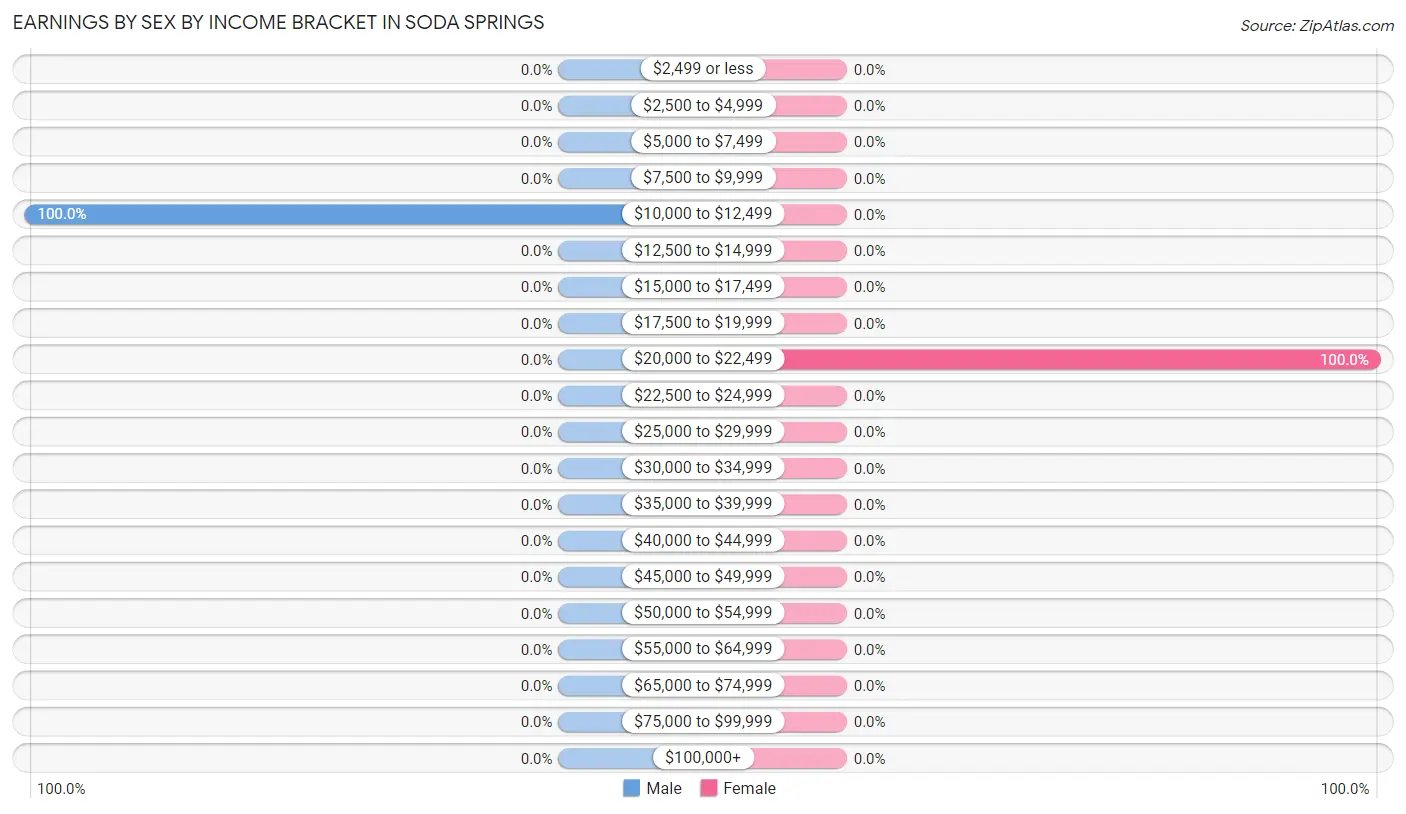
The most common earnings brackets in Soda Springs are $10,000 to $12,499 for men (42 | 100.0%) and $20,000 to $22,499 for women (12 | 100.0%).
Income
Male
Female
$2,499 or less
0 (0.0%)
0 (0.0%)
$2,500 to $4,999
0 (0.0%)
0 (0.0%)
$5,000 to $7,499
0 (0.0%)
0 (0.0%)
$7,500 to $9,999
0 (0.0%)
0 (0.0%)
$10,000 to $12,499
42 (100.0%)
0 (0.0%)
$12,500 to $14,999
0 (0.0%)
0 (0.0%)
$15,000 to $17,499
0 (0.0%)
0 (0.0%)
$17,500 to $19,999
0 (0.0%)
0 (0.0%)
$20,000 to $22,499
0 (0.0%)
12 (100.0%)
$22,500 to $24,999
0 (0.0%)
0 (0.0%)
$25,000 to $29,999
0 (0.0%)
0 (0.0%)
$30,000 to $34,999
0 (0.0%)
0 (0.0%)
$35,000 to $39,999
0 (0.0%)
0 (0.0%)
$40,000 to $44,999
0 (0.0%)
0 (0.0%)
$45,000 to $49,999
0 (0.0%)
0 (0.0%)
$50,000 to $54,999
0 (0.0%)
0 (0.0%)
$55,000 to $64,999
0 (0.0%)
0 (0.0%)
$65,000 to $74,999
0 (0.0%)
0 (0.0%)
$75,000 to $99,999
0 (0.0%)
0 (0.0%)
$100,000+
0 (0.0%)
0 (0.0%)
Total
42 (100.0%)
12 (100.0%)
Earnings by Sex by Educational Attainment in Soda Springs
Educational Attainment
Male Income
Female Income
Less than High School
-
-
High School Diploma
-
-
College or Associate's Degree
-
-
Bachelor's Degree
-
-
Graduate Degree
-
-
Total
-
-
Family Income in Soda Springs
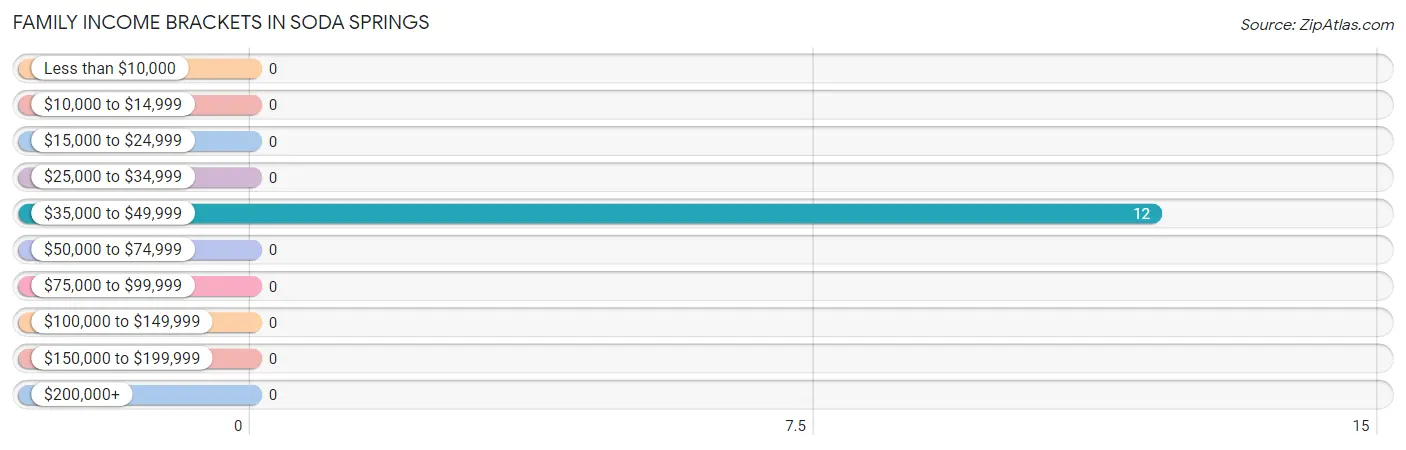
Family Income Brackets in Soda Springs
According to the Soda Springs family income data, there are 12 families falling into the $35,000 to $49,999 income range, which is the most common income bracket and makes up 100.0% of all families.
Income Bracket
# Families
% Families
Less than $10,000
0
0.0%
$10,000 to $14,999
0
0.0%
$15,000 to $24,999
0
0.0%
$25,000 to $34,999
0
0.0%
$35,000 to $49,999
12
100.0%
$50,000 to $74,999
0
0.0%
$75,000 to $99,999
0
0.0%
$100,000 to $149,999
0
0.0%
$150,000 to $199,999
0
0.0%
$200,000+
0
0.0%
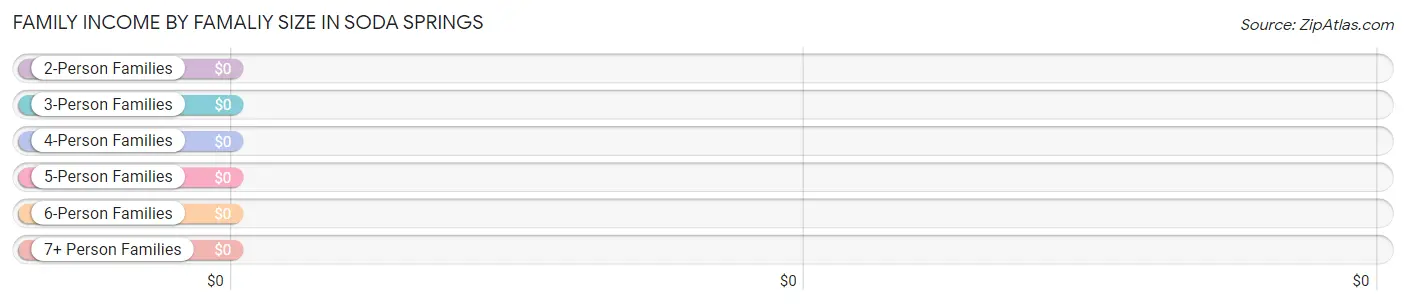
Family Income by Famaliy Size in Soda Springs
Income Bracket
# Families
Median Income
2-Person Families
12 (100.0%)
$0
3-Person Families
0 (0.0%)
$0
4-Person Families
0 (0.0%)
$0
5-Person Families
0 (0.0%)
$0
6-Person Families
0 (0.0%)
$0
7+ Person Families
0 (0.0%)
$0
Total
12 (100.0%)
$0
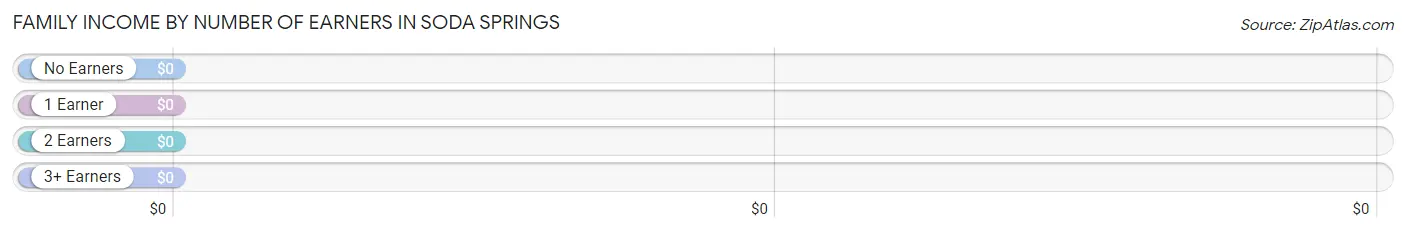
Family Income by Number of Earners in Soda Springs
Number of Earners
# Families
Median Income
No Earners
0 (0.0%)
$0
1 Earner
0 (0.0%)
$0
2 Earners
12 (100.0%)
$0
3+ Earners
0 (0.0%)
$0
Total
12 (100.0%)
$0
Household Income in Soda Springs
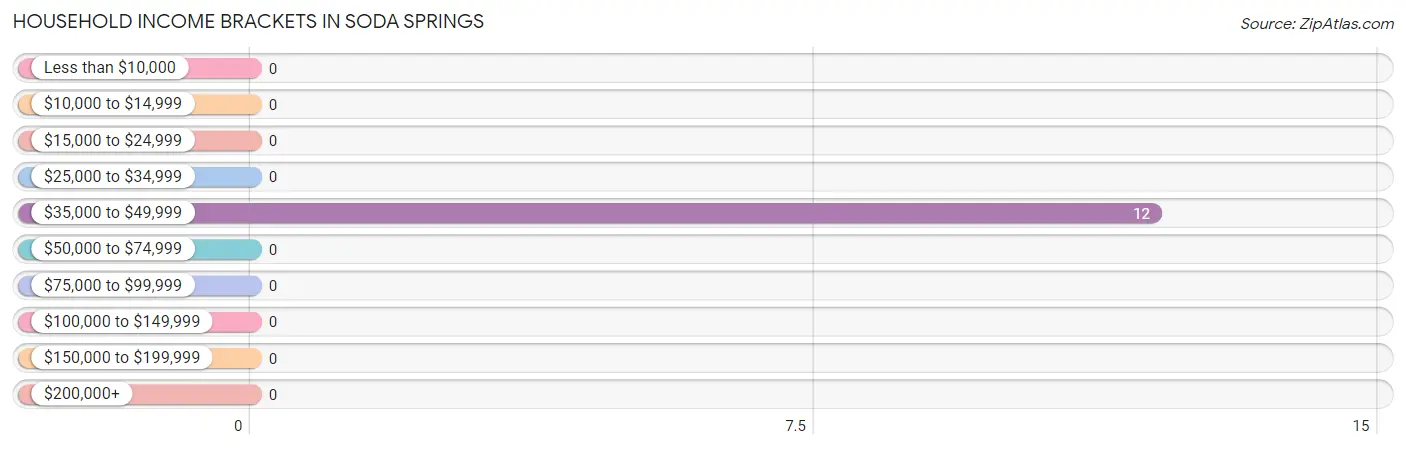
Household Income Brackets in Soda Springs
With 12 households falling in the category, the $35,000 to $49,999 income range is the most frequent in Soda Springs, accounting for 100.0% of all households.
Income Bracket
# Households
% Households
Less than $10,000
0
0.0%
$10,000 to $14,999
0
0.0%
$15,000 to $24,999
0
0.0%
$25,000 to $34,999
0
0.0%
$35,000 to $49,999
12
100.0%
$50,000 to $74,999
0
0.0%
$75,000 to $99,999
0
0.0%
$100,000 to $149,999
0
0.0%
$150,000 to $199,999
0
0.0%
$200,000+
0
0.0%
Household Income by Householder Age in Soda Springs
Income Bracket
# Households
Median Income
15 to 24 Years
0 (0.0%)
$0
25 to 44 Years
0 (0.0%)
$0
45 to 64 Years
12 (100.0%)
$0
65+ Years
0 (0.0%)
$0
Total
12 (100.0%)
$0
Poverty in Soda Springs
Income Below Poverty by Sex and Age in Soda Springs
Age Bracket
Male
Female
Under 5 Years
0 (0.0%)
0 (0.0%)
5 Years
0 (0.0%)
0 (0.0%)
6 to 11 Years
0 (0.0%)
0 (0.0%)
12 to 14 Years
0 (0.0%)
0 (0.0%)
15 Years
0 (0.0%)
0 (0.0%)
16 and 17 Years
0 (0.0%)
0 (0.0%)
18 to 24 Years
0 (0.0%)
0 (0.0%)
25 to 34 Years
0 (0.0%)
0 (0.0%)
35 to 44 Years
0 (0.0%)
0 (0.0%)
45 to 54 Years
0 (0.0%)
0 (0.0%)
55 to 64 Years
0 (0.0%)
0 (0.0%)
65 to 74 Years
0 (0.0%)
0 (0.0%)
75 Years and over
0 (0.0%)
0 (0.0%)
Total
0 (0.0%)
0 (0.0%)
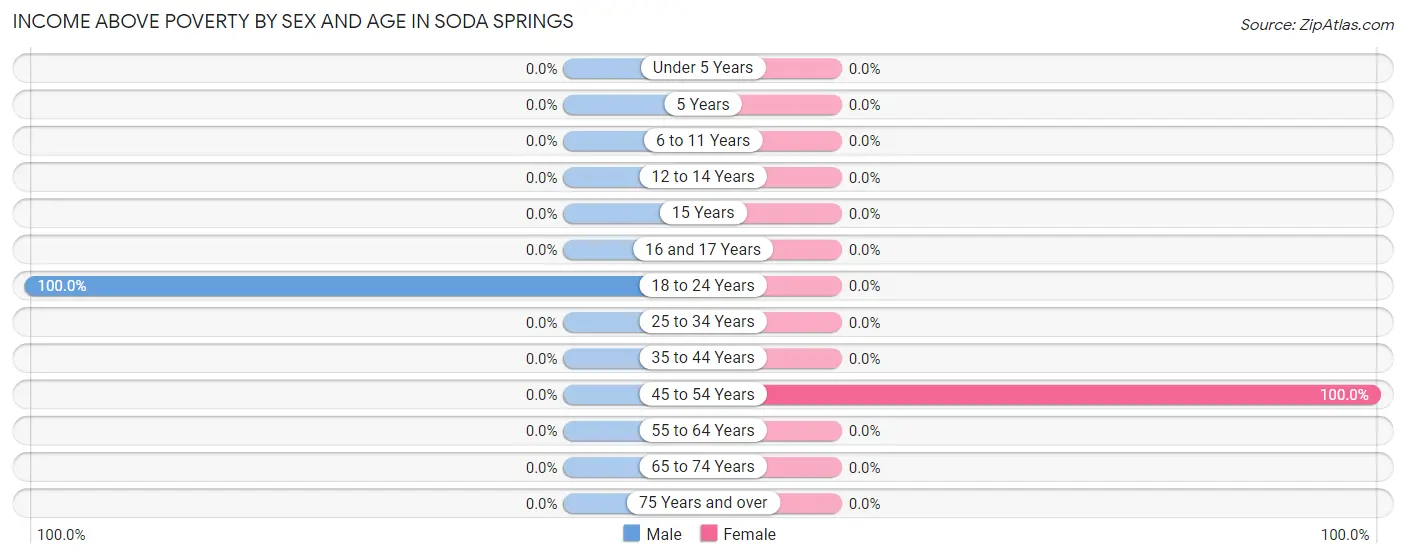
Income Above Poverty by Sex and Age in Soda Springs
According to the poverty statistics in Soda Springs, males aged 18 to 24 years and females aged 45 to 54 years are the age groups that are most secure financially, with 100.0% of males and 100.0% of females in these age groups living above the poverty line.
Age Bracket
Male
Female
Under 5 Years
0 (0.0%)
0 (0.0%)
5 Years
0 (0.0%)
0 (0.0%)
6 to 11 Years
0 (0.0%)
0 (0.0%)
12 to 14 Years
0 (0.0%)
0 (0.0%)
15 Years
0 (0.0%)
0 (0.0%)
16 and 17 Years
0 (0.0%)
0 (0.0%)
18 to 24 Years
42 (100.0%)
0 (0.0%)
25 to 34 Years
0 (0.0%)
0 (0.0%)
35 to 44 Years
0 (0.0%)
0 (0.0%)
45 to 54 Years
0 (0.0%)
12 (100.0%)
55 to 64 Years
0 (0.0%)
0 (0.0%)
65 to 74 Years
0 (0.0%)
0 (0.0%)
75 Years and over
0 (0.0%)
0 (0.0%)
Total
42 (100.0%)
12 (100.0%)
Income Below Poverty Among Married-Couple Families in Soda Springs
Children
Above Poverty
Below Poverty
No Children
0 (0.0%)
0 (0.0%)
1 or 2 Children
0 (0.0%)
0 (0.0%)
3 or 4 Children
0 (0.0%)
0 (0.0%)
5 or more Children
0 (0.0%)
0 (0.0%)
Total
0 (0.0%)
0 (0.0%)
Income Below Poverty Among Single-Parent Households in Soda Springs
Children
Single Father
Single Mother
No Children
0 (0.0%)
0 (0.0%)
1 or 2 Children
0 (0.0%)
0 (0.0%)
3 or 4 Children
0 (0.0%)
0 (0.0%)
5 or more Children
0 (0.0%)
0 (0.0%)
Total
0 (0.0%)
0 (0.0%)
Income Below Poverty Among Married-Couple vs Single-Parent Households in Soda Springs
Children
Married-Couple Families
Single-Parent Households
No Children
0 (0.0%)
0 (0.0%)
1 or 2 Children
0 (0.0%)
0 (0.0%)
3 or 4 Children
0 (0.0%)
0 (0.0%)
5 or more Children
0 (0.0%)
0 (0.0%)
Total
0 (0.0%)
0 (0.0%)
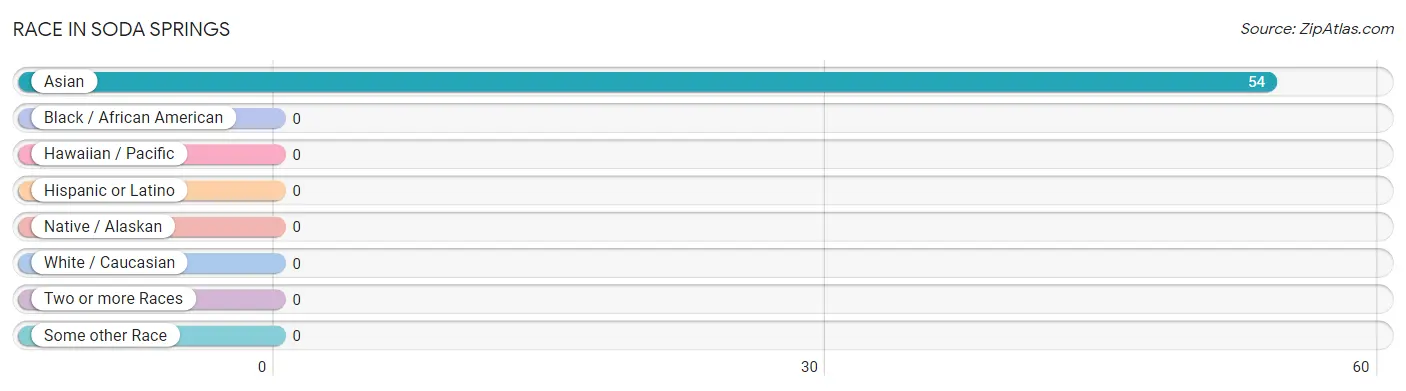
Race in Soda Springs
The most populous races in Soda Springs are , and Asian (54 | 100.0%).
Race
# Population
% Population
Asian
54
100.0%
Black / African American
0
0.0%
Hawaiian / Pacific
0
0.0%
Hispanic or Latino
0
0.0%
Native / Alaskan
0
0.0%
White / Caucasian
0
0.0%
Two or more Races
0
0.0%
Some other Race
0
0.0%
Total
54
100.0%
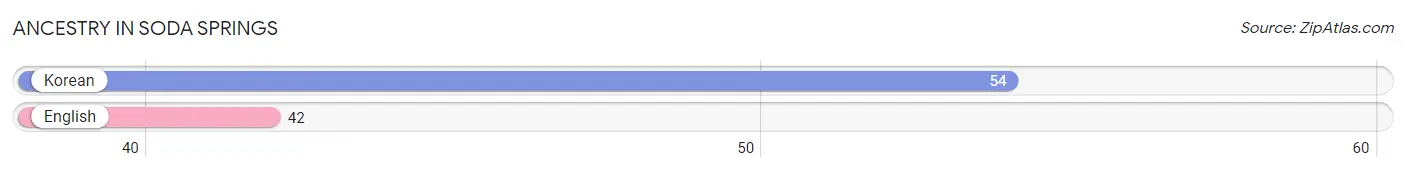
Ancestry in Soda Springs
The most populous ancestries reported in Soda Springs are Korean (54 | 100.0%), and English (42 | 77.8%), together accounting for 177.8% of all Soda Springs residents.
Ancestry
# Population
% Population
English
42
77.8%
Korean
54
100.0%
View All 2 Rows
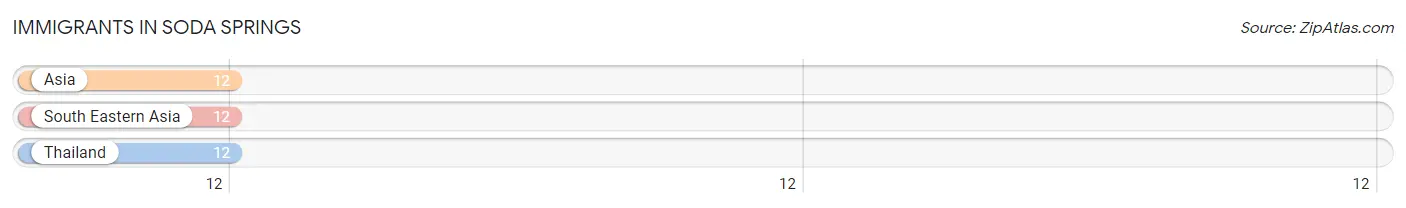
Immigrants in Soda Springs
The most numerous immigrant groups reported in Soda Springs came from Asia (12 | 22.2%), South Eastern Asia (12 | 22.2%), and Thailand (12 | 22.2%), together accounting for 66.7% of all Soda Springs residents.
Immigration Origin
# Population
% Population
Asia
12
22.2%
South Eastern Asia
12
22.2%
Thailand
12
22.2%
View All 3 Rows
Sex and Age in Soda Springs
Sex and Age in Soda Springs
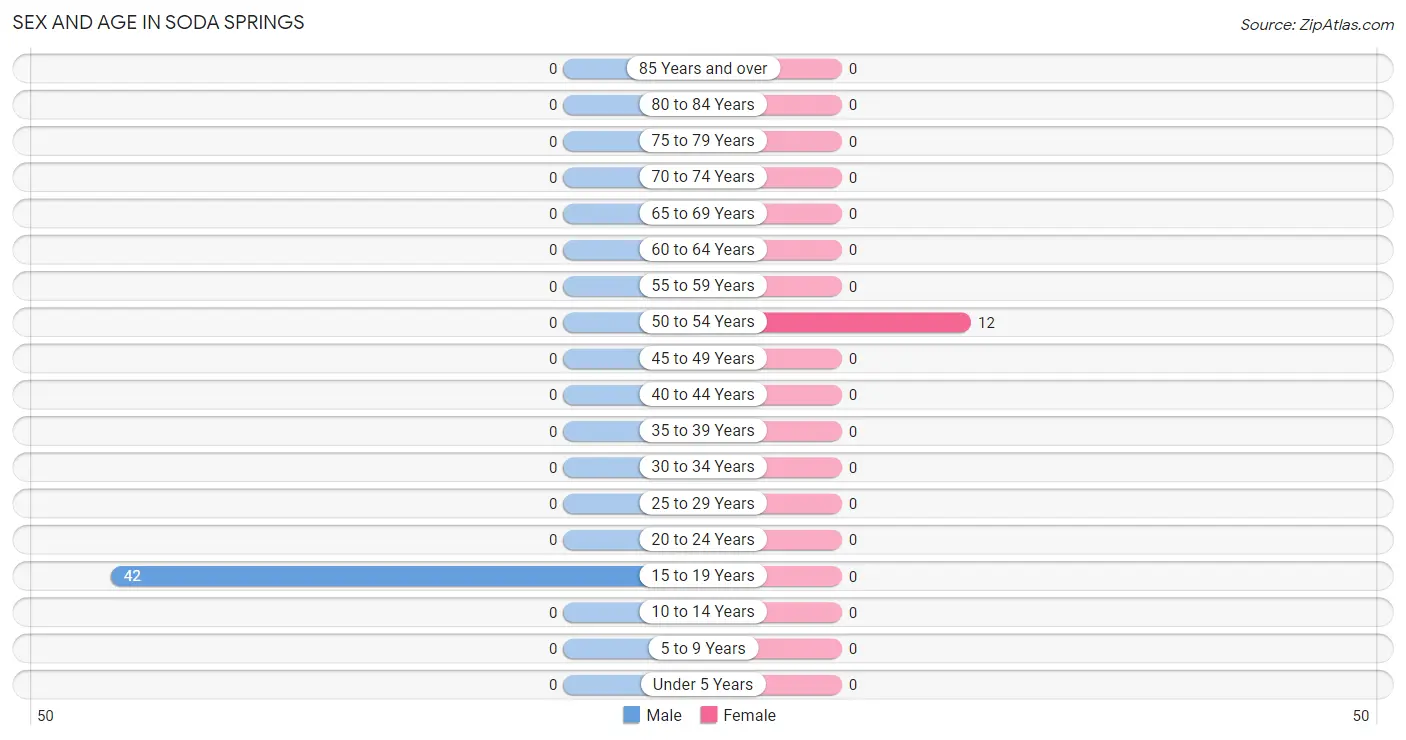
The most populous age groups in Soda Springs are 15 to 19 Years (42 | 100.0%) for men and 50 to 54 Years (12 | 100.0%) for women.
Age Bracket
Male
Female
Under 5 Years
0 (0.0%)
0 (0.0%)
5 to 9 Years
0 (0.0%)
0 (0.0%)
10 to 14 Years
0 (0.0%)
0 (0.0%)
15 to 19 Years
42 (100.0%)
0 (0.0%)
20 to 24 Years
0 (0.0%)
0 (0.0%)
25 to 29 Years
0 (0.0%)
0 (0.0%)
30 to 34 Years
0 (0.0%)
0 (0.0%)
35 to 39 Years
0 (0.0%)
0 (0.0%)
40 to 44 Years
0 (0.0%)
0 (0.0%)
45 to 49 Years
0 (0.0%)
0 (0.0%)
50 to 54 Years
0 (0.0%)
12 (100.0%)
55 to 59 Years
0 (0.0%)
0 (0.0%)
60 to 64 Years
0 (0.0%)
0 (0.0%)
65 to 69 Years
0 (0.0%)
0 (0.0%)
70 to 74 Years
0 (0.0%)
0 (0.0%)
75 to 79 Years
0 (0.0%)
0 (0.0%)
80 to 84 Years
0 (0.0%)
0 (0.0%)
85 Years and over
0 (0.0%)
0 (0.0%)
Total
42 (100.0%)
12 (100.0%)
Families and Households in Soda Springs
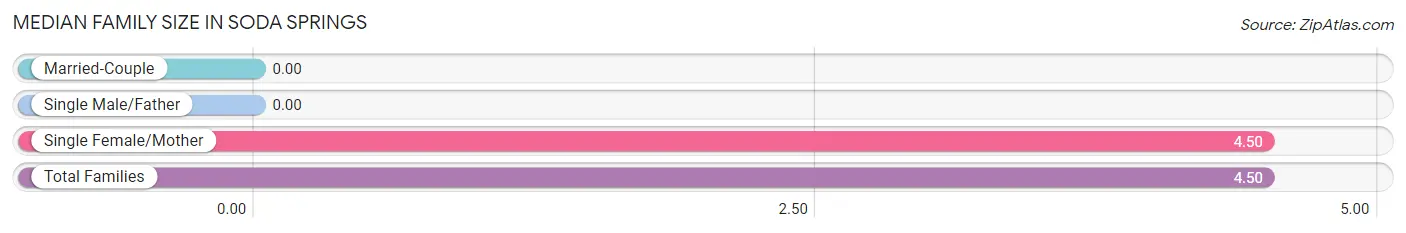
Median Family Size in Soda Springs
Family Type
# Families
Family Size
Married-Couple
0 (0.0%)
-
Single Male/Father
0 (0.0%)
-
Single Female/Mother
12 (100.0%)
4.50
Total Families
12 (100.0%)
4.50
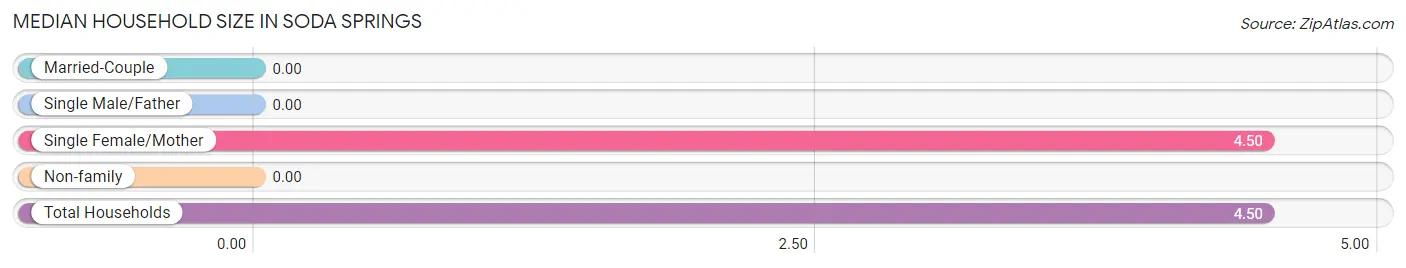
Median Household Size in Soda Springs
Household Type
# Households
Household Size
Married-Couple
0 (0.0%)
-
Single Male/Father
0 (0.0%)
-
Single Female/Mother
12 (100.0%)
4.50
Non-family
0 (0.0%)
-
Total Households
12 (100.0%)
4.50
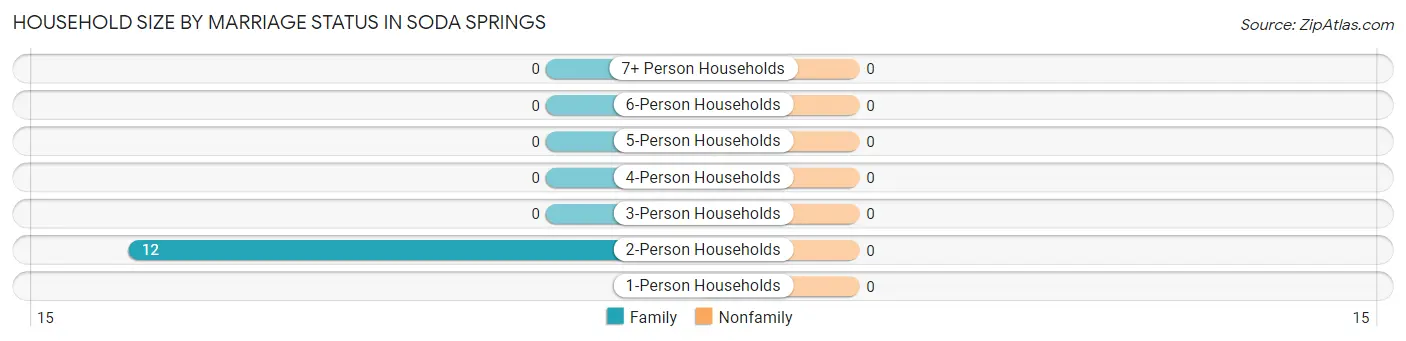
Household Size by Marriage Status in Soda Springs
Household Size
Family Households
Nonfamily Households
1-Person Households
-
0 (0.0%)
2-Person Households
12 (100.0%)
0 (0.0%)
3-Person Households
0 (0.0%)
0 (0.0%)
4-Person Households
0 (0.0%)
0 (0.0%)
5-Person Households
0 (0.0%)
0 (0.0%)
6-Person Households
0 (0.0%)
0 (0.0%)
7+ Person Households
0 (0.0%)
0 (0.0%)
Total
12 (100.0%)
0 (0.0%)
Female Fertility in Soda Springs
Fertility by Age in Soda Springs
Age Bracket
Women with Births
Births / 1,000 Women
15 to 19 years
0 (0.0%)
0.0
20 to 34 years
0 (0.0%)
0.0
35 to 50 years
0 (0.0%)
0.0
Total
0 (0.0%)
0.0
Fertility by Age by Marriage Status in Soda Springs
Age Bracket
Married
Unmarried
15 to 19 years
0 (0.0%)
0 (0.0%)
20 to 34 years
0 (0.0%)
0 (0.0%)
35 to 50 years
0 (0.0%)
0 (0.0%)
Total
0 (0.0%)
0 (0.0%)
Fertility by Education in Soda Springs
Educational Attainment
Women with Births
Births / 1,000 Women
Less than High School
0 (0.0%)
0.0
High School Diploma
0 (0.0%)
0.0
College or Associate's Degree
0 (0.0%)
0.0
Bachelor's Degree
0 (0.0%)
0.0
Graduate Degree
0 (0.0%)
0.0
Total
0 (0.0%)
0.0
Fertility by Education by Marriage Status in Soda Springs
Educational Attainment
Married
Unmarried
Less than High School
0 (0.0%)
0 (0.0%)
High School Diploma
0 (0.0%)
0 (0.0%)
College or Associate's Degree
0 (0.0%)
0 (0.0%)
Bachelor's Degree
0 (0.0%)
0 (0.0%)
Graduate Degree
0 (0.0%)
0 (0.0%)
Total
0 (0.0%)
0 (0.0%)
Employment Characteristics in Soda Springs
Employment by Class of Employer in Soda Springs
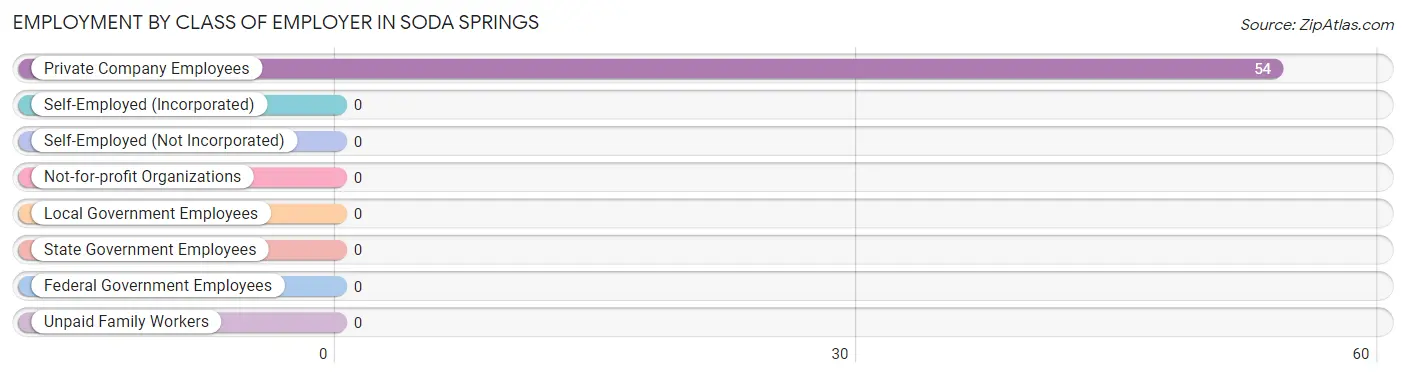
Among the 54 employed individuals in Soda Springs, , and private company employees (54 | 100.0%) make up the most common classes of employment.
Employer Class
# Employees
% Employees
Private Company Employees
54
100.0%
Self-Employed (Incorporated)
0
0.0%
Self-Employed (Not Incorporated)
0
0.0%
Not-for-profit Organizations
0
0.0%
Local Government Employees
0
0.0%
State Government Employees
0
0.0%
Federal Government Employees
0
0.0%
Unpaid Family Workers
0
0.0%
Total
54
100.0%
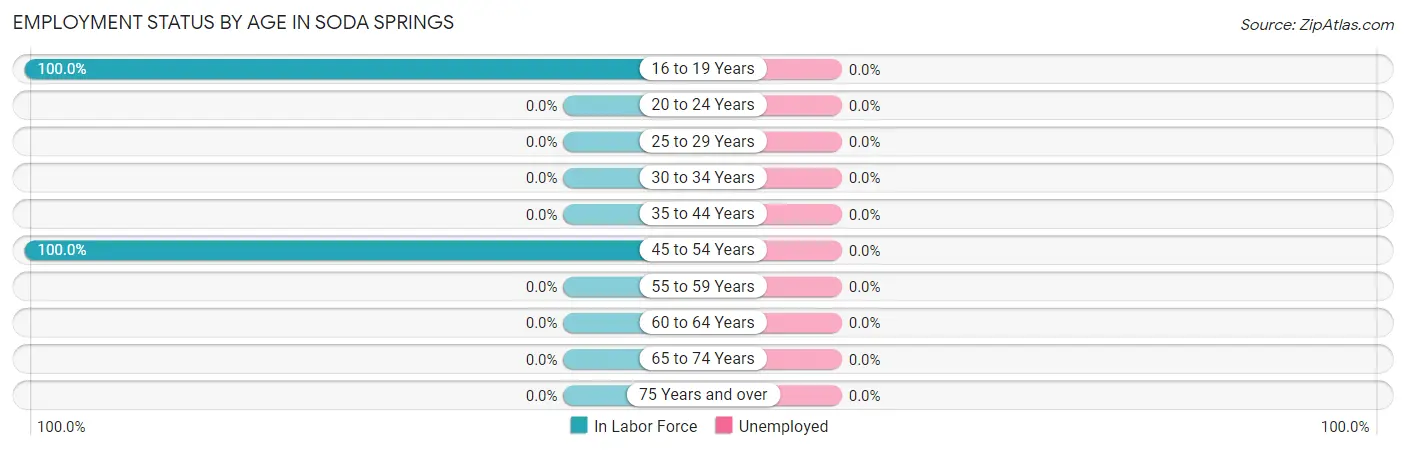
Employment Status by Age in Soda Springs
Age Bracket
In Labor Force
Unemployed
16 to 19 Years
42 (100.0%)
0 (0.0%)
20 to 24 Years
0 (0.0%)
0 (0.0%)
25 to 29 Years
0 (0.0%)
0 (0.0%)
30 to 34 Years
0 (0.0%)
0 (0.0%)
35 to 44 Years
0 (0.0%)
0 (0.0%)
45 to 54 Years
12 (100.0%)
0 (0.0%)
55 to 59 Years
0 (0.0%)
0 (0.0%)
60 to 64 Years
0 (0.0%)
0 (0.0%)
65 to 74 Years
0 (0.0%)
0 (0.0%)
75 Years and over
0 (0.0%)
0 (0.0%)
Total
54 (100.0%)
0 (0.0%)
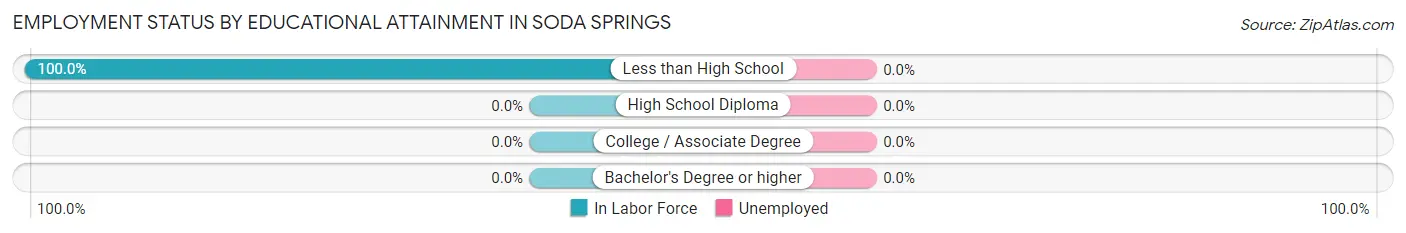
Employment Status by Educational Attainment in Soda Springs
Educational Attainment
In Labor Force
Unemployed
Less than High School
12 (100.0%)
0 (0.0%)
High School Diploma
0 (0.0%)
0 (0.0%)
College / Associate Degree
0 (0.0%)
0 (0.0%)
Bachelor's Degree or higher
0 (0.0%)
0 (0.0%)
Total
12 (100.0%)
0 (0.0%)
Employment Occupations by Sex in Soda Springs
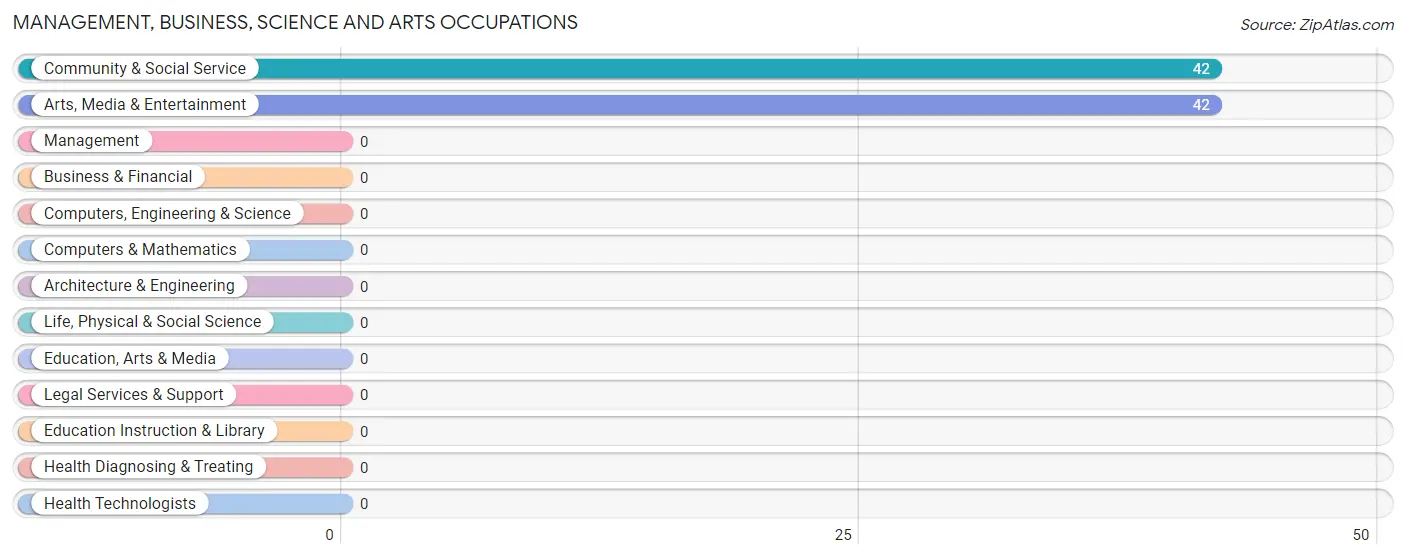
Management, Business, Science and Arts Occupations
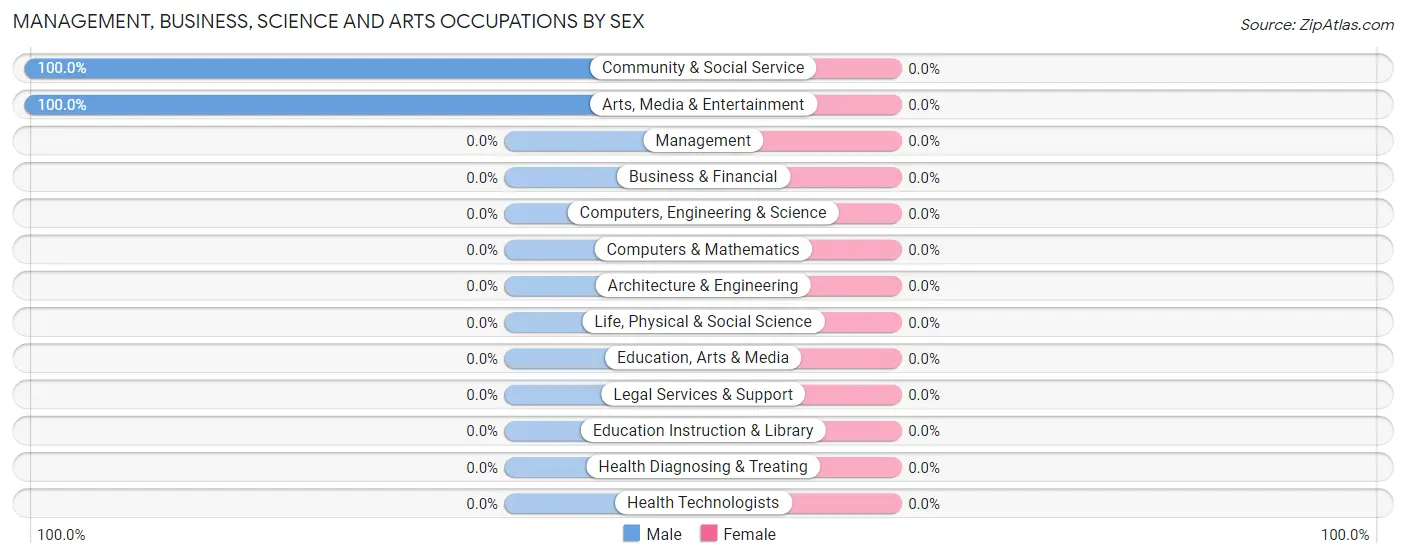
The most common Management, Business, Science and Arts occupations in Soda Springs are Community & Social Service (42 | 77.8%), and Arts, Media & Entertainment (42 | 77.8%).
Management, Business, Science and Arts Occupations by Sex
Occupation
Male
Female
Management
0 (0.0%)
0 (0.0%)
Business & Financial
0 (0.0%)
0 (0.0%)
Computers, Engineering & Science
0 (0.0%)
0 (0.0%)
Computers & Mathematics
0 (0.0%)
0 (0.0%)
Architecture & Engineering
0 (0.0%)
0 (0.0%)
Life, Physical & Social Science
0 (0.0%)
0 (0.0%)
Community & Social Service
42 (100.0%)
0 (0.0%)
Education, Arts & Media
0 (0.0%)
0 (0.0%)
Legal Services & Support
0 (0.0%)
0 (0.0%)
Education Instruction & Library
0 (0.0%)
0 (0.0%)
Arts, Media & Entertainment
42 (100.0%)
0 (0.0%)
Health Diagnosing & Treating
0 (0.0%)
0 (0.0%)
Health Technologists
0 (0.0%)
0 (0.0%)
Total (Category)
42 (100.0%)
0 (0.0%)
Total (Overall)
42 (77.8%)
12 (22.2%)
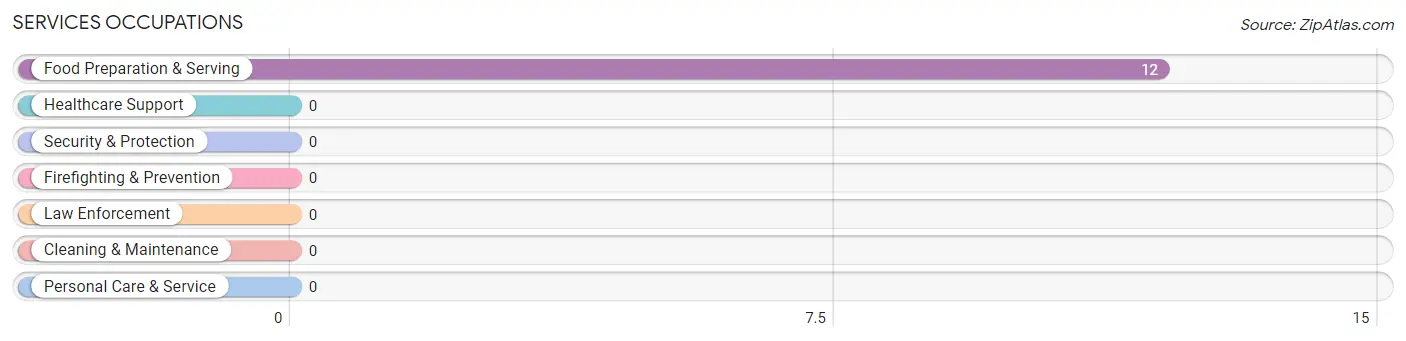
Services Occupations
The most common Services occupations in Soda Springs are , and Food Preparation & Serving (12 | 22.2%).
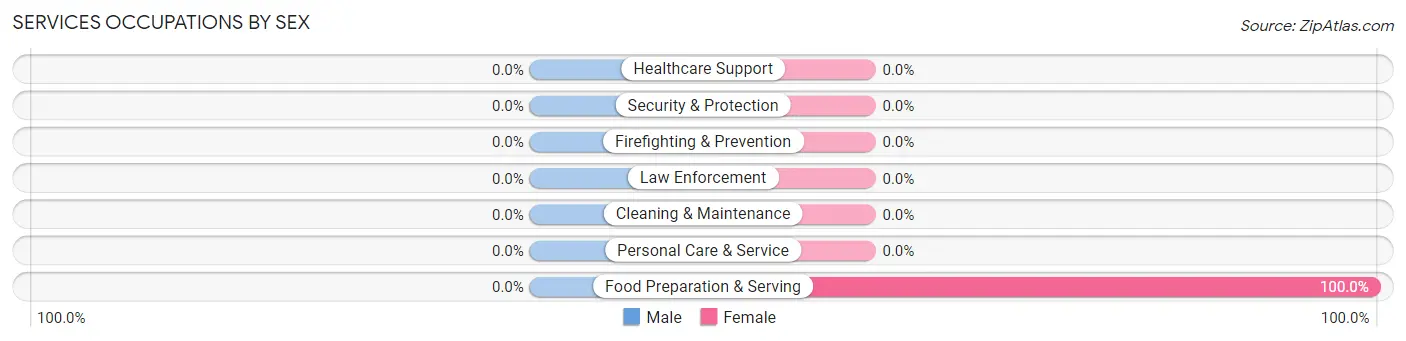
Services Occupations by Sex
Occupation
Male
Female
Healthcare Support
0 (0.0%)
0 (0.0%)
Security & Protection
0 (0.0%)
0 (0.0%)
Firefighting & Prevention
0 (0.0%)
0 (0.0%)
Law Enforcement
0 (0.0%)
0 (0.0%)
Food Preparation & Serving
0 (0.0%)
12 (100.0%)
Cleaning & Maintenance
0 (0.0%)
0 (0.0%)
Personal Care & Service
0 (0.0%)
0 (0.0%)
Total (Category)
0 (0.0%)
12 (100.0%)
Total (Overall)
42 (77.8%)
12 (22.2%)
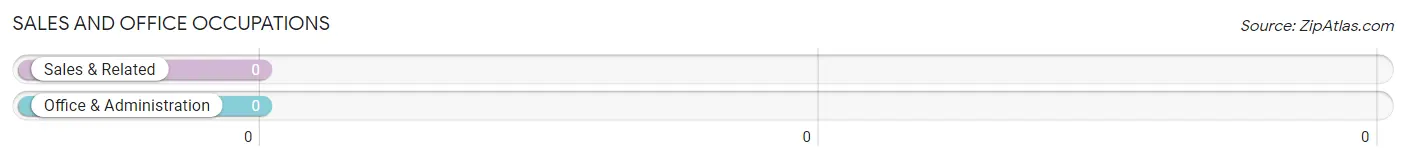
Sales and Office Occupations
Sales and Office Occupations by Sex
Occupation
Male
Female
Sales & Related
0 (0.0%)
0 (0.0%)
Office & Administration
0 (0.0%)
0 (0.0%)
Total (Category)
0 (0.0%)
0 (0.0%)
Total (Overall)
42 (77.8%)
12 (22.2%)
Natural Resources, Construction and Maintenance Occupations
Natural Resources, Construction and Maintenance Occupations by Sex
Occupation
Male
Female
Farming, Fishing & Forestry
0 (0.0%)
0 (0.0%)
Construction & Extraction
0 (0.0%)
0 (0.0%)
Installation, Maintenance & Repair
0 (0.0%)
0 (0.0%)
Total (Category)
0 (0.0%)
0 (0.0%)
Total (Overall)
42 (77.8%)
12 (22.2%)
Production, Transportation and Moving Occupations
Production, Transportation and Moving Occupations by Sex
Occupation
Male
Female
Production
0 (0.0%)
0 (0.0%)
Transportation
0 (0.0%)
0 (0.0%)
Material Moving
0 (0.0%)
0 (0.0%)
Total (Category)
0 (0.0%)
0 (0.0%)
Total (Overall)
42 (77.8%)
12 (22.2%)
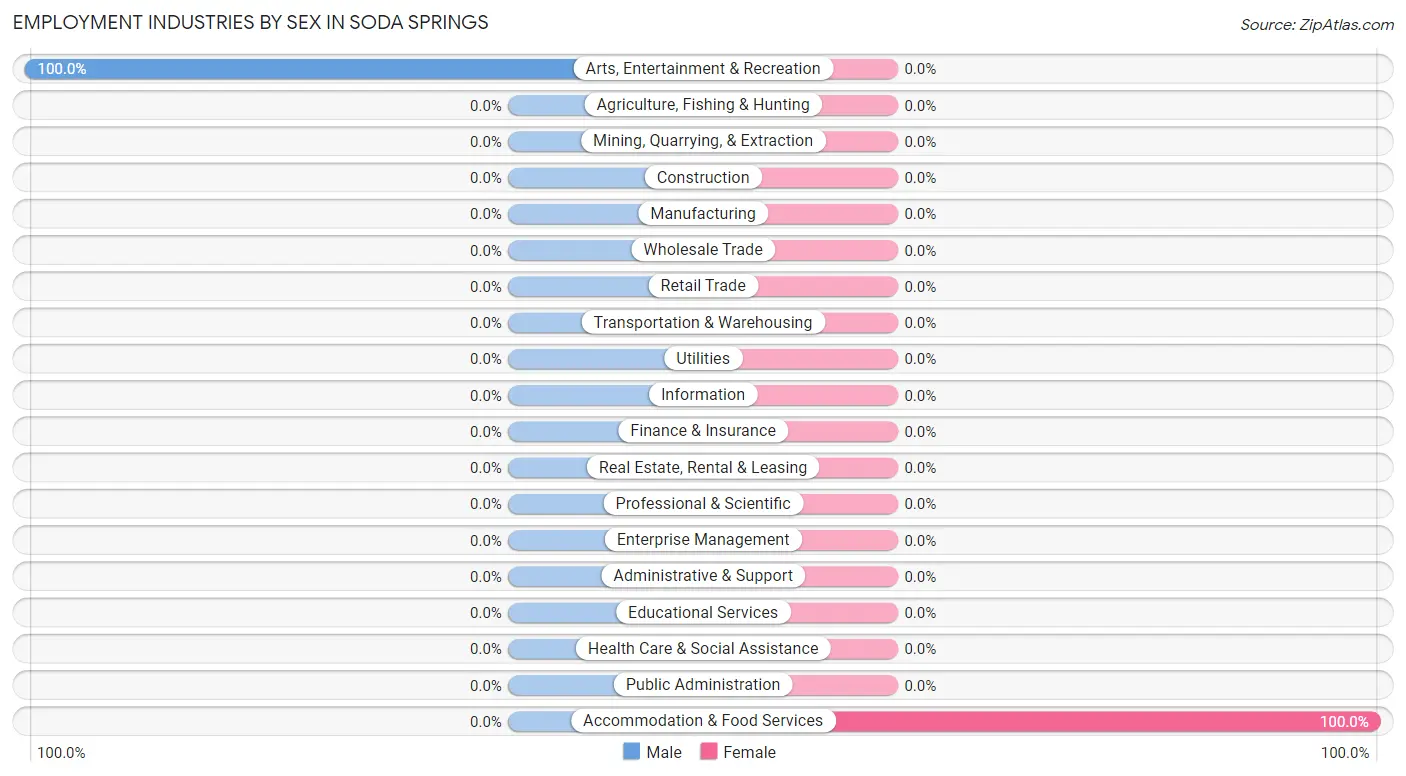
Employment Industries by Sex in Soda Springs
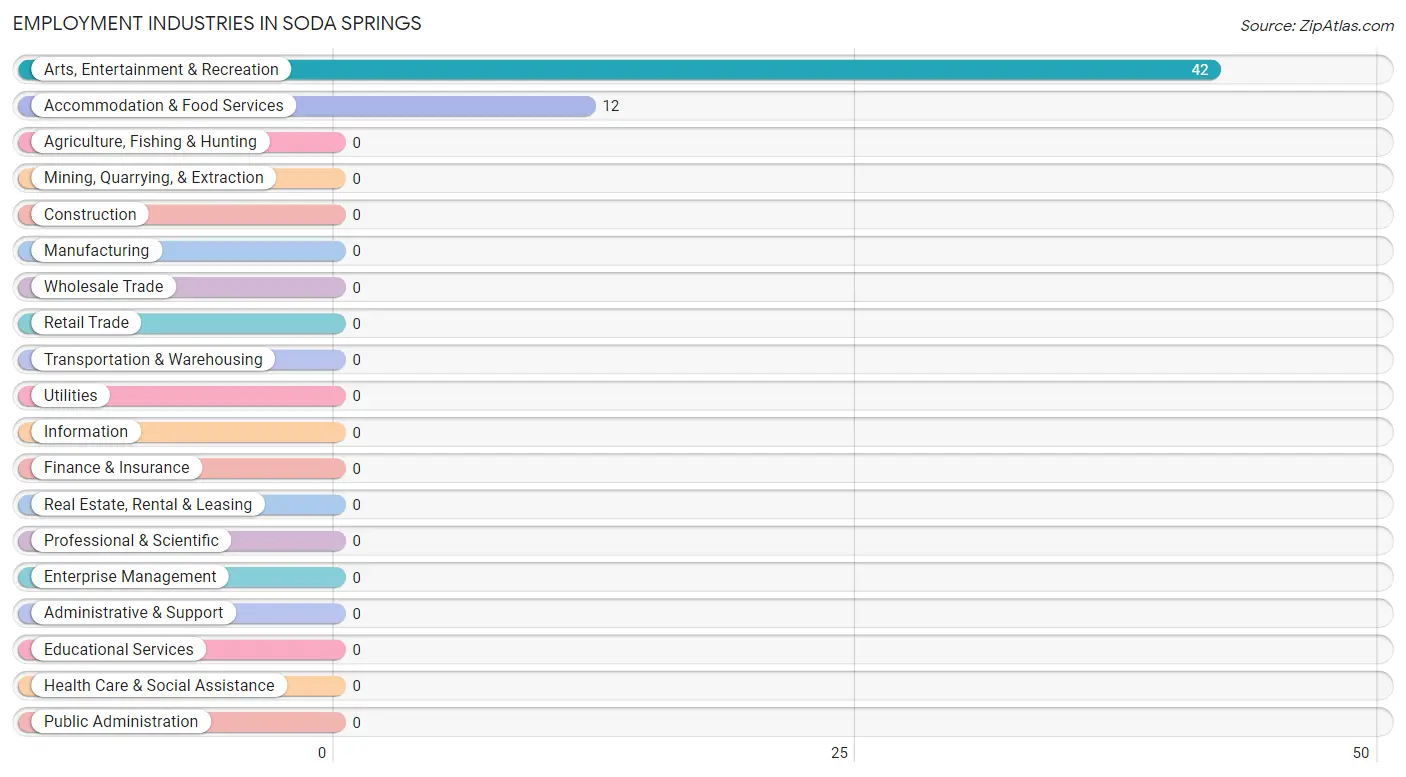
Employment Industries in Soda Springs
The major employment industries in Soda Springs include Arts, Entertainment & Recreation (42 | 77.8%), and Accommodation & Food Services (12 | 22.2%).
Employment Industries by Sex in Soda Springs
Industry
Male
Female
Agriculture, Fishing & Hunting
0 (0.0%)
0 (0.0%)
Mining, Quarrying, & Extraction
0 (0.0%)
0 (0.0%)
Construction
0 (0.0%)
0 (0.0%)
Manufacturing
0 (0.0%)
0 (0.0%)
Wholesale Trade
0 (0.0%)
0 (0.0%)
Retail Trade
0 (0.0%)
0 (0.0%)
Transportation & Warehousing
0 (0.0%)
0 (0.0%)
Utilities
0 (0.0%)
0 (0.0%)
Information
0 (0.0%)
0 (0.0%)
Finance & Insurance
0 (0.0%)
0 (0.0%)
Real Estate, Rental & Leasing
0 (0.0%)
0 (0.0%)
Professional & Scientific
0 (0.0%)
0 (0.0%)
Enterprise Management
0 (0.0%)
0 (0.0%)
Administrative & Support
0 (0.0%)
0 (0.0%)
Educational Services
0 (0.0%)
0 (0.0%)
Health Care & Social Assistance
0 (0.0%)
0 (0.0%)
Arts, Entertainment & Recreation
42 (100.0%)
0 (0.0%)
Accommodation & Food Services
0 (0.0%)
12 (100.0%)
Public Administration
0 (0.0%)
0 (0.0%)
Total
42 (77.8%)
12 (22.2%)
Education in Soda Springs
School Enrollment in Soda Springs
School Level
# Students
% Students
Nursery / Preschool
0
0.0%
Kindergarten
0
0.0%
Elementary School
0
0.0%
Middle School
0
0.0%
High School
0
0.0%
College / Undergraduate
0
0.0%
Graduate / Professional
0
0.0%
Total
0
0.0%
School Enrollment by Age by Funding Source in Soda Springs
Age Bracket
Public School
Private School
3 to 4 Year Olds
0 (0.0%)
0 (0.0%)
5 to 9 Year Old
0 (0.0%)
0 (0.0%)
10 to 14 Year Olds
0 (0.0%)
0 (0.0%)
15 to 17 Year Olds
0 (0.0%)
0 (0.0%)
18 to 19 Year Olds
0 (0.0%)
0 (0.0%)
20 to 24 Year Olds
0 (0.0%)
0 (0.0%)
25 to 34 Year Olds
0 (0.0%)
0 (0.0%)
35 Years and over
0 (0.0%)
0 (0.0%)
Total
0 (0.0%)
0 (0.0%)
Educational Attainment by Field of Study in Soda Springs
Field of Study
# Graduates
% Graduates
Computers & Mathematics
0
0.0%
Bio, Nature & Agricultural
0
0.0%
Physical & Health Sciences
0
0.0%
Psychology
0
0.0%
Social Sciences
0
0.0%
Engineering
0
0.0%
Multidisciplinary Studies
0
0.0%
Science & Technology
0
0.0%
Business
0
0.0%
Education
0
0.0%
Literature & Languages
0
0.0%
Liberal Arts & History
0
0.0%
Visual & Performing Arts
0
0.0%
Communications
0
0.0%
Arts & Humanities
0
0.0%
Total
0
0.0%
Transportation & Commute in Soda Springs
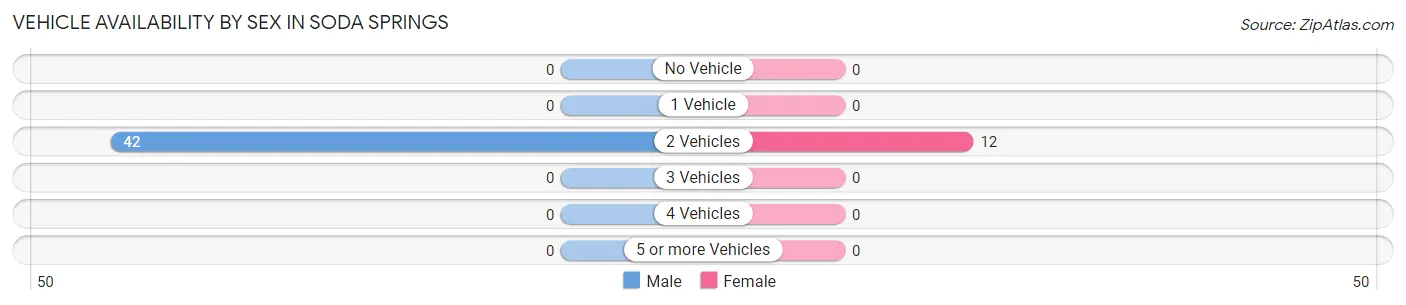
Vehicle Availability by Sex in Soda Springs
The most prevalent vehicle ownership categories in Soda Springs are males with 2 vehicles (42, accounting for 100.0%) and females with 2 vehicles (12, making up 350.0%).
Vehicles Available
Male
Female
No Vehicle
0 (0.0%)
0 (0.0%)
1 Vehicle
0 (0.0%)
0 (0.0%)
2 Vehicles
42 (100.0%)
12 (100.0%)
3 Vehicles
0 (0.0%)
0 (0.0%)
4 Vehicles
0 (0.0%)
0 (0.0%)
5 or more Vehicles
0 (0.0%)
0 (0.0%)
Total
42 (100.0%)
12 (100.0%)
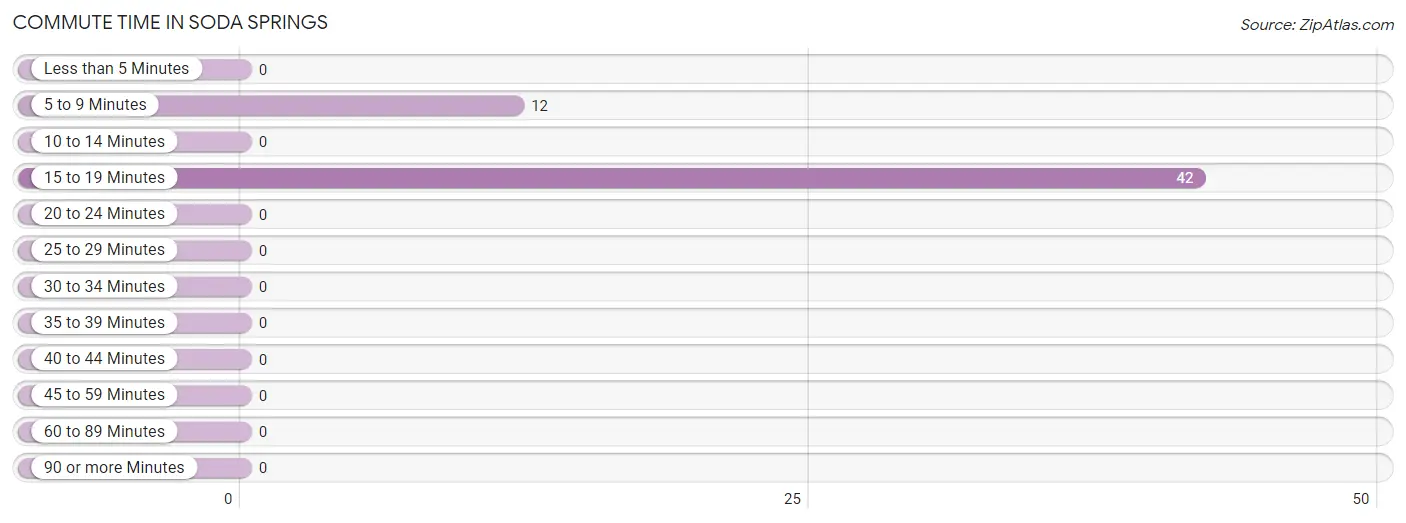
Commute Time in Soda Springs
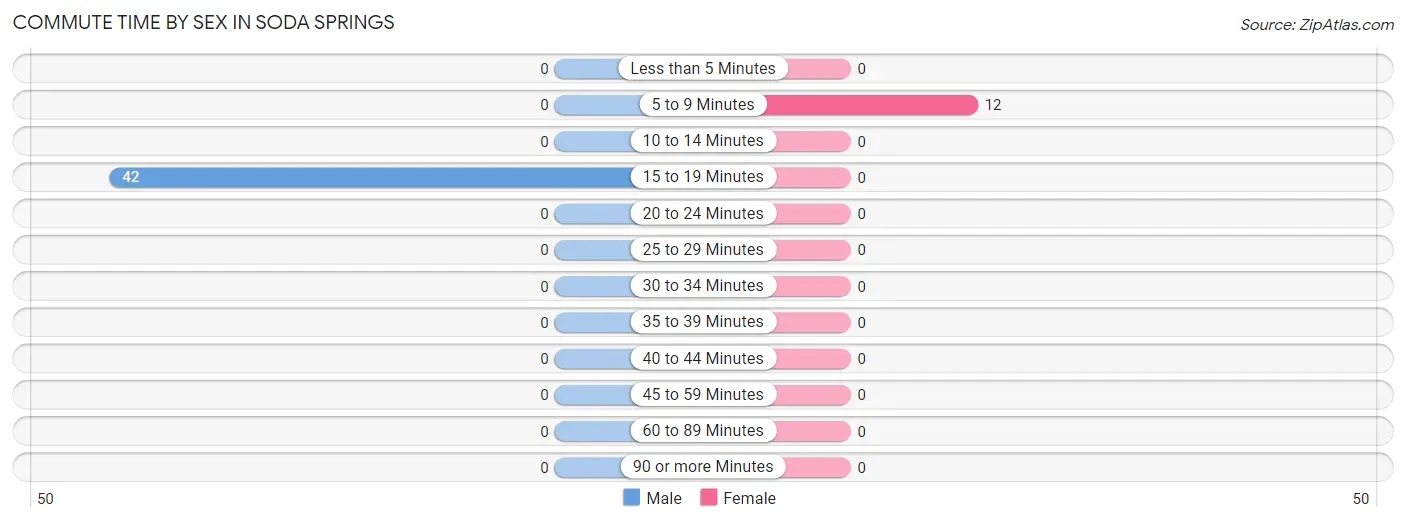
The most frequently occuring commute durations in Soda Springs are 15 to 19 minutes (42 commuters, 77.8%), 5 to 9 minutes (12 commuters, 22.2%), and less than 5 minutes (0 commuters, 0.0%).
Commute Time
# Commuters
% Commuters
Less than 5 Minutes
0
0.0%
5 to 9 Minutes
12
22.2%
10 to 14 Minutes
0
0.0%
15 to 19 Minutes
42
77.8%
20 to 24 Minutes
0
0.0%
25 to 29 Minutes
0
0.0%
30 to 34 Minutes
0
0.0%
35 to 39 Minutes
0
0.0%
40 to 44 Minutes
0
0.0%
45 to 59 Minutes
0
0.0%
60 to 89 Minutes
0
0.0%
90 or more Minutes
0
0.0%
Commute Time by Sex in Soda Springs
The most common commute times in Soda Springs are 15 to 19 minutes (42 commuters, 100.0%) for males and 5 to 9 minutes (12 commuters, 100.0%) for females.
Commute Time
Male
Female
Less than 5 Minutes
0 (0.0%)
0 (0.0%)
5 to 9 Minutes
0 (0.0%)
12 (100.0%)
10 to 14 Minutes
0 (0.0%)
0 (0.0%)
15 to 19 Minutes
42 (100.0%)
0 (0.0%)
20 to 24 Minutes
0 (0.0%)
0 (0.0%)
25 to 29 Minutes
0 (0.0%)
0 (0.0%)
30 to 34 Minutes
0 (0.0%)
0 (0.0%)
35 to 39 Minutes
0 (0.0%)
0 (0.0%)
40 to 44 Minutes
0 (0.0%)
0 (0.0%)
45 to 59 Minutes
0 (0.0%)
0 (0.0%)
60 to 89 Minutes
0 (0.0%)
0 (0.0%)
90 or more Minutes
0 (0.0%)
0 (0.0%)
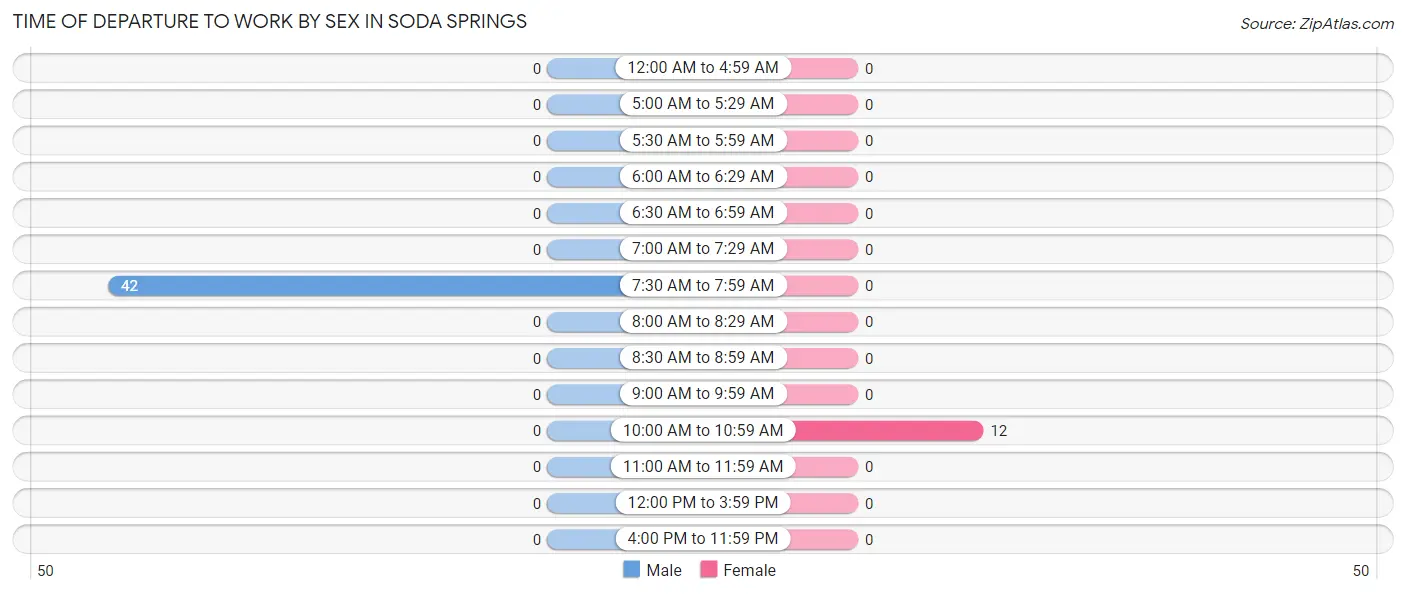
Time of Departure to Work by Sex in Soda Springs
The most frequent times of departure to work in Soda Springs are 7:30 AM to 7:59 AM (42, 100.0%) for males and 10:00 AM to 10:59 AM (12, 100.0%) for females.
Time of Departure
Male
Female
12:00 AM to 4:59 AM
0 (0.0%)
0 (0.0%)
5:00 AM to 5:29 AM
0 (0.0%)
0 (0.0%)
5:30 AM to 5:59 AM
0 (0.0%)
0 (0.0%)
6:00 AM to 6:29 AM
0 (0.0%)
0 (0.0%)
6:30 AM to 6:59 AM
0 (0.0%)
0 (0.0%)
7:00 AM to 7:29 AM
0 (0.0%)
0 (0.0%)
7:30 AM to 7:59 AM
42 (100.0%)
0 (0.0%)
8:00 AM to 8:29 AM
0 (0.0%)
0 (0.0%)
8:30 AM to 8:59 AM
0 (0.0%)
0 (0.0%)
9:00 AM to 9:59 AM
0 (0.0%)
0 (0.0%)
10:00 AM to 10:59 AM
0 (0.0%)
12 (100.0%)
11:00 AM to 11:59 AM
0 (0.0%)
0 (0.0%)
12:00 PM to 3:59 PM
0 (0.0%)
0 (0.0%)
4:00 PM to 11:59 PM
0 (0.0%)
0 (0.0%)
Total
42 (100.0%)
12 (100.0%)
Housing Occupancy in Soda Springs
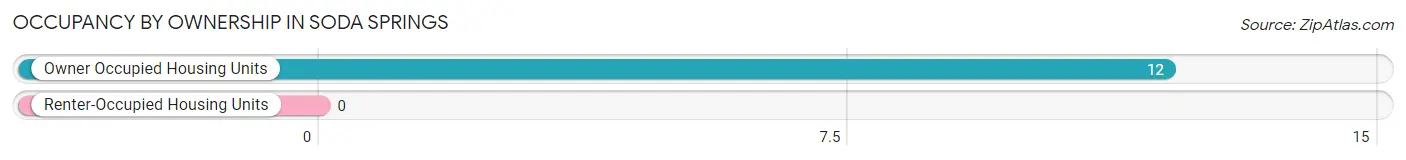
Occupancy by Ownership in Soda Springs
Of the total 12 dwellings in Soda Springs, owner-occupied units account for 12 (100.0%), while renter-occupied units make up 0 (0.0%).
Occupancy
# Housing Units
% Housing Units
Owner Occupied Housing Units
12
100.0%
Renter-Occupied Housing Units
0
0.0%
Total Occupied Housing Units
12
100.0%
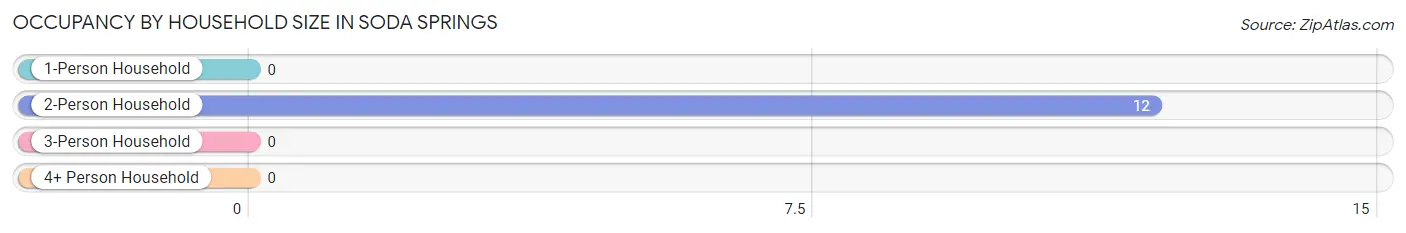
Occupancy by Household Size in Soda Springs
Household Size
# Housing Units
% Housing Units
1-Person Household
0
0.0%
2-Person Household
12
100.0%
3-Person Household
0
0.0%
4+ Person Household
0
0.0%
Total Housing Units
12
100.0%
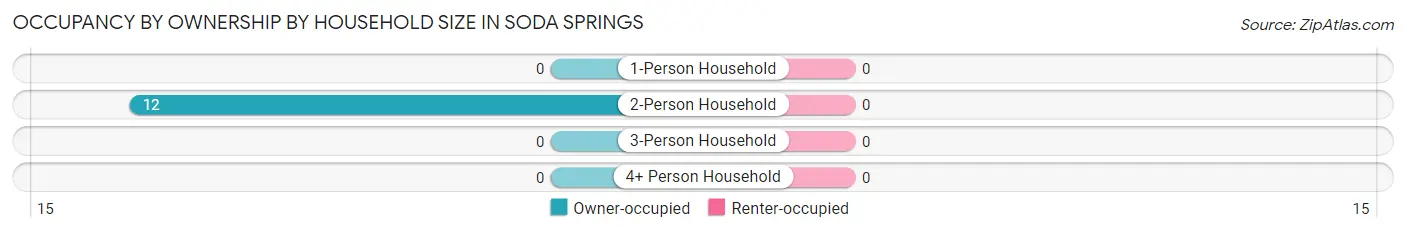
Occupancy by Ownership by Household Size in Soda Springs
Household Size
Owner-occupied
Renter-occupied
1-Person Household
0 (0.0%)
0 (0.0%)
2-Person Household
12 (100.0%)
0 (0.0%)
3-Person Household
0 (0.0%)
0 (0.0%)
4+ Person Household
0 (0.0%)
0 (0.0%)
Total Housing Units
12 (100.0%)
0 (0.0%)
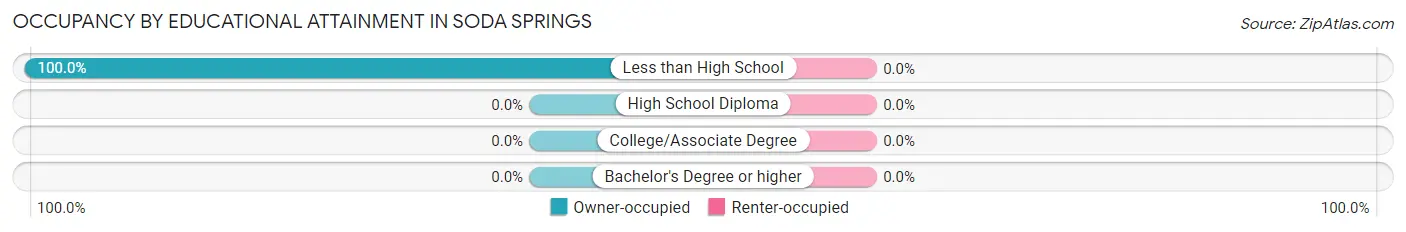
Occupancy by Educational Attainment in Soda Springs
Household Size
Owner-occupied
Renter-occupied
Less than High School
12 (100.0%)
0 (0.0%)
High School Diploma
0 (0.0%)
0 (0.0%)
College/Associate Degree
0 (0.0%)
0 (0.0%)
Bachelor's Degree or higher
0 (0.0%)
0 (0.0%)
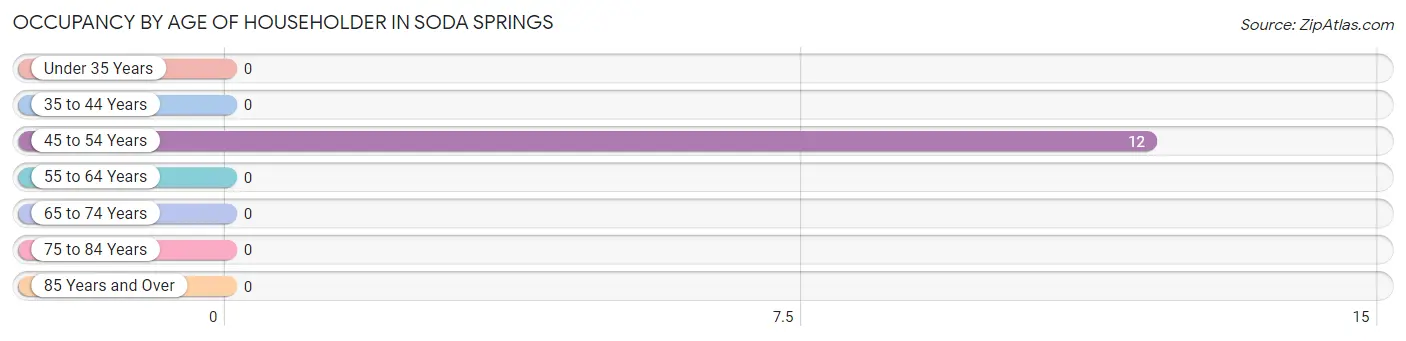
Occupancy by Age of Householder in Soda Springs
Age Bracket
# Households
% Households
Under 35 Years
0
0.0%
35 to 44 Years
0
0.0%
45 to 54 Years
12
100.0%
55 to 64 Years
0
0.0%
65 to 74 Years
0
0.0%
75 to 84 Years
0
0.0%
85 Years and Over
0
0.0%
Total
12
100.0%
Housing Finances in Soda Springs
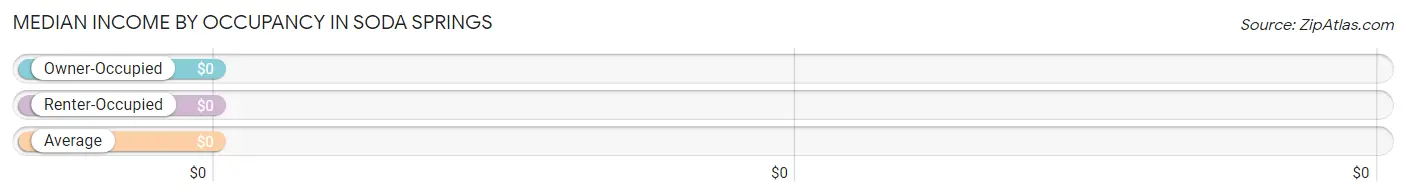
Median Income by Occupancy in Soda Springs
Occupancy Type
# Households
Median Income
Owner-Occupied
12 (100.0%)
$0
Renter-Occupied
0 (0.0%)
$0
Average
12 (100.0%)
$0
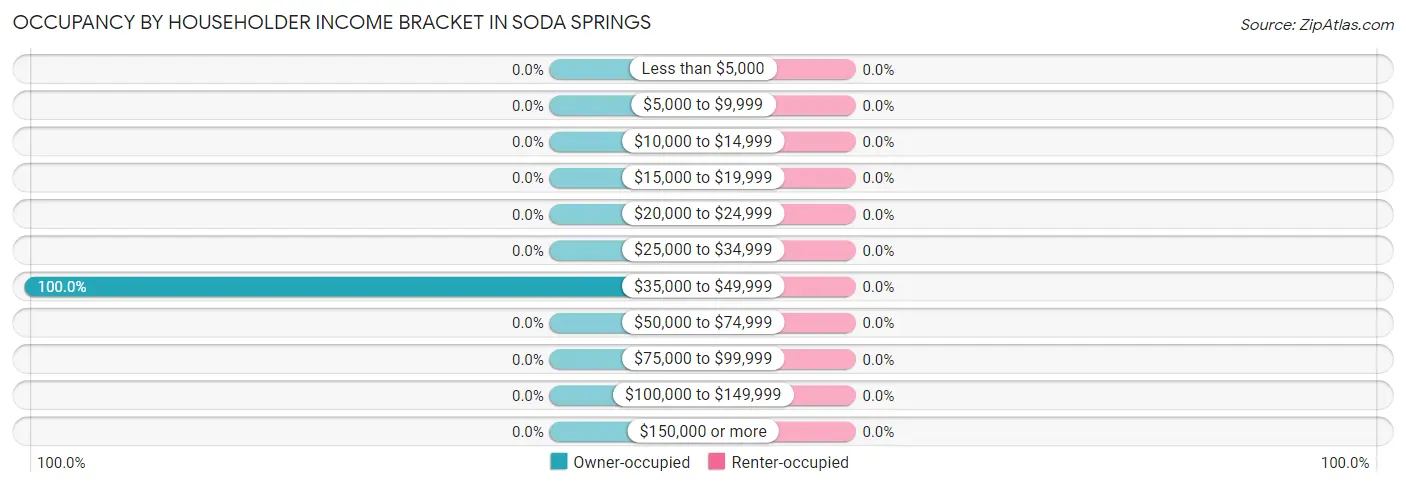
Occupancy by Householder Income Bracket in Soda Springs
Income Bracket
Owner-occupied
Renter-occupied
Less than $5,000
0 (0.0%)
0 (0.0%)
$5,000 to $9,999
0 (0.0%)
0 (0.0%)
$10,000 to $14,999
0 (0.0%)
0 (0.0%)
$15,000 to $19,999
0 (0.0%)
0 (0.0%)
$20,000 to $24,999
0 (0.0%)
0 (0.0%)
$25,000 to $34,999
0 (0.0%)
0 (0.0%)
$35,000 to $49,999
12 (100.0%)
0 (0.0%)
$50,000 to $74,999
0 (0.0%)
0 (0.0%)
$75,000 to $99,999
0 (0.0%)
0 (0.0%)
$100,000 to $149,999
0 (0.0%)
0 (0.0%)
$150,000 or more
0 (0.0%)
0 (0.0%)
Total
12 (100.0%)
0 (0.0%)
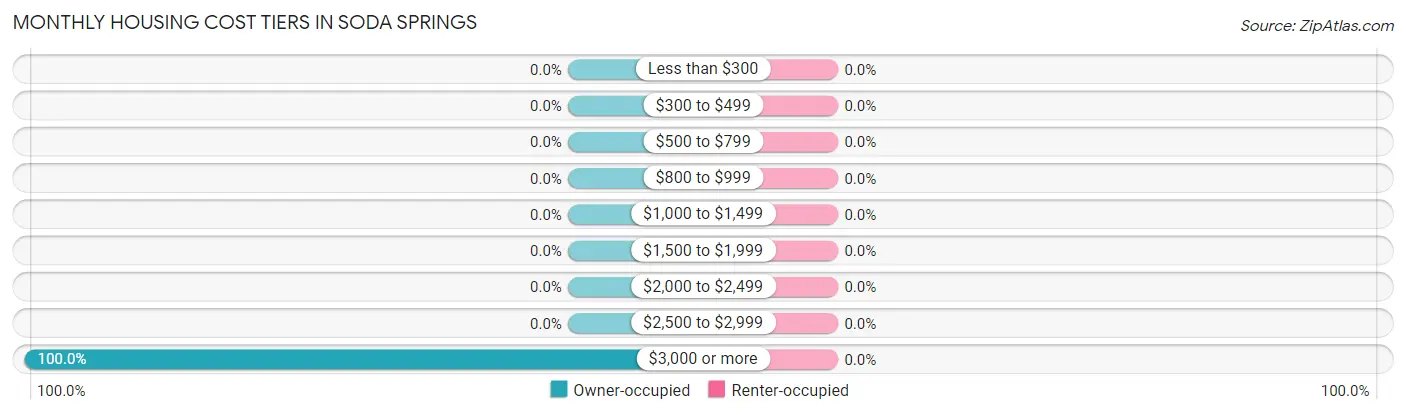
Monthly Housing Cost Tiers in Soda Springs
Monthly Cost
Owner-occupied
Renter-occupied
Less than $300
0 (0.0%)
0 (0.0%)
$300 to $499
0 (0.0%)
0 (0.0%)
$500 to $799
0 (0.0%)
0 (0.0%)
$800 to $999
0 (0.0%)
0 (0.0%)
$1,000 to $1,499
0 (0.0%)
0 (0.0%)
$1,500 to $1,999
0 (0.0%)
0 (0.0%)
$2,000 to $2,499
0 (0.0%)
0 (0.0%)
$2,500 to $2,999
0 (0.0%)
0 (0.0%)
$3,000 or more
12 (100.0%)
0 (0.0%)
Total
12 (100.0%)
0 (0.0%)
Physical Housing Characteristics in Soda Springs
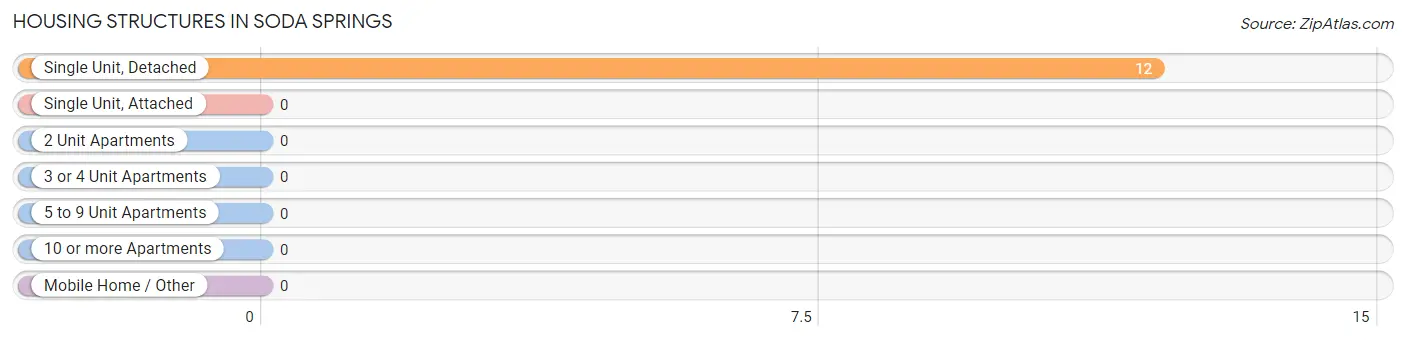
Housing Structures in Soda Springs
Structure Type
# Housing Units
% Housing Units
Single Unit, Detached
12
100.0%
Single Unit, Attached
0
0.0%
2 Unit Apartments
0
0.0%
3 or 4 Unit Apartments
0
0.0%
5 to 9 Unit Apartments
0
0.0%
10 or more Apartments
0
0.0%
Mobile Home / Other
0
0.0%
Total
12
100.0%
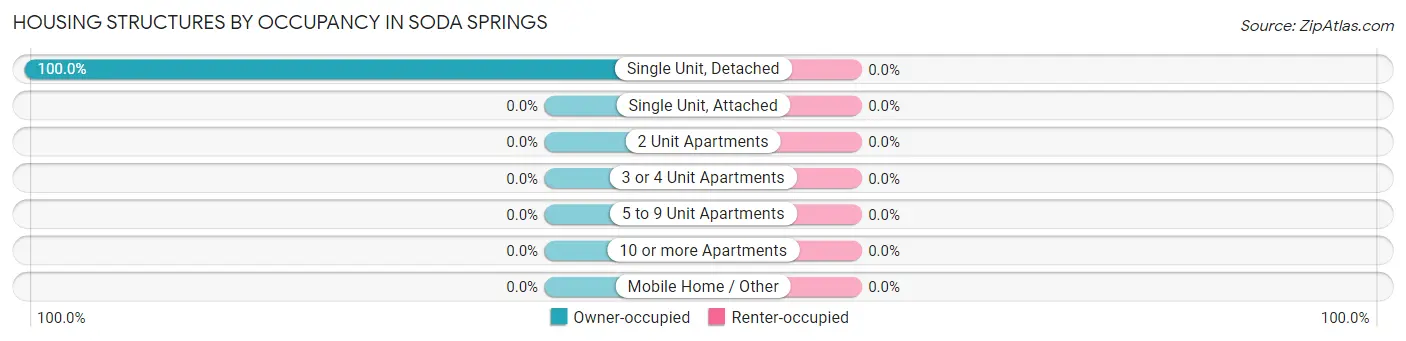
Housing Structures by Occupancy in Soda Springs
Structure Type
Owner-occupied
Renter-occupied
Single Unit, Detached
12 (100.0%)
0 (0.0%)
Single Unit, Attached
0 (0.0%)
0 (0.0%)
2 Unit Apartments
0 (0.0%)
0 (0.0%)
3 or 4 Unit Apartments
0 (0.0%)
0 (0.0%)
5 to 9 Unit Apartments
0 (0.0%)
0 (0.0%)
10 or more Apartments
0 (0.0%)
0 (0.0%)
Mobile Home / Other
0 (0.0%)
0 (0.0%)
Total
12 (100.0%)
0 (0.0%)
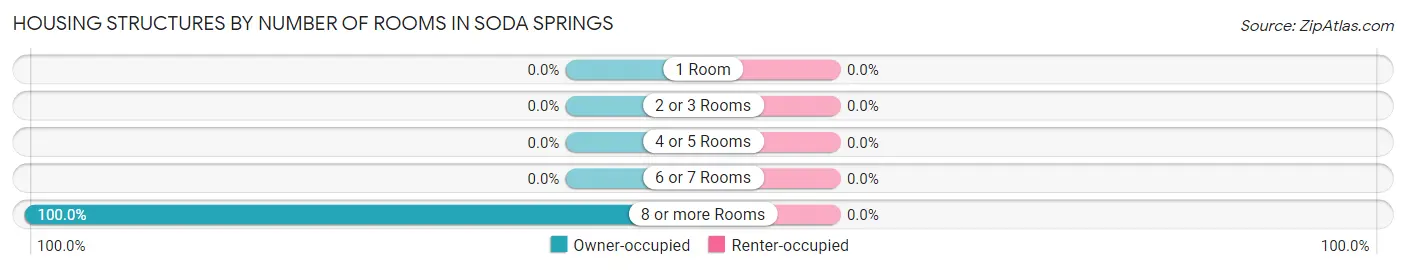
Housing Structures by Number of Rooms in Soda Springs
Number of Rooms
Owner-occupied
Renter-occupied
1 Room
0 (0.0%)
0 (0.0%)
2 or 3 Rooms
0 (0.0%)
0 (0.0%)
4 or 5 Rooms
0 (0.0%)
0 (0.0%)
6 or 7 Rooms
0 (0.0%)
0 (0.0%)
8 or more Rooms
12 (100.0%)
0 (0.0%)
Total
12 (100.0%)
0 (0.0%)
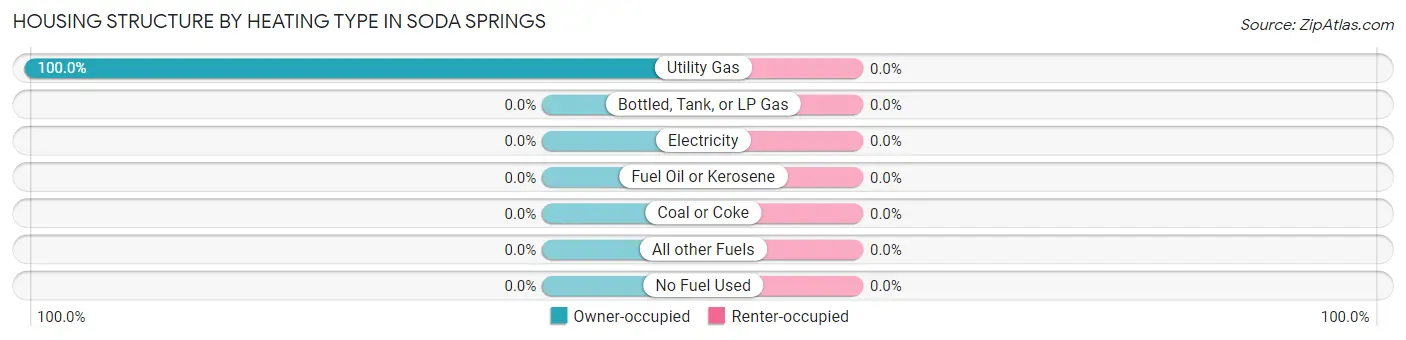
Housing Structure by Heating Type in Soda Springs
Heating Type
Owner-occupied
Renter-occupied
Utility Gas
12 (100.0%)
0 (0.0%)
Bottled, Tank, or LP Gas
0 (0.0%)
0 (0.0%)
Electricity
0 (0.0%)
0 (0.0%)
Fuel Oil or Kerosene
0 (0.0%)
0 (0.0%)
Coal or Coke
0 (0.0%)
0 (0.0%)
All other Fuels
0 (0.0%)
0 (0.0%)
No Fuel Used
0 (0.0%)
0 (0.0%)
Total
12 (100.0%)
0 (0.0%)
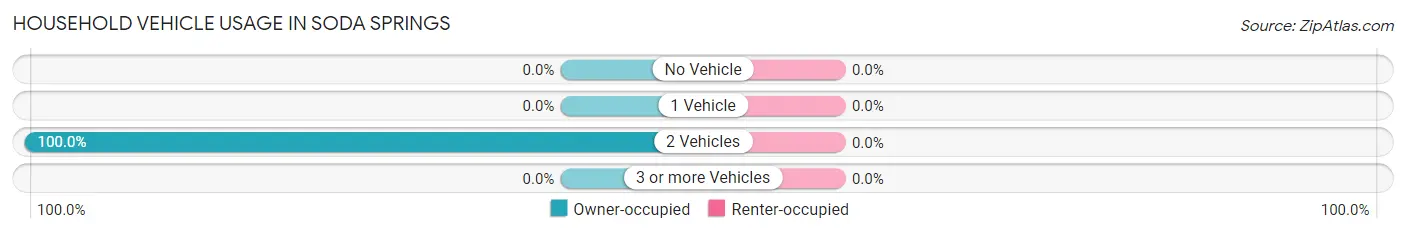
Household Vehicle Usage in Soda Springs
Vehicles per Household
Owner-occupied
Renter-occupied
No Vehicle
0 (0.0%)
0 (0.0%)
1 Vehicle
0 (0.0%)
0 (0.0%)
2 Vehicles
12 (100.0%)
0 (0.0%)
3 or more Vehicles
0 (0.0%)
0 (0.0%)
Total
12 (100.0%)
0 (0.0%)
Real Estate & Mortgages in Soda Springs
Real Estate and Mortgage Overview in Soda Springs
Characteristic
Without Mortgage
With Mortgage
Housing Units
0
12
Median Property Value
-
-
Median Household Income
-
-
Monthly Housing Costs
-
-
Real Estate Taxes
-
-
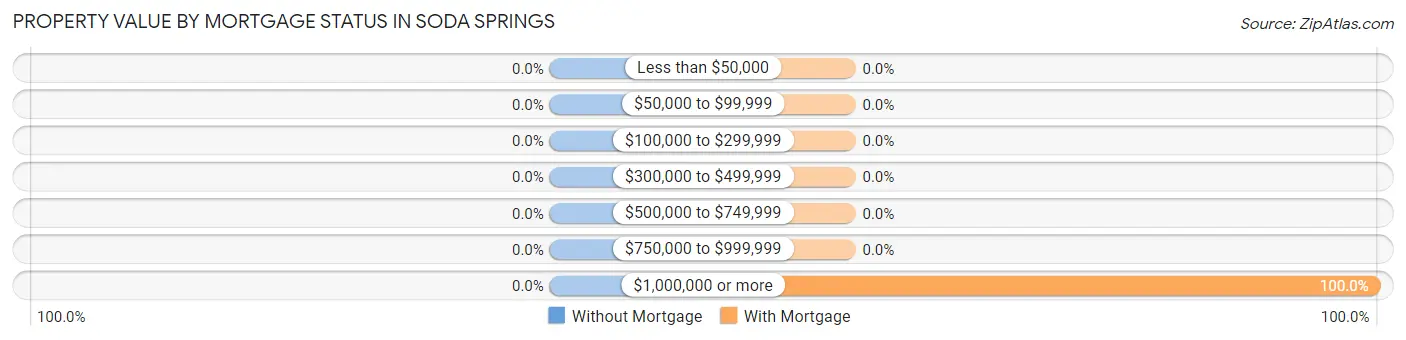
Property Value by Mortgage Status in Soda Springs
Property Value
Without Mortgage
With Mortgage
Less than $50,000
0 (0.0%)
0 (0.0%)
$50,000 to $99,999
0 (0.0%)
0 (0.0%)
$100,000 to $299,999
0 (0.0%)
0 (0.0%)
$300,000 to $499,999
0 (0.0%)
0 (0.0%)
$500,000 to $749,999
0 (0.0%)
0 (0.0%)
$750,000 to $999,999
0 (0.0%)
0 (0.0%)
$1,000,000 or more
0 (0.0%)
12 (100.0%)
Total
0 (0.0%)
12 (100.0%)
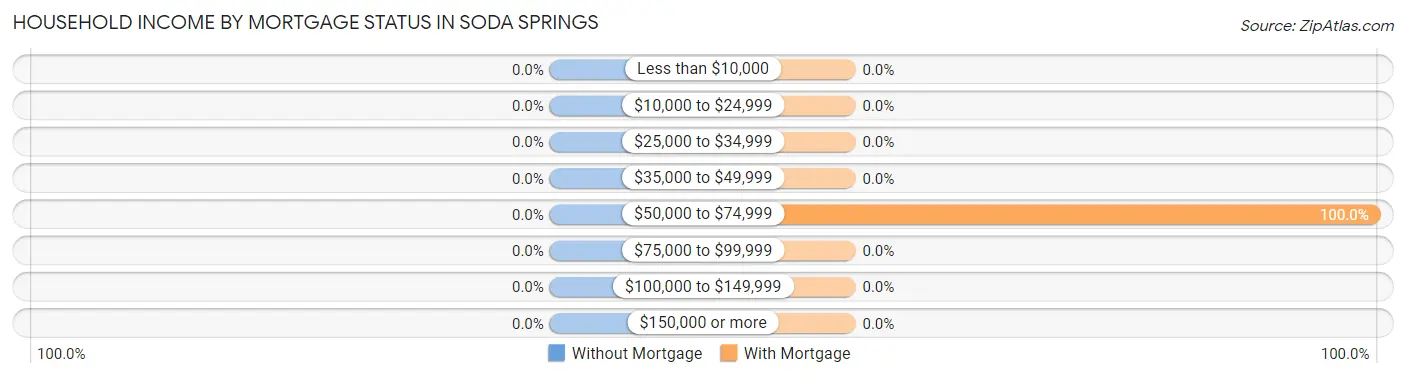
Household Income by Mortgage Status in Soda Springs
Household Income
Without Mortgage
With Mortgage
Less than $10,000
0 (0.0%)
0 (0.0%)
$10,000 to $24,999
0 (0.0%)
0 (0.0%)
$25,000 to $34,999
0 (0.0%)
0 (0.0%)
$35,000 to $49,999
0 (0.0%)
0 (0.0%)
$50,000 to $74,999
0 (0.0%)
12 (100.0%)
$75,000 to $99,999
0 (0.0%)
0 (0.0%)
$100,000 to $149,999
0 (0.0%)
0 (0.0%)
$150,000 or more
0 (0.0%)
0 (0.0%)
Total
0 (0.0%)
12 (100.0%)
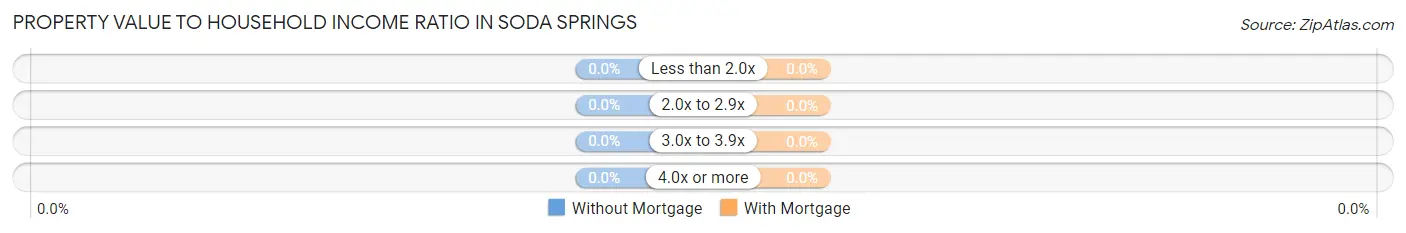
Property Value to Household Income Ratio in Soda Springs
Value-to-Income Ratio
Without Mortgage
With Mortgage
Less than 2.0x
0 (0.0%)
0 (0.0%)
2.0x to 2.9x
0 (0.0%)
0 (0.0%)
3.0x to 3.9x
0 (0.0%)
0 (0.0%)
4.0x or more
0 (0.0%)
0 (0.0%)
Total
0 (0.0%)
12 (100.0%)
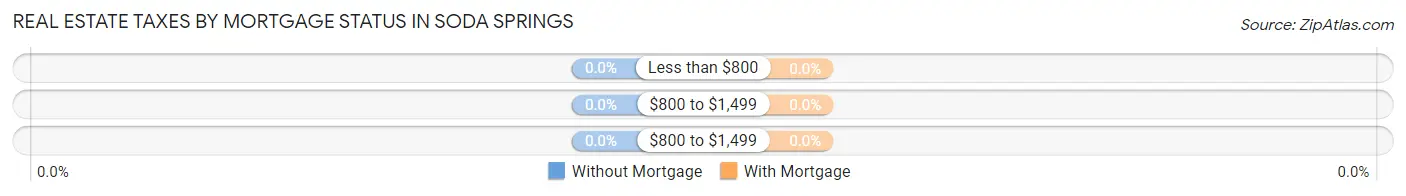
Real Estate Taxes by Mortgage Status in Soda Springs
Property Taxes
Without Mortgage
With Mortgage
Less than $800
0 (0.0%)
0 (0.0%)
$800 to $1,499
0 (0.0%)
0 (0.0%)
$800 to $1,499
0 (0.0%)
0 (0.0%)
Total
0 (0.0%)
12 (100.0%)
Health & Disability in Soda Springs
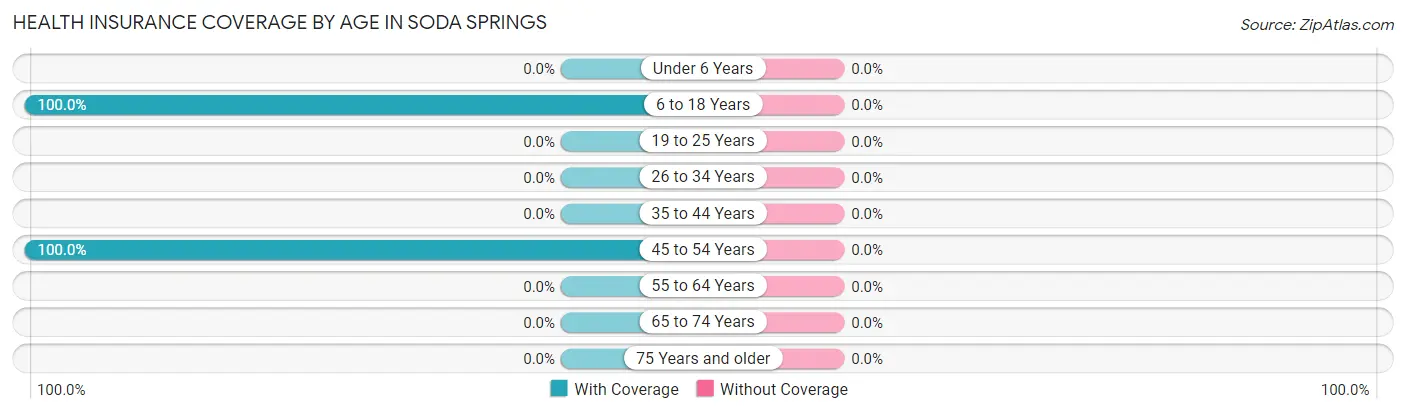
Health Insurance Coverage by Age in Soda Springs
Age Bracket
With Coverage
Without Coverage
Under 6 Years
0 (0.0%)
0 (0.0%)
6 to 18 Years
42 (100.0%)
0 (0.0%)
19 to 25 Years
0 (0.0%)
0 (0.0%)
26 to 34 Years
0 (0.0%)
0 (0.0%)
35 to 44 Years
0 (0.0%)
0 (0.0%)
45 to 54 Years
12 (100.0%)
0 (0.0%)
55 to 64 Years
0 (0.0%)
0 (0.0%)
65 to 74 Years
0 (0.0%)
0 (0.0%)
75 Years and older
0 (0.0%)
0 (0.0%)
Total
54 (100.0%)
0 (0.0%)
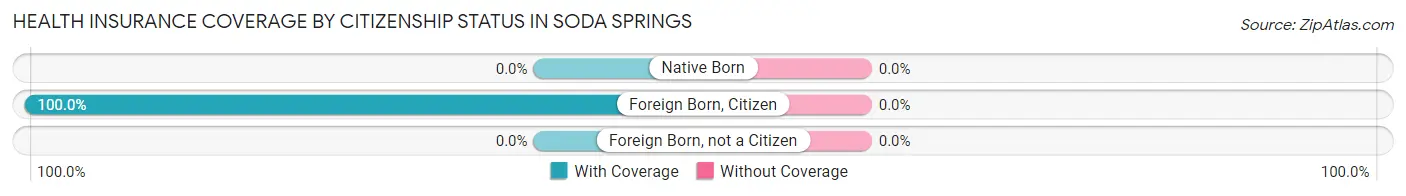
Health Insurance Coverage by Citizenship Status in Soda Springs
Citizenship Status
With Coverage
Without Coverage
Native Born
0 (0.0%)
0 (0.0%)
Foreign Born, Citizen
42 (100.0%)
0 (0.0%)
Foreign Born, not a Citizen
0 (0.0%)
0 (0.0%)
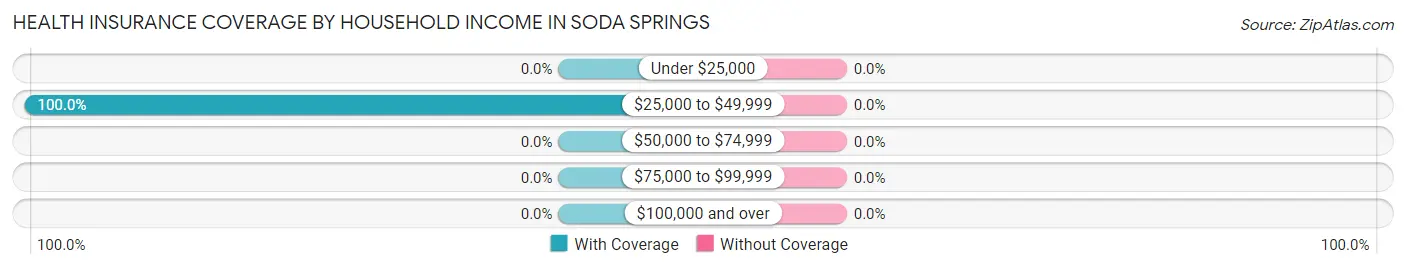
Health Insurance Coverage by Household Income in Soda Springs
Household Income
With Coverage
Without Coverage
Under $25,000
0 (0.0%)
0 (0.0%)
$25,000 to $49,999
54 (100.0%)
0 (0.0%)
$50,000 to $74,999
0 (0.0%)
0 (0.0%)
$75,000 to $99,999
0 (0.0%)
0 (0.0%)
$100,000 and over
0 (0.0%)
0 (0.0%)
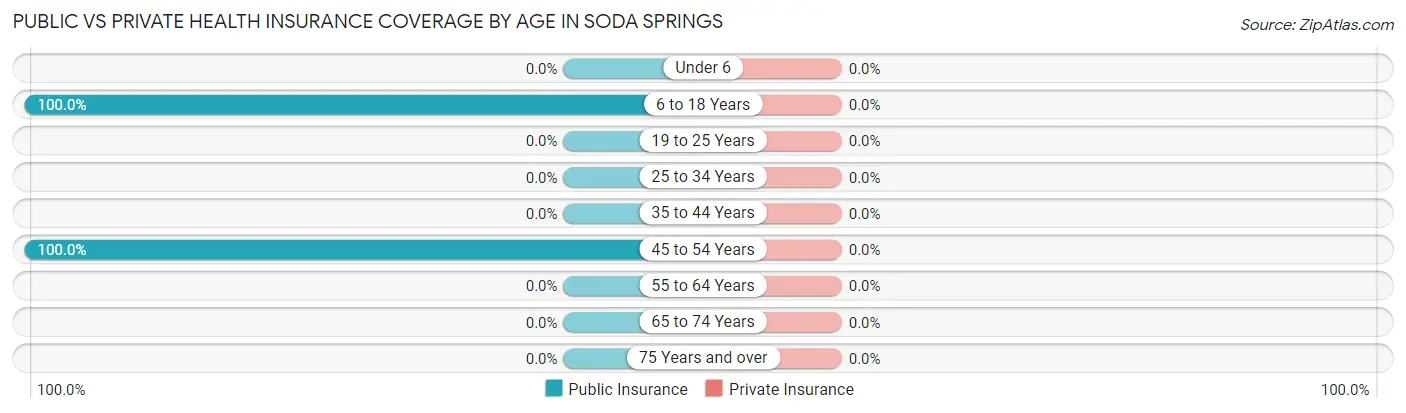
Public vs Private Health Insurance Coverage by Age in Soda Springs
Age Bracket
Public Insurance
Private Insurance
Under 6
0 (0.0%)
0 (0.0%)
6 to 18 Years
42 (100.0%)
0 (0.0%)
19 to 25 Years
0 (0.0%)
0 (0.0%)
25 to 34 Years
0 (0.0%)
0 (0.0%)
35 to 44 Years
0 (0.0%)
0 (0.0%)
45 to 54 Years
12 (100.0%)
0 (0.0%)
55 to 64 Years
0 (0.0%)
0 (0.0%)
65 to 74 Years
0 (0.0%)
0 (0.0%)
75 Years and over
0 (0.0%)
0 (0.0%)
Total
54 (100.0%)
0 (0.0%)
Disability Status by Sex by Age in Soda Springs
Age Bracket
Male
Female
Under 5 Years
0 (0.0%)
0 (0.0%)
5 to 17 Years
0 (0.0%)
0 (0.0%)
18 to 34 Years
0 (0.0%)
0 (0.0%)
35 to 64 Years
0 (0.0%)
0 (0.0%)
65 to 74 Years
0 (0.0%)
0 (0.0%)
75 Years and over
0 (0.0%)
0 (0.0%)
Disability Class by Sex by Age in Soda Springs
Disability Class: Hearing Difficulty
Age Bracket
Male
Female
Under 5 Years
0 (0.0%)
0 (0.0%)
5 to 17 Years
0 (0.0%)
0 (0.0%)
18 to 34 Years
0 (0.0%)
0 (0.0%)
35 to 64 Years
0 (0.0%)
0 (0.0%)
65 to 74 Years
0 (0.0%)
0 (0.0%)
75 Years and over
0 (0.0%)
0 (0.0%)
Disability Class: Vision Difficulty
Age Bracket
Male
Female
Under 5 Years
0 (0.0%)
0 (0.0%)
5 to 17 Years
0 (0.0%)
0 (0.0%)
18 to 34 Years
0 (0.0%)
0 (0.0%)
35 to 64 Years
0 (0.0%)
0 (0.0%)
65 to 74 Years
0 (0.0%)
0 (0.0%)
75 Years and over
0 (0.0%)
0 (0.0%)
Disability Class: Cognitive Difficulty
Age Bracket
Male
Female
5 to 17 Years
0 (0.0%)
0 (0.0%)
18 to 34 Years
0 (0.0%)
0 (0.0%)
35 to 64 Years
0 (0.0%)
0 (0.0%)
65 to 74 Years
0 (0.0%)
0 (0.0%)
75 Years and over
0 (0.0%)
0 (0.0%)
Disability Class: Ambulatory Difficulty
Age Bracket
Male
Female
5 to 17 Years
0 (0.0%)
0 (0.0%)
18 to 34 Years
0 (0.0%)
0 (0.0%)
35 to 64 Years
0 (0.0%)
0 (0.0%)
65 to 74 Years
0 (0.0%)
0 (0.0%)
75 Years and over
0 (0.0%)
0 (0.0%)
Disability Class: Self-Care Difficulty
Age Bracket
Male
Female
5 to 17 Years
0 (0.0%)
0 (0.0%)
18 to 34 Years
0 (0.0%)
0 (0.0%)
35 to 64 Years
0 (0.0%)
0 (0.0%)
65 to 74 Years
0 (0.0%)
0 (0.0%)
75 Years and over
0 (0.0%)
0 (0.0%)
Technology Access in Soda Springs
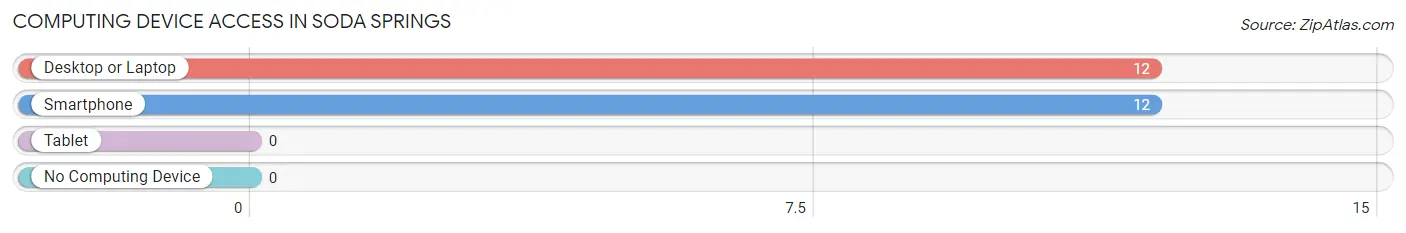
Computing Device Access in Soda Springs
Device Type
# Households
% Households
Desktop or Laptop
12
100.0%
Smartphone
12
100.0%
Tablet
0
0.0%
No Computing Device
0
0.0%
Total
12
100.0%
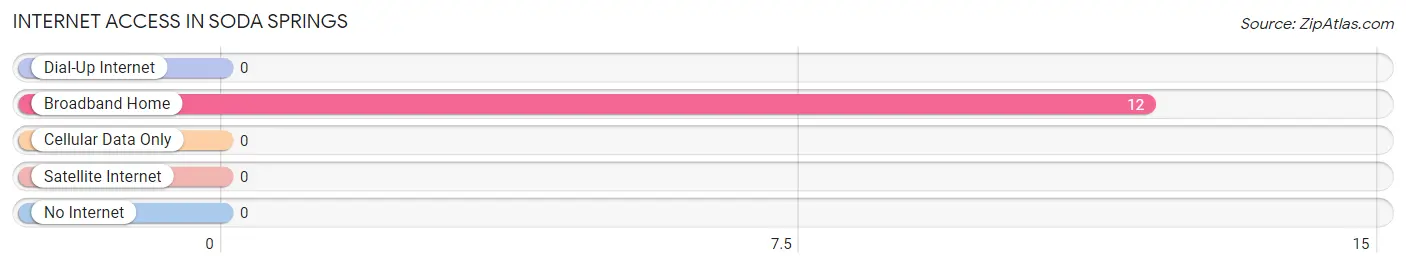
Internet Access in Soda Springs
Internet Type
# Households
% Households
Dial-Up Internet
0
0.0%
Broadband Home
12
100.0%
Cellular Data Only
0
0.0%
Satellite Internet
0
0.0%
No Internet
0
0.0%
Total
12
100.0%
Soda Springs Summary
Soda Springs is a small town located in the Sierra Nevada Mountains of California, in Placer County. It is situated at an elevation of 6,000 feet, and is surrounded by the Tahoe National Forest. The town is known for its natural hot springs, which have been used for centuries by the local Native American tribes for healing and relaxation. The town was founded in 1855 by a group of prospectors who discovered the hot springs and built a resort around them.
History
The area around Soda Springs has been inhabited for thousands of years by the Washoe, Maidu, and Nisenan Native American tribes. The Washoe were the first to discover the hot springs, and used them for healing and relaxation. The area was first explored by Europeans in the early 1800s, and in 1855, a group of prospectors discovered the hot springs and built a resort around them. The resort was a popular destination for travelers, and the town of Soda Springs was officially founded in 1856.
In the late 1800s, Soda Springs became a popular destination for tourists, and the town grew rapidly. The town was home to several hotels, restaurants, and stores, and was a popular destination for outdoor activities such as fishing, hunting, and skiing. In the early 1900s, the town was home to a large lumber mill, which provided jobs for many of the town’s residents.
Geography
Soda Springs is located in the Sierra Nevada Mountains of California, in Placer County. It is situated at an elevation of 6,000 feet, and is surrounded by the Tahoe National Forest. The town is located on the western slope of the Sierra Nevada, and is approximately 30 miles northeast of Sacramento. The town is situated on the banks of the Bear River, and is surrounded by several mountain peaks, including Mount Lincoln, Mount Anderson, and Mount Watson.
The climate in Soda Springs is generally mild, with hot summers and cold winters. The average temperature in the summer is around 70 degrees Fahrenheit, and the average temperature in the winter is around 30 degrees Fahrenheit. The town receives an average of 20 inches of precipitation per year, with most of it falling in the winter months.
Economy
The economy of Soda Springs is largely based on tourism and recreation. The town is home to several resorts and hotels, as well as restaurants and stores. The town is also home to a large lumber mill, which provides jobs for many of the town’s residents. The town is also home to several outdoor activities, such as fishing, hunting, and skiing.
Demographics
As of the 2010 census, the population of Soda Springs was 1,072. The population is largely white (90.2%), with small percentages of other races, including Native American (2.2%), Asian (1.2%), and African American (0.7%). The median household income in the town is $45,000, and the median age is 44. The town is home to several churches, and the majority of the population is Christian (90.2%).
Common Questions
What is the Total Population of Soda Springs?
Total Population of Soda Springs is 54.
What is the Total Male Population of Soda Springs?
Total Male Population of Soda Springs is 42.
What is the Total Female Population of Soda Springs?
Total Female Population of Soda Springs is 12.
What is the Ratio of Males per 100 Females in Soda Springs?
There are 350.00 Males per 100 Females in Soda Springs.
What is the Ratio of Females per 100 Males in Soda Springs?
There are 28.57 Females per 100 Males in Soda Springs.
What is the Average Family Size in Soda Springs
Average Family Size in Soda Springs is 4.5 People.
What is the Average Household Size in Soda Springs
Average Household Size in Soda Springs is 4.5 People.
How Large is the Labor Force in Soda Springs?
There are 54 People in the Labor Forcein in Soda Springs.
What is the Percentage of People in the Labor Force in Soda Springs?
100.0% of People are in the Labor Force in Soda Springs.
Report Title
Report Link
HTML Copy & Paste Link
Social Media
Copy and paste the folowing code into any webpage where you would like this interactive chart to display