Cities with the Highest Percentage of Asian Population in Missouri
RELATED REPORTS & OPTIONS
Asian
Missouri
Compare Cities
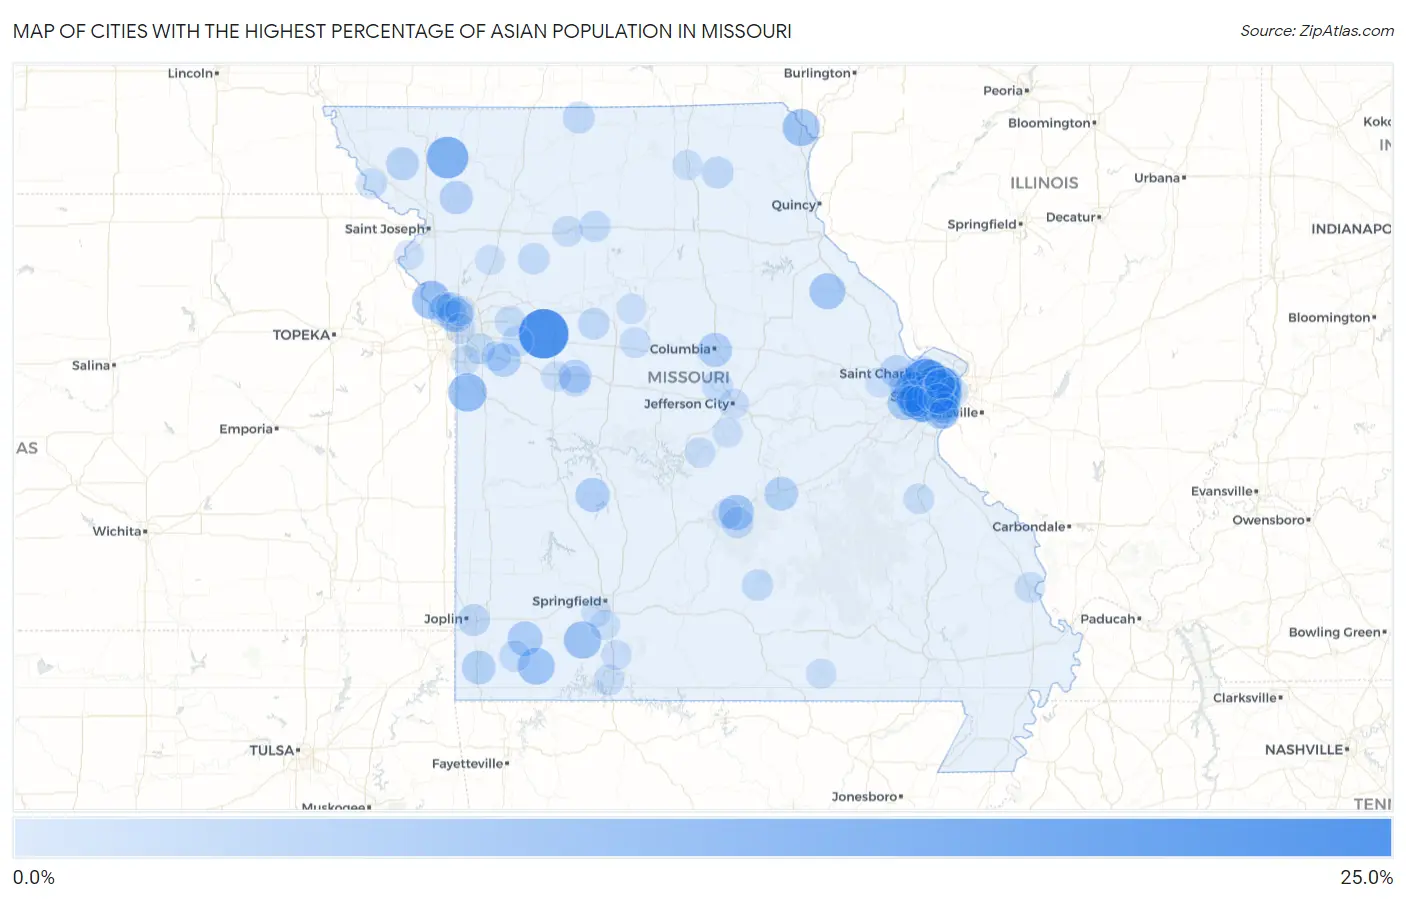
Map of Cities with the Highest Percentage of Asian Population in Missouri
0.0%
25.0%
Cities with the Highest Percentage of Asian Population in Missouri
| City | Asian | vs State | vs National | |
| 1. | Mayview | 21.6% | 2.1%(+19.5)#1 | 5.8%(+15.8)#470 |
| 2. | Maryland Heights | 18.8% | 2.1%(+16.7)#2 | 5.8%(+13.0)#591 |
| 3. | Olivette | 18.6% | 2.1%(+16.6)#3 | 5.8%(+12.9)#597 |
| 4. | Conception | 13.5% | 2.1%(+11.5)#4 | 5.8%(+7.76)#952 |
| 5. | Chesterfield | 13.1% | 2.1%(+11.1)#5 | 5.8%(+7.36)#1,003 |
| 6. | Manchester | 11.9% | 2.1%(+9.87)#6 | 5.8%(+6.16)#1,132 |
| 7. | Frontenac | 10.8% | 2.1%(+8.74)#7 | 5.8%(+5.03)#1,294 |
| 8. | Creve Coeur | 10.8% | 2.1%(+8.73)#8 | 5.8%(+5.02)#1,296 |
| 9. | Clayton | 10.5% | 2.1%(+8.39)#9 | 5.8%(+4.68)#1,341 |
| 10. | Town And Country | 10.4% | 2.1%(+8.35)#10 | 5.8%(+4.65)#1,347 |
| 11. | Lake Annette | 10.2% | 2.1%(+8.16)#11 | 5.8%(+4.45)#1,380 |
| 12. | Farley | 10.0% | 2.1%(+7.98)#12 | 5.8%(+4.27)#1,407 |
| 13. | Hurley | 9.2% | 2.1%(+7.11)#13 | 5.8%(+3.40)#1,562 |
| 14. | Crystal Lake Park | 9.1% | 2.1%(+7.07)#14 | 5.8%(+3.36)#1,572 |
| 15. | St Francisville | 9.0% | 2.1%(+6.94)#15 | 5.8%(+3.23)#1,602 |
| 16. | Butterfield | 8.8% | 2.1%(+6.74)#16 | 5.8%(+3.03)#1,647 |
| 17. | Ballwin | 8.3% | 2.1%(+6.28)#17 | 5.8%(+2.57)#1,730 |
| 18. | Curryville | 7.8% | 2.1%(+5.78)#18 | 5.8%(+2.07)#1,848 |
| 19. | Ladue | 7.5% | 2.1%(+5.42)#19 | 5.8%(+1.72)#1,938 |
| 20. | Green Park | 7.4% | 2.1%(+5.30)#20 | 5.8%(+1.59)#1,976 |
| 21. | St Robert | 7.3% | 2.1%(+5.22)#21 | 5.8%(+1.51)#1,996 |
| 22. | Wildwood | 7.0% | 2.1%(+4.89)#22 | 5.8%(+1.18)#2,110 |
| 23. | Shrewsbury | 6.8% | 2.1%(+4.78)#23 | 5.8%(+1.08)#2,150 |
| 24. | Pierce City | 6.8% | 2.1%(+4.78)#24 | 5.8%(+1.07)#2,151 |
| 25. | University City | 6.8% | 2.1%(+4.71)#25 | 5.8%(+1.00)#2,176 |
| 26. | Northmoor | 6.3% | 2.1%(+4.27)#26 | 5.8%(+0.560)#2,330 |
| 27. | Brentwood | 6.2% | 2.1%(+4.18)#27 | 5.8%(+0.467)#2,373 |
| 28. | Wheatland | 6.1% | 2.1%(+4.08)#28 | 5.8%(+0.375)#2,407 |
| 29. | Columbia | 6.1% | 2.1%(+4.03)#29 | 5.8%(+0.321)#2,434 |
| 30. | Whiting | 5.9% | 2.1%(+3.86)#30 | 5.8%(+0.148)#2,508 |
| 31. | Rolla | 5.7% | 2.1%(+3.68)#31 | 5.8%(-0.030)#2,588 |
| 32. | Lone Jack | 5.7% | 2.1%(+3.66)#32 | 5.8%(-0.050)#2,596 |
| 33. | Goodman | 5.7% | 2.1%(+3.65)#33 | 5.8%(-0.056)#2,599 |
| 34. | Union Star | 5.5% | 2.1%(+3.40)#34 | 5.8%(-0.304)#2,734 |
| 35. | Twin Oaks | 5.3% | 2.1%(+3.27)#35 | 5.8%(-0.441)#2,821 |
| 36. | Maitland | 5.2% | 2.1%(+3.13)#36 | 5.8%(-0.582)#2,892 |
| 37. | Weldon Spring | 5.1% | 2.1%(+3.05)#37 | 5.8%(-0.660)#2,932 |
| 38. | Knob Noster | 5.1% | 2.1%(+3.02)#38 | 5.8%(-0.688)#2,947 |
| 39. | Richmond Heights | 4.5% | 2.1%(+2.46)#39 | 5.8%(-1.24)#3,283 |
| 40. | O Fallon | 4.4% | 2.1%(+2.37)#40 | 5.8%(-1.33)#3,358 |
| 41. | Maplewood | 4.3% | 2.1%(+2.20)#41 | 5.8%(-1.51)#3,476 |
| 42. | Westwood | 4.2% | 2.1%(+2.14)#42 | 5.8%(-1.57)#3,529 |
| 43. | Clarkson Valley | 4.1% | 2.1%(+2.04)#43 | 5.8%(-1.67)#3,611 |
| 44. | Duquesne | 4.0% | 2.1%(+1.98)#44 | 5.8%(-1.72)#3,653 |
| 45. | Normandy | 4.0% | 2.1%(+1.98)#45 | 5.8%(-1.73)#3,655 |
| 46. | Hurdland | 4.0% | 2.1%(+1.95)#46 | 5.8%(-1.75)#3,674 |
| 47. | Mercer | 3.9% | 2.1%(+1.88)#47 | 5.8%(-1.83)#3,739 |
| 48. | Fort Leonard Wood | 3.8% | 2.1%(+1.77)#48 | 5.8%(-1.94)#3,837 |
| 49. | Parkville | 3.8% | 2.1%(+1.74)#49 | 5.8%(-1.97)#3,860 |
| 50. | Mount Leonard | 3.8% | 2.1%(+1.71)#50 | 5.8%(-2.00)#3,882 |
| 51. | Ellisville | 3.8% | 2.1%(+1.70)#51 | 5.8%(-2.01)#3,891 |
| 52. | Overland | 3.7% | 2.1%(+1.66)#52 | 5.8%(-2.05)#3,924 |
| 53. | Huntleigh | 3.7% | 2.1%(+1.66)#53 | 5.8%(-2.05)#3,926 |
| 54. | Affton | 3.6% | 2.1%(+1.57)#54 | 5.8%(-2.14)#4,008 |
| 55. | Houston | 3.6% | 2.1%(+1.50)#55 | 5.8%(-2.21)#4,080 |
| 56. | St Charles | 3.5% | 2.1%(+1.48)#56 | 5.8%(-2.23)#4,096 |
| 57. | Sycamore Hills | 3.5% | 2.1%(+1.48)#57 | 5.8%(-2.23)#4,098 |
| 58. | Fairview | 3.5% | 2.1%(+1.45)#58 | 5.8%(-2.26)#4,116 |
| 59. | St Louis | 3.5% | 2.1%(+1.44)#59 | 5.8%(-2.27)#4,138 |
| 60. | Cowgill | 3.5% | 2.1%(+1.42)#60 | 5.8%(-2.29)#4,160 |
| 61. | Wheeling | 3.4% | 2.1%(+1.38)#61 | 5.8%(-2.32)#4,202 |
| 62. | Winchester | 3.4% | 2.1%(+1.38)#62 | 5.8%(-2.33)#4,207 |
| 63. | Riverside | 3.4% | 2.1%(+1.32)#63 | 5.8%(-2.39)#4,268 |
| 64. | Bates City | 3.2% | 2.1%(+1.18)#64 | 5.8%(-2.53)#4,408 |
| 65. | Weatherby Lake | 3.1% | 2.1%(+1.07)#65 | 5.8%(-2.63)#4,559 |
| 66. | Hartsburg | 3.1% | 2.1%(+1.01)#66 | 5.8%(-2.70)#4,629 |
| 67. | Unity Village | 3.1% | 2.1%(+1.01)#67 | 5.8%(-2.70)#4,632 |
| 68. | Nelson | 3.0% | 2.1%(+0.966)#68 | 5.8%(-2.74)#4,704 |
| 69. | Levasy | 3.0% | 2.1%(+0.966)#69 | 5.8%(-2.74)#4,705 |
| 70. | Bridgeton | 3.0% | 2.1%(+0.939)#70 | 5.8%(-2.77)#4,738 |
| 71. | Utica | 3.0% | 2.1%(+0.906)#71 | 5.8%(-2.80)#4,776 |
| 72. | St George | 2.9% | 2.1%(+0.869)#72 | 5.8%(-2.84)#4,819 |
| 73. | Whiteman Afb | 2.9% | 2.1%(+0.849)#73 | 5.8%(-2.86)#4,840 |
| 74. | Branson | 2.9% | 2.1%(+0.845)#74 | 5.8%(-2.86)#4,852 |
| 75. | Big Lake | 2.9% | 2.1%(+0.834)#75 | 5.8%(-2.87)#4,869 |
| 76. | Cape Girardeau | 2.8% | 2.1%(+0.778)#76 | 5.8%(-2.93)#4,949 |
| 77. | St John | 2.8% | 2.1%(+0.731)#77 | 5.8%(-2.98)#5,025 |
| 78. | Platte Woods | 2.8% | 2.1%(+0.719)#78 | 5.8%(-2.99)#5,046 |
| 79. | Bonne Terre | 2.8% | 2.1%(+0.704)#79 | 5.8%(-3.00)#5,066 |
| 80. | Tuscumbia | 2.7% | 2.1%(+0.638)#80 | 5.8%(-3.07)#5,141 |
| 81. | Kansas City | 2.7% | 2.1%(+0.610)#81 | 5.8%(-3.10)#5,188 |
| 82. | Jefferson City | 2.6% | 2.1%(+0.536)#82 | 5.8%(-3.17)#5,301 |
| 83. | Kirksville | 2.6% | 2.1%(+0.514)#83 | 5.8%(-3.19)#5,327 |
| 84. | Saddlebrooke | 2.5% | 2.1%(+0.483)#84 | 5.8%(-3.22)#5,364 |
| 85. | Warrensburg | 2.5% | 2.1%(+0.478)#85 | 5.8%(-3.23)#5,372 |
| 86. | Alton | 2.5% | 2.1%(+0.432)#86 | 5.8%(-3.28)#5,436 |
| 87. | Lake Lotawana | 2.5% | 2.1%(+0.388)#87 | 5.8%(-3.32)#5,499 |
| 88. | St Thomas | 2.4% | 2.1%(+0.345)#88 | 5.8%(-3.36)#5,581 |
| 89. | New Melle | 2.4% | 2.1%(+0.328)#89 | 5.8%(-3.38)#5,605 |
| 90. | Slater | 2.4% | 2.1%(+0.301)#90 | 5.8%(-3.41)#5,654 |
| 91. | Lathrop | 2.4% | 2.1%(+0.292)#91 | 5.8%(-3.42)#5,669 |
| 92. | Grandview | 2.3% | 2.1%(+0.277)#92 | 5.8%(-3.43)#5,696 |
| 93. | Oakview | 2.3% | 2.1%(+0.267)#93 | 5.8%(-3.44)#5,720 |
| 94. | Nixa | 2.3% | 2.1%(+0.265)#94 | 5.8%(-3.44)#5,724 |
| 95. | Philadelphia | 2.3% | 2.1%(+0.254)#95 | 5.8%(-3.45)#5,741 |
| 96. | Waynesville | 2.3% | 2.1%(+0.244)#96 | 5.8%(-3.46)#5,761 |
| 97. | Rushville | 2.3% | 2.1%(+0.235)#97 | 5.8%(-3.47)#5,776 |
| 98. | Rock Hill | 2.3% | 2.1%(+0.220)#98 | 5.8%(-3.49)#5,798 |
| 99. | Battlefield | 2.3% | 2.1%(+0.218)#99 | 5.8%(-3.49)#5,800 |
| 100. | Mehlville | 2.3% | 2.1%(+0.198)#100 | 5.8%(-3.51)#5,832 |
Common Questions
What are the Top 10 Cities with the Highest Percentage of Asian Population in Missouri?
Top 10 Cities with the Highest Percentage of Asian Population in Missouri are:
#1
21.6%
#2
18.8%
#3
18.6%
#4
13.5%
#5
13.1%
#6
11.9%
#7
10.8%
#8
10.8%
#9
10.5%
#10
10.4%
What city has the Highest Percentage of Asian Population in Missouri?
Mayview has the Highest Percentage of Asian Population in Missouri with 21.6%.
What is the Percentage of Asian Population in the State of Missouri?
Percentage of Asian Population in Missouri is 2.1%.
What is the Percentage of Asian Population in the United States?
Percentage of Asian Population in the United States is 5.8%.