Johannesburg, CA Map & Demographics
Johannesburg Map
Johannesburg Overview
$9,224
PER CAPITA INCOME
$2,499
AVG HOUSEHOLD INCOME
0.74
INEQUALITY / GINI INDEX
94
TOTAL POPULATION
60
MALE POPULATION
34
FEMALE POPULATION
176.47
MALES / 100 FEMALES
56.67
FEMALES / 100 MALES
35.5
MEDIAN AGE
3.0
AVG FAMILY SIZE
1.9
AVG HOUSEHOLD SIZE
44
LABOR FORCE [ PEOPLE ]
46.8%
PERCENT IN LABOR FORCE
22.7%
UNEMPLOYMENT RATE
Johannesburg Zip Codes
Income in Johannesburg
Income Overview in Johannesburg
| Characteristic | Number | Measure |
| Per Capita Income | 94 | $9,224 |
| Median Family Income | 22 | $0 |
| Mean Family Income | 22 | $0 |
| Median Household Income | 50 | $2,499 |
| Mean Household Income | 50 | $0 |
| Income Deficit | 22 | $0 |
| Wage / Income Gap (%) | 94 | 0.00% |
| Wage / Income Gap ($) | 94 | 100.00¢ per $1 |
| Gini / Inequality Index | 94 | 0.74 |
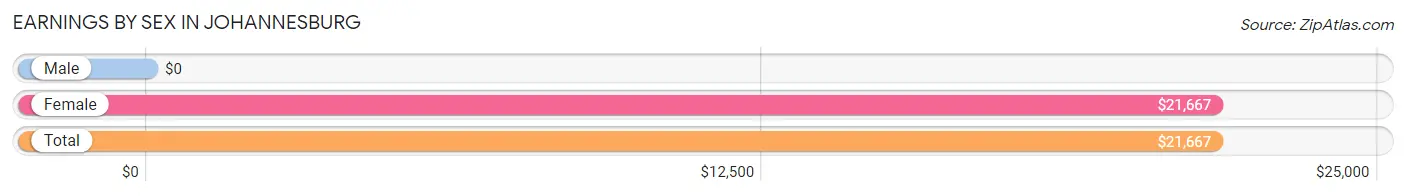
Earnings by Sex in Johannesburg
| Sex | Number | Average Earnings |
| Male | 0 (0.0%) | $0 |
| Female | 34 (100.0%) | $21,667 |
| Total | 34 (100.0%) | $21,667 |
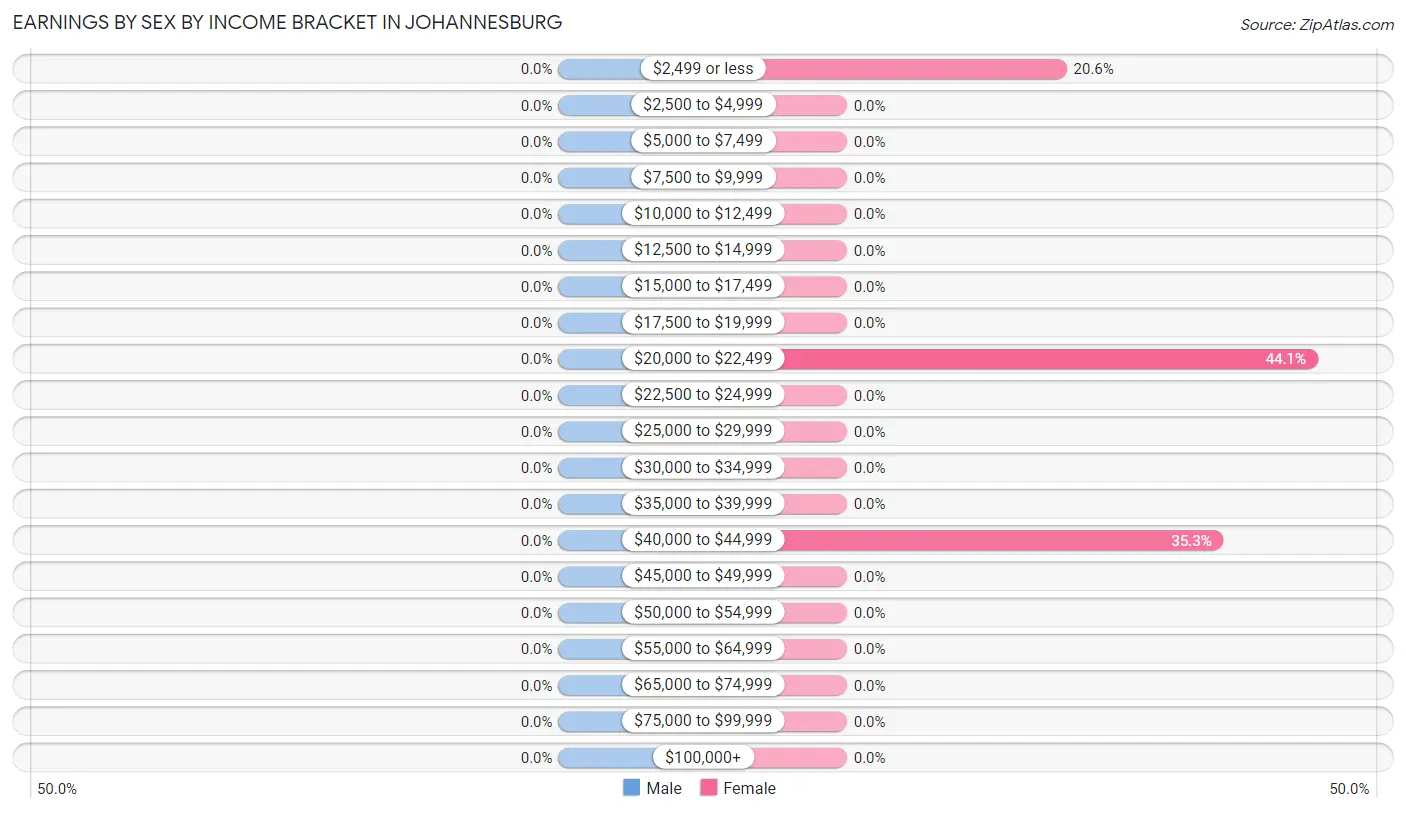
Earnings by Sex by Income Bracket in Johannesburg
| Income | Male | Female |
| $2,499 or less | 0 (0.0%) | 7 (20.6%) |
| $2,500 to $4,999 | 0 (0.0%) | 0 (0.0%) |
| $5,000 to $7,499 | 0 (0.0%) | 0 (0.0%) |
| $7,500 to $9,999 | 0 (0.0%) | 0 (0.0%) |
| $10,000 to $12,499 | 0 (0.0%) | 0 (0.0%) |
| $12,500 to $14,999 | 0 (0.0%) | 0 (0.0%) |
| $15,000 to $17,499 | 0 (0.0%) | 0 (0.0%) |
| $17,500 to $19,999 | 0 (0.0%) | 0 (0.0%) |
| $20,000 to $22,499 | 0 (0.0%) | 15 (44.1%) |
| $22,500 to $24,999 | 0 (0.0%) | 0 (0.0%) |
| $25,000 to $29,999 | 0 (0.0%) | 0 (0.0%) |
| $30,000 to $34,999 | 0 (0.0%) | 0 (0.0%) |
| $35,000 to $39,999 | 0 (0.0%) | 0 (0.0%) |
| $40,000 to $44,999 | 0 (0.0%) | 12 (35.3%) |
| $45,000 to $49,999 | 0 (0.0%) | 0 (0.0%) |
| $50,000 to $54,999 | 0 (0.0%) | 0 (0.0%) |
| $55,000 to $64,999 | 0 (0.0%) | 0 (0.0%) |
| $65,000 to $74,999 | 0 (0.0%) | 0 (0.0%) |
| $75,000 to $99,999 | 0 (0.0%) | 0 (0.0%) |
| $100,000+ | 0 (0.0%) | 0 (0.0%) |
| Total | 0 (0.0%) | 34 (100.0%) |
Earnings by Sex by Educational Attainment in Johannesburg
| Educational Attainment | Male Income | Female Income |
| Less than High School | - | - |
| High School Diploma | - | - |
| College or Associate's Degree | - | - |
| Bachelor's Degree | - | - |
| Graduate Degree | - | - |
| Total | - | - |
Family Income in Johannesburg
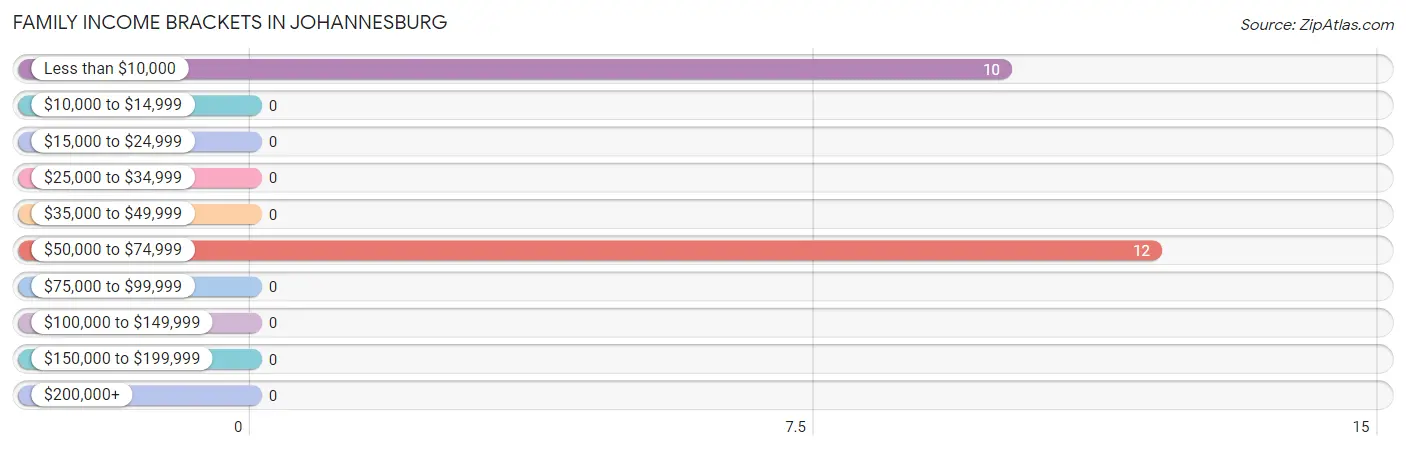
Family Income Brackets in Johannesburg
According to the Johannesburg family income data, there are 12 families falling into the $50,000 to $74,999 income range, which is the most common income bracket and makes up 54.5% of all families.
| Income Bracket | # Families | % Families |
| Less than $10,000 | 10 | 45.5% |
| $10,000 to $14,999 | 0 | 0.0% |
| $15,000 to $24,999 | 0 | 0.0% |
| $25,000 to $34,999 | 0 | 0.0% |
| $35,000 to $49,999 | 0 | 0.0% |
| $50,000 to $74,999 | 12 | 54.5% |
| $75,000 to $99,999 | 0 | 0.0% |
| $100,000 to $149,999 | 0 | 0.0% |
| $150,000 to $199,999 | 0 | 0.0% |
| $200,000+ | 0 | 0.0% |
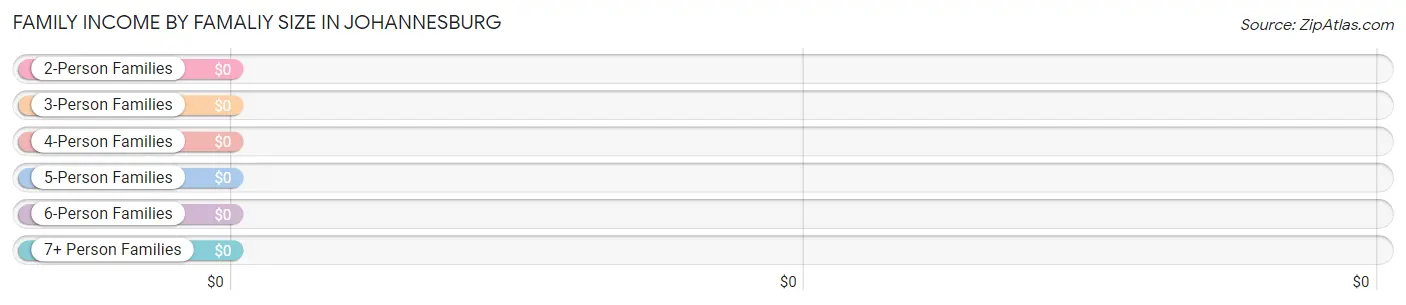
Family Income by Famaliy Size in Johannesburg
| Income Bracket | # Families | Median Income |
| 2-Person Families | 10 (45.5%) | $0 |
| 3-Person Families | 12 (54.5%) | $0 |
| 4-Person Families | 0 (0.0%) | $0 |
| 5-Person Families | 0 (0.0%) | $0 |
| 6-Person Families | 0 (0.0%) | $0 |
| 7+ Person Families | 0 (0.0%) | $0 |
| Total | 22 (100.0%) | $0 |
Family Income by Number of Earners in Johannesburg
| Number of Earners | # Families | Median Income |
| No Earners | 0 (0.0%) | $0 |
| 1 Earner | 10 (45.5%) | $0 |
| 2 Earners | 12 (54.5%) | $0 |
| 3+ Earners | 0 (0.0%) | $0 |
| Total | 22 (100.0%) | $0 |
Household Income in Johannesburg
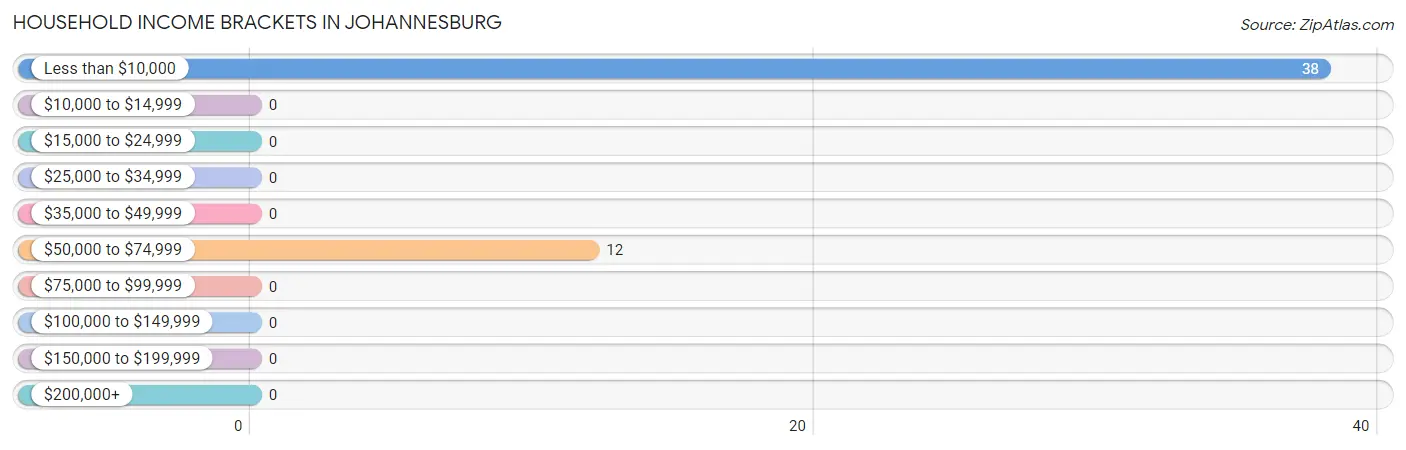
Household Income Brackets in Johannesburg
With 38 households falling in the category, the less than $10,000 income range is the most frequent in Johannesburg, accounting for 76.0% of all households.
| Income Bracket | # Households | % Households |
| Less than $10,000 | 38 | 76.0% |
| $10,000 to $14,999 | 0 | 0.0% |
| $15,000 to $24,999 | 0 | 0.0% |
| $25,000 to $34,999 | 0 | 0.0% |
| $35,000 to $49,999 | 0 | 0.0% |
| $50,000 to $74,999 | 12 | 24.0% |
| $75,000 to $99,999 | 0 | 0.0% |
| $100,000 to $149,999 | 0 | 0.0% |
| $150,000 to $199,999 | 0 | 0.0% |
| $200,000+ | 0 | 0.0% |
Household Income by Householder Age in Johannesburg
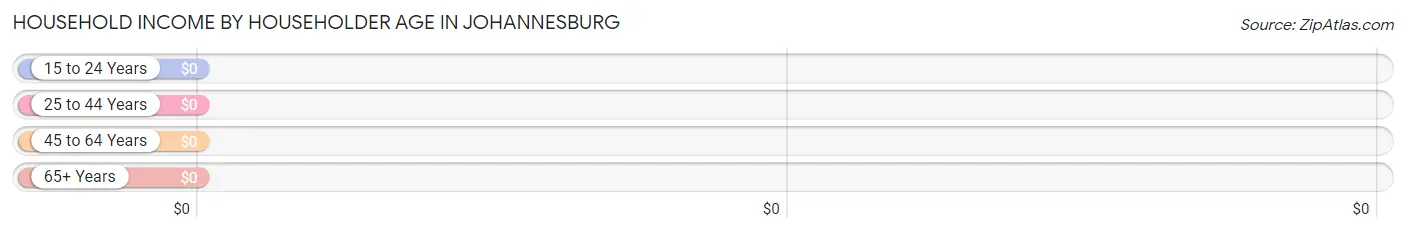
| Income Bracket | # Households | Median Income |
| 15 to 24 Years | 0 (0.0%) | $0 |
| 25 to 44 Years | 38 (76.0%) | $0 |
| 45 to 64 Years | 12 (24.0%) | $0 |
| 65+ Years | 0 (0.0%) | $0 |
| Total | 50 (100.0%) | $2,499 |
Poverty in Johannesburg
Income Below Poverty by Sex and Age in Johannesburg
With 63.3% poverty level for males and 20.6% for females among the residents of Johannesburg, 35 to 44 year old males and 65 to 74 year old females are the most vulnerable to poverty, with 28 males (100.0%) and 7 females (100.0%) in their respective age groups living below the poverty level.
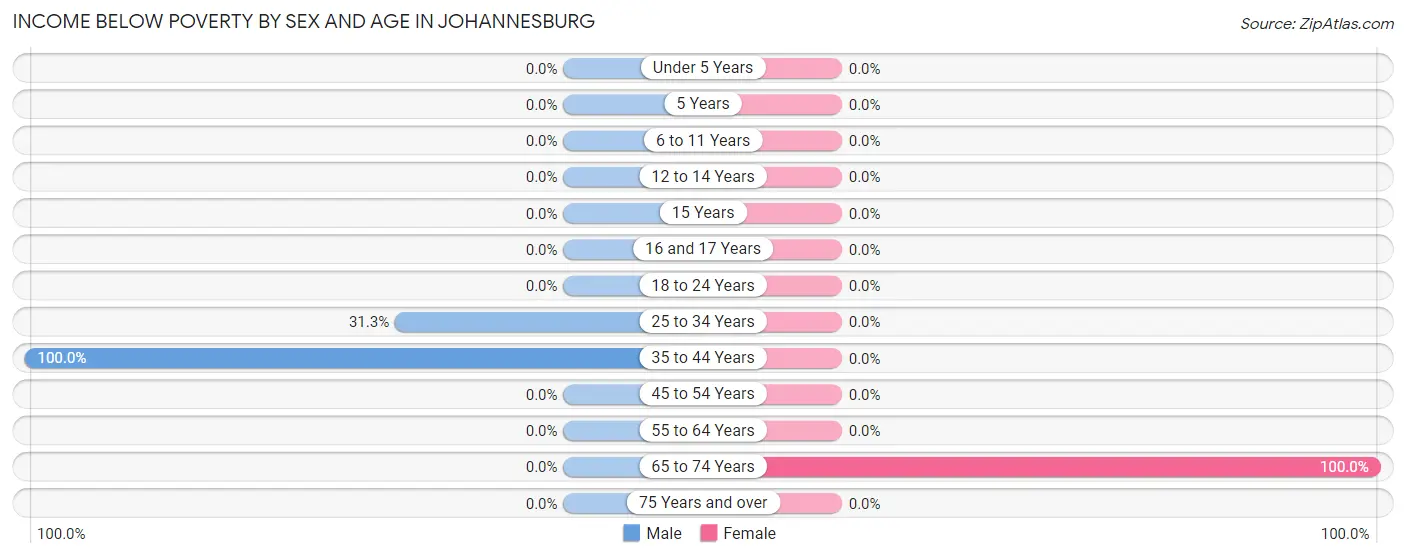
| Age Bracket | Male | Female |
| Under 5 Years | 0 (0.0%) | 0 (0.0%) |
| 5 Years | 0 (0.0%) | 0 (0.0%) |
| 6 to 11 Years | 0 (0.0%) | 0 (0.0%) |
| 12 to 14 Years | 0 (0.0%) | 0 (0.0%) |
| 15 Years | 0 (0.0%) | 0 (0.0%) |
| 16 and 17 Years | 0 (0.0%) | 0 (0.0%) |
| 18 to 24 Years | 0 (0.0%) | 0 (0.0%) |
| 25 to 34 Years | 10 (31.2%) | 0 (0.0%) |
| 35 to 44 Years | 28 (100.0%) | 0 (0.0%) |
| 45 to 54 Years | 0 (0.0%) | 0 (0.0%) |
| 55 to 64 Years | 0 (0.0%) | 0 (0.0%) |
| 65 to 74 Years | 0 (0.0%) | 7 (100.0%) |
| 75 Years and over | 0 (0.0%) | 0 (0.0%) |
| Total | 38 (63.3%) | 7 (20.6%) |
Income Above Poverty by Sex and Age in Johannesburg
According to the poverty statistics in Johannesburg, males aged 25 to 34 years and females aged 45 to 54 years are the age groups that are most secure financially, with 68.8% of males and 100.0% of females in these age groups living above the poverty line.
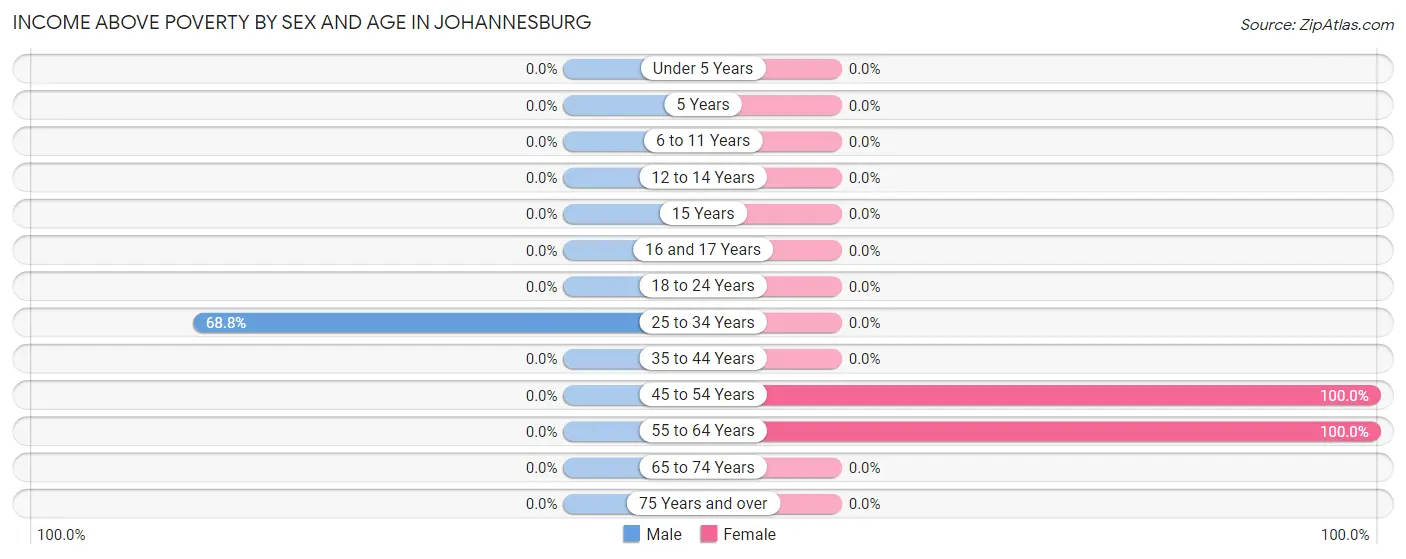
| Age Bracket | Male | Female |
| Under 5 Years | 0 (0.0%) | 0 (0.0%) |
| 5 Years | 0 (0.0%) | 0 (0.0%) |
| 6 to 11 Years | 0 (0.0%) | 0 (0.0%) |
| 12 to 14 Years | 0 (0.0%) | 0 (0.0%) |
| 15 Years | 0 (0.0%) | 0 (0.0%) |
| 16 and 17 Years | 0 (0.0%) | 0 (0.0%) |
| 18 to 24 Years | 0 (0.0%) | 0 (0.0%) |
| 25 to 34 Years | 22 (68.8%) | 0 (0.0%) |
| 35 to 44 Years | 0 (0.0%) | 0 (0.0%) |
| 45 to 54 Years | 0 (0.0%) | 12 (100.0%) |
| 55 to 64 Years | 0 (0.0%) | 15 (100.0%) |
| 65 to 74 Years | 0 (0.0%) | 0 (0.0%) |
| 75 Years and over | 0 (0.0%) | 0 (0.0%) |
| Total | 22 (36.7%) | 27 (79.4%) |
Income Below Poverty Among Married-Couple Families in Johannesburg
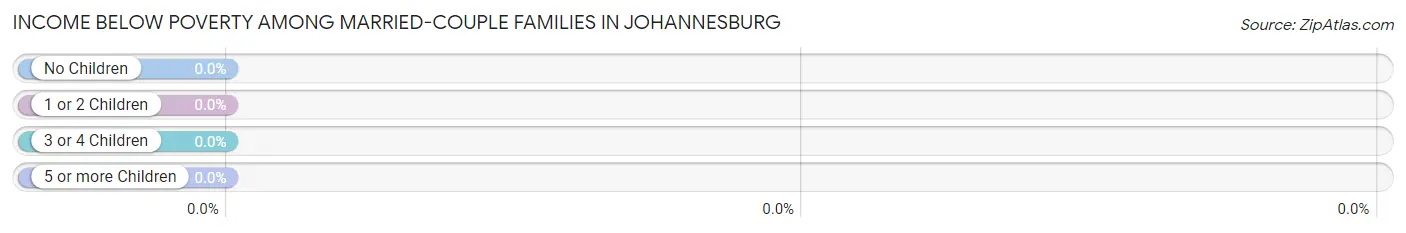
| Children | Above Poverty | Below Poverty |
| No Children | 12 (100.0%) | 0 (0.0%) |
| 1 or 2 Children | 0 (0.0%) | 0 (0.0%) |
| 3 or 4 Children | 0 (0.0%) | 0 (0.0%) |
| 5 or more Children | 0 (0.0%) | 0 (0.0%) |
| Total | 12 (100.0%) | 0 (0.0%) |
Income Below Poverty Among Single-Parent Households in Johannesburg
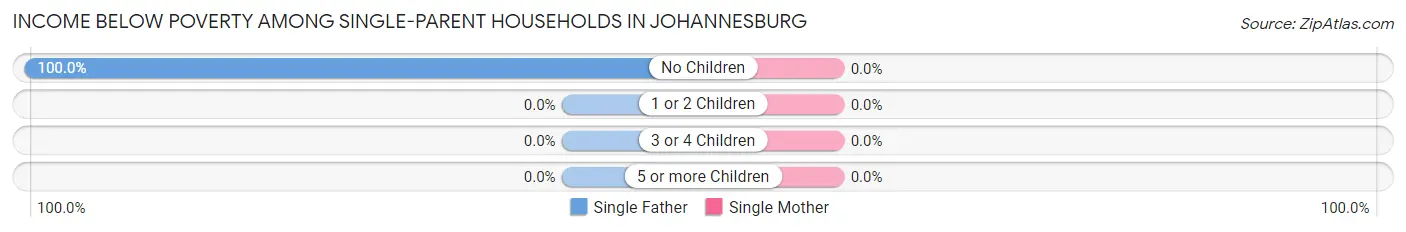
| Children | Single Father | Single Mother |
| No Children | 10 (100.0%) | 0 (0.0%) |
| 1 or 2 Children | 0 (0.0%) | 0 (0.0%) |
| 3 or 4 Children | 0 (0.0%) | 0 (0.0%) |
| 5 or more Children | 0 (0.0%) | 0 (0.0%) |
| Total | 10 (100.0%) | 0 (0.0%) |
Income Below Poverty Among Married-Couple vs Single-Parent Households in Johannesburg
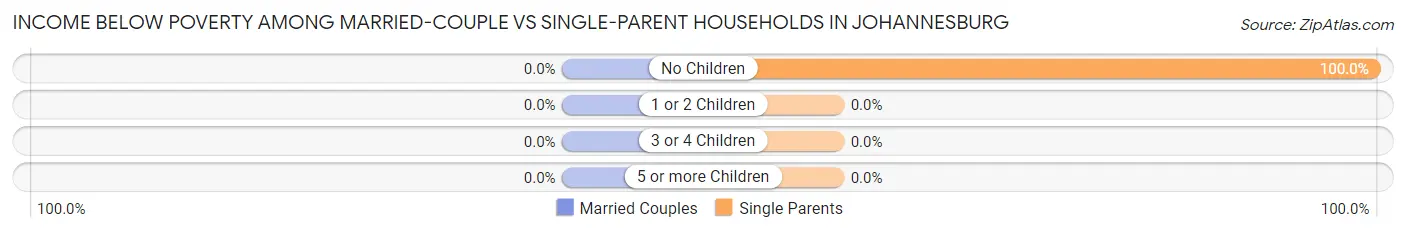
| Children | Married-Couple Families | Single-Parent Households |
| No Children | 0 (0.0%) | 10 (100.0%) |
| 1 or 2 Children | 0 (0.0%) | 0 (0.0%) |
| 3 or 4 Children | 0 (0.0%) | 0 (0.0%) |
| 5 or more Children | 0 (0.0%) | 0 (0.0%) |
| Total | 0 (0.0%) | 10 (100.0%) |
Race in Johannesburg
The most populous races in Johannesburg are Asian (66 | 70.2%), and White / Caucasian (28 | 29.8%).
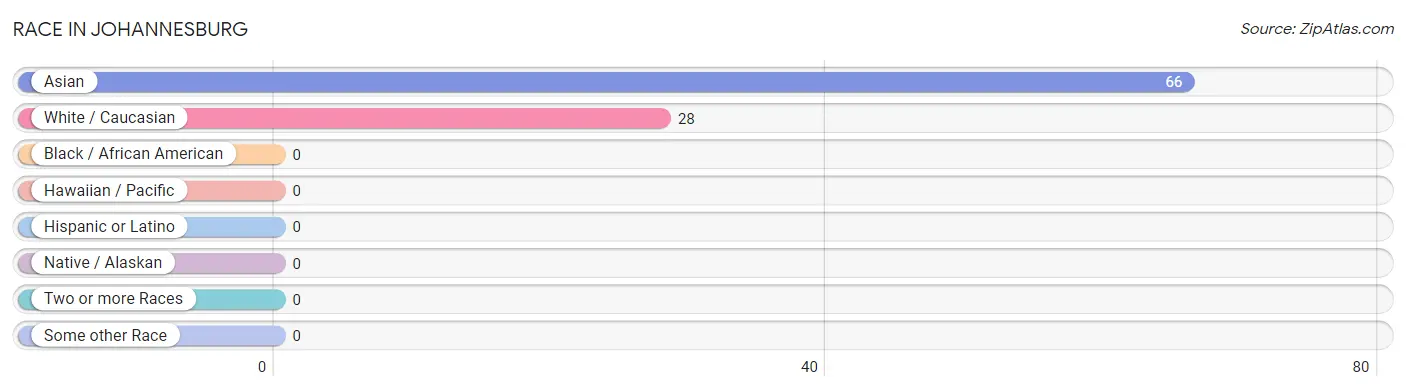
| Race | # Population | % Population |
| Asian | 66 | 70.2% |
| Black / African American | 0 | 0.0% |
| Hawaiian / Pacific | 0 | 0.0% |
| Hispanic or Latino | 0 | 0.0% |
| Native / Alaskan | 0 | 0.0% |
| White / Caucasian | 28 | 29.8% |
| Two or more Races | 0 | 0.0% |
| Some other Race | 0 | 0.0% |
| Total | 94 | 100.0% |
Ancestry in Johannesburg
The most populous ancestries reported in Johannesburg are Sri Lankan (49 | 52.1%), Indian (Asian) (17 | 18.1%), and Korean (17 | 18.1%), together accounting for 88.3% of all Johannesburg residents.
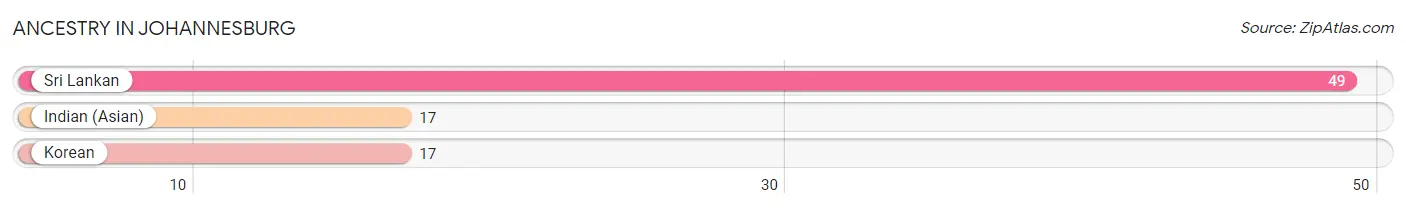
| Ancestry | # Population | % Population |
| Indian (Asian) | 17 | 18.1% |
| Korean | 17 | 18.1% |
| Sri Lankan | 49 | 52.1% | View All 3 Rows |
Immigrants in Johannesburg
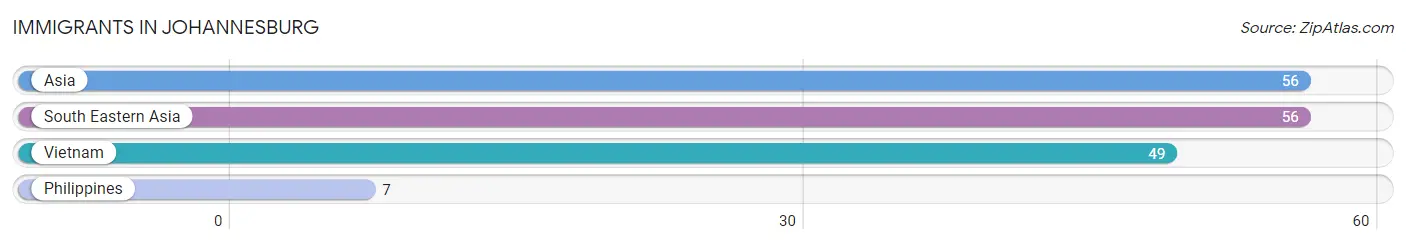
The most numerous immigrant groups reported in Johannesburg came from Asia (56 | 59.6%), South Eastern Asia (56 | 59.6%), Vietnam (49 | 52.1%), and Philippines (7 | 7.4%), together accounting for 178.7% of all Johannesburg residents.
| Immigration Origin | # Population | % Population |
| Asia | 56 | 59.6% |
| Philippines | 7 | 7.4% |
| South Eastern Asia | 56 | 59.6% |
| Vietnam | 49 | 52.1% | View All 4 Rows |
Sex and Age in Johannesburg
Sex and Age in Johannesburg
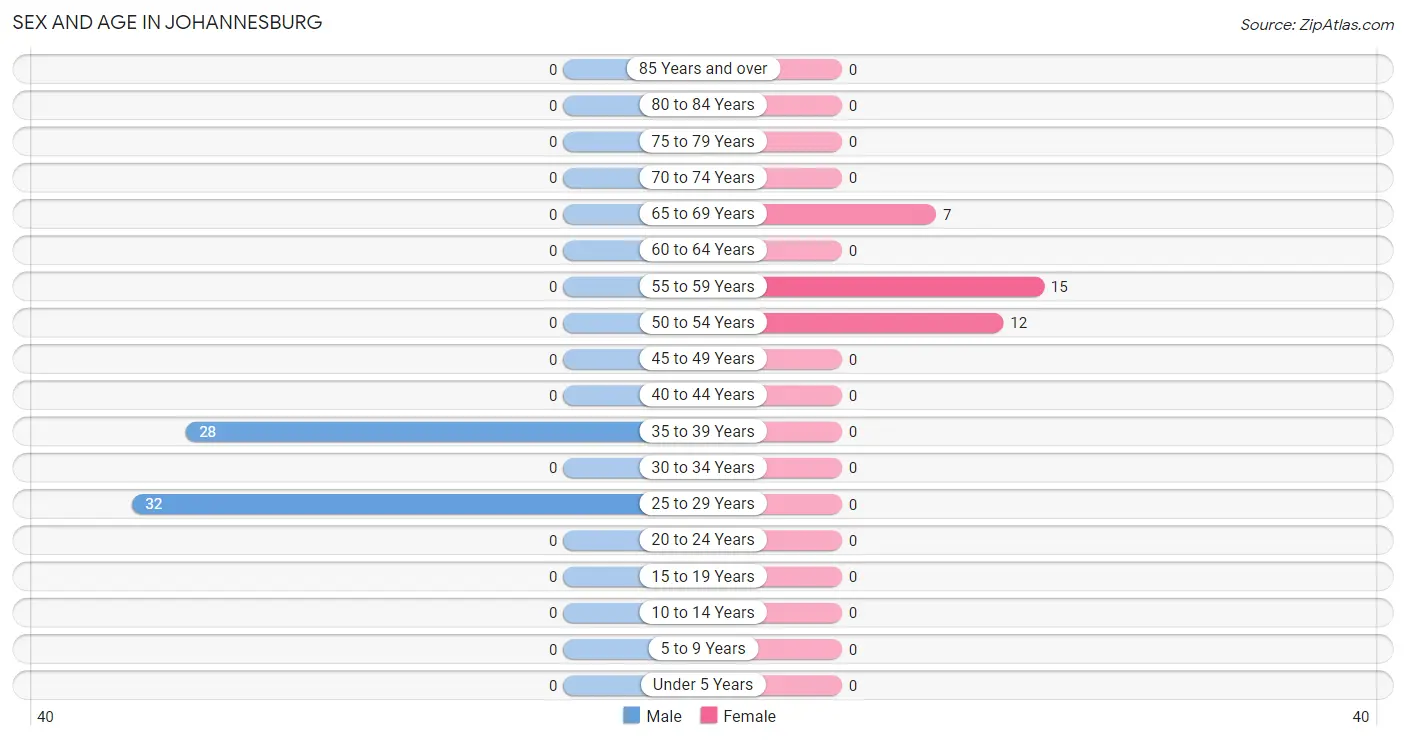
The most populous age groups in Johannesburg are 25 to 29 Years (32 | 53.3%) for men and 55 to 59 Years (15 | 44.1%) for women.
| Age Bracket | Male | Female |
| Under 5 Years | 0 (0.0%) | 0 (0.0%) |
| 5 to 9 Years | 0 (0.0%) | 0 (0.0%) |
| 10 to 14 Years | 0 (0.0%) | 0 (0.0%) |
| 15 to 19 Years | 0 (0.0%) | 0 (0.0%) |
| 20 to 24 Years | 0 (0.0%) | 0 (0.0%) |
| 25 to 29 Years | 32 (53.3%) | 0 (0.0%) |
| 30 to 34 Years | 0 (0.0%) | 0 (0.0%) |
| 35 to 39 Years | 28 (46.7%) | 0 (0.0%) |
| 40 to 44 Years | 0 (0.0%) | 0 (0.0%) |
| 45 to 49 Years | 0 (0.0%) | 0 (0.0%) |
| 50 to 54 Years | 0 (0.0%) | 12 (35.3%) |
| 55 to 59 Years | 0 (0.0%) | 15 (44.1%) |
| 60 to 64 Years | 0 (0.0%) | 0 (0.0%) |
| 65 to 69 Years | 0 (0.0%) | 7 (20.6%) |
| 70 to 74 Years | 0 (0.0%) | 0 (0.0%) |
| 75 to 79 Years | 0 (0.0%) | 0 (0.0%) |
| 80 to 84 Years | 0 (0.0%) | 0 (0.0%) |
| 85 Years and over | 0 (0.0%) | 0 (0.0%) |
| Total | 60 (100.0%) | 34 (100.0%) |
Families and Households in Johannesburg
Median Family Size in Johannesburg
| Family Type | # Families | Family Size |
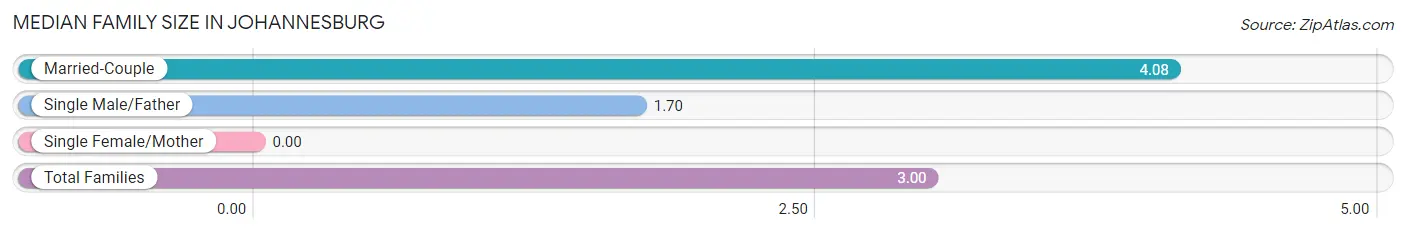
| Married-Couple | 12 (54.5%) | 4.08 |
| Single Male/Father | 10 (45.5%) | 1.70 |
| Single Female/Mother | 0 (0.0%) | - |
| Total Families | 22 (100.0%) | 3.00 |
Median Household Size in Johannesburg
| Household Type | # Households | Household Size |
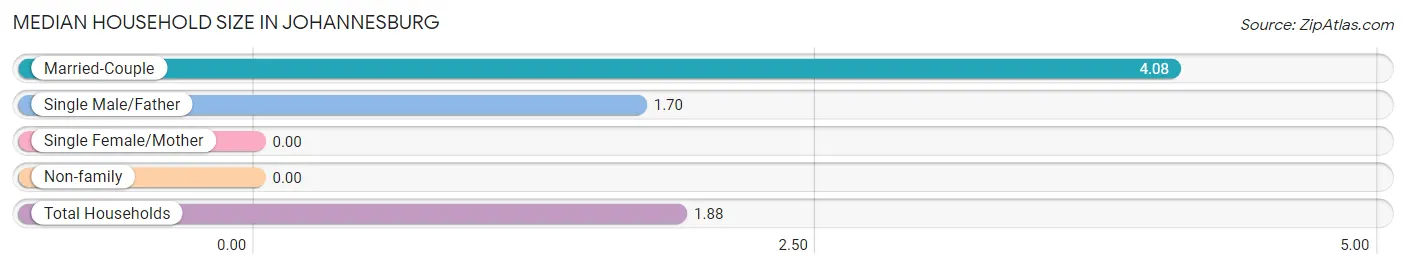
| Married-Couple | 12 (24.0%) | 4.08 |
| Single Male/Father | 10 (20.0%) | 1.70 |
| Single Female/Mother | 0 (0.0%) | - |
| Non-family | 28 (56.0%) | - |
| Total Households | 50 (100.0%) | 1.88 |
Household Size by Marriage Status in Johannesburg
Out of a total of 50 households in Johannesburg, 22 (44.0%) are family households, while 28 (56.0%) are nonfamily households. The most numerous type of family households are 3-person households, comprising 12, and the most common type of nonfamily households are 1-person households, comprising 28.
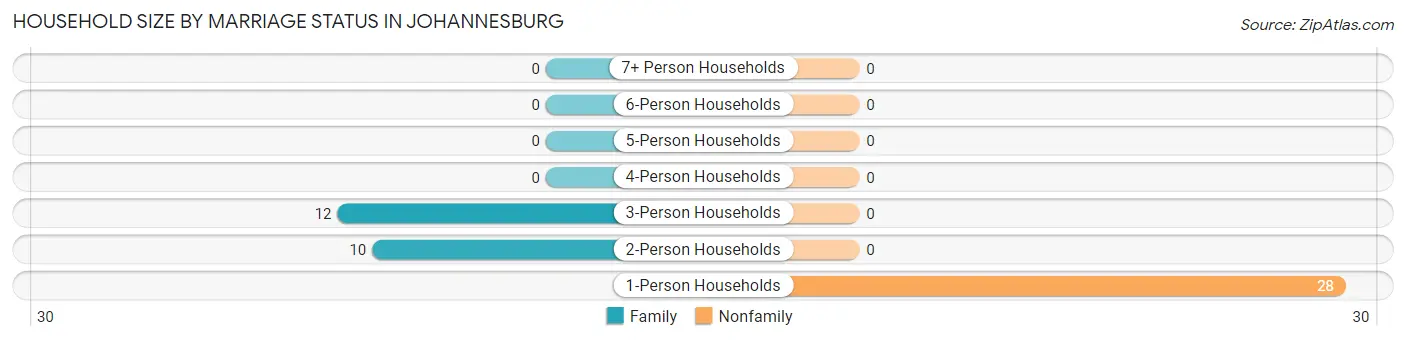
| Household Size | Family Households | Nonfamily Households |
| 1-Person Households | - | 28 (56.0%) |
| 2-Person Households | 10 (20.0%) | 0 (0.0%) |
| 3-Person Households | 12 (24.0%) | 0 (0.0%) |
| 4-Person Households | 0 (0.0%) | 0 (0.0%) |
| 5-Person Households | 0 (0.0%) | 0 (0.0%) |
| 6-Person Households | 0 (0.0%) | 0 (0.0%) |
| 7+ Person Households | 0 (0.0%) | 0 (0.0%) |
| Total | 22 (44.0%) | 28 (56.0%) |
Female Fertility in Johannesburg
Fertility by Age in Johannesburg
| Age Bracket | Women with Births | Births / 1,000 Women |
| 15 to 19 years | 0 (0.0%) | 0.0 |
| 20 to 34 years | 0 (0.0%) | 0.0 |
| 35 to 50 years | 0 (0.0%) | 0.0 |
| Total | 0 (0.0%) | 0.0 |
Fertility by Age by Marriage Status in Johannesburg
| Age Bracket | Married | Unmarried |
| 15 to 19 years | 0 (0.0%) | 0 (0.0%) |
| 20 to 34 years | 0 (0.0%) | 0 (0.0%) |
| 35 to 50 years | 0 (0.0%) | 0 (0.0%) |
| Total | 0 (0.0%) | 0 (0.0%) |
Fertility by Education in Johannesburg
| Educational Attainment | Women with Births | Births / 1,000 Women |
| Less than High School | 0 (0.0%) | 0.0 |
| High School Diploma | 0 (0.0%) | 0.0 |
| College or Associate's Degree | 0 (0.0%) | 0.0 |
| Bachelor's Degree | 0 (0.0%) | 0.0 |
| Graduate Degree | 0 (0.0%) | 0.0 |
| Total | 0 (0.0%) | 0.0 |
Fertility by Education by Marriage Status in Johannesburg
| Educational Attainment | Married | Unmarried |
| Less than High School | 0 (0.0%) | 0 (0.0%) |
| High School Diploma | 0 (0.0%) | 0 (0.0%) |
| College or Associate's Degree | 0 (0.0%) | 0 (0.0%) |
| Bachelor's Degree | 0 (0.0%) | 0 (0.0%) |
| Graduate Degree | 0 (0.0%) | 0 (0.0%) |
| Total | 0 (0.0%) | 0 (0.0%) |
Employment Characteristics in Johannesburg
Employment by Class of Employer in Johannesburg
Among the 34 employed individuals in Johannesburg, private company employees (27 | 79.4%), and local government employees (7 | 20.6%) make up the most common classes of employment.
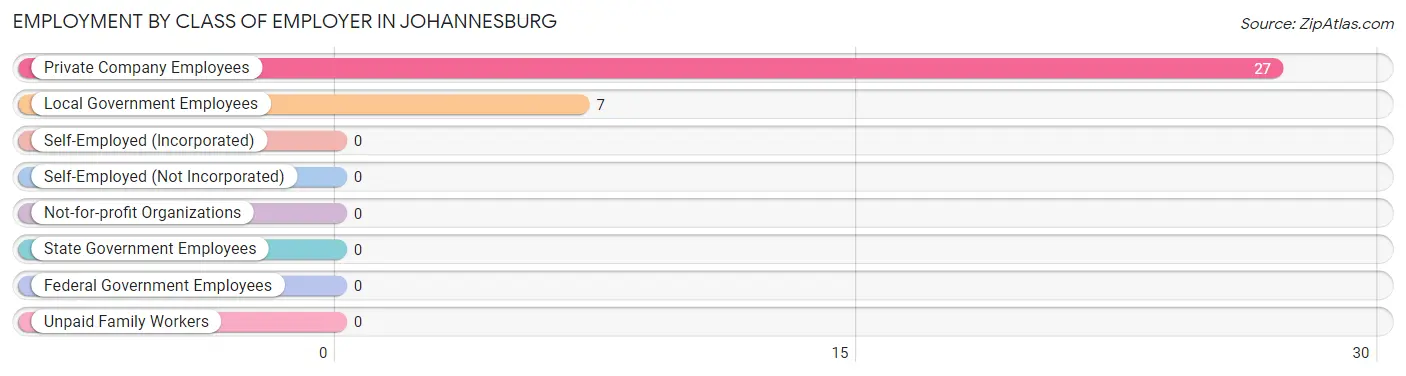
| Employer Class | # Employees | % Employees |
| Private Company Employees | 27 | 79.4% |
| Self-Employed (Incorporated) | 0 | 0.0% |
| Self-Employed (Not Incorporated) | 0 | 0.0% |
| Not-for-profit Organizations | 0 | 0.0% |
| Local Government Employees | 7 | 20.6% |
| State Government Employees | 0 | 0.0% |
| Federal Government Employees | 0 | 0.0% |
| Unpaid Family Workers | 0 | 0.0% |
| Total | 34 | 100.0% |
Employment Status by Age in Johannesburg
According to the labor force statistics for Johannesburg, out of the total population over 16 years of age (94), 46.8% or 44 individuals are in the labor force, with 22.7% or 10 of them unemployed. The age group with the highest labor force participation rate is 45 to 54 years, with 100.0% or 12 individuals in the labor force. Within the labor force, the 25 to 29 years age range has the highest percentage of unemployed individuals, with 100.0% or 10 of them being unemployed.
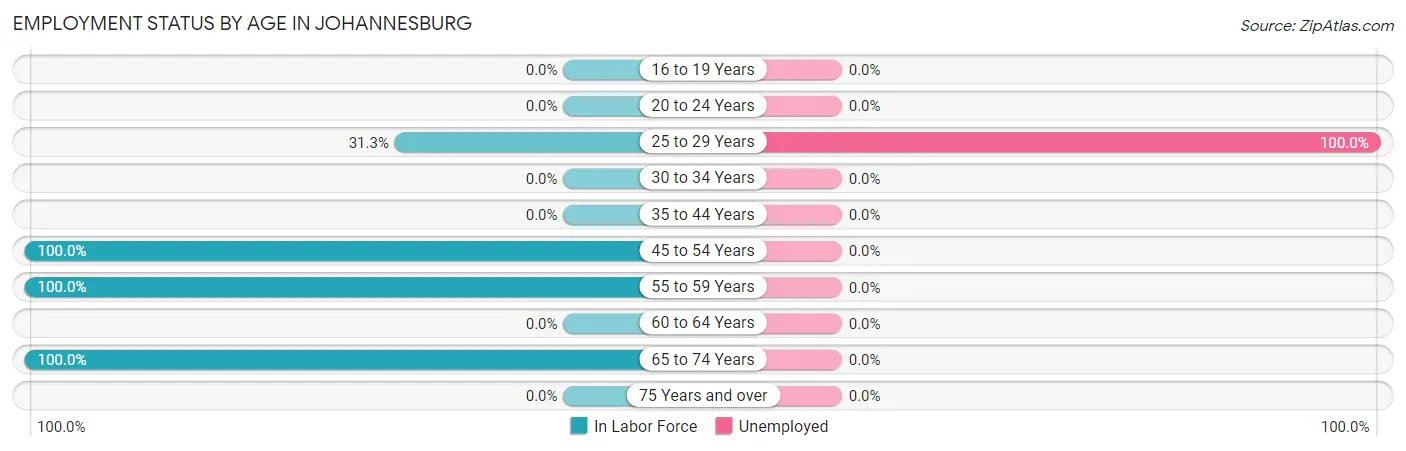
| Age Bracket | In Labor Force | Unemployed |
| 16 to 19 Years | 0 (0.0%) | 0 (0.0%) |
| 20 to 24 Years | 0 (0.0%) | 0 (0.0%) |
| 25 to 29 Years | 10 (31.3%) | 10 (100.0%) |
| 30 to 34 Years | 0 (0.0%) | 0 (0.0%) |
| 35 to 44 Years | 0 (0.0%) | 0 (0.0%) |
| 45 to 54 Years | 12 (100.0%) | 0 (0.0%) |
| 55 to 59 Years | 15 (100.0%) | 0 (0.0%) |
| 60 to 64 Years | 0 (0.0%) | 0 (0.0%) |
| 65 to 74 Years | 7 (100.0%) | 0 (0.0%) |
| 75 Years and over | 0 (0.0%) | 0 (0.0%) |
| Total | 44 (46.8%) | 10 (22.7%) |
Employment Status by Educational Attainment in Johannesburg
According to labor force statistics for Johannesburg, 42.5% of individuals (37) out of the total population between 25 and 64 years of age (87) are in the labor force, with 27.0% or 10 of them being unemployed. The group with the highest labor force participation rate are those with the educational attainment of less than high school, with 100.0% or 27 individuals in the labor force. Within the labor force, individuals with bachelor's degree or higher education have the highest percentage of unemployment, with 100.0% or 10 of them being unemployed.
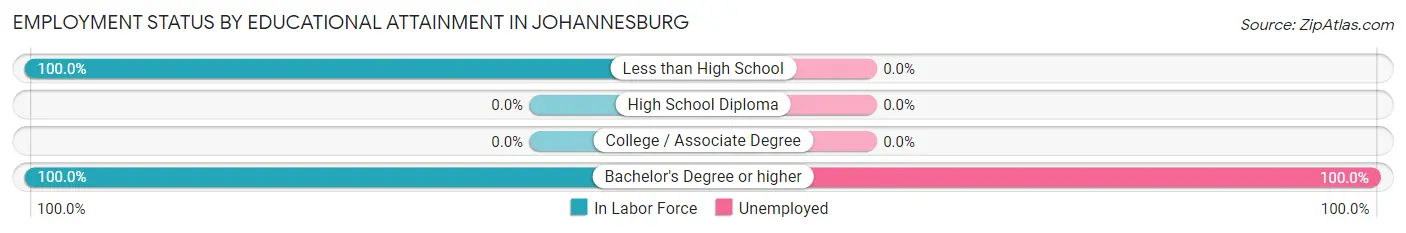
| Educational Attainment | In Labor Force | Unemployed |
| Less than High School | 27 (100.0%) | 0 (0.0%) |
| High School Diploma | 0 (0.0%) | 0 (0.0%) |
| College / Associate Degree | 0 (0.0%) | 0 (0.0%) |
| Bachelor's Degree or higher | 10 (100.0%) | 10 (100.0%) |
| Total | 37 (42.5%) | 23 (27.0%) |
Employment Occupations by Sex in Johannesburg
Management, Business, Science and Arts Occupations
The most common Management, Business, Science and Arts occupations in Johannesburg are Community & Social Service (7 | 20.6%), and Education Instruction & Library (7 | 20.6%).
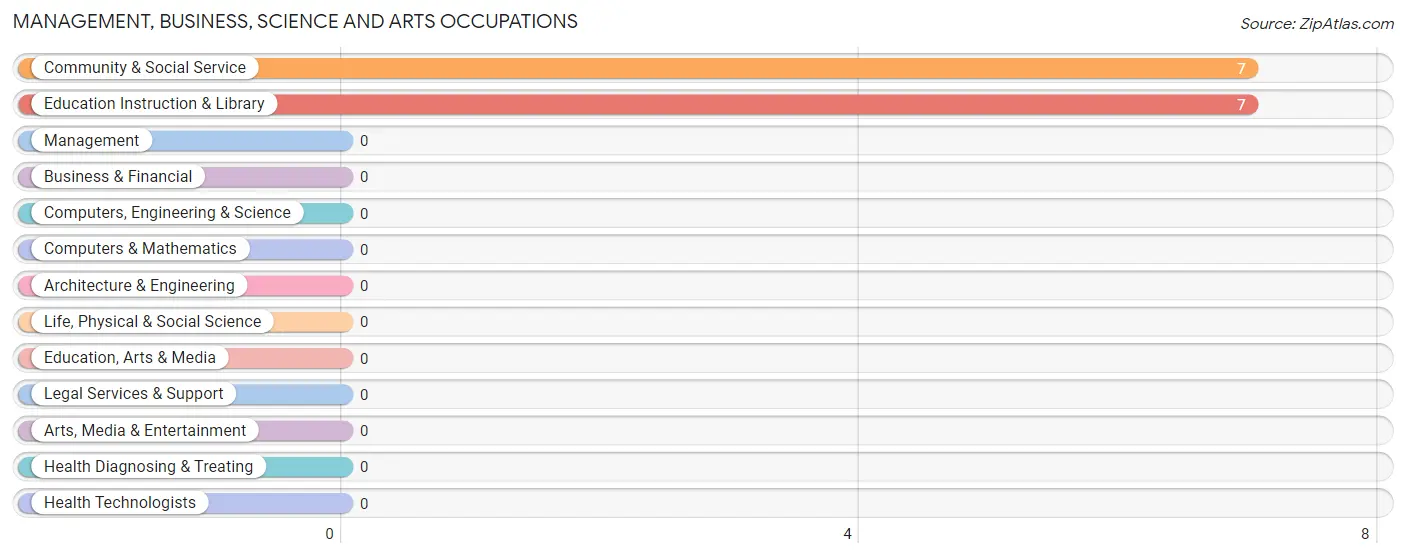
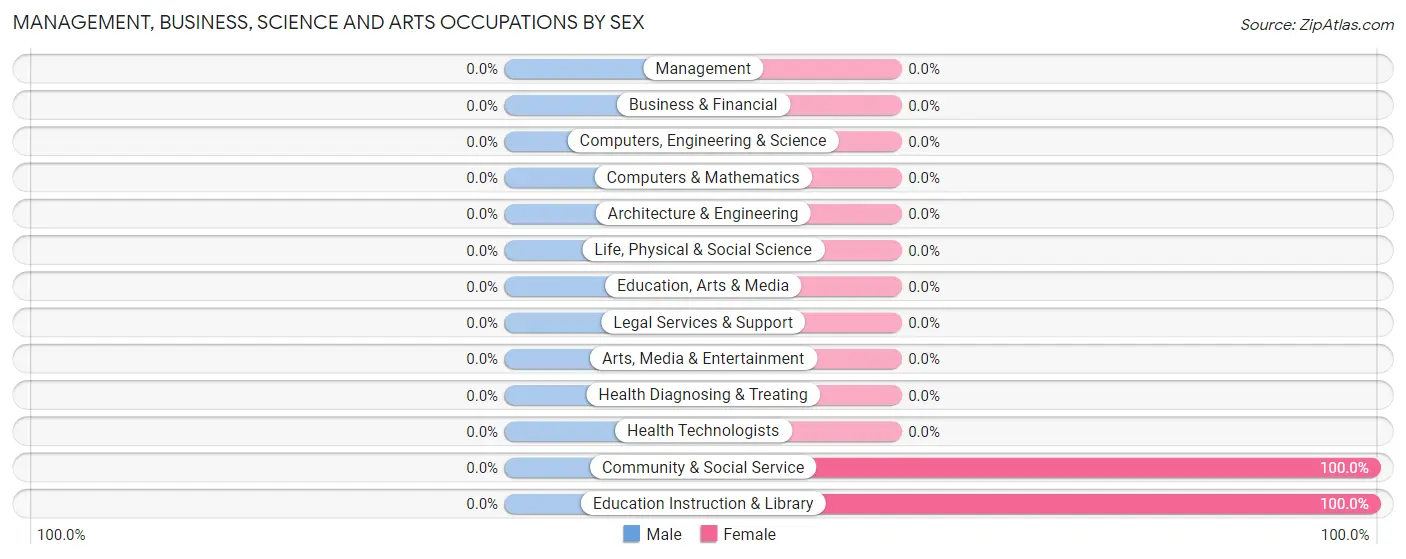
Management, Business, Science and Arts Occupations by Sex
| Occupation | Male | Female |
| Management | 0 (0.0%) | 0 (0.0%) |
| Business & Financial | 0 (0.0%) | 0 (0.0%) |
| Computers, Engineering & Science | 0 (0.0%) | 0 (0.0%) |
| Computers & Mathematics | 0 (0.0%) | 0 (0.0%) |
| Architecture & Engineering | 0 (0.0%) | 0 (0.0%) |
| Life, Physical & Social Science | 0 (0.0%) | 0 (0.0%) |
| Community & Social Service | 0 (0.0%) | 7 (100.0%) |
| Education, Arts & Media | 0 (0.0%) | 0 (0.0%) |
| Legal Services & Support | 0 (0.0%) | 0 (0.0%) |
| Education Instruction & Library | 0 (0.0%) | 7 (100.0%) |
| Arts, Media & Entertainment | 0 (0.0%) | 0 (0.0%) |
| Health Diagnosing & Treating | 0 (0.0%) | 0 (0.0%) |
| Health Technologists | 0 (0.0%) | 0 (0.0%) |
| Total (Category) | 0 (0.0%) | 7 (100.0%) |
| Total (Overall) | 0 (0.0%) | 34 (100.0%) |
Services Occupations
The most common Services occupations in Johannesburg are , and Personal Care & Service (27 | 79.4%).
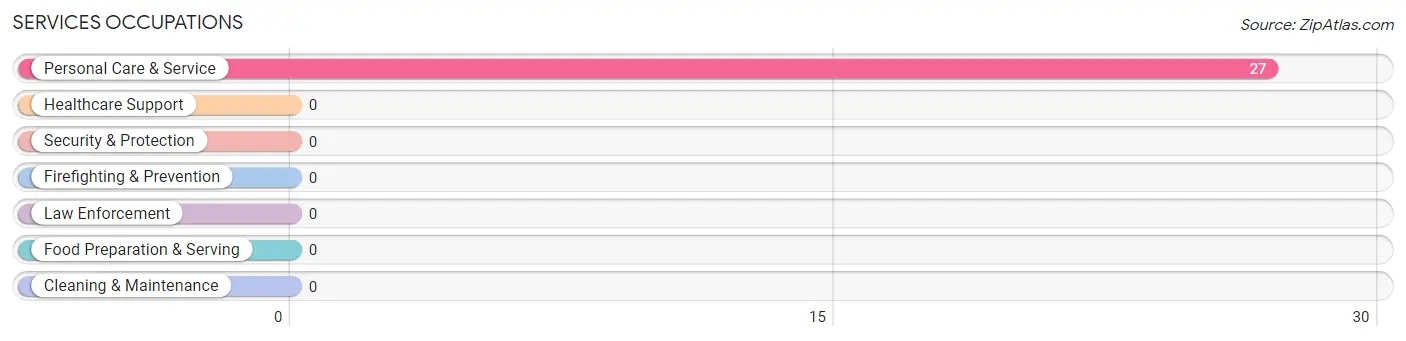
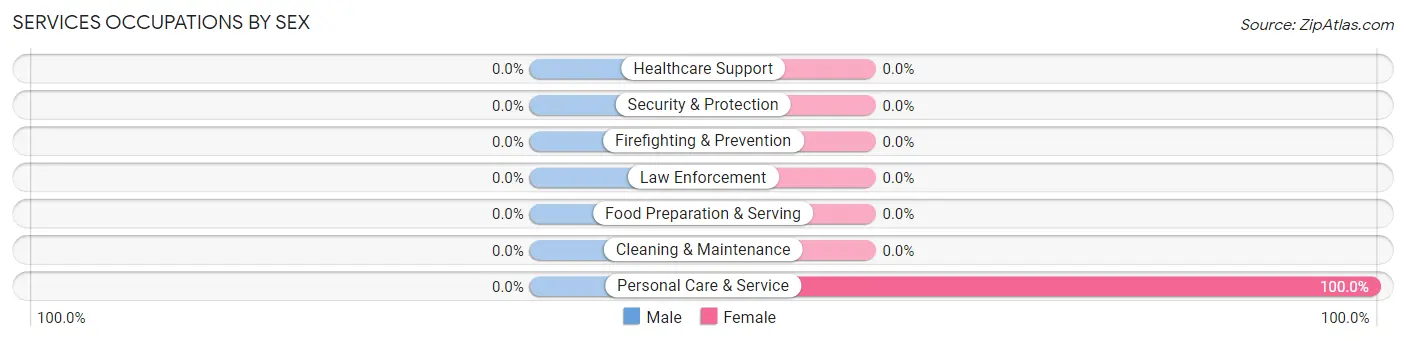
Services Occupations by Sex
| Occupation | Male | Female |
| Healthcare Support | 0 (0.0%) | 0 (0.0%) |
| Security & Protection | 0 (0.0%) | 0 (0.0%) |
| Firefighting & Prevention | 0 (0.0%) | 0 (0.0%) |
| Law Enforcement | 0 (0.0%) | 0 (0.0%) |
| Food Preparation & Serving | 0 (0.0%) | 0 (0.0%) |
| Cleaning & Maintenance | 0 (0.0%) | 0 (0.0%) |
| Personal Care & Service | 0 (0.0%) | 27 (100.0%) |
| Total (Category) | 0 (0.0%) | 27 (100.0%) |
| Total (Overall) | 0 (0.0%) | 34 (100.0%) |
Sales and Office Occupations
Sales and Office Occupations by Sex
| Occupation | Male | Female |
| Sales & Related | 0 (0.0%) | 0 (0.0%) |
| Office & Administration | 0 (0.0%) | 0 (0.0%) |
| Total (Category) | 0 (0.0%) | 0 (0.0%) |
| Total (Overall) | 0 (0.0%) | 34 (100.0%) |
Natural Resources, Construction and Maintenance Occupations
Natural Resources, Construction and Maintenance Occupations by Sex
| Occupation | Male | Female |
| Farming, Fishing & Forestry | 0 (0.0%) | 0 (0.0%) |
| Construction & Extraction | 0 (0.0%) | 0 (0.0%) |
| Installation, Maintenance & Repair | 0 (0.0%) | 0 (0.0%) |
| Total (Category) | 0 (0.0%) | 0 (0.0%) |
| Total (Overall) | 0 (0.0%) | 34 (100.0%) |
Production, Transportation and Moving Occupations
Production, Transportation and Moving Occupations by Sex
| Occupation | Male | Female |
| Production | 0 (0.0%) | 0 (0.0%) |
| Transportation | 0 (0.0%) | 0 (0.0%) |
| Material Moving | 0 (0.0%) | 0 (0.0%) |
| Total (Category) | 0 (0.0%) | 0 (0.0%) |
| Total (Overall) | 0 (0.0%) | 34 (100.0%) |
Employment Industries by Sex in Johannesburg
Employment Industries in Johannesburg
The major employment industries in Johannesburg include , and Educational Services (7 | 20.6%).
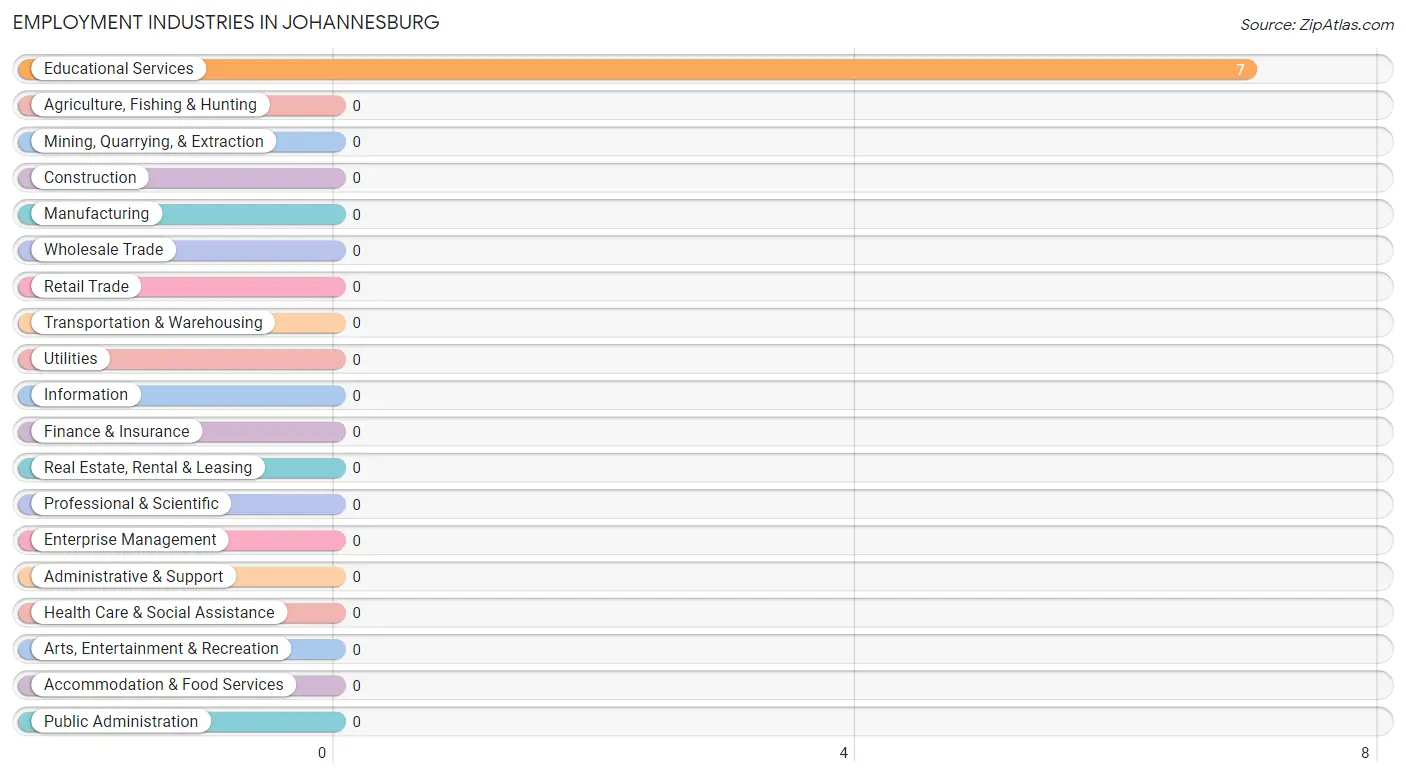
Employment Industries by Sex in Johannesburg
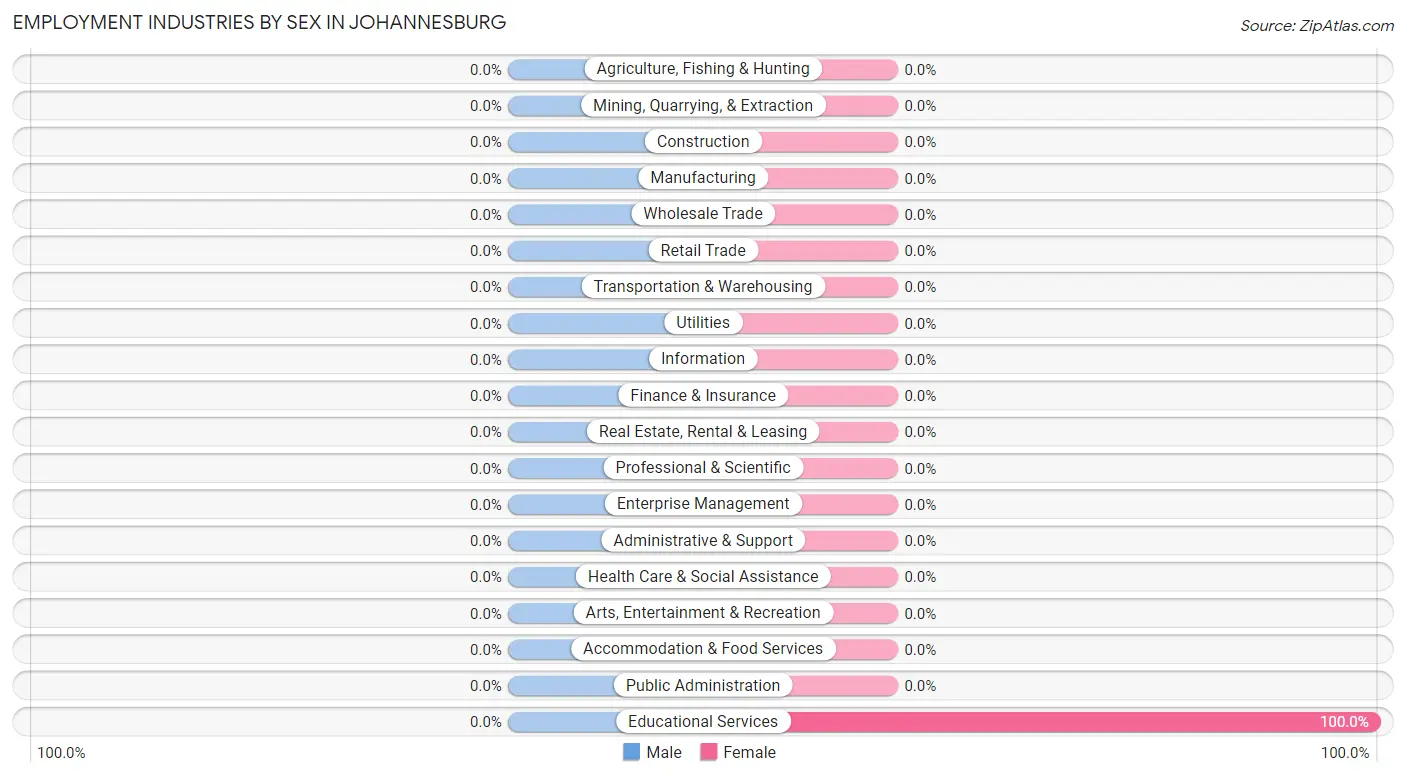
| Industry | Male | Female |
| Agriculture, Fishing & Hunting | 0 (0.0%) | 0 (0.0%) |
| Mining, Quarrying, & Extraction | 0 (0.0%) | 0 (0.0%) |
| Construction | 0 (0.0%) | 0 (0.0%) |
| Manufacturing | 0 (0.0%) | 0 (0.0%) |
| Wholesale Trade | 0 (0.0%) | 0 (0.0%) |
| Retail Trade | 0 (0.0%) | 0 (0.0%) |
| Transportation & Warehousing | 0 (0.0%) | 0 (0.0%) |
| Utilities | 0 (0.0%) | 0 (0.0%) |
| Information | 0 (0.0%) | 0 (0.0%) |
| Finance & Insurance | 0 (0.0%) | 0 (0.0%) |
| Real Estate, Rental & Leasing | 0 (0.0%) | 0 (0.0%) |
| Professional & Scientific | 0 (0.0%) | 0 (0.0%) |
| Enterprise Management | 0 (0.0%) | 0 (0.0%) |
| Administrative & Support | 0 (0.0%) | 0 (0.0%) |
| Educational Services | 0 (0.0%) | 7 (100.0%) |
| Health Care & Social Assistance | 0 (0.0%) | 0 (0.0%) |
| Arts, Entertainment & Recreation | 0 (0.0%) | 0 (0.0%) |
| Accommodation & Food Services | 0 (0.0%) | 0 (0.0%) |
| Public Administration | 0 (0.0%) | 0 (0.0%) |
| Total | 0 (0.0%) | 34 (100.0%) |
Education in Johannesburg
School Enrollment in Johannesburg
| School Level | # Students | % Students |
| Nursery / Preschool | 0 | 0.0% |
| Kindergarten | 0 | 0.0% |
| Elementary School | 0 | 0.0% |
| Middle School | 0 | 0.0% |
| High School | 0 | 0.0% |
| College / Undergraduate | 0 | 0.0% |
| Graduate / Professional | 0 | 0.0% |
| Total | 0 | 0.0% |
School Enrollment by Age by Funding Source in Johannesburg
| Age Bracket | Public School | Private School |
| 3 to 4 Year Olds | 0 (0.0%) | 0 (0.0%) |
| 5 to 9 Year Old | 0 (0.0%) | 0 (0.0%) |
| 10 to 14 Year Olds | 0 (0.0%) | 0 (0.0%) |
| 15 to 17 Year Olds | 0 (0.0%) | 0 (0.0%) |
| 18 to 19 Year Olds | 0 (0.0%) | 0 (0.0%) |
| 20 to 24 Year Olds | 0 (0.0%) | 0 (0.0%) |
| 25 to 34 Year Olds | 0 (0.0%) | 0 (0.0%) |
| 35 Years and over | 0 (0.0%) | 0 (0.0%) |
| Total | 0 (0.0%) | 0 (0.0%) |
Educational Attainment by Field of Study in Johannesburg
Computers & mathematics (10 | 58.8%), and liberal arts & history (7 | 41.2%) are the most common fields of study among 17 individuals in Johannesburg who have obtained a bachelor's degree or higher.
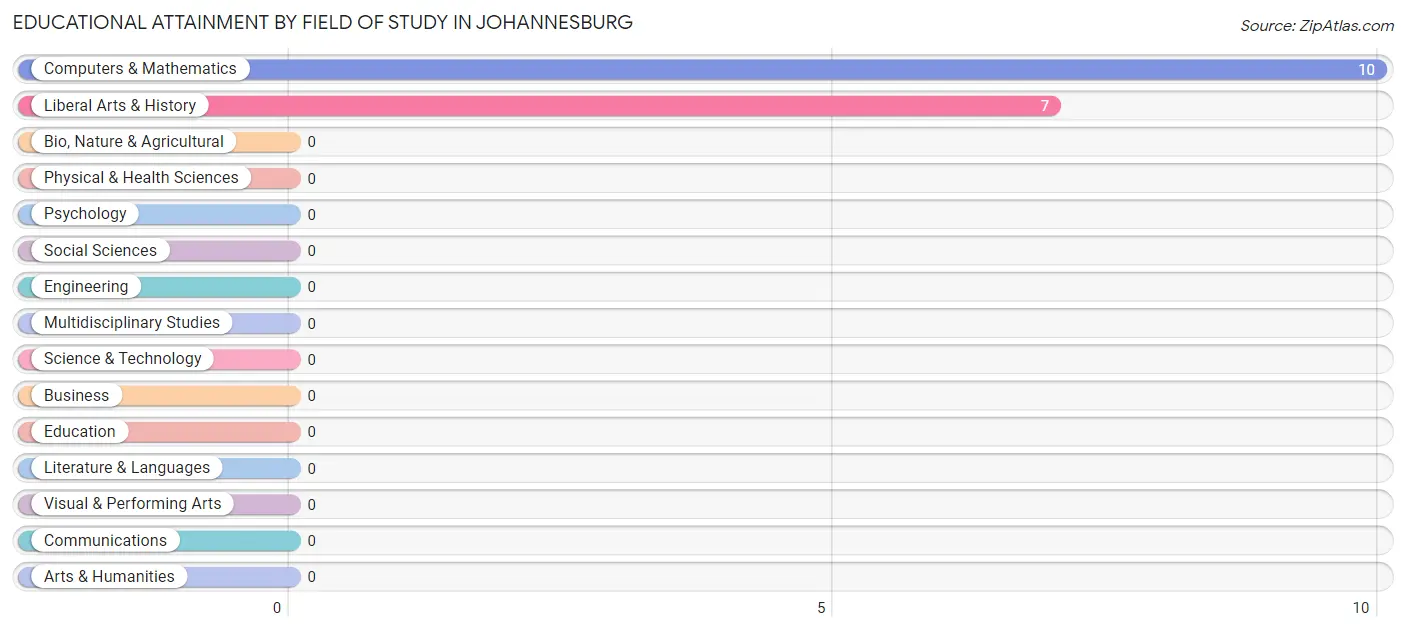
| Field of Study | # Graduates | % Graduates |
| Computers & Mathematics | 10 | 58.8% |
| Bio, Nature & Agricultural | 0 | 0.0% |
| Physical & Health Sciences | 0 | 0.0% |
| Psychology | 0 | 0.0% |
| Social Sciences | 0 | 0.0% |
| Engineering | 0 | 0.0% |
| Multidisciplinary Studies | 0 | 0.0% |
| Science & Technology | 0 | 0.0% |
| Business | 0 | 0.0% |
| Education | 0 | 0.0% |
| Literature & Languages | 0 | 0.0% |
| Liberal Arts & History | 7 | 41.2% |
| Visual & Performing Arts | 0 | 0.0% |
| Communications | 0 | 0.0% |
| Arts & Humanities | 0 | 0.0% |
| Total | 17 | 100.0% |
Transportation & Commute in Johannesburg
Vehicle Availability by Sex in Johannesburg
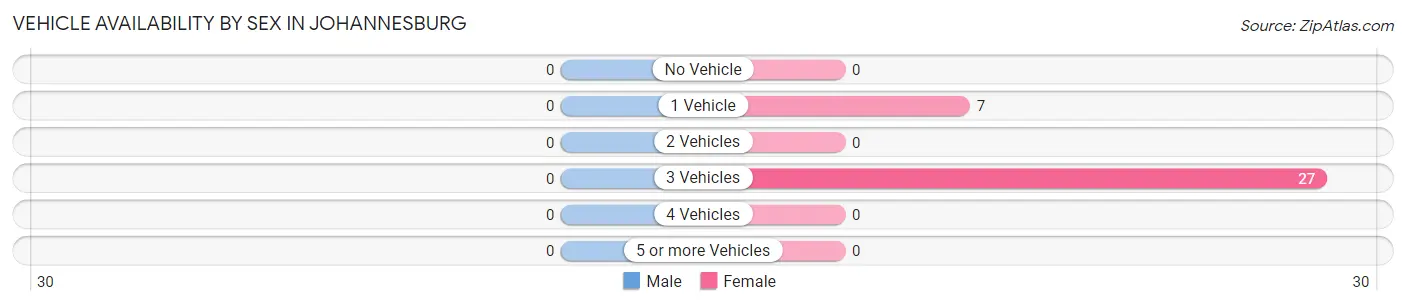
| Vehicles Available | Male | Female |
| No Vehicle | 0 (0.0%) | 0 (0.0%) |
| 1 Vehicle | 0 (0.0%) | 7 (20.6%) |
| 2 Vehicles | 0 (0.0%) | 0 (0.0%) |
| 3 Vehicles | 0 (0.0%) | 27 (79.4%) |
| 4 Vehicles | 0 (0.0%) | 0 (0.0%) |
| 5 or more Vehicles | 0 (0.0%) | 0 (0.0%) |
| Total | 0 (0.0%) | 34 (100.0%) |
Commute Time in Johannesburg
The most frequently occuring commute durations in Johannesburg are 15 to 19 minutes (15 commuters, 68.2%), 20 to 24 minutes (7 commuters, 31.8%), and less than 5 minutes (0 commuters, 0.0%).
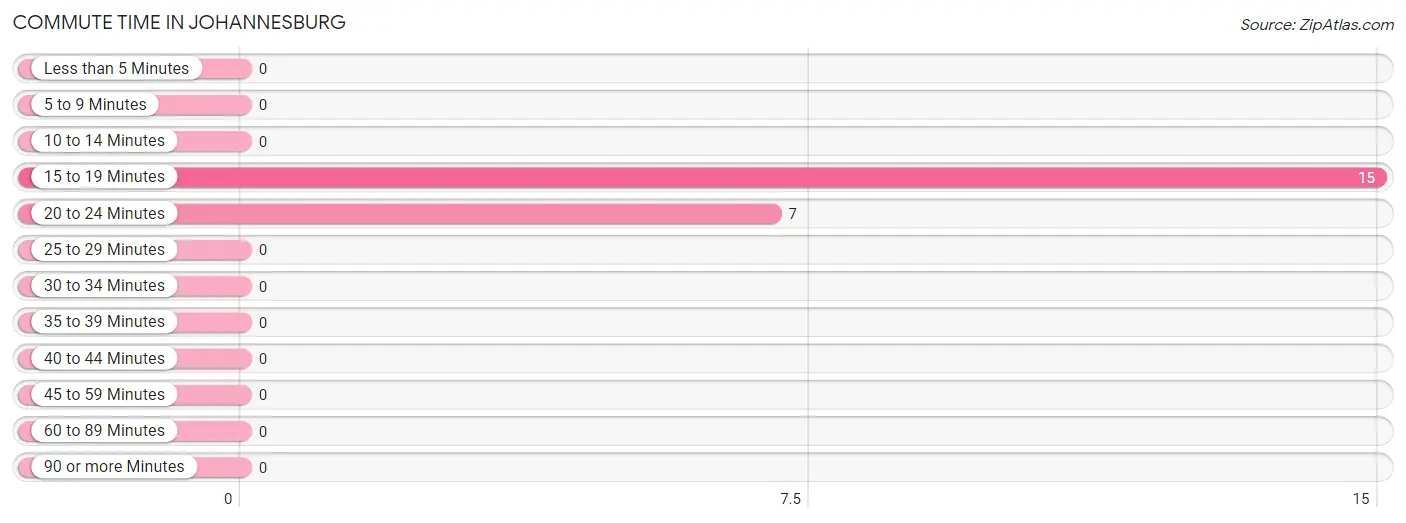
| Commute Time | # Commuters | % Commuters |
| Less than 5 Minutes | 0 | 0.0% |
| 5 to 9 Minutes | 0 | 0.0% |
| 10 to 14 Minutes | 0 | 0.0% |
| 15 to 19 Minutes | 15 | 68.2% |
| 20 to 24 Minutes | 7 | 31.8% |
| 25 to 29 Minutes | 0 | 0.0% |
| 30 to 34 Minutes | 0 | 0.0% |
| 35 to 39 Minutes | 0 | 0.0% |
| 40 to 44 Minutes | 0 | 0.0% |
| 45 to 59 Minutes | 0 | 0.0% |
| 60 to 89 Minutes | 0 | 0.0% |
| 90 or more Minutes | 0 | 0.0% |
Commute Time by Sex in Johannesburg
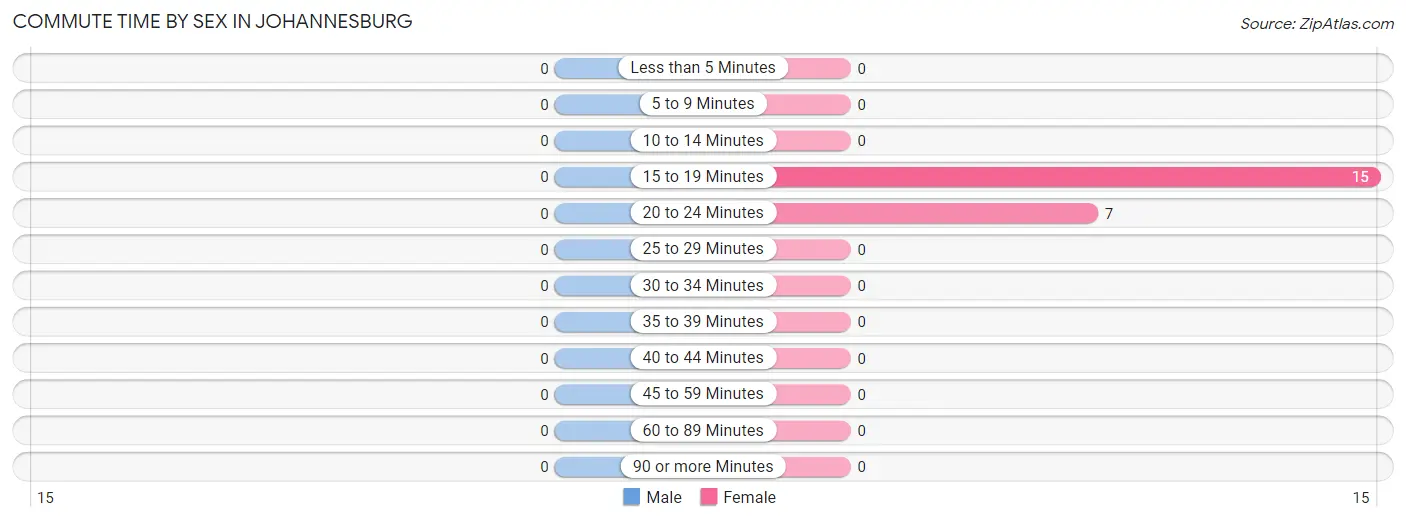
| Commute Time | Male | Female |
| Less than 5 Minutes | 0 (0.0%) | 0 (0.0%) |
| 5 to 9 Minutes | 0 (0.0%) | 0 (0.0%) |
| 10 to 14 Minutes | 0 (0.0%) | 0 (0.0%) |
| 15 to 19 Minutes | 0 (0.0%) | 15 (68.2%) |
| 20 to 24 Minutes | 0 (0.0%) | 7 (31.8%) |
| 25 to 29 Minutes | 0 (0.0%) | 0 (0.0%) |
| 30 to 34 Minutes | 0 (0.0%) | 0 (0.0%) |
| 35 to 39 Minutes | 0 (0.0%) | 0 (0.0%) |
| 40 to 44 Minutes | 0 (0.0%) | 0 (0.0%) |
| 45 to 59 Minutes | 0 (0.0%) | 0 (0.0%) |
| 60 to 89 Minutes | 0 (0.0%) | 0 (0.0%) |
| 90 or more Minutes | 0 (0.0%) | 0 (0.0%) |
Time of Departure to Work by Sex in Johannesburg
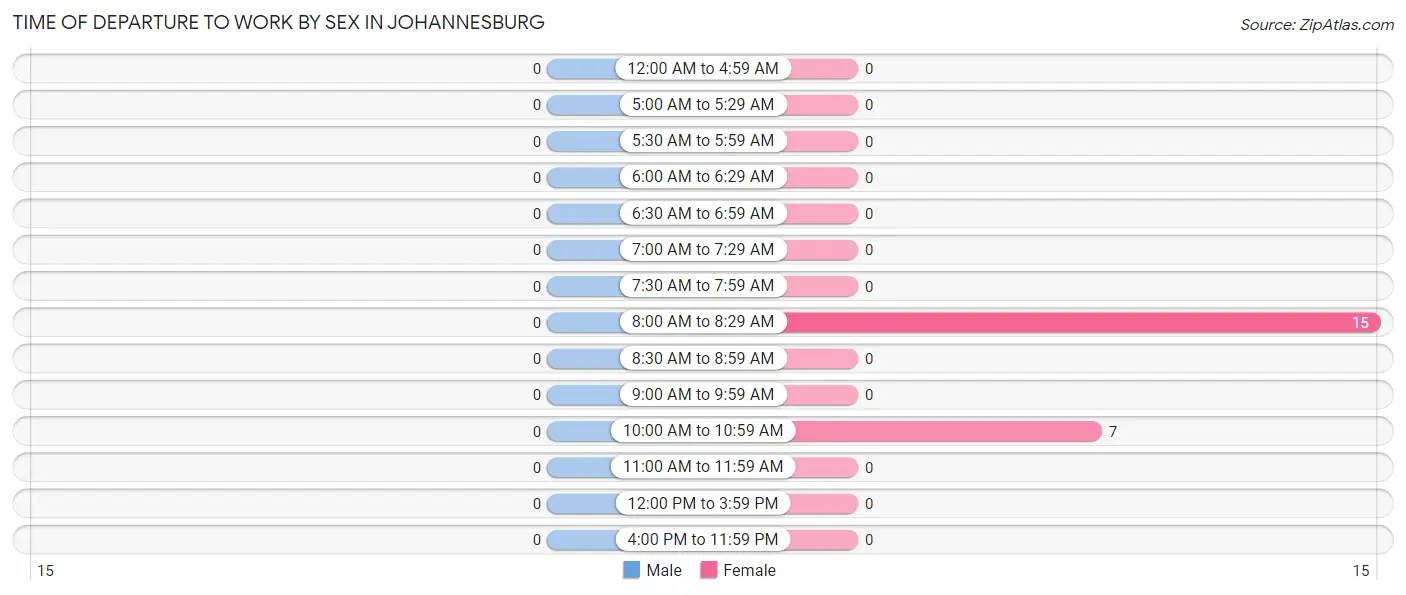
| Time of Departure | Male | Female |
| 12:00 AM to 4:59 AM | 0 (0.0%) | 0 (0.0%) |
| 5:00 AM to 5:29 AM | 0 (0.0%) | 0 (0.0%) |
| 5:30 AM to 5:59 AM | 0 (0.0%) | 0 (0.0%) |
| 6:00 AM to 6:29 AM | 0 (0.0%) | 0 (0.0%) |
| 6:30 AM to 6:59 AM | 0 (0.0%) | 0 (0.0%) |
| 7:00 AM to 7:29 AM | 0 (0.0%) | 0 (0.0%) |
| 7:30 AM to 7:59 AM | 0 (0.0%) | 0 (0.0%) |
| 8:00 AM to 8:29 AM | 0 (0.0%) | 15 (68.2%) |
| 8:30 AM to 8:59 AM | 0 (0.0%) | 0 (0.0%) |
| 9:00 AM to 9:59 AM | 0 (0.0%) | 0 (0.0%) |
| 10:00 AM to 10:59 AM | 0 (0.0%) | 7 (31.8%) |
| 11:00 AM to 11:59 AM | 0 (0.0%) | 0 (0.0%) |
| 12:00 PM to 3:59 PM | 0 (0.0%) | 0 (0.0%) |
| 4:00 PM to 11:59 PM | 0 (0.0%) | 0 (0.0%) |
| Total | 0 (0.0%) | 22 (100.0%) |
Housing Occupancy in Johannesburg
Occupancy by Ownership in Johannesburg
Of the total 50 dwellings in Johannesburg, owner-occupied units account for 22 (44.0%), while renter-occupied units make up 28 (56.0%).
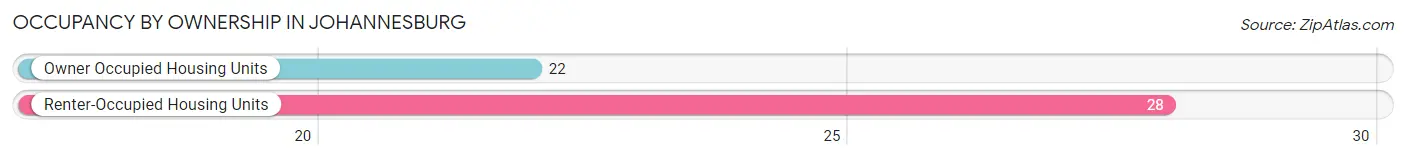
| Occupancy | # Housing Units | % Housing Units |
| Owner Occupied Housing Units | 22 | 44.0% |
| Renter-Occupied Housing Units | 28 | 56.0% |
| Total Occupied Housing Units | 50 | 100.0% |
Occupancy by Household Size in Johannesburg
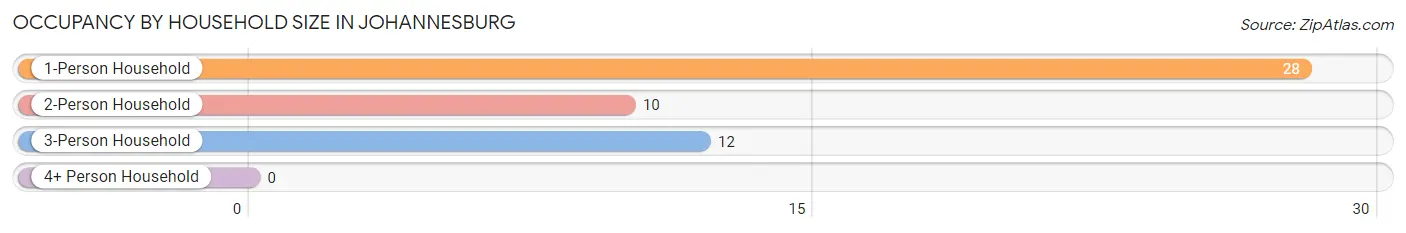
| Household Size | # Housing Units | % Housing Units |
| 1-Person Household | 28 | 56.0% |
| 2-Person Household | 10 | 20.0% |
| 3-Person Household | 12 | 24.0% |
| 4+ Person Household | 0 | 0.0% |
| Total Housing Units | 50 | 100.0% |
Occupancy by Ownership by Household Size in Johannesburg
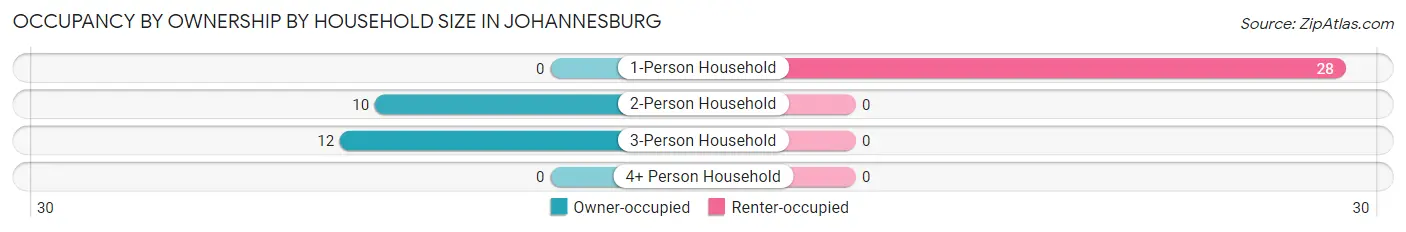
| Household Size | Owner-occupied | Renter-occupied |
| 1-Person Household | 0 (0.0%) | 28 (100.0%) |
| 2-Person Household | 10 (100.0%) | 0 (0.0%) |
| 3-Person Household | 12 (100.0%) | 0 (0.0%) |
| 4+ Person Household | 0 (0.0%) | 0 (0.0%) |
| Total Housing Units | 22 (44.0%) | 28 (56.0%) |
Occupancy by Educational Attainment in Johannesburg
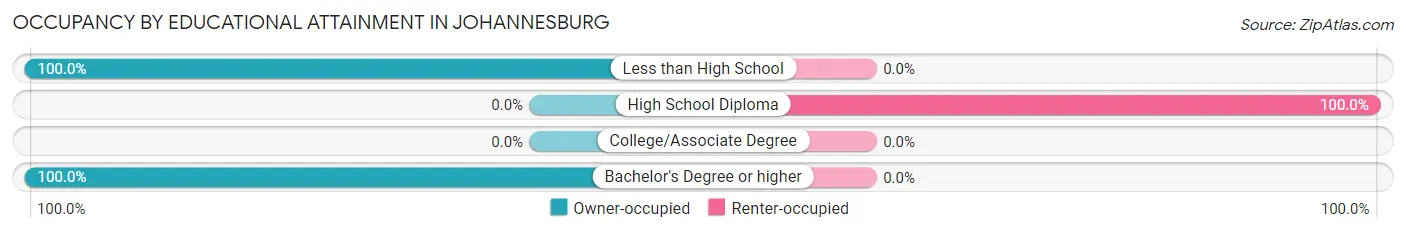
| Household Size | Owner-occupied | Renter-occupied |
| Less than High School | 12 (100.0%) | 0 (0.0%) |
| High School Diploma | 0 (0.0%) | 28 (100.0%) |
| College/Associate Degree | 0 (0.0%) | 0 (0.0%) |
| Bachelor's Degree or higher | 10 (100.0%) | 0 (0.0%) |
Occupancy by Age of Householder in Johannesburg
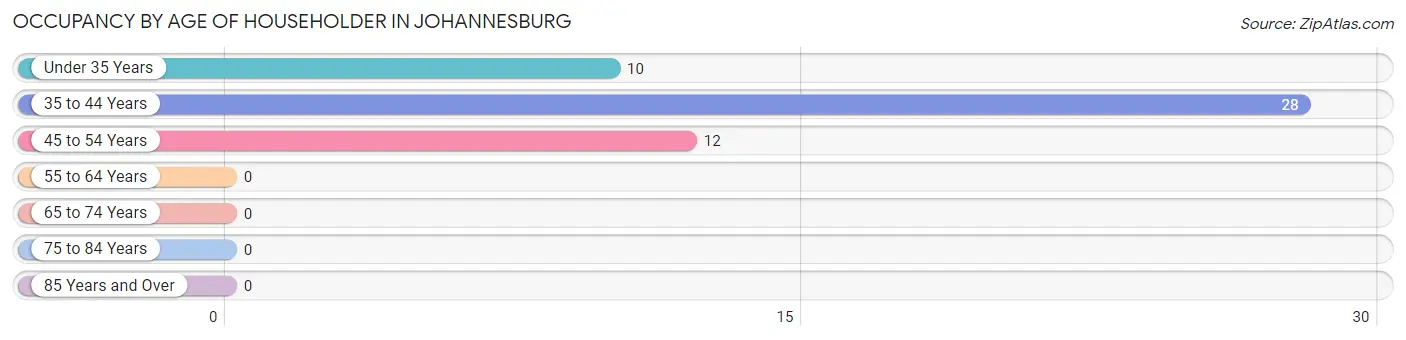
| Age Bracket | # Households | % Households |
| Under 35 Years | 10 | 20.0% |
| 35 to 44 Years | 28 | 56.0% |
| 45 to 54 Years | 12 | 24.0% |
| 55 to 64 Years | 0 | 0.0% |
| 65 to 74 Years | 0 | 0.0% |
| 75 to 84 Years | 0 | 0.0% |
| 85 Years and Over | 0 | 0.0% |
| Total | 50 | 100.0% |
Housing Finances in Johannesburg
Median Income by Occupancy in Johannesburg
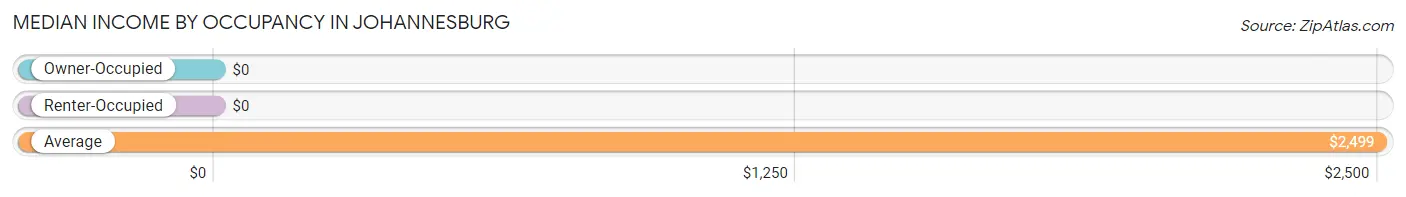
| Occupancy Type | # Households | Median Income |
| Owner-Occupied | 22 (44.0%) | $0 |
| Renter-Occupied | 28 (56.0%) | $0 |
| Average | 50 (100.0%) | $2,499 |
Occupancy by Householder Income Bracket in Johannesburg
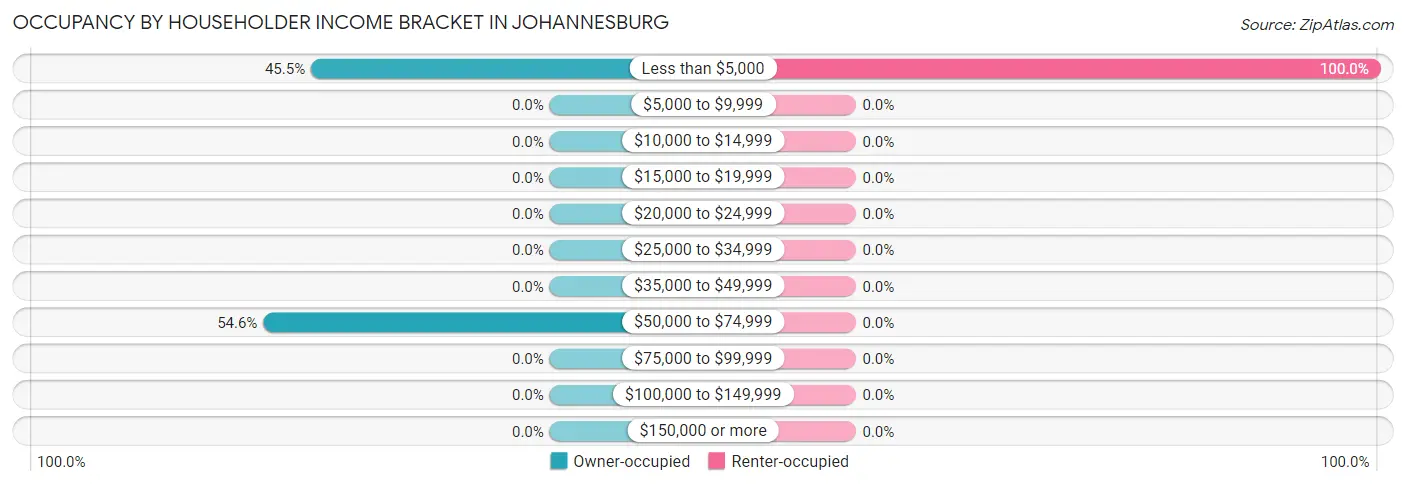
| Income Bracket | Owner-occupied | Renter-occupied |
| Less than $5,000 | 10 (45.5%) | 28 (100.0%) |
| $5,000 to $9,999 | 0 (0.0%) | 0 (0.0%) |
| $10,000 to $14,999 | 0 (0.0%) | 0 (0.0%) |
| $15,000 to $19,999 | 0 (0.0%) | 0 (0.0%) |
| $20,000 to $24,999 | 0 (0.0%) | 0 (0.0%) |
| $25,000 to $34,999 | 0 (0.0%) | 0 (0.0%) |
| $35,000 to $49,999 | 0 (0.0%) | 0 (0.0%) |
| $50,000 to $74,999 | 12 (54.5%) | 0 (0.0%) |
| $75,000 to $99,999 | 0 (0.0%) | 0 (0.0%) |
| $100,000 to $149,999 | 0 (0.0%) | 0 (0.0%) |
| $150,000 or more | 0 (0.0%) | 0 (0.0%) |
| Total | 22 (100.0%) | 28 (100.0%) |
Monthly Housing Cost Tiers in Johannesburg
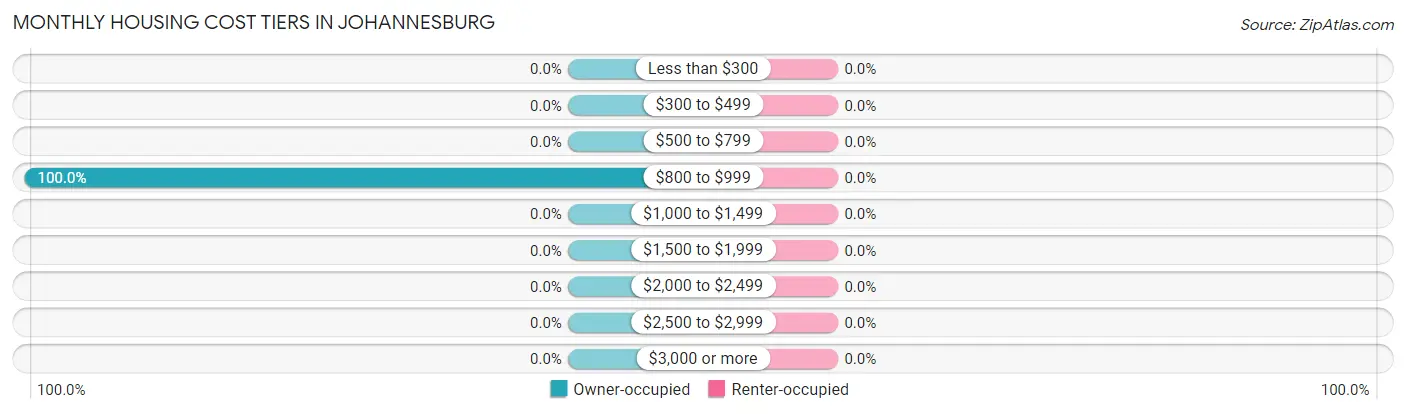
| Monthly Cost | Owner-occupied | Renter-occupied |
| Less than $300 | 0 (0.0%) | 0 (0.0%) |
| $300 to $499 | 0 (0.0%) | 0 (0.0%) |
| $500 to $799 | 0 (0.0%) | 0 (0.0%) |
| $800 to $999 | 22 (100.0%) | 0 (0.0%) |
| $1,000 to $1,499 | 0 (0.0%) | 0 (0.0%) |
| $1,500 to $1,999 | 0 (0.0%) | 0 (0.0%) |
| $2,000 to $2,499 | 0 (0.0%) | 0 (0.0%) |
| $2,500 to $2,999 | 0 (0.0%) | 0 (0.0%) |
| $3,000 or more | 0 (0.0%) | 0 (0.0%) |
| Total | 22 (100.0%) | 28 (100.0%) |
Physical Housing Characteristics in Johannesburg
Housing Structures in Johannesburg
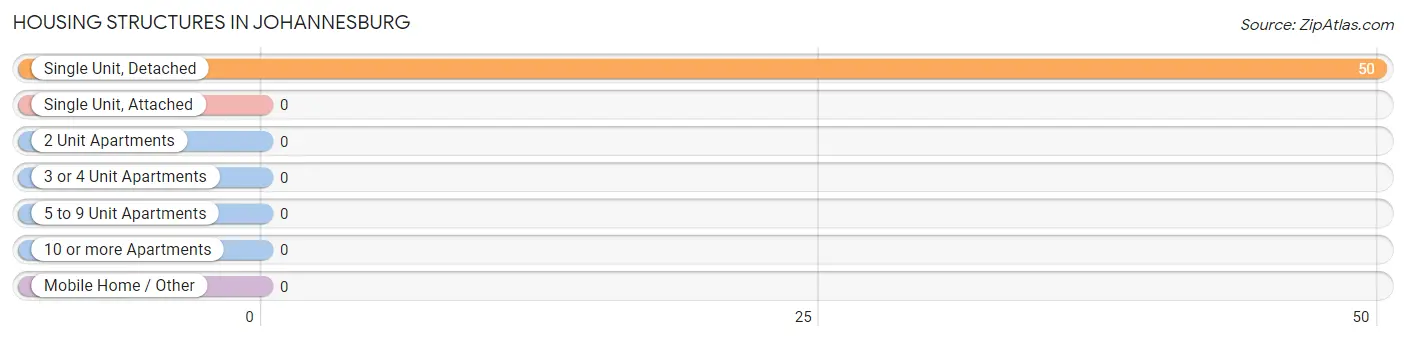
| Structure Type | # Housing Units | % Housing Units |
| Single Unit, Detached | 50 | 100.0% |
| Single Unit, Attached | 0 | 0.0% |
| 2 Unit Apartments | 0 | 0.0% |
| 3 or 4 Unit Apartments | 0 | 0.0% |
| 5 to 9 Unit Apartments | 0 | 0.0% |
| 10 or more Apartments | 0 | 0.0% |
| Mobile Home / Other | 0 | 0.0% |
| Total | 50 | 100.0% |
Housing Structures by Occupancy in Johannesburg
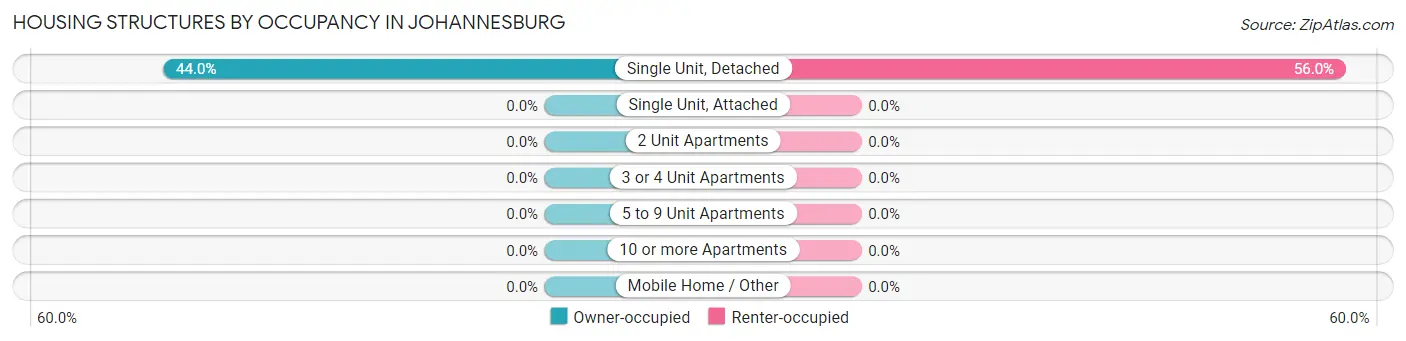
| Structure Type | Owner-occupied | Renter-occupied |
| Single Unit, Detached | 22 (44.0%) | 28 (56.0%) |
| Single Unit, Attached | 0 (0.0%) | 0 (0.0%) |
| 2 Unit Apartments | 0 (0.0%) | 0 (0.0%) |
| 3 or 4 Unit Apartments | 0 (0.0%) | 0 (0.0%) |
| 5 to 9 Unit Apartments | 0 (0.0%) | 0 (0.0%) |
| 10 or more Apartments | 0 (0.0%) | 0 (0.0%) |
| Mobile Home / Other | 0 (0.0%) | 0 (0.0%) |
| Total | 22 (44.0%) | 28 (56.0%) |
Housing Structures by Number of Rooms in Johannesburg
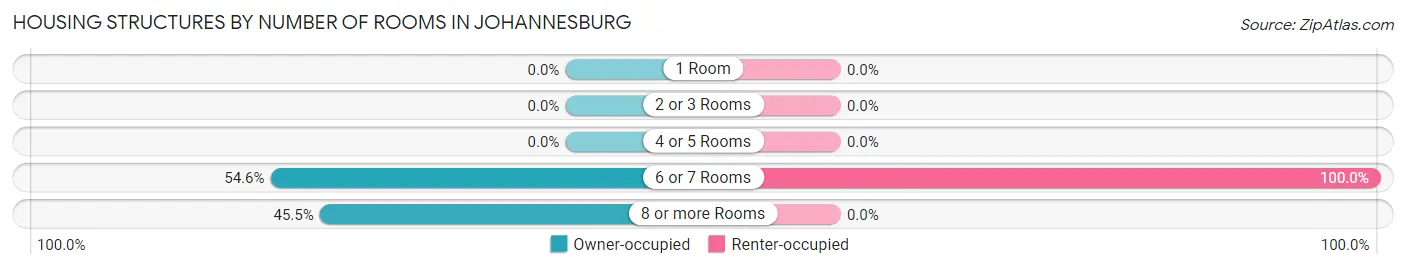
| Number of Rooms | Owner-occupied | Renter-occupied |
| 1 Room | 0 (0.0%) | 0 (0.0%) |
| 2 or 3 Rooms | 0 (0.0%) | 0 (0.0%) |
| 4 or 5 Rooms | 0 (0.0%) | 0 (0.0%) |
| 6 or 7 Rooms | 12 (54.5%) | 28 (100.0%) |
| 8 or more Rooms | 10 (45.5%) | 0 (0.0%) |
| Total | 22 (100.0%) | 28 (100.0%) |
Housing Structure by Heating Type in Johannesburg
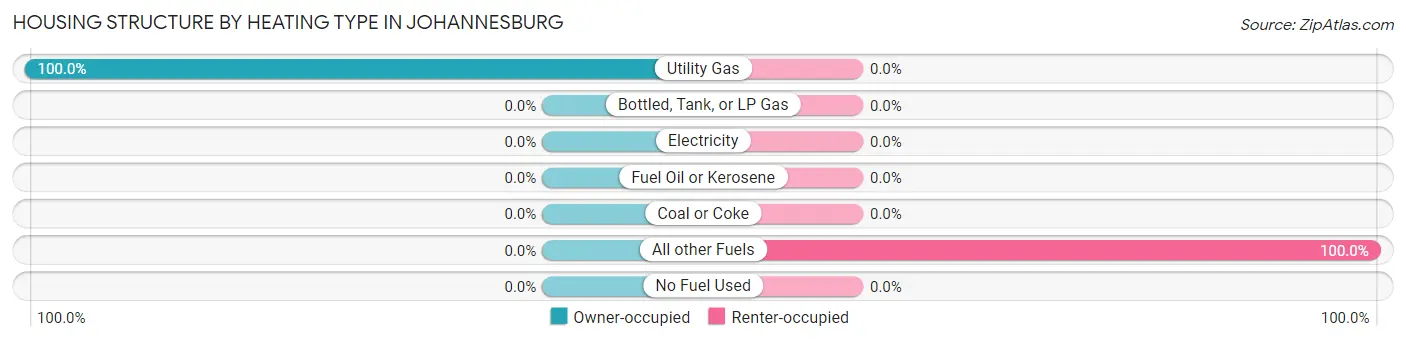
| Heating Type | Owner-occupied | Renter-occupied |
| Utility Gas | 22 (100.0%) | 0 (0.0%) |
| Bottled, Tank, or LP Gas | 0 (0.0%) | 0 (0.0%) |
| Electricity | 0 (0.0%) | 0 (0.0%) |
| Fuel Oil or Kerosene | 0 (0.0%) | 0 (0.0%) |
| Coal or Coke | 0 (0.0%) | 0 (0.0%) |
| All other Fuels | 0 (0.0%) | 28 (100.0%) |
| No Fuel Used | 0 (0.0%) | 0 (0.0%) |
| Total | 22 (100.0%) | 28 (100.0%) |
Household Vehicle Usage in Johannesburg
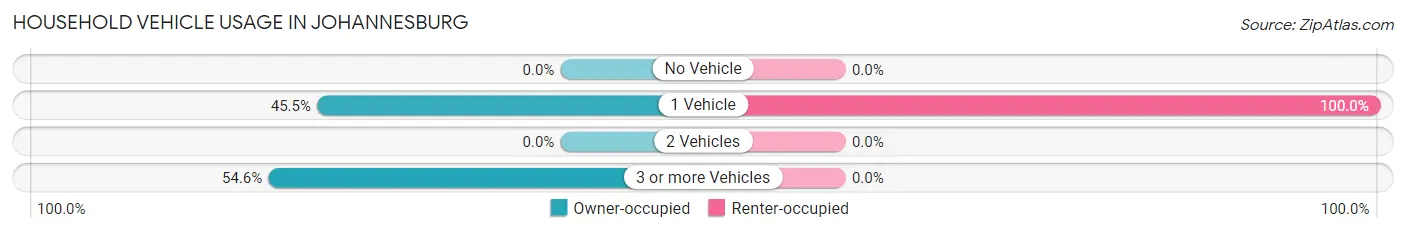
| Vehicles per Household | Owner-occupied | Renter-occupied |
| No Vehicle | 0 (0.0%) | 0 (0.0%) |
| 1 Vehicle | 10 (45.5%) | 28 (100.0%) |
| 2 Vehicles | 0 (0.0%) | 0 (0.0%) |
| 3 or more Vehicles | 12 (54.5%) | 0 (0.0%) |
| Total | 22 (100.0%) | 28 (100.0%) |
Real Estate & Mortgages in Johannesburg
Real Estate and Mortgage Overview in Johannesburg
| Characteristic | Without Mortgage | With Mortgage |
| Housing Units | 22 | 0 |
| Median Property Value | - | - |
| Median Household Income | - | - |
| Monthly Housing Costs | - | - |
| Real Estate Taxes | - | - |
Property Value by Mortgage Status in Johannesburg
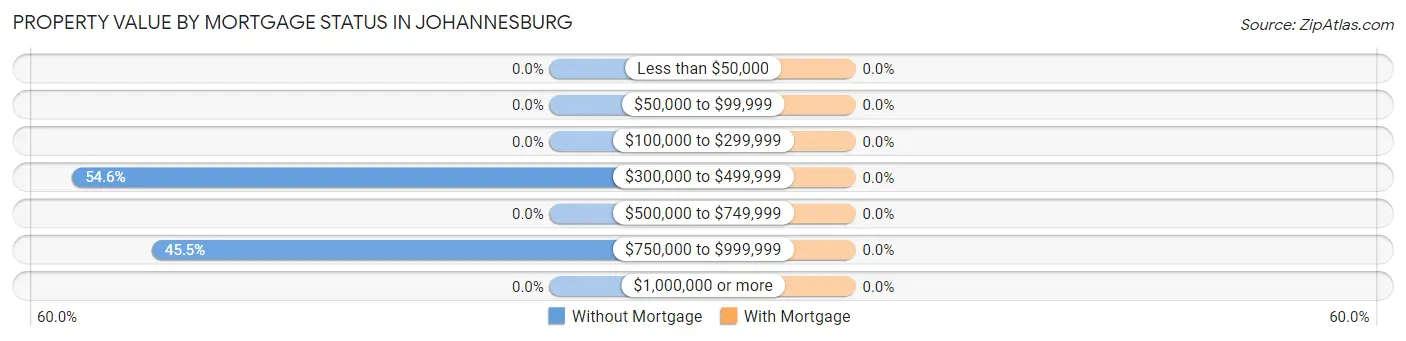
| Property Value | Without Mortgage | With Mortgage |
| Less than $50,000 | 0 (0.0%) | 0 (0.0%) |
| $50,000 to $99,999 | 0 (0.0%) | 0 (0.0%) |
| $100,000 to $299,999 | 0 (0.0%) | 0 (0.0%) |
| $300,000 to $499,999 | 12 (54.5%) | 0 (0.0%) |
| $500,000 to $749,999 | 0 (0.0%) | 0 (0.0%) |
| $750,000 to $999,999 | 10 (45.5%) | 0 (0.0%) |
| $1,000,000 or more | 0 (0.0%) | 0 (0.0%) |
| Total | 22 (100.0%) | 0 (0.0%) |
Household Income by Mortgage Status in Johannesburg
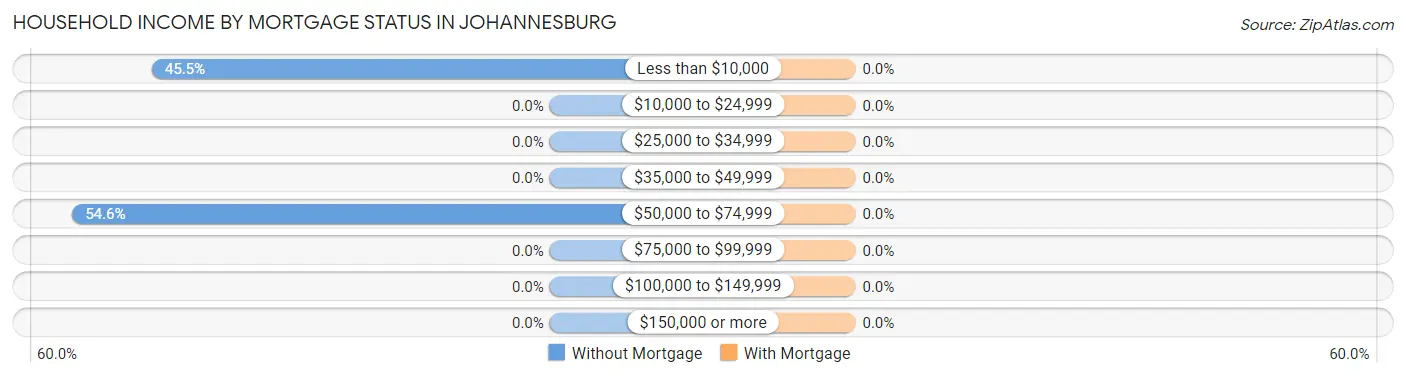
| Household Income | Without Mortgage | With Mortgage |
| Less than $10,000 | 10 (45.5%) | 0 (0.0%) |
| $10,000 to $24,999 | 0 (0.0%) | 0 (0.0%) |
| $25,000 to $34,999 | 0 (0.0%) | 0 (0.0%) |
| $35,000 to $49,999 | 0 (0.0%) | 0 (0.0%) |
| $50,000 to $74,999 | 12 (54.5%) | 0 (0.0%) |
| $75,000 to $99,999 | 0 (0.0%) | 0 (0.0%) |
| $100,000 to $149,999 | 0 (0.0%) | 0 (0.0%) |
| $150,000 or more | 0 (0.0%) | 0 (0.0%) |
| Total | 22 (100.0%) | 0 (0.0%) |
Property Value to Household Income Ratio in Johannesburg
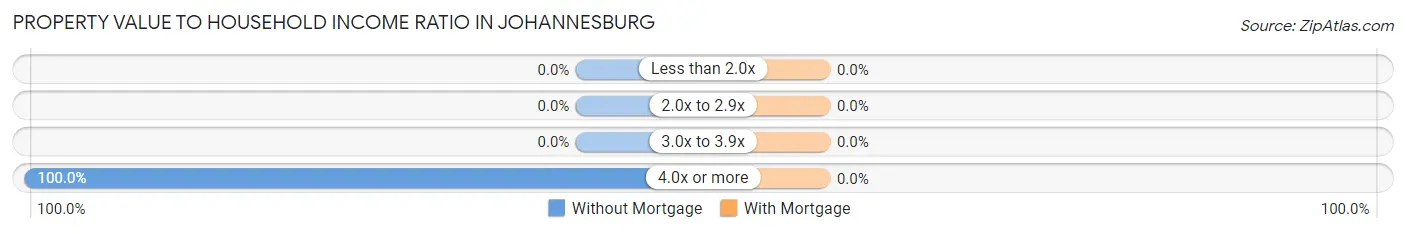
| Value-to-Income Ratio | Without Mortgage | With Mortgage |
| Less than 2.0x | 0 (0.0%) | 0 (0.0%) |
| 2.0x to 2.9x | 0 (0.0%) | 0 (0.0%) |
| 3.0x to 3.9x | 0 (0.0%) | 0 (0.0%) |
| 4.0x or more | 22 (100.0%) | 0 (0.0%) |
| Total | 22 (100.0%) | 0 (0.0%) |
Real Estate Taxes by Mortgage Status in Johannesburg
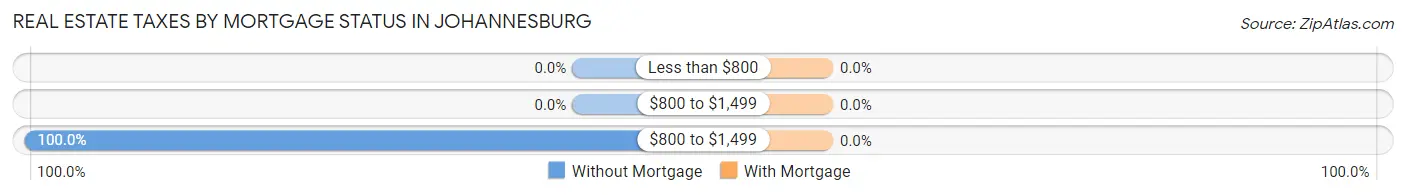
| Property Taxes | Without Mortgage | With Mortgage |
| Less than $800 | 0 (0.0%) | 0 (0.0%) |
| $800 to $1,499 | 0 (0.0%) | 0 (0.0%) |
| $800 to $1,499 | 22 (100.0%) | 0 (0.0%) |
| Total | 22 (100.0%) | 0 (0.0%) |
Health & Disability in Johannesburg
Health Insurance Coverage by Age in Johannesburg
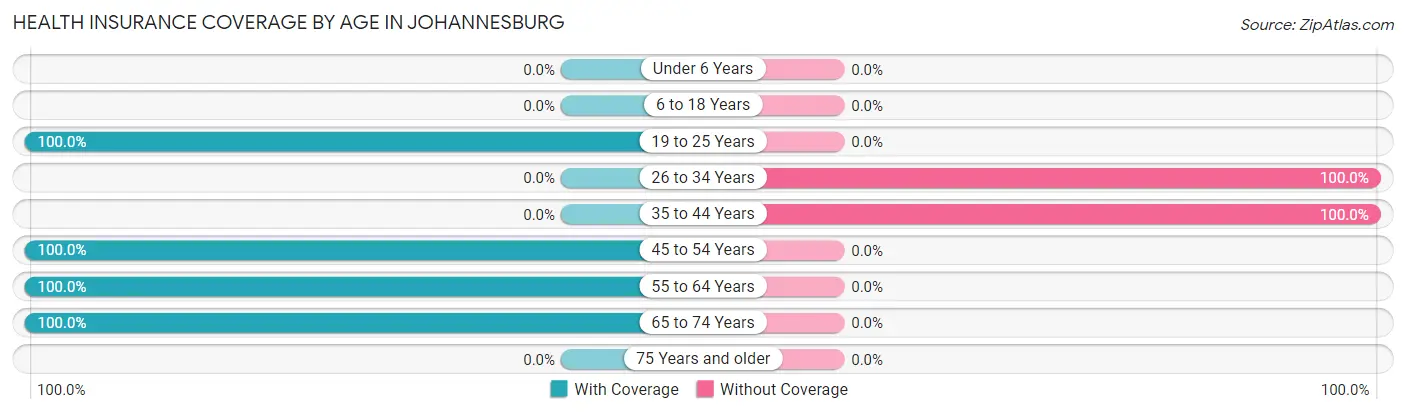
| Age Bracket | With Coverage | Without Coverage |
| Under 6 Years | 0 (0.0%) | 0 (0.0%) |
| 6 to 18 Years | 0 (0.0%) | 0 (0.0%) |
| 19 to 25 Years | 22 (100.0%) | 0 (0.0%) |
| 26 to 34 Years | 0 (0.0%) | 10 (100.0%) |
| 35 to 44 Years | 0 (0.0%) | 28 (100.0%) |
| 45 to 54 Years | 12 (100.0%) | 0 (0.0%) |
| 55 to 64 Years | 15 (100.0%) | 0 (0.0%) |
| 65 to 74 Years | 7 (100.0%) | 0 (0.0%) |
| 75 Years and older | 0 (0.0%) | 0 (0.0%) |
| Total | 56 (59.6%) | 38 (40.4%) |
Health Insurance Coverage by Citizenship Status in Johannesburg
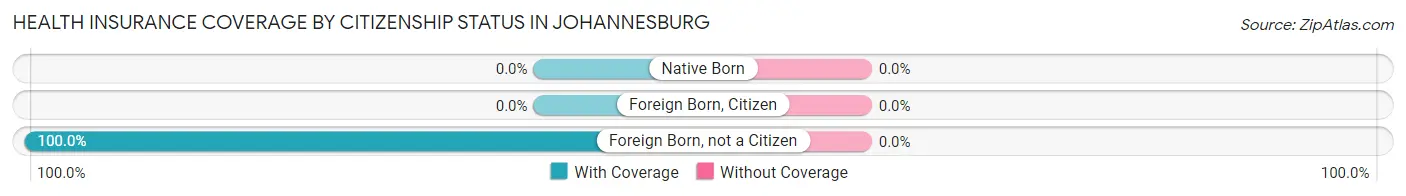
| Citizenship Status | With Coverage | Without Coverage |
| Native Born | 0 (0.0%) | 0 (0.0%) |
| Foreign Born, Citizen | 0 (0.0%) | 0 (0.0%) |
| Foreign Born, not a Citizen | 22 (100.0%) | 0 (0.0%) |
Health Insurance Coverage by Household Income in Johannesburg
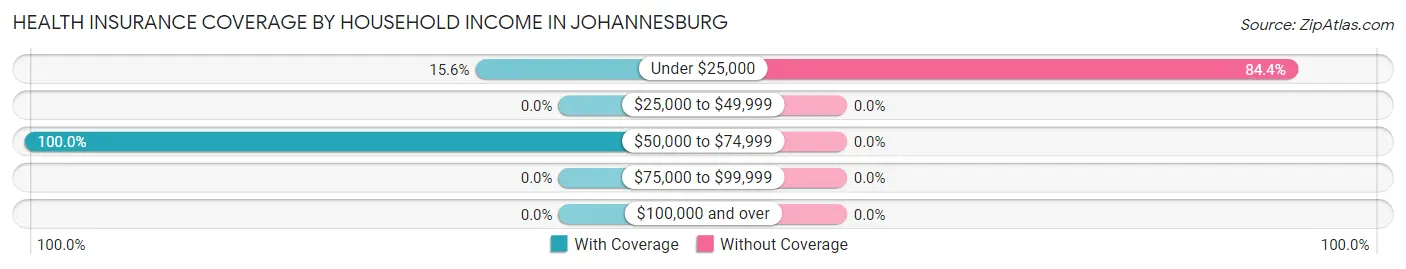
| Household Income | With Coverage | Without Coverage |
| Under $25,000 | 7 (15.6%) | 38 (84.4%) |
| $25,000 to $49,999 | 0 (0.0%) | 0 (0.0%) |
| $50,000 to $74,999 | 49 (100.0%) | 0 (0.0%) |
| $75,000 to $99,999 | 0 (0.0%) | 0 (0.0%) |
| $100,000 and over | 0 (0.0%) | 0 (0.0%) |
Public vs Private Health Insurance Coverage by Age in Johannesburg
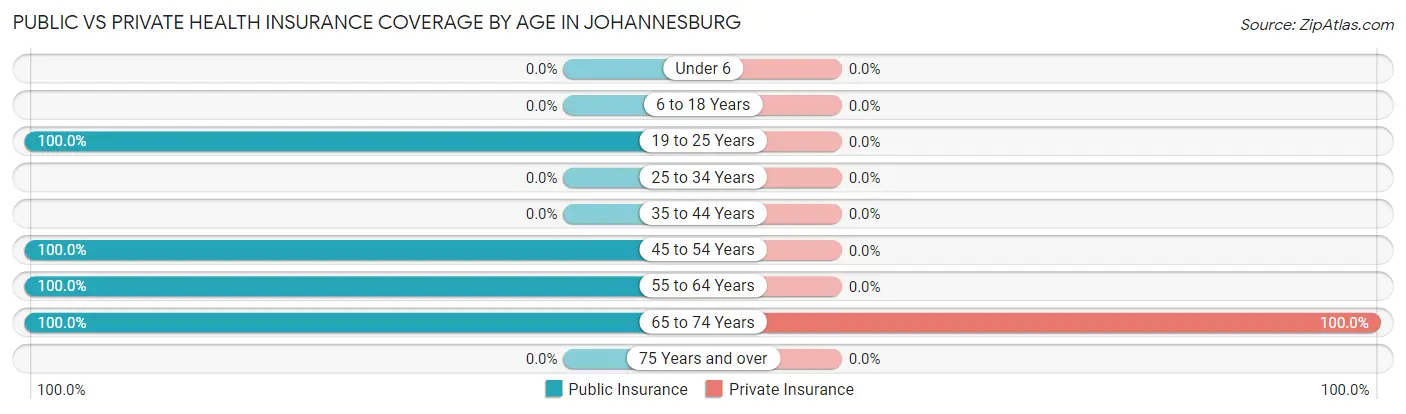
| Age Bracket | Public Insurance | Private Insurance |
| Under 6 | 0 (0.0%) | 0 (0.0%) |
| 6 to 18 Years | 0 (0.0%) | 0 (0.0%) |
| 19 to 25 Years | 22 (100.0%) | 0 (0.0%) |
| 25 to 34 Years | 0 (0.0%) | 0 (0.0%) |
| 35 to 44 Years | 0 (0.0%) | 0 (0.0%) |
| 45 to 54 Years | 12 (100.0%) | 0 (0.0%) |
| 55 to 64 Years | 15 (100.0%) | 0 (0.0%) |
| 65 to 74 Years | 7 (100.0%) | 7 (100.0%) |
| 75 Years and over | 0 (0.0%) | 0 (0.0%) |
| Total | 56 (59.6%) | 7 (7.4%) |
Disability Status by Sex by Age in Johannesburg
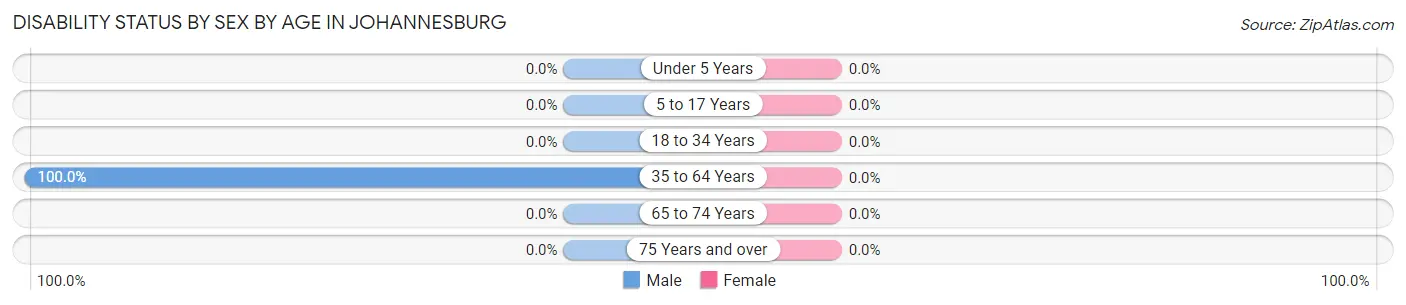
| Age Bracket | Male | Female |
| Under 5 Years | 0 (0.0%) | 0 (0.0%) |
| 5 to 17 Years | 0 (0.0%) | 0 (0.0%) |
| 18 to 34 Years | 0 (0.0%) | 0 (0.0%) |
| 35 to 64 Years | 28 (100.0%) | 0 (0.0%) |
| 65 to 74 Years | 0 (0.0%) | 0 (0.0%) |
| 75 Years and over | 0 (0.0%) | 0 (0.0%) |
Disability Class by Sex by Age in Johannesburg
Disability Class: Hearing Difficulty
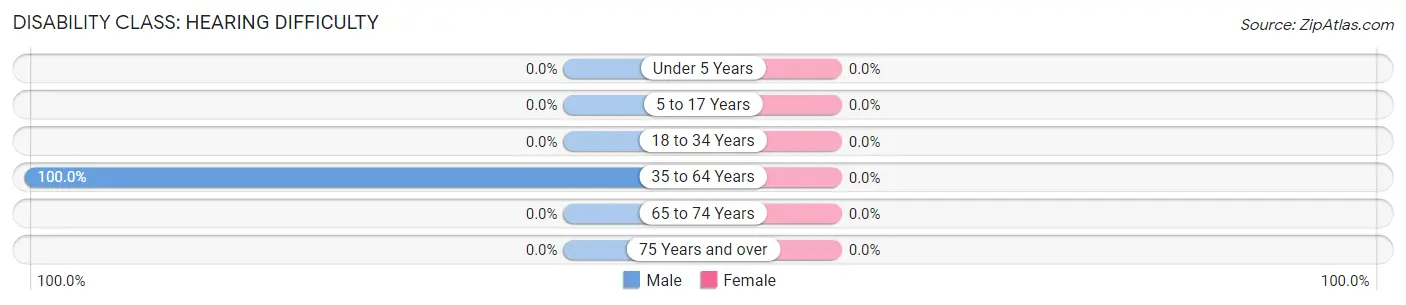
| Age Bracket | Male | Female |
| Under 5 Years | 0 (0.0%) | 0 (0.0%) |
| 5 to 17 Years | 0 (0.0%) | 0 (0.0%) |
| 18 to 34 Years | 0 (0.0%) | 0 (0.0%) |
| 35 to 64 Years | 28 (100.0%) | 0 (0.0%) |
| 65 to 74 Years | 0 (0.0%) | 0 (0.0%) |
| 75 Years and over | 0 (0.0%) | 0 (0.0%) |
Disability Class: Vision Difficulty
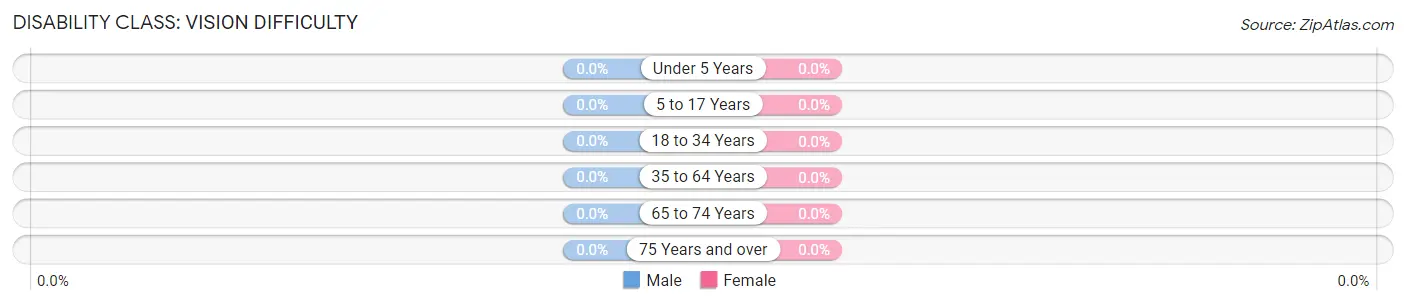
| Age Bracket | Male | Female |
| Under 5 Years | 0 (0.0%) | 0 (0.0%) |
| 5 to 17 Years | 0 (0.0%) | 0 (0.0%) |
| 18 to 34 Years | 0 (0.0%) | 0 (0.0%) |
| 35 to 64 Years | 0 (0.0%) | 0 (0.0%) |
| 65 to 74 Years | 0 (0.0%) | 0 (0.0%) |
| 75 Years and over | 0 (0.0%) | 0 (0.0%) |
Disability Class: Cognitive Difficulty
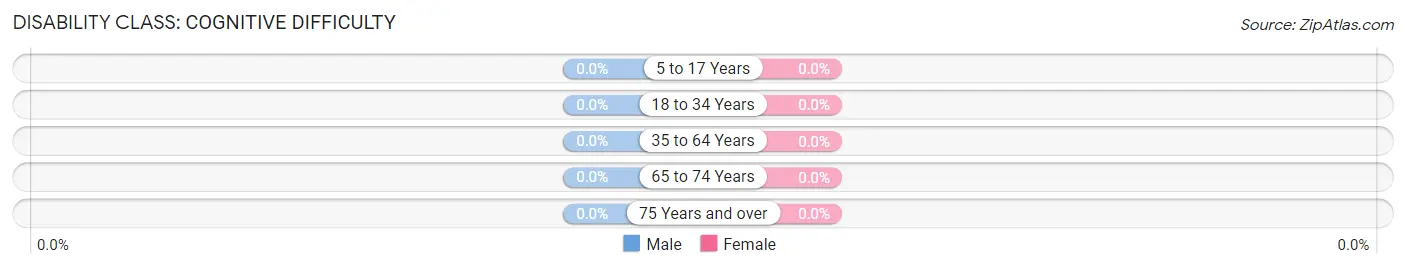
| Age Bracket | Male | Female |
| 5 to 17 Years | 0 (0.0%) | 0 (0.0%) |
| 18 to 34 Years | 0 (0.0%) | 0 (0.0%) |
| 35 to 64 Years | 0 (0.0%) | 0 (0.0%) |
| 65 to 74 Years | 0 (0.0%) | 0 (0.0%) |
| 75 Years and over | 0 (0.0%) | 0 (0.0%) |
Disability Class: Ambulatory Difficulty
| Age Bracket | Male | Female |
| 5 to 17 Years | 0 (0.0%) | 0 (0.0%) |
| 18 to 34 Years | 0 (0.0%) | 0 (0.0%) |
| 35 to 64 Years | 0 (0.0%) | 0 (0.0%) |
| 65 to 74 Years | 0 (0.0%) | 0 (0.0%) |
| 75 Years and over | 0 (0.0%) | 0 (0.0%) |
Disability Class: Self-Care Difficulty

| Age Bracket | Male | Female |
| 5 to 17 Years | 0 (0.0%) | 0 (0.0%) |
| 18 to 34 Years | 0 (0.0%) | 0 (0.0%) |
| 35 to 64 Years | 0 (0.0%) | 0 (0.0%) |
| 65 to 74 Years | 0 (0.0%) | 0 (0.0%) |
| 75 Years and over | 0 (0.0%) | 0 (0.0%) |
Technology Access in Johannesburg
Computing Device Access in Johannesburg
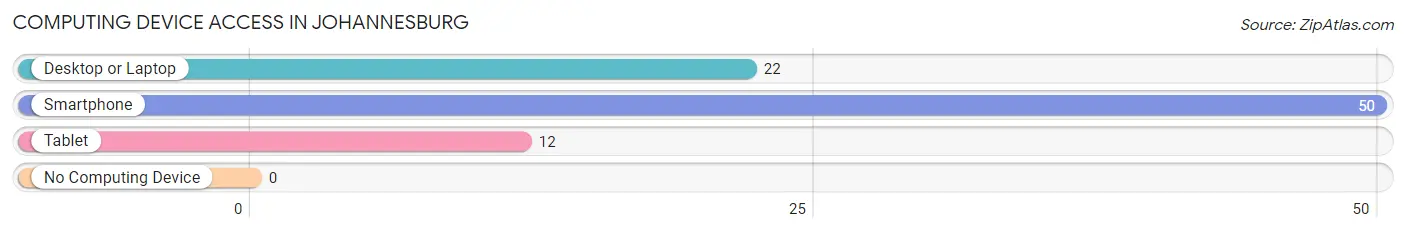
| Device Type | # Households | % Households |
| Desktop or Laptop | 22 | 44.0% |
| Smartphone | 50 | 100.0% |
| Tablet | 12 | 24.0% |
| No Computing Device | 0 | 0.0% |
| Total | 50 | 100.0% |
Internet Access in Johannesburg
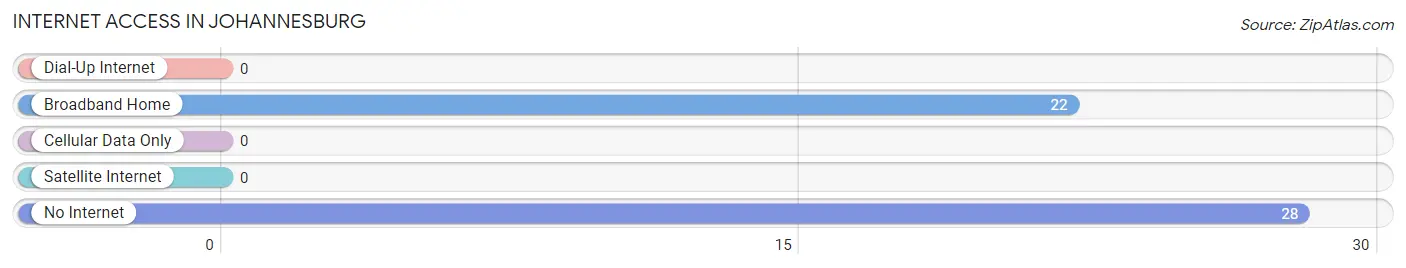
| Internet Type | # Households | % Households |
| Dial-Up Internet | 0 | 0.0% |
| Broadband Home | 22 | 44.0% |
| Cellular Data Only | 0 | 0.0% |
| Satellite Internet | 0 | 0.0% |
| No Internet | 28 | 56.0% |
| Total | 50 | 100.0% |
Johannesburg Summary
Johannesburg is the largest city in South Africa and the provincial capital of Gauteng. It is the economic hub of the country and the most populous city in the country, with a population of over 4.4 million people in 2019. Johannesburg is located in the Witwatersrand region of the Highveld, which is a vast, flat plateau that stretches across the country. The city is situated on the edge of the Witwatersrand, which is a range of hills that form the eastern edge of the Highveld.
History
Johannesburg was founded in 1886, when gold was discovered in the area. The discovery of gold sparked a gold rush, and thousands of people flocked to the area in search of wealth. The city was named after two prospectors, Johannes Rissik and Johannes Joubert, who were the first to stake a claim in the area. The city quickly grew, and by the turn of the century, it was the largest city in South Africa.
The city was the site of the Boer War, which was fought between the British and the Boers (Afrikaners) from 1899 to 1902. The war ended with the British victory, and the city was annexed to the British Empire. After the war, the city continued to grow, and by the 1920s, it was the largest city in the country.
Geography
Johannesburg is located in the Witwatersrand region of the Highveld, which is a vast, flat plateau that stretches across the country. The city is situated on the edge of the Witwatersrand, which is a range of hills that form the eastern edge of the Highveld. The city is surrounded by the Magaliesberg mountain range to the north, the Vaal River to the south, and the Crocodile River to the east.
The city is divided into several distinct areas, including the Central Business District, the Northern Suburbs, the Southern Suburbs, and the West Rand. The Central Business District is the commercial and financial hub of the city, and is home to many of the city's major businesses and financial institutions. The Northern Suburbs are the most affluent areas of the city, and are home to many of the city's wealthiest residents. The Southern Suburbs are the most populous areas of the city, and are home to many of the city's working-class residents. The West Rand is the least developed area of the city, and is home to many of the city's poorest residents.
Economy
Johannesburg is the economic hub of South Africa, and is home to many of the country's major businesses and financial institutions. The city is the largest contributor to the country's GDP, and is home to the Johannesburg Stock Exchange, which is the largest stock exchange in Africa. The city is also home to many of the country's major industries, including mining, manufacturing, finance, and tourism.
The city is also home to many of the country's major universities, including the University of the Witwatersrand, the University of Johannesburg, and the University of Pretoria. The city is also home to many of the country's major cultural institutions, including the Johannesburg Art Gallery, the Johannesburg Zoo, and the Johannesburg Planetarium.
Demographics
Johannesburg is the most populous city in South Africa, with a population of over 4.4 million people in 2019. The city is home to people of many different ethnic backgrounds, including African, European, Indian, and Chinese. The city is also home to many different religious groups, including Christianity, Islam, Hinduism, and Judaism.
The city is also home to many different languages, including English, Afrikaans, Zulu, Xhosa, and Sotho. The city is also home to many different cultures, including the Zulu, Xhosa, Sotho, and Tswana.
Conclusion
Johannesburg is the largest city in South Africa and the provincial capital of Gauteng. It is the economic hub of the country and the most populous city in the country, with a population of over 4.4 million people in 2019. The city was founded in 1886, when gold was discovered in the area, and has since grown to become the economic and cultural hub of the country. The city is located in the Witwatersrand region of the Highveld, and is divided into several distinct areas, including the Central Business District, the Northern Suburbs, the Southern Suburbs, and the West Rand. The city is home to many of the country's major businesses and financial institutions, and is the largest contributor to the country's GDP. The city is also home to people of many different ethnic backgrounds, religions, languages, and cultures.
Common Questions
What is Per Capita Income in Johannesburg?
Per Capita income in Johannesburg is $9,224.
What is the Median Household income in Johannesburg?
Median Household Income in Johannesburg is $2,499.
What is Inequality or Gini Index in Johannesburg?
Inequality or Gini Index in Johannesburg is 0.74.
What is the Total Population of Johannesburg?
Total Population of Johannesburg is 94.
What is the Total Male Population of Johannesburg?
Total Male Population of Johannesburg is 60.
What is the Total Female Population of Johannesburg?
Total Female Population of Johannesburg is 34.
What is the Ratio of Males per 100 Females in Johannesburg?
There are 176.47 Males per 100 Females in Johannesburg.
What is the Ratio of Females per 100 Males in Johannesburg?
There are 56.67 Females per 100 Males in Johannesburg.
What is the Median Population Age in Johannesburg?
Median Population Age in Johannesburg is 35.5 Years.
What is the Average Family Size in Johannesburg
Average Family Size in Johannesburg is 3.0 People.
What is the Average Household Size in Johannesburg
Average Household Size in Johannesburg is 1.9 People.
How Large is the Labor Force in Johannesburg?
There are 44 People in the Labor Forcein in Johannesburg.
What is the Percentage of People in the Labor Force in Johannesburg?
46.8% of People are in the Labor Force in Johannesburg.
What is the Unemployment Rate in Johannesburg?
Unemployment Rate in Johannesburg is 22.7%.