Kealakekua, HI Map & Demographics
Kealakekua Map
Kealakekua Overview
$41,040
PER CAPITA INCOME
$110,461
AVG FAMILY INCOME
$78,646
AVG HOUSEHOLD INCOME
23.1%
WAGE / INCOME GAP [ % ]
76.9¢/ $1
WAGE / INCOME GAP [ $ ]
0.46
INEQUALITY / GINI INDEX
2,188
TOTAL POPULATION
1,083
MALE POPULATION
1,105
FEMALE POPULATION
98.01
MALES / 100 FEMALES
102.03
FEMALES / 100 MALES
47.2
MEDIAN AGE
4.0
AVG FAMILY SIZE
2.9
AVG HOUSEHOLD SIZE
1,003
LABOR FORCE [ PEOPLE ]
57.1%
PERCENT IN LABOR FORCE
1.9%
UNEMPLOYMENT RATE
Kealakekua Zip Codes
Kealakekua Area Codes
Income in Kealakekua
Income Overview in Kealakekua
Per Capita Income in Kealakekua is $41,040, while median incomes of families and households are $110,461 and $78,646 respectively.
| Characteristic | Number | Measure |
| Per Capita Income | 2,188 | $41,040 |
| Median Family Income | 413 | $110,461 |
| Mean Family Income | 413 | $148,989 |
| Median Household Income | 751 | $78,646 |
| Mean Household Income | 751 | $116,524 |
| Income Deficit | 413 | $0 |
| Wage / Income Gap (%) | 2,188 | 23.14% |
| Wage / Income Gap ($) | 2,188 | 76.86¢ per $1 |
| Gini / Inequality Index | 2,188 | 0.46 |
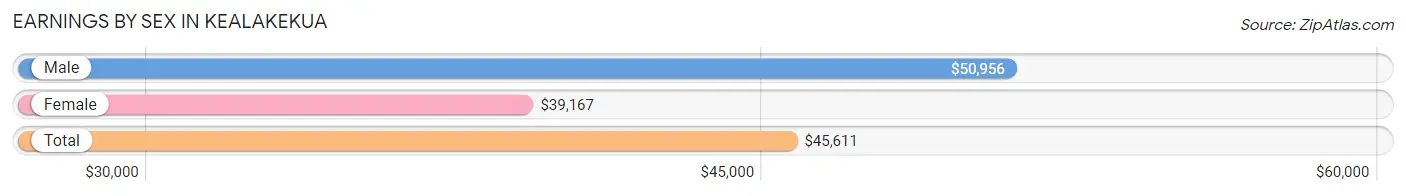
Earnings by Sex in Kealakekua
Average Earnings in Kealakekua are $45,611, $50,956 for men and $39,167 for women, a difference of 23.1%.
| Sex | Number | Average Earnings |
| Male | 517 (48.0%) | $50,956 |
| Female | 560 (52.0%) | $39,167 |
| Total | 1,077 (100.0%) | $45,611 |
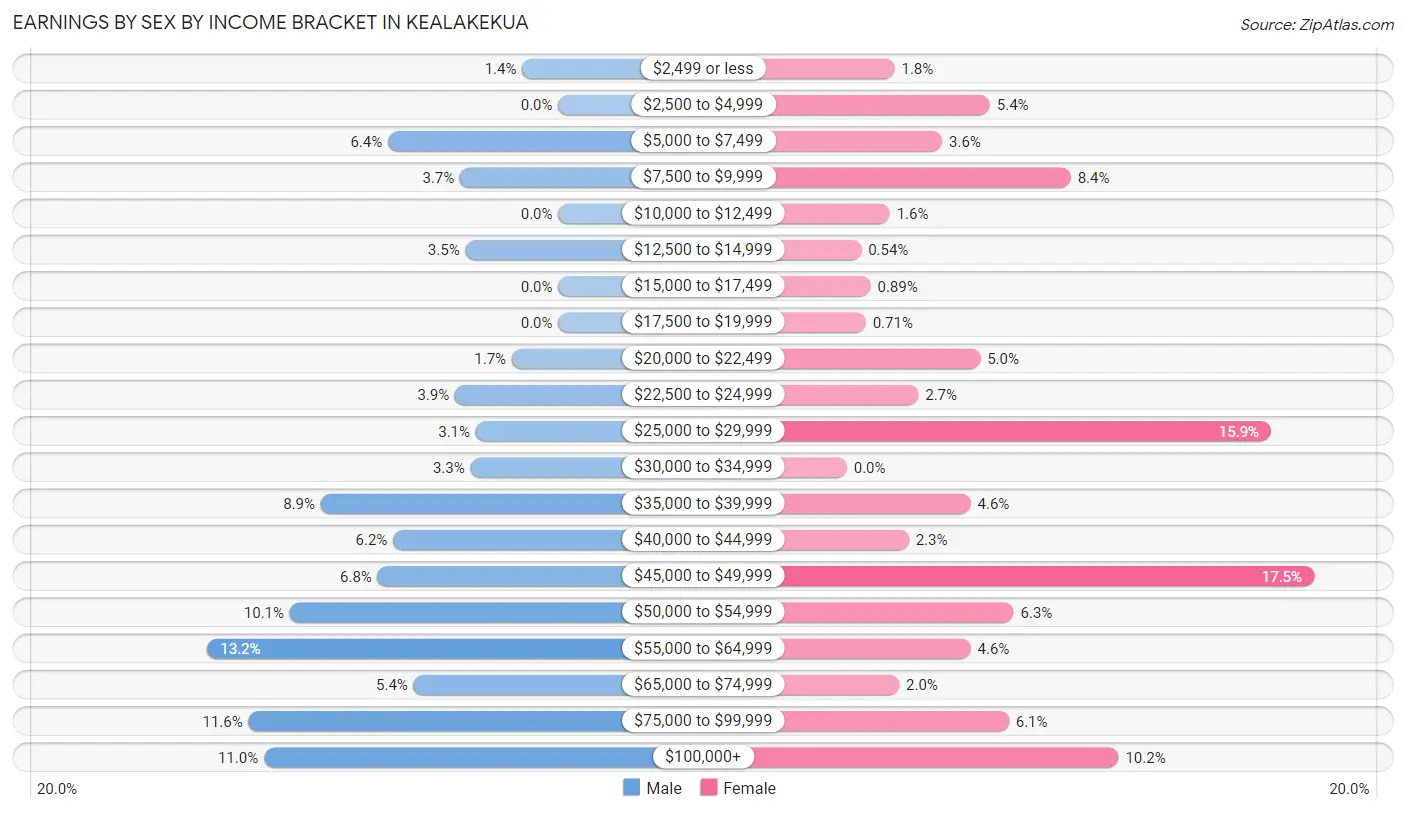
Earnings by Sex by Income Bracket in Kealakekua
The most common earnings brackets in Kealakekua are $55,000 to $64,999 for men (68 | 13.2%) and $45,000 to $49,999 for women (98 | 17.5%).
| Income | Male | Female |
| $2,499 or less | 7 (1.3%) | 10 (1.8%) |
| $2,500 to $4,999 | 0 (0.0%) | 30 (5.4%) |
| $5,000 to $7,499 | 33 (6.4%) | 20 (3.6%) |
| $7,500 to $9,999 | 19 (3.7%) | 47 (8.4%) |
| $10,000 to $12,499 | 0 (0.0%) | 9 (1.6%) |
| $12,500 to $14,999 | 18 (3.5%) | 3 (0.5%) |
| $15,000 to $17,499 | 0 (0.0%) | 5 (0.9%) |
| $17,500 to $19,999 | 0 (0.0%) | 4 (0.7%) |
| $20,000 to $22,499 | 9 (1.7%) | 28 (5.0%) |
| $22,500 to $24,999 | 20 (3.9%) | 15 (2.7%) |
| $25,000 to $29,999 | 16 (3.1%) | 89 (15.9%) |
| $30,000 to $34,999 | 17 (3.3%) | 0 (0.0%) |
| $35,000 to $39,999 | 46 (8.9%) | 26 (4.6%) |
| $40,000 to $44,999 | 32 (6.2%) | 13 (2.3%) |
| $45,000 to $49,999 | 35 (6.8%) | 98 (17.5%) |
| $50,000 to $54,999 | 52 (10.1%) | 35 (6.2%) |
| $55,000 to $64,999 | 68 (13.2%) | 26 (4.6%) |
| $65,000 to $74,999 | 28 (5.4%) | 11 (2.0%) |
| $75,000 to $99,999 | 60 (11.6%) | 34 (6.1%) |
| $100,000+ | 57 (11.0%) | 57 (10.2%) |
| Total | 517 (100.0%) | 560 (100.0%) |
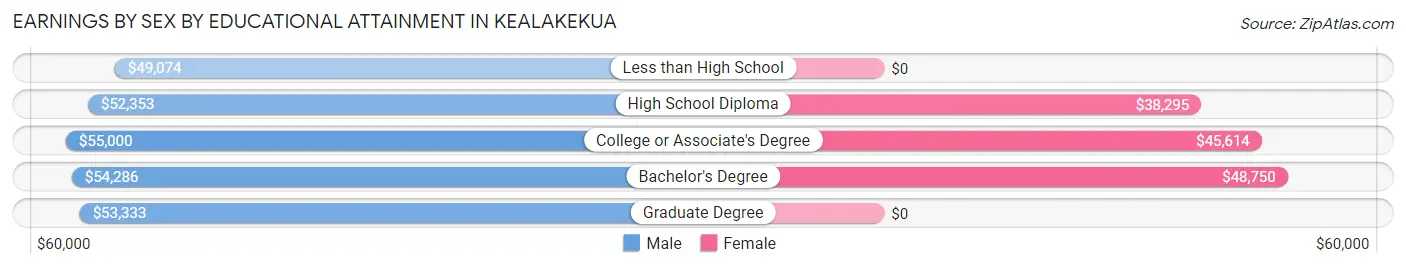
Earnings by Sex by Educational Attainment in Kealakekua
Average earnings in Kealakekua are $52,714 for men and $45,169 for women, a difference of 14.3%. Men with an educational attainment of college or associate's degree enjoy the highest average annual earnings of $55,000, while those with less than high school education earn the least with $49,074. Women with an educational attainment of bachelor's degree earn the most with the average annual earnings of $48,750, while those with high school diploma education have the smallest earnings of $38,295.
| Educational Attainment | Male Income | Female Income |
| Less than High School | $49,074 | $0 |
| High School Diploma | $52,353 | $38,295 |
| College or Associate's Degree | $55,000 | $45,614 |
| Bachelor's Degree | $54,286 | $48,750 |
| Graduate Degree | $53,333 | $0 |
| Total | $52,714 | $45,169 |
Family Income in Kealakekua
Family Income Brackets in Kealakekua
According to the Kealakekua family income data, there are 98 families falling into the $200,000+ income range, which is the most common income bracket and makes up 23.7% of all families.
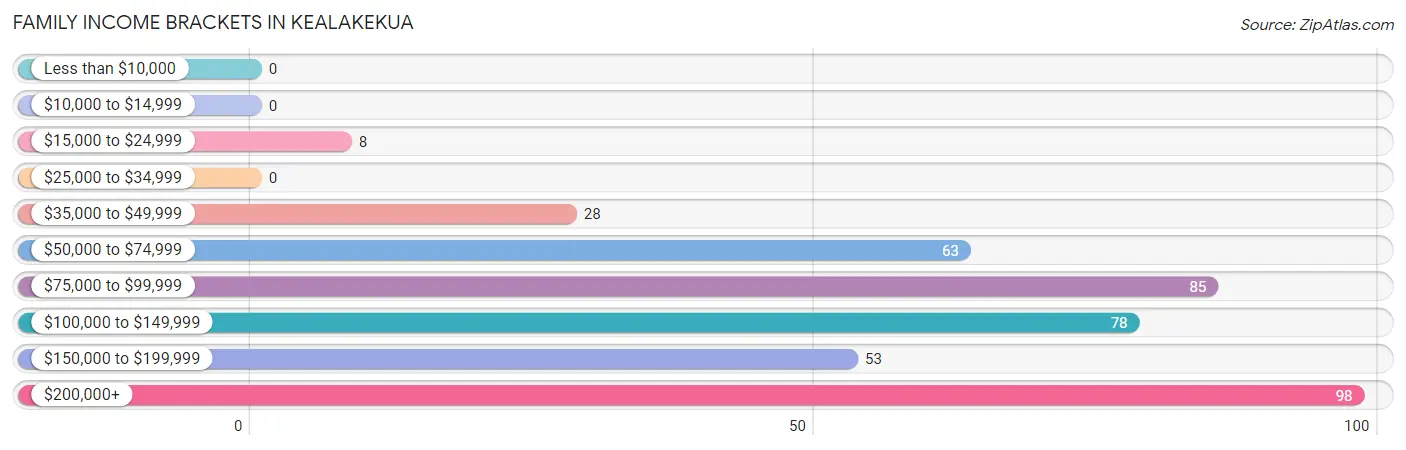
| Income Bracket | # Families | % Families |
| Less than $10,000 | 0 | 0.0% |
| $10,000 to $14,999 | 0 | 0.0% |
| $15,000 to $24,999 | 8 | 1.9% |
| $25,000 to $34,999 | 0 | 0.0% |
| $35,000 to $49,999 | 28 | 6.8% |
| $50,000 to $74,999 | 63 | 15.3% |
| $75,000 to $99,999 | 85 | 20.6% |
| $100,000 to $149,999 | 78 | 18.9% |
| $150,000 to $199,999 | 53 | 12.8% |
| $200,000+ | 98 | 23.7% |
Family Income by Famaliy Size in Kealakekua
7+ person families (39 | 9.4%) account for the highest median family income in Kealakekua with $224,716 per family, while 2-person families (176 | 42.6%) have the highest median income of $41,944 per family member.
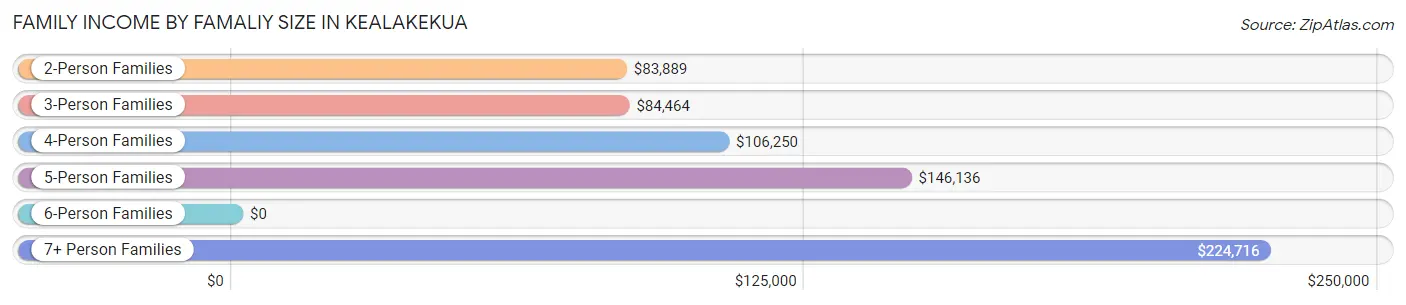
| Income Bracket | # Families | Median Income |
| 2-Person Families | 176 (42.6%) | $83,889 |
| 3-Person Families | 68 (16.5%) | $84,464 |
| 4-Person Families | 76 (18.4%) | $106,250 |
| 5-Person Families | 54 (13.1%) | $146,136 |
| 6-Person Families | 0 (0.0%) | $0 |
| 7+ Person Families | 39 (9.4%) | $224,716 |
| Total | 413 (100.0%) | $110,461 |
Family Income by Number of Earners in Kealakekua
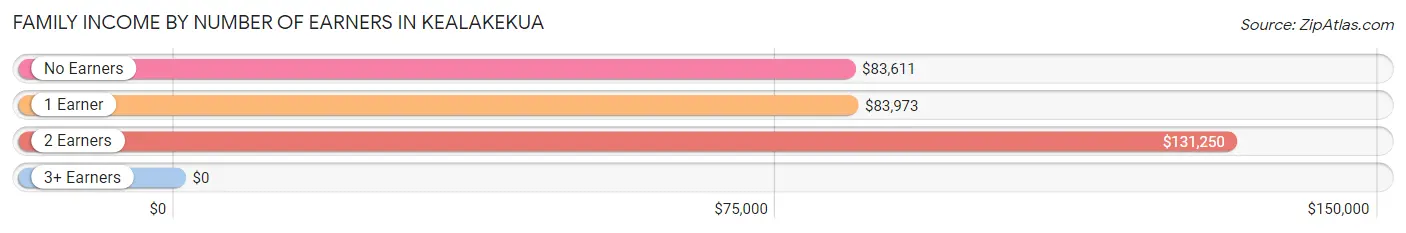
| Number of Earners | # Families | Median Income |
| No Earners | 54 (13.1%) | $83,611 |
| 1 Earner | 121 (29.3%) | $83,973 |
| 2 Earners | 148 (35.8%) | $131,250 |
| 3+ Earners | 90 (21.8%) | $0 |
| Total | 413 (100.0%) | $110,461 |
Household Income in Kealakekua
Household Income Brackets in Kealakekua
With 168 households falling in the category, the $50,000 to $74,999 income range is the most frequent in Kealakekua, accounting for 22.4% of all households. In contrast, only 21 households (2.8%) fall into the less than $10,000 income bracket, making it the least populous group.
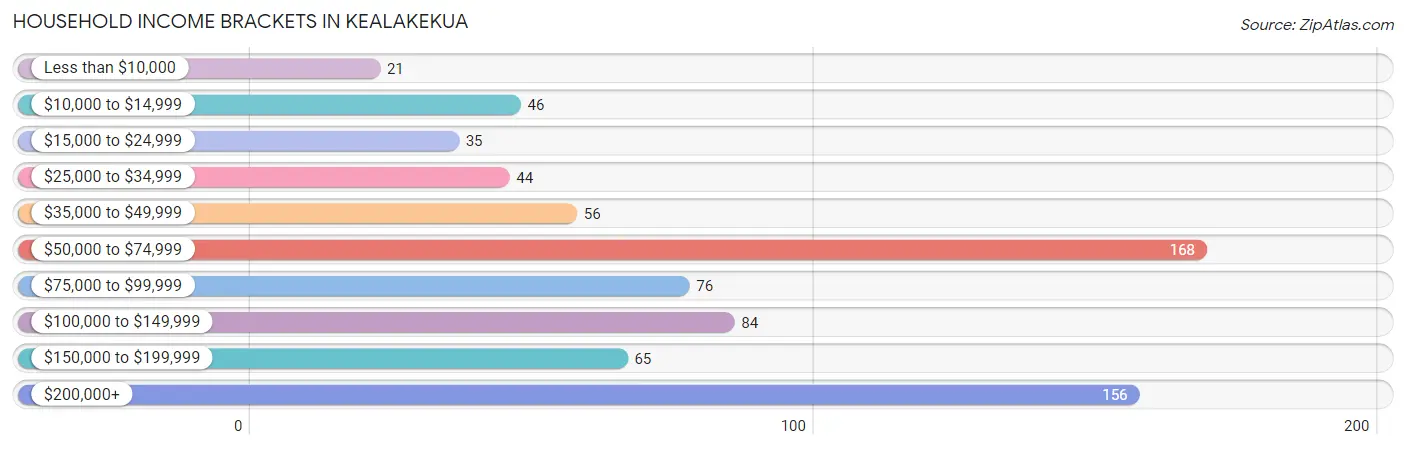
| Income Bracket | # Households | % Households |
| Less than $10,000 | 21 | 2.8% |
| $10,000 to $14,999 | 46 | 6.1% |
| $15,000 to $24,999 | 35 | 4.7% |
| $25,000 to $34,999 | 44 | 5.9% |
| $35,000 to $49,999 | 56 | 7.5% |
| $50,000 to $74,999 | 168 | 22.4% |
| $75,000 to $99,999 | 76 | 10.1% |
| $100,000 to $149,999 | 84 | 11.2% |
| $150,000 to $199,999 | 65 | 8.7% |
| $200,000+ | 156 | 20.8% |
Household Income by Householder Age in Kealakekua
The median household income in Kealakekua is $78,646, with the highest median household income of $224,674 found in the 25 to 44 years age bracket for the primary householder. A total of 102 households (13.6%) fall into this category.
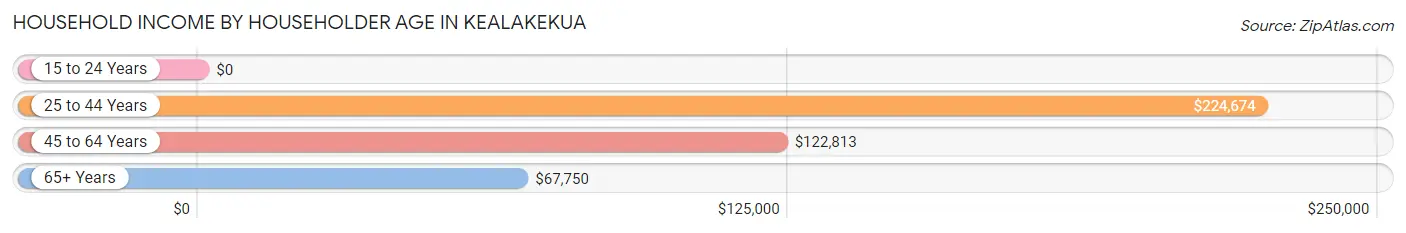
| Income Bracket | # Households | Median Income |
| 15 to 24 Years | 0 (0.0%) | $0 |
| 25 to 44 Years | 102 (13.6%) | $224,674 |
| 45 to 64 Years | 227 (30.2%) | $122,813 |
| 65+ Years | 422 (56.2%) | $67,750 |
| Total | 751 (100.0%) | $78,646 |
Poverty in Kealakekua
Income Below Poverty by Sex and Age in Kealakekua
With 6.6% poverty level for males and 4.8% for females among the residents of Kealakekua, 65 to 74 year old males and 75 year old and over females are the most vulnerable to poverty, with 34 males (27.0%) and 19 females (11.9%) in their respective age groups living below the poverty level.
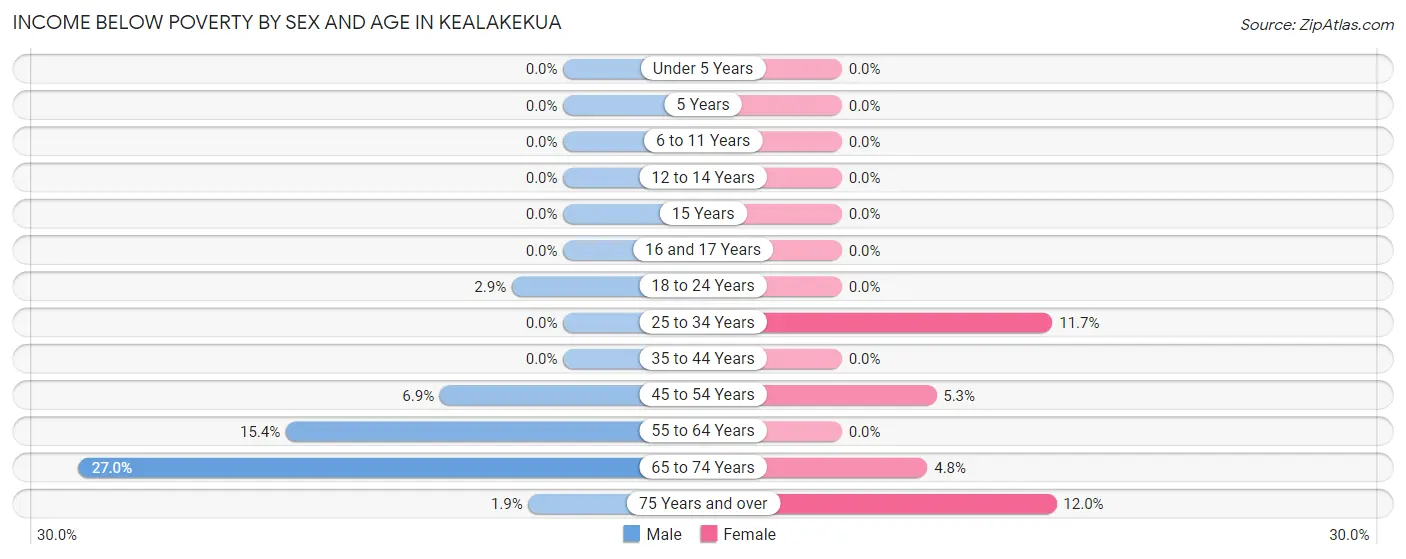
| Age Bracket | Male | Female |
| Under 5 Years | 0 (0.0%) | 0 (0.0%) |
| 5 Years | 0 (0.0%) | 0 (0.0%) |
| 6 to 11 Years | 0 (0.0%) | 0 (0.0%) |
| 12 to 14 Years | 0 (0.0%) | 0 (0.0%) |
| 15 Years | 0 (0.0%) | 0 (0.0%) |
| 16 and 17 Years | 0 (0.0%) | 0 (0.0%) |
| 18 to 24 Years | 1 (2.9%) | 0 (0.0%) |
| 25 to 34 Years | 0 (0.0%) | 17 (11.7%) |
| 35 to 44 Years | 0 (0.0%) | 0 (0.0%) |
| 45 to 54 Years | 9 (6.9%) | 7 (5.3%) |
| 55 to 64 Years | 23 (15.4%) | 0 (0.0%) |
| 65 to 74 Years | 34 (27.0%) | 9 (4.8%) |
| 75 Years and over | 2 (1.9%) | 19 (11.9%) |
| Total | 69 (6.6%) | 52 (4.8%) |
Income Above Poverty by Sex and Age in Kealakekua
According to the poverty statistics in Kealakekua, males aged under 5 years and females aged under 5 years are the age groups that are most secure financially, with 100.0% of males and 100.0% of females in these age groups living above the poverty line.
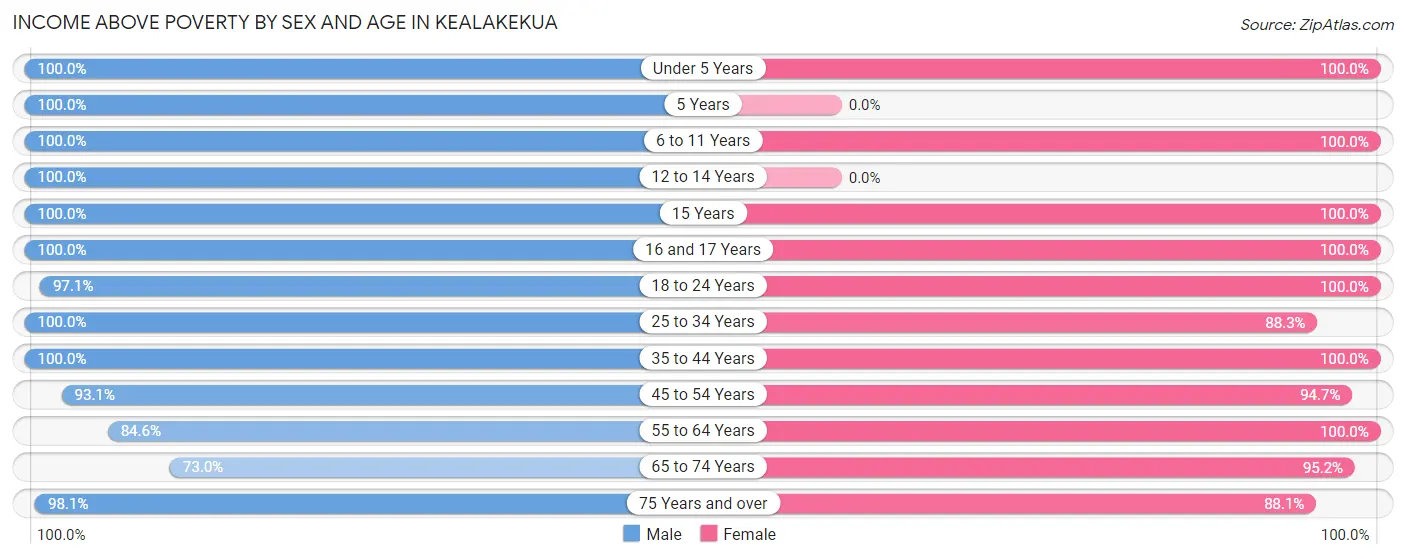
| Age Bracket | Male | Female |
| Under 5 Years | 43 (100.0%) | 46 (100.0%) |
| 5 Years | 44 (100.0%) | 0 (0.0%) |
| 6 to 11 Years | 77 (100.0%) | 90 (100.0%) |
| 12 to 14 Years | 40 (100.0%) | 0 (0.0%) |
| 15 Years | 28 (100.0%) | 31 (100.0%) |
| 16 and 17 Years | 4 (100.0%) | 25 (100.0%) |
| 18 to 24 Years | 34 (97.1%) | 50 (100.0%) |
| 25 to 34 Years | 151 (100.0%) | 128 (88.3%) |
| 35 to 44 Years | 109 (100.0%) | 108 (100.0%) |
| 45 to 54 Years | 122 (93.1%) | 126 (94.7%) |
| 55 to 64 Years | 126 (84.6%) | 116 (100.0%) |
| 65 to 74 Years | 92 (73.0%) | 180 (95.2%) |
| 75 Years and over | 101 (98.1%) | 140 (88.0%) |
| Total | 971 (93.4%) | 1,040 (95.2%) |
Income Below Poverty Among Married-Couple Families in Kealakekua
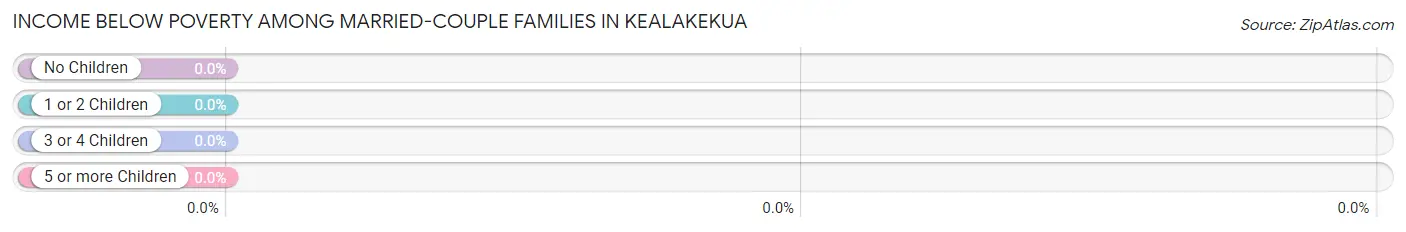
| Children | Above Poverty | Below Poverty |
| No Children | 171 (100.0%) | 0 (0.0%) |
| 1 or 2 Children | 79 (100.0%) | 0 (0.0%) |
| 3 or 4 Children | 51 (100.0%) | 0 (0.0%) |
| 5 or more Children | 0 (0.0%) | 0 (0.0%) |
| Total | 301 (100.0%) | 0 (0.0%) |
Income Below Poverty Among Single-Parent Households in Kealakekua
| Children | Single Father | Single Mother |
| No Children | 0 (0.0%) | 0 (0.0%) |
| 1 or 2 Children | 0 (0.0%) | 0 (0.0%) |
| 3 or 4 Children | 0 (0.0%) | 0 (0.0%) |
| 5 or more Children | 0 (0.0%) | 0 (0.0%) |
| Total | 0 (0.0%) | 0 (0.0%) |
Income Below Poverty Among Married-Couple vs Single-Parent Households in Kealakekua
| Children | Married-Couple Families | Single-Parent Households |
| No Children | 0 (0.0%) | 0 (0.0%) |
| 1 or 2 Children | 0 (0.0%) | 0 (0.0%) |
| 3 or 4 Children | 0 (0.0%) | 0 (0.0%) |
| 5 or more Children | 0 (0.0%) | 0 (0.0%) |
| Total | 0 (0.0%) | 0 (0.0%) |
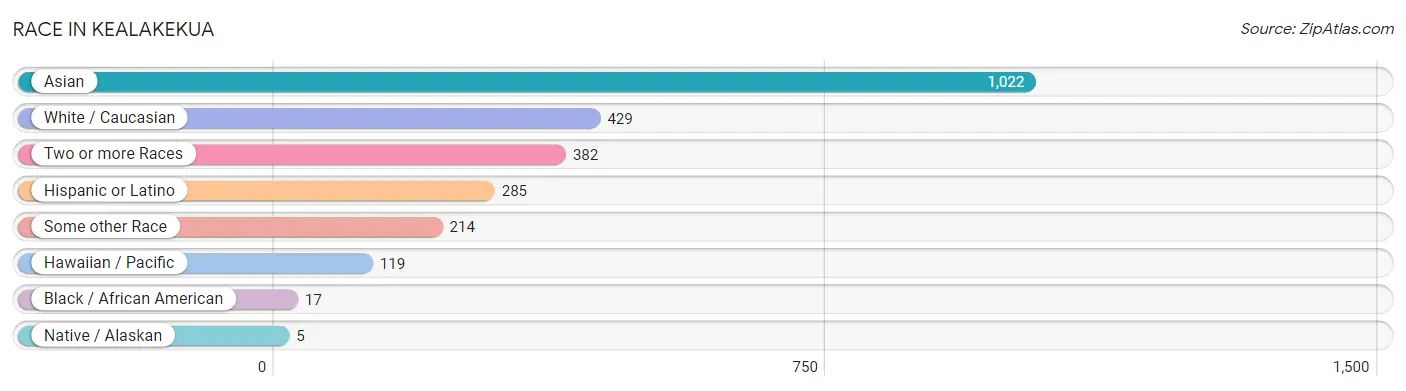
Race in Kealakekua
The most populous races in Kealakekua are Asian (1,022 | 46.7%), White / Caucasian (429 | 19.6%), and Two or more Races (382 | 17.5%).
| Race | # Population | % Population |
| Asian | 1,022 | 46.7% |
| Black / African American | 17 | 0.8% |
| Hawaiian / Pacific | 119 | 5.4% |
| Hispanic or Latino | 285 | 13.0% |
| Native / Alaskan | 5 | 0.2% |
| White / Caucasian | 429 | 19.6% |
| Two or more Races | 382 | 17.5% |
| Some other Race | 214 | 9.8% |
| Total | 2,188 | 100.0% |
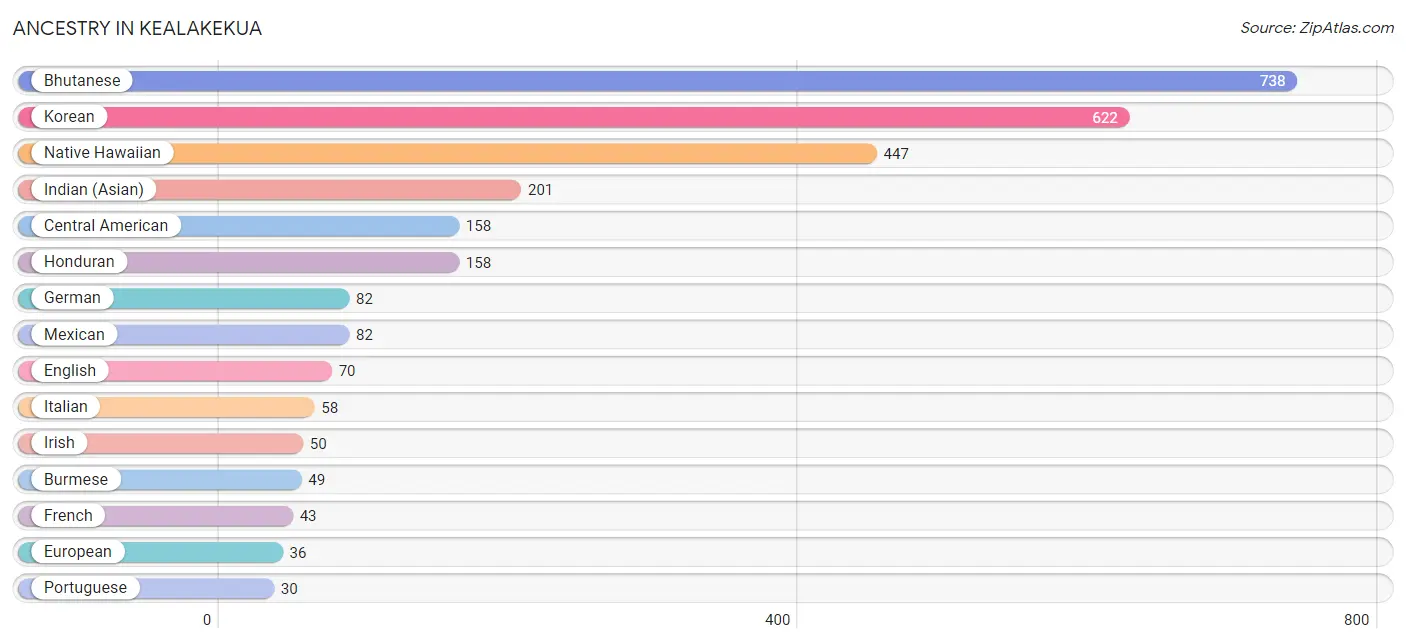
Ancestry in Kealakekua
The most populous ancestries reported in Kealakekua are Bhutanese (738 | 33.7%), Korean (622 | 28.4%), Native Hawaiian (447 | 20.4%), Indian (Asian) (201 | 9.2%), and Central American (158 | 7.2%), together accounting for 99.0% of all Kealakekua residents.
| Ancestry | # Population | % Population |
| American | 7 | 0.3% |
| Bhutanese | 738 | 33.7% |
| Brazilian | 8 | 0.4% |
| British | 4 | 0.2% |
| Burmese | 49 | 2.2% |
| Central American | 158 | 7.2% |
| Cherokee | 3 | 0.1% |
| Cuban | 17 | 0.8% |
| Czech | 4 | 0.2% |
| Eastern European | 10 | 0.5% |
| English | 70 | 3.2% |
| European | 36 | 1.7% |
| French | 43 | 2.0% |
| German | 82 | 3.7% |
| Honduran | 158 | 7.2% |
| Indian (Asian) | 201 | 9.2% |
| Irish | 50 | 2.3% |
| Italian | 58 | 2.6% |
| Korean | 622 | 28.4% |
| Malaysian | 25 | 1.1% |
| Mexican | 82 | 3.7% |
| Native Hawaiian | 447 | 20.4% |
| Norwegian | 8 | 0.4% |
| Portuguese | 30 | 1.4% |
| Puerto Rican | 20 | 0.9% |
| Samoan | 6 | 0.3% |
| Scottish | 7 | 0.3% |
| Sioux | 7 | 0.3% |
| Spaniard | 8 | 0.4% |
| Sri Lankan | 2 | 0.1% |
| Swedish | 13 | 0.6% |
| Thai | 9 | 0.4% |
| Ukrainian | 7 | 0.3% |
| Welsh | 25 | 1.1% | View All 34 Rows |
Immigrants in Kealakekua
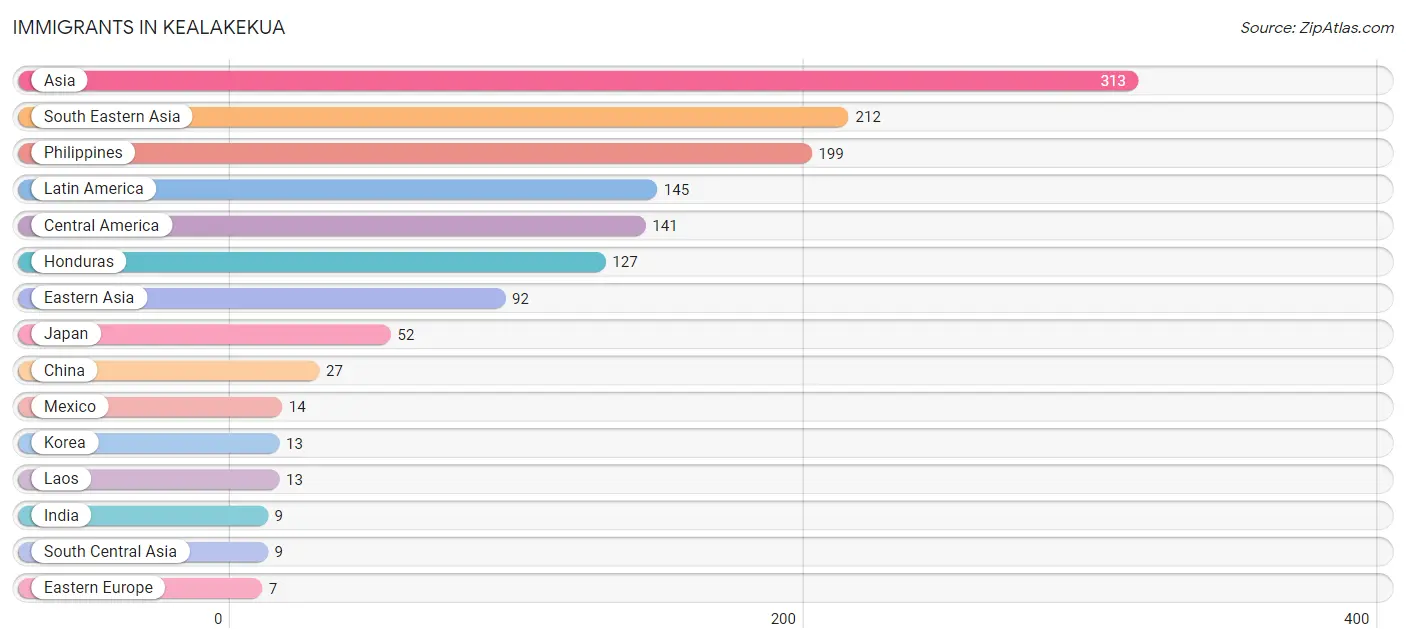
The most numerous immigrant groups reported in Kealakekua came from Asia (313 | 14.3%), South Eastern Asia (212 | 9.7%), Philippines (199 | 9.1%), Latin America (145 | 6.6%), and Central America (141 | 6.4%), together accounting for 46.2% of all Kealakekua residents.
| Immigration Origin | # Population | % Population |
| Africa | 2 | 0.1% |
| Asia | 313 | 14.3% |
| Brazil | 4 | 0.2% |
| Canada | 3 | 0.1% |
| Central America | 141 | 6.4% |
| China | 27 | 1.2% |
| Czechoslovakia | 4 | 0.2% |
| Eastern Asia | 92 | 4.2% |
| Eastern Europe | 7 | 0.3% |
| Europe | 7 | 0.3% |
| Honduras | 127 | 5.8% |
| India | 9 | 0.4% |
| Japan | 52 | 2.4% |
| Korea | 13 | 0.6% |
| Laos | 13 | 0.6% |
| Latin America | 145 | 6.6% |
| Liberia | 2 | 0.1% |
| Mexico | 14 | 0.6% |
| Oceania | 1 | 0.1% |
| Philippines | 199 | 9.1% |
| Russia | 3 | 0.1% |
| South America | 4 | 0.2% |
| South Central Asia | 9 | 0.4% |
| South Eastern Asia | 212 | 9.7% |
| Western Africa | 2 | 0.1% | View All 25 Rows |
Sex and Age in Kealakekua
Sex and Age in Kealakekua
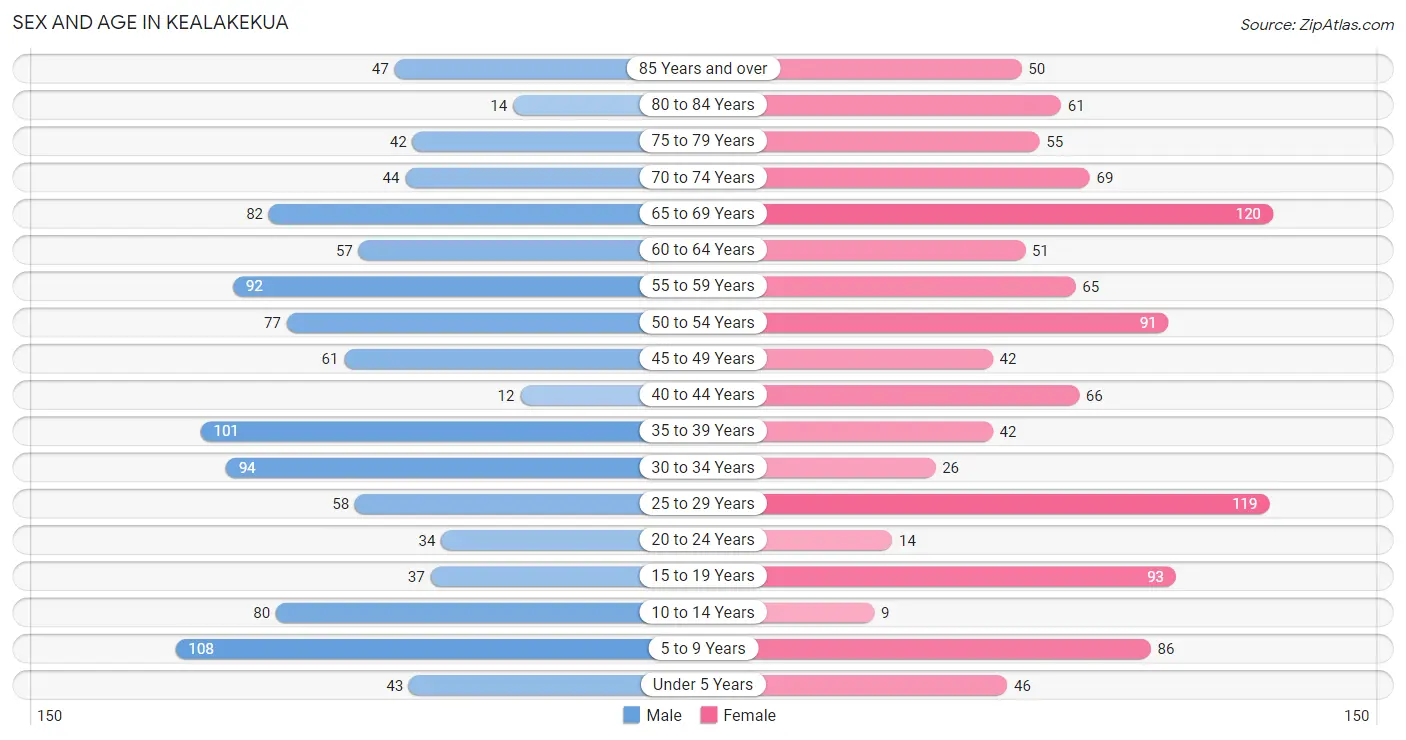
The most populous age groups in Kealakekua are 5 to 9 Years (108 | 10.0%) for men and 65 to 69 Years (120 | 10.9%) for women.
| Age Bracket | Male | Female |
| Under 5 Years | 43 (4.0%) | 46 (4.2%) |
| 5 to 9 Years | 108 (10.0%) | 86 (7.8%) |
| 10 to 14 Years | 80 (7.4%) | 9 (0.8%) |
| 15 to 19 Years | 37 (3.4%) | 93 (8.4%) |
| 20 to 24 Years | 34 (3.1%) | 14 (1.3%) |
| 25 to 29 Years | 58 (5.4%) | 119 (10.8%) |
| 30 to 34 Years | 94 (8.7%) | 26 (2.4%) |
| 35 to 39 Years | 101 (9.3%) | 42 (3.8%) |
| 40 to 44 Years | 12 (1.1%) | 66 (6.0%) |
| 45 to 49 Years | 61 (5.6%) | 42 (3.8%) |
| 50 to 54 Years | 77 (7.1%) | 91 (8.2%) |
| 55 to 59 Years | 92 (8.5%) | 65 (5.9%) |
| 60 to 64 Years | 57 (5.3%) | 51 (4.6%) |
| 65 to 69 Years | 82 (7.6%) | 120 (10.9%) |
| 70 to 74 Years | 44 (4.1%) | 69 (6.2%) |
| 75 to 79 Years | 42 (3.9%) | 55 (5.0%) |
| 80 to 84 Years | 14 (1.3%) | 61 (5.5%) |
| 85 Years and over | 47 (4.3%) | 50 (4.5%) |
| Total | 1,083 (100.0%) | 1,105 (100.0%) |
Families and Households in Kealakekua
Median Family Size in Kealakekua
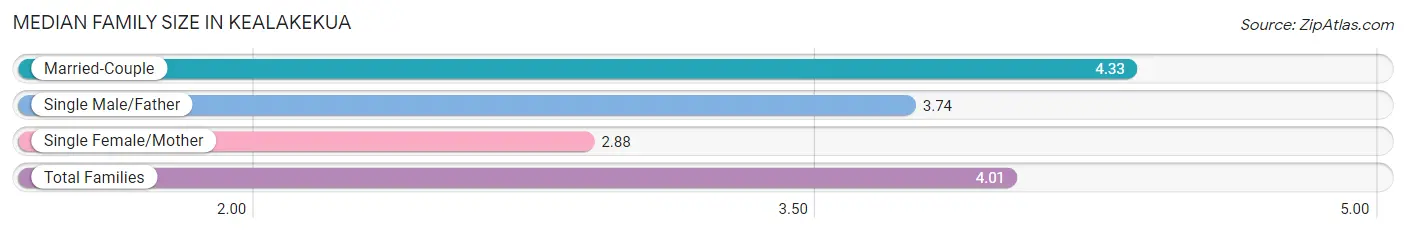
The median family size in Kealakekua is 4.01 persons per family, with married-couple families (301 | 72.9%) accounting for the largest median family size of 4.33 persons per family. On the other hand, single female/mother families (77 | 18.6%) represent the smallest median family size with 2.88 persons per family.
| Family Type | # Families | Family Size |
| Married-Couple | 301 (72.9%) | 4.33 |
| Single Male/Father | 35 (8.5%) | 3.74 |
| Single Female/Mother | 77 (18.6%) | 2.88 |
| Total Families | 413 (100.0%) | 4.01 |
Median Household Size in Kealakekua
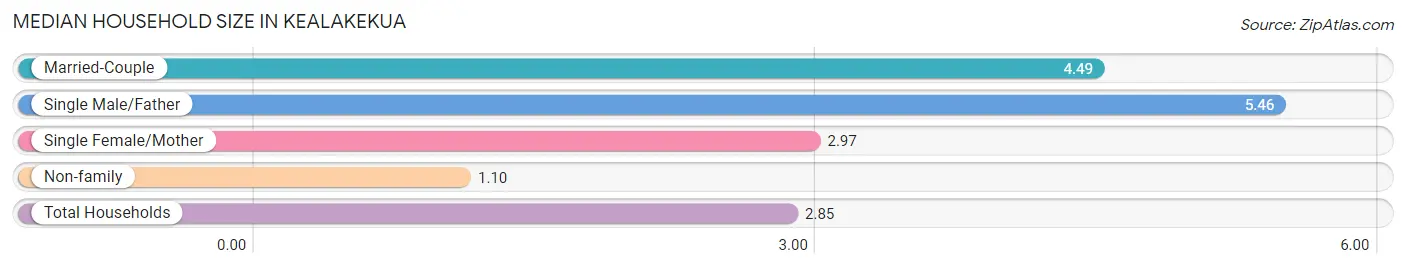
The median household size in Kealakekua is 2.85 persons per household, with single male/father households (35 | 4.7%) accounting for the largest median household size of 5.46 persons per household. non-family households (338 | 45.0%) represent the smallest median household size with 1.10 persons per household.
| Household Type | # Households | Household Size |
| Married-Couple | 301 (40.1%) | 4.49 |
| Single Male/Father | 35 (4.7%) | 5.46 |
| Single Female/Mother | 77 (10.2%) | 2.97 |
| Non-family | 338 (45.0%) | 1.10 |
| Total Households | 751 (100.0%) | 2.85 |
Household Size by Marriage Status in Kealakekua
Out of a total of 751 households in Kealakekua, 413 (55.0%) are family households, while 338 (45.0%) are nonfamily households. The most numerous type of family households are 2-person households, comprising 163, and the most common type of nonfamily households are 1-person households, comprising 299.
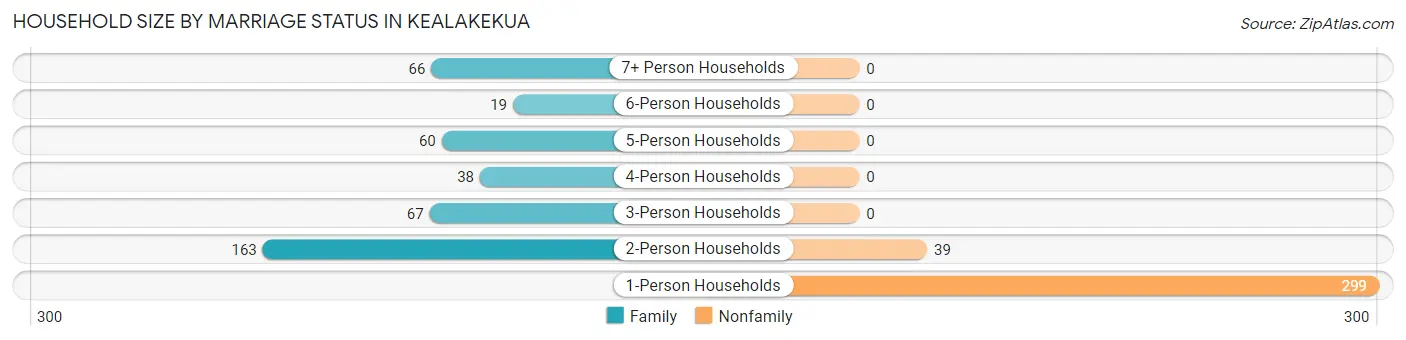
| Household Size | Family Households | Nonfamily Households |
| 1-Person Households | - | 299 (39.8%) |
| 2-Person Households | 163 (21.7%) | 39 (5.2%) |
| 3-Person Households | 67 (8.9%) | 0 (0.0%) |
| 4-Person Households | 38 (5.1%) | 0 (0.0%) |
| 5-Person Households | 60 (8.0%) | 0 (0.0%) |
| 6-Person Households | 19 (2.5%) | 0 (0.0%) |
| 7+ Person Households | 66 (8.8%) | 0 (0.0%) |
| Total | 413 (55.0%) | 338 (45.0%) |
Female Fertility in Kealakekua
Fertility by Age in Kealakekua
| Age Bracket | Women with Births | Births / 1,000 Women |
| 15 to 19 years | 0 (0.0%) | 0.0 |
| 20 to 34 years | 0 (0.0%) | 0.0 |
| 35 to 50 years | 0 (0.0%) | 0.0 |
| Total | 0 (0.0%) | 0.0 |
Fertility by Age by Marriage Status in Kealakekua
| Age Bracket | Married | Unmarried |
| 15 to 19 years | 0 (0.0%) | 0 (0.0%) |
| 20 to 34 years | 0 (0.0%) | 0 (0.0%) |
| 35 to 50 years | 0 (0.0%) | 0 (0.0%) |
| Total | 0 (0.0%) | 0 (0.0%) |
Fertility by Education in Kealakekua
| Educational Attainment | Women with Births | Births / 1,000 Women |
| Less than High School | 0 (0.0%) | 0.0 |
| High School Diploma | 0 (0.0%) | 0.0 |
| College or Associate's Degree | 0 (0.0%) | 0.0 |
| Bachelor's Degree | 0 (0.0%) | 0.0 |
| Graduate Degree | 0 (0.0%) | 0.0 |
| Total | 0 (0.0%) | 0.0 |
Fertility by Education by Marriage Status in Kealakekua
| Educational Attainment | Married | Unmarried |
| Less than High School | 0 (0.0%) | 0 (0.0%) |
| High School Diploma | 0 (0.0%) | 0 (0.0%) |
| College or Associate's Degree | 0 (0.0%) | 0 (0.0%) |
| Bachelor's Degree | 0 (0.0%) | 0 (0.0%) |
| Graduate Degree | 0 (0.0%) | 0 (0.0%) |
| Total | 0 (0.0%) | 0 (0.0%) |
Employment Characteristics in Kealakekua
Employment by Class of Employer in Kealakekua
Among the 928 employed individuals in Kealakekua, private company employees (575 | 62.0%), state government employees (103 | 11.1%), and not-for-profit organizations (71 | 7.6%) make up the most common classes of employment.
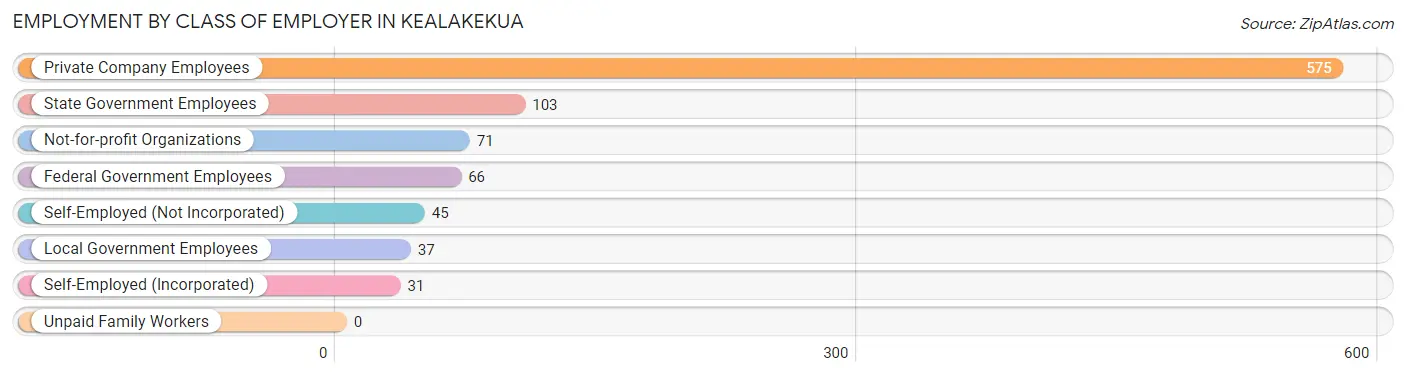
| Employer Class | # Employees | % Employees |
| Private Company Employees | 575 | 62.0% |
| Self-Employed (Incorporated) | 31 | 3.3% |
| Self-Employed (Not Incorporated) | 45 | 4.9% |
| Not-for-profit Organizations | 71 | 7.6% |
| Local Government Employees | 37 | 4.0% |
| State Government Employees | 103 | 11.1% |
| Federal Government Employees | 66 | 7.1% |
| Unpaid Family Workers | 0 | 0.0% |
| Total | 928 | 100.0% |
Employment Status by Age in Kealakekua
According to the labor force statistics for Kealakekua, out of the total population over 16 years of age (1,757), 57.1% or 1,003 individuals are in the labor force, with 1.9% or 19 of them unemployed. The age group with the highest labor force participation rate is 20 to 24 years, with 91.7% or 44 individuals in the labor force. Within the labor force, the 20 to 24 years age range has the highest percentage of unemployed individuals, with 31.8% or 14 of them being unemployed.
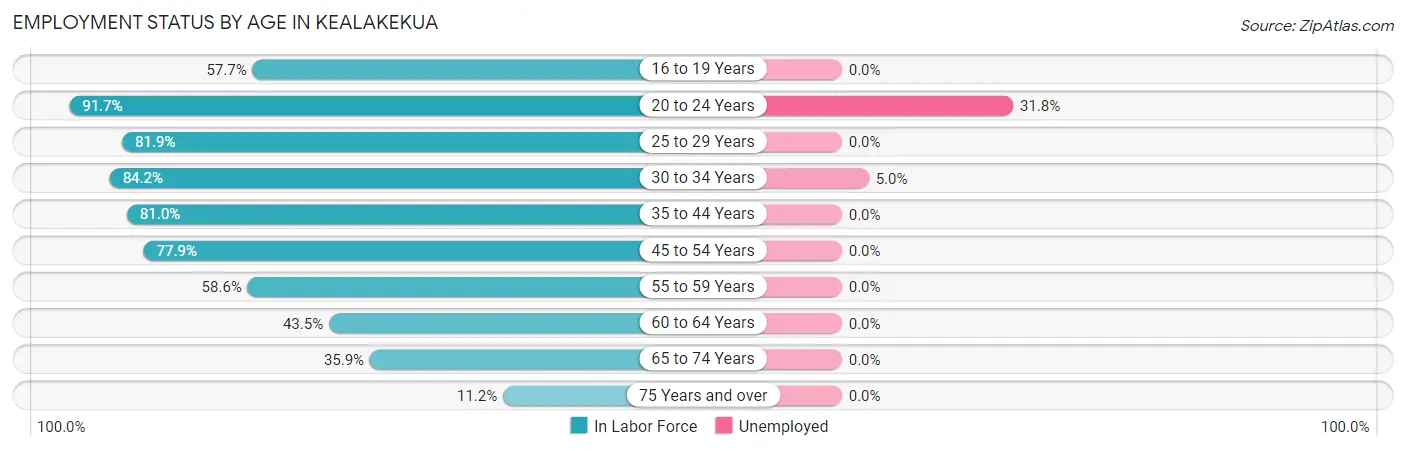
| Age Bracket | In Labor Force | Unemployed |
| 16 to 19 Years | 41 (57.7%) | 0 (0.0%) |
| 20 to 24 Years | 44 (91.7%) | 14 (31.8%) |
| 25 to 29 Years | 145 (81.9%) | 0 (0.0%) |
| 30 to 34 Years | 101 (84.2%) | 5 (5.0%) |
| 35 to 44 Years | 179 (81.0%) | 0 (0.0%) |
| 45 to 54 Years | 211 (77.9%) | 0 (0.0%) |
| 55 to 59 Years | 92 (58.6%) | 0 (0.0%) |
| 60 to 64 Years | 47 (43.5%) | 0 (0.0%) |
| 65 to 74 Years | 113 (35.9%) | 0 (0.0%) |
| 75 Years and over | 30 (11.2%) | 0 (0.0%) |
| Total | 1,003 (57.1%) | 19 (1.9%) |
Employment Status by Educational Attainment in Kealakekua
According to labor force statistics for Kealakekua, 73.5% of individuals (775) out of the total population between 25 and 64 years of age (1,054) are in the labor force, with 0.6% or 5 of them being unemployed. The group with the highest labor force participation rate are those with the educational attainment of high school diploma, with 86.9% or 284 individuals in the labor force. Within the labor force, individuals with bachelor's degree or higher education have the highest percentage of unemployment, with 2.3% or 5 of them being unemployed.
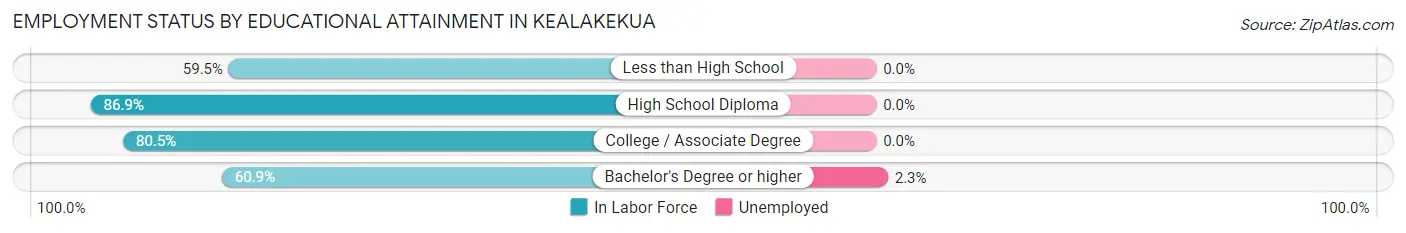
| Educational Attainment | In Labor Force | Unemployed |
| Less than High School | 72 (59.5%) | 0 (0.0%) |
| High School Diploma | 284 (86.9%) | 0 (0.0%) |
| College / Associate Degree | 206 (80.5%) | 0 (0.0%) |
| Bachelor's Degree or higher | 213 (60.9%) | 8 (2.3%) |
| Total | 775 (73.5%) | 6 (0.6%) |
Employment Occupations by Sex in Kealakekua
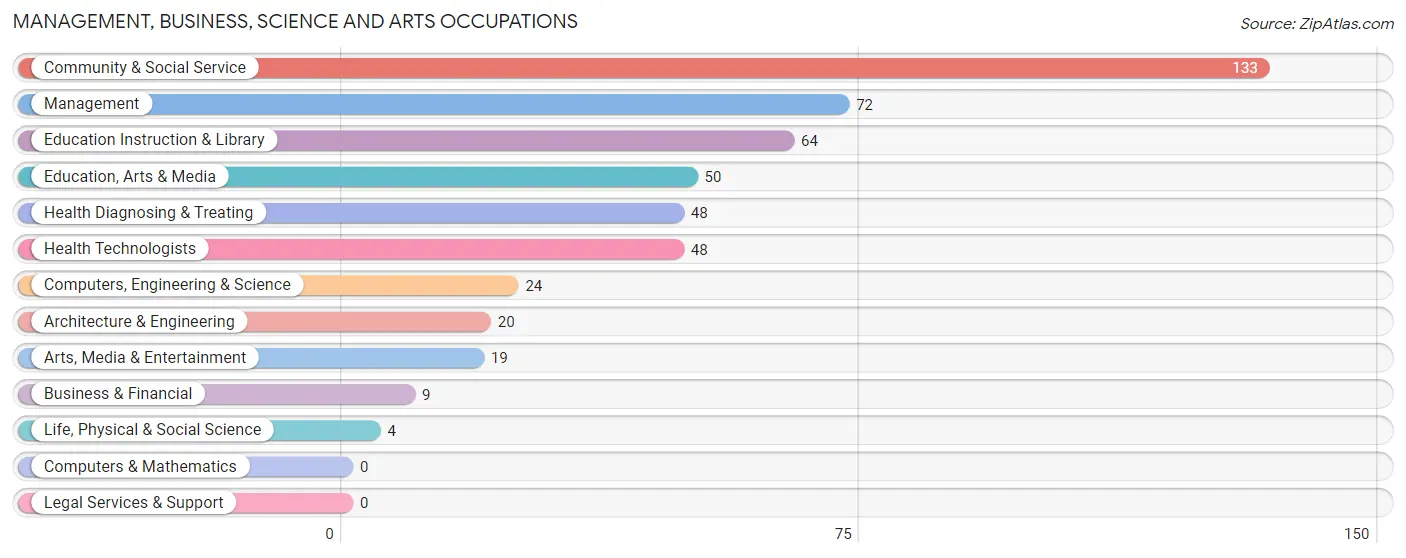
Management, Business, Science and Arts Occupations
The most common Management, Business, Science and Arts occupations in Kealakekua are Community & Social Service (133 | 13.5%), Management (72 | 7.3%), Education Instruction & Library (64 | 6.5%), Education, Arts & Media (50 | 5.1%), and Health Diagnosing & Treating (48 | 4.9%).
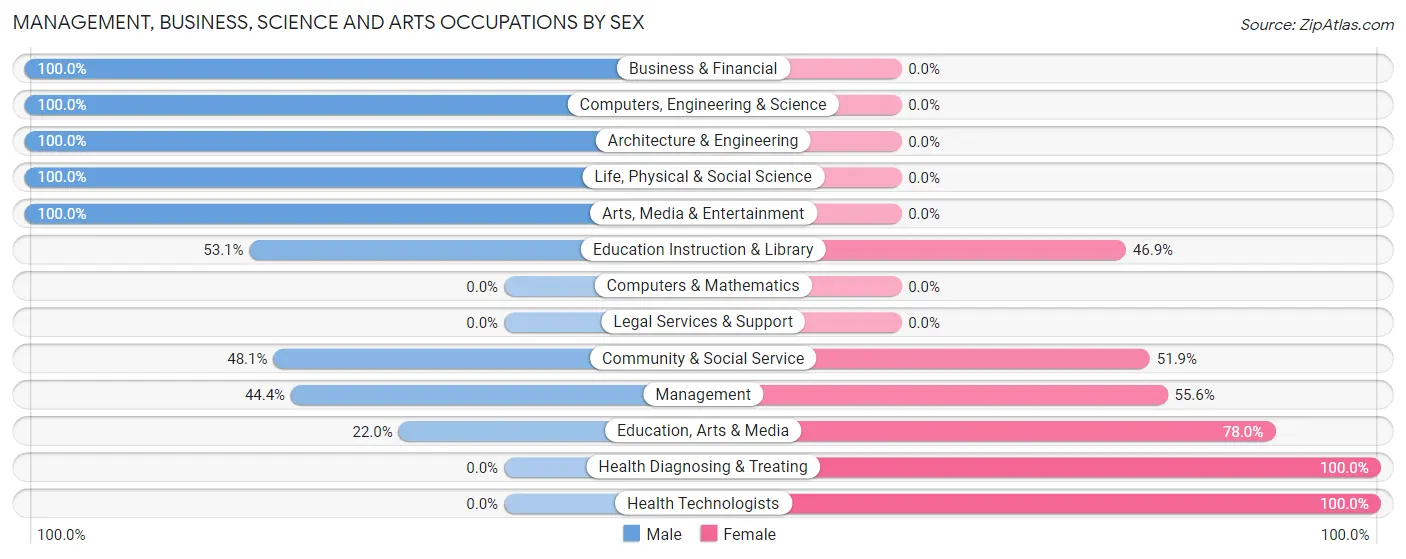
Management, Business, Science and Arts Occupations by Sex
Within the Management, Business, Science and Arts occupations in Kealakekua, the most male-oriented occupations are Business & Financial (100.0%), Computers, Engineering & Science (100.0%), and Architecture & Engineering (100.0%), while the most female-oriented occupations are Health Diagnosing & Treating (100.0%), Health Technologists (100.0%), and Education, Arts & Media (78.0%).
| Occupation | Male | Female |
| Management | 32 (44.4%) | 40 (55.6%) |
| Business & Financial | 9 (100.0%) | 0 (0.0%) |
| Computers, Engineering & Science | 24 (100.0%) | 0 (0.0%) |
| Computers & Mathematics | 0 (0.0%) | 0 (0.0%) |
| Architecture & Engineering | 20 (100.0%) | 0 (0.0%) |
| Life, Physical & Social Science | 4 (100.0%) | 0 (0.0%) |
| Community & Social Service | 64 (48.1%) | 69 (51.9%) |
| Education, Arts & Media | 11 (22.0%) | 39 (78.0%) |
| Legal Services & Support | 0 (0.0%) | 0 (0.0%) |
| Education Instruction & Library | 34 (53.1%) | 30 (46.9%) |
| Arts, Media & Entertainment | 19 (100.0%) | 0 (0.0%) |
| Health Diagnosing & Treating | 0 (0.0%) | 48 (100.0%) |
| Health Technologists | 0 (0.0%) | 48 (100.0%) |
| Total (Category) | 129 (45.1%) | 157 (54.9%) |
| Total (Overall) | 466 (47.4%) | 518 (52.6%) |
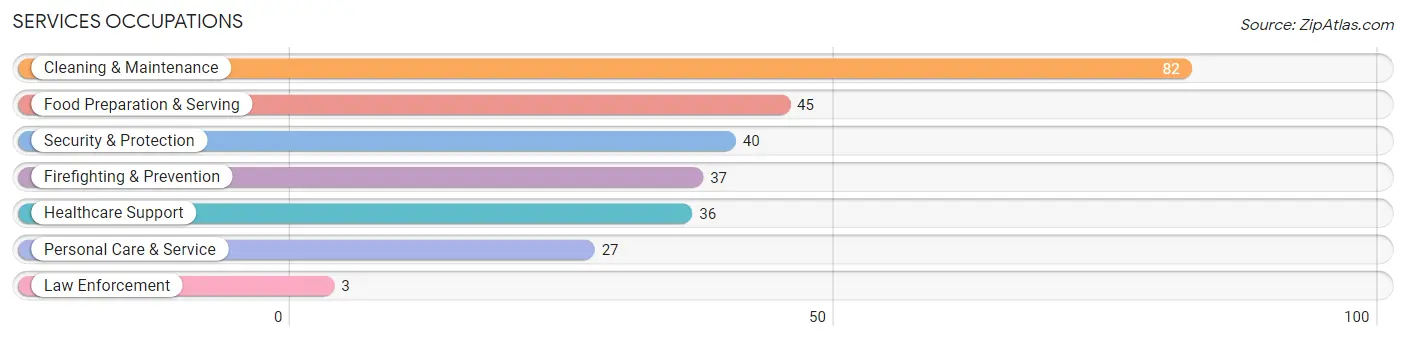
Services Occupations
The most common Services occupations in Kealakekua are Cleaning & Maintenance (82 | 8.3%), Food Preparation & Serving (45 | 4.6%), Security & Protection (40 | 4.1%), Firefighting & Prevention (37 | 3.8%), and Healthcare Support (36 | 3.7%).
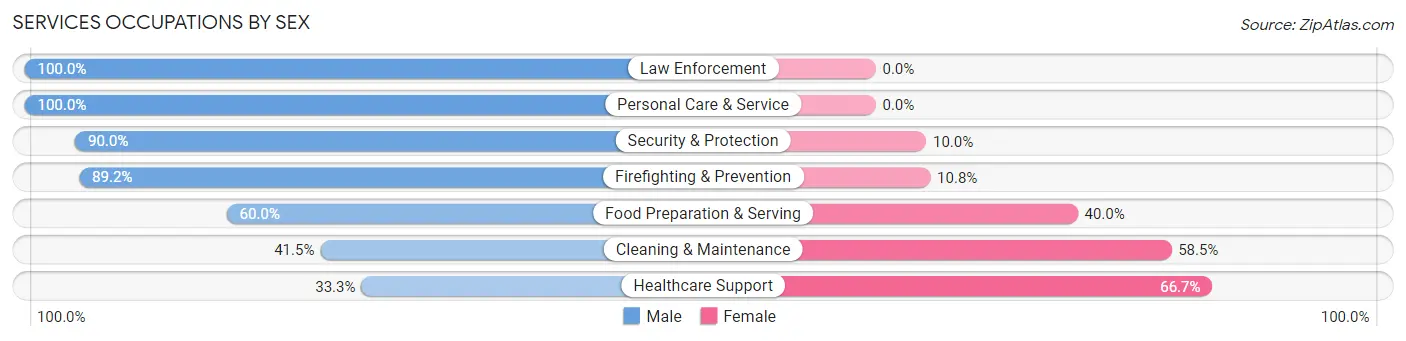
Services Occupations by Sex
Within the Services occupations in Kealakekua, the most male-oriented occupations are Law Enforcement (100.0%), Personal Care & Service (100.0%), and Security & Protection (90.0%), while the most female-oriented occupations are Healthcare Support (66.7%), Cleaning & Maintenance (58.5%), and Food Preparation & Serving (40.0%).
| Occupation | Male | Female |
| Healthcare Support | 12 (33.3%) | 24 (66.7%) |
| Security & Protection | 36 (90.0%) | 4 (10.0%) |
| Firefighting & Prevention | 33 (89.2%) | 4 (10.8%) |
| Law Enforcement | 3 (100.0%) | 0 (0.0%) |
| Food Preparation & Serving | 27 (60.0%) | 18 (40.0%) |
| Cleaning & Maintenance | 34 (41.5%) | 48 (58.5%) |
| Personal Care & Service | 27 (100.0%) | 0 (0.0%) |
| Total (Category) | 136 (59.1%) | 94 (40.9%) |
| Total (Overall) | 466 (47.4%) | 518 (52.6%) |
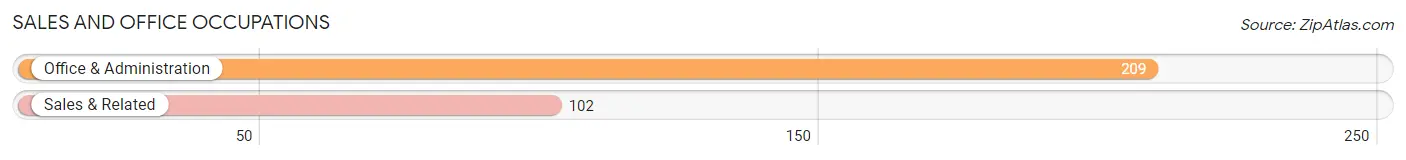
Sales and Office Occupations
The most common Sales and Office occupations in Kealakekua are Office & Administration (209 | 21.2%), and Sales & Related (102 | 10.4%).
Sales and Office Occupations by Sex
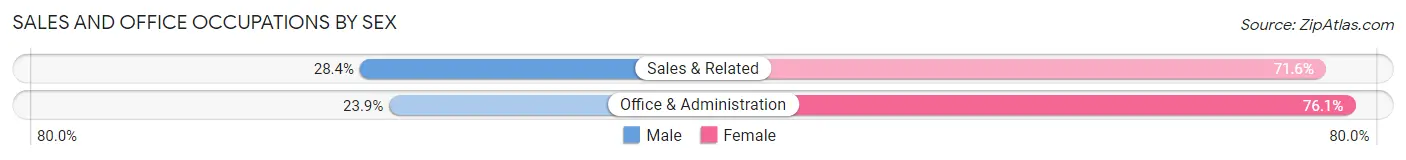
| Occupation | Male | Female |
| Sales & Related | 29 (28.4%) | 73 (71.6%) |
| Office & Administration | 50 (23.9%) | 159 (76.1%) |
| Total (Category) | 79 (25.4%) | 232 (74.6%) |
| Total (Overall) | 466 (47.4%) | 518 (52.6%) |
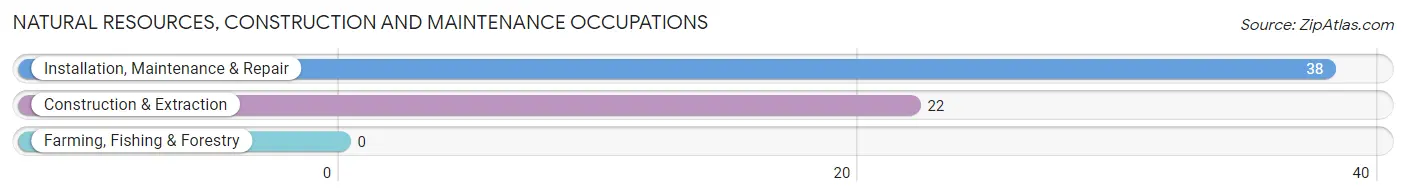
Natural Resources, Construction and Maintenance Occupations
The most common Natural Resources, Construction and Maintenance occupations in Kealakekua are Installation, Maintenance & Repair (38 | 3.9%), and Construction & Extraction (22 | 2.2%).
Natural Resources, Construction and Maintenance Occupations by Sex
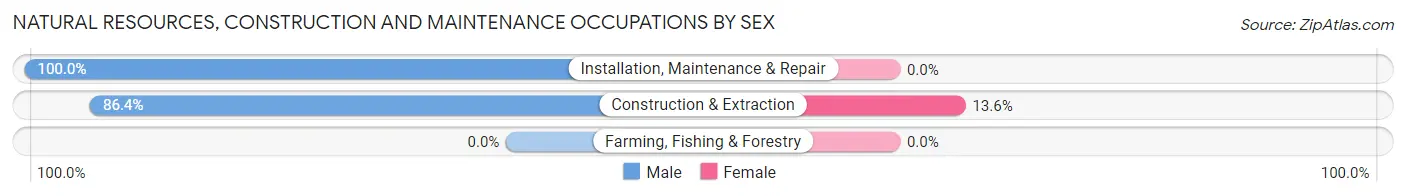
| Occupation | Male | Female |
| Farming, Fishing & Forestry | 0 (0.0%) | 0 (0.0%) |
| Construction & Extraction | 19 (86.4%) | 3 (13.6%) |
| Installation, Maintenance & Repair | 38 (100.0%) | 0 (0.0%) |
| Total (Category) | 57 (95.0%) | 3 (5.0%) |
| Total (Overall) | 466 (47.4%) | 518 (52.6%) |
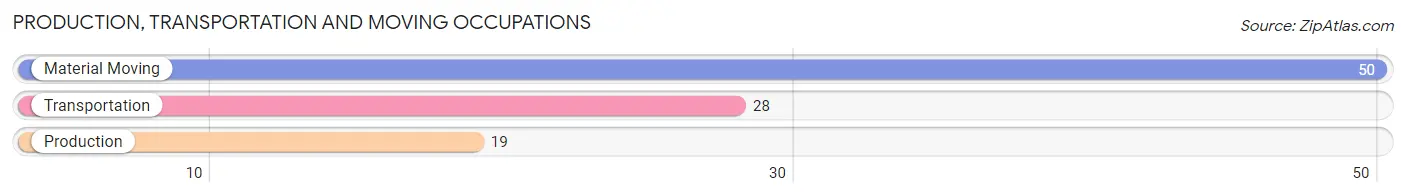
Production, Transportation and Moving Occupations
The most common Production, Transportation and Moving occupations in Kealakekua are Material Moving (50 | 5.1%), Transportation (28 | 2.9%), and Production (19 | 1.9%).
Production, Transportation and Moving Occupations by Sex
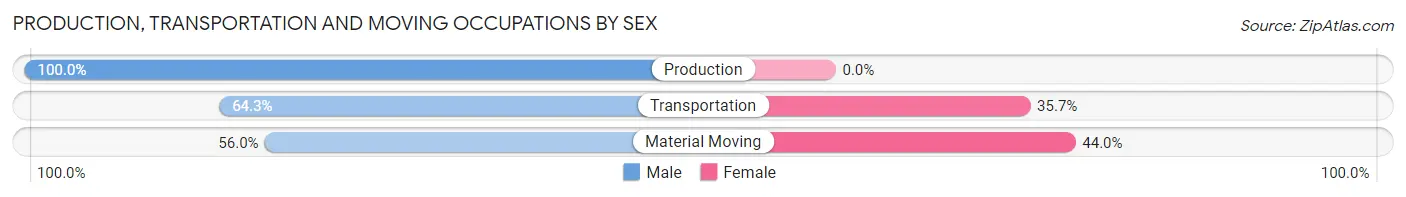
| Occupation | Male | Female |
| Production | 19 (100.0%) | 0 (0.0%) |
| Transportation | 18 (64.3%) | 10 (35.7%) |
| Material Moving | 28 (56.0%) | 22 (44.0%) |
| Total (Category) | 65 (67.0%) | 32 (33.0%) |
| Total (Overall) | 466 (47.4%) | 518 (52.6%) |
Employment Industries by Sex in Kealakekua
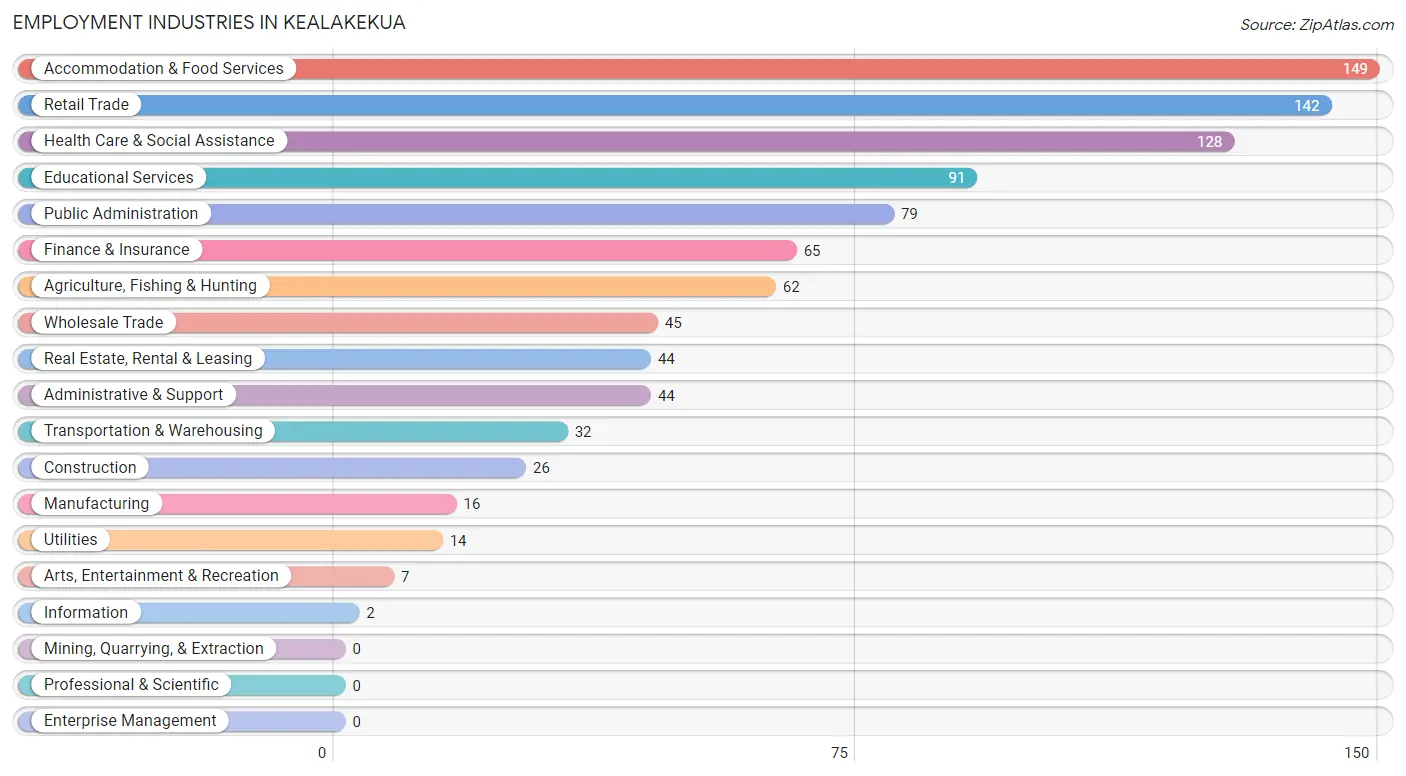
Employment Industries in Kealakekua
The major employment industries in Kealakekua include Accommodation & Food Services (149 | 15.1%), Retail Trade (142 | 14.4%), Health Care & Social Assistance (128 | 13.0%), Educational Services (91 | 9.2%), and Public Administration (79 | 8.0%).
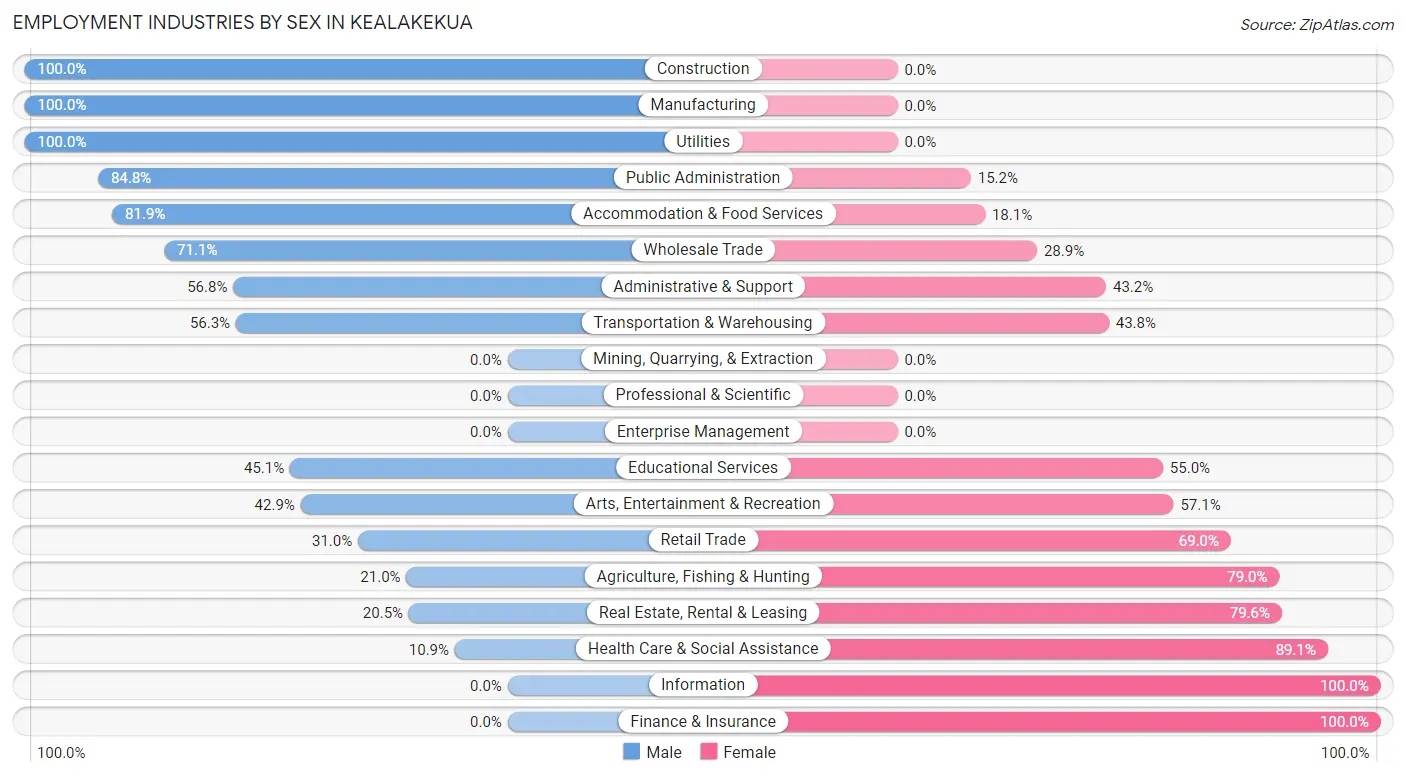
Employment Industries by Sex in Kealakekua
The Kealakekua industries that see more men than women are Construction (100.0%), Manufacturing (100.0%), and Utilities (100.0%), whereas the industries that tend to have a higher number of women are Information (100.0%), Finance & Insurance (100.0%), and Health Care & Social Assistance (89.1%).
| Industry | Male | Female |
| Agriculture, Fishing & Hunting | 13 (21.0%) | 49 (79.0%) |
| Mining, Quarrying, & Extraction | 0 (0.0%) | 0 (0.0%) |
| Construction | 26 (100.0%) | 0 (0.0%) |
| Manufacturing | 16 (100.0%) | 0 (0.0%) |
| Wholesale Trade | 32 (71.1%) | 13 (28.9%) |
| Retail Trade | 44 (31.0%) | 98 (69.0%) |
| Transportation & Warehousing | 18 (56.2%) | 14 (43.8%) |
| Utilities | 14 (100.0%) | 0 (0.0%) |
| Information | 0 (0.0%) | 2 (100.0%) |
| Finance & Insurance | 0 (0.0%) | 65 (100.0%) |
| Real Estate, Rental & Leasing | 9 (20.4%) | 35 (79.5%) |
| Professional & Scientific | 0 (0.0%) | 0 (0.0%) |
| Enterprise Management | 0 (0.0%) | 0 (0.0%) |
| Administrative & Support | 25 (56.8%) | 19 (43.2%) |
| Educational Services | 41 (45.1%) | 50 (54.9%) |
| Health Care & Social Assistance | 14 (10.9%) | 114 (89.1%) |
| Arts, Entertainment & Recreation | 3 (42.9%) | 4 (57.1%) |
| Accommodation & Food Services | 122 (81.9%) | 27 (18.1%) |
| Public Administration | 67 (84.8%) | 12 (15.2%) |
| Total | 466 (47.4%) | 518 (52.6%) |
Education in Kealakekua
School Enrollment in Kealakekua
The most common levels of schooling among the 498 students in Kealakekua are elementary school (175 | 35.1%), high school (118 | 23.7%), and college / undergraduate (107 | 21.5%).
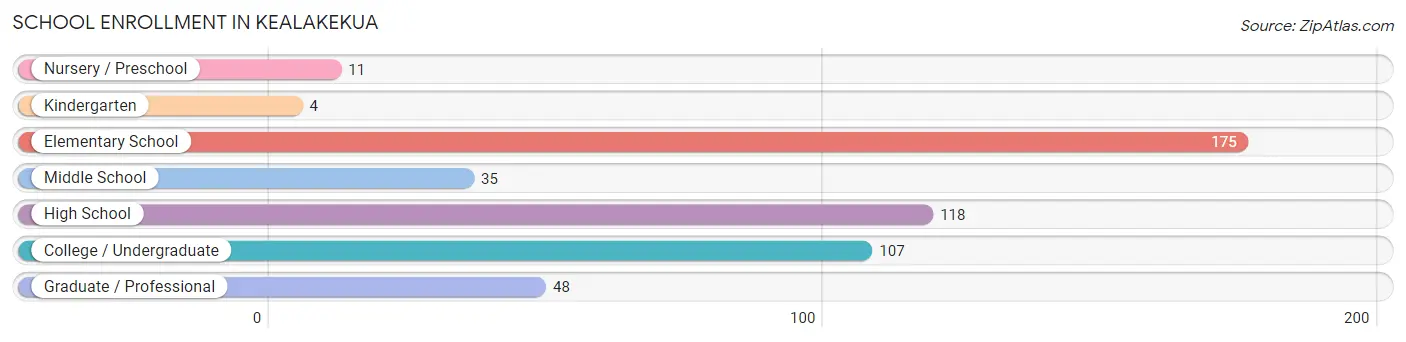
| School Level | # Students | % Students |
| Nursery / Preschool | 11 | 2.2% |
| Kindergarten | 4 | 0.8% |
| Elementary School | 175 | 35.1% |
| Middle School | 35 | 7.0% |
| High School | 118 | 23.7% |
| College / Undergraduate | 107 | 21.5% |
| Graduate / Professional | 48 | 9.6% |
| Total | 498 | 100.0% |
School Enrollment by Age by Funding Source in Kealakekua
Out of a total of 498 students who are enrolled in schools in Kealakekua, 67 (13.5%) attend a private institution, while the remaining 431 (86.5%) are enrolled in public schools. The age group of 20 to 24 year olds has the highest likelihood of being enrolled in private schools, with 1 (100.0% in the age bracket) enrolled. Conversely, the age group of 10 to 14 year olds has the lowest likelihood of being enrolled in a private school, with 89 (100.0% in the age bracket) attending a public institution.
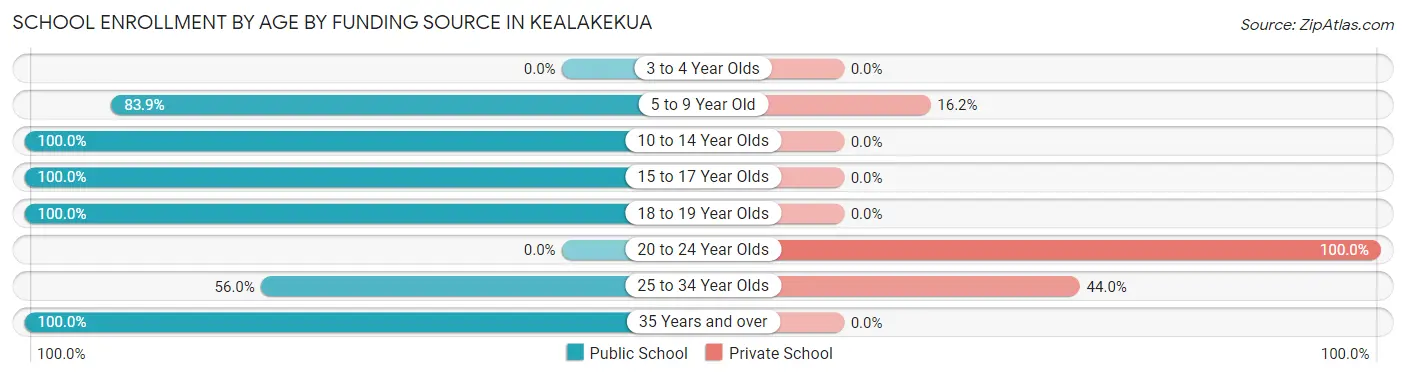
| Age Bracket | Public School | Private School |
| 3 to 4 Year Olds | 0 (0.0%) | 0 (0.0%) |
| 5 to 9 Year Old | 135 (83.9%) | 26 (16.2%) |
| 10 to 14 Year Olds | 89 (100.0%) | 0 (0.0%) |
| 15 to 17 Year Olds | 88 (100.0%) | 0 (0.0%) |
| 18 to 19 Year Olds | 35 (100.0%) | 0 (0.0%) |
| 20 to 24 Year Olds | 0 (0.0%) | 1 (100.0%) |
| 25 to 34 Year Olds | 51 (56.0%) | 40 (44.0%) |
| 35 Years and over | 33 (100.0%) | 0 (0.0%) |
| Total | 431 (86.5%) | 67 (13.5%) |
Educational Attainment by Field of Study in Kealakekua
Bio, nature & agricultural (97 | 17.0%), business (95 | 16.6%), science & technology (62 | 10.9%), literature & languages (61 | 10.7%), and social sciences (45 | 7.9%) are the most common fields of study among 571 individuals in Kealakekua who have obtained a bachelor's degree or higher.
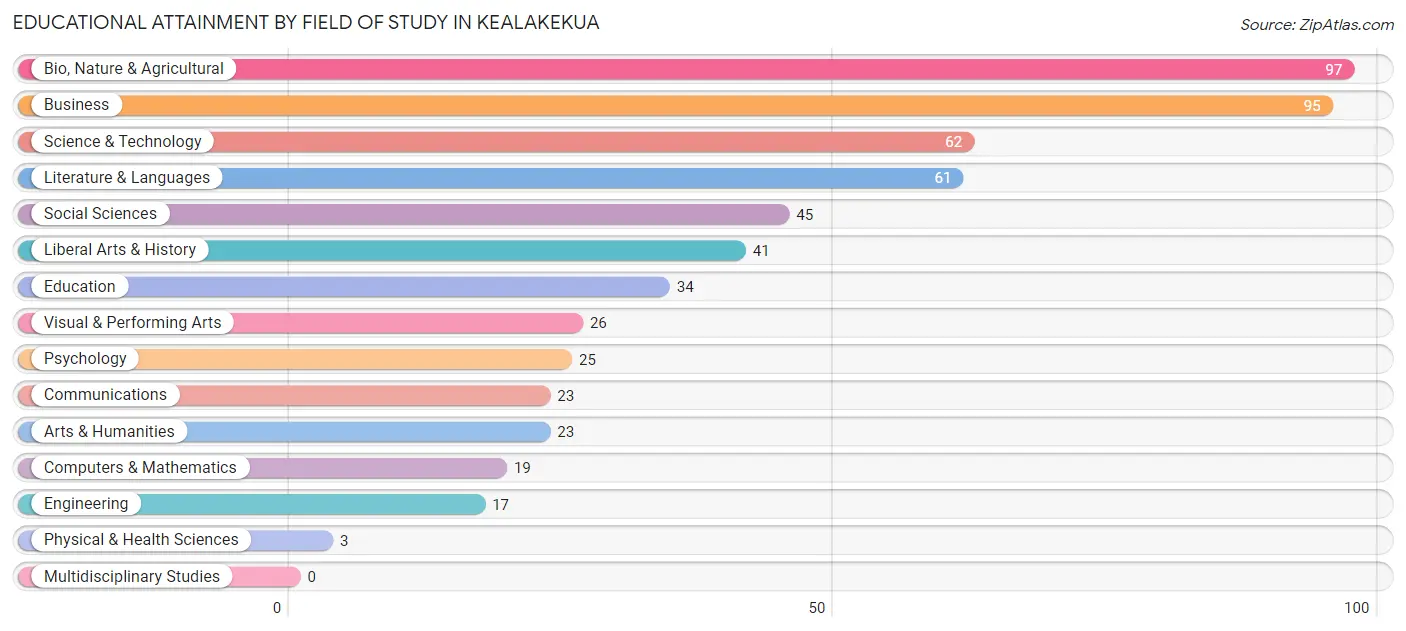
| Field of Study | # Graduates | % Graduates |
| Computers & Mathematics | 19 | 3.3% |
| Bio, Nature & Agricultural | 97 | 17.0% |
| Physical & Health Sciences | 3 | 0.5% |
| Psychology | 25 | 4.4% |
| Social Sciences | 45 | 7.9% |
| Engineering | 17 | 3.0% |
| Multidisciplinary Studies | 0 | 0.0% |
| Science & Technology | 62 | 10.9% |
| Business | 95 | 16.6% |
| Education | 34 | 5.9% |
| Literature & Languages | 61 | 10.7% |
| Liberal Arts & History | 41 | 7.2% |
| Visual & Performing Arts | 26 | 4.5% |
| Communications | 23 | 4.0% |
| Arts & Humanities | 23 | 4.0% |
| Total | 571 | 100.0% |
Transportation & Commute in Kealakekua
Vehicle Availability by Sex in Kealakekua
The most prevalent vehicle ownership categories in Kealakekua are males with 3 vehicles (147, accounting for 32.0%) and females with 3 vehicles (154, making up 31.6%).
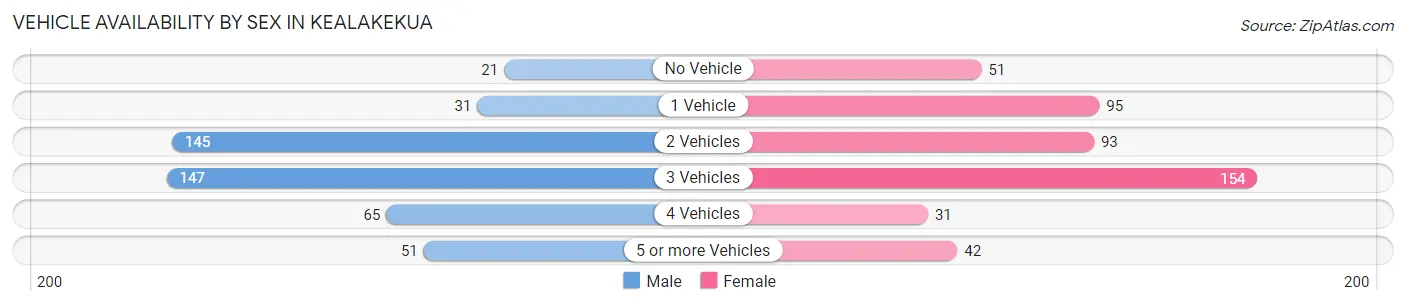
| Vehicles Available | Male | Female |
| No Vehicle | 21 (4.6%) | 51 (10.9%) |
| 1 Vehicle | 31 (6.7%) | 95 (20.4%) |
| 2 Vehicles | 145 (31.5%) | 93 (20.0%) |
| 3 Vehicles | 147 (32.0%) | 154 (33.1%) |
| 4 Vehicles | 65 (14.1%) | 31 (6.7%) |
| 5 or more Vehicles | 51 (11.1%) | 42 (9.0%) |
| Total | 460 (100.0%) | 466 (100.0%) |
Commute Time in Kealakekua
The most frequently occuring commute durations in Kealakekua are 30 to 34 minutes (233 commuters, 25.5%), 10 to 14 minutes (191 commuters, 20.9%), and 5 to 9 minutes (119 commuters, 13.0%).
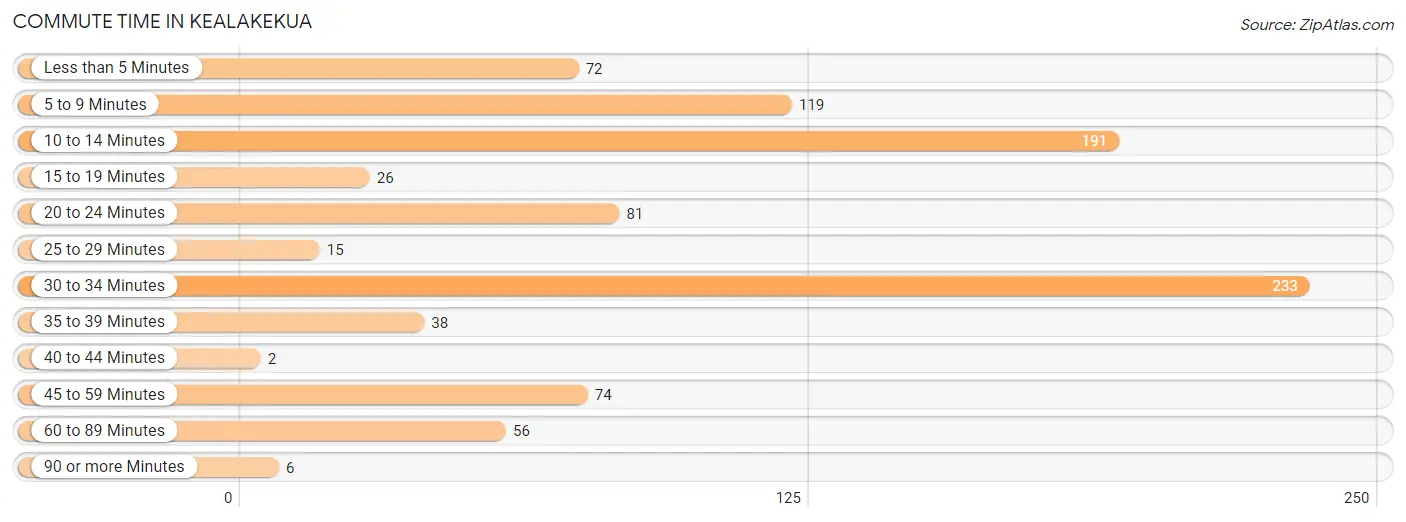
| Commute Time | # Commuters | % Commuters |
| Less than 5 Minutes | 72 | 7.9% |
| 5 to 9 Minutes | 119 | 13.0% |
| 10 to 14 Minutes | 191 | 20.9% |
| 15 to 19 Minutes | 26 | 2.9% |
| 20 to 24 Minutes | 81 | 8.9% |
| 25 to 29 Minutes | 15 | 1.6% |
| 30 to 34 Minutes | 233 | 25.5% |
| 35 to 39 Minutes | 38 | 4.2% |
| 40 to 44 Minutes | 2 | 0.2% |
| 45 to 59 Minutes | 74 | 8.1% |
| 60 to 89 Minutes | 56 | 6.1% |
| 90 or more Minutes | 6 | 0.7% |
Commute Time by Sex in Kealakekua
The most common commute times in Kealakekua are 30 to 34 minutes (153 commuters, 34.2%) for males and 10 to 14 minutes (144 commuters, 30.9%) for females.
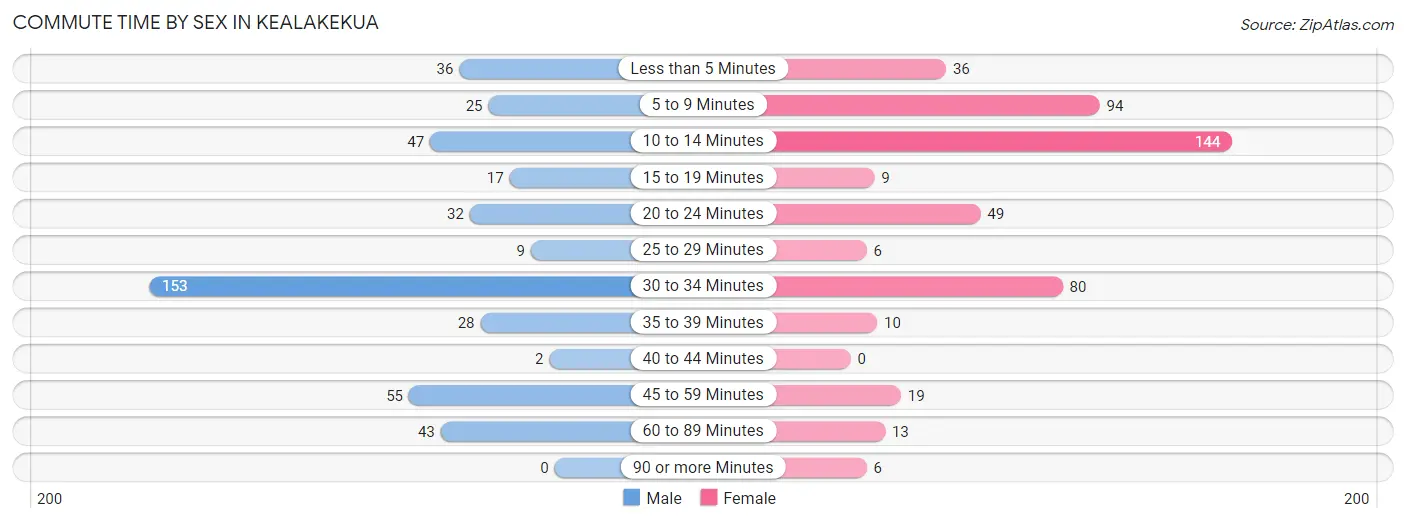
| Commute Time | Male | Female |
| Less than 5 Minutes | 36 (8.1%) | 36 (7.7%) |
| 5 to 9 Minutes | 25 (5.6%) | 94 (20.2%) |
| 10 to 14 Minutes | 47 (10.5%) | 144 (30.9%) |
| 15 to 19 Minutes | 17 (3.8%) | 9 (1.9%) |
| 20 to 24 Minutes | 32 (7.2%) | 49 (10.5%) |
| 25 to 29 Minutes | 9 (2.0%) | 6 (1.3%) |
| 30 to 34 Minutes | 153 (34.2%) | 80 (17.2%) |
| 35 to 39 Minutes | 28 (6.3%) | 10 (2.1%) |
| 40 to 44 Minutes | 2 (0.4%) | 0 (0.0%) |
| 45 to 59 Minutes | 55 (12.3%) | 19 (4.1%) |
| 60 to 89 Minutes | 43 (9.6%) | 13 (2.8%) |
| 90 or more Minutes | 0 (0.0%) | 6 (1.3%) |
Time of Departure to Work by Sex in Kealakekua
The most frequent times of departure to work in Kealakekua are 7:00 AM to 7:29 AM (102, 22.8%) for males and 7:00 AM to 7:29 AM (106, 22.8%) for females.
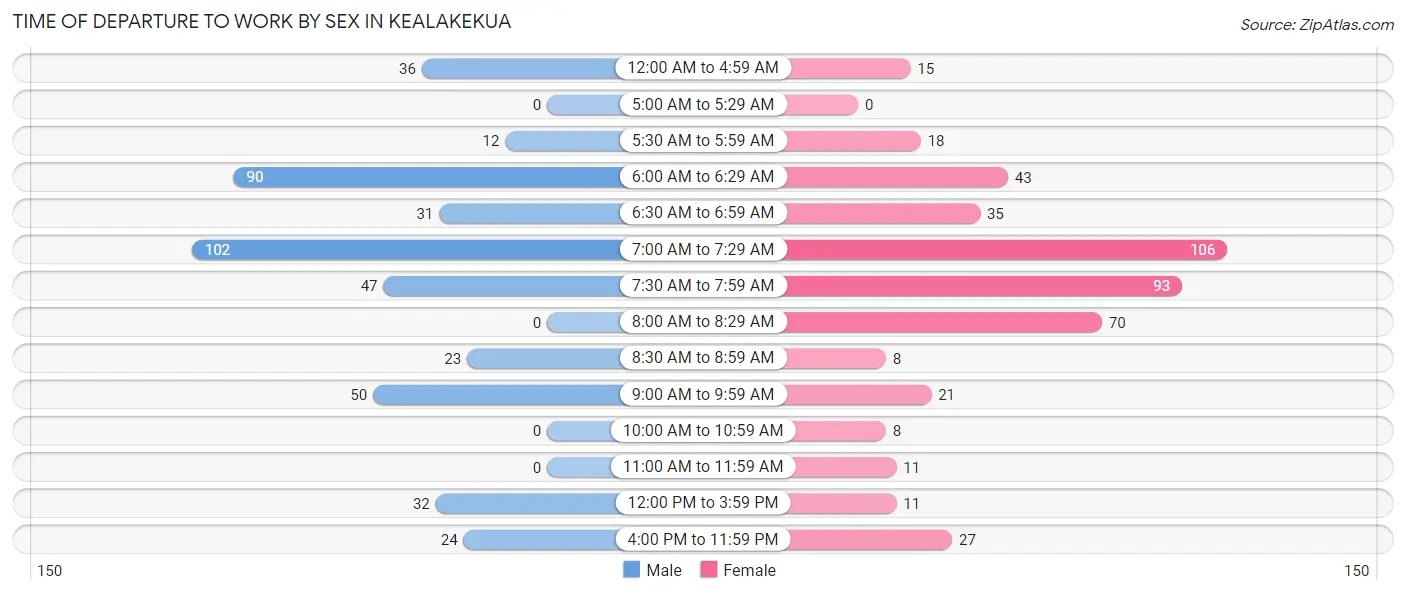
| Time of Departure | Male | Female |
| 12:00 AM to 4:59 AM | 36 (8.1%) | 15 (3.2%) |
| 5:00 AM to 5:29 AM | 0 (0.0%) | 0 (0.0%) |
| 5:30 AM to 5:59 AM | 12 (2.7%) | 18 (3.9%) |
| 6:00 AM to 6:29 AM | 90 (20.1%) | 43 (9.2%) |
| 6:30 AM to 6:59 AM | 31 (6.9%) | 35 (7.5%) |
| 7:00 AM to 7:29 AM | 102 (22.8%) | 106 (22.8%) |
| 7:30 AM to 7:59 AM | 47 (10.5%) | 93 (20.0%) |
| 8:00 AM to 8:29 AM | 0 (0.0%) | 70 (15.0%) |
| 8:30 AM to 8:59 AM | 23 (5.1%) | 8 (1.7%) |
| 9:00 AM to 9:59 AM | 50 (11.2%) | 21 (4.5%) |
| 10:00 AM to 10:59 AM | 0 (0.0%) | 8 (1.7%) |
| 11:00 AM to 11:59 AM | 0 (0.0%) | 11 (2.4%) |
| 12:00 PM to 3:59 PM | 32 (7.2%) | 11 (2.4%) |
| 4:00 PM to 11:59 PM | 24 (5.4%) | 27 (5.8%) |
| Total | 447 (100.0%) | 466 (100.0%) |
Housing Occupancy in Kealakekua
Occupancy by Ownership in Kealakekua
Of the total 751 dwellings in Kealakekua, owner-occupied units account for 490 (65.2%), while renter-occupied units make up 261 (34.7%).
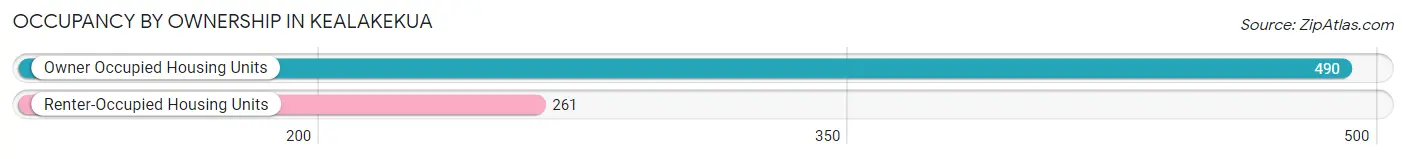
| Occupancy | # Housing Units | % Housing Units |
| Owner Occupied Housing Units | 490 | 65.2% |
| Renter-Occupied Housing Units | 261 | 34.7% |
| Total Occupied Housing Units | 751 | 100.0% |
Occupancy by Household Size in Kealakekua
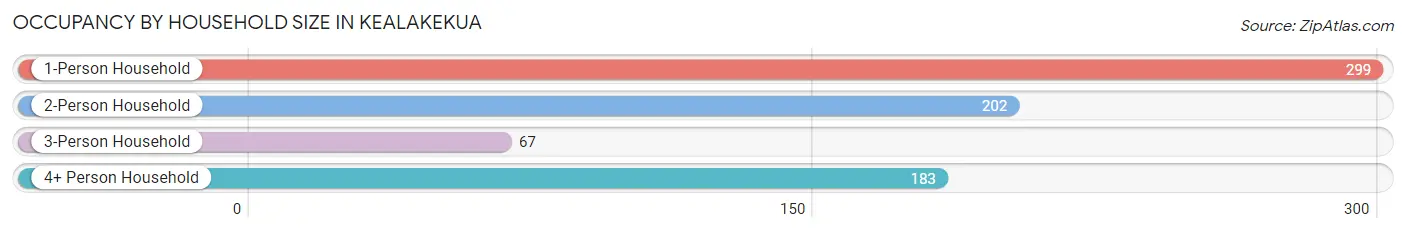
| Household Size | # Housing Units | % Housing Units |
| 1-Person Household | 299 | 39.8% |
| 2-Person Household | 202 | 26.9% |
| 3-Person Household | 67 | 8.9% |
| 4+ Person Household | 183 | 24.4% |
| Total Housing Units | 751 | 100.0% |
Occupancy by Ownership by Household Size in Kealakekua
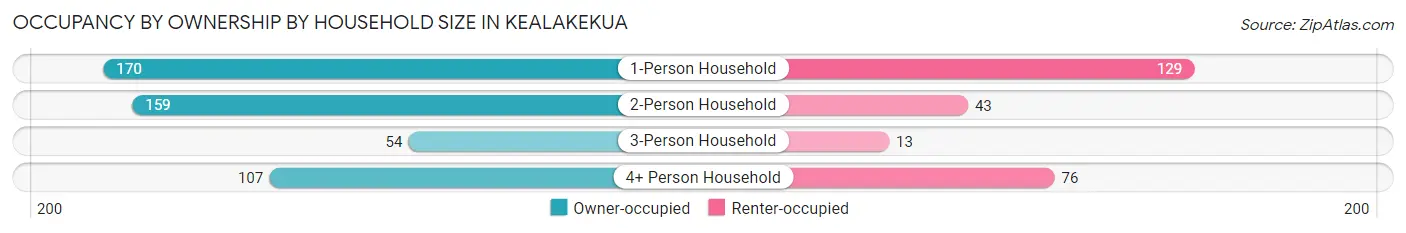
| Household Size | Owner-occupied | Renter-occupied |
| 1-Person Household | 170 (56.9%) | 129 (43.1%) |
| 2-Person Household | 159 (78.7%) | 43 (21.3%) |
| 3-Person Household | 54 (80.6%) | 13 (19.4%) |
| 4+ Person Household | 107 (58.5%) | 76 (41.5%) |
| Total Housing Units | 490 (65.2%) | 261 (34.7%) |
Occupancy by Educational Attainment in Kealakekua
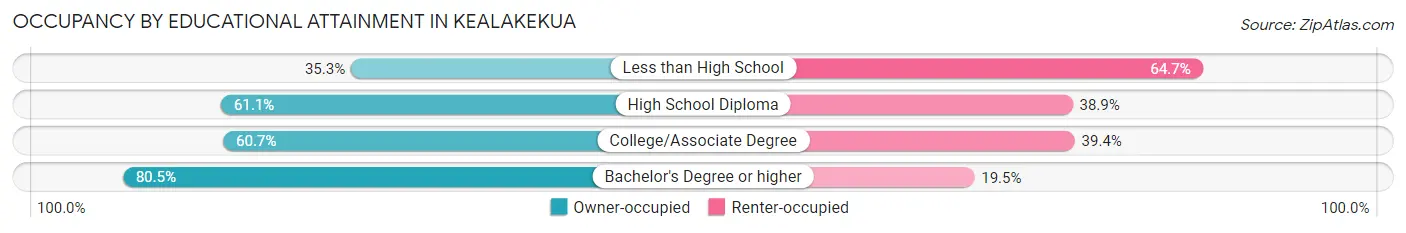
| Household Size | Owner-occupied | Renter-occupied |
| Less than High School | 24 (35.3%) | 44 (64.7%) |
| High School Diploma | 91 (61.1%) | 58 (38.9%) |
| College/Associate Degree | 168 (60.7%) | 109 (39.4%) |
| Bachelor's Degree or higher | 207 (80.5%) | 50 (19.5%) |
Occupancy by Age of Householder in Kealakekua
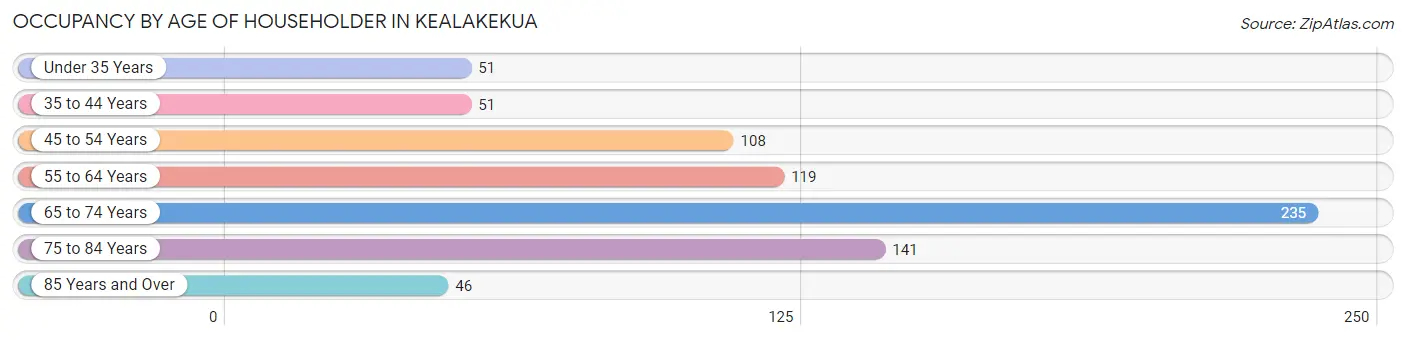
| Age Bracket | # Households | % Households |
| Under 35 Years | 51 | 6.8% |
| 35 to 44 Years | 51 | 6.8% |
| 45 to 54 Years | 108 | 14.4% |
| 55 to 64 Years | 119 | 15.9% |
| 65 to 74 Years | 235 | 31.3% |
| 75 to 84 Years | 141 | 18.8% |
| 85 Years and Over | 46 | 6.1% |
| Total | 751 | 100.0% |
Housing Finances in Kealakekua
Median Income by Occupancy in Kealakekua
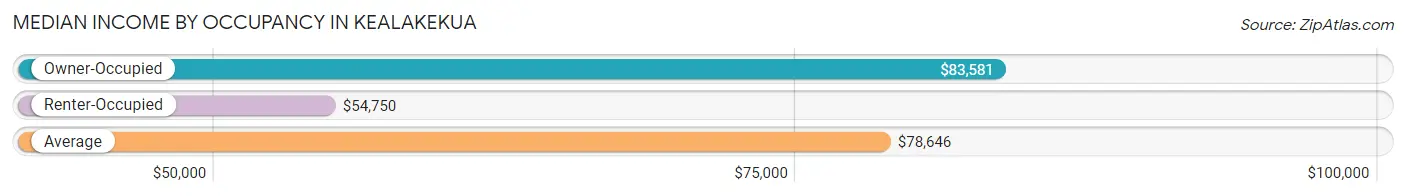
| Occupancy Type | # Households | Median Income |
| Owner-Occupied | 490 (65.2%) | $83,581 |
| Renter-Occupied | 261 (34.7%) | $54,750 |
| Average | 751 (100.0%) | $78,646 |
Occupancy by Householder Income Bracket in Kealakekua
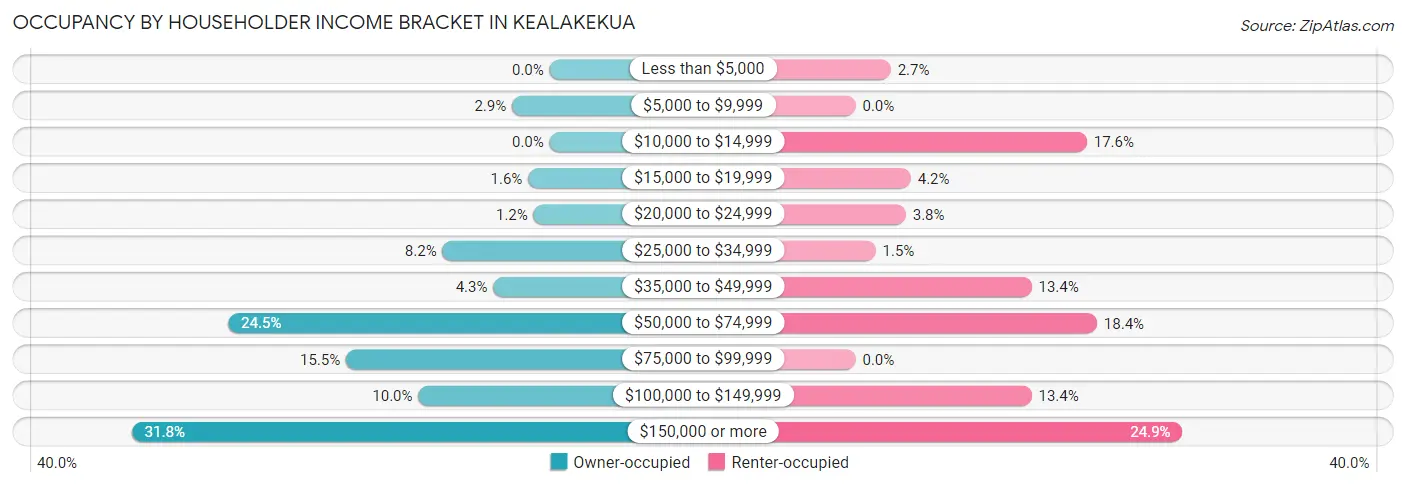
| Income Bracket | Owner-occupied | Renter-occupied |
| Less than $5,000 | 0 (0.0%) | 7 (2.7%) |
| $5,000 to $9,999 | 14 (2.9%) | 0 (0.0%) |
| $10,000 to $14,999 | 0 (0.0%) | 46 (17.6%) |
| $15,000 to $19,999 | 8 (1.6%) | 11 (4.2%) |
| $20,000 to $24,999 | 6 (1.2%) | 10 (3.8%) |
| $25,000 to $34,999 | 40 (8.2%) | 4 (1.5%) |
| $35,000 to $49,999 | 21 (4.3%) | 35 (13.4%) |
| $50,000 to $74,999 | 120 (24.5%) | 48 (18.4%) |
| $75,000 to $99,999 | 76 (15.5%) | 0 (0.0%) |
| $100,000 to $149,999 | 49 (10.0%) | 35 (13.4%) |
| $150,000 or more | 156 (31.8%) | 65 (24.9%) |
| Total | 490 (100.0%) | 261 (100.0%) |
Monthly Housing Cost Tiers in Kealakekua
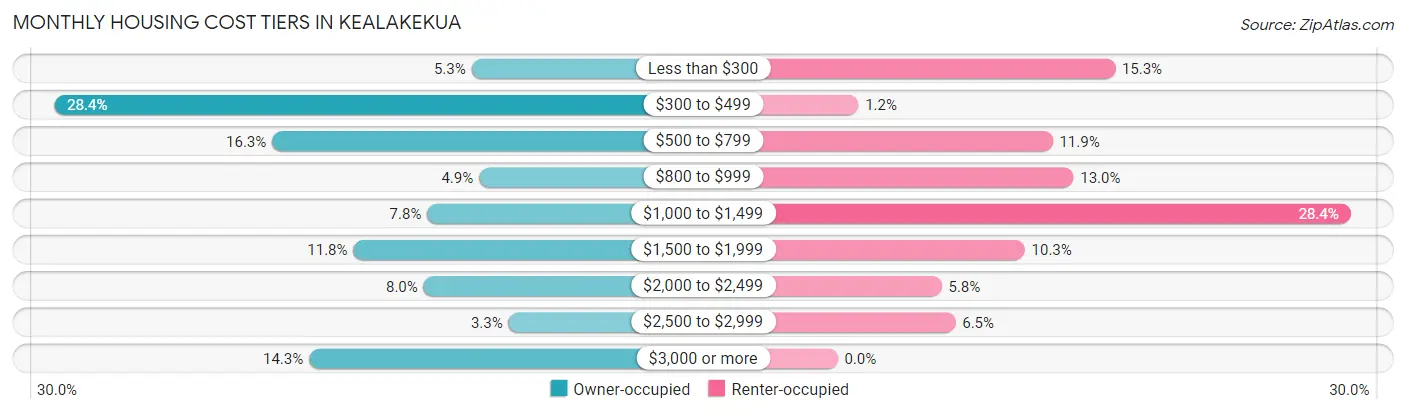
| Monthly Cost | Owner-occupied | Renter-occupied |
| Less than $300 | 26 (5.3%) | 40 (15.3%) |
| $300 to $499 | 139 (28.4%) | 3 (1.1%) |
| $500 to $799 | 80 (16.3%) | 31 (11.9%) |
| $800 to $999 | 24 (4.9%) | 34 (13.0%) |
| $1,000 to $1,499 | 38 (7.8%) | 74 (28.3%) |
| $1,500 to $1,999 | 58 (11.8%) | 27 (10.3%) |
| $2,000 to $2,499 | 39 (8.0%) | 15 (5.8%) |
| $2,500 to $2,999 | 16 (3.3%) | 17 (6.5%) |
| $3,000 or more | 70 (14.3%) | 0 (0.0%) |
| Total | 490 (100.0%) | 261 (100.0%) |
Physical Housing Characteristics in Kealakekua
Housing Structures in Kealakekua
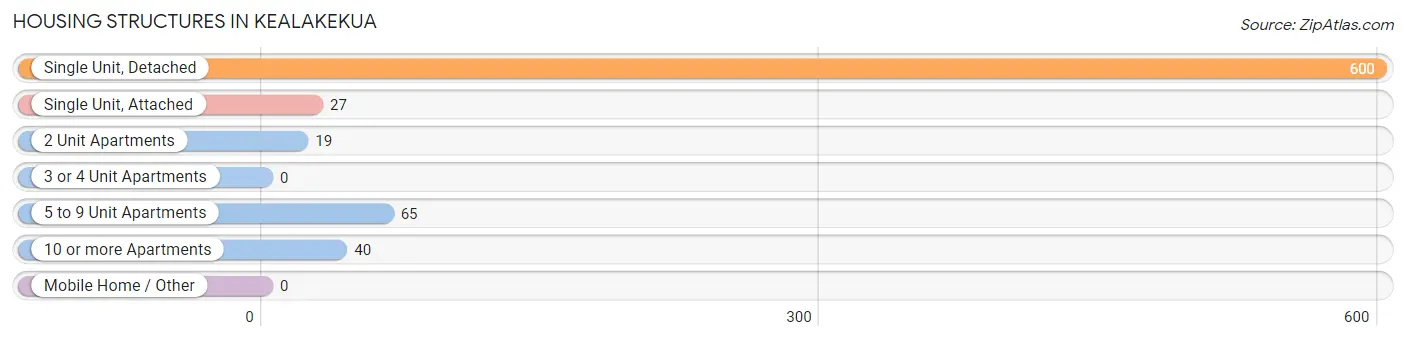
| Structure Type | # Housing Units | % Housing Units |
| Single Unit, Detached | 600 | 79.9% |
| Single Unit, Attached | 27 | 3.6% |
| 2 Unit Apartments | 19 | 2.5% |
| 3 or 4 Unit Apartments | 0 | 0.0% |
| 5 to 9 Unit Apartments | 65 | 8.7% |
| 10 or more Apartments | 40 | 5.3% |
| Mobile Home / Other | 0 | 0.0% |
| Total | 751 | 100.0% |
Housing Structures by Occupancy in Kealakekua
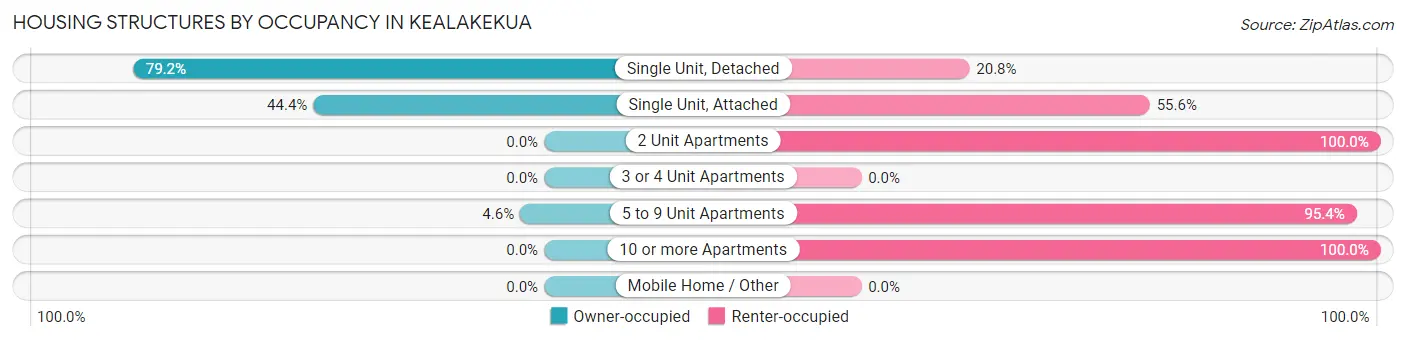
| Structure Type | Owner-occupied | Renter-occupied |
| Single Unit, Detached | 475 (79.2%) | 125 (20.8%) |
| Single Unit, Attached | 12 (44.4%) | 15 (55.6%) |
| 2 Unit Apartments | 0 (0.0%) | 19 (100.0%) |
| 3 or 4 Unit Apartments | 0 (0.0%) | 0 (0.0%) |
| 5 to 9 Unit Apartments | 3 (4.6%) | 62 (95.4%) |
| 10 or more Apartments | 0 (0.0%) | 40 (100.0%) |
| Mobile Home / Other | 0 (0.0%) | 0 (0.0%) |
| Total | 490 (65.2%) | 261 (34.7%) |
Housing Structures by Number of Rooms in Kealakekua
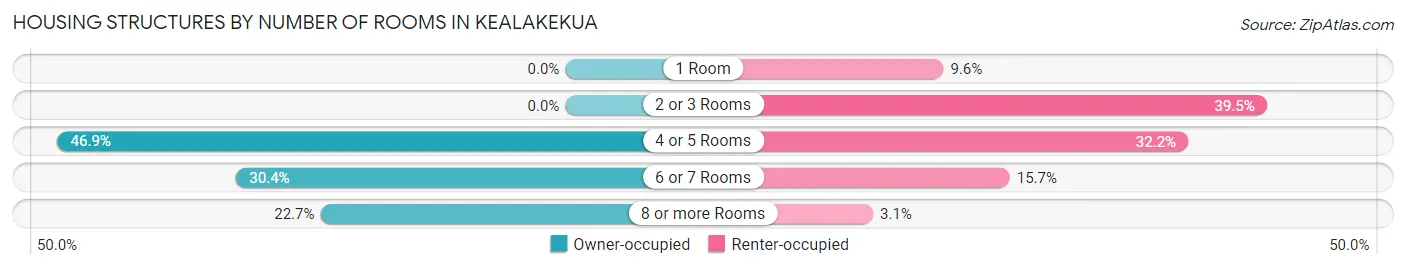
| Number of Rooms | Owner-occupied | Renter-occupied |
| 1 Room | 0 (0.0%) | 25 (9.6%) |
| 2 or 3 Rooms | 0 (0.0%) | 103 (39.5%) |
| 4 or 5 Rooms | 230 (46.9%) | 84 (32.2%) |
| 6 or 7 Rooms | 149 (30.4%) | 41 (15.7%) |
| 8 or more Rooms | 111 (22.7%) | 8 (3.1%) |
| Total | 490 (100.0%) | 261 (100.0%) |
Housing Structure by Heating Type in Kealakekua
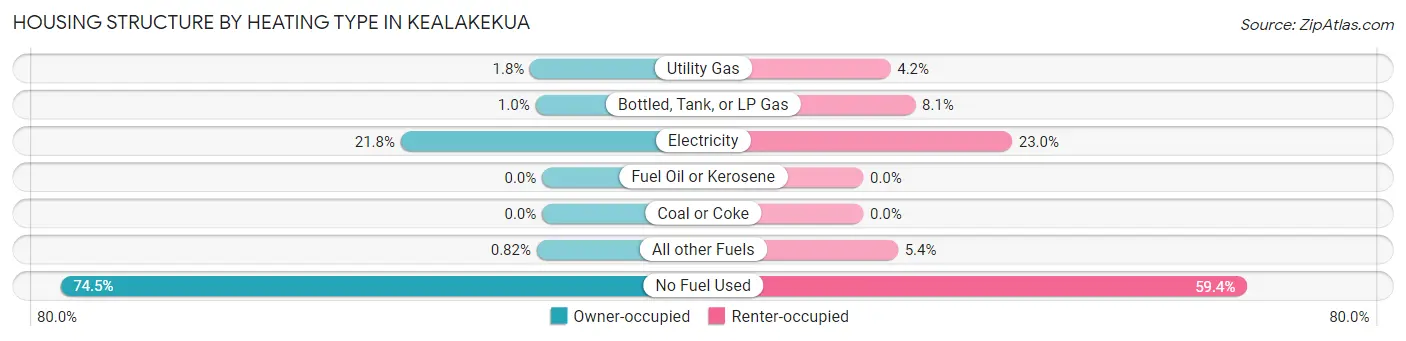
| Heating Type | Owner-occupied | Renter-occupied |
| Utility Gas | 9 (1.8%) | 11 (4.2%) |
| Bottled, Tank, or LP Gas | 5 (1.0%) | 21 (8.1%) |
| Electricity | 107 (21.8%) | 60 (23.0%) |
| Fuel Oil or Kerosene | 0 (0.0%) | 0 (0.0%) |
| Coal or Coke | 0 (0.0%) | 0 (0.0%) |
| All other Fuels | 4 (0.8%) | 14 (5.4%) |
| No Fuel Used | 365 (74.5%) | 155 (59.4%) |
| Total | 490 (100.0%) | 261 (100.0%) |
Household Vehicle Usage in Kealakekua
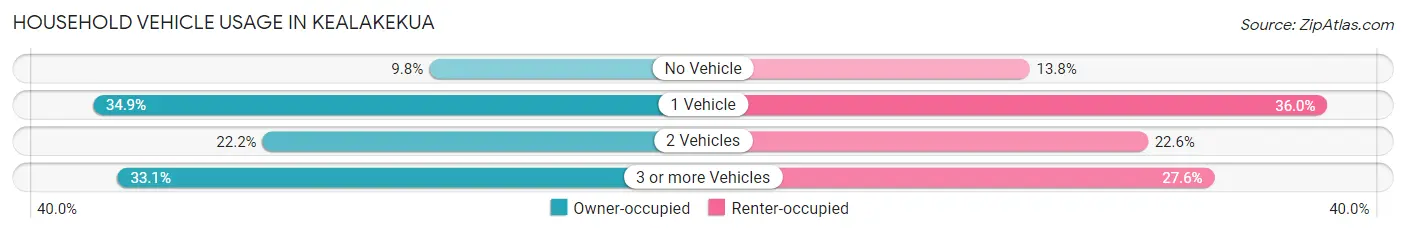
| Vehicles per Household | Owner-occupied | Renter-occupied |
| No Vehicle | 48 (9.8%) | 36 (13.8%) |
| 1 Vehicle | 171 (34.9%) | 94 (36.0%) |
| 2 Vehicles | 109 (22.2%) | 59 (22.6%) |
| 3 or more Vehicles | 162 (33.1%) | 72 (27.6%) |
| Total | 490 (100.0%) | 261 (100.0%) |
Real Estate & Mortgages in Kealakekua
Real Estate and Mortgage Overview in Kealakekua
| Characteristic | Without Mortgage | With Mortgage |
| Housing Units | 281 | 209 |
| Median Property Value | $488,600 | $613,400 |
| Median Household Income | $74,471 | $95 |
| Monthly Housing Costs | $482 | $64 |
| Real Estate Taxes | - | - |
Property Value by Mortgage Status in Kealakekua
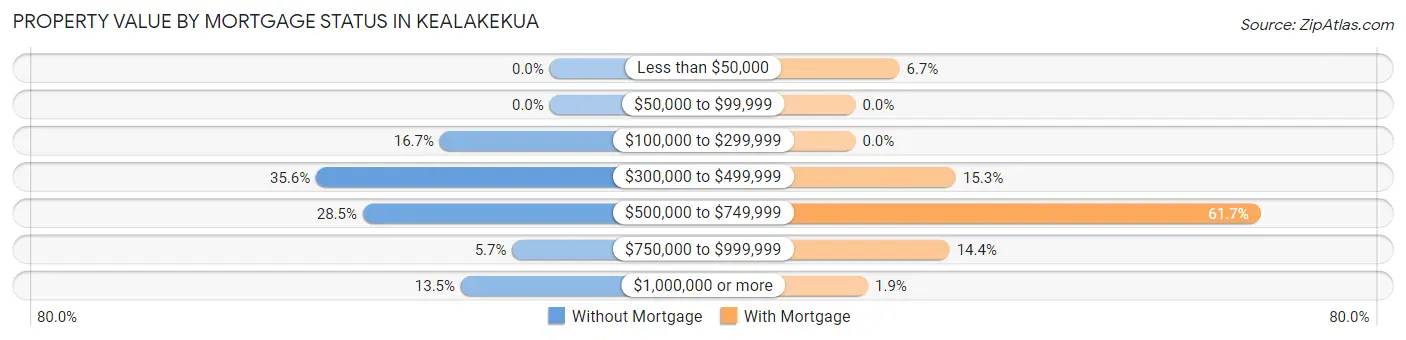
| Property Value | Without Mortgage | With Mortgage |
| Less than $50,000 | 0 (0.0%) | 14 (6.7%) |
| $50,000 to $99,999 | 0 (0.0%) | 0 (0.0%) |
| $100,000 to $299,999 | 47 (16.7%) | 0 (0.0%) |
| $300,000 to $499,999 | 100 (35.6%) | 32 (15.3%) |
| $500,000 to $749,999 | 80 (28.5%) | 129 (61.7%) |
| $750,000 to $999,999 | 16 (5.7%) | 30 (14.3%) |
| $1,000,000 or more | 38 (13.5%) | 4 (1.9%) |
| Total | 281 (100.0%) | 209 (100.0%) |
Household Income by Mortgage Status in Kealakekua
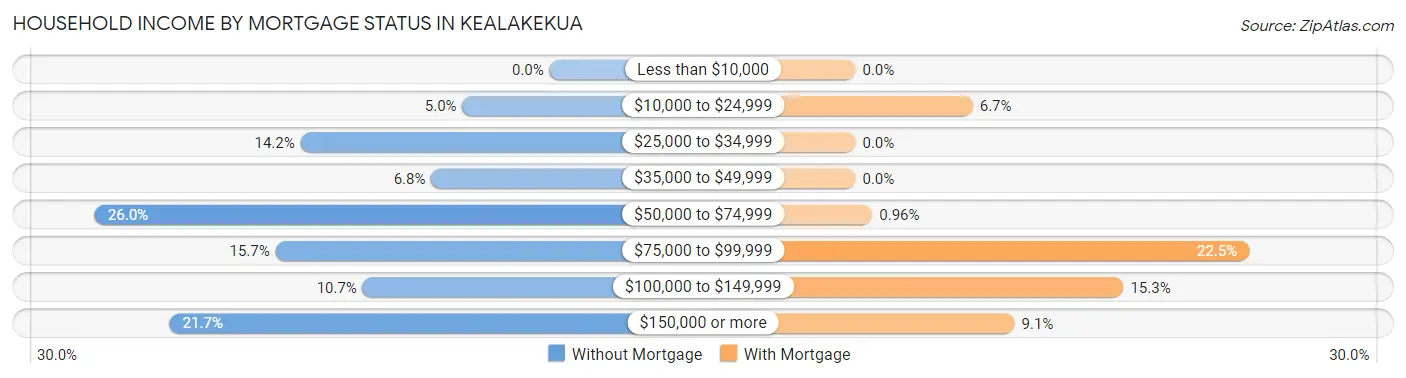
| Household Income | Without Mortgage | With Mortgage |
| Less than $10,000 | 0 (0.0%) | 0 (0.0%) |
| $10,000 to $24,999 | 14 (5.0%) | 14 (6.7%) |
| $25,000 to $34,999 | 40 (14.2%) | 0 (0.0%) |
| $35,000 to $49,999 | 19 (6.8%) | 0 (0.0%) |
| $50,000 to $74,999 | 73 (26.0%) | 2 (1.0%) |
| $75,000 to $99,999 | 44 (15.7%) | 47 (22.5%) |
| $100,000 to $149,999 | 30 (10.7%) | 32 (15.3%) |
| $150,000 or more | 61 (21.7%) | 19 (9.1%) |
| Total | 281 (100.0%) | 209 (100.0%) |
Property Value to Household Income Ratio in Kealakekua
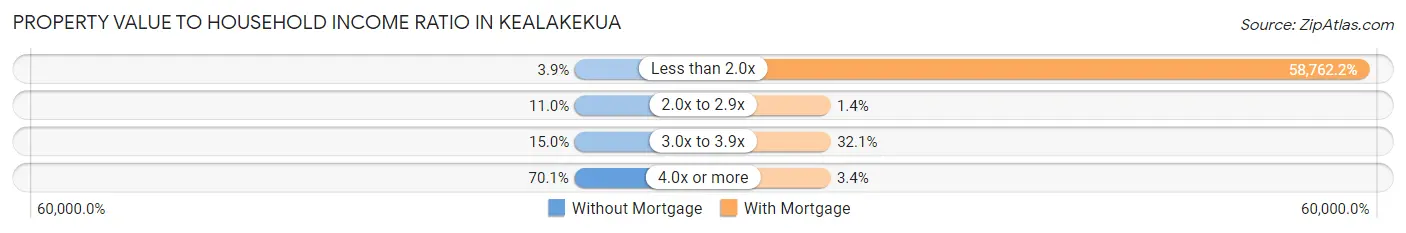
| Value-to-Income Ratio | Without Mortgage | With Mortgage |
| Less than 2.0x | 11 (3.9%) | 122,813 (58,762.2%) |
| 2.0x to 2.9x | 31 (11.0%) | 3 (1.4%) |
| 3.0x to 3.9x | 42 (14.9%) | 67 (32.1%) |
| 4.0x or more | 197 (70.1%) | 7 (3.4%) |
| Total | 281 (100.0%) | 209 (100.0%) |
Real Estate Taxes by Mortgage Status in Kealakekua
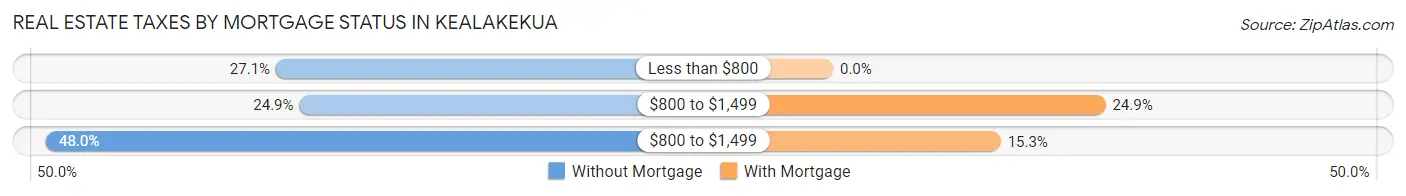
| Property Taxes | Without Mortgage | With Mortgage |
| Less than $800 | 76 (27.1%) | 0 (0.0%) |
| $800 to $1,499 | 70 (24.9%) | 52 (24.9%) |
| $800 to $1,499 | 135 (48.0%) | 32 (15.3%) |
| Total | 281 (100.0%) | 209 (100.0%) |
Health & Disability in Kealakekua
Health Insurance Coverage by Age in Kealakekua
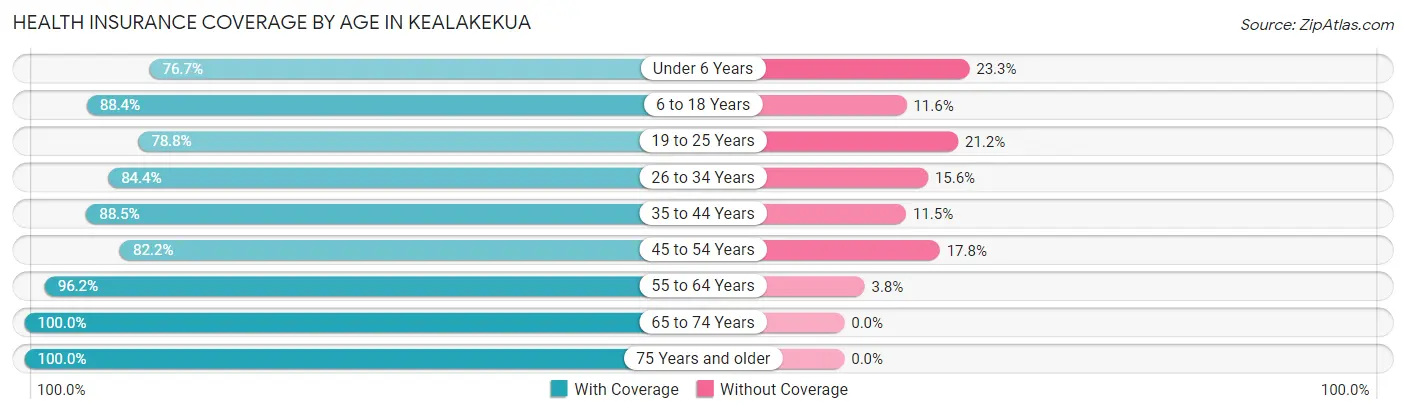
| Age Bracket | With Coverage | Without Coverage |
| Under 6 Years | 102 (76.7%) | 31 (23.3%) |
| 6 to 18 Years | 320 (88.4%) | 42 (11.6%) |
| 19 to 25 Years | 52 (78.8%) | 14 (21.2%) |
| 26 to 34 Years | 238 (84.4%) | 44 (15.6%) |
| 35 to 44 Years | 192 (88.5%) | 25 (11.5%) |
| 45 to 54 Years | 217 (82.2%) | 47 (17.8%) |
| 55 to 64 Years | 255 (96.2%) | 10 (3.8%) |
| 65 to 74 Years | 315 (100.0%) | 0 (0.0%) |
| 75 Years and older | 262 (100.0%) | 0 (0.0%) |
| Total | 1,953 (90.2%) | 213 (9.8%) |
Health Insurance Coverage by Citizenship Status in Kealakekua
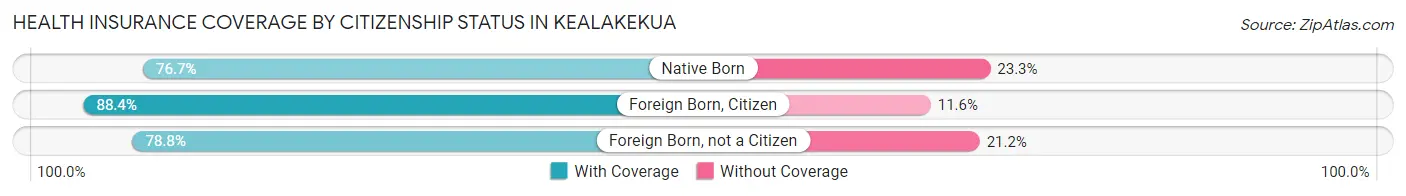
| Citizenship Status | With Coverage | Without Coverage |
| Native Born | 102 (76.7%) | 31 (23.3%) |
| Foreign Born, Citizen | 320 (88.4%) | 42 (11.6%) |
| Foreign Born, not a Citizen | 52 (78.8%) | 14 (21.2%) |
Health Insurance Coverage by Household Income in Kealakekua
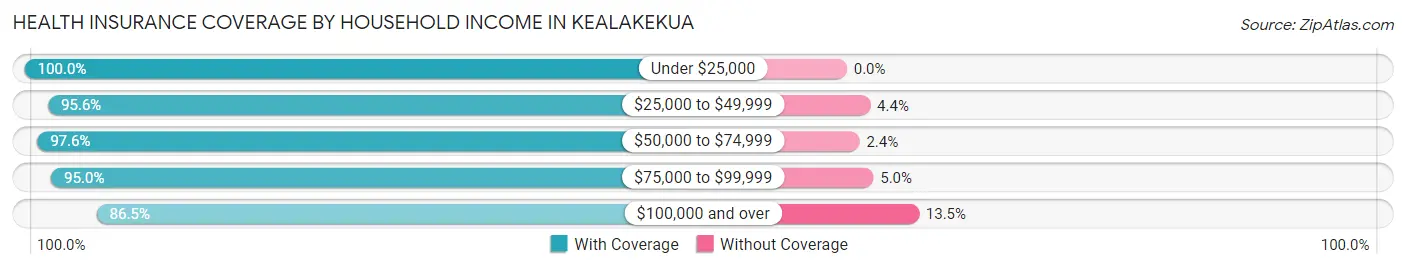
| Household Income | With Coverage | Without Coverage |
| Under $25,000 | 106 (100.0%) | 0 (0.0%) |
| $25,000 to $49,999 | 131 (95.6%) | 6 (4.4%) |
| $50,000 to $74,999 | 330 (97.6%) | 8 (2.4%) |
| $75,000 to $99,999 | 134 (95.0%) | 7 (5.0%) |
| $100,000 and over | 1,230 (86.5%) | 192 (13.5%) |
Public vs Private Health Insurance Coverage by Age in Kealakekua
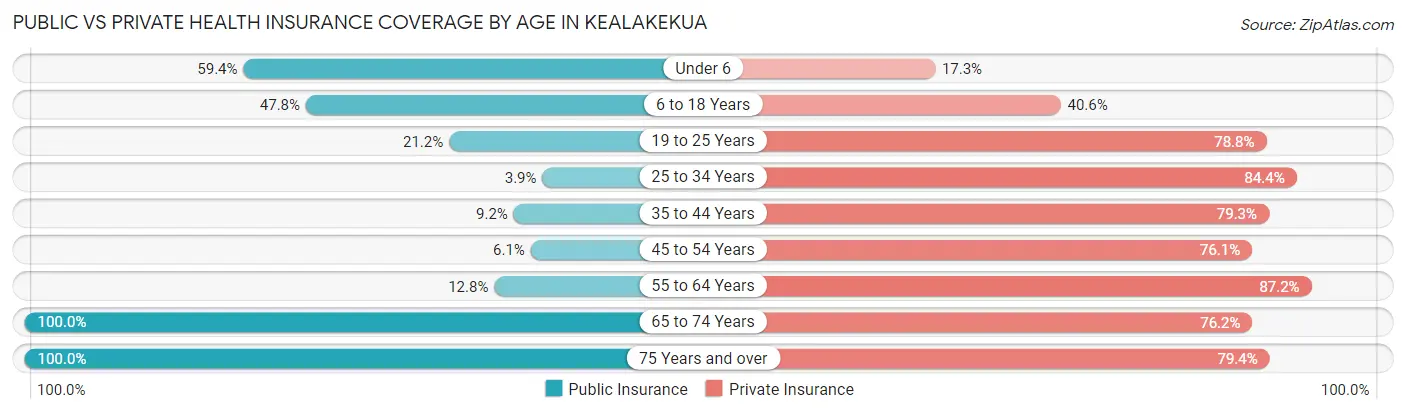
| Age Bracket | Public Insurance | Private Insurance |
| Under 6 | 79 (59.4%) | 23 (17.3%) |
| 6 to 18 Years | 173 (47.8%) | 147 (40.6%) |
| 19 to 25 Years | 14 (21.2%) | 52 (78.8%) |
| 25 to 34 Years | 11 (3.9%) | 238 (84.4%) |
| 35 to 44 Years | 20 (9.2%) | 172 (79.3%) |
| 45 to 54 Years | 16 (6.1%) | 201 (76.1%) |
| 55 to 64 Years | 34 (12.8%) | 231 (87.2%) |
| 65 to 74 Years | 315 (100.0%) | 240 (76.2%) |
| 75 Years and over | 262 (100.0%) | 208 (79.4%) |
| Total | 924 (42.7%) | 1,512 (69.8%) |
Disability Status by Sex by Age in Kealakekua
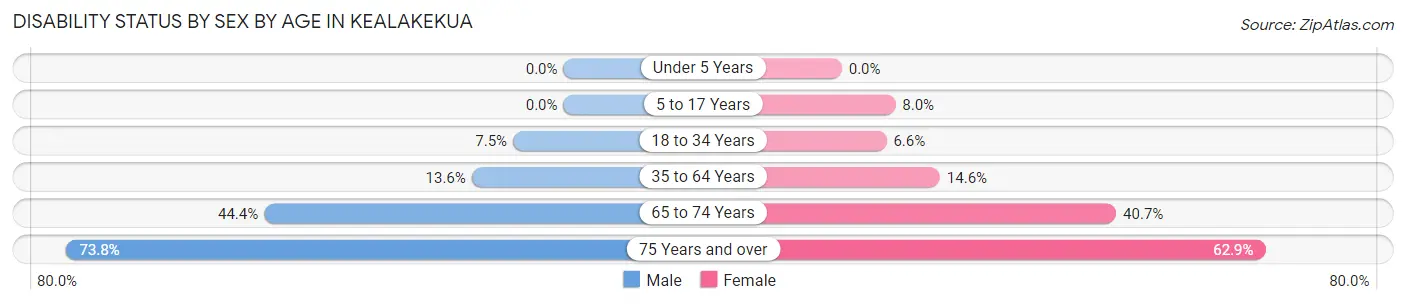
| Age Bracket | Male | Female |
| Under 5 Years | 0 (0.0%) | 0 (0.0%) |
| 5 to 17 Years | 0 (0.0%) | 12 (8.0%) |
| 18 to 34 Years | 14 (7.5%) | 13 (6.6%) |
| 35 to 64 Years | 53 (13.6%) | 52 (14.6%) |
| 65 to 74 Years | 56 (44.4%) | 77 (40.7%) |
| 75 Years and over | 76 (73.8%) | 100 (62.9%) |
Disability Class by Sex by Age in Kealakekua
Disability Class: Hearing Difficulty
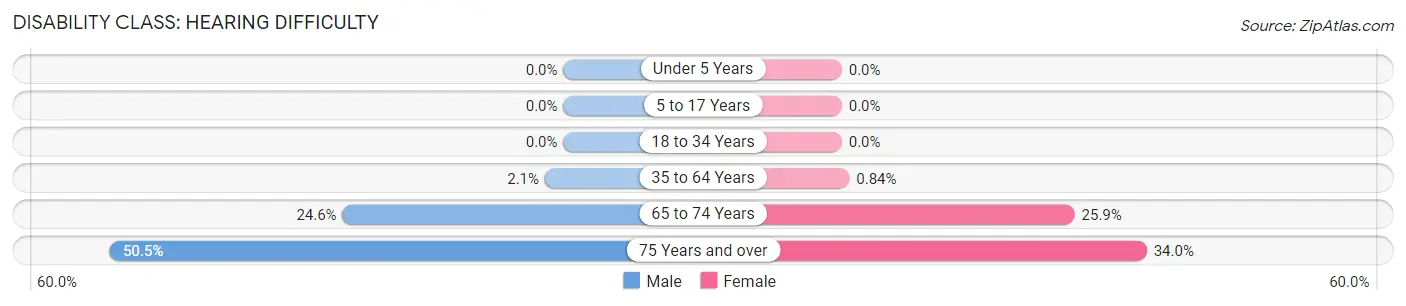
| Age Bracket | Male | Female |
| Under 5 Years | 0 (0.0%) | 0 (0.0%) |
| 5 to 17 Years | 0 (0.0%) | 0 (0.0%) |
| 18 to 34 Years | 0 (0.0%) | 0 (0.0%) |
| 35 to 64 Years | 8 (2.1%) | 3 (0.8%) |
| 65 to 74 Years | 31 (24.6%) | 49 (25.9%) |
| 75 Years and over | 52 (50.5%) | 54 (34.0%) |
Disability Class: Vision Difficulty
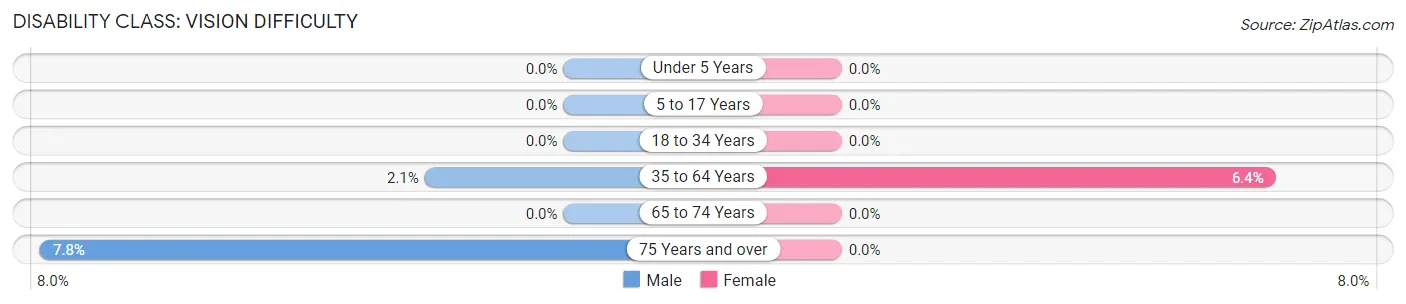
| Age Bracket | Male | Female |
| Under 5 Years | 0 (0.0%) | 0 (0.0%) |
| 5 to 17 Years | 0 (0.0%) | 0 (0.0%) |
| 18 to 34 Years | 0 (0.0%) | 0 (0.0%) |
| 35 to 64 Years | 8 (2.1%) | 23 (6.4%) |
| 65 to 74 Years | 0 (0.0%) | 0 (0.0%) |
| 75 Years and over | 8 (7.8%) | 0 (0.0%) |
Disability Class: Cognitive Difficulty
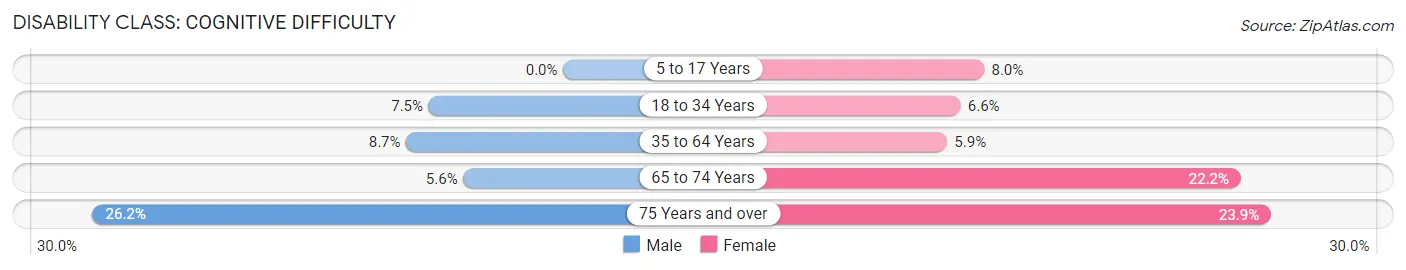
| Age Bracket | Male | Female |
| 5 to 17 Years | 0 (0.0%) | 12 (8.0%) |
| 18 to 34 Years | 14 (7.5%) | 13 (6.6%) |
| 35 to 64 Years | 34 (8.7%) | 21 (5.9%) |
| 65 to 74 Years | 7 (5.6%) | 42 (22.2%) |
| 75 Years and over | 27 (26.2%) | 38 (23.9%) |
Disability Class: Ambulatory Difficulty
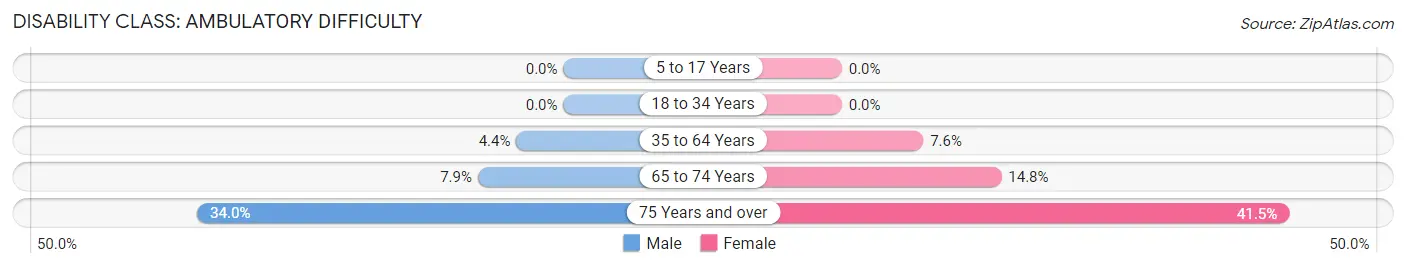
| Age Bracket | Male | Female |
| 5 to 17 Years | 0 (0.0%) | 0 (0.0%) |
| 18 to 34 Years | 0 (0.0%) | 0 (0.0%) |
| 35 to 64 Years | 17 (4.4%) | 27 (7.6%) |
| 65 to 74 Years | 10 (7.9%) | 28 (14.8%) |
| 75 Years and over | 35 (34.0%) | 66 (41.5%) |
Disability Class: Self-Care Difficulty
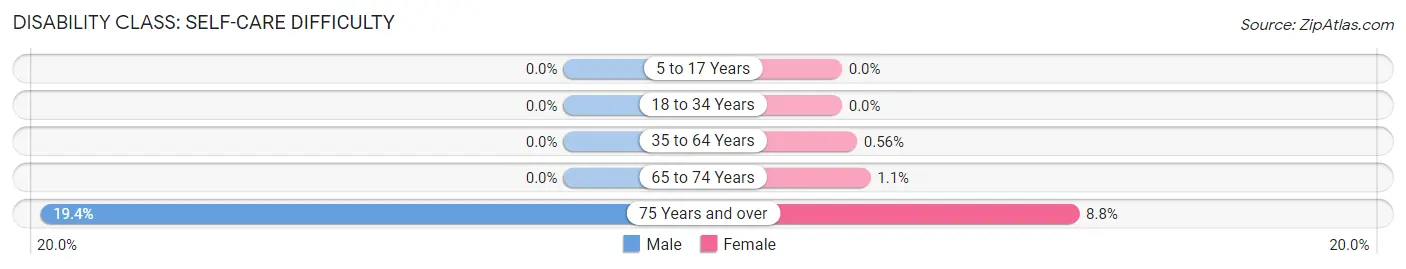
| Age Bracket | Male | Female |
| 5 to 17 Years | 0 (0.0%) | 0 (0.0%) |
| 18 to 34 Years | 0 (0.0%) | 0 (0.0%) |
| 35 to 64 Years | 0 (0.0%) | 2 (0.6%) |
| 65 to 74 Years | 0 (0.0%) | 2 (1.1%) |
| 75 Years and over | 20 (19.4%) | 14 (8.8%) |
Technology Access in Kealakekua
Computing Device Access in Kealakekua
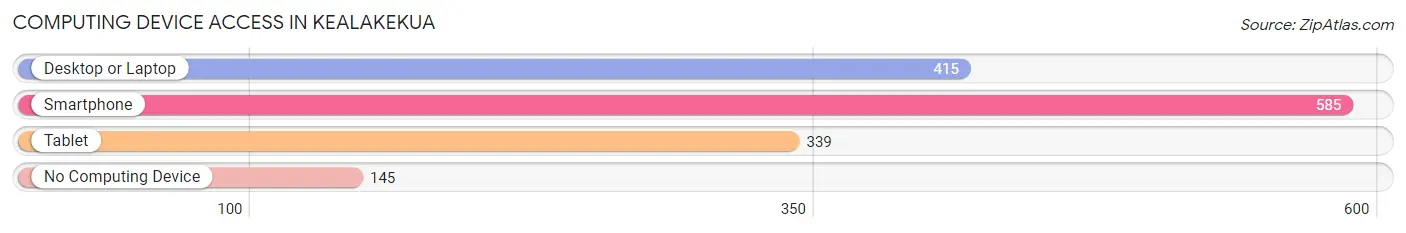
| Device Type | # Households | % Households |
| Desktop or Laptop | 415 | 55.3% |
| Smartphone | 585 | 77.9% |
| Tablet | 339 | 45.1% |
| No Computing Device | 145 | 19.3% |
| Total | 751 | 100.0% |
Internet Access in Kealakekua
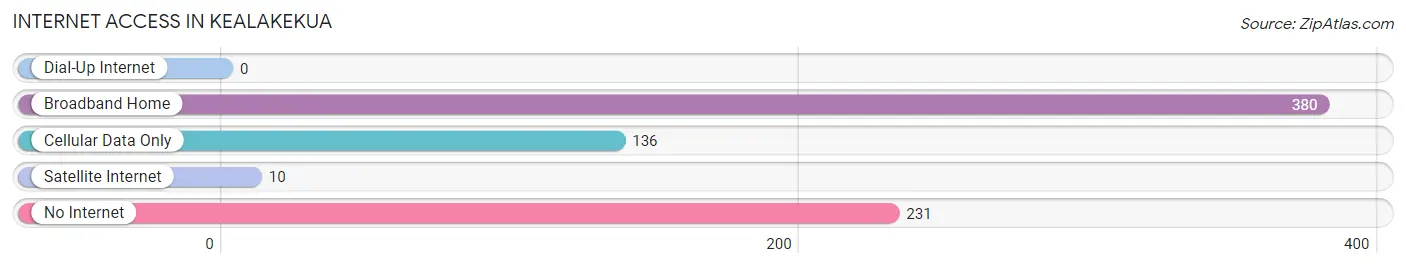
| Internet Type | # Households | % Households |
| Dial-Up Internet | 0 | 0.0% |
| Broadband Home | 380 | 50.6% |
| Cellular Data Only | 136 | 18.1% |
| Satellite Internet | 10 | 1.3% |
| No Internet | 231 | 30.8% |
| Total | 751 | 100.0% |
Kealakekua Summary
Kealakekua is a small town located on the Kona Coast of the Big Island of Hawaii. It is situated at the base of the Kealakekua Bay, which is a popular tourist destination. The town is known for its rich history, stunning geography, vibrant economy, and diverse demographics.
History
Kealakekua has a long and rich history that dates back to the early Polynesian settlers. The area was first settled by the Menehune, a mythical race of small people who were believed to have inhabited the area. The Menehune were believed to have built the heiau (temple) at the base of the bay, which is now a popular tourist attraction.
The area was later settled by the Hawaiians, who named the area Kealakekua, which means “pathway of the gods”. The area was an important religious and political center for the Hawaiian people, and was the site of the first Christian mission in Hawaii.
In 1779, Captain James Cook arrived in Kealakekua Bay and was welcomed by the Hawaiian people. However, a misunderstanding between the Hawaiians and the British sailors led to a skirmish, in which Cook was killed. This event is now known as the “Kealakekua Incident”.
Geography
Kealakekua is located on the Kona Coast of the Big Island of Hawaii. The town is situated at the base of the Kealakekua Bay, which is a popular tourist destination. The bay is surrounded by lush tropical vegetation and is home to a variety of marine life, including dolphins, whales, and sea turtles.
The town is located at an elevation of about 500 feet, and is surrounded by the Kealakekua Mountains. The area is known for its mild climate, with temperatures ranging from the mid-70s to the mid-80s year-round.
Economy
Kealakekua’s economy is largely driven by tourism. The town is home to a variety of hotels, restaurants, and other tourist attractions. The area is also home to a number of small businesses, including art galleries, gift shops, and souvenir stores.
The town is also home to a number of agricultural operations, including coffee and macadamia nut farms. The area is also known for its fishing industry, with a variety of fish, including mahi-mahi, ahi, and ono, being caught in the bay.
Demographics
Kealakekua has a population of about 2,500 people. The town is home to a diverse population, with people of various ethnic backgrounds, including Native Hawaiian, Filipino, Japanese, and Caucasian.
The town is also home to a variety of religious faiths, including Christianity, Buddhism, and Hinduism. The town is also home to a number of artists, musicians, and writers, who contribute to the town’s vibrant culture.
Conclusion
Kealakekua is a small town located on the Kona Coast of the Big Island of Hawaii. It is known for its rich history, stunning geography, vibrant economy, and diverse demographics. The town is home to a variety of tourist attractions, small businesses, and agricultural operations. The town is also home to a diverse population, with people of various ethnic backgrounds and religious faiths. Kealakekua is a unique and vibrant town that is sure to delight visitors and residents alike.
Common Questions
What is Per Capita Income in Kealakekua?
Per Capita income in Kealakekua is $41,040.
What is the Median Family Income in Kealakekua?
Median Family Income in Kealakekua is $110,461.
What is the Median Household income in Kealakekua?
Median Household Income in Kealakekua is $78,646.
What is Income or Wage Gap in Kealakekua?
Income or Wage Gap in Kealakekua is 23.1%.
Women in Kealakekua earn 76.9 cents for every dollar earned by a man.
What is Inequality or Gini Index in Kealakekua?
Inequality or Gini Index in Kealakekua is 0.46.
What is the Total Population of Kealakekua?
Total Population of Kealakekua is 2,188.
What is the Total Male Population of Kealakekua?
Total Male Population of Kealakekua is 1,083.
What is the Total Female Population of Kealakekua?
Total Female Population of Kealakekua is 1,105.
What is the Ratio of Males per 100 Females in Kealakekua?
There are 98.01 Males per 100 Females in Kealakekua.
What is the Ratio of Females per 100 Males in Kealakekua?
There are 102.03 Females per 100 Males in Kealakekua.
What is the Median Population Age in Kealakekua?
Median Population Age in Kealakekua is 47.2 Years.
What is the Average Family Size in Kealakekua
Average Family Size in Kealakekua is 4.0 People.
What is the Average Household Size in Kealakekua
Average Household Size in Kealakekua is 2.9 People.
How Large is the Labor Force in Kealakekua?
There are 1,003 People in the Labor Forcein in Kealakekua.
What is the Percentage of People in the Labor Force in Kealakekua?
57.1% of People are in the Labor Force in Kealakekua.
What is the Unemployment Rate in Kealakekua?
Unemployment Rate in Kealakekua is 1.9%.