Proctorsville, VT Map & Demographics
Proctorsville Map
Proctorsville Overview
$33,991
PER CAPITA INCOME
$88,523
AVG FAMILY INCOME
$74,167
AVG HOUSEHOLD INCOME
25.1%
WAGE / INCOME GAP [ % ]
74.9¢/ $1
WAGE / INCOME GAP [ $ ]
0.50
INEQUALITY / GINI INDEX
359
TOTAL POPULATION
173
MALE POPULATION
186
FEMALE POPULATION
93.01
MALES / 100 FEMALES
107.51
FEMALES / 100 MALES
44.5
MEDIAN AGE
3.4
AVG FAMILY SIZE
3.0
AVG HOUSEHOLD SIZE
210
LABOR FORCE [ PEOPLE ]
74.7%
PERCENT IN LABOR FORCE
1.9%
UNEMPLOYMENT RATE
Proctorsville Zip Codes
Proctorsville Area Codes
Income in Proctorsville
Income Overview in Proctorsville
Per Capita Income in Proctorsville is $33,991, while median incomes of families and households are $88,523 and $74,167 respectively.
| Characteristic | Number | Measure |
| Per Capita Income | 359 | $33,991 |
| Median Family Income | 79 | $88,523 |
| Mean Family Income | 79 | $132,434 |
| Median Household Income | 116 | $74,167 |
| Mean Household Income | 116 | $107,415 |
| Income Deficit | 79 | $0 |
| Wage / Income Gap (%) | 359 | 25.14% |
| Wage / Income Gap ($) | 359 | 74.86¢ per $1 |
| Gini / Inequality Index | 359 | 0.50 |
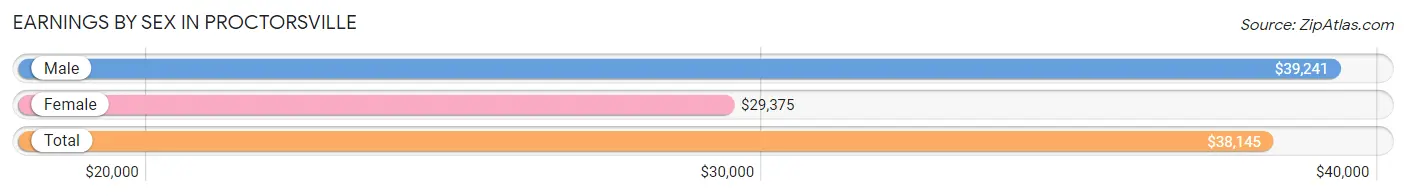
Earnings by Sex in Proctorsville
Average Earnings in Proctorsville are $38,145, $39,241 for men and $29,375 for women, a difference of 25.1%.
| Sex | Number | Average Earnings |
| Male | 111 (48.7%) | $39,241 |
| Female | 117 (51.3%) | $29,375 |
| Total | 228 (100.0%) | $38,145 |
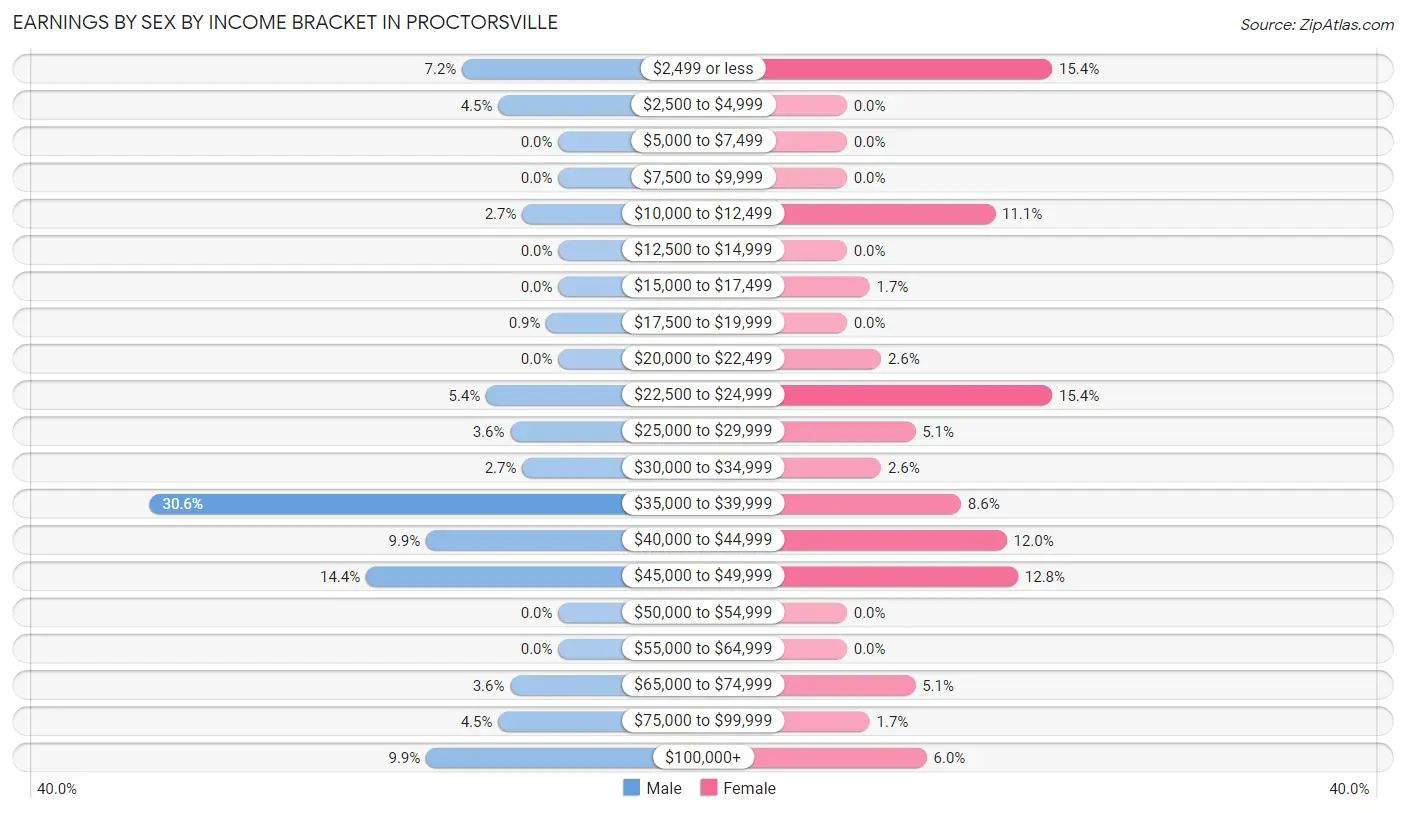
Earnings by Sex by Income Bracket in Proctorsville
The most common earnings brackets in Proctorsville are $35,000 to $39,999 for men (34 | 30.6%) and $2,499 or less for women (18 | 15.4%).
| Income | Male | Female |
| $2,499 or less | 8 (7.2%) | 18 (15.4%) |
| $2,500 to $4,999 | 5 (4.5%) | 0 (0.0%) |
| $5,000 to $7,499 | 0 (0.0%) | 0 (0.0%) |
| $7,500 to $9,999 | 0 (0.0%) | 0 (0.0%) |
| $10,000 to $12,499 | 3 (2.7%) | 13 (11.1%) |
| $12,500 to $14,999 | 0 (0.0%) | 0 (0.0%) |
| $15,000 to $17,499 | 0 (0.0%) | 2 (1.7%) |
| $17,500 to $19,999 | 1 (0.9%) | 0 (0.0%) |
| $20,000 to $22,499 | 0 (0.0%) | 3 (2.6%) |
| $22,500 to $24,999 | 6 (5.4%) | 18 (15.4%) |
| $25,000 to $29,999 | 4 (3.6%) | 6 (5.1%) |
| $30,000 to $34,999 | 3 (2.7%) | 3 (2.6%) |
| $35,000 to $39,999 | 34 (30.6%) | 10 (8.6%) |
| $40,000 to $44,999 | 11 (9.9%) | 14 (12.0%) |
| $45,000 to $49,999 | 16 (14.4%) | 15 (12.8%) |
| $50,000 to $54,999 | 0 (0.0%) | 0 (0.0%) |
| $55,000 to $64,999 | 0 (0.0%) | 0 (0.0%) |
| $65,000 to $74,999 | 4 (3.6%) | 6 (5.1%) |
| $75,000 to $99,999 | 5 (4.5%) | 2 (1.7%) |
| $100,000+ | 11 (9.9%) | 7 (6.0%) |
| Total | 111 (100.0%) | 117 (100.0%) |
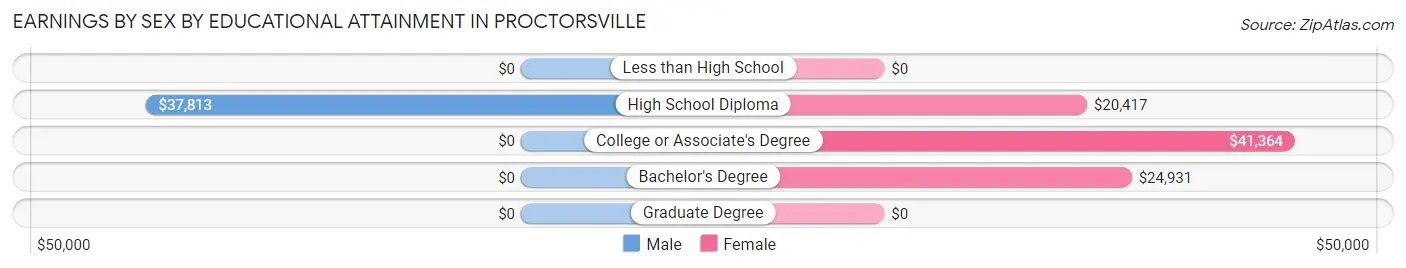
Earnings by Sex by Educational Attainment in Proctorsville
Average earnings in Proctorsville are $39,375 for men and $37,143 for women, a difference of 5.7%. Men with an educational attainment of high school diploma enjoy the highest average annual earnings of $37,813, while those with high school diploma education earn the least with $37,813. Women with an educational attainment of college or associate's degree earn the most with the average annual earnings of $41,364, while those with high school diploma education have the smallest earnings of $20,417.
| Educational Attainment | Male Income | Female Income |
| Less than High School | - | - |
| High School Diploma | $37,813 | $20,417 |
| College or Associate's Degree | - | - |
| Bachelor's Degree | - | - |
| Graduate Degree | - | - |
| Total | $39,375 | $37,143 |
Family Income in Proctorsville
Family Income Brackets in Proctorsville
According to the Proctorsville family income data, there are 25 families falling into the $75,000 to $99,999 income range, which is the most common income bracket and makes up 31.7% of all families.
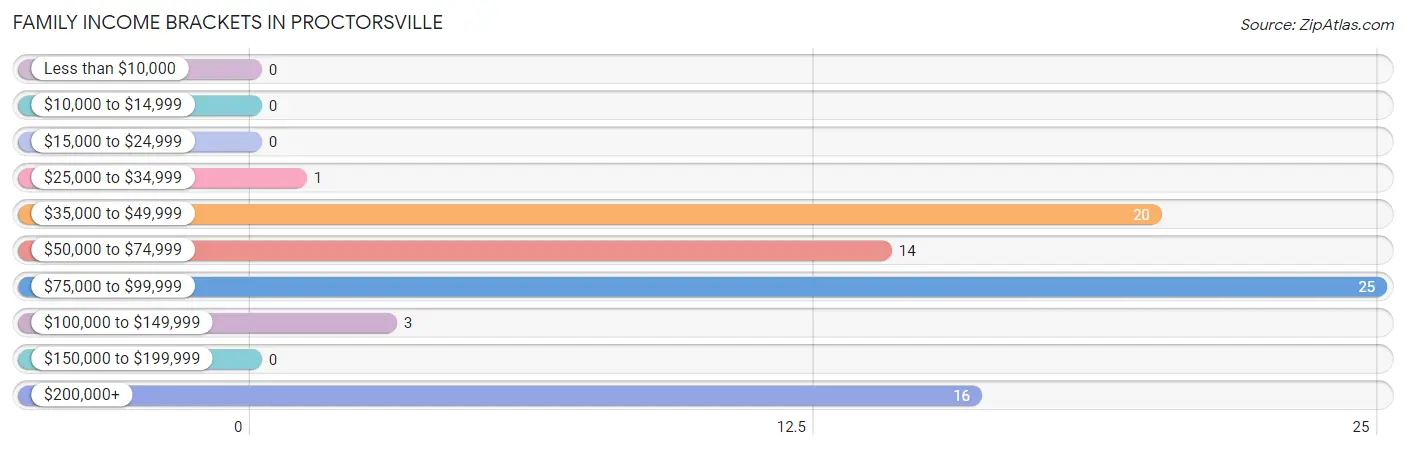
| Income Bracket | # Families | % Families |
| Less than $10,000 | 0 | 0.0% |
| $10,000 to $14,999 | 0 | 0.0% |
| $15,000 to $24,999 | 0 | 0.0% |
| $25,000 to $34,999 | 1 | 1.3% |
| $35,000 to $49,999 | 20 | 25.3% |
| $50,000 to $74,999 | 14 | 17.7% |
| $75,000 to $99,999 | 25 | 31.6% |
| $100,000 to $149,999 | 3 | 3.8% |
| $150,000 to $199,999 | 0 | 0.0% |
| $200,000+ | 16 | 20.3% |
Family Income by Famaliy Size in Proctorsville
2-person families (40 | 50.6%) account for the highest median family income in Proctorsville with $87,955 per family, while 2-person families (40 | 50.6%) have the highest median income of $43,978 per family member.
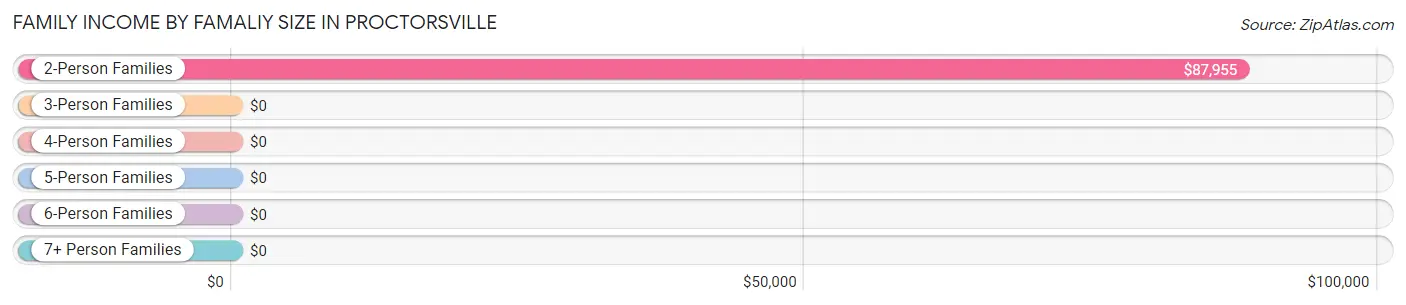
| Income Bracket | # Families | Median Income |
| 2-Person Families | 40 (50.6%) | $87,955 |
| 3-Person Families | 23 (29.1%) | $0 |
| 4-Person Families | 9 (11.4%) | $0 |
| 5-Person Families | 7 (8.9%) | $0 |
| 6-Person Families | 0 (0.0%) | $0 |
| 7+ Person Families | 0 (0.0%) | $0 |
| Total | 79 (100.0%) | $88,523 |
Family Income by Number of Earners in Proctorsville
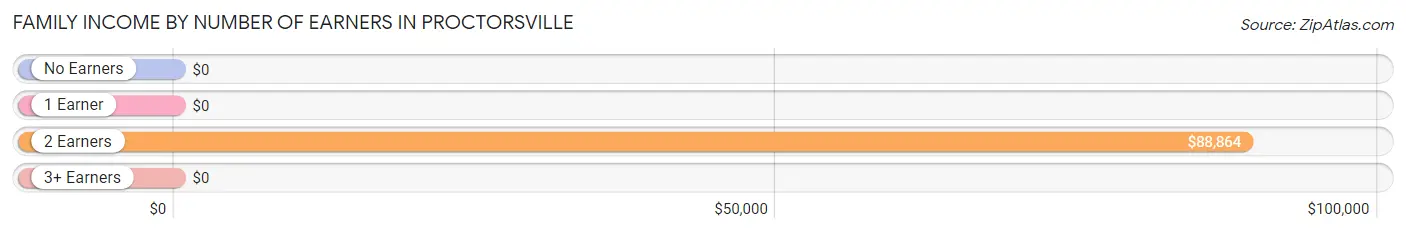
| Number of Earners | # Families | Median Income |
| No Earners | 5 (6.3%) | $0 |
| 1 Earner | 5 (6.3%) | $0 |
| 2 Earners | 62 (78.5%) | $88,864 |
| 3+ Earners | 7 (8.9%) | $0 |
| Total | 79 (100.0%) | $88,523 |
Household Income in Proctorsville
Household Income Brackets in Proctorsville
With 30 households falling in the category, the $75,000 to $99,999 income range is the most frequent in Proctorsville, accounting for 25.9% of all households. In contrast, only 1 households (0.9%) fall into the $25,000 to $34,999 income bracket, making it the least populous group.
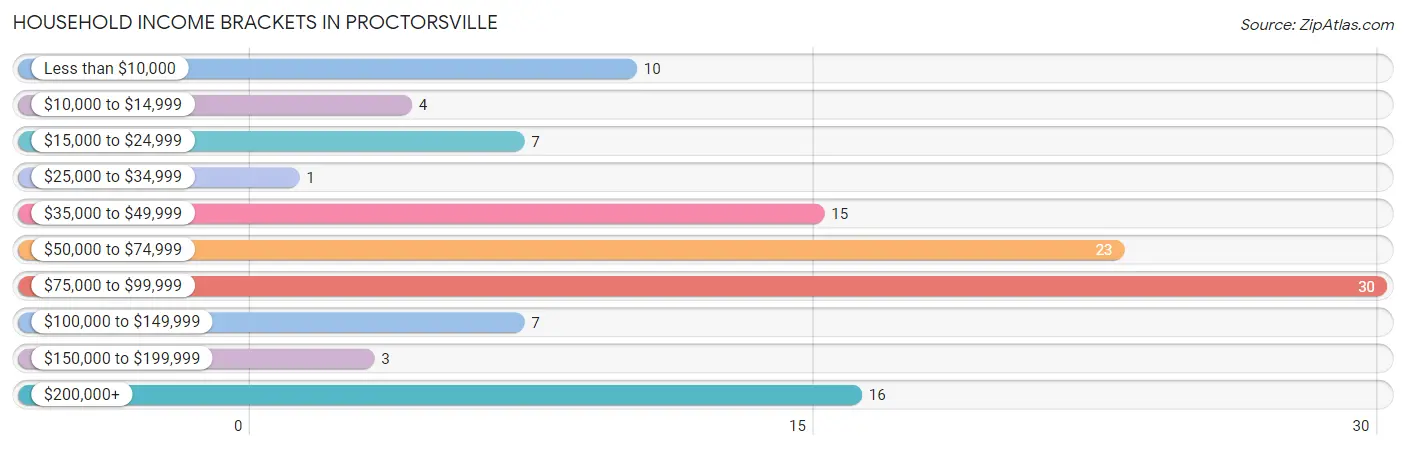
| Income Bracket | # Households | % Households |
| Less than $10,000 | 10 | 8.6% |
| $10,000 to $14,999 | 4 | 3.4% |
| $15,000 to $24,999 | 7 | 6.0% |
| $25,000 to $34,999 | 1 | 0.9% |
| $35,000 to $49,999 | 15 | 12.9% |
| $50,000 to $74,999 | 23 | 19.8% |
| $75,000 to $99,999 | 30 | 25.9% |
| $100,000 to $149,999 | 7 | 6.0% |
| $150,000 to $199,999 | 3 | 2.6% |
| $200,000+ | 16 | 13.8% |
Household Income by Householder Age in Proctorsville
The median household income in Proctorsville is $74,167, with the highest median household income of $90,455 found in the 45 to 64 years age bracket for the primary householder. A total of 50 households (43.1%) fall into this category. Meanwhile, the 15 to 24 years age bracket for the primary householder has the lowest median household income of $0, with 8 households (6.9%) in this group.
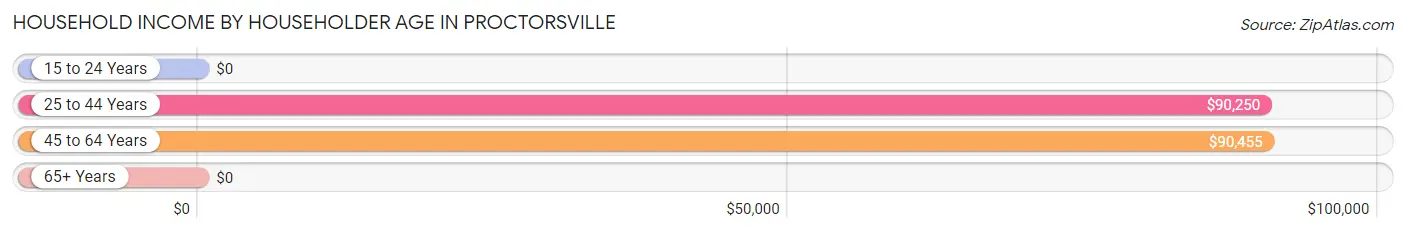
| Income Bracket | # Households | Median Income |
| 15 to 24 Years | 8 (6.9%) | $0 |
| 25 to 44 Years | 21 (18.1%) | $90,250 |
| 45 to 64 Years | 50 (43.1%) | $90,455 |
| 65+ Years | 37 (31.9%) | $0 |
| Total | 116 (100.0%) | $74,167 |
Poverty in Proctorsville
Income Below Poverty by Sex and Age in Proctorsville
With 4.6% poverty level for males and 14.7% for females among the residents of Proctorsville, 35 to 44 year old males and 65 to 74 year old females are the most vulnerable to poverty, with 5 males (55.6%) and 14 females (43.8%) in their respective age groups living below the poverty level.
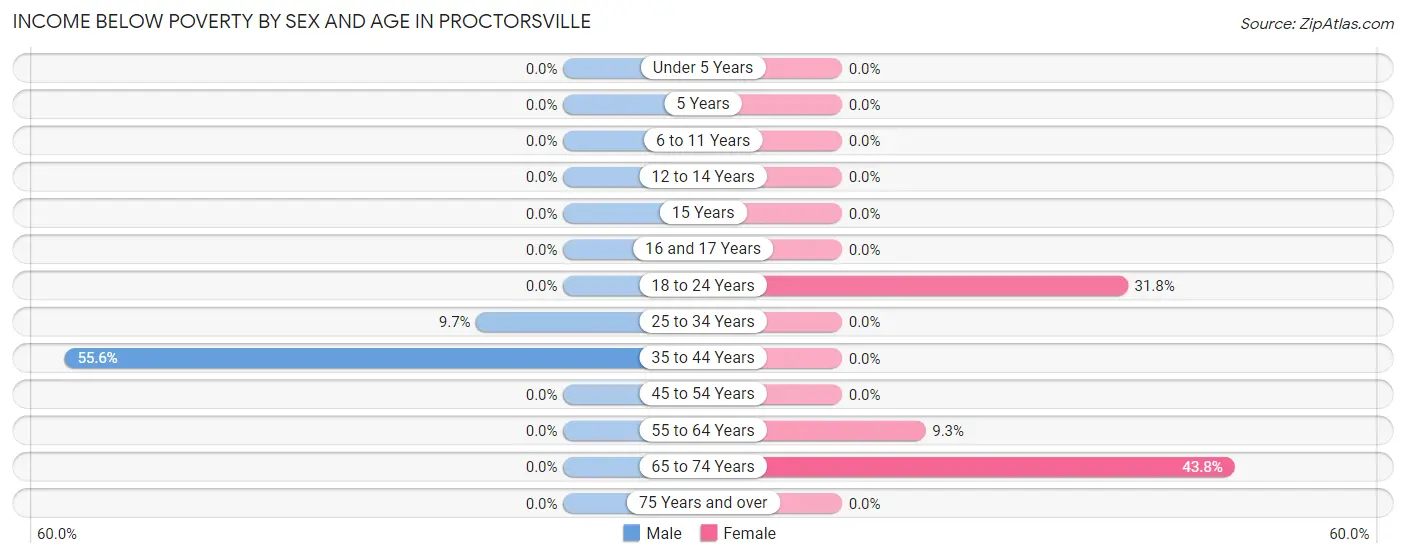
| Age Bracket | Male | Female |
| Under 5 Years | 0 (0.0%) | 0 (0.0%) |
| 5 Years | 0 (0.0%) | 0 (0.0%) |
| 6 to 11 Years | 0 (0.0%) | 0 (0.0%) |
| 12 to 14 Years | 0 (0.0%) | 0 (0.0%) |
| 15 Years | 0 (0.0%) | 0 (0.0%) |
| 16 and 17 Years | 0 (0.0%) | 0 (0.0%) |
| 18 to 24 Years | 0 (0.0%) | 7 (31.8%) |
| 25 to 34 Years | 3 (9.7%) | 0 (0.0%) |
| 35 to 44 Years | 5 (55.6%) | 0 (0.0%) |
| 45 to 54 Years | 0 (0.0%) | 0 (0.0%) |
| 55 to 64 Years | 0 (0.0%) | 4 (9.3%) |
| 65 to 74 Years | 0 (0.0%) | 14 (43.8%) |
| 75 Years and over | 0 (0.0%) | 0 (0.0%) |
| Total | 8 (4.6%) | 25 (14.7%) |
Income Above Poverty by Sex and Age in Proctorsville
According to the poverty statistics in Proctorsville, males aged under 5 years and females aged 6 to 11 years are the age groups that are most secure financially, with 100.0% of males and 100.0% of females in these age groups living above the poverty line.
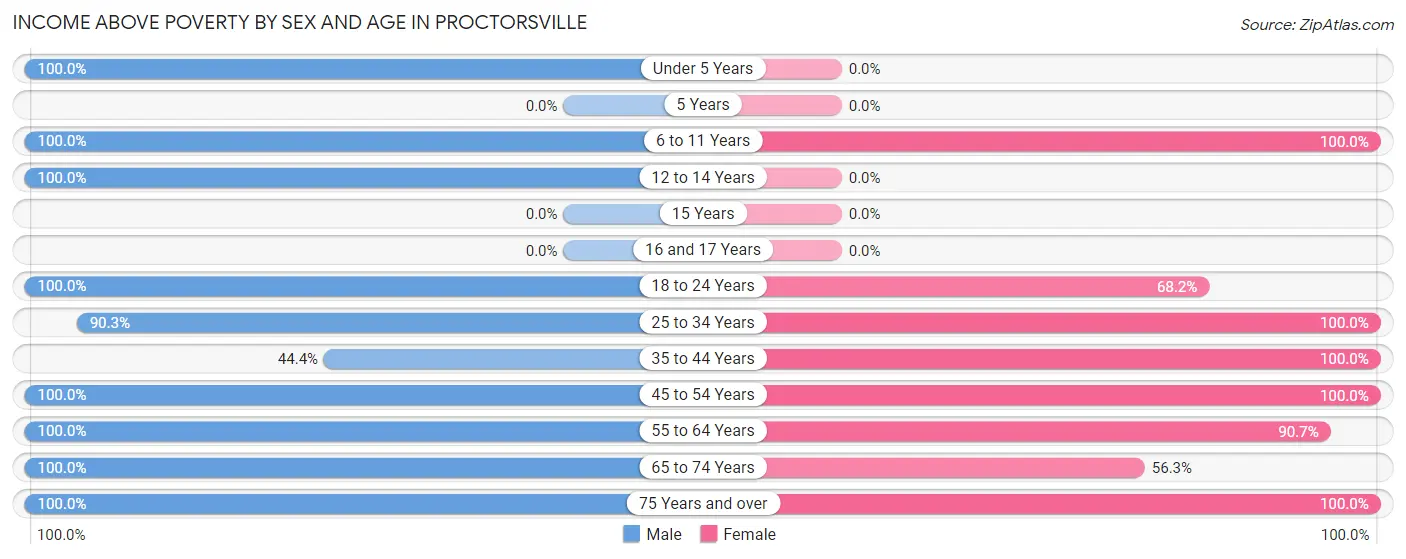
| Age Bracket | Male | Female |
| Under 5 Years | 25 (100.0%) | 0 (0.0%) |
| 5 Years | 0 (0.0%) | 0 (0.0%) |
| 6 to 11 Years | 15 (100.0%) | 13 (100.0%) |
| 12 to 14 Years | 9 (100.0%) | 0 (0.0%) |
| 15 Years | 0 (0.0%) | 0 (0.0%) |
| 16 and 17 Years | 0 (0.0%) | 0 (0.0%) |
| 18 to 24 Years | 13 (100.0%) | 15 (68.2%) |
| 25 to 34 Years | 28 (90.3%) | 19 (100.0%) |
| 35 to 44 Years | 4 (44.4%) | 10 (100.0%) |
| 45 to 54 Years | 16 (100.0%) | 28 (100.0%) |
| 55 to 64 Years | 42 (100.0%) | 39 (90.7%) |
| 65 to 74 Years | 7 (100.0%) | 18 (56.2%) |
| 75 Years and over | 6 (100.0%) | 3 (100.0%) |
| Total | 165 (95.4%) | 145 (85.3%) |
Income Below Poverty Among Married-Couple Families in Proctorsville
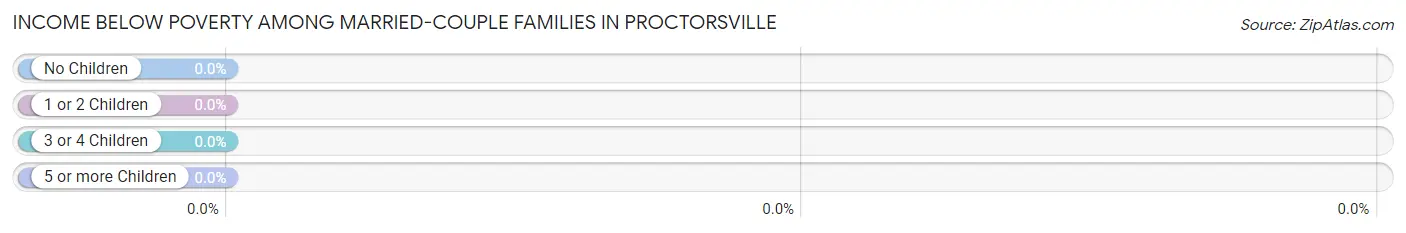
| Children | Above Poverty | Below Poverty |
| No Children | 44 (100.0%) | 0 (0.0%) |
| 1 or 2 Children | 24 (100.0%) | 0 (0.0%) |
| 3 or 4 Children | 0 (0.0%) | 0 (0.0%) |
| 5 or more Children | 0 (0.0%) | 0 (0.0%) |
| Total | 68 (100.0%) | 0 (0.0%) |
Income Below Poverty Among Single-Parent Households in Proctorsville
| Children | Single Father | Single Mother |
| No Children | 0 (0.0%) | 0 (0.0%) |
| 1 or 2 Children | 0 (0.0%) | 0 (0.0%) |
| 3 or 4 Children | 0 (0.0%) | 0 (0.0%) |
| 5 or more Children | 0 (0.0%) | 0 (0.0%) |
| Total | 0 (0.0%) | 0 (0.0%) |
Income Below Poverty Among Married-Couple vs Single-Parent Households in Proctorsville
| Children | Married-Couple Families | Single-Parent Households |
| No Children | 0 (0.0%) | 0 (0.0%) |
| 1 or 2 Children | 0 (0.0%) | 0 (0.0%) |
| 3 or 4 Children | 0 (0.0%) | 0 (0.0%) |
| 5 or more Children | 0 (0.0%) | 0 (0.0%) |
| Total | 0 (0.0%) | 0 (0.0%) |
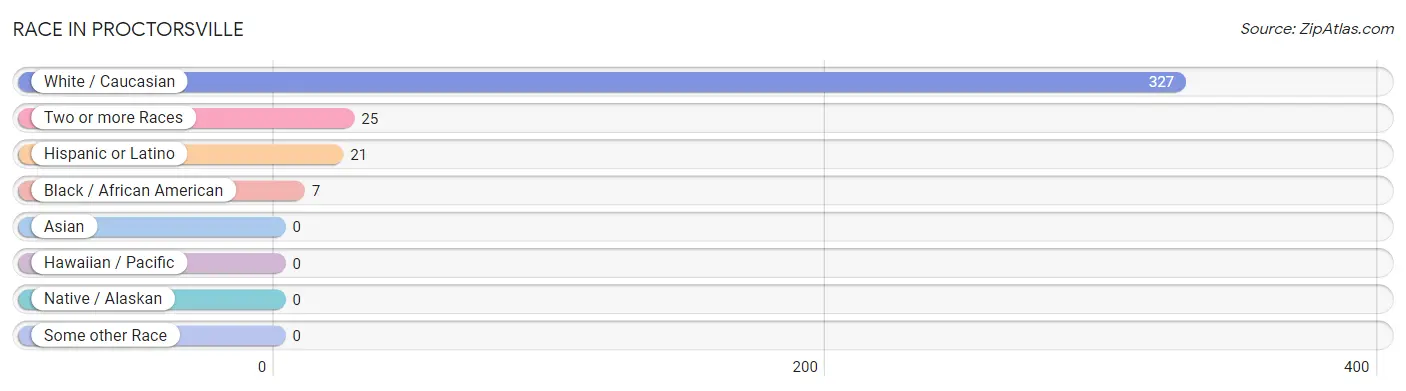
Race in Proctorsville
The most populous races in Proctorsville are White / Caucasian (327 | 91.1%), Two or more Races (25 | 7.0%), and Hispanic or Latino (21 | 5.9%).
| Race | # Population | % Population |
| Asian | 0 | 0.0% |
| Black / African American | 7 | 1.9% |
| Hawaiian / Pacific | 0 | 0.0% |
| Hispanic or Latino | 21 | 5.9% |
| Native / Alaskan | 0 | 0.0% |
| White / Caucasian | 327 | 91.1% |
| Two or more Races | 25 | 7.0% |
| Some other Race | 0 | 0.0% |
| Total | 359 | 100.0% |
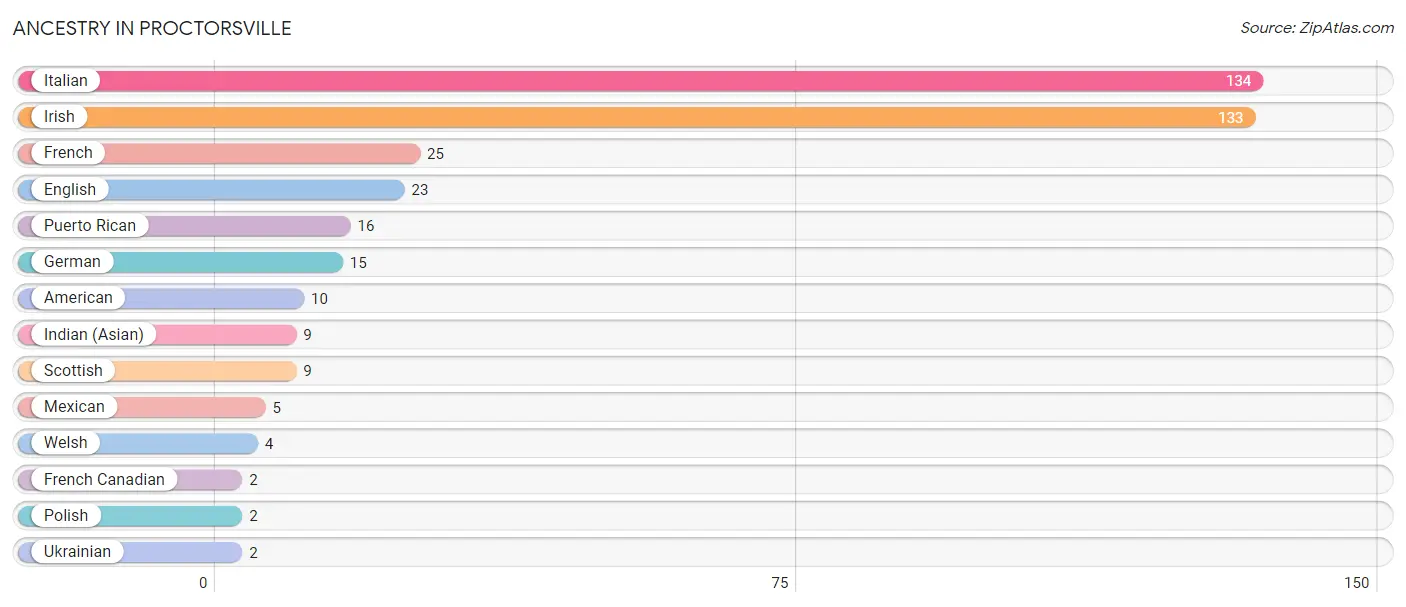
Ancestry in Proctorsville
The most populous ancestries reported in Proctorsville are Italian (134 | 37.3%), Irish (133 | 37.0%), French (25 | 7.0%), English (23 | 6.4%), and Puerto Rican (16 | 4.5%), together accounting for 92.2% of all Proctorsville residents.
| Ancestry | # Population | % Population |
| American | 10 | 2.8% |
| English | 23 | 6.4% |
| French | 25 | 7.0% |
| French Canadian | 2 | 0.6% |
| German | 15 | 4.2% |
| Indian (Asian) | 9 | 2.5% |
| Irish | 133 | 37.0% |
| Italian | 134 | 37.3% |
| Mexican | 5 | 1.4% |
| Polish | 2 | 0.6% |
| Puerto Rican | 16 | 4.5% |
| Scottish | 9 | 2.5% |
| Ukrainian | 2 | 0.6% |
| Welsh | 4 | 1.1% | View All 14 Rows |
Immigrants in Proctorsville

| Immigration Origin | # Population | % Population | View All 0 Rows |
Sex and Age in Proctorsville
Sex and Age in Proctorsville
The most populous age groups in Proctorsville are 25 to 29 Years (31 | 17.9%) for men and 55 to 59 Years (27 | 14.5%) for women.
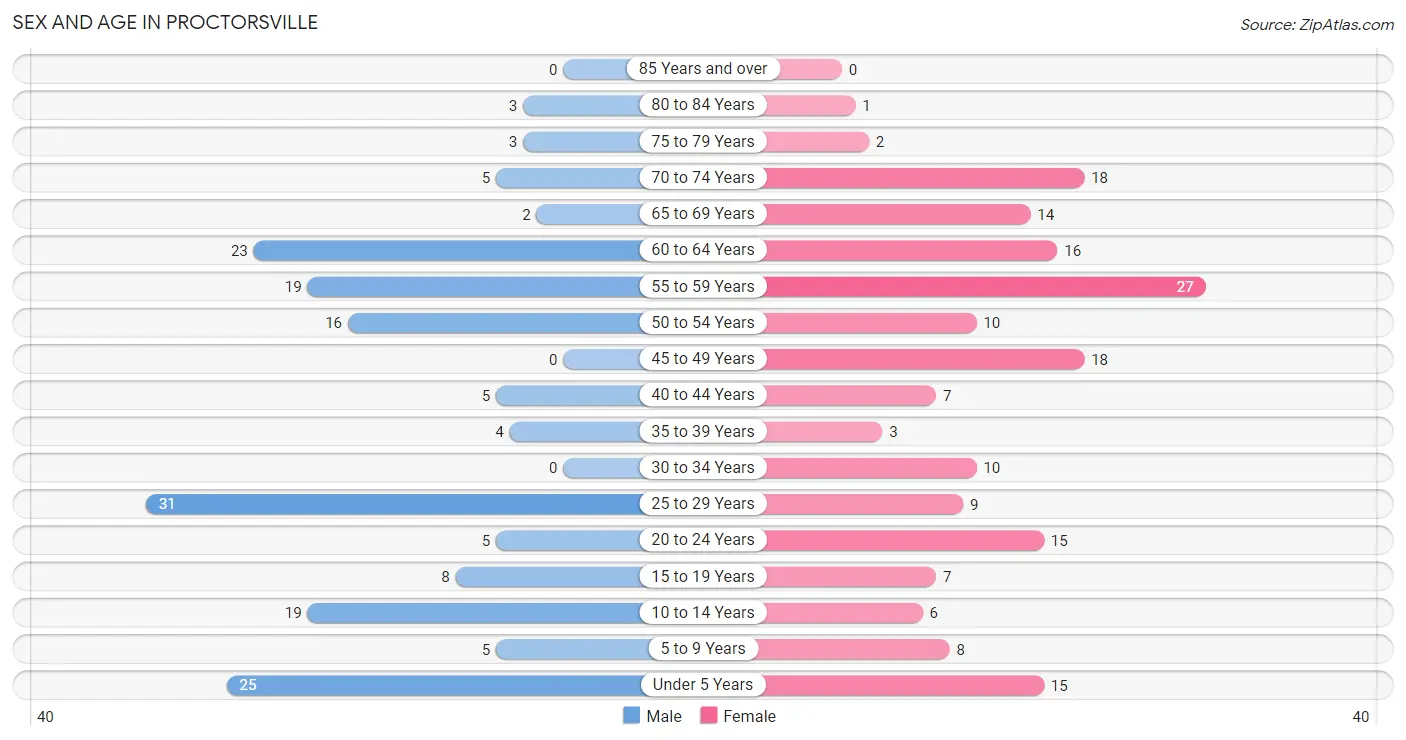
| Age Bracket | Male | Female |
| Under 5 Years | 25 (14.4%) | 15 (8.1%) |
| 5 to 9 Years | 5 (2.9%) | 8 (4.3%) |
| 10 to 14 Years | 19 (11.0%) | 6 (3.2%) |
| 15 to 19 Years | 8 (4.6%) | 7 (3.8%) |
| 20 to 24 Years | 5 (2.9%) | 15 (8.1%) |
| 25 to 29 Years | 31 (17.9%) | 9 (4.8%) |
| 30 to 34 Years | 0 (0.0%) | 10 (5.4%) |
| 35 to 39 Years | 4 (2.3%) | 3 (1.6%) |
| 40 to 44 Years | 5 (2.9%) | 7 (3.8%) |
| 45 to 49 Years | 0 (0.0%) | 18 (9.7%) |
| 50 to 54 Years | 16 (9.2%) | 10 (5.4%) |
| 55 to 59 Years | 19 (11.0%) | 27 (14.5%) |
| 60 to 64 Years | 23 (13.3%) | 16 (8.6%) |
| 65 to 69 Years | 2 (1.2%) | 14 (7.5%) |
| 70 to 74 Years | 5 (2.9%) | 18 (9.7%) |
| 75 to 79 Years | 3 (1.7%) | 2 (1.1%) |
| 80 to 84 Years | 3 (1.7%) | 1 (0.5%) |
| 85 Years and over | 0 (0.0%) | 0 (0.0%) |
| Total | 173 (100.0%) | 186 (100.0%) |
Families and Households in Proctorsville
Median Family Size in Proctorsville
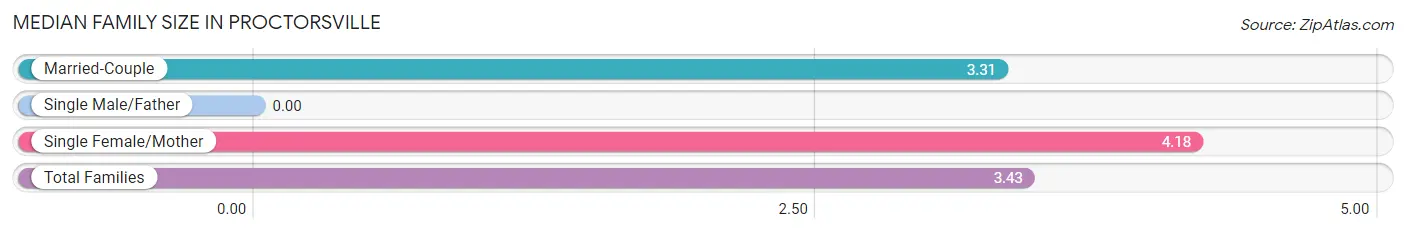
| Family Type | # Families | Family Size |
| Married-Couple | 68 (86.1%) | 3.31 |
| Single Male/Father | 0 (0.0%) | - |
| Single Female/Mother | 11 (13.9%) | 4.18 |
| Total Families | 79 (100.0%) | 3.43 |
Median Household Size in Proctorsville
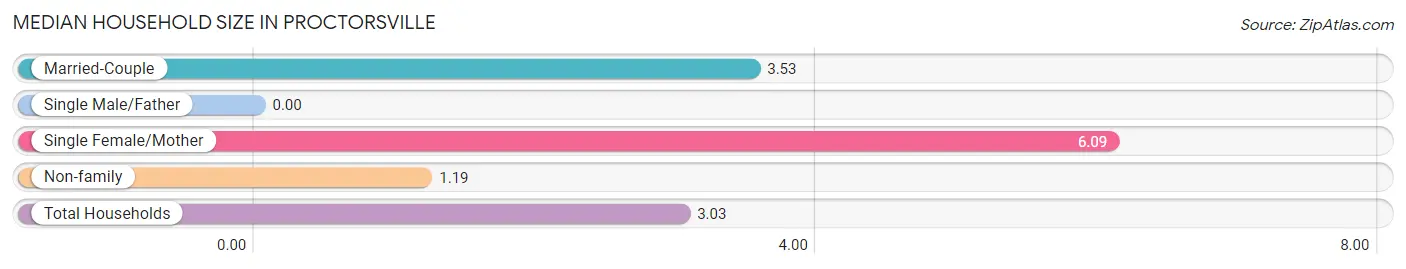
| Household Type | # Households | Household Size |
| Married-Couple | 68 (58.6%) | 3.53 |
| Single Male/Father | 0 (0.0%) | - |
| Single Female/Mother | 11 (9.5%) | 6.09 |
| Non-family | 37 (31.9%) | 1.19 |
| Total Households | 116 (100.0%) | 3.03 |
Household Size by Marriage Status in Proctorsville
Out of a total of 116 households in Proctorsville, 79 (68.1%) are family households, while 37 (31.9%) are nonfamily households. The most numerous type of family households are 2-person households, comprising 40, and the most common type of nonfamily households are 1-person households, comprising 29.
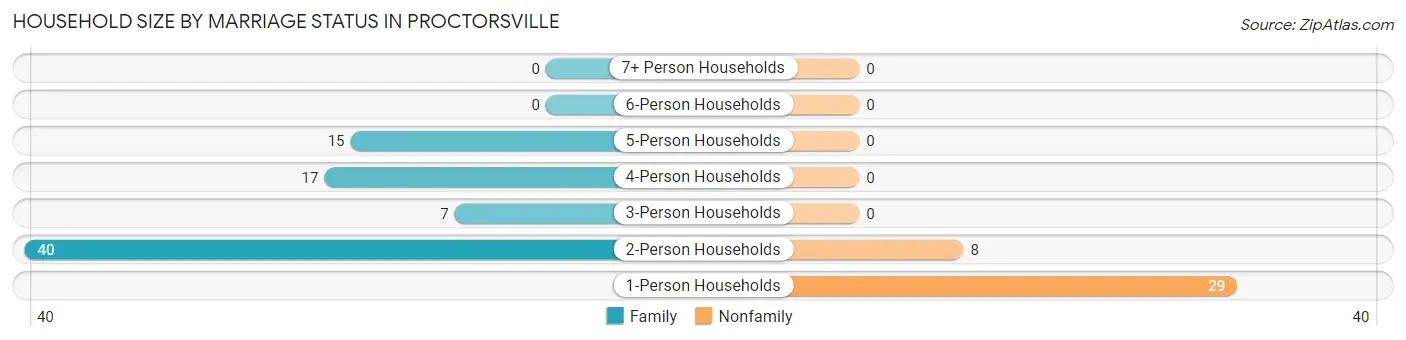
| Household Size | Family Households | Nonfamily Households |
| 1-Person Households | - | 29 (25.0%) |
| 2-Person Households | 40 (34.5%) | 8 (6.9%) |
| 3-Person Households | 7 (6.0%) | 0 (0.0%) |
| 4-Person Households | 17 (14.7%) | 0 (0.0%) |
| 5-Person Households | 15 (12.9%) | 0 (0.0%) |
| 6-Person Households | 0 (0.0%) | 0 (0.0%) |
| 7+ Person Households | 0 (0.0%) | 0 (0.0%) |
| Total | 79 (68.1%) | 37 (31.9%) |
Female Fertility in Proctorsville
Fertility by Age in Proctorsville
Average fertility rate in Proctorsville is 110.0 births per 1,000 women. Women in the age bracket of 20 to 34 years have the highest fertility rate with 235.0 births per 1,000 women. Women in the age bracket of 20 to 34 years acount for 100.0% of all women with births.
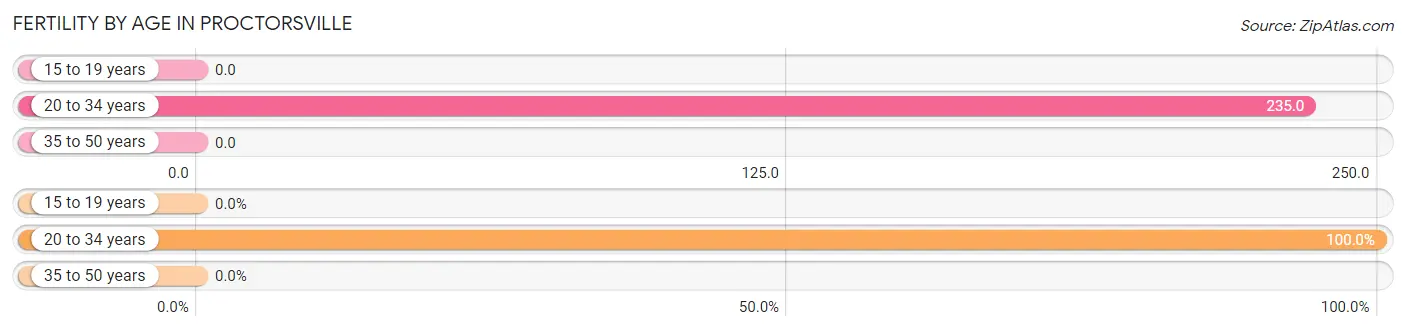
| Age Bracket | Women with Births | Births / 1,000 Women |
| 15 to 19 years | 0 (0.0%) | 0.0 |
| 20 to 34 years | 8 (100.0%) | 235.0 |
| 35 to 50 years | 0 (0.0%) | 0.0 |
| Total | 8 (100.0%) | 110.0 |
Fertility by Age by Marriage Status in Proctorsville
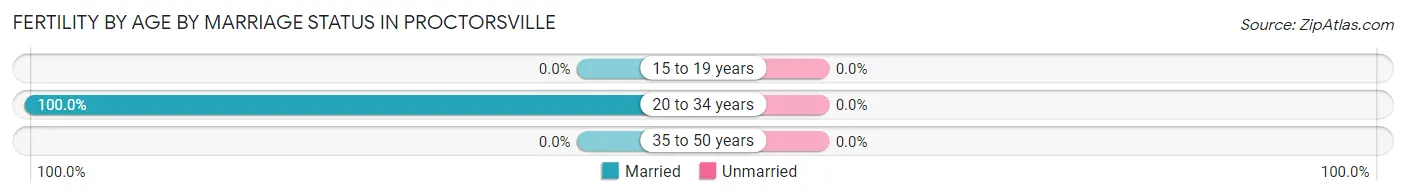
| Age Bracket | Married | Unmarried |
| 15 to 19 years | 0 (0.0%) | 0 (0.0%) |
| 20 to 34 years | 8 (100.0%) | 0 (0.0%) |
| 35 to 50 years | 0 (0.0%) | 0 (0.0%) |
| Total | 8 (100.0%) | 0 (0.0%) |
Fertility by Education in Proctorsville
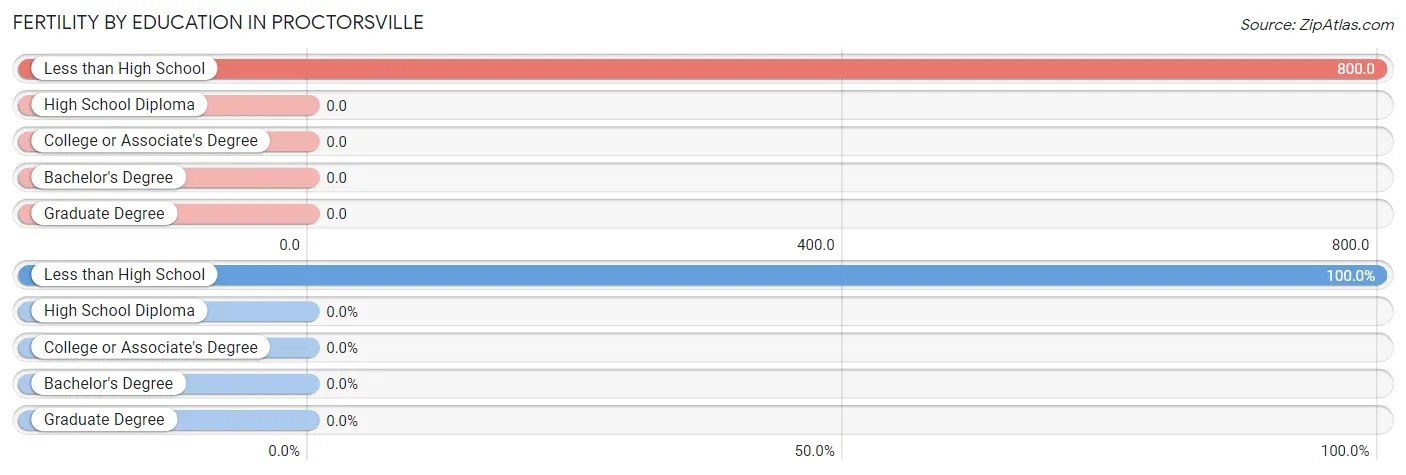
| Educational Attainment | Women with Births | Births / 1,000 Women |
| Less than High School | 8 (100.0%) | 800.0 |
| High School Diploma | 0 (0.0%) | 0.0 |
| College or Associate's Degree | 0 (0.0%) | 0.0 |
| Bachelor's Degree | 0 (0.0%) | 0.0 |
| Graduate Degree | 0 (0.0%) | 0.0 |
| Total | 8 (100.0%) | 110.0 |
Fertility by Education by Marriage Status in Proctorsville
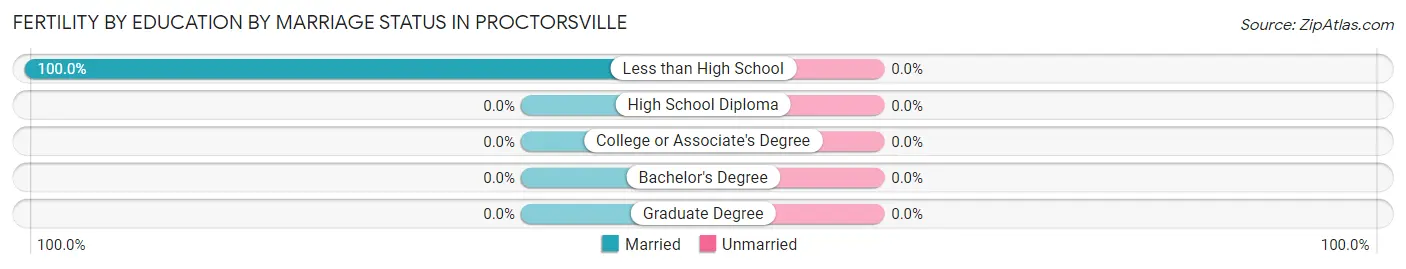
| Educational Attainment | Married | Unmarried |
| Less than High School | 8 (100.0%) | 0 (0.0%) |
| High School Diploma | 0 (0.0%) | 0 (0.0%) |
| College or Associate's Degree | 0 (0.0%) | 0 (0.0%) |
| Bachelor's Degree | 0 (0.0%) | 0 (0.0%) |
| Graduate Degree | 0 (0.0%) | 0 (0.0%) |
| Total | 8 (100.0%) | 0 (0.0%) |
Employment Characteristics in Proctorsville
Employment by Class of Employer in Proctorsville
Among the 206 employed individuals in Proctorsville, private company employees (157 | 76.2%), local government employees (23 | 11.2%), and self-employed (not incorporated) (10 | 4.9%) make up the most common classes of employment.
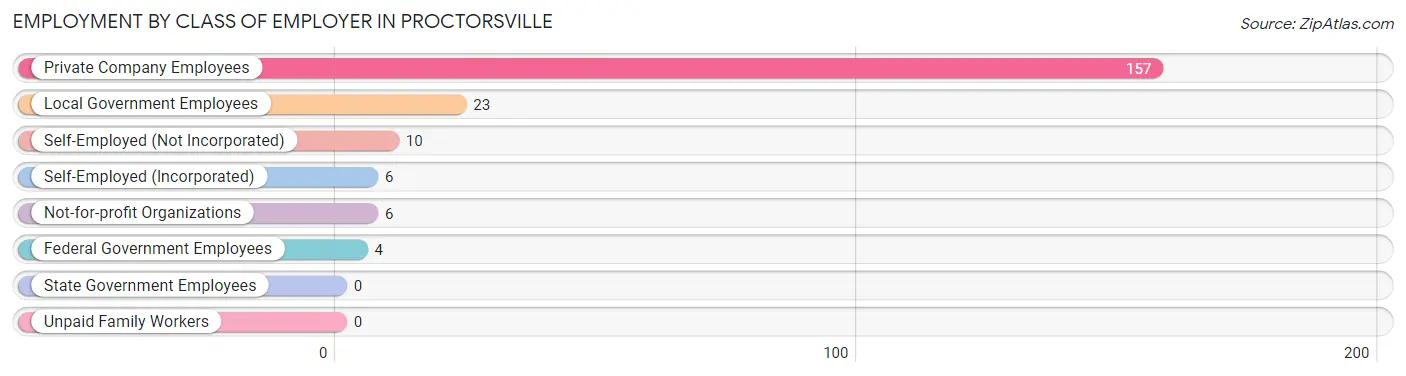
| Employer Class | # Employees | % Employees |
| Private Company Employees | 157 | 76.2% |
| Self-Employed (Incorporated) | 6 | 2.9% |
| Self-Employed (Not Incorporated) | 10 | 4.9% |
| Not-for-profit Organizations | 6 | 2.9% |
| Local Government Employees | 23 | 11.2% |
| State Government Employees | 0 | 0.0% |
| Federal Government Employees | 4 | 1.9% |
| Unpaid Family Workers | 0 | 0.0% |
| Total | 206 | 100.0% |
Employment Status by Age in Proctorsville
According to the labor force statistics for Proctorsville, out of the total population over 16 years of age (281), 74.7% or 210 individuals are in the labor force, with 1.9% or 4 of them unemployed. The age group with the highest labor force participation rate is 25 to 29 years, with 100.0% or 40 individuals in the labor force. Within the labor force, the 55 to 59 years age range has the highest percentage of unemployed individuals, with 9.8% or 4 of them being unemployed.
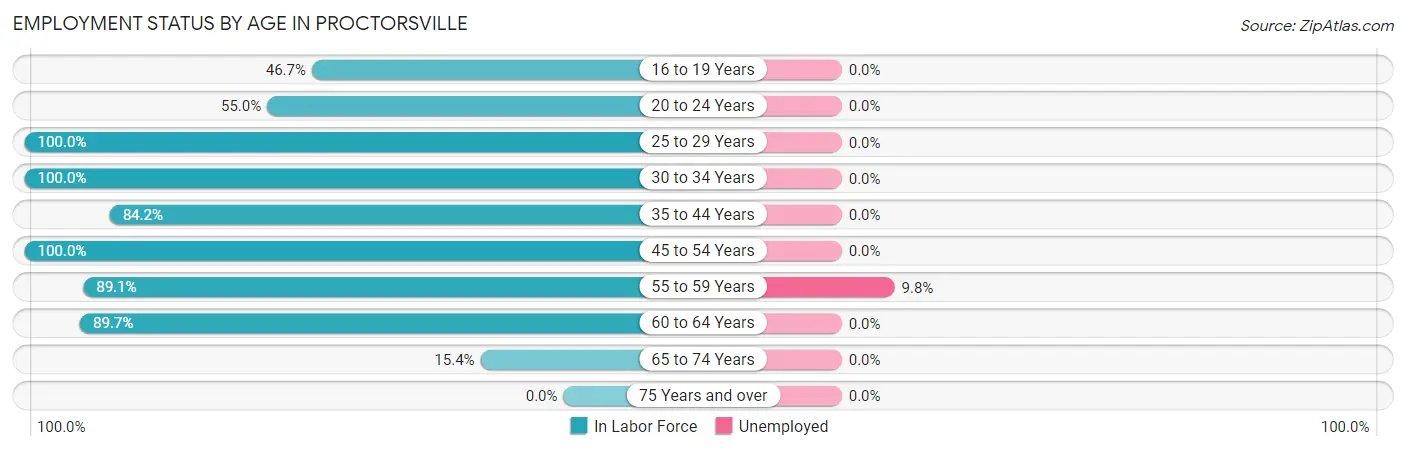
| Age Bracket | In Labor Force | Unemployed |
| 16 to 19 Years | 7 (46.7%) | 0 (0.0%) |
| 20 to 24 Years | 11 (55.0%) | 0 (0.0%) |
| 25 to 29 Years | 40 (100.0%) | 0 (0.0%) |
| 30 to 34 Years | 10 (100.0%) | 0 (0.0%) |
| 35 to 44 Years | 16 (84.2%) | 0 (0.0%) |
| 45 to 54 Years | 44 (100.0%) | 0 (0.0%) |
| 55 to 59 Years | 41 (89.1%) | 4 (9.8%) |
| 60 to 64 Years | 35 (89.7%) | 0 (0.0%) |
| 65 to 74 Years | 6 (15.4%) | 0 (0.0%) |
| 75 Years and over | 0 (0.0%) | 0 (0.0%) |
| Total | 210 (74.7%) | 4 (1.9%) |
Employment Status by Educational Attainment in Proctorsville
According to labor force statistics for Proctorsville, 93.9% of individuals (186) out of the total population between 25 and 64 years of age (198) are in the labor force, with 2.2% or 4 of them being unemployed. The group with the highest labor force participation rate are those with the educational attainment of less than high school, with 100.0% or 17 individuals in the labor force. Within the labor force, individuals with college / associate degree education have the highest percentage of unemployment, with 8.7% or 4 of them being unemployed.
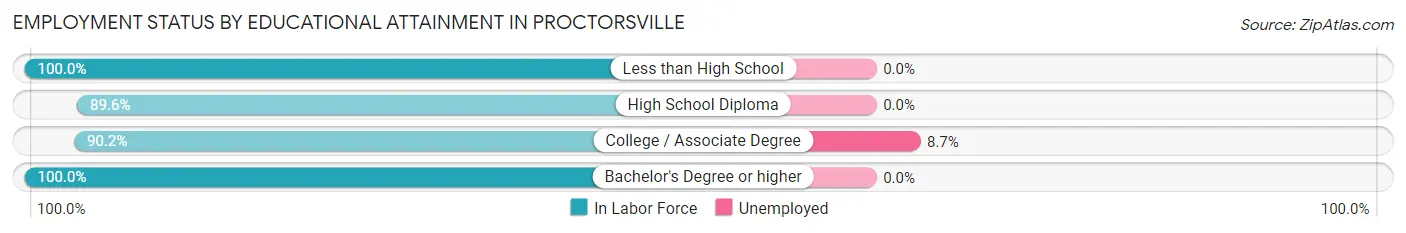
| Educational Attainment | In Labor Force | Unemployed |
| Less than High School | 17 (100.0%) | 0 (0.0%) |
| High School Diploma | 60 (89.6%) | 0 (0.0%) |
| College / Associate Degree | 46 (90.2%) | 4 (8.7%) |
| Bachelor's Degree or higher | 63 (100.0%) | 0 (0.0%) |
| Total | 186 (93.9%) | 4 (2.2%) |
Employment Occupations by Sex in Proctorsville
Management, Business, Science and Arts Occupations
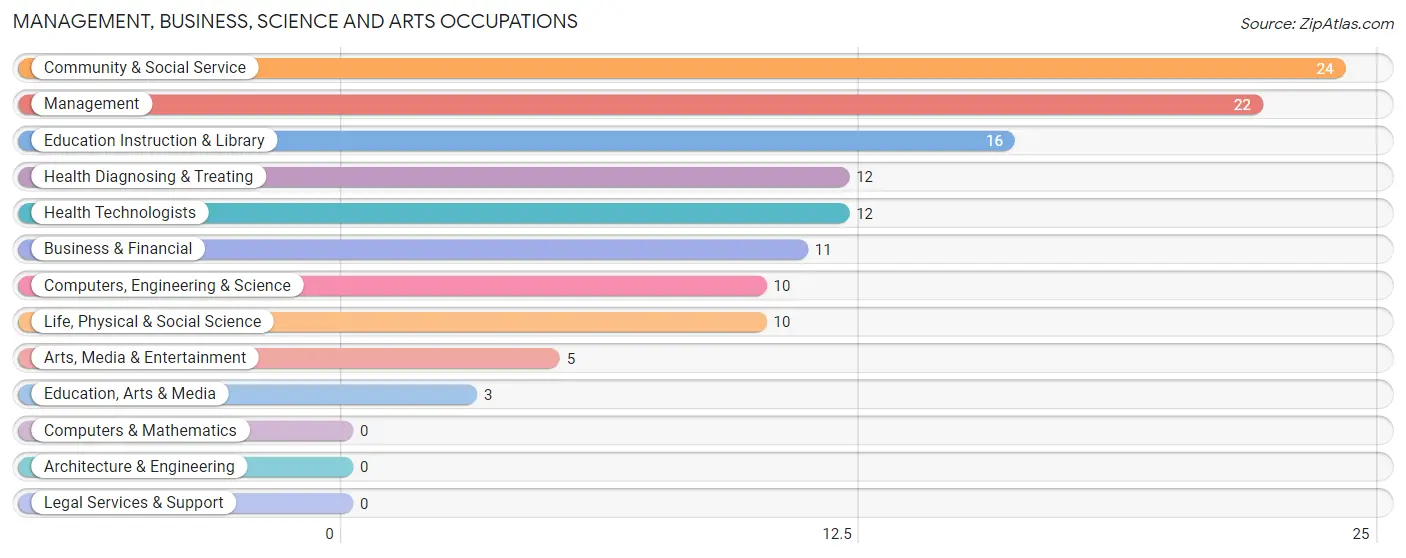
The most common Management, Business, Science and Arts occupations in Proctorsville are Community & Social Service (24 | 11.7%), Management (22 | 10.7%), Education Instruction & Library (16 | 7.8%), Health Diagnosing & Treating (12 | 5.8%), and Health Technologists (12 | 5.8%).
Management, Business, Science and Arts Occupations by Sex
Within the Management, Business, Science and Arts occupations in Proctorsville, the most male-oriented occupations are Business & Financial (100.0%), Arts, Media & Entertainment (100.0%), and Management (68.2%), while the most female-oriented occupations are Computers, Engineering & Science (100.0%), Life, Physical & Social Science (100.0%), and Education, Arts & Media (100.0%).
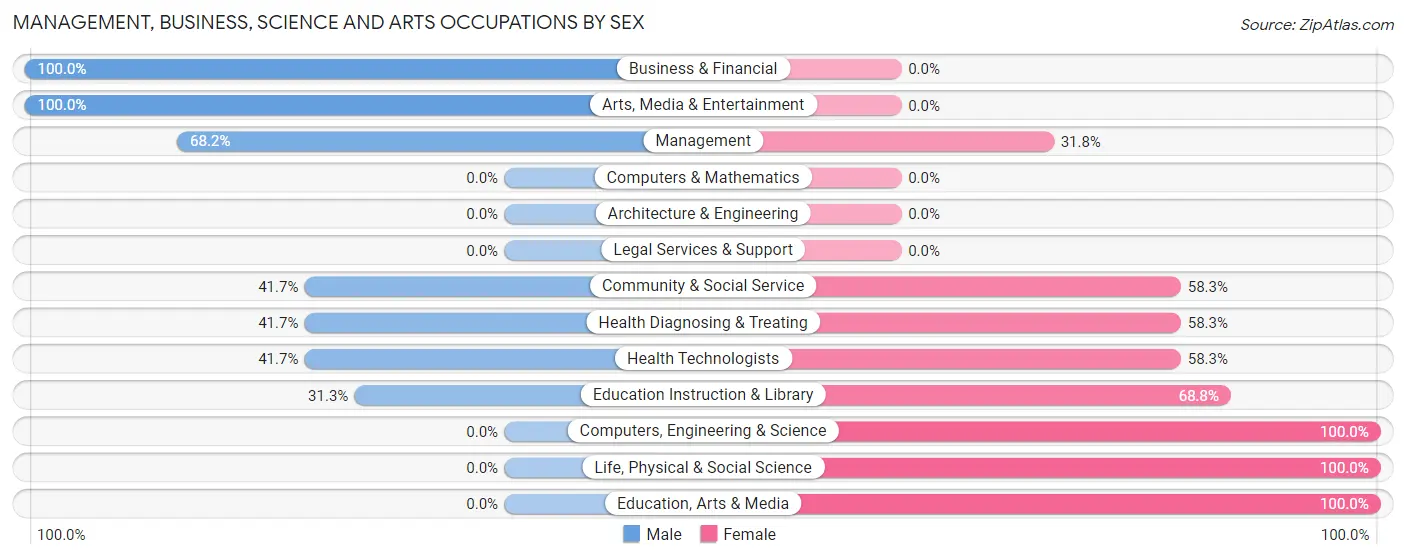
| Occupation | Male | Female |
| Management | 15 (68.2%) | 7 (31.8%) |
| Business & Financial | 11 (100.0%) | 0 (0.0%) |
| Computers, Engineering & Science | 0 (0.0%) | 10 (100.0%) |
| Computers & Mathematics | 0 (0.0%) | 0 (0.0%) |
| Architecture & Engineering | 0 (0.0%) | 0 (0.0%) |
| Life, Physical & Social Science | 0 (0.0%) | 10 (100.0%) |
| Community & Social Service | 10 (41.7%) | 14 (58.3%) |
| Education, Arts & Media | 0 (0.0%) | 3 (100.0%) |
| Legal Services & Support | 0 (0.0%) | 0 (0.0%) |
| Education Instruction & Library | 5 (31.2%) | 11 (68.8%) |
| Arts, Media & Entertainment | 5 (100.0%) | 0 (0.0%) |
| Health Diagnosing & Treating | 5 (41.7%) | 7 (58.3%) |
| Health Technologists | 5 (41.7%) | 7 (58.3%) |
| Total (Category) | 41 (51.9%) | 38 (48.1%) |
| Total (Overall) | 102 (49.5%) | 104 (50.5%) |
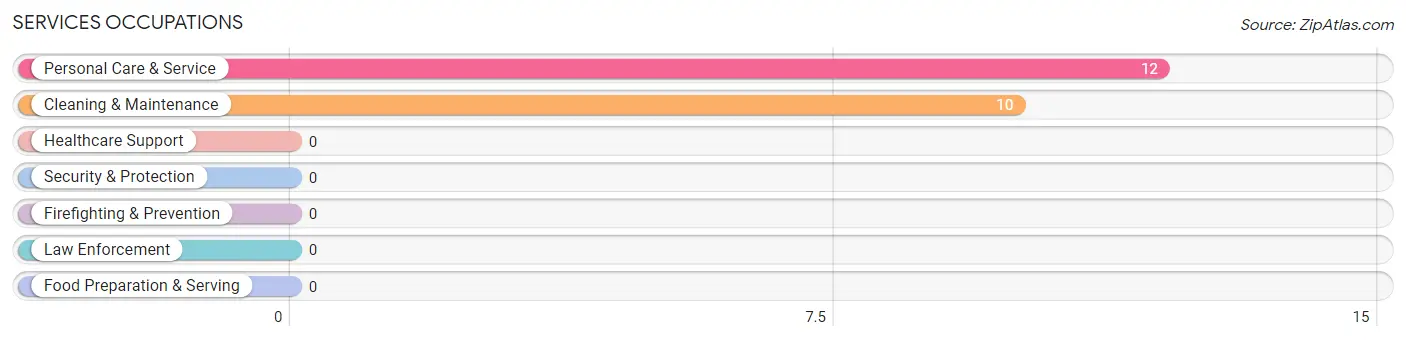
Services Occupations
The most common Services occupations in Proctorsville are Personal Care & Service (12 | 5.8%), and Cleaning & Maintenance (10 | 4.9%).
Services Occupations by Sex
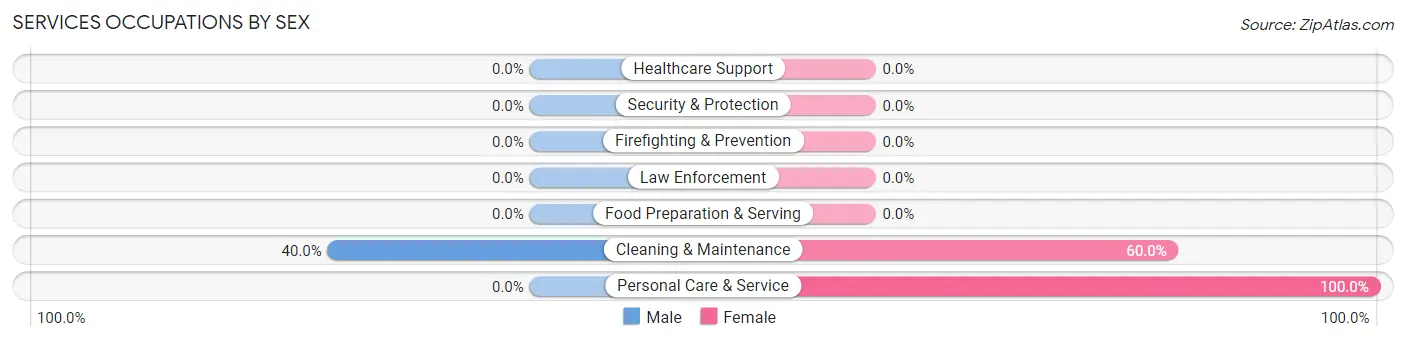
| Occupation | Male | Female |
| Healthcare Support | 0 (0.0%) | 0 (0.0%) |
| Security & Protection | 0 (0.0%) | 0 (0.0%) |
| Firefighting & Prevention | 0 (0.0%) | 0 (0.0%) |
| Law Enforcement | 0 (0.0%) | 0 (0.0%) |
| Food Preparation & Serving | 0 (0.0%) | 0 (0.0%) |
| Cleaning & Maintenance | 4 (40.0%) | 6 (60.0%) |
| Personal Care & Service | 0 (0.0%) | 12 (100.0%) |
| Total (Category) | 4 (18.2%) | 18 (81.8%) |
| Total (Overall) | 102 (49.5%) | 104 (50.5%) |
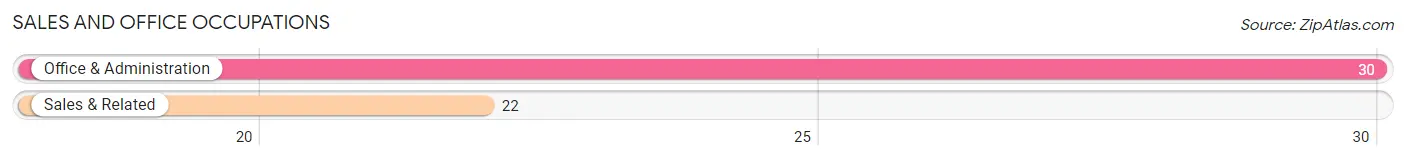
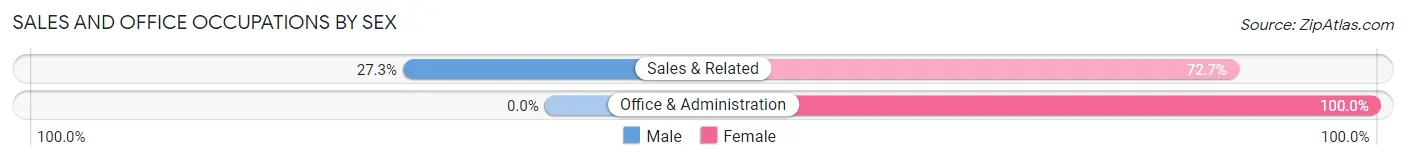
Sales and Office Occupations
The most common Sales and Office occupations in Proctorsville are Office & Administration (30 | 14.6%), and Sales & Related (22 | 10.7%).
Sales and Office Occupations by Sex
| Occupation | Male | Female |
| Sales & Related | 6 (27.3%) | 16 (72.7%) |
| Office & Administration | 0 (0.0%) | 30 (100.0%) |
| Total (Category) | 6 (11.5%) | 46 (88.5%) |
| Total (Overall) | 102 (49.5%) | 104 (50.5%) |
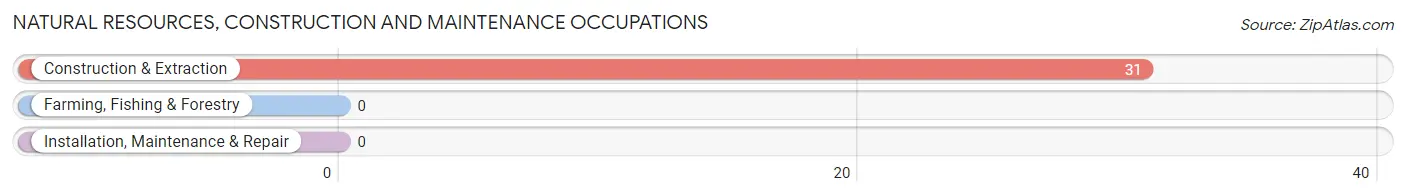
Natural Resources, Construction and Maintenance Occupations
The most common Natural Resources, Construction and Maintenance occupations in Proctorsville are , and Construction & Extraction (31 | 15.0%).
Natural Resources, Construction and Maintenance Occupations by Sex
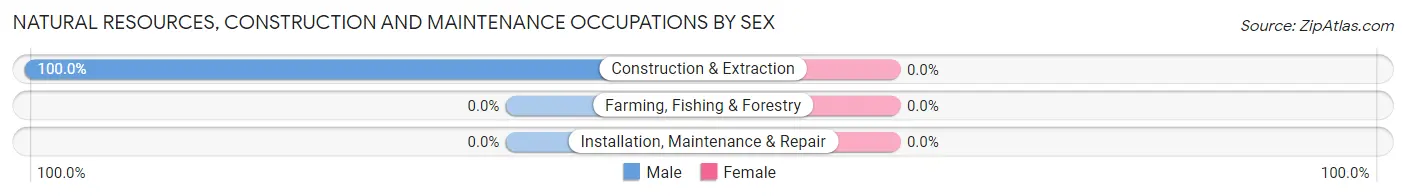
| Occupation | Male | Female |
| Farming, Fishing & Forestry | 0 (0.0%) | 0 (0.0%) |
| Construction & Extraction | 31 (100.0%) | 0 (0.0%) |
| Installation, Maintenance & Repair | 0 (0.0%) | 0 (0.0%) |
| Total (Category) | 31 (100.0%) | 0 (0.0%) |
| Total (Overall) | 102 (49.5%) | 104 (50.5%) |
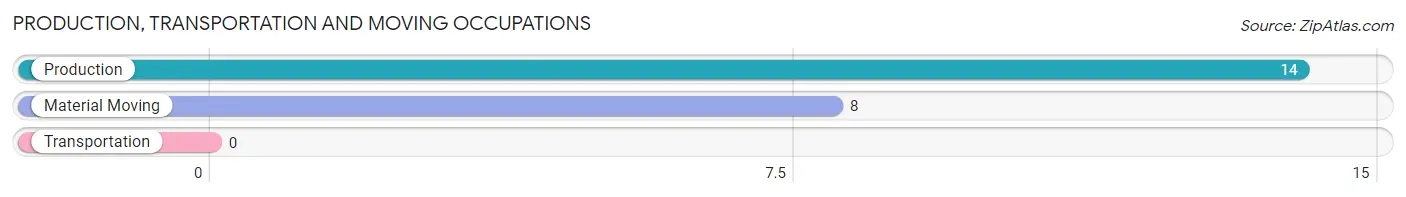
Production, Transportation and Moving Occupations
The most common Production, Transportation and Moving occupations in Proctorsville are Production (14 | 6.8%), and Material Moving (8 | 3.9%).
Production, Transportation and Moving Occupations by Sex
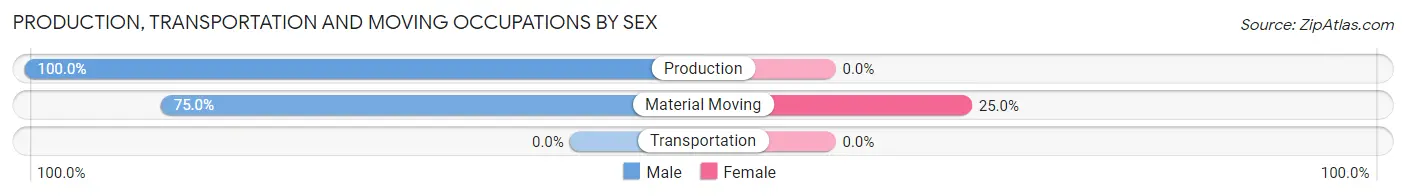
| Occupation | Male | Female |
| Production | 14 (100.0%) | 0 (0.0%) |
| Transportation | 0 (0.0%) | 0 (0.0%) |
| Material Moving | 6 (75.0%) | 2 (25.0%) |
| Total (Category) | 20 (90.9%) | 2 (9.1%) |
| Total (Overall) | 102 (49.5%) | 104 (50.5%) |
Employment Industries by Sex in Proctorsville
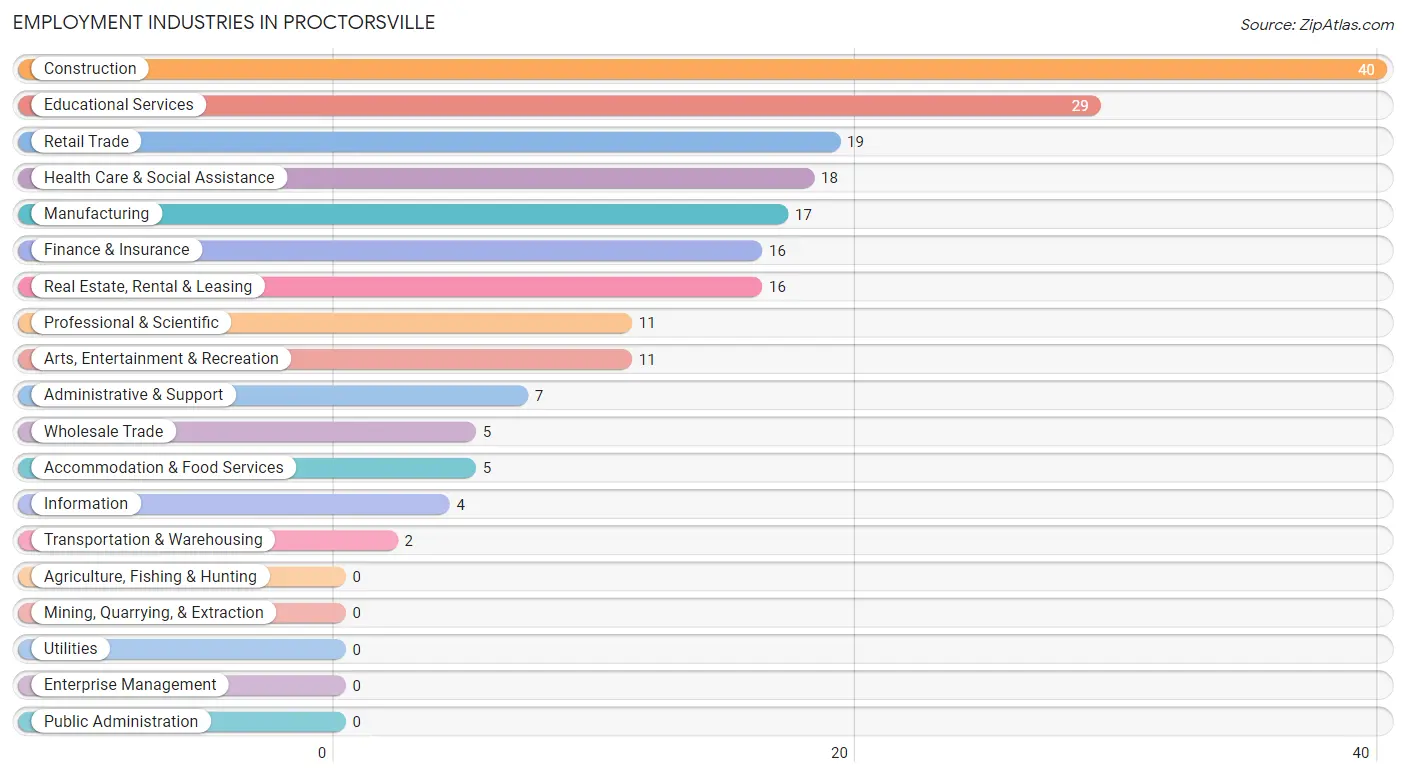
Employment Industries in Proctorsville
The major employment industries in Proctorsville include Construction (40 | 19.4%), Educational Services (29 | 14.1%), Retail Trade (19 | 9.2%), Health Care & Social Assistance (18 | 8.7%), and Manufacturing (17 | 8.3%).
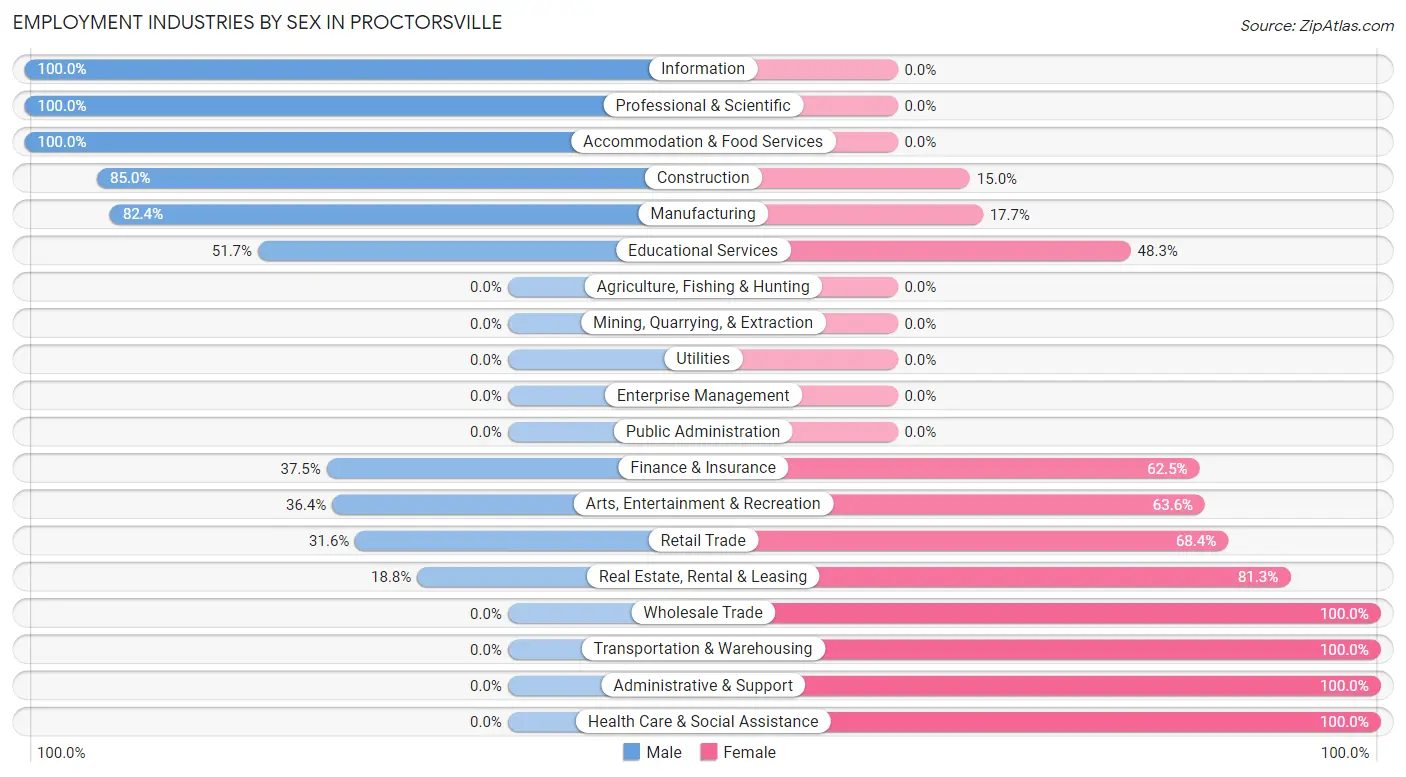
Employment Industries by Sex in Proctorsville
The Proctorsville industries that see more men than women are Information (100.0%), Professional & Scientific (100.0%), and Accommodation & Food Services (100.0%), whereas the industries that tend to have a higher number of women are Wholesale Trade (100.0%), Transportation & Warehousing (100.0%), and Administrative & Support (100.0%).
| Industry | Male | Female |
| Agriculture, Fishing & Hunting | 0 (0.0%) | 0 (0.0%) |
| Mining, Quarrying, & Extraction | 0 (0.0%) | 0 (0.0%) |
| Construction | 34 (85.0%) | 6 (15.0%) |
| Manufacturing | 14 (82.4%) | 3 (17.6%) |
| Wholesale Trade | 0 (0.0%) | 5 (100.0%) |
| Retail Trade | 6 (31.6%) | 13 (68.4%) |
| Transportation & Warehousing | 0 (0.0%) | 2 (100.0%) |
| Utilities | 0 (0.0%) | 0 (0.0%) |
| Information | 4 (100.0%) | 0 (0.0%) |
| Finance & Insurance | 6 (37.5%) | 10 (62.5%) |
| Real Estate, Rental & Leasing | 3 (18.8%) | 13 (81.2%) |
| Professional & Scientific | 11 (100.0%) | 0 (0.0%) |
| Enterprise Management | 0 (0.0%) | 0 (0.0%) |
| Administrative & Support | 0 (0.0%) | 7 (100.0%) |
| Educational Services | 15 (51.7%) | 14 (48.3%) |
| Health Care & Social Assistance | 0 (0.0%) | 18 (100.0%) |
| Arts, Entertainment & Recreation | 4 (36.4%) | 7 (63.6%) |
| Accommodation & Food Services | 5 (100.0%) | 0 (0.0%) |
| Public Administration | 0 (0.0%) | 0 (0.0%) |
| Total | 102 (49.5%) | 104 (50.5%) |
Education in Proctorsville
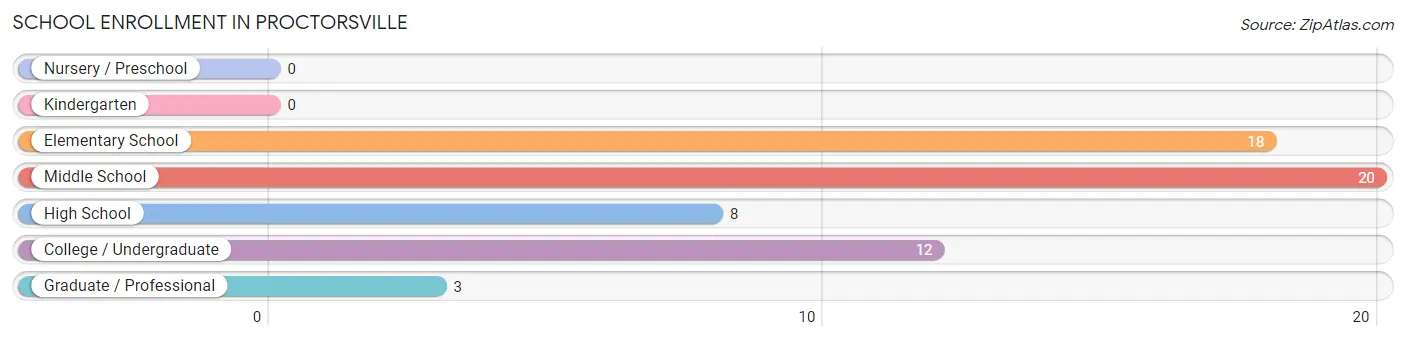
School Enrollment in Proctorsville
The most common levels of schooling among the 61 students in Proctorsville are middle school (20 | 32.8%), elementary school (18 | 29.5%), and college / undergraduate (12 | 19.7%).
| School Level | # Students | % Students |
| Nursery / Preschool | 0 | 0.0% |
| Kindergarten | 0 | 0.0% |
| Elementary School | 18 | 29.5% |
| Middle School | 20 | 32.8% |
| High School | 8 | 13.1% |
| College / Undergraduate | 12 | 19.7% |
| Graduate / Professional | 3 | 4.9% |
| Total | 61 | 100.0% |
School Enrollment by Age by Funding Source in Proctorsville
Out of a total of 61 students who are enrolled in schools in Proctorsville, 27 (44.3%) attend a private institution, while the remaining 34 (55.7%) are enrolled in public schools. The age group of 10 to 14 year olds has the highest likelihood of being enrolled in private schools, with 19 (76.0% in the age bracket) enrolled. Conversely, the age group of 18 to 19 year olds has the lowest likelihood of being enrolled in a private school, with 15 (100.0% in the age bracket) attending a public institution.
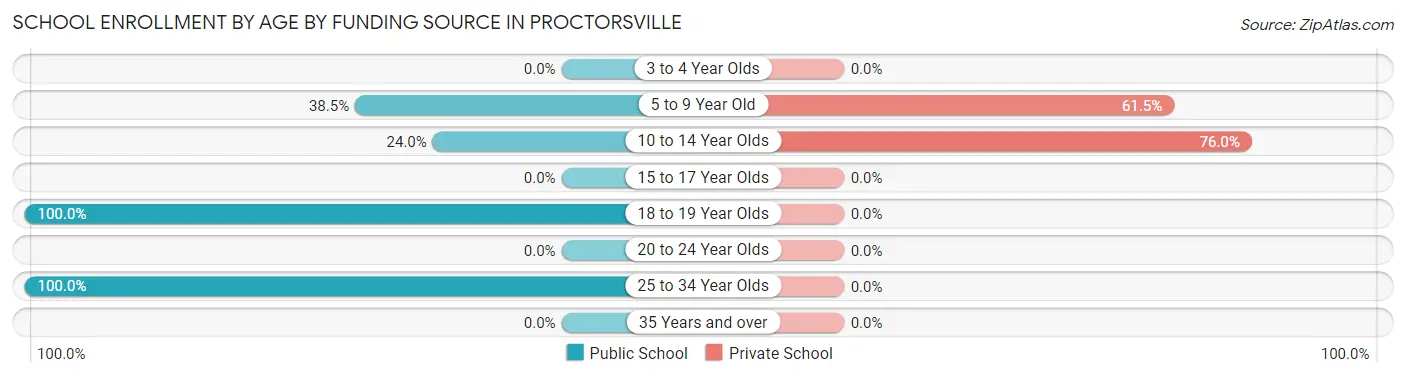
| Age Bracket | Public School | Private School |
| 3 to 4 Year Olds | 0 (0.0%) | 0 (0.0%) |
| 5 to 9 Year Old | 5 (38.5%) | 8 (61.5%) |
| 10 to 14 Year Olds | 6 (24.0%) | 19 (76.0%) |
| 15 to 17 Year Olds | 0 (0.0%) | 0 (0.0%) |
| 18 to 19 Year Olds | 15 (100.0%) | 0 (0.0%) |
| 20 to 24 Year Olds | 0 (0.0%) | 0 (0.0%) |
| 25 to 34 Year Olds | 8 (100.0%) | 0 (0.0%) |
| 35 Years and over | 0 (0.0%) | 0 (0.0%) |
| Total | 34 (55.7%) | 27 (44.3%) |
Educational Attainment by Field of Study in Proctorsville
Computers & mathematics (14 | 13.7%), visual & performing arts (13 | 12.8%), psychology (11 | 10.8%), education (11 | 10.8%), and bio, nature & agricultural (10 | 9.8%) are the most common fields of study among 102 individuals in Proctorsville who have obtained a bachelor's degree or higher.
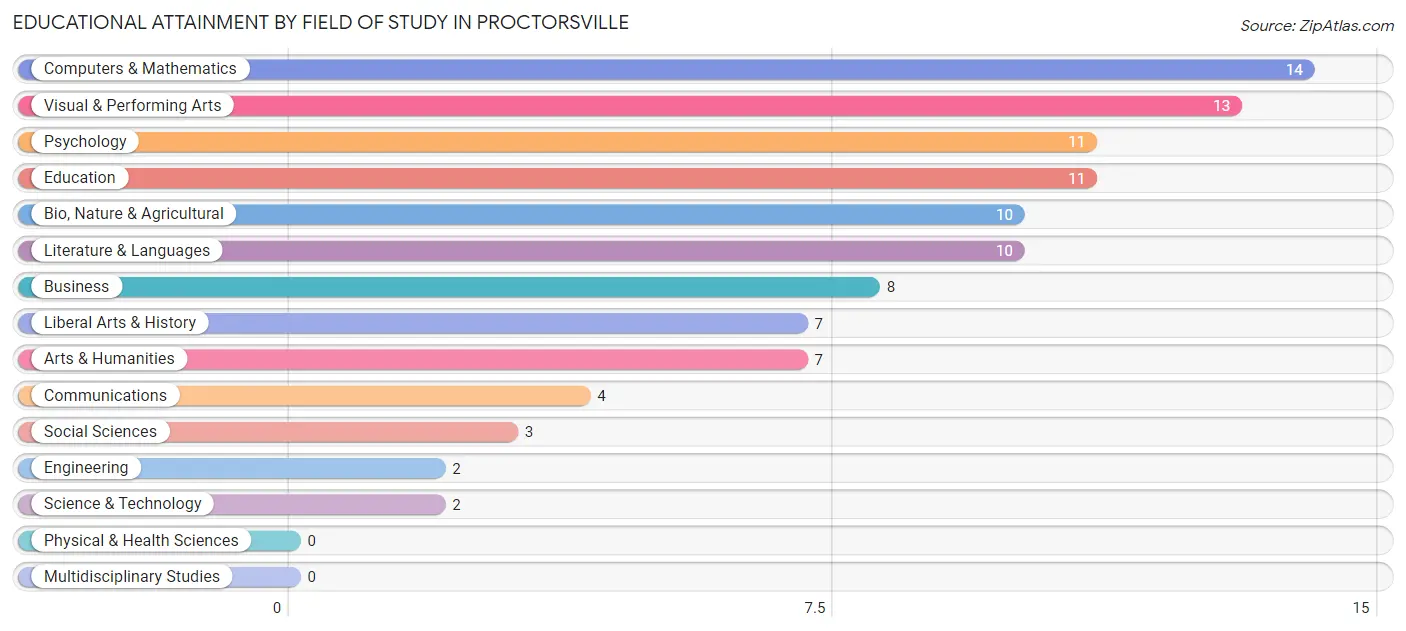
| Field of Study | # Graduates | % Graduates |
| Computers & Mathematics | 14 | 13.7% |
| Bio, Nature & Agricultural | 10 | 9.8% |
| Physical & Health Sciences | 0 | 0.0% |
| Psychology | 11 | 10.8% |
| Social Sciences | 3 | 2.9% |
| Engineering | 2 | 2.0% |
| Multidisciplinary Studies | 0 | 0.0% |
| Science & Technology | 2 | 2.0% |
| Business | 8 | 7.8% |
| Education | 11 | 10.8% |
| Literature & Languages | 10 | 9.8% |
| Liberal Arts & History | 7 | 6.9% |
| Visual & Performing Arts | 13 | 12.8% |
| Communications | 4 | 3.9% |
| Arts & Humanities | 7 | 6.9% |
| Total | 102 | 100.0% |
Transportation & Commute in Proctorsville
Vehicle Availability by Sex in Proctorsville
The most prevalent vehicle ownership categories in Proctorsville are males with 2 vehicles (78, accounting for 76.5%) and females with 2 vehicles (55, making up 76.5%).
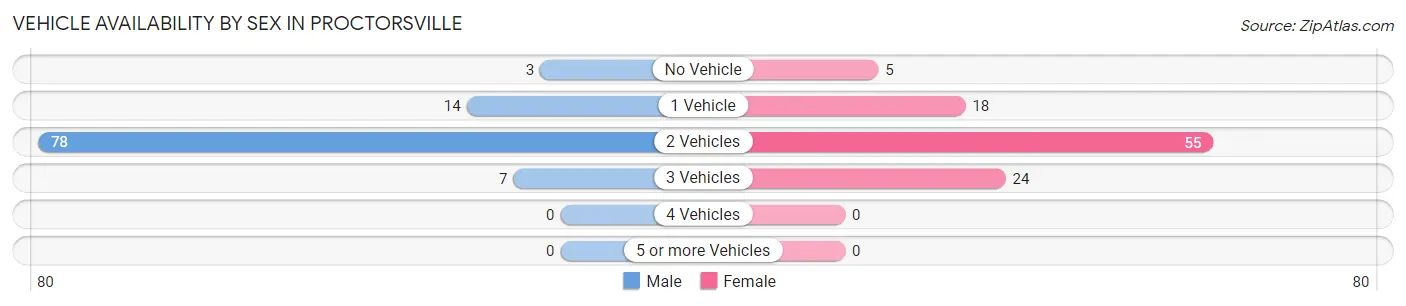
| Vehicles Available | Male | Female |
| No Vehicle | 3 (2.9%) | 5 (4.9%) |
| 1 Vehicle | 14 (13.7%) | 18 (17.6%) |
| 2 Vehicles | 78 (76.5%) | 55 (53.9%) |
| 3 Vehicles | 7 (6.9%) | 24 (23.5%) |
| 4 Vehicles | 0 (0.0%) | 0 (0.0%) |
| 5 or more Vehicles | 0 (0.0%) | 0 (0.0%) |
| Total | 102 (100.0%) | 102 (100.0%) |
Commute Time in Proctorsville
The most frequently occuring commute durations in Proctorsville are 15 to 19 minutes (63 commuters, 32.5%), 5 to 9 minutes (31 commuters, 16.0%), and 40 to 44 minutes (22 commuters, 11.3%).
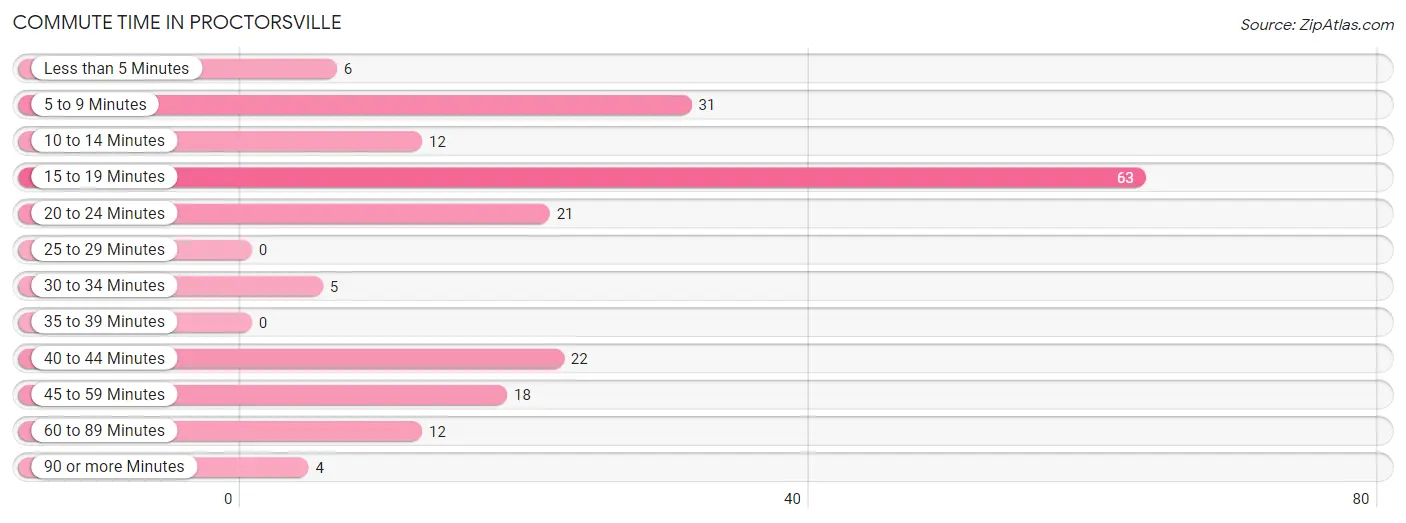
| Commute Time | # Commuters | % Commuters |
| Less than 5 Minutes | 6 | 3.1% |
| 5 to 9 Minutes | 31 | 16.0% |
| 10 to 14 Minutes | 12 | 6.2% |
| 15 to 19 Minutes | 63 | 32.5% |
| 20 to 24 Minutes | 21 | 10.8% |
| 25 to 29 Minutes | 0 | 0.0% |
| 30 to 34 Minutes | 5 | 2.6% |
| 35 to 39 Minutes | 0 | 0.0% |
| 40 to 44 Minutes | 22 | 11.3% |
| 45 to 59 Minutes | 18 | 9.3% |
| 60 to 89 Minutes | 12 | 6.2% |
| 90 or more Minutes | 4 | 2.1% |
Commute Time by Sex in Proctorsville
The most common commute times in Proctorsville are 15 to 19 minutes (36 commuters, 38.7%) for males and 5 to 9 minutes (27 commuters, 26.7%) for females.
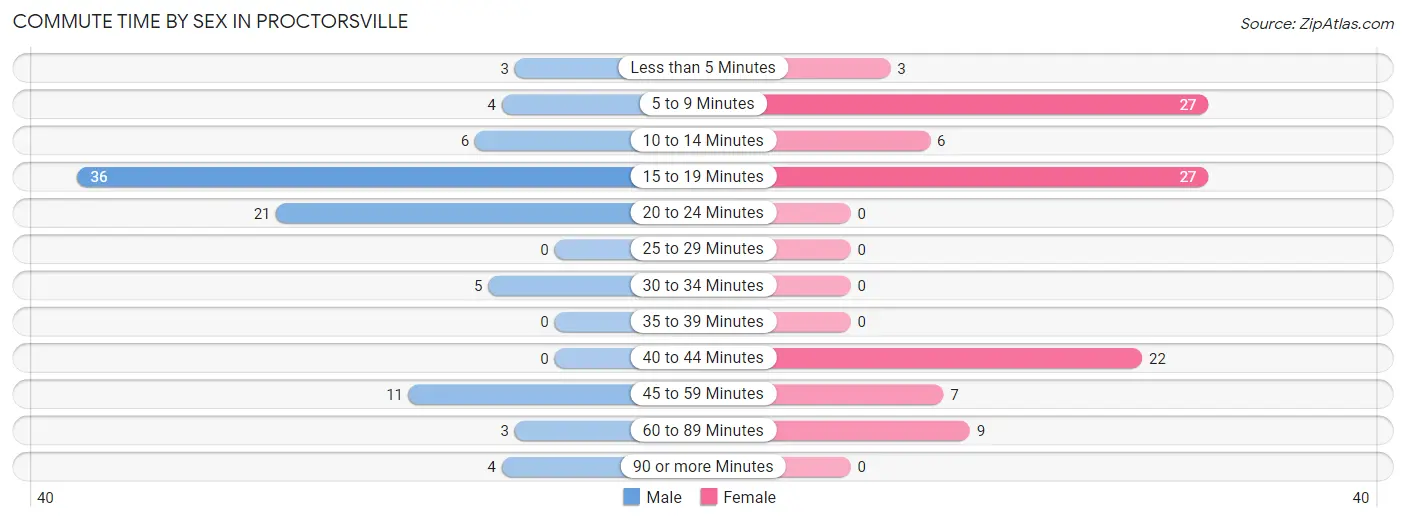
| Commute Time | Male | Female |
| Less than 5 Minutes | 3 (3.2%) | 3 (3.0%) |
| 5 to 9 Minutes | 4 (4.3%) | 27 (26.7%) |
| 10 to 14 Minutes | 6 (6.5%) | 6 (5.9%) |
| 15 to 19 Minutes | 36 (38.7%) | 27 (26.7%) |
| 20 to 24 Minutes | 21 (22.6%) | 0 (0.0%) |
| 25 to 29 Minutes | 0 (0.0%) | 0 (0.0%) |
| 30 to 34 Minutes | 5 (5.4%) | 0 (0.0%) |
| 35 to 39 Minutes | 0 (0.0%) | 0 (0.0%) |
| 40 to 44 Minutes | 0 (0.0%) | 22 (21.8%) |
| 45 to 59 Minutes | 11 (11.8%) | 7 (6.9%) |
| 60 to 89 Minutes | 3 (3.2%) | 9 (8.9%) |
| 90 or more Minutes | 4 (4.3%) | 0 (0.0%) |
Time of Departure to Work by Sex in Proctorsville
The most frequent times of departure to work in Proctorsville are 7:30 AM to 7:59 AM (28, 30.1%) for males and 7:00 AM to 7:29 AM (28, 27.7%) for females.
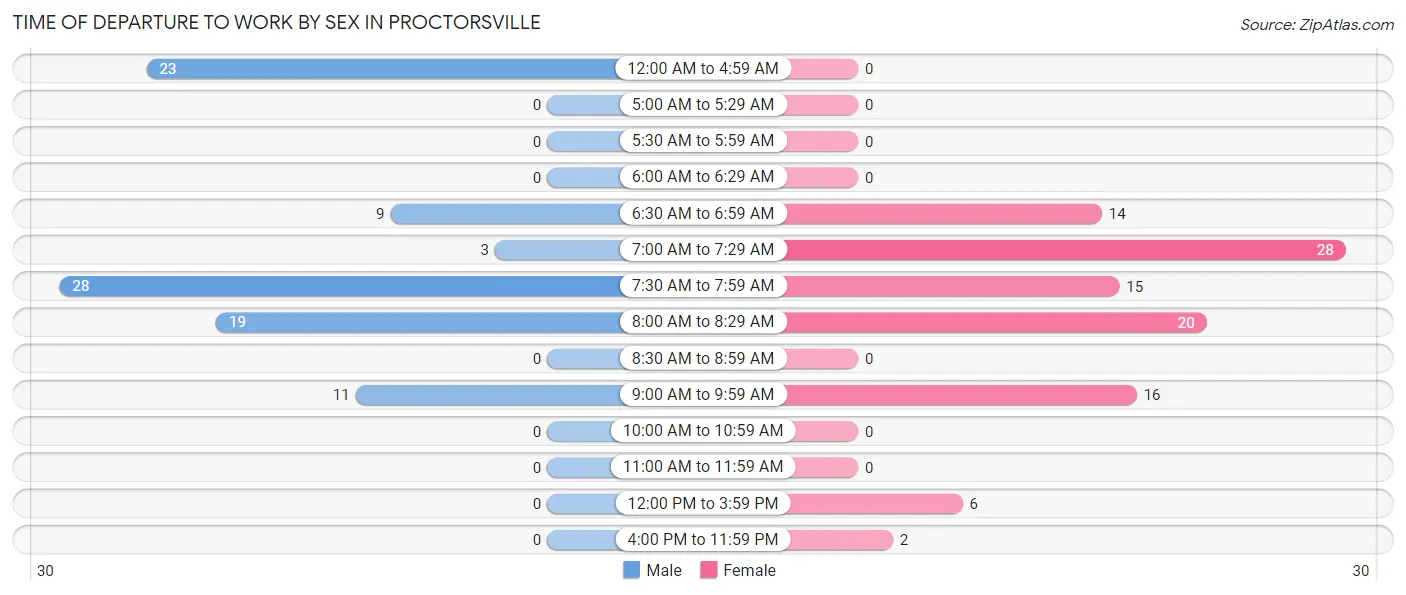
| Time of Departure | Male | Female |
| 12:00 AM to 4:59 AM | 23 (24.7%) | 0 (0.0%) |
| 5:00 AM to 5:29 AM | 0 (0.0%) | 0 (0.0%) |
| 5:30 AM to 5:59 AM | 0 (0.0%) | 0 (0.0%) |
| 6:00 AM to 6:29 AM | 0 (0.0%) | 0 (0.0%) |
| 6:30 AM to 6:59 AM | 9 (9.7%) | 14 (13.9%) |
| 7:00 AM to 7:29 AM | 3 (3.2%) | 28 (27.7%) |
| 7:30 AM to 7:59 AM | 28 (30.1%) | 15 (14.8%) |
| 8:00 AM to 8:29 AM | 19 (20.4%) | 20 (19.8%) |
| 8:30 AM to 8:59 AM | 0 (0.0%) | 0 (0.0%) |
| 9:00 AM to 9:59 AM | 11 (11.8%) | 16 (15.8%) |
| 10:00 AM to 10:59 AM | 0 (0.0%) | 0 (0.0%) |
| 11:00 AM to 11:59 AM | 0 (0.0%) | 0 (0.0%) |
| 12:00 PM to 3:59 PM | 0 (0.0%) | 6 (5.9%) |
| 4:00 PM to 11:59 PM | 0 (0.0%) | 2 (2.0%) |
| Total | 93 (100.0%) | 101 (100.0%) |
Housing Occupancy in Proctorsville
Occupancy by Ownership in Proctorsville
Of the total 116 dwellings in Proctorsville, owner-occupied units account for 64 (55.2%), while renter-occupied units make up 52 (44.8%).
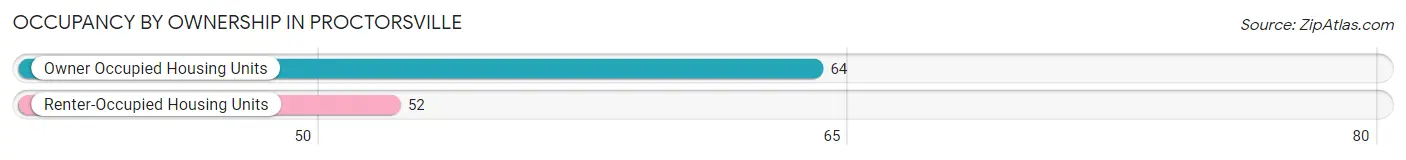
| Occupancy | # Housing Units | % Housing Units |
| Owner Occupied Housing Units | 64 | 55.2% |
| Renter-Occupied Housing Units | 52 | 44.8% |
| Total Occupied Housing Units | 116 | 100.0% |
Occupancy by Household Size in Proctorsville
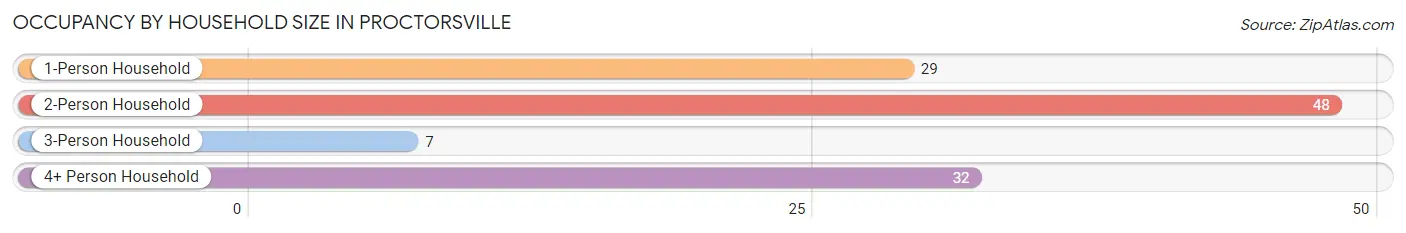
| Household Size | # Housing Units | % Housing Units |
| 1-Person Household | 29 | 25.0% |
| 2-Person Household | 48 | 41.4% |
| 3-Person Household | 7 | 6.0% |
| 4+ Person Household | 32 | 27.6% |
| Total Housing Units | 116 | 100.0% |
Occupancy by Ownership by Household Size in Proctorsville
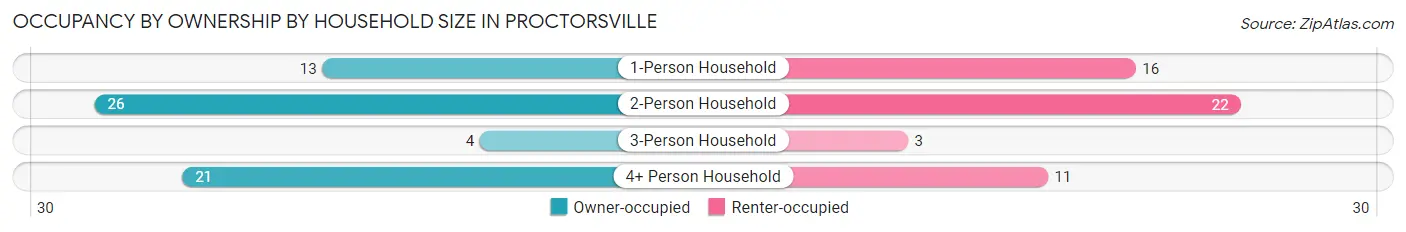
| Household Size | Owner-occupied | Renter-occupied |
| 1-Person Household | 13 (44.8%) | 16 (55.2%) |
| 2-Person Household | 26 (54.2%) | 22 (45.8%) |
| 3-Person Household | 4 (57.1%) | 3 (42.9%) |
| 4+ Person Household | 21 (65.6%) | 11 (34.4%) |
| Total Housing Units | 64 (55.2%) | 52 (44.8%) |
Occupancy by Educational Attainment in Proctorsville
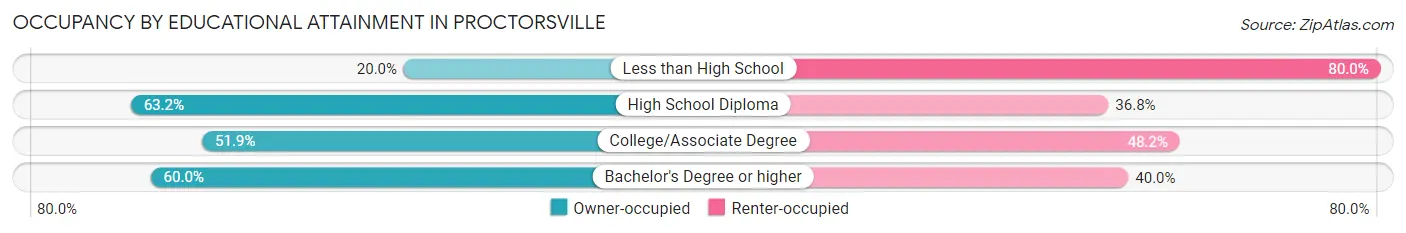
| Household Size | Owner-occupied | Renter-occupied |
| Less than High School | 2 (20.0%) | 8 (80.0%) |
| High School Diploma | 12 (63.2%) | 7 (36.8%) |
| College/Associate Degree | 14 (51.8%) | 13 (48.1%) |
| Bachelor's Degree or higher | 36 (60.0%) | 24 (40.0%) |
Occupancy by Age of Householder in Proctorsville
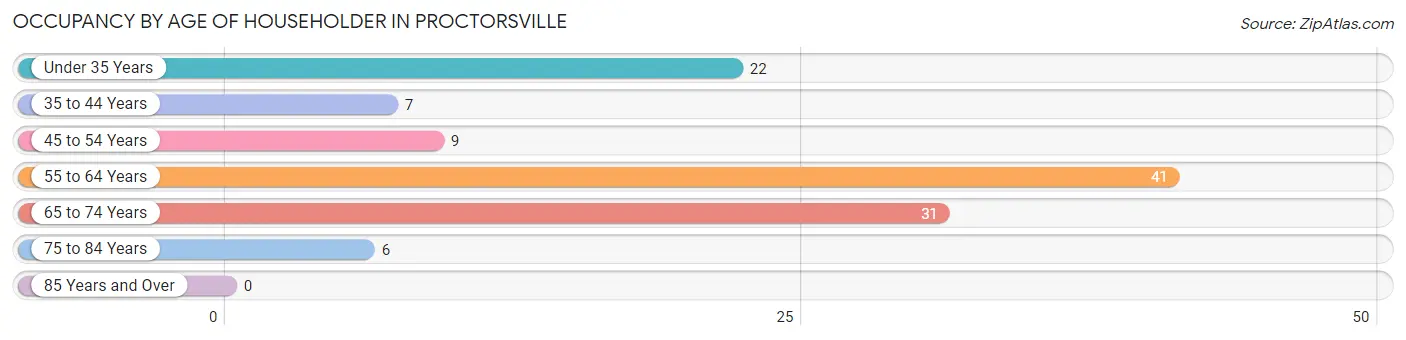
| Age Bracket | # Households | % Households |
| Under 35 Years | 22 | 19.0% |
| 35 to 44 Years | 7 | 6.0% |
| 45 to 54 Years | 9 | 7.8% |
| 55 to 64 Years | 41 | 35.3% |
| 65 to 74 Years | 31 | 26.7% |
| 75 to 84 Years | 6 | 5.2% |
| 85 Years and Over | 0 | 0.0% |
| Total | 116 | 100.0% |
Housing Finances in Proctorsville
Median Income by Occupancy in Proctorsville
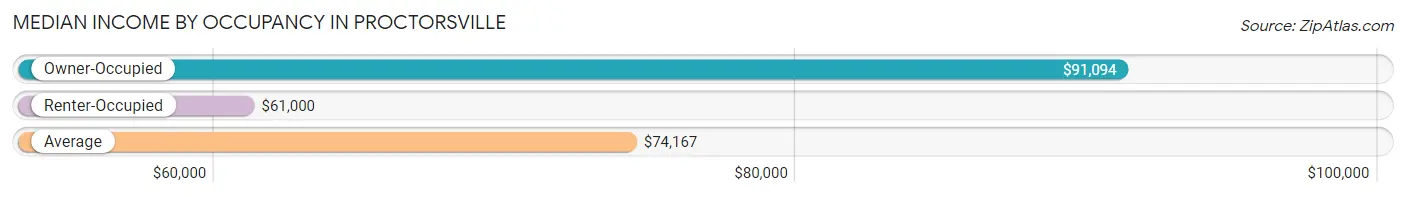
| Occupancy Type | # Households | Median Income |
| Owner-Occupied | 64 (55.2%) | $91,094 |
| Renter-Occupied | 52 (44.8%) | $61,000 |
| Average | 116 (100.0%) | $74,167 |
Occupancy by Householder Income Bracket in Proctorsville
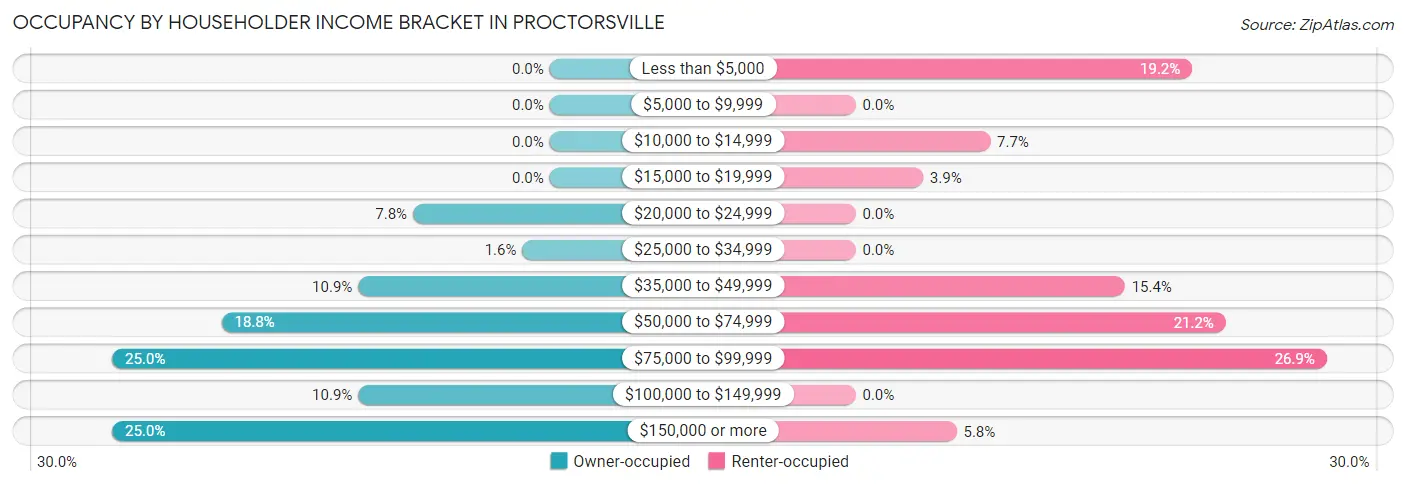
| Income Bracket | Owner-occupied | Renter-occupied |
| Less than $5,000 | 0 (0.0%) | 10 (19.2%) |
| $5,000 to $9,999 | 0 (0.0%) | 0 (0.0%) |
| $10,000 to $14,999 | 0 (0.0%) | 4 (7.7%) |
| $15,000 to $19,999 | 0 (0.0%) | 2 (3.8%) |
| $20,000 to $24,999 | 5 (7.8%) | 0 (0.0%) |
| $25,000 to $34,999 | 1 (1.6%) | 0 (0.0%) |
| $35,000 to $49,999 | 7 (10.9%) | 8 (15.4%) |
| $50,000 to $74,999 | 12 (18.8%) | 11 (21.1%) |
| $75,000 to $99,999 | 16 (25.0%) | 14 (26.9%) |
| $100,000 to $149,999 | 7 (10.9%) | 0 (0.0%) |
| $150,000 or more | 16 (25.0%) | 3 (5.8%) |
| Total | 64 (100.0%) | 52 (100.0%) |
Monthly Housing Cost Tiers in Proctorsville
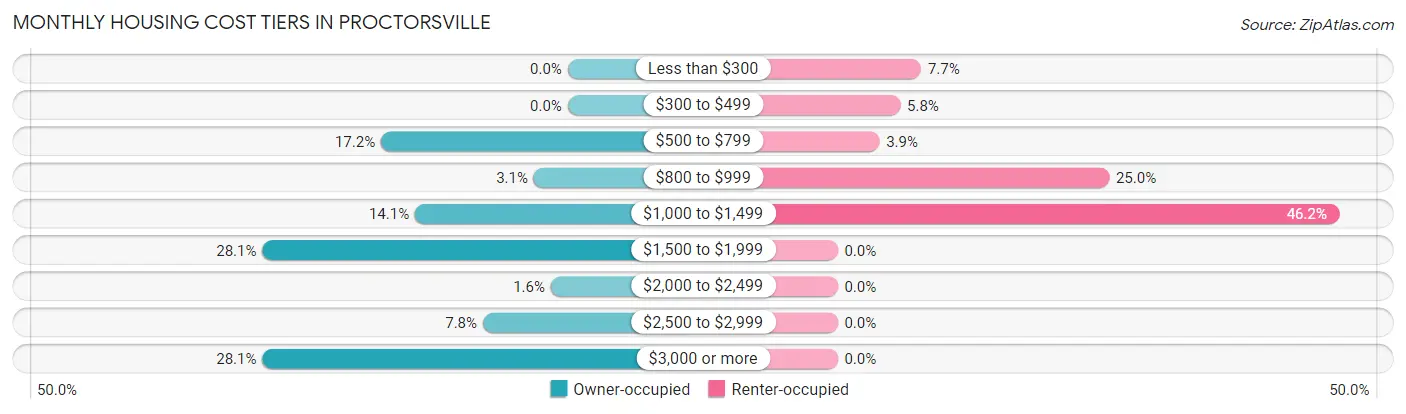
| Monthly Cost | Owner-occupied | Renter-occupied |
| Less than $300 | 0 (0.0%) | 4 (7.7%) |
| $300 to $499 | 0 (0.0%) | 3 (5.8%) |
| $500 to $799 | 11 (17.2%) | 2 (3.8%) |
| $800 to $999 | 2 (3.1%) | 13 (25.0%) |
| $1,000 to $1,499 | 9 (14.1%) | 24 (46.2%) |
| $1,500 to $1,999 | 18 (28.1%) | 0 (0.0%) |
| $2,000 to $2,499 | 1 (1.6%) | 0 (0.0%) |
| $2,500 to $2,999 | 5 (7.8%) | 0 (0.0%) |
| $3,000 or more | 18 (28.1%) | 0 (0.0%) |
| Total | 64 (100.0%) | 52 (100.0%) |
Physical Housing Characteristics in Proctorsville
Housing Structures in Proctorsville
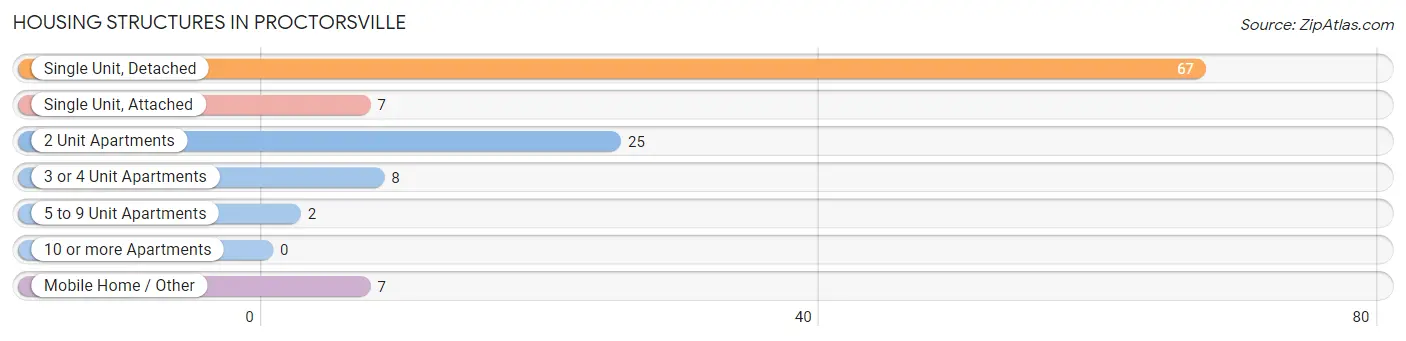
| Structure Type | # Housing Units | % Housing Units |
| Single Unit, Detached | 67 | 57.8% |
| Single Unit, Attached | 7 | 6.0% |
| 2 Unit Apartments | 25 | 21.5% |
| 3 or 4 Unit Apartments | 8 | 6.9% |
| 5 to 9 Unit Apartments | 2 | 1.7% |
| 10 or more Apartments | 0 | 0.0% |
| Mobile Home / Other | 7 | 6.0% |
| Total | 116 | 100.0% |
Housing Structures by Occupancy in Proctorsville
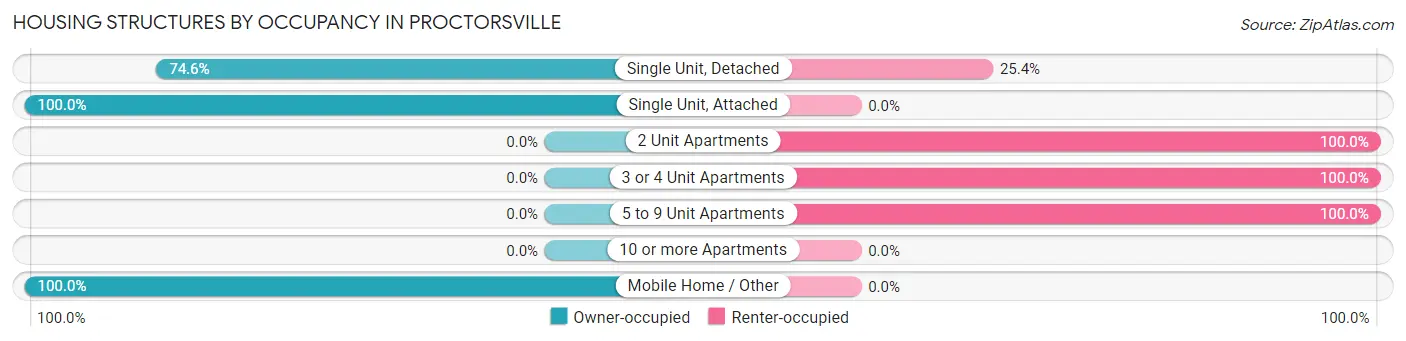
| Structure Type | Owner-occupied | Renter-occupied |
| Single Unit, Detached | 50 (74.6%) | 17 (25.4%) |
| Single Unit, Attached | 7 (100.0%) | 0 (0.0%) |
| 2 Unit Apartments | 0 (0.0%) | 25 (100.0%) |
| 3 or 4 Unit Apartments | 0 (0.0%) | 8 (100.0%) |
| 5 to 9 Unit Apartments | 0 (0.0%) | 2 (100.0%) |
| 10 or more Apartments | 0 (0.0%) | 0 (0.0%) |
| Mobile Home / Other | 7 (100.0%) | 0 (0.0%) |
| Total | 64 (55.2%) | 52 (44.8%) |
Housing Structures by Number of Rooms in Proctorsville
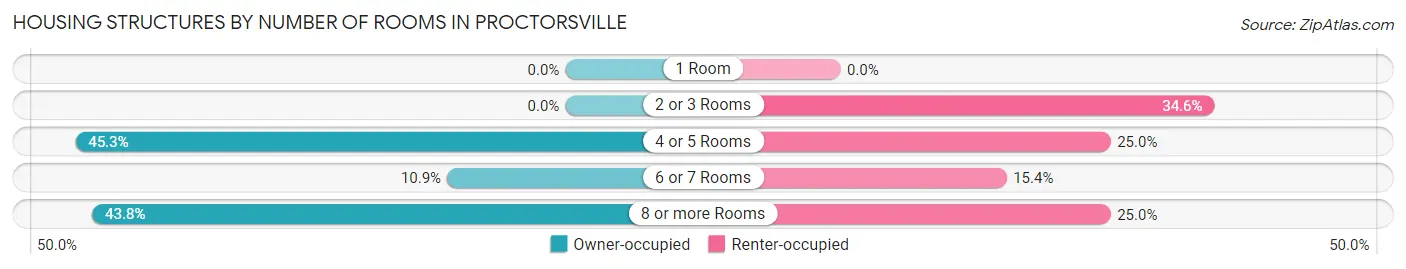
| Number of Rooms | Owner-occupied | Renter-occupied |
| 1 Room | 0 (0.0%) | 0 (0.0%) |
| 2 or 3 Rooms | 0 (0.0%) | 18 (34.6%) |
| 4 or 5 Rooms | 29 (45.3%) | 13 (25.0%) |
| 6 or 7 Rooms | 7 (10.9%) | 8 (15.4%) |
| 8 or more Rooms | 28 (43.8%) | 13 (25.0%) |
| Total | 64 (100.0%) | 52 (100.0%) |
Housing Structure by Heating Type in Proctorsville
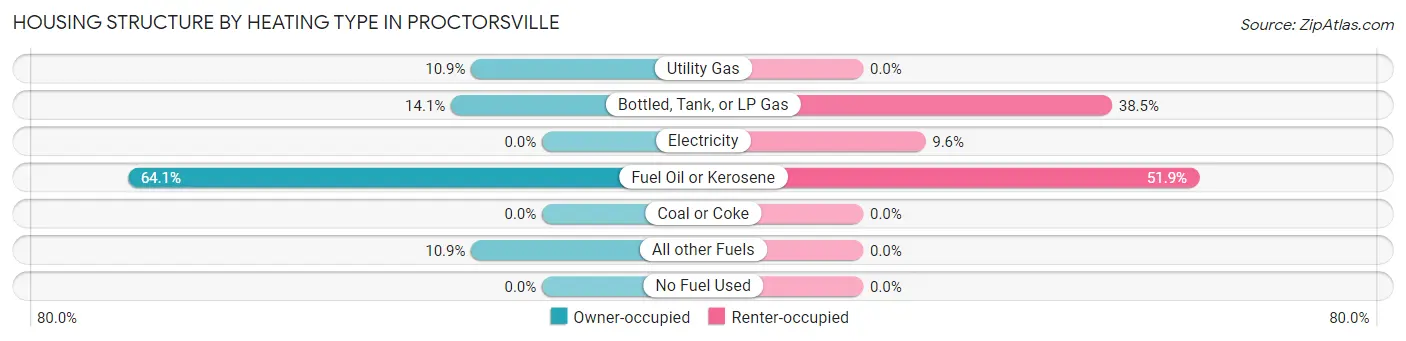
| Heating Type | Owner-occupied | Renter-occupied |
| Utility Gas | 7 (10.9%) | 0 (0.0%) |
| Bottled, Tank, or LP Gas | 9 (14.1%) | 20 (38.5%) |
| Electricity | 0 (0.0%) | 5 (9.6%) |
| Fuel Oil or Kerosene | 41 (64.1%) | 27 (51.9%) |
| Coal or Coke | 0 (0.0%) | 0 (0.0%) |
| All other Fuels | 7 (10.9%) | 0 (0.0%) |
| No Fuel Used | 0 (0.0%) | 0 (0.0%) |
| Total | 64 (100.0%) | 52 (100.0%) |
Household Vehicle Usage in Proctorsville
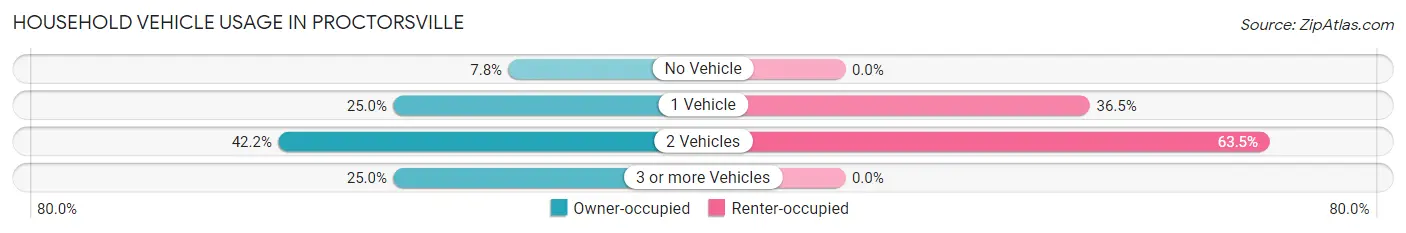
| Vehicles per Household | Owner-occupied | Renter-occupied |
| No Vehicle | 5 (7.8%) | 0 (0.0%) |
| 1 Vehicle | 16 (25.0%) | 19 (36.5%) |
| 2 Vehicles | 27 (42.2%) | 33 (63.5%) |
| 3 or more Vehicles | 16 (25.0%) | 0 (0.0%) |
| Total | 64 (100.0%) | 52 (100.0%) |
Real Estate & Mortgages in Proctorsville
Real Estate and Mortgage Overview in Proctorsville
| Characteristic | Without Mortgage | With Mortgage |
| Housing Units | 23 | 41 |
| Median Property Value | - | - |
| Median Household Income | $67,750 | $9 |
| Monthly Housing Costs | $1,217 | $11 |
| Real Estate Taxes | - | - |
Property Value by Mortgage Status in Proctorsville
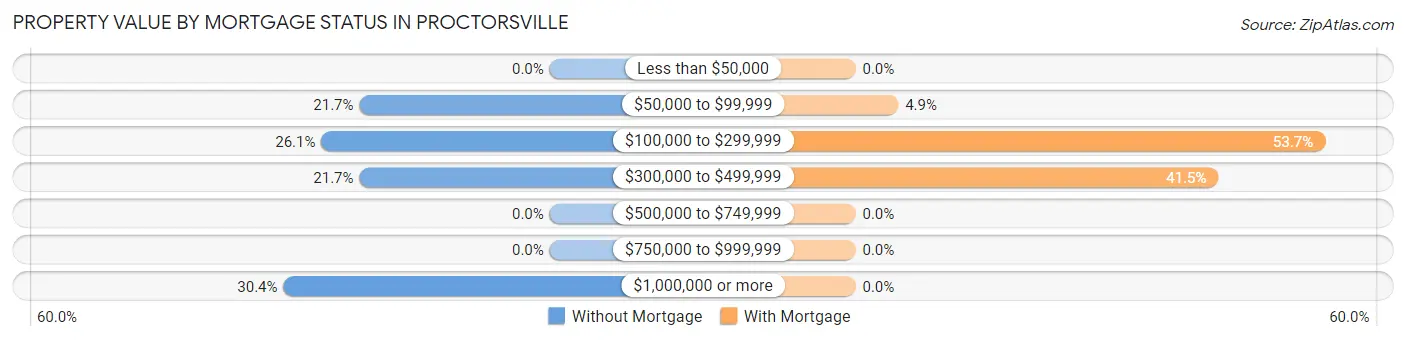
| Property Value | Without Mortgage | With Mortgage |
| Less than $50,000 | 0 (0.0%) | 0 (0.0%) |
| $50,000 to $99,999 | 5 (21.7%) | 2 (4.9%) |
| $100,000 to $299,999 | 6 (26.1%) | 22 (53.7%) |
| $300,000 to $499,999 | 5 (21.7%) | 17 (41.5%) |
| $500,000 to $749,999 | 0 (0.0%) | 0 (0.0%) |
| $750,000 to $999,999 | 0 (0.0%) | 0 (0.0%) |
| $1,000,000 or more | 7 (30.4%) | 0 (0.0%) |
| Total | 23 (100.0%) | 41 (100.0%) |
Household Income by Mortgage Status in Proctorsville
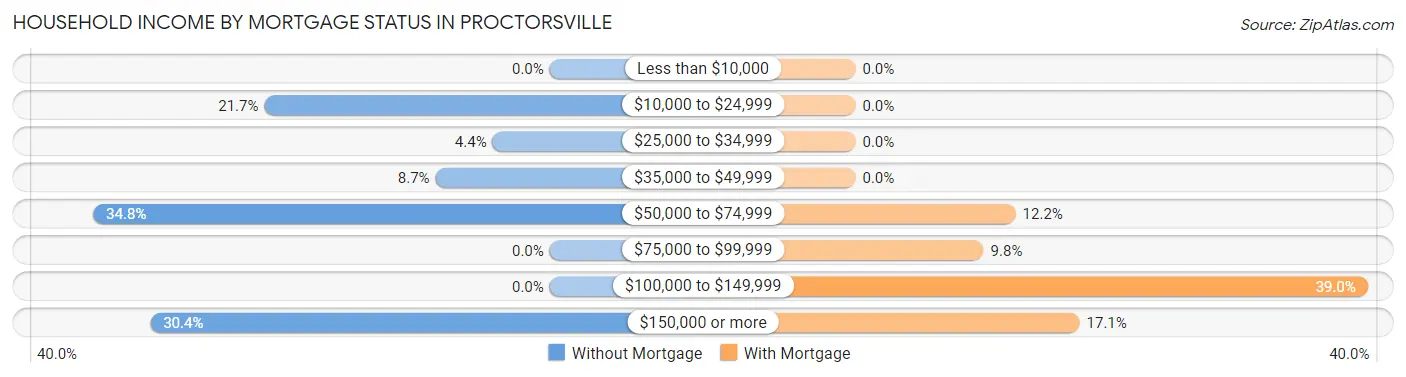
| Household Income | Without Mortgage | With Mortgage |
| Less than $10,000 | 0 (0.0%) | 0 (0.0%) |
| $10,000 to $24,999 | 5 (21.7%) | 0 (0.0%) |
| $25,000 to $34,999 | 1 (4.3%) | 0 (0.0%) |
| $35,000 to $49,999 | 2 (8.7%) | 0 (0.0%) |
| $50,000 to $74,999 | 8 (34.8%) | 5 (12.2%) |
| $75,000 to $99,999 | 0 (0.0%) | 4 (9.8%) |
| $100,000 to $149,999 | 0 (0.0%) | 16 (39.0%) |
| $150,000 or more | 7 (30.4%) | 7 (17.1%) |
| Total | 23 (100.0%) | 41 (100.0%) |
Property Value to Household Income Ratio in Proctorsville
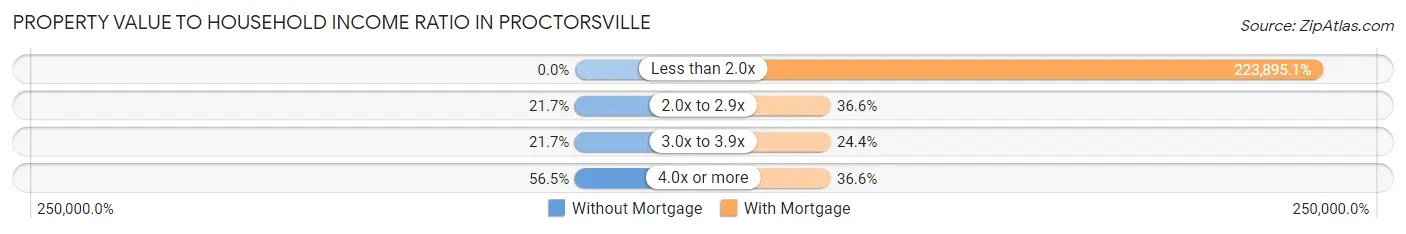
| Value-to-Income Ratio | Without Mortgage | With Mortgage |
| Less than 2.0x | 0 (0.0%) | 91,797 (223,895.1%) |
| 2.0x to 2.9x | 5 (21.7%) | 15 (36.6%) |
| 3.0x to 3.9x | 5 (21.7%) | 10 (24.4%) |
| 4.0x or more | 13 (56.5%) | 15 (36.6%) |
| Total | 23 (100.0%) | 41 (100.0%) |
Real Estate Taxes by Mortgage Status in Proctorsville
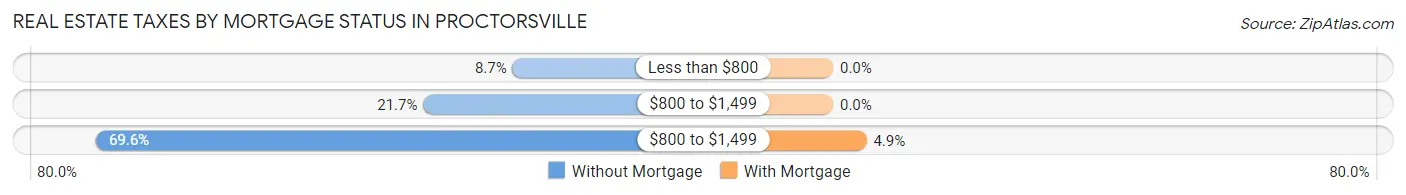
| Property Taxes | Without Mortgage | With Mortgage |
| Less than $800 | 2 (8.7%) | 0 (0.0%) |
| $800 to $1,499 | 5 (21.7%) | 0 (0.0%) |
| $800 to $1,499 | 16 (69.6%) | 2 (4.9%) |
| Total | 23 (100.0%) | 41 (100.0%) |
Health & Disability in Proctorsville
Health Insurance Coverage by Age in Proctorsville
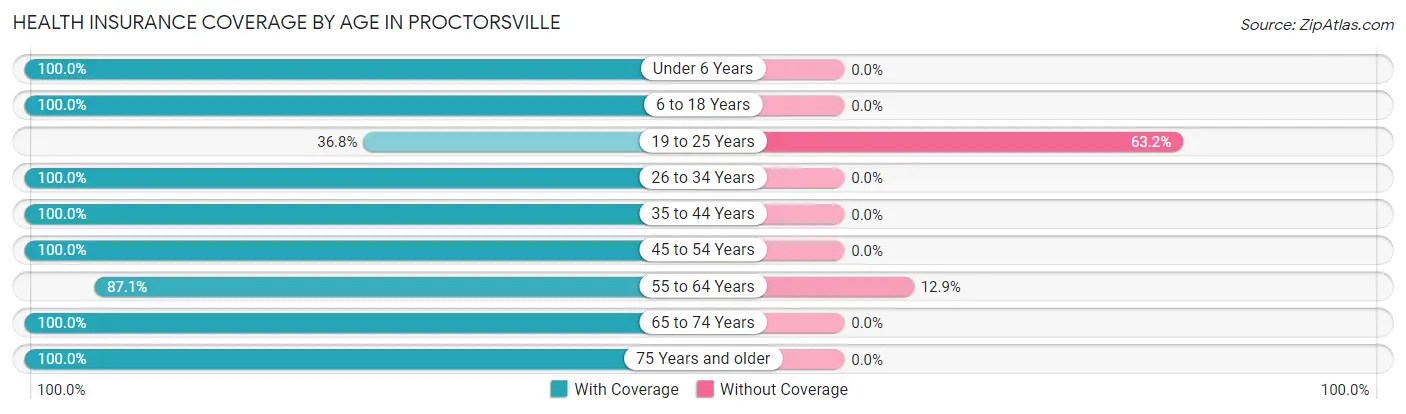
| Age Bracket | With Coverage | Without Coverage |
| Under 6 Years | 40 (100.0%) | 0 (0.0%) |
| 6 to 18 Years | 52 (100.0%) | 0 (0.0%) |
| 19 to 25 Years | 21 (36.8%) | 36 (63.2%) |
| 26 to 34 Years | 13 (100.0%) | 0 (0.0%) |
| 35 to 44 Years | 19 (100.0%) | 0 (0.0%) |
| 45 to 54 Years | 44 (100.0%) | 0 (0.0%) |
| 55 to 64 Years | 74 (87.1%) | 11 (12.9%) |
| 65 to 74 Years | 39 (100.0%) | 0 (0.0%) |
| 75 Years and older | 9 (100.0%) | 0 (0.0%) |
| Total | 311 (86.9%) | 47 (13.1%) |
Health Insurance Coverage by Citizenship Status in Proctorsville
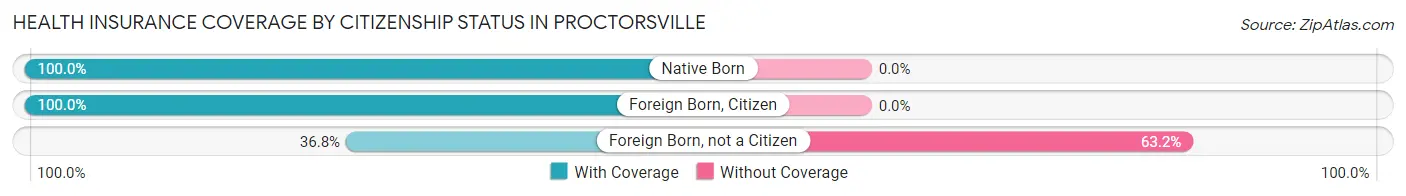
| Citizenship Status | With Coverage | Without Coverage |
| Native Born | 40 (100.0%) | 0 (0.0%) |
| Foreign Born, Citizen | 52 (100.0%) | 0 (0.0%) |
| Foreign Born, not a Citizen | 21 (36.8%) | 36 (63.2%) |
Health Insurance Coverage by Household Income in Proctorsville
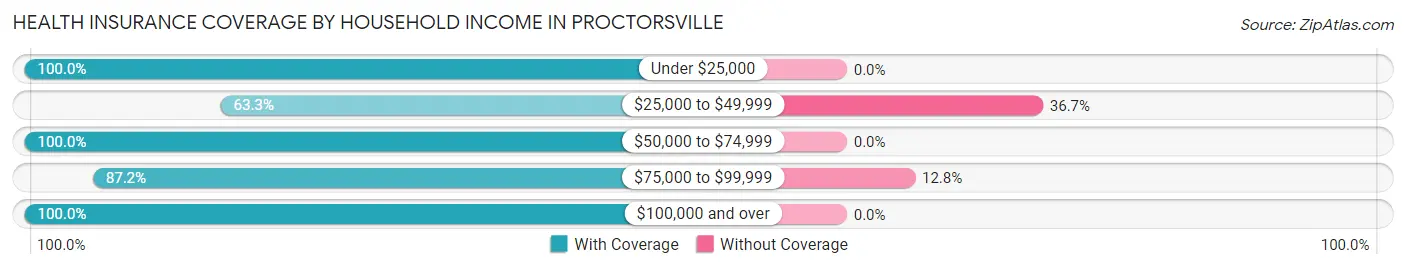
| Household Income | With Coverage | Without Coverage |
| Under $25,000 | 21 (100.0%) | 0 (0.0%) |
| $25,000 to $49,999 | 62 (63.3%) | 36 (36.7%) |
| $50,000 to $74,999 | 42 (100.0%) | 0 (0.0%) |
| $75,000 to $99,999 | 75 (87.2%) | 11 (12.8%) |
| $100,000 and over | 104 (100.0%) | 0 (0.0%) |
Public vs Private Health Insurance Coverage by Age in Proctorsville
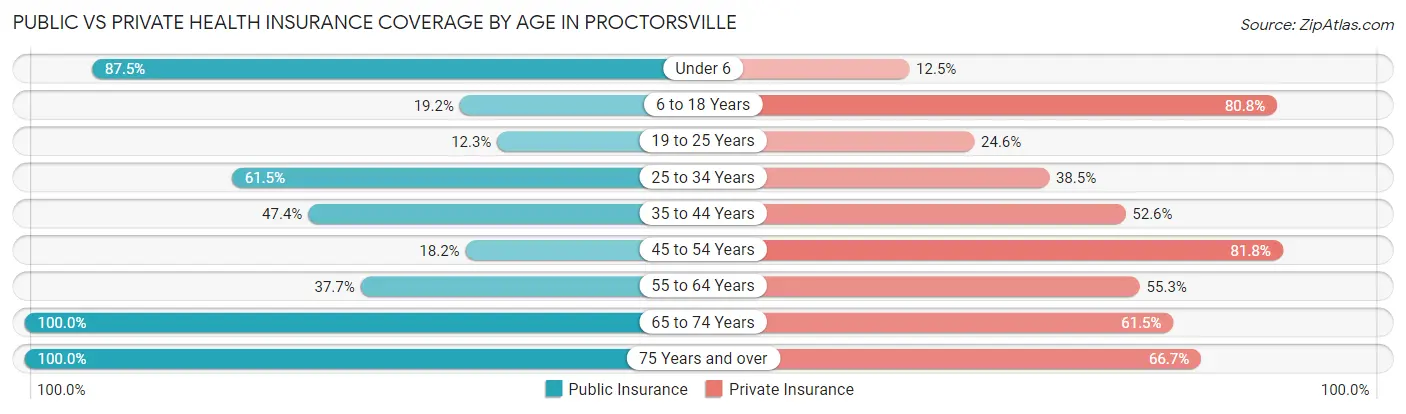
| Age Bracket | Public Insurance | Private Insurance |
| Under 6 | 35 (87.5%) | 5 (12.5%) |
| 6 to 18 Years | 10 (19.2%) | 42 (80.8%) |
| 19 to 25 Years | 7 (12.3%) | 14 (24.6%) |
| 25 to 34 Years | 8 (61.5%) | 5 (38.5%) |
| 35 to 44 Years | 9 (47.4%) | 10 (52.6%) |
| 45 to 54 Years | 8 (18.2%) | 36 (81.8%) |
| 55 to 64 Years | 32 (37.7%) | 47 (55.3%) |
| 65 to 74 Years | 39 (100.0%) | 24 (61.5%) |
| 75 Years and over | 9 (100.0%) | 6 (66.7%) |
| Total | 157 (43.9%) | 189 (52.8%) |
Disability Status by Sex by Age in Proctorsville
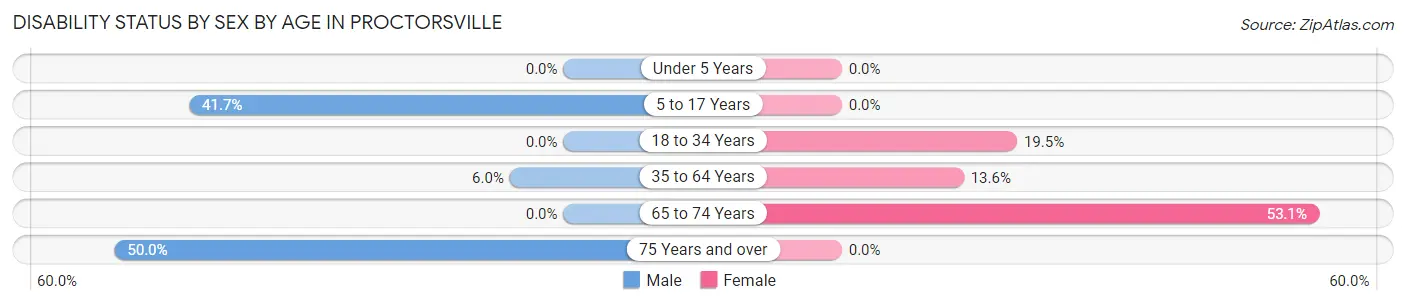
| Age Bracket | Male | Female |
| Under 5 Years | 0 (0.0%) | 0 (0.0%) |
| 5 to 17 Years | 10 (41.7%) | 0 (0.0%) |
| 18 to 34 Years | 0 (0.0%) | 8 (19.5%) |
| 35 to 64 Years | 4 (6.0%) | 11 (13.6%) |
| 65 to 74 Years | 0 (0.0%) | 17 (53.1%) |
| 75 Years and over | 3 (50.0%) | 0 (0.0%) |
Disability Class by Sex by Age in Proctorsville
Disability Class: Hearing Difficulty
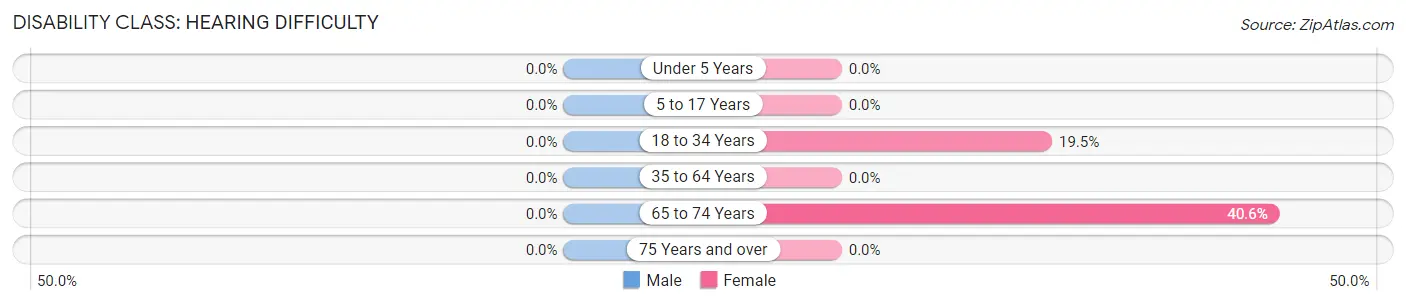
| Age Bracket | Male | Female |
| Under 5 Years | 0 (0.0%) | 0 (0.0%) |
| 5 to 17 Years | 0 (0.0%) | 0 (0.0%) |
| 18 to 34 Years | 0 (0.0%) | 8 (19.5%) |
| 35 to 64 Years | 0 (0.0%) | 0 (0.0%) |
| 65 to 74 Years | 0 (0.0%) | 13 (40.6%) |
| 75 Years and over | 0 (0.0%) | 0 (0.0%) |
Disability Class: Vision Difficulty
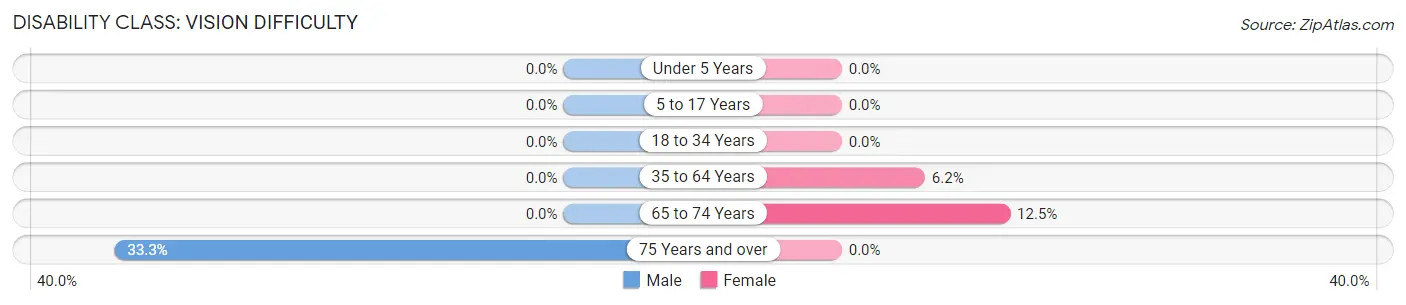
| Age Bracket | Male | Female |
| Under 5 Years | 0 (0.0%) | 0 (0.0%) |
| 5 to 17 Years | 0 (0.0%) | 0 (0.0%) |
| 18 to 34 Years | 0 (0.0%) | 0 (0.0%) |
| 35 to 64 Years | 0 (0.0%) | 5 (6.2%) |
| 65 to 74 Years | 0 (0.0%) | 4 (12.5%) |
| 75 Years and over | 2 (33.3%) | 0 (0.0%) |
Disability Class: Cognitive Difficulty
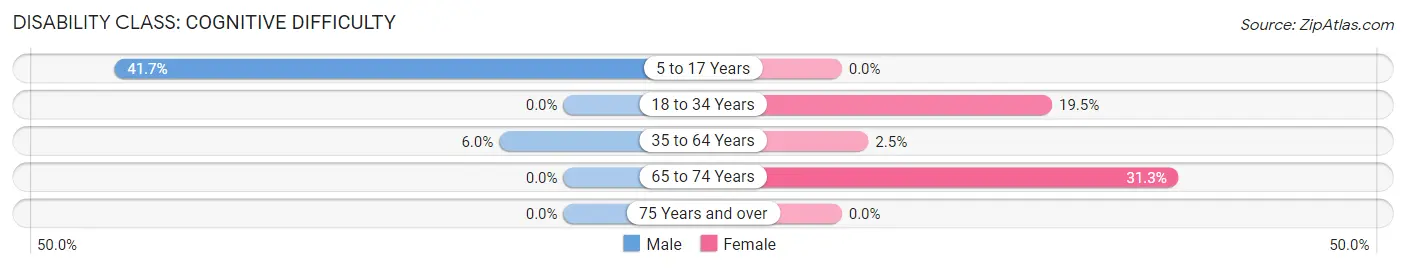
| Age Bracket | Male | Female |
| 5 to 17 Years | 10 (41.7%) | 0 (0.0%) |
| 18 to 34 Years | 0 (0.0%) | 8 (19.5%) |
| 35 to 64 Years | 4 (6.0%) | 2 (2.5%) |
| 65 to 74 Years | 0 (0.0%) | 10 (31.2%) |
| 75 Years and over | 0 (0.0%) | 0 (0.0%) |
Disability Class: Ambulatory Difficulty
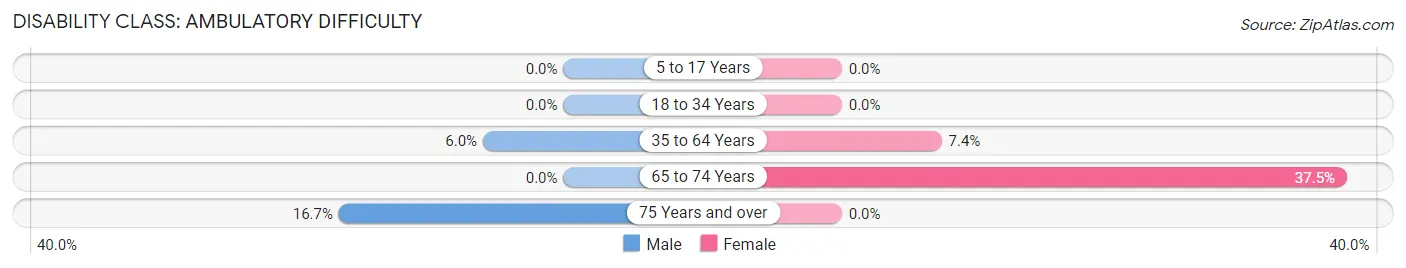
| Age Bracket | Male | Female |
| 5 to 17 Years | 0 (0.0%) | 0 (0.0%) |
| 18 to 34 Years | 0 (0.0%) | 0 (0.0%) |
| 35 to 64 Years | 4 (6.0%) | 6 (7.4%) |
| 65 to 74 Years | 0 (0.0%) | 12 (37.5%) |
| 75 Years and over | 1 (16.7%) | 0 (0.0%) |
Disability Class: Self-Care Difficulty
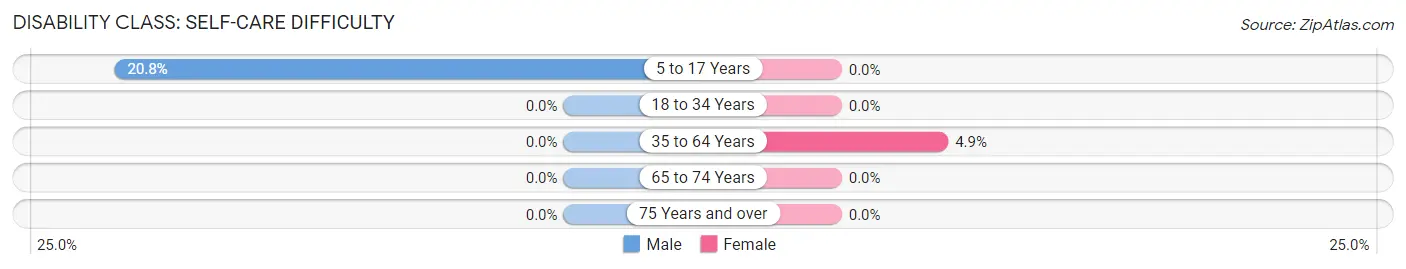
| Age Bracket | Male | Female |
| 5 to 17 Years | 5 (20.8%) | 0 (0.0%) |
| 18 to 34 Years | 0 (0.0%) | 0 (0.0%) |
| 35 to 64 Years | 0 (0.0%) | 4 (4.9%) |
| 65 to 74 Years | 0 (0.0%) | 0 (0.0%) |
| 75 Years and over | 0 (0.0%) | 0 (0.0%) |
Technology Access in Proctorsville
Computing Device Access in Proctorsville
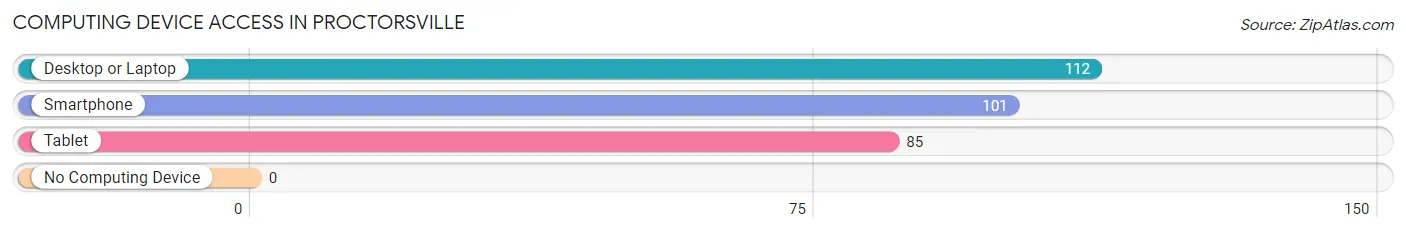
| Device Type | # Households | % Households |
| Desktop or Laptop | 112 | 96.6% |
| Smartphone | 101 | 87.1% |
| Tablet | 85 | 73.3% |
| No Computing Device | 0 | 0.0% |
| Total | 116 | 100.0% |
Internet Access in Proctorsville
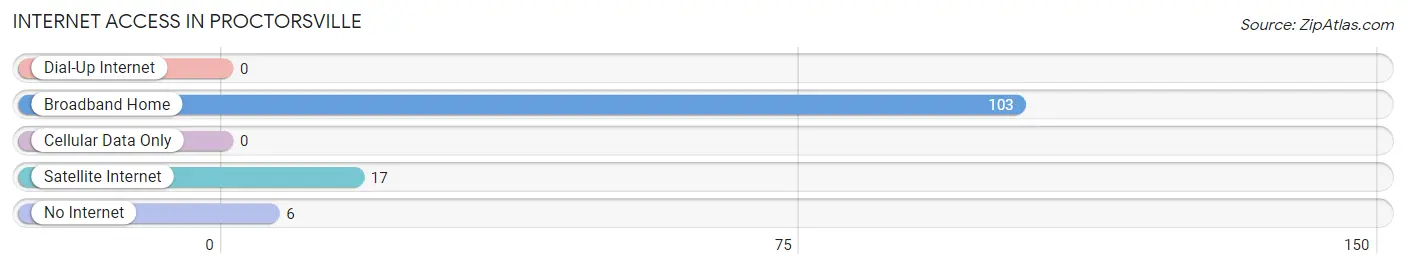
| Internet Type | # Households | % Households |
| Dial-Up Internet | 0 | 0.0% |
| Broadband Home | 103 | 88.8% |
| Cellular Data Only | 0 | 0.0% |
| Satellite Internet | 17 | 14.7% |
| No Internet | 6 | 5.2% |
| Total | 116 | 100.0% |
Proctorsville Summary
Proctorsville, Vermont is a small village located in the town of Cavendish in Windsor County. It is situated in the Green Mountains of Vermont, and is home to a population of approximately 500 people. The village is named after the Proctor family, who were among the first settlers in the area.
History
The Proctor family first settled in the area in 1790, and the village of Proctorsville was officially incorporated in 1820. The Proctors were a prominent family in the area, and their influence can still be seen in the village today. The Proctor family owned a large amount of land in the area, and the village was built around their homestead.
The village was a thriving center of commerce in the 19th century, with a variety of businesses and industries. The Proctor family owned a sawmill, gristmill, and a general store. The village also had a blacksmith, a tannery, and a variety of other businesses.
The village was also home to a number of churches, including the Congregational Church, the Methodist Church, and the Baptist Church. The village also had a school, which was built in 1845.
Geography
Proctorsville is located in the Green Mountains of Vermont, and is situated in the town of Cavendish. The village is located at the intersection of Vermont Route 103 and Vermont Route 131. The village is surrounded by rolling hills and forests, and is located near the Black River.
The village is located approximately 25 miles from the city of Rutland, and is approximately 50 miles from the state capital of Montpelier. The village is also located near the ski resorts of Okemo Mountain and Killington.
Economy
The economy of Proctorsville is largely based on tourism and agriculture. The village is home to a number of small businesses, including restaurants, shops, and galleries. The village is also home to a number of farms, which produce a variety of products, including dairy, beef, and vegetables.
The village is also home to a number of bed and breakfasts, which attract visitors from all over the world. The village is also home to a number of antique stores, which attract visitors from all over the country.
Demographics
As of the 2010 census, the population of Proctorsville was 498. The population is largely white, with a small percentage of African Americans, Hispanics, and Asians. The median age of the population is 44.7 years, and the median household income is $50,000.
The village is home to a number of churches, including the Congregational Church, the Methodist Church, and the Baptist Church. The village also has a public library, which is located in the center of the village.
Conclusion
Proctorsville, Vermont is a small village located in the town of Cavendish in Windsor County. It is situated in the Green Mountains of Vermont, and is home to a population of approximately 500 people. The village is named after the Proctor family, who were among the first settlers in the area. The village is a thriving center of commerce, with a variety of businesses and industries. The economy of Proctorsville is largely based on tourism and agriculture, and the village is home to a number of small businesses, farms, and bed and breakfasts. The population of Proctorsville is largely white, with a small percentage of African Americans, Hispanics, and Asians. The village is home to a number of churches, and a public library.
Common Questions
What is Per Capita Income in Proctorsville?
Per Capita income in Proctorsville is $33,991.
What is the Median Family Income in Proctorsville?
Median Family Income in Proctorsville is $88,523.
What is the Median Household income in Proctorsville?
Median Household Income in Proctorsville is $74,167.
What is Income or Wage Gap in Proctorsville?
Income or Wage Gap in Proctorsville is 25.1%.
Women in Proctorsville earn 74.9 cents for every dollar earned by a man.
What is Inequality or Gini Index in Proctorsville?
Inequality or Gini Index in Proctorsville is 0.50.
What is the Total Population of Proctorsville?
Total Population of Proctorsville is 359.
What is the Total Male Population of Proctorsville?
Total Male Population of Proctorsville is 173.
What is the Total Female Population of Proctorsville?
Total Female Population of Proctorsville is 186.
What is the Ratio of Males per 100 Females in Proctorsville?
There are 93.01 Males per 100 Females in Proctorsville.
What is the Ratio of Females per 100 Males in Proctorsville?
There are 107.51 Females per 100 Males in Proctorsville.
What is the Median Population Age in Proctorsville?
Median Population Age in Proctorsville is 44.5 Years.
What is the Average Family Size in Proctorsville
Average Family Size in Proctorsville is 3.4 People.
What is the Average Household Size in Proctorsville
Average Household Size in Proctorsville is 3.0 People.
How Large is the Labor Force in Proctorsville?
There are 210 People in the Labor Forcein in Proctorsville.
What is the Percentage of People in the Labor Force in Proctorsville?
74.7% of People are in the Labor Force in Proctorsville.
What is the Unemployment Rate in Proctorsville?
Unemployment Rate in Proctorsville is 1.9%.