East Middlebury, VT Map & Demographics
East Middlebury Map
East Middlebury Overview
$57,429
PER CAPITA INCOME
$123,587
AVG FAMILY INCOME
$92,241
AVG HOUSEHOLD INCOME
0.38
INEQUALITY / GINI INDEX
483
TOTAL POPULATION
290
MALE POPULATION
193
FEMALE POPULATION
150.26
MALES / 100 FEMALES
66.55
FEMALES / 100 MALES
49.6
MEDIAN AGE
2.7
AVG FAMILY SIZE
2.2
AVG HOUSEHOLD SIZE
286
LABOR FORCE [ PEOPLE ]
70.3%
PERCENT IN LABOR FORCE
East Middlebury Area Codes
Income in East Middlebury
Income Overview in East Middlebury
Per Capita Income in East Middlebury is $57,429, while median incomes of families and households are $123,587 and $92,241 respectively.
| Characteristic | Number | Measure |
| Per Capita Income | 483 | $57,429 |
| Median Family Income | 150 | $123,587 |
| Mean Family Income | 150 | $134,447 |
| Median Household Income | 222 | $92,241 |
| Mean Household Income | 222 | $123,621 |
| Income Deficit | 150 | $0 |
| Wage / Income Gap (%) | 483 | 0.00% |
| Wage / Income Gap ($) | 483 | 100.00¢ per $1 |
| Gini / Inequality Index | 483 | 0.38 |
Earnings by Sex in East Middlebury
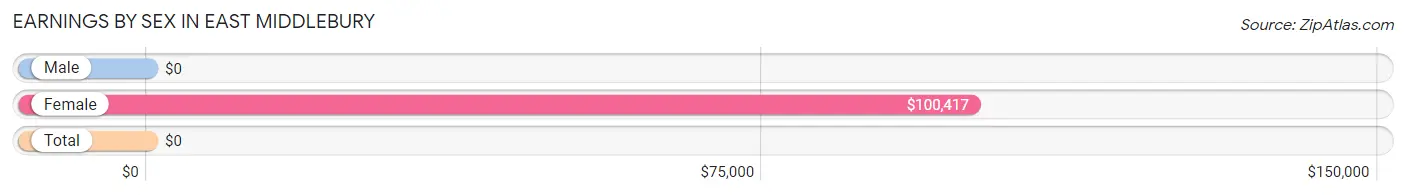
| Sex | Number | Average Earnings |
| Male | 213 (68.3%) | $0 |
| Female | 99 (31.7%) | $100,417 |
| Total | 312 (100.0%) | $0 |
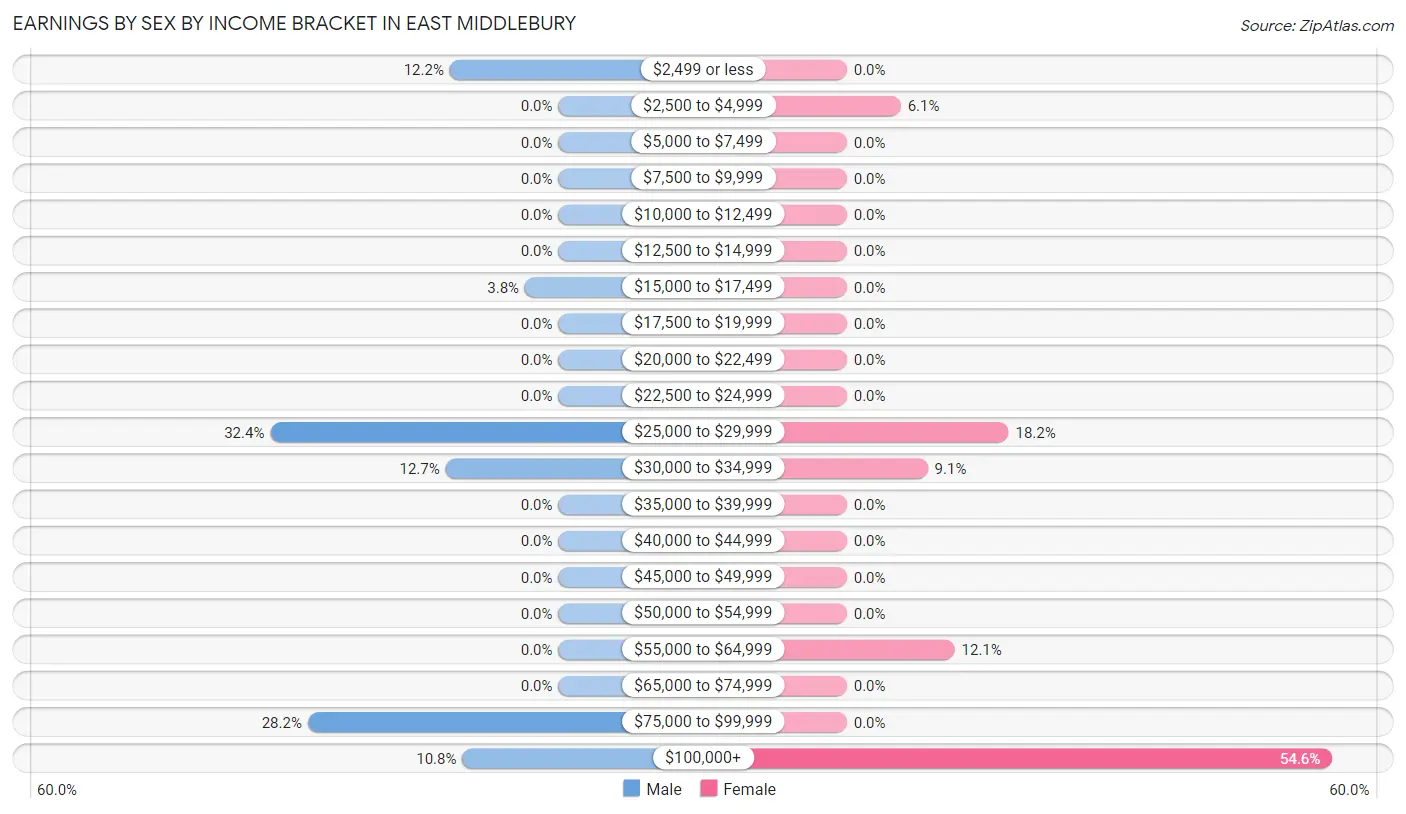
Earnings by Sex by Income Bracket in East Middlebury
The most common earnings brackets in East Middlebury are $25,000 to $29,999 for men (69 | 32.4%) and $100,000+ for women (54 | 54.5%).
| Income | Male | Female |
| $2,499 or less | 26 (12.2%) | 0 (0.0%) |
| $2,500 to $4,999 | 0 (0.0%) | 6 (6.1%) |
| $5,000 to $7,499 | 0 (0.0%) | 0 (0.0%) |
| $7,500 to $9,999 | 0 (0.0%) | 0 (0.0%) |
| $10,000 to $12,499 | 0 (0.0%) | 0 (0.0%) |
| $12,500 to $14,999 | 0 (0.0%) | 0 (0.0%) |
| $15,000 to $17,499 | 8 (3.8%) | 0 (0.0%) |
| $17,500 to $19,999 | 0 (0.0%) | 0 (0.0%) |
| $20,000 to $22,499 | 0 (0.0%) | 0 (0.0%) |
| $22,500 to $24,999 | 0 (0.0%) | 0 (0.0%) |
| $25,000 to $29,999 | 69 (32.4%) | 18 (18.2%) |
| $30,000 to $34,999 | 27 (12.7%) | 9 (9.1%) |
| $35,000 to $39,999 | 0 (0.0%) | 0 (0.0%) |
| $40,000 to $44,999 | 0 (0.0%) | 0 (0.0%) |
| $45,000 to $49,999 | 0 (0.0%) | 0 (0.0%) |
| $50,000 to $54,999 | 0 (0.0%) | 0 (0.0%) |
| $55,000 to $64,999 | 0 (0.0%) | 12 (12.1%) |
| $65,000 to $74,999 | 0 (0.0%) | 0 (0.0%) |
| $75,000 to $99,999 | 60 (28.2%) | 0 (0.0%) |
| $100,000+ | 23 (10.8%) | 54 (54.5%) |
| Total | 213 (100.0%) | 99 (100.0%) |
Earnings by Sex by Educational Attainment in East Middlebury
| Educational Attainment | Male Income | Female Income |
| Less than High School | - | - |
| High School Diploma | - | - |
| College or Associate's Degree | - | - |
| Bachelor's Degree | - | - |
| Graduate Degree | - | - |
| Total | - | - |
Family Income in East Middlebury
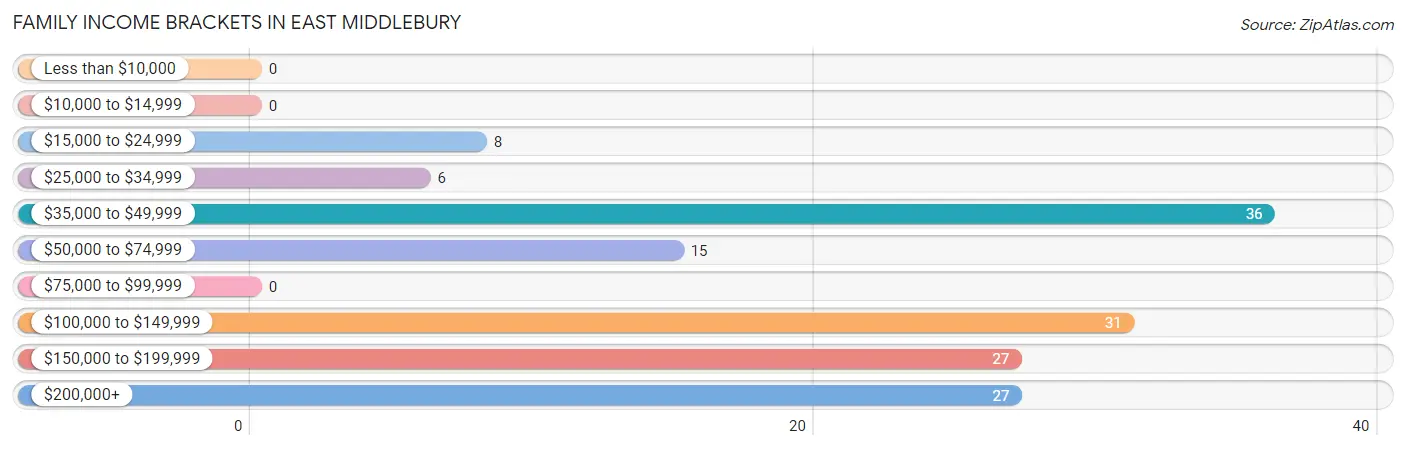
Family Income Brackets in East Middlebury
According to the East Middlebury family income data, there are 36 families falling into the $35,000 to $49,999 income range, which is the most common income bracket and makes up 24.0% of all families.
| Income Bracket | # Families | % Families |
| Less than $10,000 | 0 | 0.0% |
| $10,000 to $14,999 | 0 | 0.0% |
| $15,000 to $24,999 | 8 | 5.3% |
| $25,000 to $34,999 | 6 | 4.0% |
| $35,000 to $49,999 | 36 | 24.0% |
| $50,000 to $74,999 | 15 | 10.0% |
| $75,000 to $99,999 | 0 | 0.0% |
| $100,000 to $149,999 | 31 | 20.7% |
| $150,000 to $199,999 | 27 | 18.0% |
| $200,000+ | 27 | 18.0% |
Family Income by Famaliy Size in East Middlebury
| Income Bracket | # Families | Median Income |
| 2-Person Families | 83 (55.3%) | $0 |
| 3-Person Families | 44 (29.3%) | $0 |
| 4-Person Families | 0 (0.0%) | $0 |
| 5-Person Families | 23 (15.3%) | $0 |
| 6-Person Families | 0 (0.0%) | $0 |
| 7+ Person Families | 0 (0.0%) | $0 |
| Total | 150 (100.0%) | $123,587 |
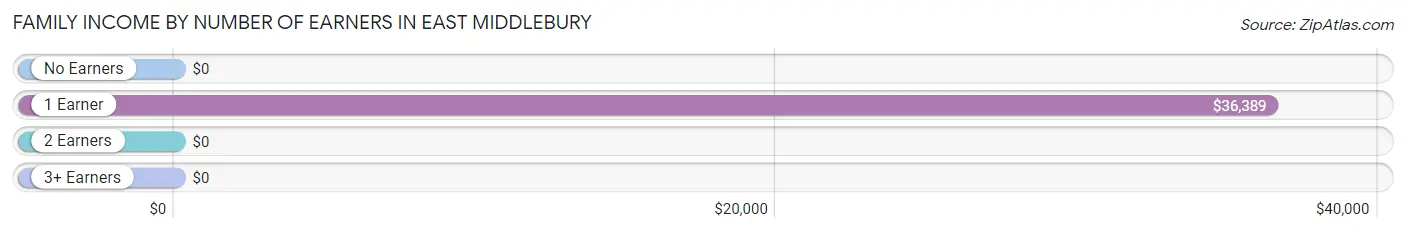
Family Income by Number of Earners in East Middlebury
| Number of Earners | # Families | Median Income |
| No Earners | 15 (10.0%) | $0 |
| 1 Earner | 58 (38.7%) | $36,389 |
| 2 Earners | 50 (33.3%) | $0 |
| 3+ Earners | 27 (18.0%) | $0 |
| Total | 150 (100.0%) | $123,587 |
Household Income in East Middlebury
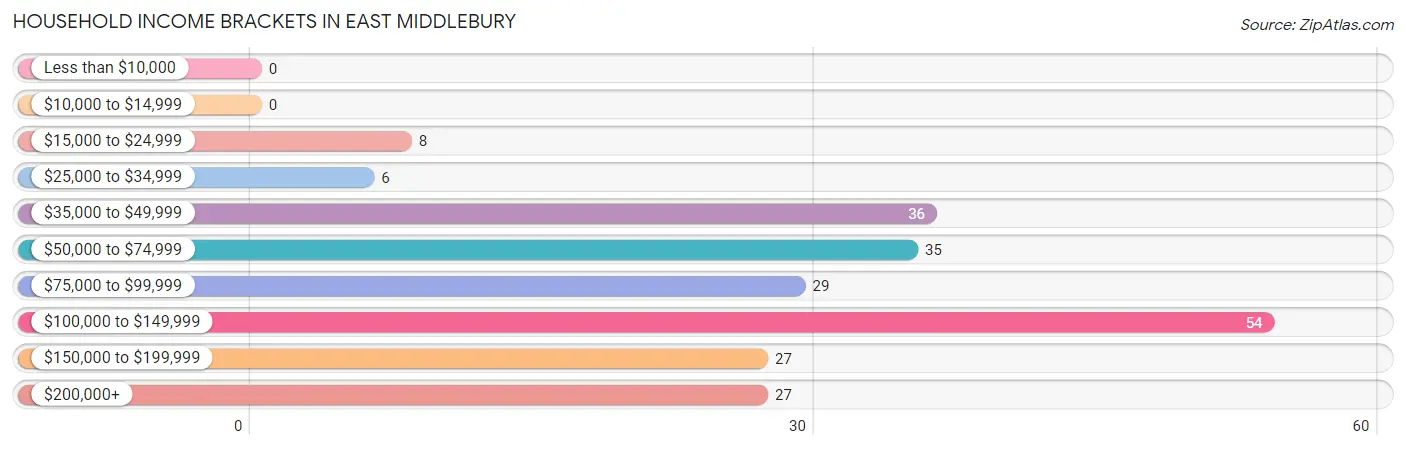
Household Income Brackets in East Middlebury
With 54 households falling in the category, the $100,000 to $149,999 income range is the most frequent in East Middlebury, accounting for 24.3% of all households.
| Income Bracket | # Households | % Households |
| Less than $10,000 | 0 | 0.0% |
| $10,000 to $14,999 | 0 | 0.0% |
| $15,000 to $24,999 | 8 | 3.6% |
| $25,000 to $34,999 | 6 | 2.7% |
| $35,000 to $49,999 | 36 | 16.2% |
| $50,000 to $74,999 | 35 | 15.8% |
| $75,000 to $99,999 | 29 | 13.1% |
| $100,000 to $149,999 | 54 | 24.3% |
| $150,000 to $199,999 | 27 | 12.2% |
| $200,000+ | 27 | 12.2% |
Household Income by Householder Age in East Middlebury
The median household income in East Middlebury is $92,241, with the highest median household income of $173,009 found in the 45 to 64 years age bracket for the primary householder. A total of 97 households (43.7%) fall into this category.
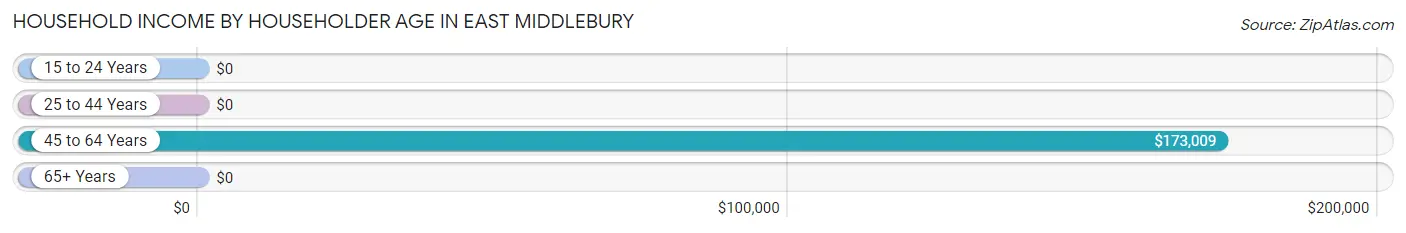
| Income Bracket | # Households | Median Income |
| 15 to 24 Years | 0 (0.0%) | $0 |
| 25 to 44 Years | 52 (23.4%) | $0 |
| 45 to 64 Years | 97 (43.7%) | $173,009 |
| 65+ Years | 73 (32.9%) | $0 |
| Total | 222 (100.0%) | $92,241 |
Poverty in East Middlebury
Income Below Poverty by Sex and Age in East Middlebury
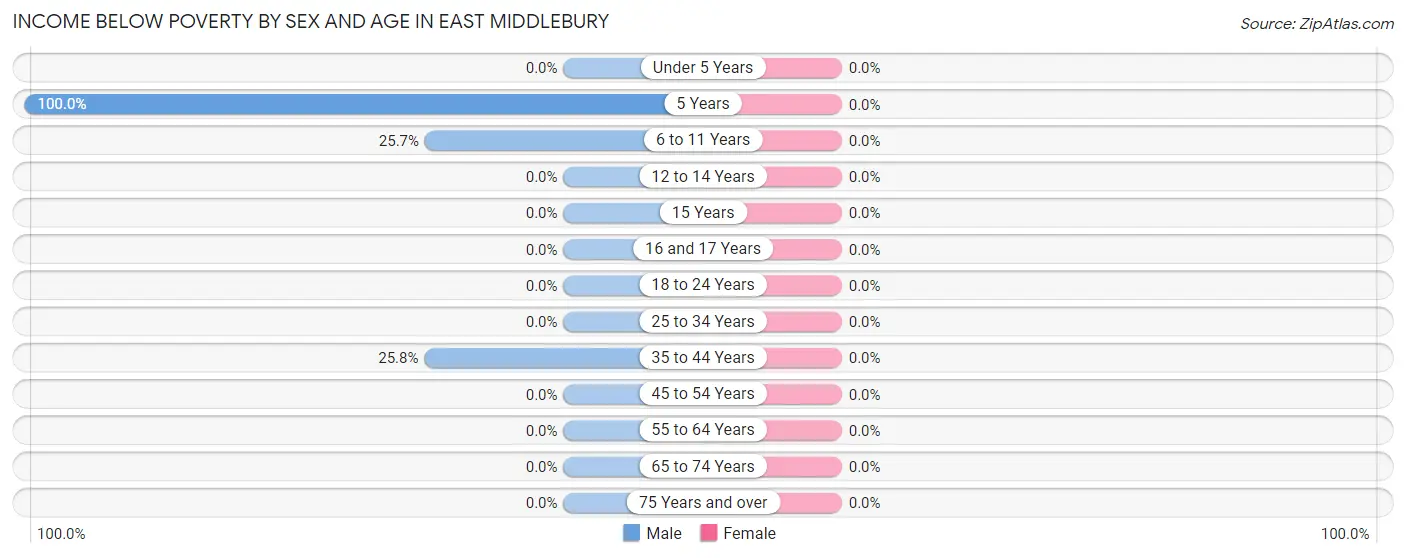
| Age Bracket | Male | Female |
| Under 5 Years | 0 (0.0%) | 0 (0.0%) |
| 5 Years | 10 (100.0%) | 0 (0.0%) |
| 6 to 11 Years | 9 (25.7%) | 0 (0.0%) |
| 12 to 14 Years | 0 (0.0%) | 0 (0.0%) |
| 15 Years | 0 (0.0%) | 0 (0.0%) |
| 16 and 17 Years | 0 (0.0%) | 0 (0.0%) |
| 18 to 24 Years | 0 (0.0%) | 0 (0.0%) |
| 25 to 34 Years | 0 (0.0%) | 0 (0.0%) |
| 35 to 44 Years | 8 (25.8%) | 0 (0.0%) |
| 45 to 54 Years | 0 (0.0%) | 0 (0.0%) |
| 55 to 64 Years | 0 (0.0%) | 0 (0.0%) |
| 65 to 74 Years | 0 (0.0%) | 0 (0.0%) |
| 75 Years and over | 0 (0.0%) | 0 (0.0%) |
| Total | 27 (9.3%) | 0 (0.0%) |
Income Above Poverty by Sex and Age in East Middlebury
According to the poverty statistics in East Middlebury, males aged 12 to 14 years and females aged under 5 years are the age groups that are most secure financially, with 100.0% of males and 100.0% of females in these age groups living above the poverty line.
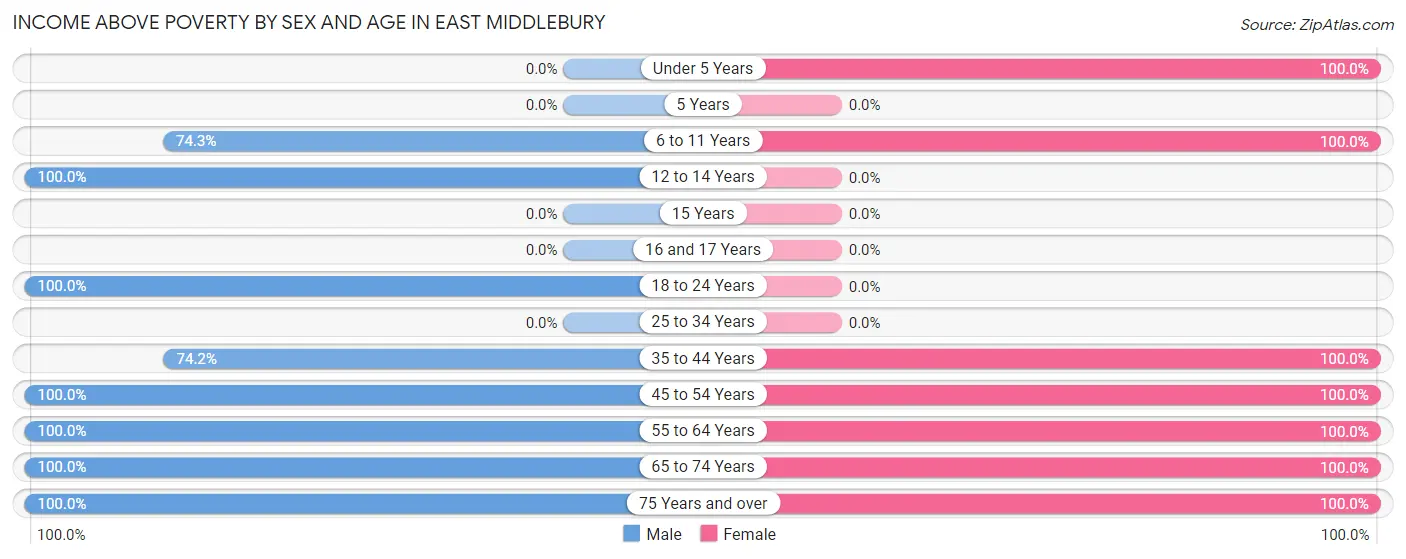
| Age Bracket | Male | Female |
| Under 5 Years | 0 (0.0%) | 6 (100.0%) |
| 5 Years | 0 (0.0%) | 0 (0.0%) |
| 6 to 11 Years | 26 (74.3%) | 16 (100.0%) |
| 12 to 14 Years | 9 (100.0%) | 0 (0.0%) |
| 15 Years | 0 (0.0%) | 0 (0.0%) |
| 16 and 17 Years | 0 (0.0%) | 0 (0.0%) |
| 18 to 24 Years | 69 (100.0%) | 0 (0.0%) |
| 25 to 34 Years | 0 (0.0%) | 0 (0.0%) |
| 35 to 44 Years | 23 (74.2%) | 31 (100.0%) |
| 45 to 54 Years | 27 (100.0%) | 54 (100.0%) |
| 55 to 64 Years | 60 (100.0%) | 22 (100.0%) |
| 65 to 74 Years | 34 (100.0%) | 27 (100.0%) |
| 75 Years and over | 15 (100.0%) | 37 (100.0%) |
| Total | 263 (90.7%) | 193 (100.0%) |
Income Below Poverty Among Married-Couple Families in East Middlebury
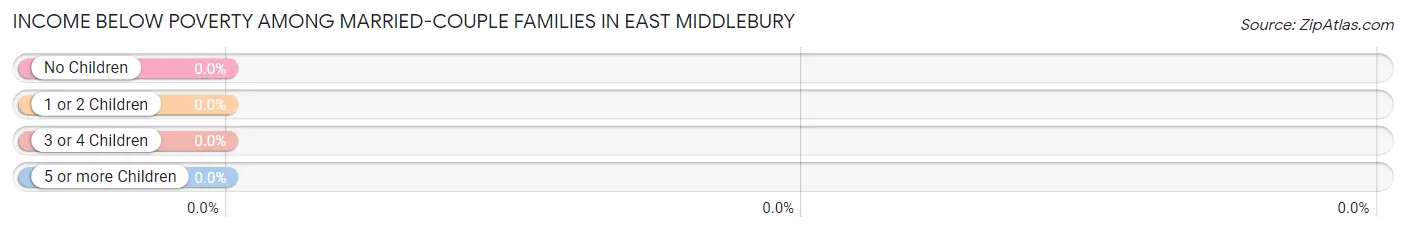
| Children | Above Poverty | Below Poverty |
| No Children | 110 (100.0%) | 0 (0.0%) |
| 1 or 2 Children | 0 (0.0%) | 0 (0.0%) |
| 3 or 4 Children | 23 (100.0%) | 0 (0.0%) |
| 5 or more Children | 0 (0.0%) | 0 (0.0%) |
| Total | 133 (100.0%) | 0 (0.0%) |
Income Below Poverty Among Single-Parent Households in East Middlebury
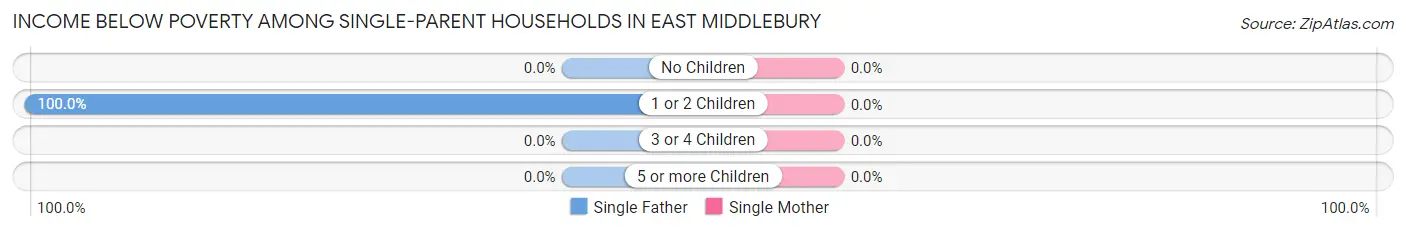
| Children | Single Father | Single Mother |
| No Children | 0 (0.0%) | 0 (0.0%) |
| 1 or 2 Children | 8 (100.0%) | 0 (0.0%) |
| 3 or 4 Children | 0 (0.0%) | 0 (0.0%) |
| 5 or more Children | 0 (0.0%) | 0 (0.0%) |
| Total | 8 (100.0%) | 0 (0.0%) |
Income Below Poverty Among Married-Couple vs Single-Parent Households in East Middlebury
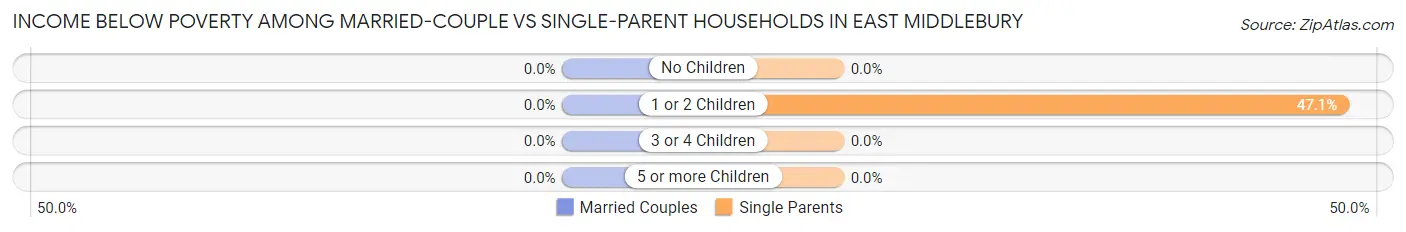
| Children | Married-Couple Families | Single-Parent Households |
| No Children | 0 (0.0%) | 0 (0.0%) |
| 1 or 2 Children | 0 (0.0%) | 8 (47.1%) |
| 3 or 4 Children | 0 (0.0%) | 0 (0.0%) |
| 5 or more Children | 0 (0.0%) | 0 (0.0%) |
| Total | 0 (0.0%) | 8 (47.1%) |
Race in East Middlebury
The most populous races in East Middlebury are White / Caucasian (411 | 85.1%), Hispanic or Latino (49 | 10.1%), and Some other Race (39 | 8.1%).
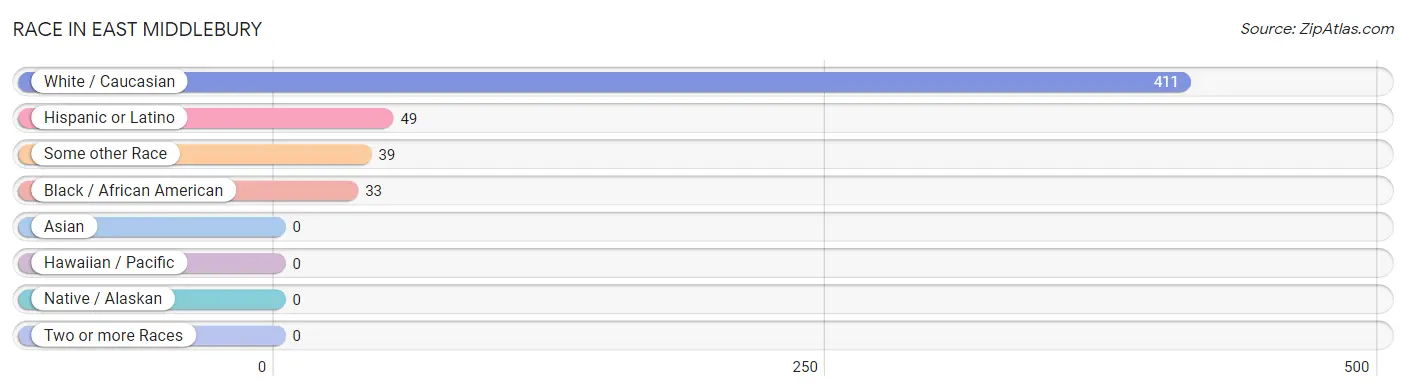
| Race | # Population | % Population |
| Asian | 0 | 0.0% |
| Black / African American | 33 | 6.8% |
| Hawaiian / Pacific | 0 | 0.0% |
| Hispanic or Latino | 49 | 10.1% |
| Native / Alaskan | 0 | 0.0% |
| White / Caucasian | 411 | 85.1% |
| Two or more Races | 0 | 0.0% |
| Some other Race | 39 | 8.1% |
| Total | 483 | 100.0% |
Ancestry in East Middlebury
The most populous ancestries reported in East Middlebury are French Canadian (160 | 33.1%), English (103 | 21.3%), American (62 | 12.8%), Jamaican (62 | 12.8%), and Irish (58 | 12.0%), together accounting for 92.1% of all East Middlebury residents.
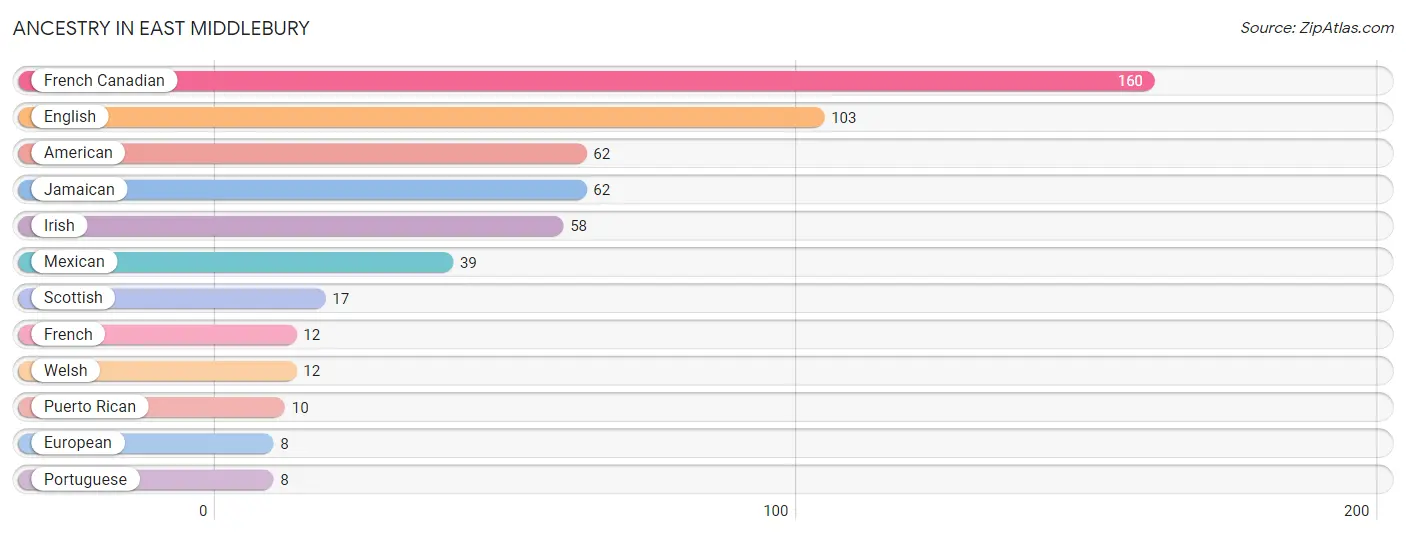
| Ancestry | # Population | % Population |
| American | 62 | 12.8% |
| English | 103 | 21.3% |
| European | 8 | 1.7% |
| French | 12 | 2.5% |
| French Canadian | 160 | 33.1% |
| Irish | 58 | 12.0% |
| Jamaican | 62 | 12.8% |
| Mexican | 39 | 8.1% |
| Portuguese | 8 | 1.7% |
| Puerto Rican | 10 | 2.1% |
| Scottish | 17 | 3.5% |
| Welsh | 12 | 2.5% | View All 12 Rows |
Immigrants in East Middlebury
The most numerous immigrant groups reported in East Middlebury came from Caribbean (23 | 4.8%), Europe (23 | 4.8%), Ireland (23 | 4.8%), Jamaica (23 | 4.8%), and Latin America (23 | 4.8%), together accounting for 23.8% of all East Middlebury residents.
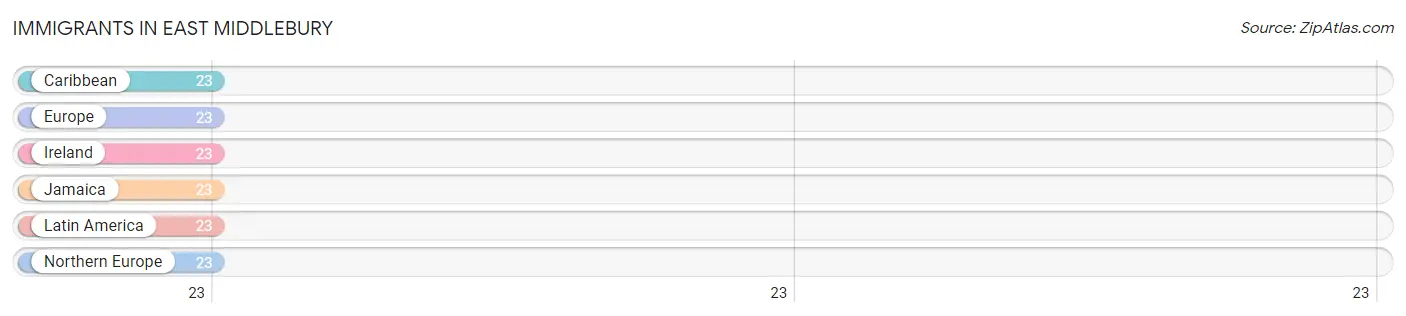
| Immigration Origin | # Population | % Population |
| Caribbean | 23 | 4.8% |
| Europe | 23 | 4.8% |
| Ireland | 23 | 4.8% |
| Jamaica | 23 | 4.8% |
| Latin America | 23 | 4.8% |
| Northern Europe | 23 | 4.8% | View All 6 Rows |
Sex and Age in East Middlebury
Sex and Age in East Middlebury
The most populous age groups in East Middlebury are 20 to 24 Years (69 | 23.8%) for men and 80 to 84 Years (37 | 19.2%) for women.
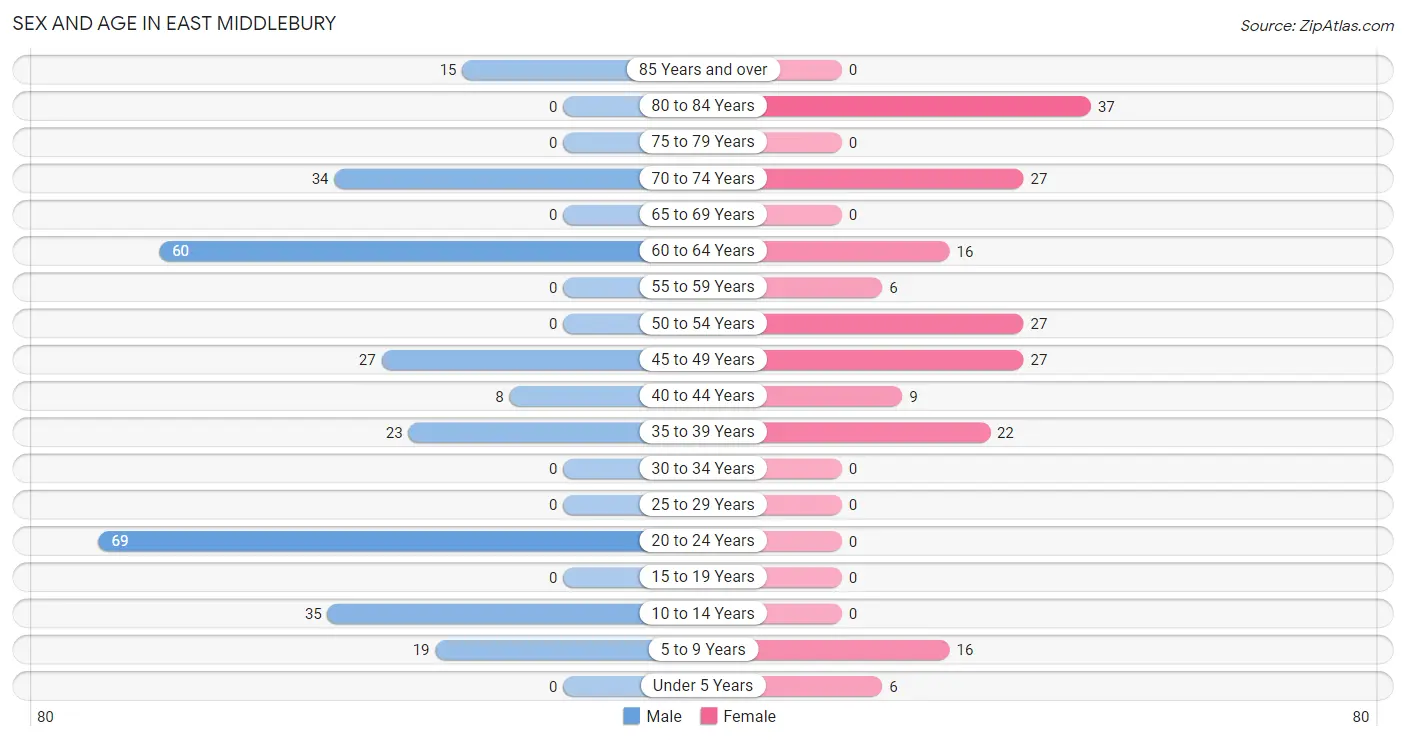
| Age Bracket | Male | Female |
| Under 5 Years | 0 (0.0%) | 6 (3.1%) |
| 5 to 9 Years | 19 (6.6%) | 16 (8.3%) |
| 10 to 14 Years | 35 (12.1%) | 0 (0.0%) |
| 15 to 19 Years | 0 (0.0%) | 0 (0.0%) |
| 20 to 24 Years | 69 (23.8%) | 0 (0.0%) |
| 25 to 29 Years | 0 (0.0%) | 0 (0.0%) |
| 30 to 34 Years | 0 (0.0%) | 0 (0.0%) |
| 35 to 39 Years | 23 (7.9%) | 22 (11.4%) |
| 40 to 44 Years | 8 (2.8%) | 9 (4.7%) |
| 45 to 49 Years | 27 (9.3%) | 27 (14.0%) |
| 50 to 54 Years | 0 (0.0%) | 27 (14.0%) |
| 55 to 59 Years | 0 (0.0%) | 6 (3.1%) |
| 60 to 64 Years | 60 (20.7%) | 16 (8.3%) |
| 65 to 69 Years | 0 (0.0%) | 0 (0.0%) |
| 70 to 74 Years | 34 (11.7%) | 27 (14.0%) |
| 75 to 79 Years | 0 (0.0%) | 0 (0.0%) |
| 80 to 84 Years | 0 (0.0%) | 37 (19.2%) |
| 85 Years and over | 15 (5.2%) | 0 (0.0%) |
| Total | 290 (100.0%) | 193 (100.0%) |
Families and Households in East Middlebury
Median Family Size in East Middlebury
The median family size in East Middlebury is 2.74 persons per family, with single male/father families (8 | 5.3%) accounting for the largest median family size of 3.38 persons per family. On the other hand, married-couple families (133 | 88.7%) represent the smallest median family size with 2.68 persons per family.
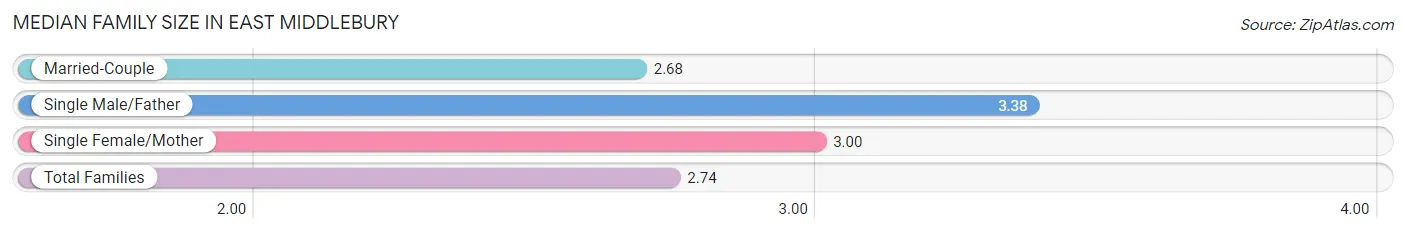
| Family Type | # Families | Family Size |
| Married-Couple | 133 (88.7%) | 2.68 |
| Single Male/Father | 8 (5.3%) | 3.38 |
| Single Female/Mother | 9 (6.0%) | 3.00 |
| Total Families | 150 (100.0%) | 2.74 |
Median Household Size in East Middlebury
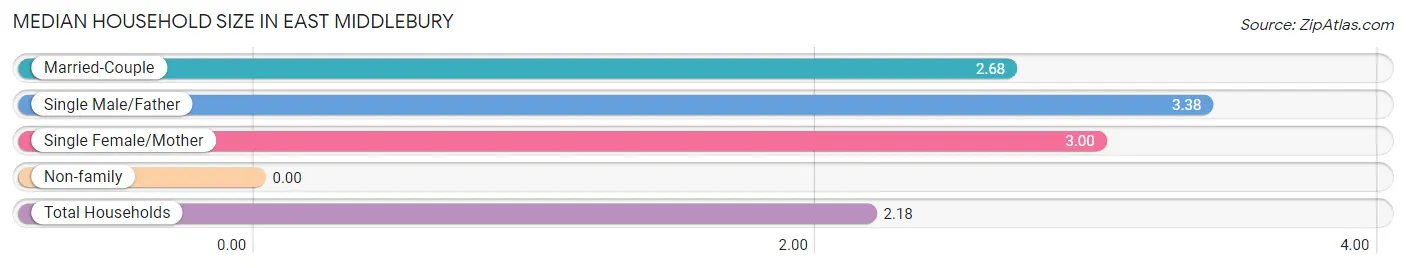
| Household Type | # Households | Household Size |
| Married-Couple | 133 (59.9%) | 2.68 |
| Single Male/Father | 8 (3.6%) | 3.38 |
| Single Female/Mother | 9 (4.1%) | 3.00 |
| Non-family | 72 (32.4%) | - |
| Total Households | 222 (100.0%) | 2.18 |
Household Size by Marriage Status in East Middlebury
Out of a total of 222 households in East Middlebury, 150 (67.6%) are family households, while 72 (32.4%) are nonfamily households. The most numerous type of family households are 2-person households, comprising 83, and the most common type of nonfamily households are 1-person households, comprising 72.
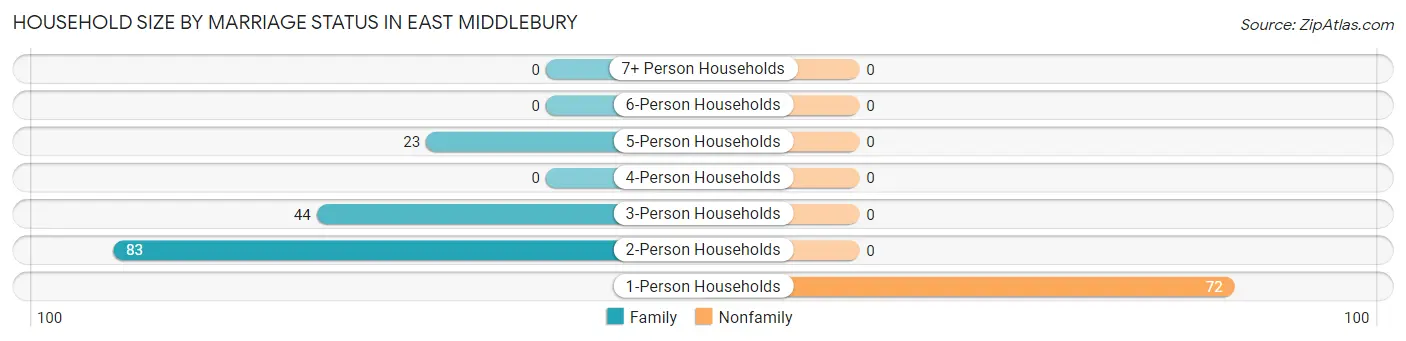
| Household Size | Family Households | Nonfamily Households |
| 1-Person Households | - | 72 (32.4%) |
| 2-Person Households | 83 (37.4%) | 0 (0.0%) |
| 3-Person Households | 44 (19.8%) | 0 (0.0%) |
| 4-Person Households | 0 (0.0%) | 0 (0.0%) |
| 5-Person Households | 23 (10.4%) | 0 (0.0%) |
| 6-Person Households | 0 (0.0%) | 0 (0.0%) |
| 7+ Person Households | 0 (0.0%) | 0 (0.0%) |
| Total | 150 (67.6%) | 72 (32.4%) |
Female Fertility in East Middlebury
Fertility by Age in East Middlebury
| Age Bracket | Women with Births | Births / 1,000 Women |
| 15 to 19 years | 0 (0.0%) | 0.0 |
| 20 to 34 years | 0 (0.0%) | 0.0 |
| 35 to 50 years | 0 (0.0%) | 0.0 |
| Total | 0 (0.0%) | 0.0 |
Fertility by Age by Marriage Status in East Middlebury
| Age Bracket | Married | Unmarried |
| 15 to 19 years | 0 (0.0%) | 0 (0.0%) |
| 20 to 34 years | 0 (0.0%) | 0 (0.0%) |
| 35 to 50 years | 0 (0.0%) | 0 (0.0%) |
| Total | 0 (0.0%) | 0 (0.0%) |
Fertility by Education in East Middlebury
| Educational Attainment | Women with Births | Births / 1,000 Women |
| Less than High School | 0 (0.0%) | 0.0 |
| High School Diploma | 0 (0.0%) | 0.0 |
| College or Associate's Degree | 0 (0.0%) | 0.0 |
| Bachelor's Degree | 0 (0.0%) | 0.0 |
| Graduate Degree | 0 (0.0%) | 0.0 |
| Total | 0 (0.0%) | 0.0 |
Fertility by Education by Marriage Status in East Middlebury
| Educational Attainment | Married | Unmarried |
| Less than High School | 0 (0.0%) | 0 (0.0%) |
| High School Diploma | 0 (0.0%) | 0 (0.0%) |
| College or Associate's Degree | 0 (0.0%) | 0 (0.0%) |
| Bachelor's Degree | 0 (0.0%) | 0 (0.0%) |
| Graduate Degree | 0 (0.0%) | 0 (0.0%) |
| Total | 0 (0.0%) | 0 (0.0%) |
Employment Characteristics in East Middlebury
Employment by Class of Employer in East Middlebury
Among the 286 employed individuals in East Middlebury, private company employees (148 | 51.7%), not-for-profit organizations (77 | 26.9%), and self-employed (incorporated) (27 | 9.4%) make up the most common classes of employment.
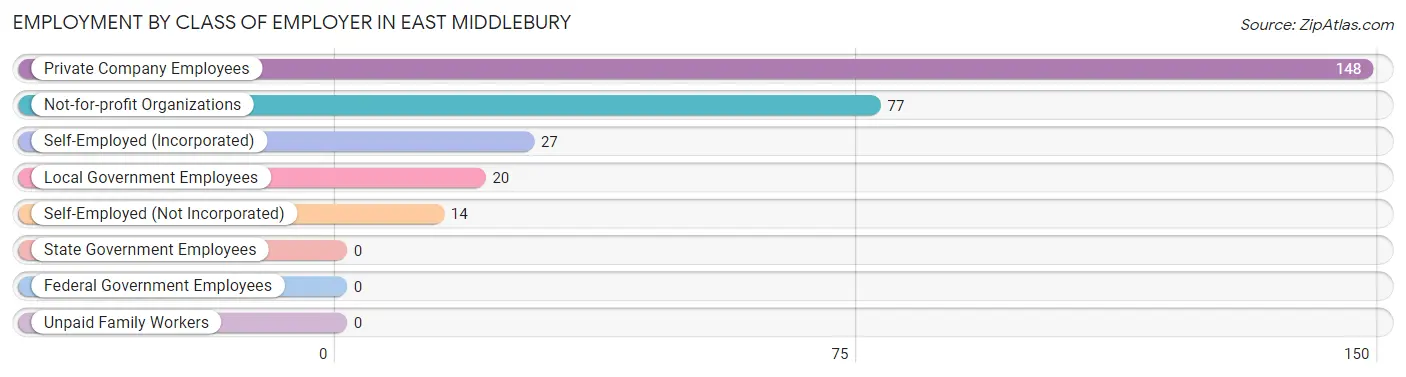
| Employer Class | # Employees | % Employees |
| Private Company Employees | 148 | 51.7% |
| Self-Employed (Incorporated) | 27 | 9.4% |
| Self-Employed (Not Incorporated) | 14 | 4.9% |
| Not-for-profit Organizations | 77 | 26.9% |
| Local Government Employees | 20 | 7.0% |
| State Government Employees | 0 | 0.0% |
| Federal Government Employees | 0 | 0.0% |
| Unpaid Family Workers | 0 | 0.0% |
| Total | 286 | 100.0% |
Employment Status by Age in East Middlebury
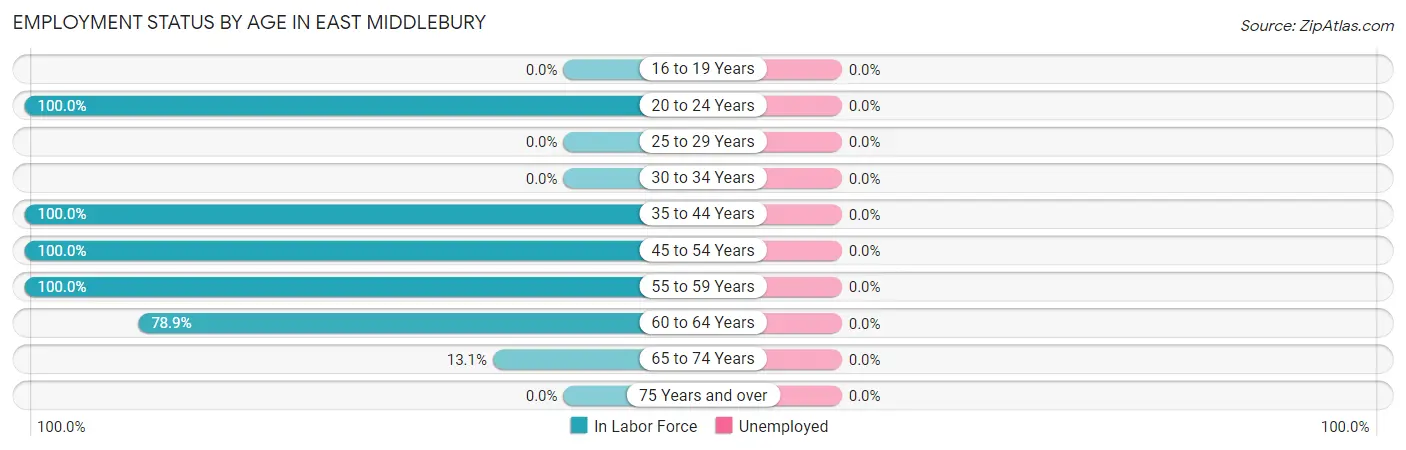
| Age Bracket | In Labor Force | Unemployed |
| 16 to 19 Years | 0 (0.0%) | 0 (0.0%) |
| 20 to 24 Years | 69 (100.0%) | 0 (0.0%) |
| 25 to 29 Years | 0 (0.0%) | 0 (0.0%) |
| 30 to 34 Years | 0 (0.0%) | 0 (0.0%) |
| 35 to 44 Years | 62 (100.0%) | 0 (0.0%) |
| 45 to 54 Years | 81 (100.0%) | 0 (0.0%) |
| 55 to 59 Years | 6 (100.0%) | 0 (0.0%) |
| 60 to 64 Years | 60 (78.9%) | 0 (0.0%) |
| 65 to 74 Years | 8 (13.1%) | 0 (0.0%) |
| 75 Years and over | 0 (0.0%) | 0 (0.0%) |
| Total | 286 (70.3%) | 0 (0.0%) |
Employment Status by Educational Attainment in East Middlebury
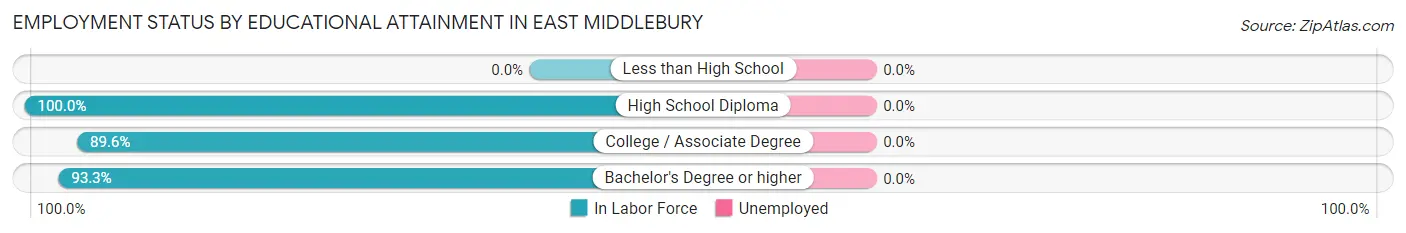
| Educational Attainment | In Labor Force | Unemployed |
| Less than High School | 0 (0.0%) | 0 (0.0%) |
| High School Diploma | 29 (100.0%) | 0 (0.0%) |
| College / Associate Degree | 69 (89.6%) | 0 (0.0%) |
| Bachelor's Degree or higher | 111 (93.3%) | 0 (0.0%) |
| Total | 209 (92.9%) | 0 (0.0%) |
Employment Occupations by Sex in East Middlebury
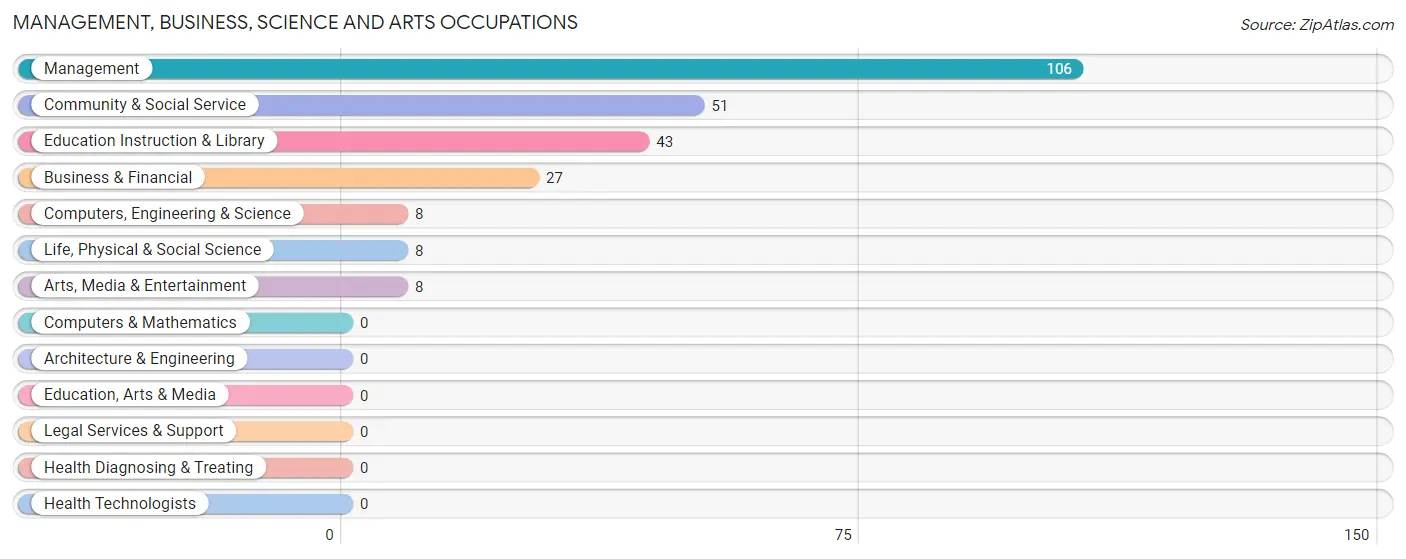
Management, Business, Science and Arts Occupations
The most common Management, Business, Science and Arts occupations in East Middlebury are Management (106 | 37.1%), Community & Social Service (51 | 17.8%), Education Instruction & Library (43 | 15.0%), Business & Financial (27 | 9.4%), and Computers, Engineering & Science (8 | 2.8%).
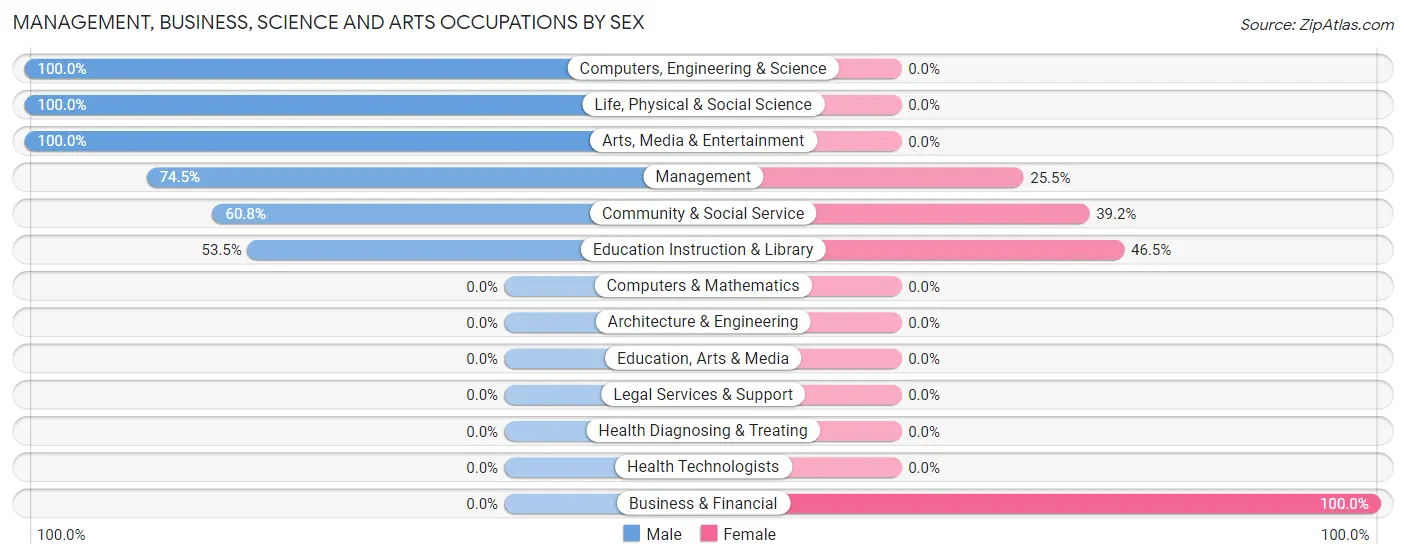
Management, Business, Science and Arts Occupations by Sex
Within the Management, Business, Science and Arts occupations in East Middlebury, the most male-oriented occupations are Computers, Engineering & Science (100.0%), Life, Physical & Social Science (100.0%), and Arts, Media & Entertainment (100.0%), while the most female-oriented occupations are Business & Financial (100.0%), Education Instruction & Library (46.5%), and Community & Social Service (39.2%).
| Occupation | Male | Female |
| Management | 79 (74.5%) | 27 (25.5%) |
| Business & Financial | 0 (0.0%) | 27 (100.0%) |
| Computers, Engineering & Science | 8 (100.0%) | 0 (0.0%) |
| Computers & Mathematics | 0 (0.0%) | 0 (0.0%) |
| Architecture & Engineering | 0 (0.0%) | 0 (0.0%) |
| Life, Physical & Social Science | 8 (100.0%) | 0 (0.0%) |
| Community & Social Service | 31 (60.8%) | 20 (39.2%) |
| Education, Arts & Media | 0 (0.0%) | 0 (0.0%) |
| Legal Services & Support | 0 (0.0%) | 0 (0.0%) |
| Education Instruction & Library | 23 (53.5%) | 20 (46.5%) |
| Arts, Media & Entertainment | 8 (100.0%) | 0 (0.0%) |
| Health Diagnosing & Treating | 0 (0.0%) | 0 (0.0%) |
| Health Technologists | 0 (0.0%) | 0 (0.0%) |
| Total (Category) | 118 (61.5%) | 74 (38.5%) |
| Total (Overall) | 187 (65.4%) | 99 (34.6%) |
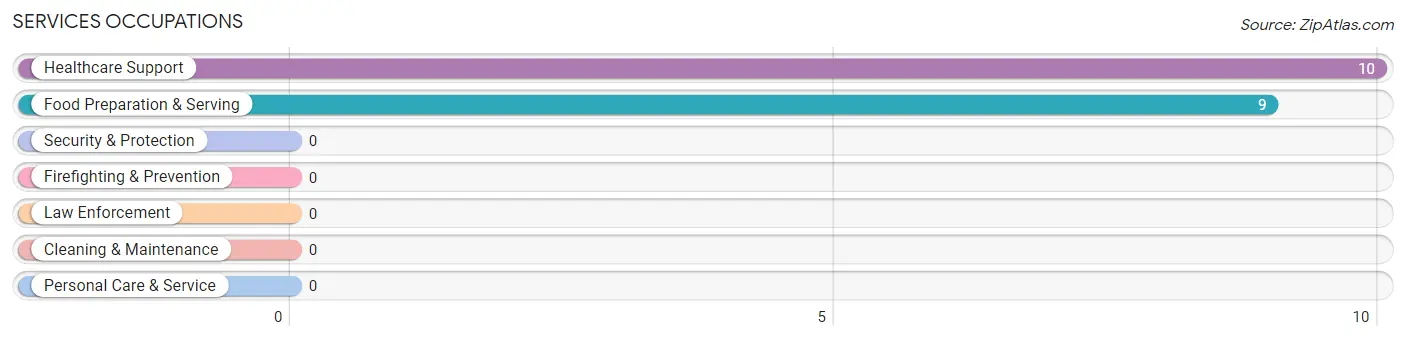
Services Occupations
The most common Services occupations in East Middlebury are Healthcare Support (10 | 3.5%), and Food Preparation & Serving (9 | 3.2%).
Services Occupations by Sex
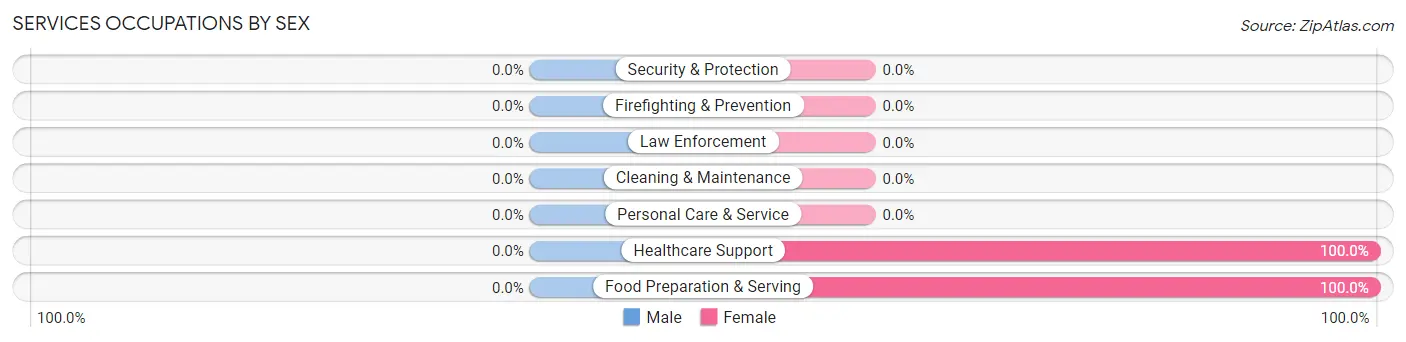
| Occupation | Male | Female |
| Healthcare Support | 0 (0.0%) | 10 (100.0%) |
| Security & Protection | 0 (0.0%) | 0 (0.0%) |
| Firefighting & Prevention | 0 (0.0%) | 0 (0.0%) |
| Law Enforcement | 0 (0.0%) | 0 (0.0%) |
| Food Preparation & Serving | 0 (0.0%) | 9 (100.0%) |
| Cleaning & Maintenance | 0 (0.0%) | 0 (0.0%) |
| Personal Care & Service | 0 (0.0%) | 0 (0.0%) |
| Total (Category) | 0 (0.0%) | 19 (100.0%) |
| Total (Overall) | 187 (65.4%) | 99 (34.6%) |
Sales and Office Occupations
Sales and Office Occupations by Sex
| Occupation | Male | Female |
| Sales & Related | 0 (0.0%) | 0 (0.0%) |
| Office & Administration | 0 (0.0%) | 0 (0.0%) |
| Total (Category) | 0 (0.0%) | 0 (0.0%) |
| Total (Overall) | 187 (65.4%) | 99 (34.6%) |
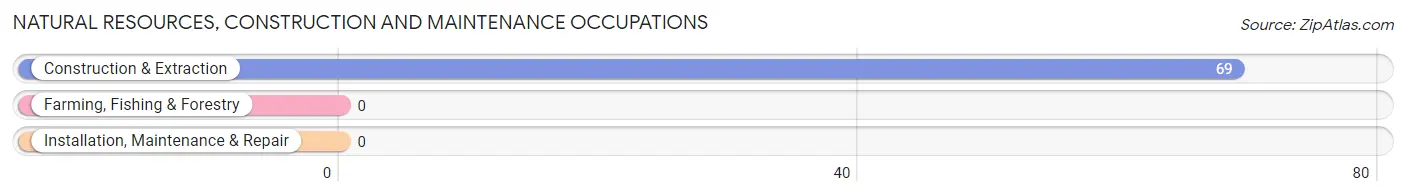
Natural Resources, Construction and Maintenance Occupations
The most common Natural Resources, Construction and Maintenance occupations in East Middlebury are , and Construction & Extraction (69 | 24.1%).
Natural Resources, Construction and Maintenance Occupations by Sex
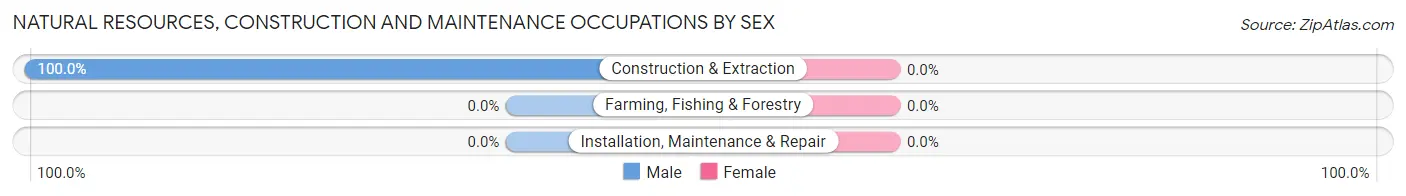
| Occupation | Male | Female |
| Farming, Fishing & Forestry | 0 (0.0%) | 0 (0.0%) |
| Construction & Extraction | 69 (100.0%) | 0 (0.0%) |
| Installation, Maintenance & Repair | 0 (0.0%) | 0 (0.0%) |
| Total (Category) | 69 (100.0%) | 0 (0.0%) |
| Total (Overall) | 187 (65.4%) | 99 (34.6%) |
Production, Transportation and Moving Occupations
The most common Production, Transportation and Moving occupations in East Middlebury are , and Production (6 | 2.1%).
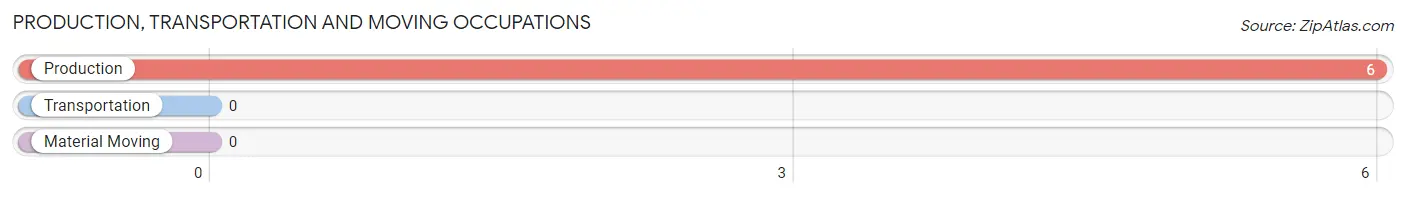
Production, Transportation and Moving Occupations by Sex
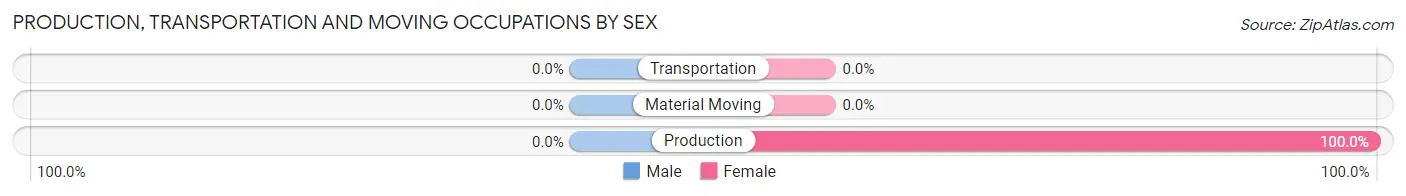
| Occupation | Male | Female |
| Production | 0 (0.0%) | 6 (100.0%) |
| Transportation | 0 (0.0%) | 0 (0.0%) |
| Material Moving | 0 (0.0%) | 0 (0.0%) |
| Total (Category) | 0 (0.0%) | 6 (100.0%) |
| Total (Overall) | 187 (65.4%) | 99 (34.6%) |
Employment Industries by Sex in East Middlebury
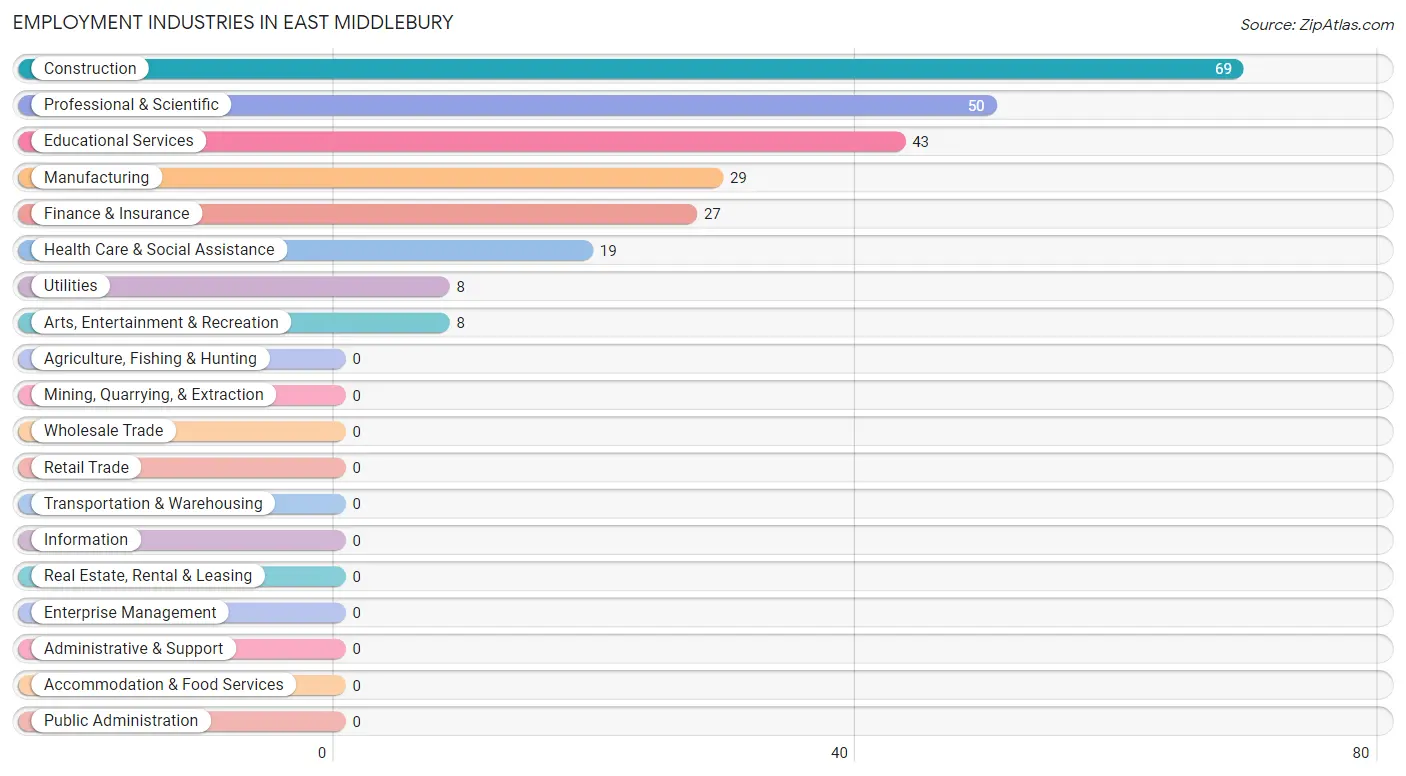
Employment Industries in East Middlebury
The major employment industries in East Middlebury include Construction (69 | 24.1%), Professional & Scientific (50 | 17.5%), Educational Services (43 | 15.0%), Manufacturing (29 | 10.1%), and Finance & Insurance (27 | 9.4%).
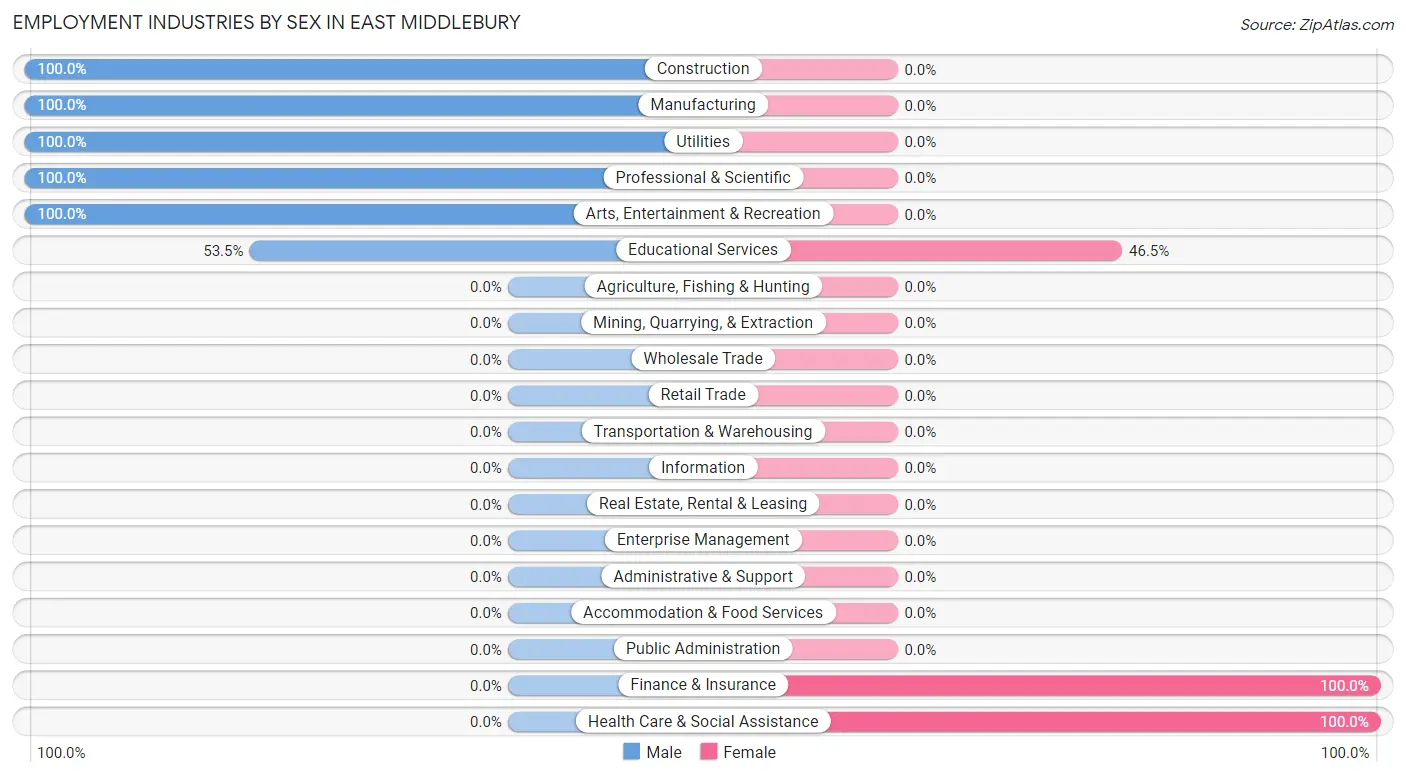
Employment Industries by Sex in East Middlebury
The East Middlebury industries that see more men than women are Construction (100.0%), Manufacturing (100.0%), and Utilities (100.0%), whereas the industries that tend to have a higher number of women are Finance & Insurance (100.0%), Health Care & Social Assistance (100.0%), and Educational Services (46.5%).
| Industry | Male | Female |
| Agriculture, Fishing & Hunting | 0 (0.0%) | 0 (0.0%) |
| Mining, Quarrying, & Extraction | 0 (0.0%) | 0 (0.0%) |
| Construction | 69 (100.0%) | 0 (0.0%) |
| Manufacturing | 29 (100.0%) | 0 (0.0%) |
| Wholesale Trade | 0 (0.0%) | 0 (0.0%) |
| Retail Trade | 0 (0.0%) | 0 (0.0%) |
| Transportation & Warehousing | 0 (0.0%) | 0 (0.0%) |
| Utilities | 8 (100.0%) | 0 (0.0%) |
| Information | 0 (0.0%) | 0 (0.0%) |
| Finance & Insurance | 0 (0.0%) | 27 (100.0%) |
| Real Estate, Rental & Leasing | 0 (0.0%) | 0 (0.0%) |
| Professional & Scientific | 50 (100.0%) | 0 (0.0%) |
| Enterprise Management | 0 (0.0%) | 0 (0.0%) |
| Administrative & Support | 0 (0.0%) | 0 (0.0%) |
| Educational Services | 23 (53.5%) | 20 (46.5%) |
| Health Care & Social Assistance | 0 (0.0%) | 19 (100.0%) |
| Arts, Entertainment & Recreation | 8 (100.0%) | 0 (0.0%) |
| Accommodation & Food Services | 0 (0.0%) | 0 (0.0%) |
| Public Administration | 0 (0.0%) | 0 (0.0%) |
| Total | 187 (65.4%) | 99 (34.6%) |
Education in East Middlebury
School Enrollment in East Middlebury
The most common levels of schooling among the 70 students in East Middlebury are elementary school (34 | 48.6%), middle school (26 | 37.1%), and nursery / preschool (10 | 14.3%).
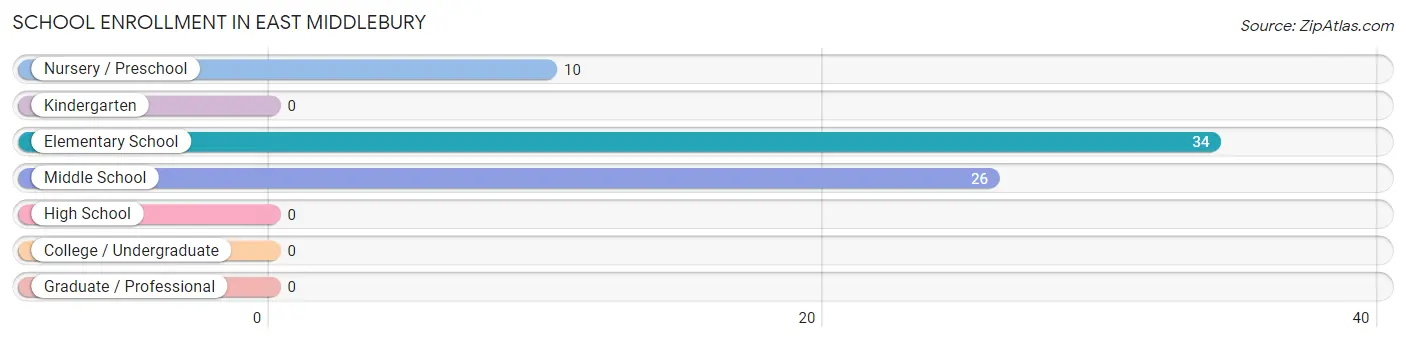
| School Level | # Students | % Students |
| Nursery / Preschool | 10 | 14.3% |
| Kindergarten | 0 | 0.0% |
| Elementary School | 34 | 48.6% |
| Middle School | 26 | 37.1% |
| High School | 0 | 0.0% |
| College / Undergraduate | 0 | 0.0% |
| Graduate / Professional | 0 | 0.0% |
| Total | 70 | 100.0% |
School Enrollment by Age by Funding Source in East Middlebury
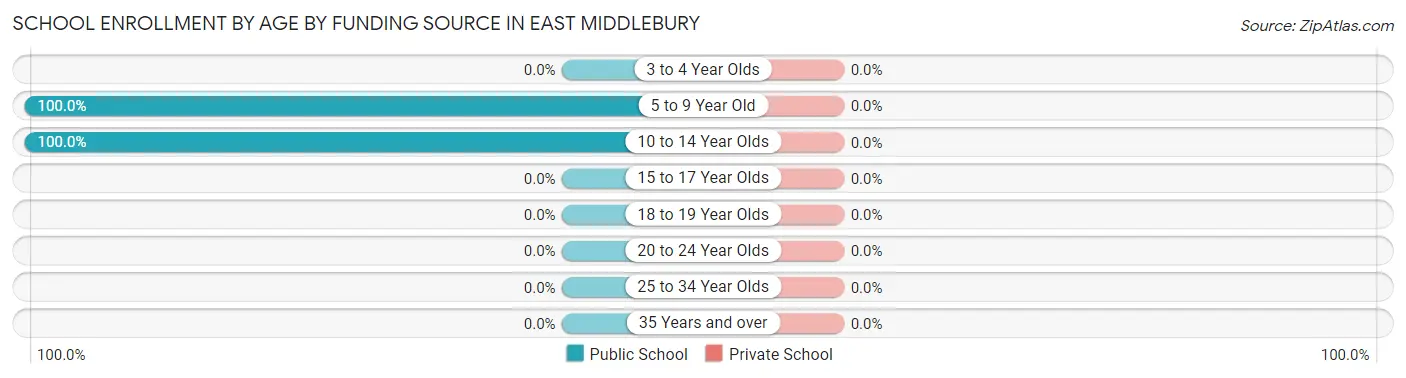
| Age Bracket | Public School | Private School |
| 3 to 4 Year Olds | 0 (0.0%) | 0 (0.0%) |
| 5 to 9 Year Old | 35 (100.0%) | 0 (0.0%) |
| 10 to 14 Year Olds | 35 (100.0%) | 0 (0.0%) |
| 15 to 17 Year Olds | 0 (0.0%) | 0 (0.0%) |
| 18 to 19 Year Olds | 0 (0.0%) | 0 (0.0%) |
| 20 to 24 Year Olds | 0 (0.0%) | 0 (0.0%) |
| 25 to 34 Year Olds | 0 (0.0%) | 0 (0.0%) |
| 35 Years and over | 0 (0.0%) | 0 (0.0%) |
| Total | 70 (100.0%) | 0 (0.0%) |
Educational Attainment by Field of Study in East Middlebury
Education (70 | 49.3%), liberal arts & history (39 | 27.5%), multidisciplinary studies (23 | 16.2%), and communications (10 | 7.0%) are the most common fields of study among 142 individuals in East Middlebury who have obtained a bachelor's degree or higher.
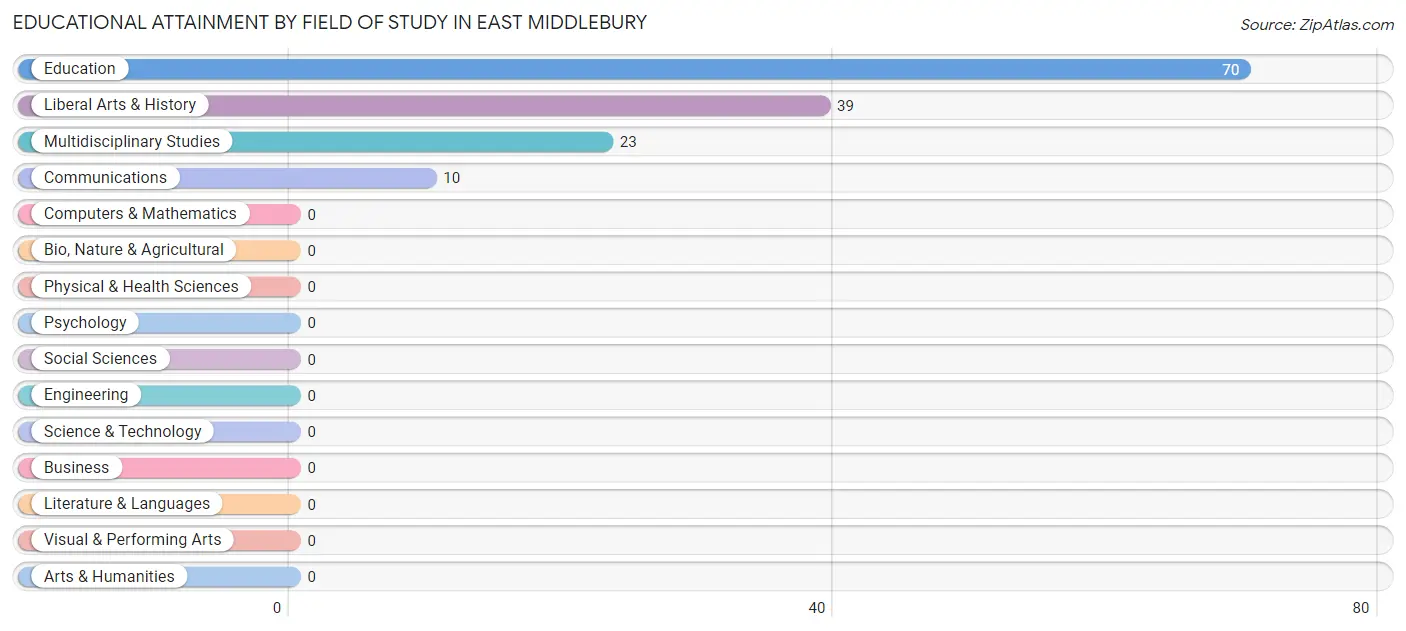
| Field of Study | # Graduates | % Graduates |
| Computers & Mathematics | 0 | 0.0% |
| Bio, Nature & Agricultural | 0 | 0.0% |
| Physical & Health Sciences | 0 | 0.0% |
| Psychology | 0 | 0.0% |
| Social Sciences | 0 | 0.0% |
| Engineering | 0 | 0.0% |
| Multidisciplinary Studies | 23 | 16.2% |
| Science & Technology | 0 | 0.0% |
| Business | 0 | 0.0% |
| Education | 70 | 49.3% |
| Literature & Languages | 0 | 0.0% |
| Liberal Arts & History | 39 | 27.5% |
| Visual & Performing Arts | 0 | 0.0% |
| Communications | 10 | 7.0% |
| Arts & Humanities | 0 | 0.0% |
| Total | 142 | 100.0% |
Transportation & Commute in East Middlebury
Vehicle Availability by Sex in East Middlebury
The most prevalent vehicle ownership categories in East Middlebury are males with 3 vehicles (96, accounting for 51.3%) and females with 3 vehicles (27, making up 97.0%).
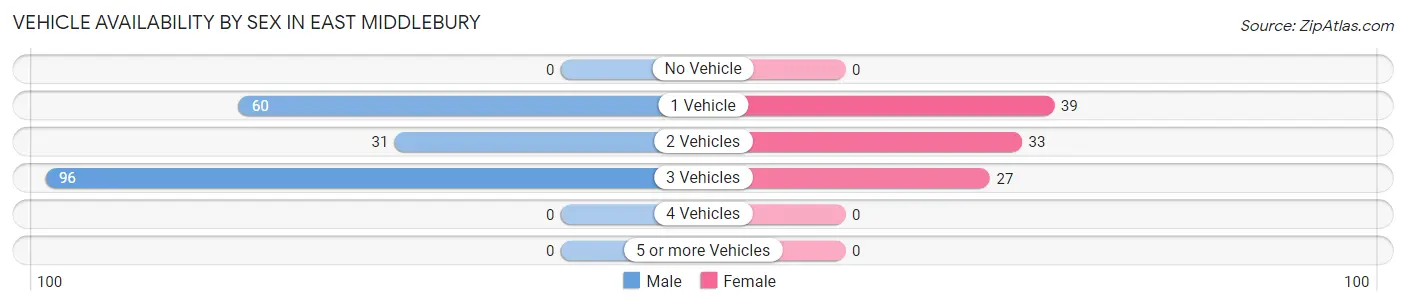
| Vehicles Available | Male | Female |
| No Vehicle | 0 (0.0%) | 0 (0.0%) |
| 1 Vehicle | 60 (32.1%) | 39 (39.4%) |
| 2 Vehicles | 31 (16.6%) | 33 (33.3%) |
| 3 Vehicles | 96 (51.3%) | 27 (27.3%) |
| 4 Vehicles | 0 (0.0%) | 0 (0.0%) |
| 5 or more Vehicles | 0 (0.0%) | 0 (0.0%) |
| Total | 187 (100.0%) | 99 (100.0%) |
Commute Time in East Middlebury
The most frequently occuring commute durations in East Middlebury are 10 to 14 minutes (146 commuters, 58.2%), less than 5 minutes (33 commuters, 13.2%), and 5 to 9 minutes (29 commuters, 11.6%).
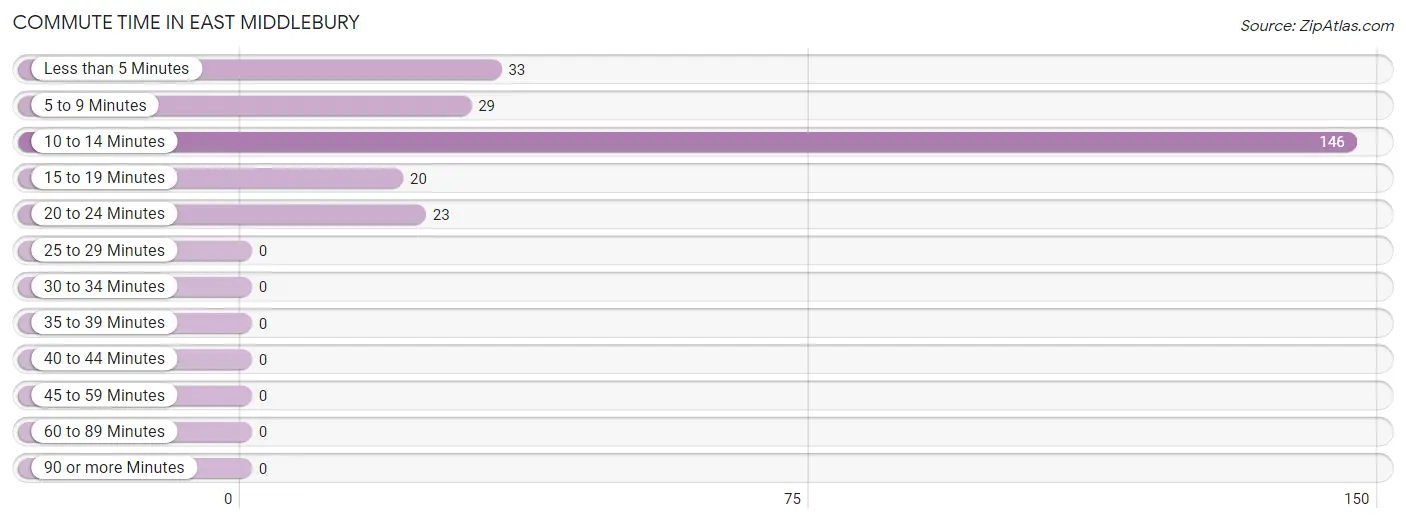
| Commute Time | # Commuters | % Commuters |
| Less than 5 Minutes | 33 | 13.2% |
| 5 to 9 Minutes | 29 | 11.6% |
| 10 to 14 Minutes | 146 | 58.2% |
| 15 to 19 Minutes | 20 | 8.0% |
| 20 to 24 Minutes | 23 | 9.2% |
| 25 to 29 Minutes | 0 | 0.0% |
| 30 to 34 Minutes | 0 | 0.0% |
| 35 to 39 Minutes | 0 | 0.0% |
| 40 to 44 Minutes | 0 | 0.0% |
| 45 to 59 Minutes | 0 | 0.0% |
| 60 to 89 Minutes | 0 | 0.0% |
| 90 or more Minutes | 0 | 0.0% |
Commute Time by Sex in East Middlebury
The most common commute times in East Middlebury are 10 to 14 minutes (92 commuters, 51.4%) for males and 10 to 14 minutes (54 commuters, 75.0%) for females.
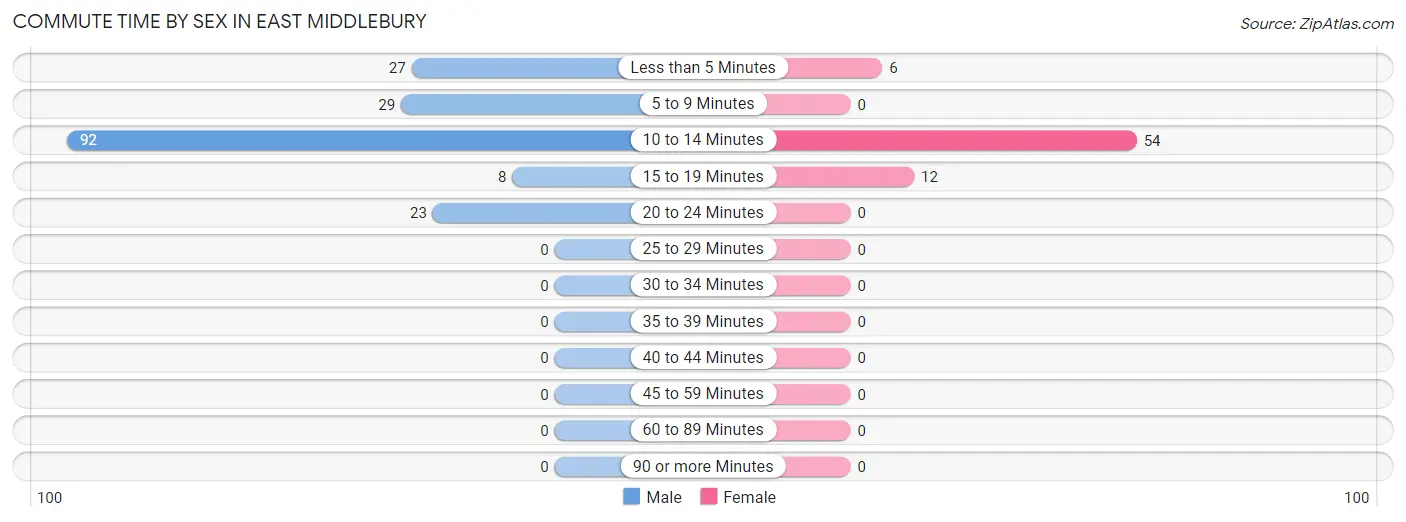
| Commute Time | Male | Female |
| Less than 5 Minutes | 27 (15.1%) | 6 (8.3%) |
| 5 to 9 Minutes | 29 (16.2%) | 0 (0.0%) |
| 10 to 14 Minutes | 92 (51.4%) | 54 (75.0%) |
| 15 to 19 Minutes | 8 (4.5%) | 12 (16.7%) |
| 20 to 24 Minutes | 23 (12.9%) | 0 (0.0%) |
| 25 to 29 Minutes | 0 (0.0%) | 0 (0.0%) |
| 30 to 34 Minutes | 0 (0.0%) | 0 (0.0%) |
| 35 to 39 Minutes | 0 (0.0%) | 0 (0.0%) |
| 40 to 44 Minutes | 0 (0.0%) | 0 (0.0%) |
| 45 to 59 Minutes | 0 (0.0%) | 0 (0.0%) |
| 60 to 89 Minutes | 0 (0.0%) | 0 (0.0%) |
| 90 or more Minutes | 0 (0.0%) | 0 (0.0%) |
Time of Departure to Work by Sex in East Middlebury
The most frequent times of departure to work in East Middlebury are 7:00 AM to 7:29 AM (69, 38.6%) for males and 8:00 AM to 8:29 AM (27, 37.5%) for females.
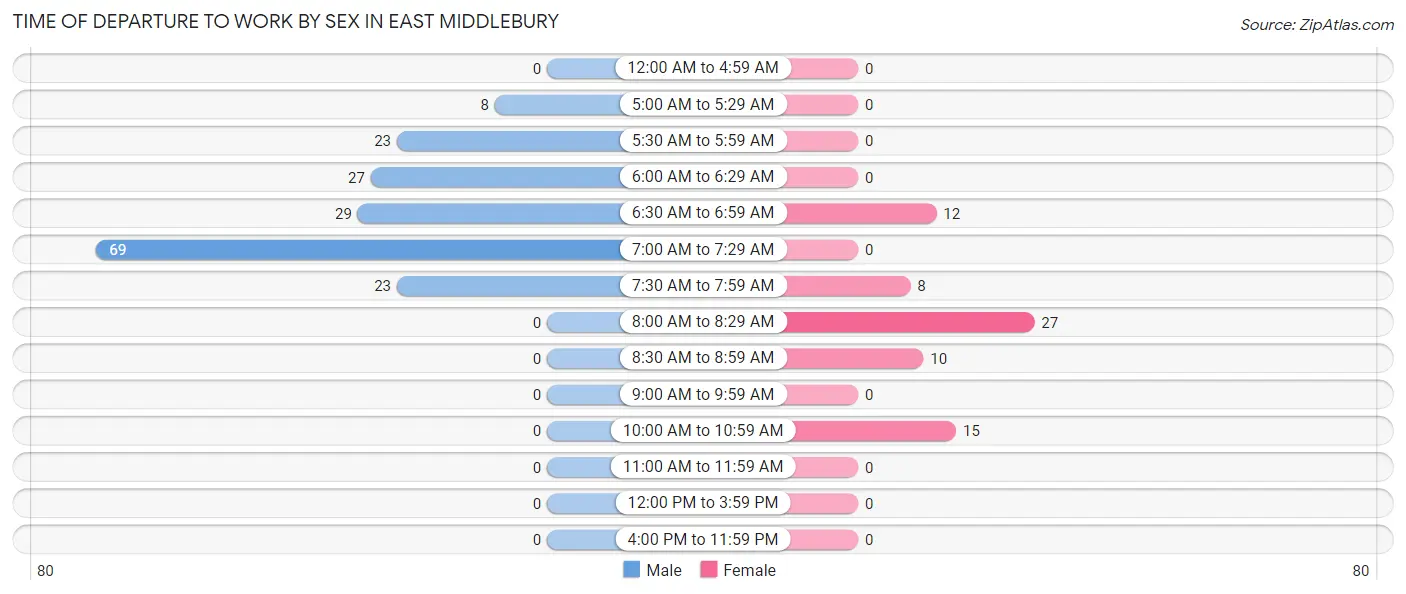
| Time of Departure | Male | Female |
| 12:00 AM to 4:59 AM | 0 (0.0%) | 0 (0.0%) |
| 5:00 AM to 5:29 AM | 8 (4.5%) | 0 (0.0%) |
| 5:30 AM to 5:59 AM | 23 (12.9%) | 0 (0.0%) |
| 6:00 AM to 6:29 AM | 27 (15.1%) | 0 (0.0%) |
| 6:30 AM to 6:59 AM | 29 (16.2%) | 12 (16.7%) |
| 7:00 AM to 7:29 AM | 69 (38.6%) | 0 (0.0%) |
| 7:30 AM to 7:59 AM | 23 (12.9%) | 8 (11.1%) |
| 8:00 AM to 8:29 AM | 0 (0.0%) | 27 (37.5%) |
| 8:30 AM to 8:59 AM | 0 (0.0%) | 10 (13.9%) |
| 9:00 AM to 9:59 AM | 0 (0.0%) | 0 (0.0%) |
| 10:00 AM to 10:59 AM | 0 (0.0%) | 15 (20.8%) |
| 11:00 AM to 11:59 AM | 0 (0.0%) | 0 (0.0%) |
| 12:00 PM to 3:59 PM | 0 (0.0%) | 0 (0.0%) |
| 4:00 PM to 11:59 PM | 0 (0.0%) | 0 (0.0%) |
| Total | 179 (100.0%) | 72 (100.0%) |
Housing Occupancy in East Middlebury
Occupancy by Ownership in East Middlebury
Of the total 222 dwellings in East Middlebury, owner-occupied units account for 193 (86.9%), while renter-occupied units make up 29 (13.1%).
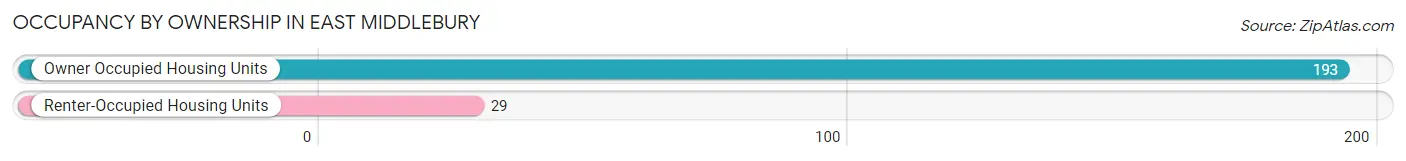
| Occupancy | # Housing Units | % Housing Units |
| Owner Occupied Housing Units | 193 | 86.9% |
| Renter-Occupied Housing Units | 29 | 13.1% |
| Total Occupied Housing Units | 222 | 100.0% |
Occupancy by Household Size in East Middlebury
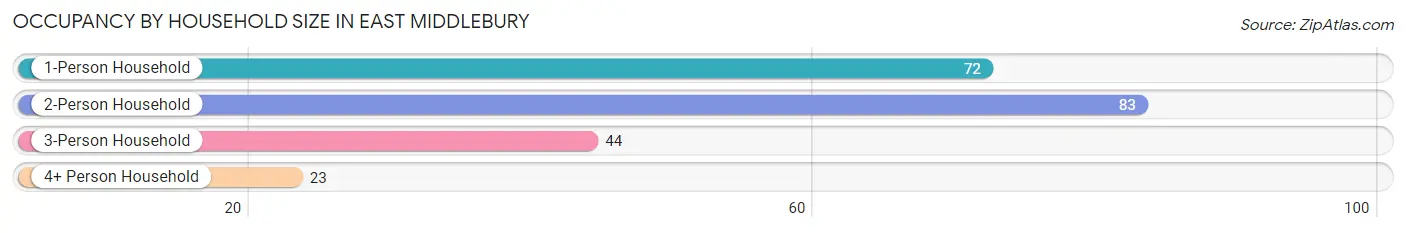
| Household Size | # Housing Units | % Housing Units |
| 1-Person Household | 72 | 32.4% |
| 2-Person Household | 83 | 37.4% |
| 3-Person Household | 44 | 19.8% |
| 4+ Person Household | 23 | 10.4% |
| Total Housing Units | 222 | 100.0% |
Occupancy by Ownership by Household Size in East Middlebury
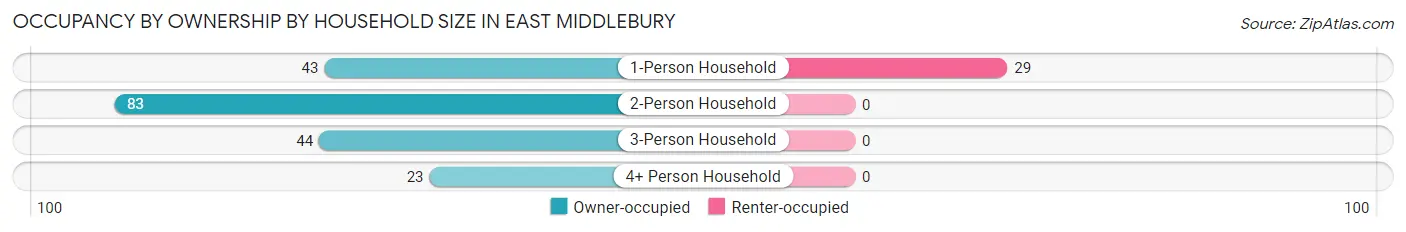
| Household Size | Owner-occupied | Renter-occupied |
| 1-Person Household | 43 (59.7%) | 29 (40.3%) |
| 2-Person Household | 83 (100.0%) | 0 (0.0%) |
| 3-Person Household | 44 (100.0%) | 0 (0.0%) |
| 4+ Person Household | 23 (100.0%) | 0 (0.0%) |
| Total Housing Units | 193 (86.9%) | 29 (13.1%) |
Occupancy by Educational Attainment in East Middlebury
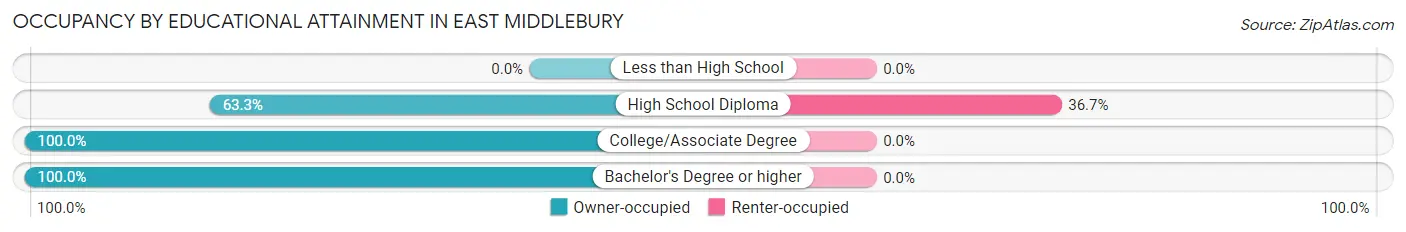
| Household Size | Owner-occupied | Renter-occupied |
| Less than High School | 0 (0.0%) | 0 (0.0%) |
| High School Diploma | 50 (63.3%) | 29 (36.7%) |
| College/Associate Degree | 42 (100.0%) | 0 (0.0%) |
| Bachelor's Degree or higher | 101 (100.0%) | 0 (0.0%) |
Occupancy by Age of Householder in East Middlebury
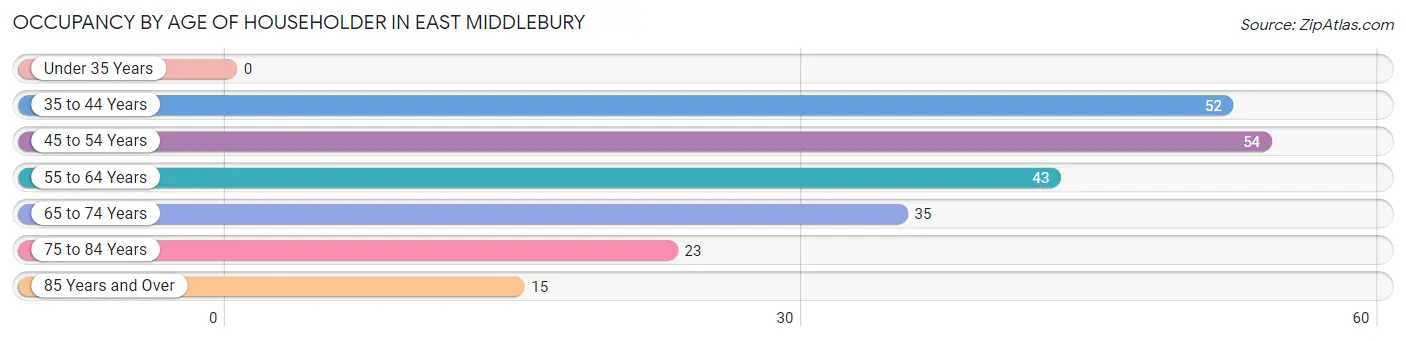
| Age Bracket | # Households | % Households |
| Under 35 Years | 0 | 0.0% |
| 35 to 44 Years | 52 | 23.4% |
| 45 to 54 Years | 54 | 24.3% |
| 55 to 64 Years | 43 | 19.4% |
| 65 to 74 Years | 35 | 15.8% |
| 75 to 84 Years | 23 | 10.4% |
| 85 Years and Over | 15 | 6.8% |
| Total | 222 | 100.0% |
Housing Finances in East Middlebury
Median Income by Occupancy in East Middlebury
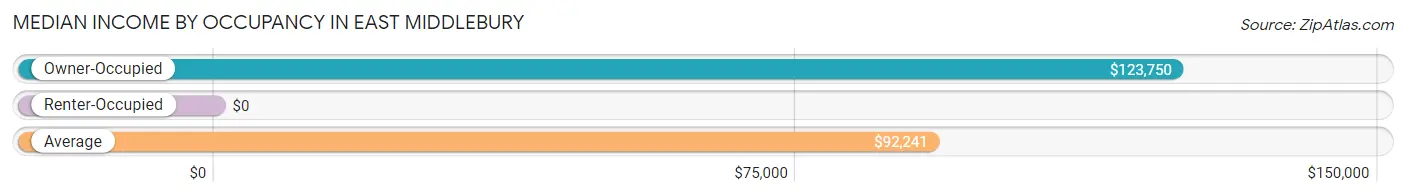
| Occupancy Type | # Households | Median Income |
| Owner-Occupied | 193 (86.9%) | $123,750 |
| Renter-Occupied | 29 (13.1%) | $0 |
| Average | 222 (100.0%) | $92,241 |
Occupancy by Householder Income Bracket in East Middlebury
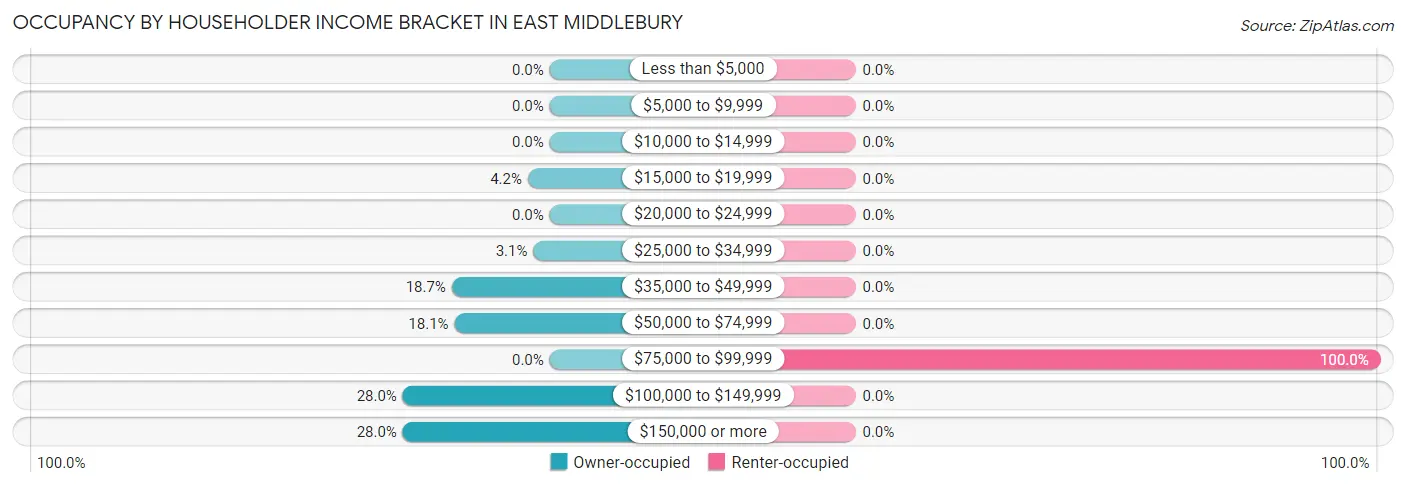
| Income Bracket | Owner-occupied | Renter-occupied |
| Less than $5,000 | 0 (0.0%) | 0 (0.0%) |
| $5,000 to $9,999 | 0 (0.0%) | 0 (0.0%) |
| $10,000 to $14,999 | 0 (0.0%) | 0 (0.0%) |
| $15,000 to $19,999 | 8 (4.2%) | 0 (0.0%) |
| $20,000 to $24,999 | 0 (0.0%) | 0 (0.0%) |
| $25,000 to $34,999 | 6 (3.1%) | 0 (0.0%) |
| $35,000 to $49,999 | 36 (18.6%) | 0 (0.0%) |
| $50,000 to $74,999 | 35 (18.1%) | 0 (0.0%) |
| $75,000 to $99,999 | 0 (0.0%) | 29 (100.0%) |
| $100,000 to $149,999 | 54 (28.0%) | 0 (0.0%) |
| $150,000 or more | 54 (28.0%) | 0 (0.0%) |
| Total | 193 (100.0%) | 29 (100.0%) |
Monthly Housing Cost Tiers in East Middlebury
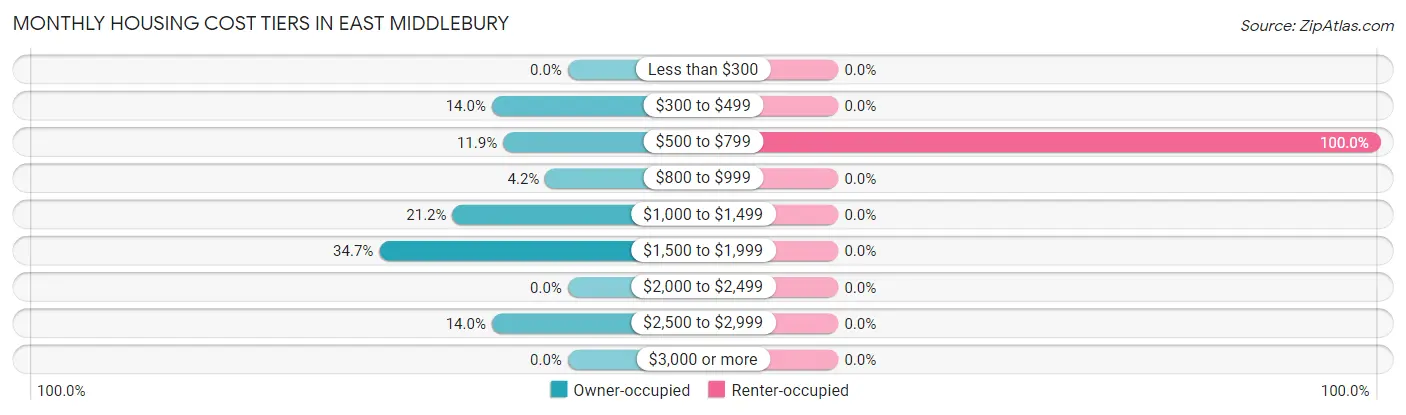
| Monthly Cost | Owner-occupied | Renter-occupied |
| Less than $300 | 0 (0.0%) | 0 (0.0%) |
| $300 to $499 | 27 (14.0%) | 0 (0.0%) |
| $500 to $799 | 23 (11.9%) | 29 (100.0%) |
| $800 to $999 | 8 (4.2%) | 0 (0.0%) |
| $1,000 to $1,499 | 41 (21.2%) | 0 (0.0%) |
| $1,500 to $1,999 | 67 (34.7%) | 0 (0.0%) |
| $2,000 to $2,499 | 0 (0.0%) | 0 (0.0%) |
| $2,500 to $2,999 | 27 (14.0%) | 0 (0.0%) |
| $3,000 or more | 0 (0.0%) | 0 (0.0%) |
| Total | 193 (100.0%) | 29 (100.0%) |
Physical Housing Characteristics in East Middlebury
Housing Structures in East Middlebury
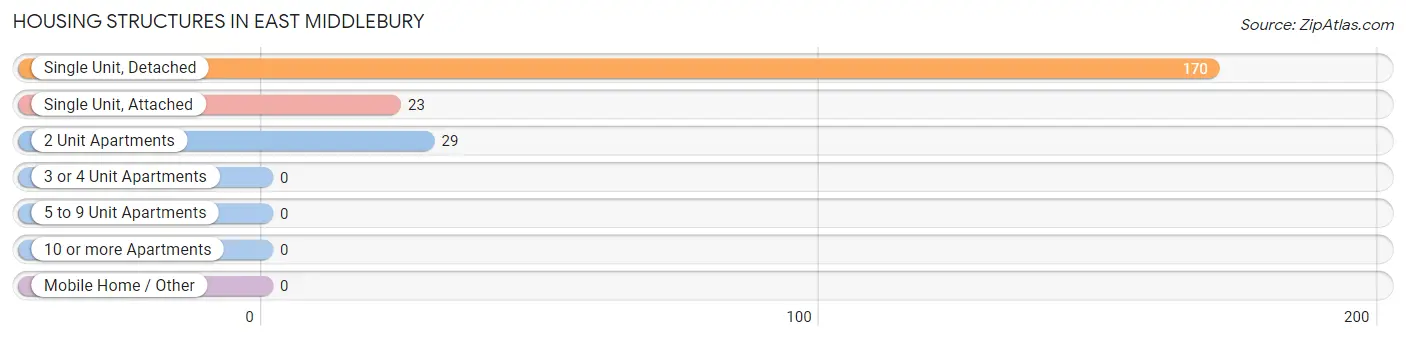
| Structure Type | # Housing Units | % Housing Units |
| Single Unit, Detached | 170 | 76.6% |
| Single Unit, Attached | 23 | 10.4% |
| 2 Unit Apartments | 29 | 13.1% |
| 3 or 4 Unit Apartments | 0 | 0.0% |
| 5 to 9 Unit Apartments | 0 | 0.0% |
| 10 or more Apartments | 0 | 0.0% |
| Mobile Home / Other | 0 | 0.0% |
| Total | 222 | 100.0% |
Housing Structures by Occupancy in East Middlebury
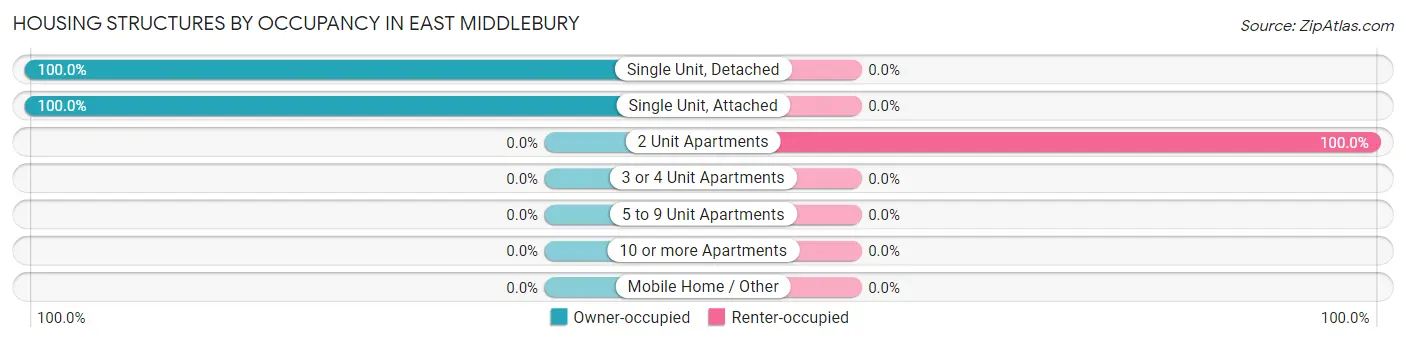
| Structure Type | Owner-occupied | Renter-occupied |
| Single Unit, Detached | 170 (100.0%) | 0 (0.0%) |
| Single Unit, Attached | 23 (100.0%) | 0 (0.0%) |
| 2 Unit Apartments | 0 (0.0%) | 29 (100.0%) |
| 3 or 4 Unit Apartments | 0 (0.0%) | 0 (0.0%) |
| 5 to 9 Unit Apartments | 0 (0.0%) | 0 (0.0%) |
| 10 or more Apartments | 0 (0.0%) | 0 (0.0%) |
| Mobile Home / Other | 0 (0.0%) | 0 (0.0%) |
| Total | 193 (86.9%) | 29 (13.1%) |
Housing Structures by Number of Rooms in East Middlebury
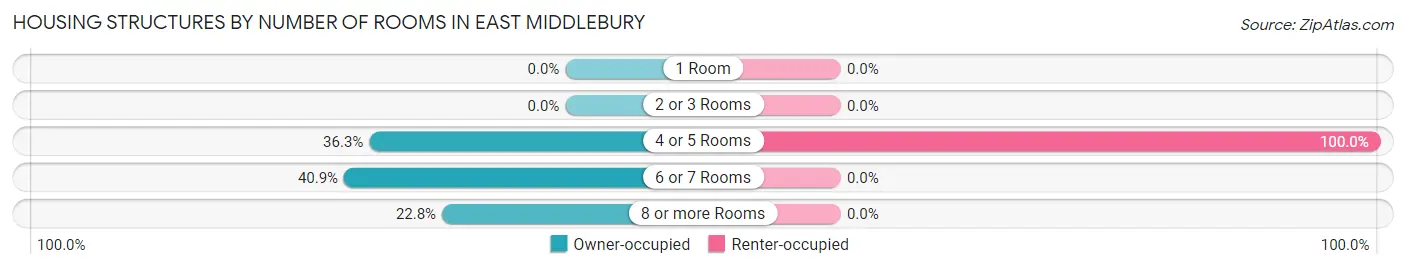
| Number of Rooms | Owner-occupied | Renter-occupied |
| 1 Room | 0 (0.0%) | 0 (0.0%) |
| 2 or 3 Rooms | 0 (0.0%) | 0 (0.0%) |
| 4 or 5 Rooms | 70 (36.3%) | 29 (100.0%) |
| 6 or 7 Rooms | 79 (40.9%) | 0 (0.0%) |
| 8 or more Rooms | 44 (22.8%) | 0 (0.0%) |
| Total | 193 (100.0%) | 29 (100.0%) |
Housing Structure by Heating Type in East Middlebury
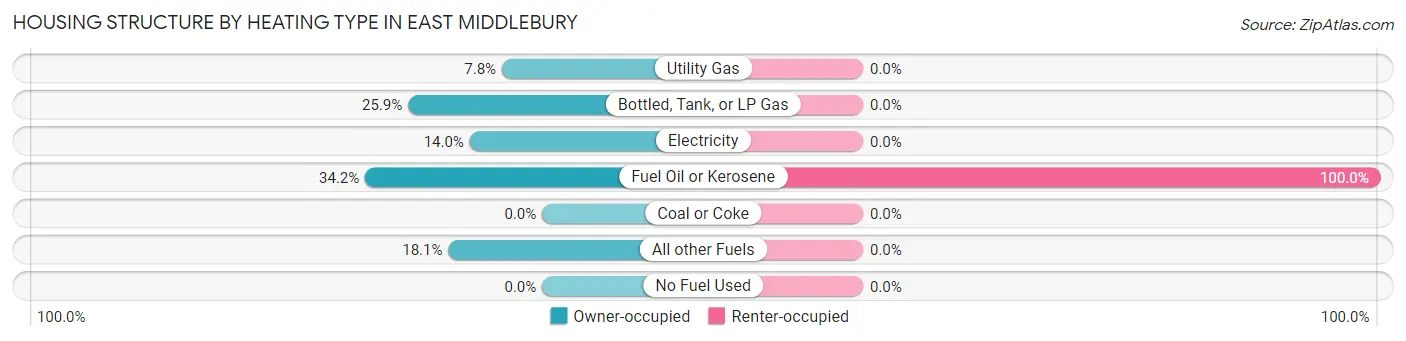
| Heating Type | Owner-occupied | Renter-occupied |
| Utility Gas | 15 (7.8%) | 0 (0.0%) |
| Bottled, Tank, or LP Gas | 50 (25.9%) | 0 (0.0%) |
| Electricity | 27 (14.0%) | 0 (0.0%) |
| Fuel Oil or Kerosene | 66 (34.2%) | 29 (100.0%) |
| Coal or Coke | 0 (0.0%) | 0 (0.0%) |
| All other Fuels | 35 (18.1%) | 0 (0.0%) |
| No Fuel Used | 0 (0.0%) | 0 (0.0%) |
| Total | 193 (100.0%) | 29 (100.0%) |
Household Vehicle Usage in East Middlebury
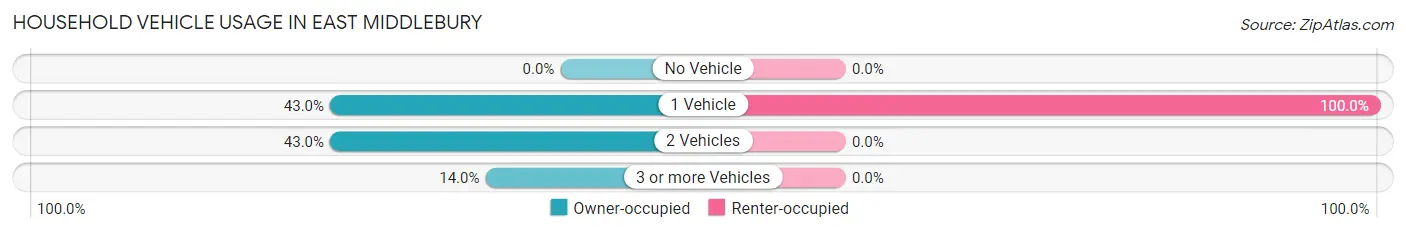
| Vehicles per Household | Owner-occupied | Renter-occupied |
| No Vehicle | 0 (0.0%) | 0 (0.0%) |
| 1 Vehicle | 83 (43.0%) | 29 (100.0%) |
| 2 Vehicles | 83 (43.0%) | 0 (0.0%) |
| 3 or more Vehicles | 27 (14.0%) | 0 (0.0%) |
| Total | 193 (100.0%) | 29 (100.0%) |
Real Estate & Mortgages in East Middlebury
Real Estate and Mortgage Overview in East Middlebury
| Characteristic | Without Mortgage | With Mortgage |
| Housing Units | 58 | 135 |
| Median Property Value | $163,000 | $247,300 |
| Median Household Income | - | - |
| Monthly Housing Costs | $513 | $0 |
| Real Estate Taxes | $2,519 | $0 |
Property Value by Mortgage Status in East Middlebury
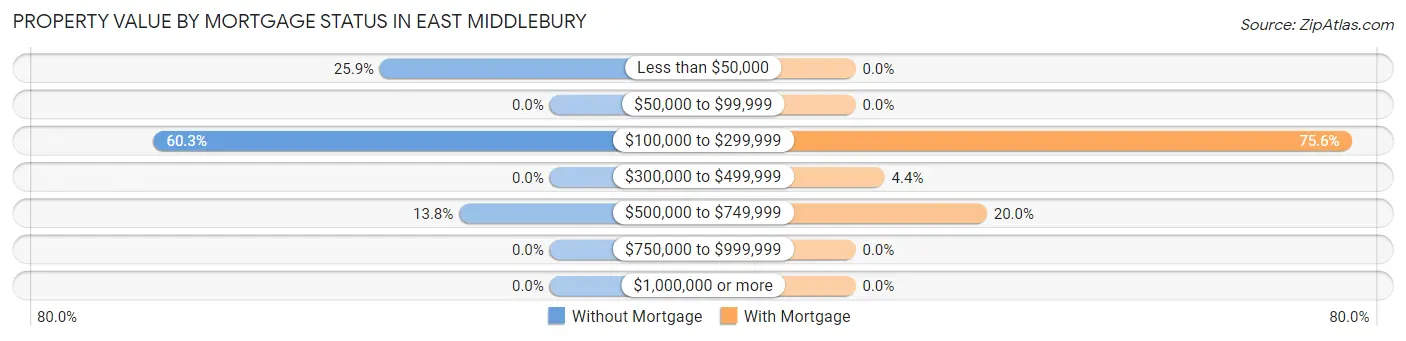
| Property Value | Without Mortgage | With Mortgage |
| Less than $50,000 | 15 (25.9%) | 0 (0.0%) |
| $50,000 to $99,999 | 0 (0.0%) | 0 (0.0%) |
| $100,000 to $299,999 | 35 (60.3%) | 102 (75.6%) |
| $300,000 to $499,999 | 0 (0.0%) | 6 (4.4%) |
| $500,000 to $749,999 | 8 (13.8%) | 27 (20.0%) |
| $750,000 to $999,999 | 0 (0.0%) | 0 (0.0%) |
| $1,000,000 or more | 0 (0.0%) | 0 (0.0%) |
| Total | 58 (100.0%) | 135 (100.0%) |
Household Income by Mortgage Status in East Middlebury
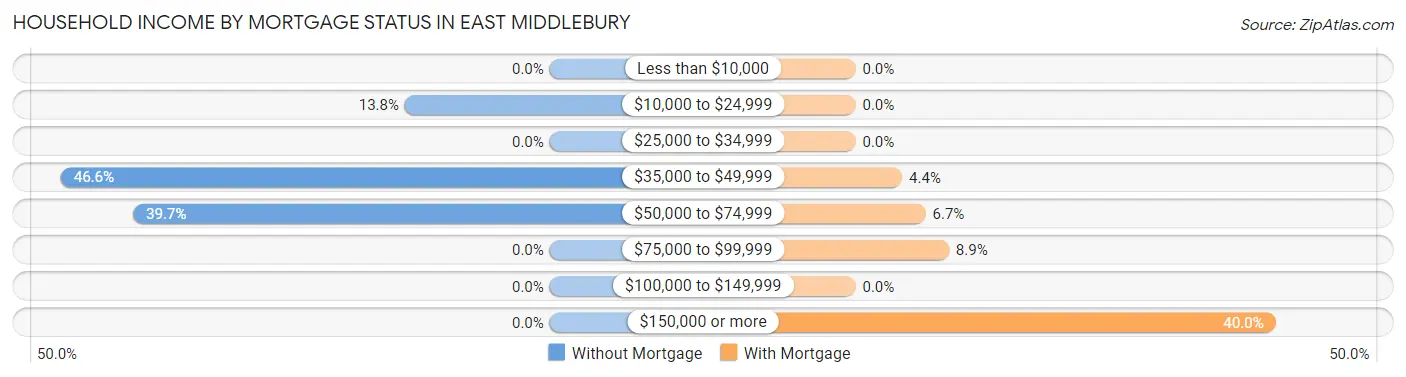
| Household Income | Without Mortgage | With Mortgage |
| Less than $10,000 | 0 (0.0%) | 0 (0.0%) |
| $10,000 to $24,999 | 8 (13.8%) | 0 (0.0%) |
| $25,000 to $34,999 | 0 (0.0%) | 0 (0.0%) |
| $35,000 to $49,999 | 27 (46.6%) | 6 (4.4%) |
| $50,000 to $74,999 | 23 (39.7%) | 9 (6.7%) |
| $75,000 to $99,999 | 0 (0.0%) | 12 (8.9%) |
| $100,000 to $149,999 | 0 (0.0%) | 0 (0.0%) |
| $150,000 or more | 0 (0.0%) | 54 (40.0%) |
| Total | 58 (100.0%) | 135 (100.0%) |
Property Value to Household Income Ratio in East Middlebury
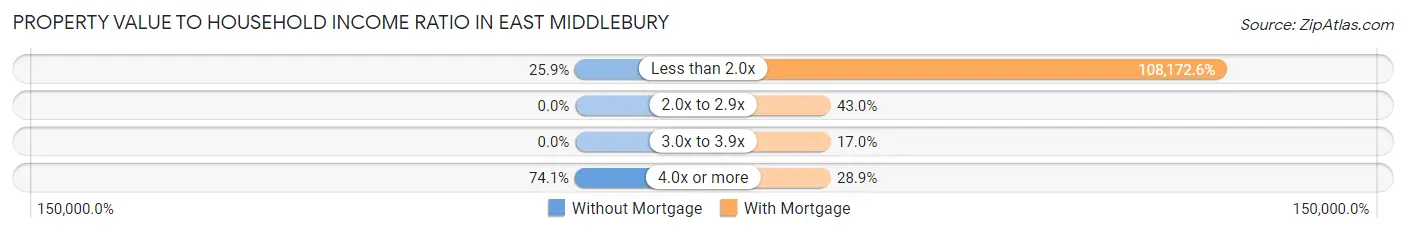
| Value-to-Income Ratio | Without Mortgage | With Mortgage |
| Less than 2.0x | 15 (25.9%) | 146,033 (108,172.6%) |
| 2.0x to 2.9x | 0 (0.0%) | 58 (43.0%) |
| 3.0x to 3.9x | 0 (0.0%) | 23 (17.0%) |
| 4.0x or more | 43 (74.1%) | 39 (28.9%) |
| Total | 58 (100.0%) | 135 (100.0%) |
Real Estate Taxes by Mortgage Status in East Middlebury
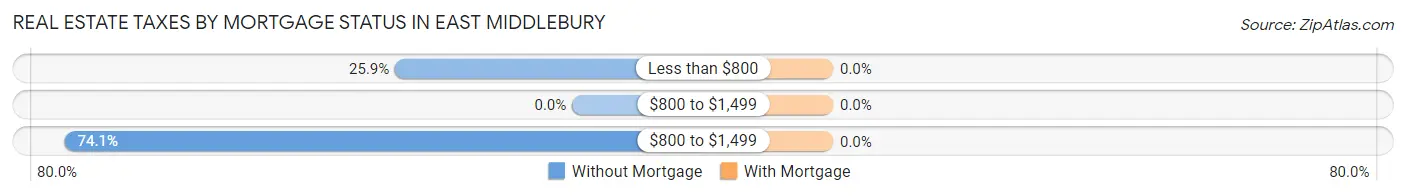
| Property Taxes | Without Mortgage | With Mortgage |
| Less than $800 | 15 (25.9%) | 0 (0.0%) |
| $800 to $1,499 | 0 (0.0%) | 0 (0.0%) |
| $800 to $1,499 | 43 (74.1%) | 0 (0.0%) |
| Total | 58 (100.0%) | 135 (100.0%) |
Health & Disability in East Middlebury
Health Insurance Coverage by Age in East Middlebury
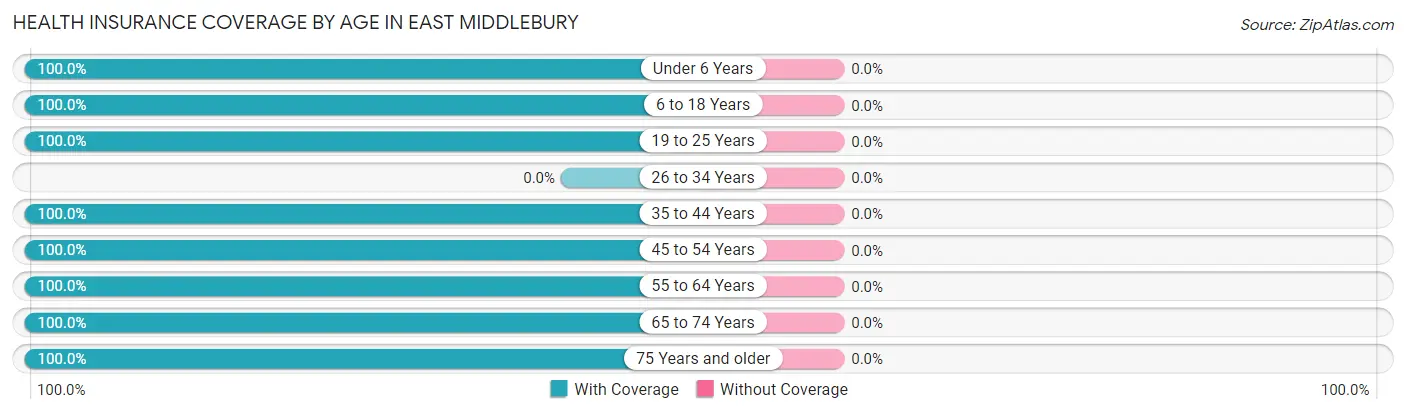
| Age Bracket | With Coverage | Without Coverage |
| Under 6 Years | 16 (100.0%) | 0 (0.0%) |
| 6 to 18 Years | 60 (100.0%) | 0 (0.0%) |
| 19 to 25 Years | 69 (100.0%) | 0 (0.0%) |
| 26 to 34 Years | 0 (0.0%) | 0 (0.0%) |
| 35 to 44 Years | 62 (100.0%) | 0 (0.0%) |
| 45 to 54 Years | 81 (100.0%) | 0 (0.0%) |
| 55 to 64 Years | 82 (100.0%) | 0 (0.0%) |
| 65 to 74 Years | 61 (100.0%) | 0 (0.0%) |
| 75 Years and older | 52 (100.0%) | 0 (0.0%) |
| Total | 483 (100.0%) | 0 (0.0%) |
Health Insurance Coverage by Citizenship Status in East Middlebury
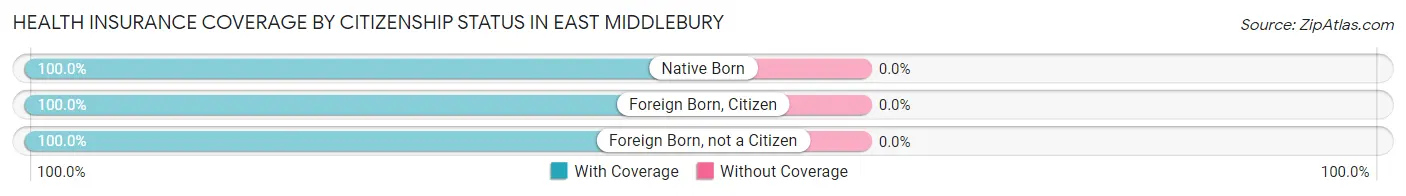
| Citizenship Status | With Coverage | Without Coverage |
| Native Born | 16 (100.0%) | 0 (0.0%) |
| Foreign Born, Citizen | 60 (100.0%) | 0 (0.0%) |
| Foreign Born, not a Citizen | 69 (100.0%) | 0 (0.0%) |
Health Insurance Coverage by Household Income in East Middlebury
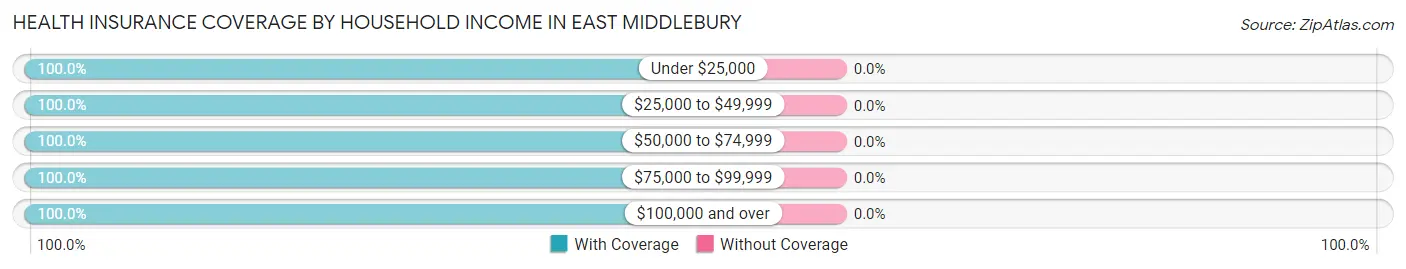
| Household Income | With Coverage | Without Coverage |
| Under $25,000 | 27 (100.0%) | 0 (0.0%) |
| $25,000 to $49,999 | 94 (100.0%) | 0 (0.0%) |
| $50,000 to $74,999 | 49 (100.0%) | 0 (0.0%) |
| $75,000 to $99,999 | 29 (100.0%) | 0 (0.0%) |
| $100,000 and over | 284 (100.0%) | 0 (0.0%) |
Public vs Private Health Insurance Coverage by Age in East Middlebury
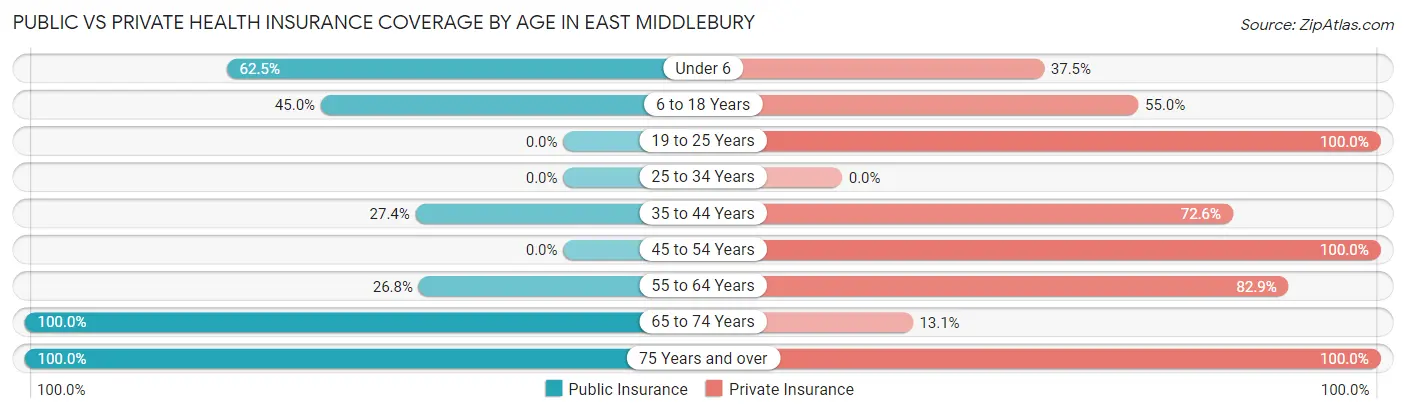
| Age Bracket | Public Insurance | Private Insurance |
| Under 6 | 10 (62.5%) | 6 (37.5%) |
| 6 to 18 Years | 27 (45.0%) | 33 (55.0%) |
| 19 to 25 Years | 0 (0.0%) | 69 (100.0%) |
| 25 to 34 Years | 0 (0.0%) | 0 (0.0%) |
| 35 to 44 Years | 17 (27.4%) | 45 (72.6%) |
| 45 to 54 Years | 0 (0.0%) | 81 (100.0%) |
| 55 to 64 Years | 22 (26.8%) | 68 (82.9%) |
| 65 to 74 Years | 61 (100.0%) | 8 (13.1%) |
| 75 Years and over | 52 (100.0%) | 52 (100.0%) |
| Total | 189 (39.1%) | 362 (75.0%) |
Disability Status by Sex by Age in East Middlebury
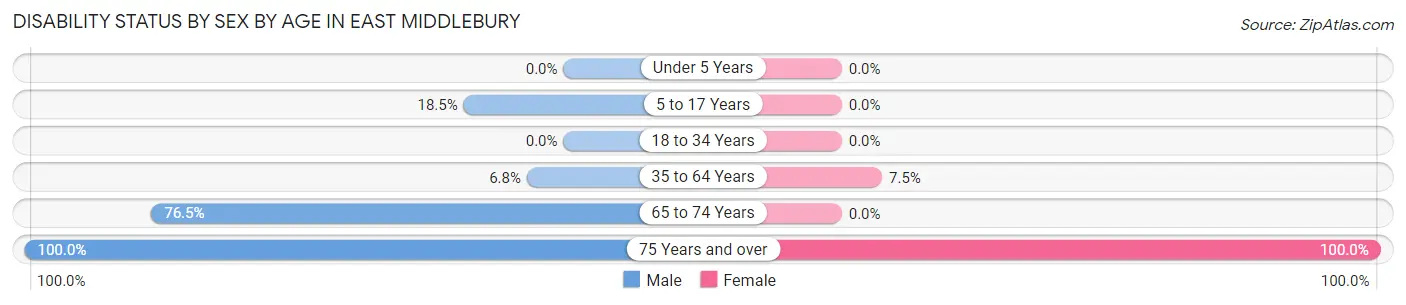
| Age Bracket | Male | Female |
| Under 5 Years | 0 (0.0%) | 0 (0.0%) |
| 5 to 17 Years | 10 (18.5%) | 0 (0.0%) |
| 18 to 34 Years | 0 (0.0%) | 0 (0.0%) |
| 35 to 64 Years | 8 (6.8%) | 8 (7.5%) |
| 65 to 74 Years | 26 (76.5%) | 0 (0.0%) |
| 75 Years and over | 15 (100.0%) | 37 (100.0%) |
Disability Class by Sex by Age in East Middlebury
Disability Class: Hearing Difficulty
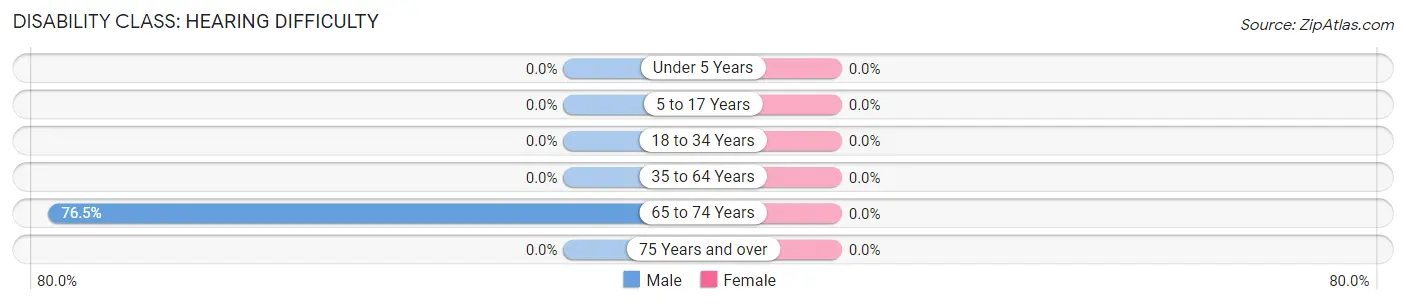
| Age Bracket | Male | Female |
| Under 5 Years | 0 (0.0%) | 0 (0.0%) |
| 5 to 17 Years | 0 (0.0%) | 0 (0.0%) |
| 18 to 34 Years | 0 (0.0%) | 0 (0.0%) |
| 35 to 64 Years | 0 (0.0%) | 0 (0.0%) |
| 65 to 74 Years | 26 (76.5%) | 0 (0.0%) |
| 75 Years and over | 0 (0.0%) | 0 (0.0%) |
Disability Class: Vision Difficulty
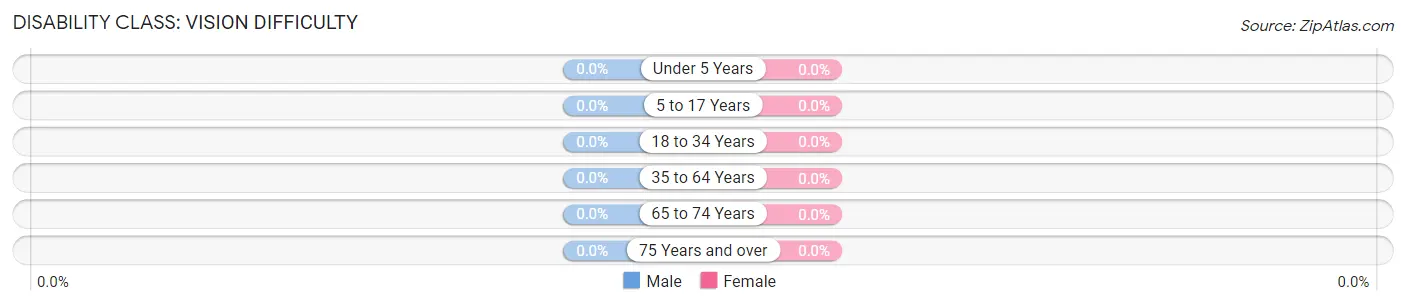
| Age Bracket | Male | Female |
| Under 5 Years | 0 (0.0%) | 0 (0.0%) |
| 5 to 17 Years | 0 (0.0%) | 0 (0.0%) |
| 18 to 34 Years | 0 (0.0%) | 0 (0.0%) |
| 35 to 64 Years | 0 (0.0%) | 0 (0.0%) |
| 65 to 74 Years | 0 (0.0%) | 0 (0.0%) |
| 75 Years and over | 0 (0.0%) | 0 (0.0%) |
Disability Class: Cognitive Difficulty
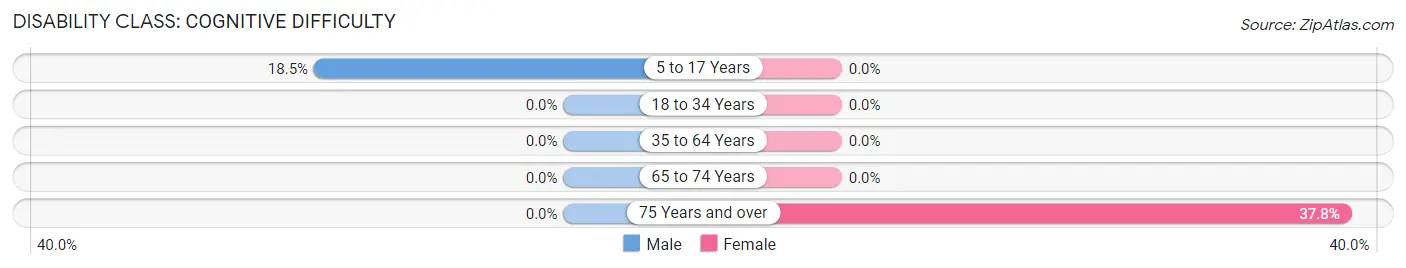
| Age Bracket | Male | Female |
| 5 to 17 Years | 10 (18.5%) | 0 (0.0%) |
| 18 to 34 Years | 0 (0.0%) | 0 (0.0%) |
| 35 to 64 Years | 0 (0.0%) | 0 (0.0%) |
| 65 to 74 Years | 0 (0.0%) | 0 (0.0%) |
| 75 Years and over | 0 (0.0%) | 14 (37.8%) |
Disability Class: Ambulatory Difficulty
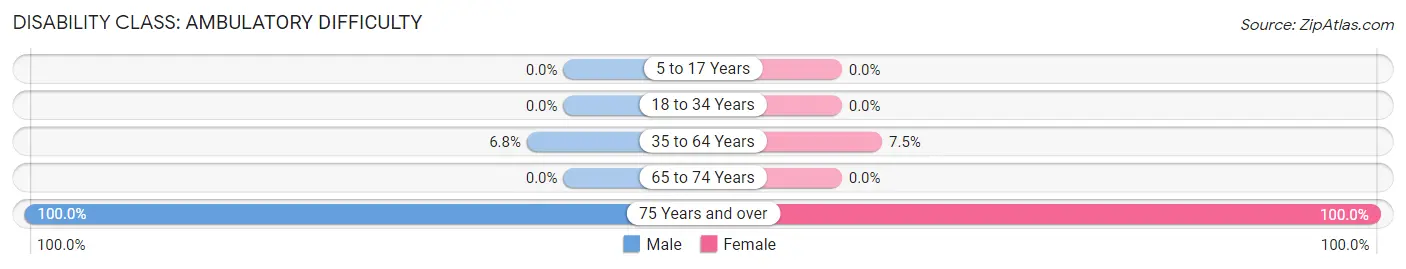
| Age Bracket | Male | Female |
| 5 to 17 Years | 0 (0.0%) | 0 (0.0%) |
| 18 to 34 Years | 0 (0.0%) | 0 (0.0%) |
| 35 to 64 Years | 8 (6.8%) | 8 (7.5%) |
| 65 to 74 Years | 0 (0.0%) | 0 (0.0%) |
| 75 Years and over | 15 (100.0%) | 37 (100.0%) |
Disability Class: Self-Care Difficulty
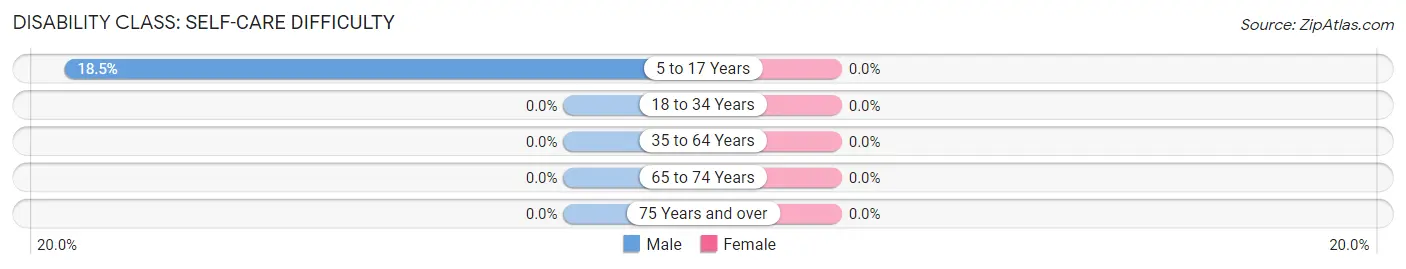
| Age Bracket | Male | Female |
| 5 to 17 Years | 10 (18.5%) | 0 (0.0%) |
| 18 to 34 Years | 0 (0.0%) | 0 (0.0%) |
| 35 to 64 Years | 0 (0.0%) | 0 (0.0%) |
| 65 to 74 Years | 0 (0.0%) | 0 (0.0%) |
| 75 Years and over | 0 (0.0%) | 0 (0.0%) |
Technology Access in East Middlebury
Computing Device Access in East Middlebury
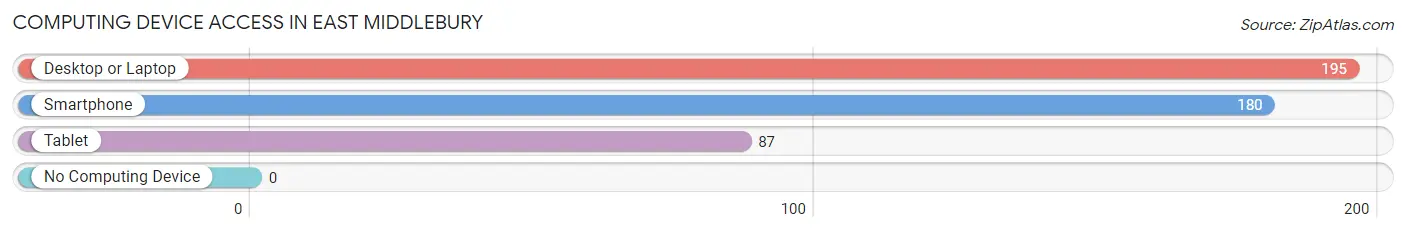
| Device Type | # Households | % Households |
| Desktop or Laptop | 195 | 87.8% |
| Smartphone | 180 | 81.1% |
| Tablet | 87 | 39.2% |
| No Computing Device | 0 | 0.0% |
| Total | 222 | 100.0% |
Internet Access in East Middlebury
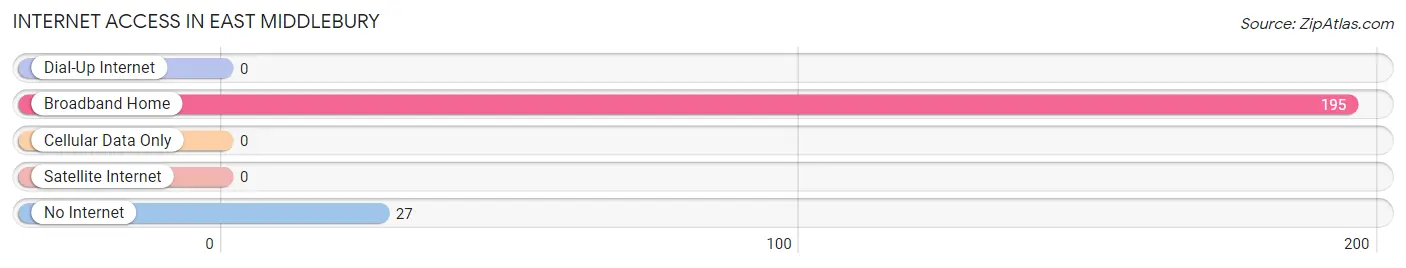
| Internet Type | # Households | % Households |
| Dial-Up Internet | 0 | 0.0% |
| Broadband Home | 195 | 87.8% |
| Cellular Data Only | 0 | 0.0% |
| Satellite Internet | 0 | 0.0% |
| No Internet | 27 | 12.2% |
| Total | 222 | 100.0% |
East Middlebury Summary
Middlebury, Vermont is a small town located in the western part of the state, in Addison County. It is situated on the banks of the Otter Creek, and is home to about 8,000 people. The town is known for its picturesque setting, its vibrant downtown, and its strong sense of community.
History
Middlebury was first settled in 1766 by a group of settlers from Connecticut. The town was named after the Middlebury Congregational Church, which was established in 1785. The town was incorporated in 1795, and the first town meeting was held in 1796.
In the early 19th century, Middlebury was a thriving agricultural and industrial center. The town was home to several mills, including a grist mill, a saw mill, and a woolen mill. The town also had a thriving lumber industry, and was home to several tanneries.
In the late 19th century, Middlebury began to transition from an agricultural and industrial center to a more residential community. The town was home to several colleges, including Middlebury College, which was founded in 1800. The college has since become one of the most prestigious liberal arts colleges in the country.
Geography
Middlebury is located in the western part of Vermont, in Addison County. The town is situated on the banks of the Otter Creek, and is surrounded by the Green Mountains. The town is located about 30 miles south of Burlington, and about 50 miles north of Rutland.
The town has a total area of 8.3 square miles, of which 8.2 square miles is land and 0.1 square miles is water. The town is located at an elevation of 645 feet above sea level.
Economy
Middlebury’s economy is largely driven by tourism and education. The town is home to several colleges, including Middlebury College, which is one of the most prestigious liberal arts colleges in the country. The college has an annual economic impact of over $200 million.
The town is also home to several businesses, including several restaurants, retail stores, and professional services. The town is also home to several manufacturing companies, including a paper mill and a woodworking company.
Demographics
As of the 2010 census, Middlebury had a population of 8,496. The racial makeup of the town was 95.3% White, 0.7% African American, 0.3% Native American, 1.2% Asian, 0.1% Pacific Islander, 0.7% from other races, and 1.7% from two or more races. Hispanic or Latino of any race were 2.2% of the population.
The median income for a household in the town was $50,945, and the median income for a family was $68,958. The per capita income for the town was $30,945. About 5.2% of families and 11.2% of the population were below the poverty line, including 8.3% of those under age 18 and 5.2% of those age 65 or over.
Common Questions
What is Per Capita Income in East Middlebury?
Per Capita income in East Middlebury is $57,429.
What is the Median Family Income in East Middlebury?
Median Family Income in East Middlebury is $123,587.
What is the Median Household income in East Middlebury?
Median Household Income in East Middlebury is $92,241.
What is Inequality or Gini Index in East Middlebury?
Inequality or Gini Index in East Middlebury is 0.38.
What is the Total Population of East Middlebury?
Total Population of East Middlebury is 483.
What is the Total Male Population of East Middlebury?
Total Male Population of East Middlebury is 290.
What is the Total Female Population of East Middlebury?
Total Female Population of East Middlebury is 193.
What is the Ratio of Males per 100 Females in East Middlebury?
There are 150.26 Males per 100 Females in East Middlebury.
What is the Ratio of Females per 100 Males in East Middlebury?
There are 66.55 Females per 100 Males in East Middlebury.
What is the Median Population Age in East Middlebury?
Median Population Age in East Middlebury is 49.6 Years.
What is the Average Family Size in East Middlebury
Average Family Size in East Middlebury is 2.7 People.
What is the Average Household Size in East Middlebury
Average Household Size in East Middlebury is 2.2 People.
How Large is the Labor Force in East Middlebury?
There are 286 People in the Labor Forcein in East Middlebury.
What is the Percentage of People in the Labor Force in East Middlebury?
70.3% of People are in the Labor Force in East Middlebury.