Websterville, VT Map & Demographics
Websterville Map
Websterville Overview
$53,525
PER CAPITA INCOME
$167,672
AVG FAMILY INCOME
$70,313
AVG HOUSEHOLD INCOME
0.27
INEQUALITY / GINI INDEX
249
TOTAL POPULATION
132
MALE POPULATION
117
FEMALE POPULATION
112.82
MALES / 100 FEMALES
88.64
FEMALES / 100 MALES
56.9
MEDIAN AGE
2.7
AVG FAMILY SIZE
1.6
AVG HOUSEHOLD SIZE
153
LABOR FORCE [ PEOPLE ]
71.5%
PERCENT IN LABOR FORCE
Websterville Zip Codes
Websterville Area Codes
Income in Websterville
Income Overview in Websterville
Per Capita Income in Websterville is $53,525, while median incomes of families and households are $167,672 and $70,313 respectively.
| Characteristic | Number | Measure |
| Per Capita Income | 249 | $53,525 |
| Median Family Income | 54 | $167,672 |
| Mean Family Income | 54 | $131,844 |
| Median Household Income | 159 | $70,313 |
| Mean Household Income | 159 | $84,011 |
| Income Deficit | 54 | $0 |
| Wage / Income Gap (%) | 249 | 0.00% |
| Wage / Income Gap ($) | 249 | 100.00¢ per $1 |
| Gini / Inequality Index | 249 | 0.27 |
Earnings by Sex in Websterville
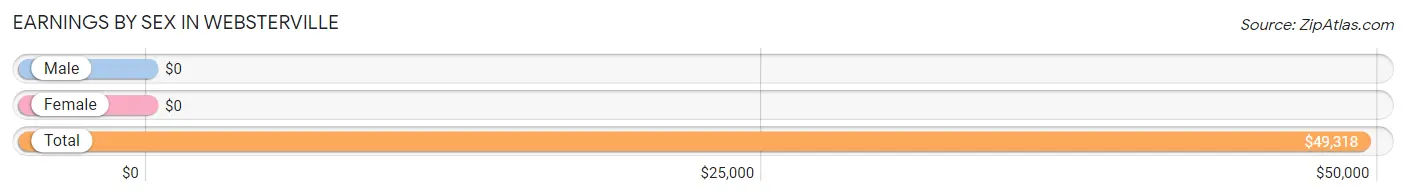
| Sex | Number | Average Earnings |
| Male | 100 (58.1%) | $0 |
| Female | 72 (41.9%) | $0 |
| Total | 172 (100.0%) | $49,318 |
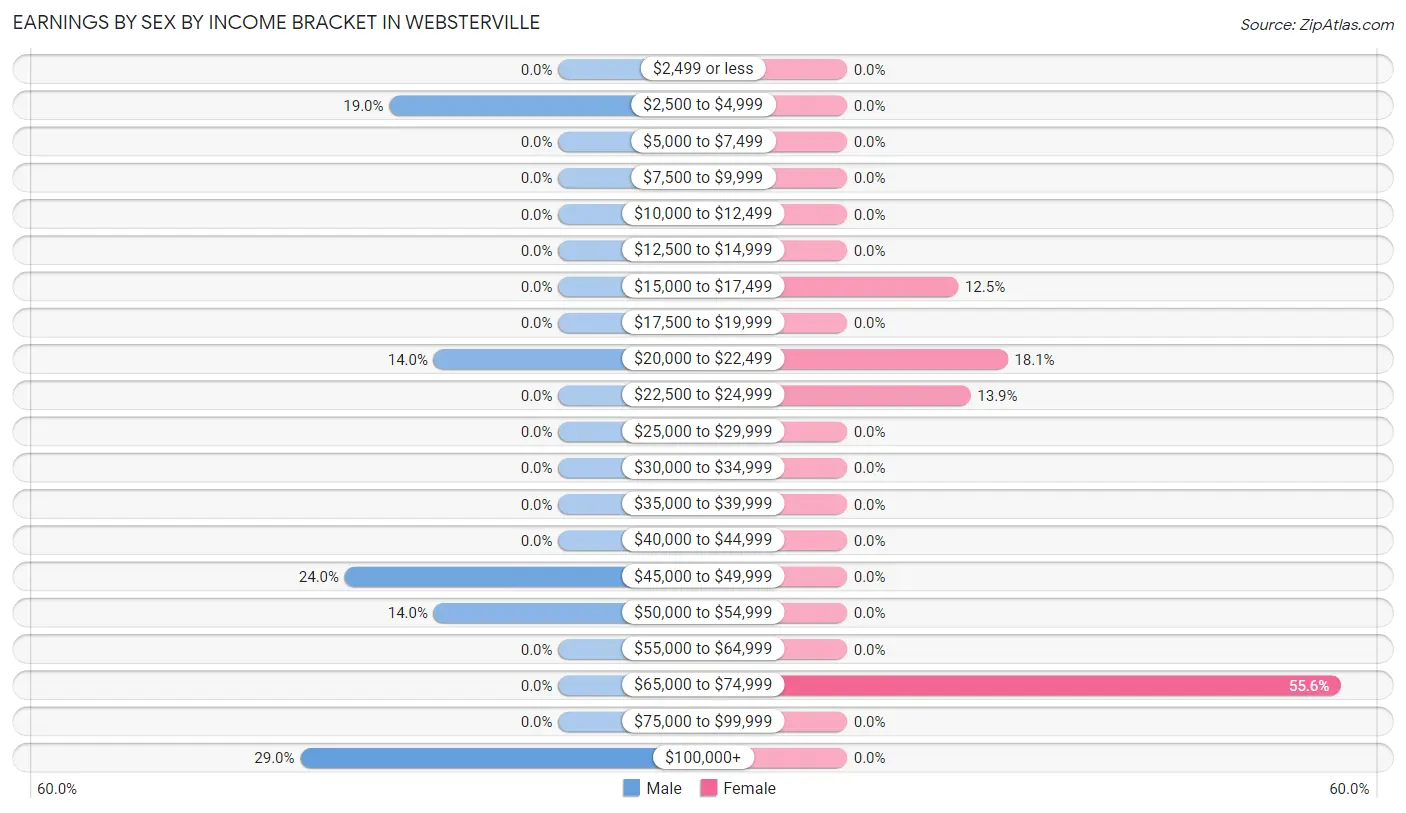
Earnings by Sex by Income Bracket in Websterville
The most common earnings brackets in Websterville are $100,000+ for men (29 | 29.0%) and $65,000 to $74,999 for women (40 | 55.6%).
| Income | Male | Female |
| $2,499 or less | 0 (0.0%) | 0 (0.0%) |
| $2,500 to $4,999 | 19 (19.0%) | 0 (0.0%) |
| $5,000 to $7,499 | 0 (0.0%) | 0 (0.0%) |
| $7,500 to $9,999 | 0 (0.0%) | 0 (0.0%) |
| $10,000 to $12,499 | 0 (0.0%) | 0 (0.0%) |
| $12,500 to $14,999 | 0 (0.0%) | 0 (0.0%) |
| $15,000 to $17,499 | 0 (0.0%) | 9 (12.5%) |
| $17,500 to $19,999 | 0 (0.0%) | 0 (0.0%) |
| $20,000 to $22,499 | 14 (14.0%) | 13 (18.1%) |
| $22,500 to $24,999 | 0 (0.0%) | 10 (13.9%) |
| $25,000 to $29,999 | 0 (0.0%) | 0 (0.0%) |
| $30,000 to $34,999 | 0 (0.0%) | 0 (0.0%) |
| $35,000 to $39,999 | 0 (0.0%) | 0 (0.0%) |
| $40,000 to $44,999 | 0 (0.0%) | 0 (0.0%) |
| $45,000 to $49,999 | 24 (24.0%) | 0 (0.0%) |
| $50,000 to $54,999 | 14 (14.0%) | 0 (0.0%) |
| $55,000 to $64,999 | 0 (0.0%) | 0 (0.0%) |
| $65,000 to $74,999 | 0 (0.0%) | 40 (55.6%) |
| $75,000 to $99,999 | 0 (0.0%) | 0 (0.0%) |
| $100,000+ | 29 (29.0%) | 0 (0.0%) |
| Total | 100 (100.0%) | 72 (100.0%) |
Earnings by Sex by Educational Attainment in Websterville
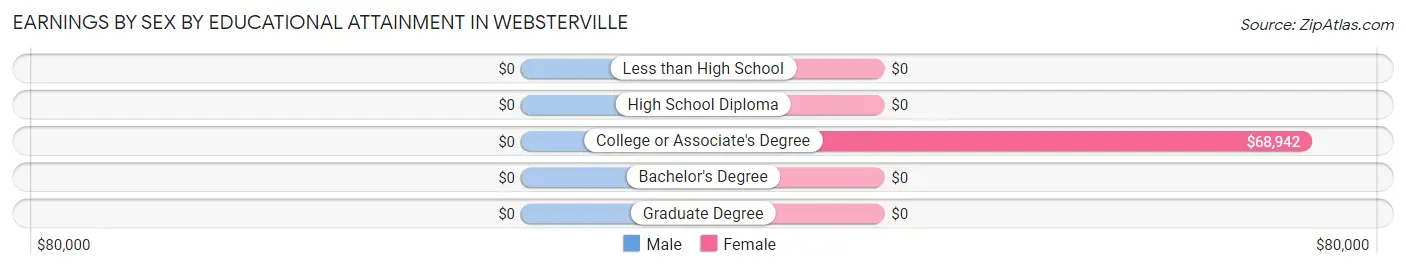
| Educational Attainment | Male Income | Female Income |
| Less than High School | - | - |
| High School Diploma | - | - |
| College or Associate's Degree | - | - |
| Bachelor's Degree | - | - |
| Graduate Degree | - | - |
| Total | - | - |
Family Income in Websterville
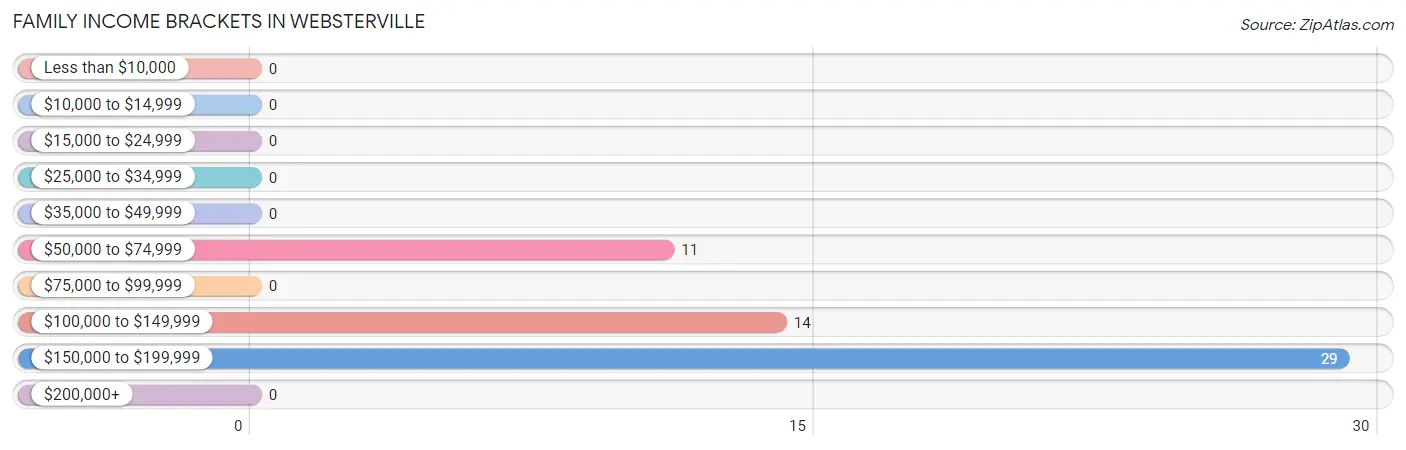
Family Income Brackets in Websterville
According to the Websterville family income data, there are 29 families falling into the $150,000 to $199,999 income range, which is the most common income bracket and makes up 53.7% of all families.
| Income Bracket | # Families | % Families |
| Less than $10,000 | 0 | 0.0% |
| $10,000 to $14,999 | 0 | 0.0% |
| $15,000 to $24,999 | 0 | 0.0% |
| $25,000 to $34,999 | 0 | 0.0% |
| $35,000 to $49,999 | 0 | 0.0% |
| $50,000 to $74,999 | 11 | 20.4% |
| $75,000 to $99,999 | 0 | 0.0% |
| $100,000 to $149,999 | 14 | 25.9% |
| $150,000 to $199,999 | 29 | 53.7% |
| $200,000+ | 0 | 0.0% |
Family Income by Famaliy Size in Websterville
| Income Bracket | # Families | Median Income |
| 2-Person Families | 43 (79.6%) | $0 |
| 3-Person Families | 0 (0.0%) | $0 |
| 4-Person Families | 0 (0.0%) | $0 |
| 5-Person Families | 11 (20.4%) | $0 |
| 6-Person Families | 0 (0.0%) | $0 |
| 7+ Person Families | 0 (0.0%) | $0 |
| Total | 54 (100.0%) | $167,672 |
Family Income by Number of Earners in Websterville
| Number of Earners | # Families | Median Income |
| No Earners | 0 (0.0%) | $0 |
| 1 Earner | 29 (53.7%) | $0 |
| 2 Earners | 25 (46.3%) | $0 |
| 3+ Earners | 0 (0.0%) | $0 |
| Total | 54 (100.0%) | $167,672 |
Household Income in Websterville
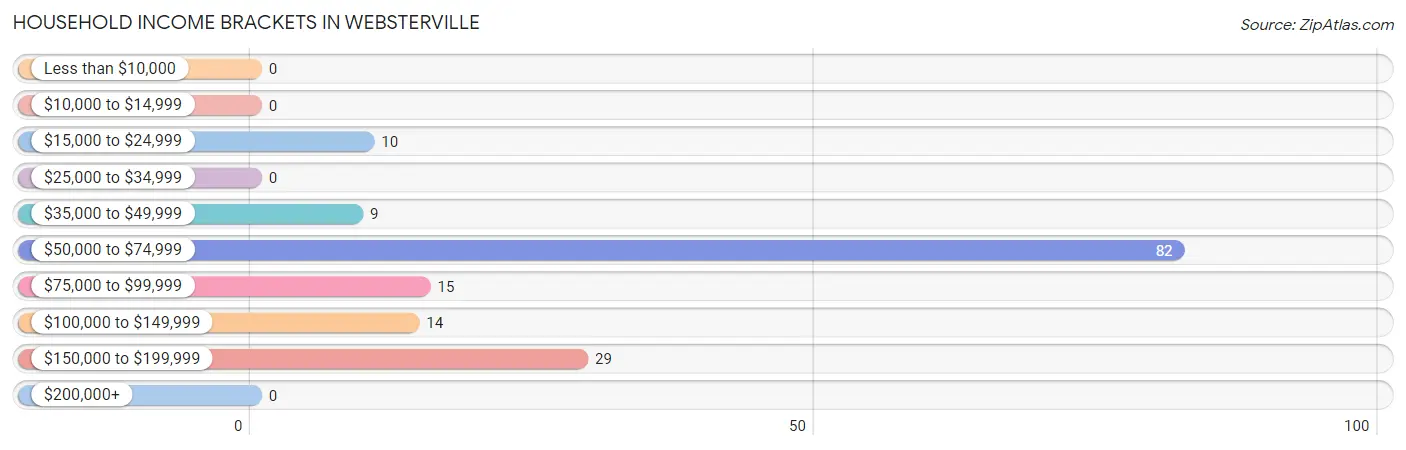
Household Income Brackets in Websterville
With 82 households falling in the category, the $50,000 to $74,999 income range is the most frequent in Websterville, accounting for 51.6% of all households.
| Income Bracket | # Households | % Households |
| Less than $10,000 | 0 | 0.0% |
| $10,000 to $14,999 | 0 | 0.0% |
| $15,000 to $24,999 | 10 | 6.3% |
| $25,000 to $34,999 | 0 | 0.0% |
| $35,000 to $49,999 | 9 | 5.7% |
| $50,000 to $74,999 | 82 | 51.6% |
| $75,000 to $99,999 | 15 | 9.4% |
| $100,000 to $149,999 | 14 | 8.8% |
| $150,000 to $199,999 | 29 | 18.2% |
| $200,000+ | 0 | 0.0% |
Household Income by Householder Age in Websterville
The median household income in Websterville is $70,313, with the highest median household income of $71,146 found in the 45 to 64 years age bracket for the primary householder. A total of 101 households (63.5%) fall into this category.
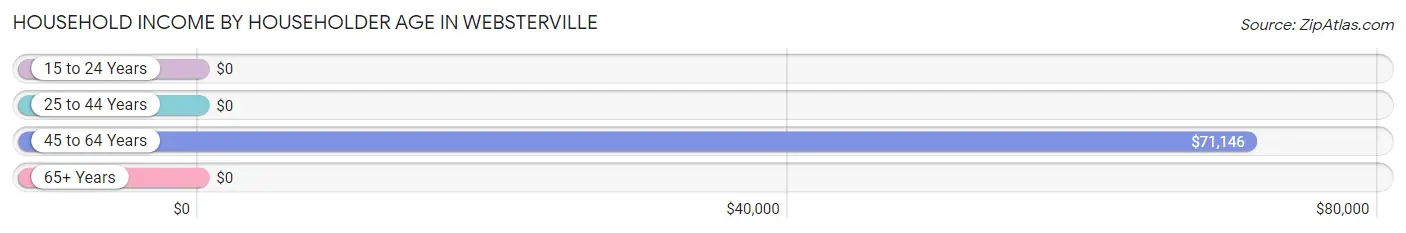
| Income Bracket | # Households | Median Income |
| 15 to 24 Years | 0 (0.0%) | $0 |
| 25 to 44 Years | 25 (15.7%) | $0 |
| 45 to 64 Years | 101 (63.5%) | $71,146 |
| 65+ Years | 33 (20.7%) | $0 |
| Total | 159 (100.0%) | $70,313 |
Poverty in Websterville
Income Below Poverty by Sex and Age in Websterville
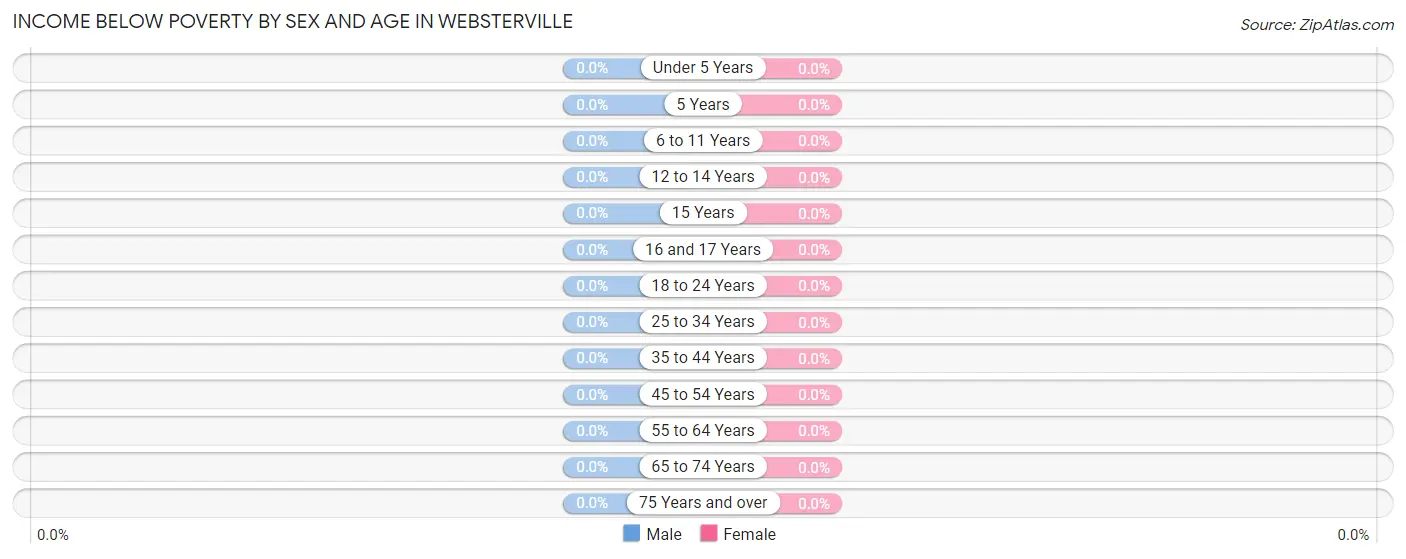
| Age Bracket | Male | Female |
| Under 5 Years | 0 (0.0%) | 0 (0.0%) |
| 5 Years | 0 (0.0%) | 0 (0.0%) |
| 6 to 11 Years | 0 (0.0%) | 0 (0.0%) |
| 12 to 14 Years | 0 (0.0%) | 0 (0.0%) |
| 15 Years | 0 (0.0%) | 0 (0.0%) |
| 16 and 17 Years | 0 (0.0%) | 0 (0.0%) |
| 18 to 24 Years | 0 (0.0%) | 0 (0.0%) |
| 25 to 34 Years | 0 (0.0%) | 0 (0.0%) |
| 35 to 44 Years | 0 (0.0%) | 0 (0.0%) |
| 45 to 54 Years | 0 (0.0%) | 0 (0.0%) |
| 55 to 64 Years | 0 (0.0%) | 0 (0.0%) |
| 65 to 74 Years | 0 (0.0%) | 0 (0.0%) |
| 75 Years and over | 0 (0.0%) | 0 (0.0%) |
| Total | 0 (0.0%) | 0 (0.0%) |
Income Above Poverty by Sex and Age in Websterville
According to the poverty statistics in Websterville, males aged 25 to 34 years and females aged under 5 years are the age groups that are most secure financially, with 100.0% of males and 100.0% of females in these age groups living above the poverty line.
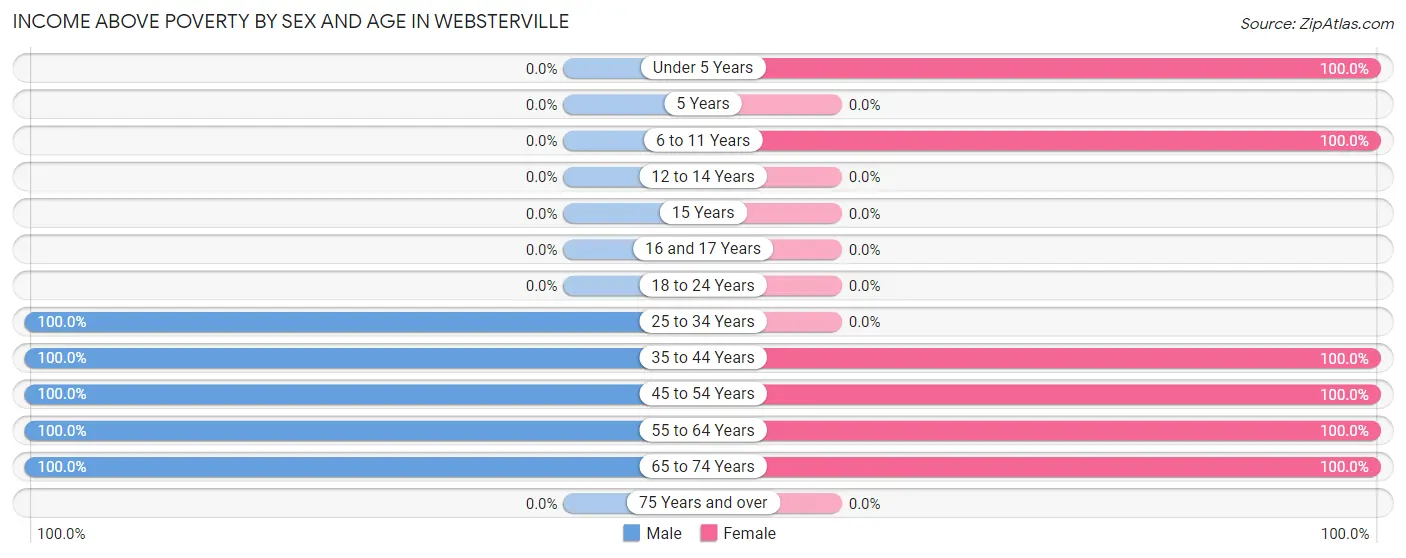
| Age Bracket | Male | Female |
| Under 5 Years | 0 (0.0%) | 13 (100.0%) |
| 5 Years | 0 (0.0%) | 0 (0.0%) |
| 6 to 11 Years | 0 (0.0%) | 22 (100.0%) |
| 12 to 14 Years | 0 (0.0%) | 0 (0.0%) |
| 15 Years | 0 (0.0%) | 0 (0.0%) |
| 16 and 17 Years | 0 (0.0%) | 0 (0.0%) |
| 18 to 24 Years | 0 (0.0%) | 0 (0.0%) |
| 25 to 34 Years | 14 (100.0%) | 0 (0.0%) |
| 35 to 44 Years | 11 (100.0%) | 10 (100.0%) |
| 45 to 54 Years | 13 (100.0%) | 13 (100.0%) |
| 55 to 64 Years | 80 (100.0%) | 27 (100.0%) |
| 65 to 74 Years | 14 (100.0%) | 32 (100.0%) |
| 75 Years and over | 0 (0.0%) | 0 (0.0%) |
| Total | 132 (100.0%) | 117 (100.0%) |
Income Below Poverty Among Married-Couple Families in Websterville
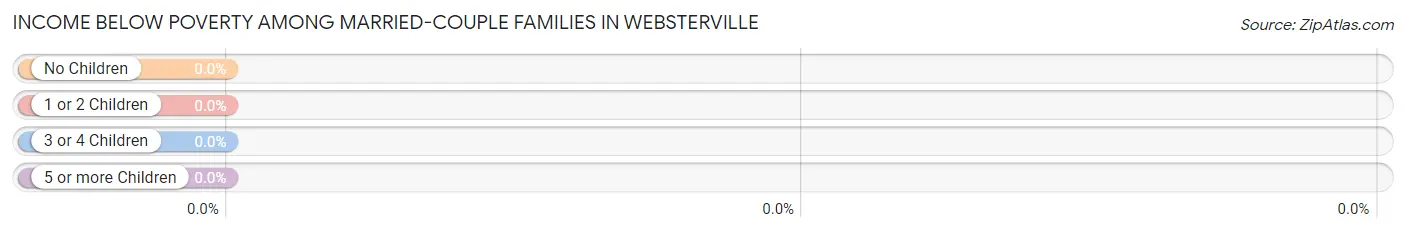
| Children | Above Poverty | Below Poverty |
| No Children | 14 (100.0%) | 0 (0.0%) |
| 1 or 2 Children | 0 (0.0%) | 0 (0.0%) |
| 3 or 4 Children | 11 (100.0%) | 0 (0.0%) |
| 5 or more Children | 0 (0.0%) | 0 (0.0%) |
| Total | 25 (100.0%) | 0 (0.0%) |
Income Below Poverty Among Single-Parent Households in Websterville
| Children | Single Father | Single Mother |
| No Children | 0 (0.0%) | 0 (0.0%) |
| 1 or 2 Children | 0 (0.0%) | 0 (0.0%) |
| 3 or 4 Children | 0 (0.0%) | 0 (0.0%) |
| 5 or more Children | 0 (0.0%) | 0 (0.0%) |
| Total | 0 (0.0%) | 0 (0.0%) |
Income Below Poverty Among Married-Couple vs Single-Parent Households in Websterville
| Children | Married-Couple Families | Single-Parent Households |
| No Children | 0 (0.0%) | 0 (0.0%) |
| 1 or 2 Children | 0 (0.0%) | 0 (0.0%) |
| 3 or 4 Children | 0 (0.0%) | 0 (0.0%) |
| 5 or more Children | 0 (0.0%) | 0 (0.0%) |
| Total | 0 (0.0%) | 0 (0.0%) |
Race in Websterville
The most populous races in Websterville are White / Caucasian (230 | 92.4%), Two or more Races (19 | 7.6%), and Hispanic or Latino (13 | 5.2%).
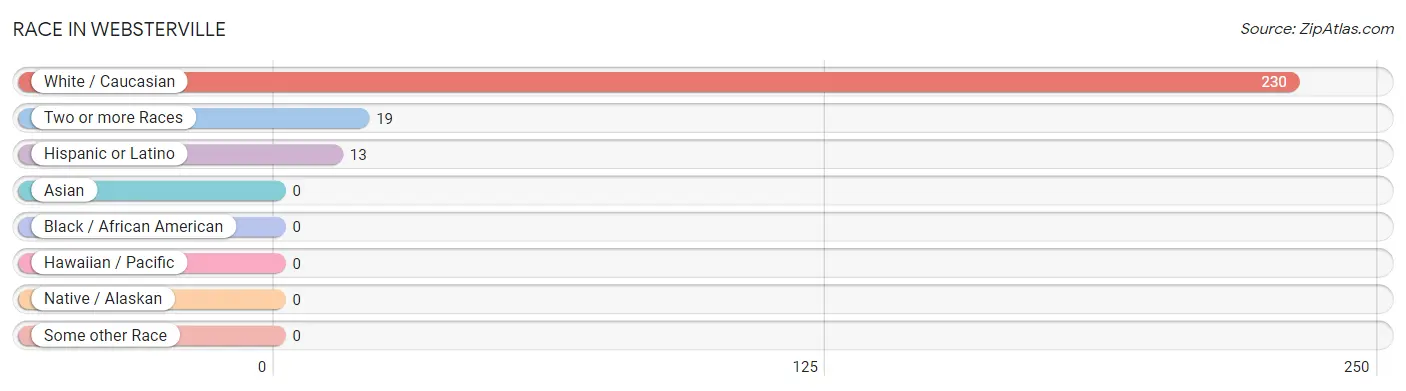
| Race | # Population | % Population |
| Asian | 0 | 0.0% |
| Black / African American | 0 | 0.0% |
| Hawaiian / Pacific | 0 | 0.0% |
| Hispanic or Latino | 13 | 5.2% |
| Native / Alaskan | 0 | 0.0% |
| White / Caucasian | 230 | 92.4% |
| Two or more Races | 19 | 7.6% |
| Some other Race | 0 | 0.0% |
| Total | 249 | 100.0% |
Ancestry in Websterville
The most populous ancestries reported in Websterville are Irish (99 | 39.8%), American (62 | 24.9%), Scottish (45 | 18.1%), French American Indian (19 | 7.6%), and French Canadian (19 | 7.6%), together accounting for 98.0% of all Websterville residents.
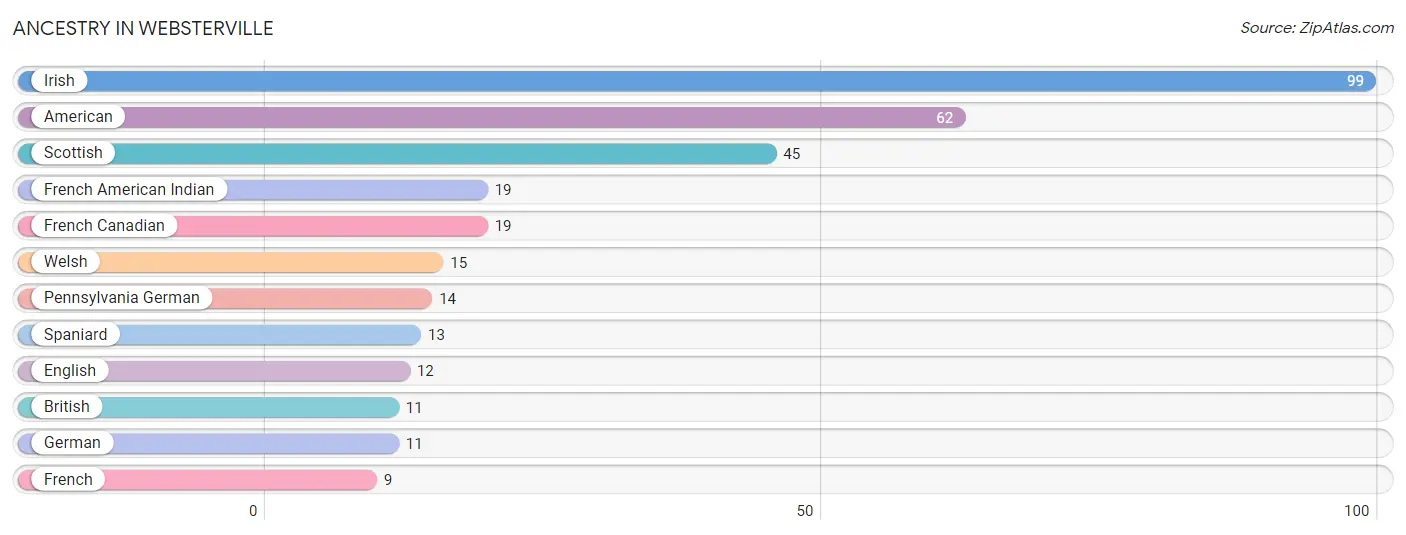
| Ancestry | # Population | % Population |
| American | 62 | 24.9% |
| British | 11 | 4.4% |
| English | 12 | 4.8% |
| French | 9 | 3.6% |
| French American Indian | 19 | 7.6% |
| French Canadian | 19 | 7.6% |
| German | 11 | 4.4% |
| Irish | 99 | 39.8% |
| Pennsylvania German | 14 | 5.6% |
| Scottish | 45 | 18.1% |
| Spaniard | 13 | 5.2% |
| Welsh | 15 | 6.0% | View All 12 Rows |
Immigrants in Websterville
The most numerous immigrant groups reported in Websterville came from Canada (19 | 7.6%), Europe (10 | 4.0%), Northern Europe (10 | 4.0%), and Scotland (10 | 4.0%), together accounting for 19.7% of all Websterville residents.
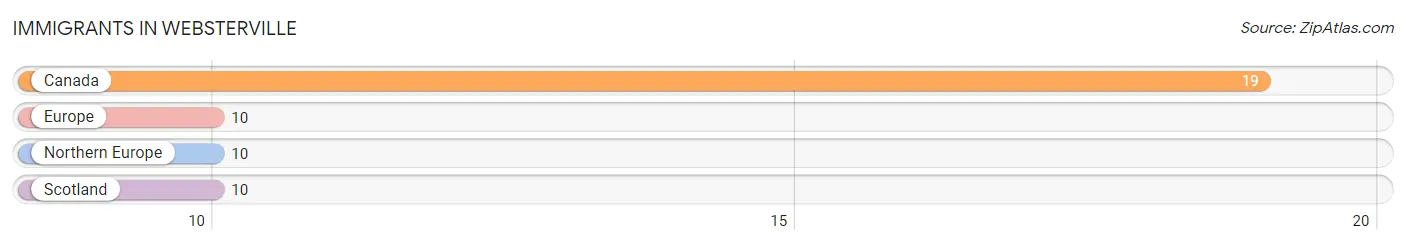
| Immigration Origin | # Population | % Population |
| Canada | 19 | 7.6% |
| Europe | 10 | 4.0% |
| Northern Europe | 10 | 4.0% |
| Scotland | 10 | 4.0% | View All 4 Rows |
Sex and Age in Websterville
Sex and Age in Websterville
The most populous age groups in Websterville are 55 to 59 Years (80 | 60.6%) for men and 60 to 64 Years (27 | 23.1%) for women.
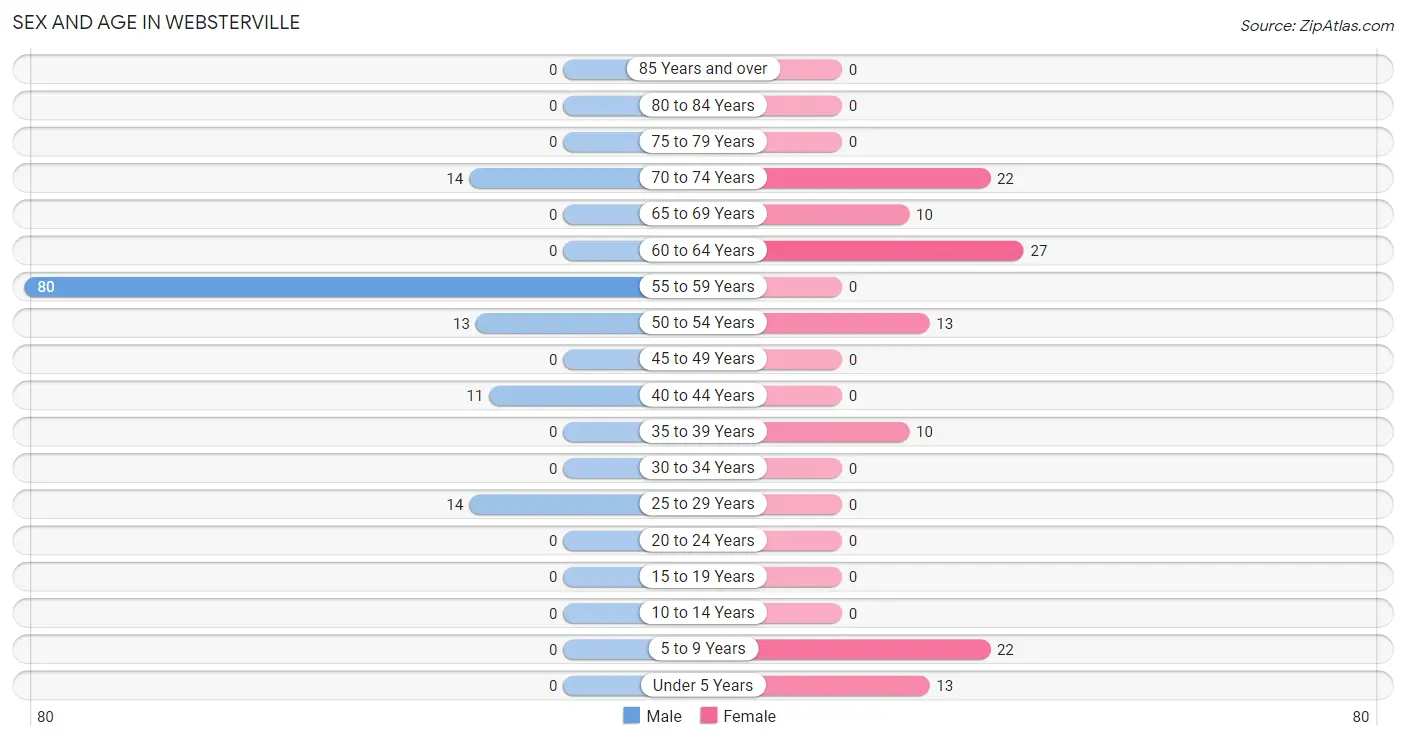
| Age Bracket | Male | Female |
| Under 5 Years | 0 (0.0%) | 13 (11.1%) |
| 5 to 9 Years | 0 (0.0%) | 22 (18.8%) |
| 10 to 14 Years | 0 (0.0%) | 0 (0.0%) |
| 15 to 19 Years | 0 (0.0%) | 0 (0.0%) |
| 20 to 24 Years | 0 (0.0%) | 0 (0.0%) |
| 25 to 29 Years | 14 (10.6%) | 0 (0.0%) |
| 30 to 34 Years | 0 (0.0%) | 0 (0.0%) |
| 35 to 39 Years | 0 (0.0%) | 10 (8.6%) |
| 40 to 44 Years | 11 (8.3%) | 0 (0.0%) |
| 45 to 49 Years | 0 (0.0%) | 0 (0.0%) |
| 50 to 54 Years | 13 (9.9%) | 13 (11.1%) |
| 55 to 59 Years | 80 (60.6%) | 0 (0.0%) |
| 60 to 64 Years | 0 (0.0%) | 27 (23.1%) |
| 65 to 69 Years | 0 (0.0%) | 10 (8.6%) |
| 70 to 74 Years | 14 (10.6%) | 22 (18.8%) |
| 75 to 79 Years | 0 (0.0%) | 0 (0.0%) |
| 80 to 84 Years | 0 (0.0%) | 0 (0.0%) |
| 85 Years and over | 0 (0.0%) | 0 (0.0%) |
| Total | 132 (100.0%) | 117 (100.0%) |
Families and Households in Websterville
Median Family Size in Websterville
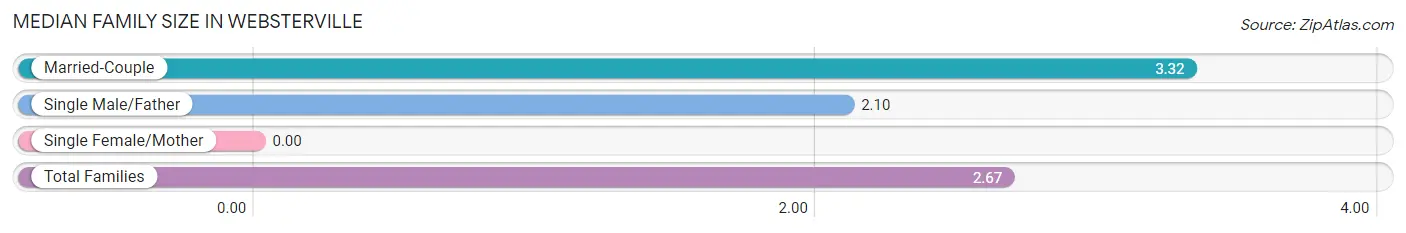
| Family Type | # Families | Family Size |
| Married-Couple | 25 (46.3%) | 3.32 |
| Single Male/Father | 29 (53.7%) | 2.10 |
| Single Female/Mother | 0 (0.0%) | - |
| Total Families | 54 (100.0%) | 2.67 |
Median Household Size in Websterville
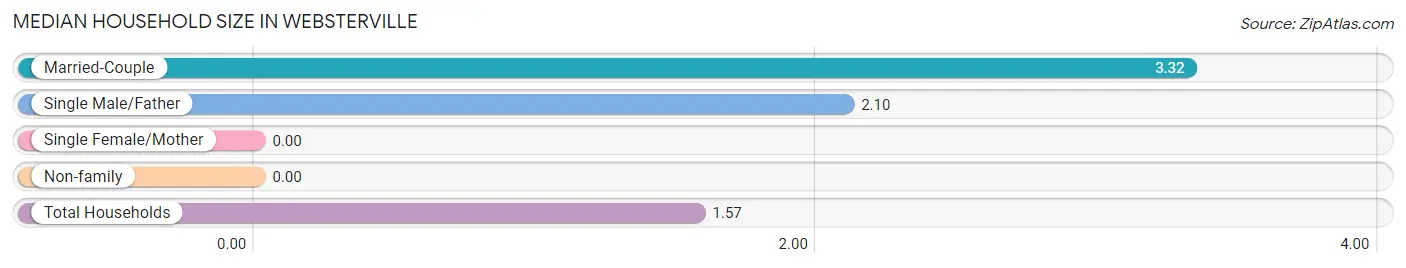
| Household Type | # Households | Household Size |
| Married-Couple | 25 (15.7%) | 3.32 |
| Single Male/Father | 29 (18.2%) | 2.10 |
| Single Female/Mother | 0 (0.0%) | - |
| Non-family | 105 (66.0%) | - |
| Total Households | 159 (100.0%) | 1.57 |
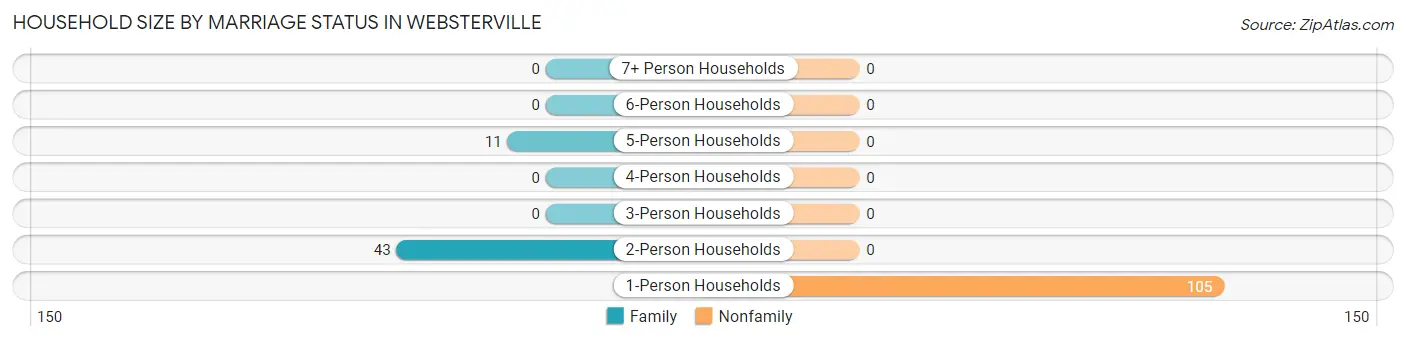
Household Size by Marriage Status in Websterville
Out of a total of 159 households in Websterville, 54 (34.0%) are family households, while 105 (66.0%) are nonfamily households. The most numerous type of family households are 2-person households, comprising 43, and the most common type of nonfamily households are 1-person households, comprising 105.
| Household Size | Family Households | Nonfamily Households |
| 1-Person Households | - | 105 (66.0%) |
| 2-Person Households | 43 (27.0%) | 0 (0.0%) |
| 3-Person Households | 0 (0.0%) | 0 (0.0%) |
| 4-Person Households | 0 (0.0%) | 0 (0.0%) |
| 5-Person Households | 11 (6.9%) | 0 (0.0%) |
| 6-Person Households | 0 (0.0%) | 0 (0.0%) |
| 7+ Person Households | 0 (0.0%) | 0 (0.0%) |
| Total | 54 (34.0%) | 105 (66.0%) |
Female Fertility in Websterville
Fertility by Age in Websterville
| Age Bracket | Women with Births | Births / 1,000 Women |
| 15 to 19 years | 0 (0.0%) | 0.0 |
| 20 to 34 years | 0 (0.0%) | 0.0 |
| 35 to 50 years | 0 (0.0%) | 0.0 |
| Total | 0 (0.0%) | 0.0 |
Fertility by Age by Marriage Status in Websterville
| Age Bracket | Married | Unmarried |
| 15 to 19 years | 0 (0.0%) | 0 (0.0%) |
| 20 to 34 years | 0 (0.0%) | 0 (0.0%) |
| 35 to 50 years | 0 (0.0%) | 0 (0.0%) |
| Total | 0 (0.0%) | 0 (0.0%) |
Fertility by Education in Websterville
| Educational Attainment | Women with Births | Births / 1,000 Women |
| Less than High School | 0 (0.0%) | 0.0 |
| High School Diploma | 0 (0.0%) | 0.0 |
| College or Associate's Degree | 0 (0.0%) | 0.0 |
| Bachelor's Degree | 0 (0.0%) | 0.0 |
| Graduate Degree | 0 (0.0%) | 0.0 |
| Total | 0 (0.0%) | 0.0 |
Fertility by Education by Marriage Status in Websterville
| Educational Attainment | Married | Unmarried |
| Less than High School | 0 (0.0%) | 0 (0.0%) |
| High School Diploma | 0 (0.0%) | 0 (0.0%) |
| College or Associate's Degree | 0 (0.0%) | 0 (0.0%) |
| Bachelor's Degree | 0 (0.0%) | 0 (0.0%) |
| Graduate Degree | 0 (0.0%) | 0 (0.0%) |
| Total | 0 (0.0%) | 0 (0.0%) |
Employment Characteristics in Websterville
Employment by Class of Employer in Websterville
Among the 153 employed individuals in Websterville, private company employees (76 | 49.7%), local government employees (27 | 17.6%), and self-employed (incorporated) (24 | 15.7%) make up the most common classes of employment.
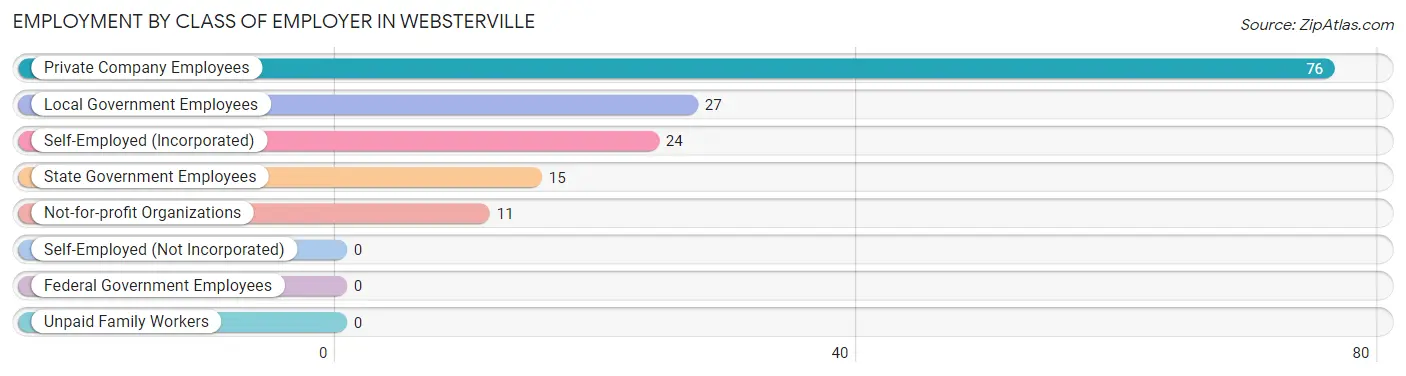
| Employer Class | # Employees | % Employees |
| Private Company Employees | 76 | 49.7% |
| Self-Employed (Incorporated) | 24 | 15.7% |
| Self-Employed (Not Incorporated) | 0 | 0.0% |
| Not-for-profit Organizations | 11 | 7.2% |
| Local Government Employees | 27 | 17.6% |
| State Government Employees | 15 | 9.8% |
| Federal Government Employees | 0 | 0.0% |
| Unpaid Family Workers | 0 | 0.0% |
| Total | 153 | 100.0% |
Employment Status by Age in Websterville
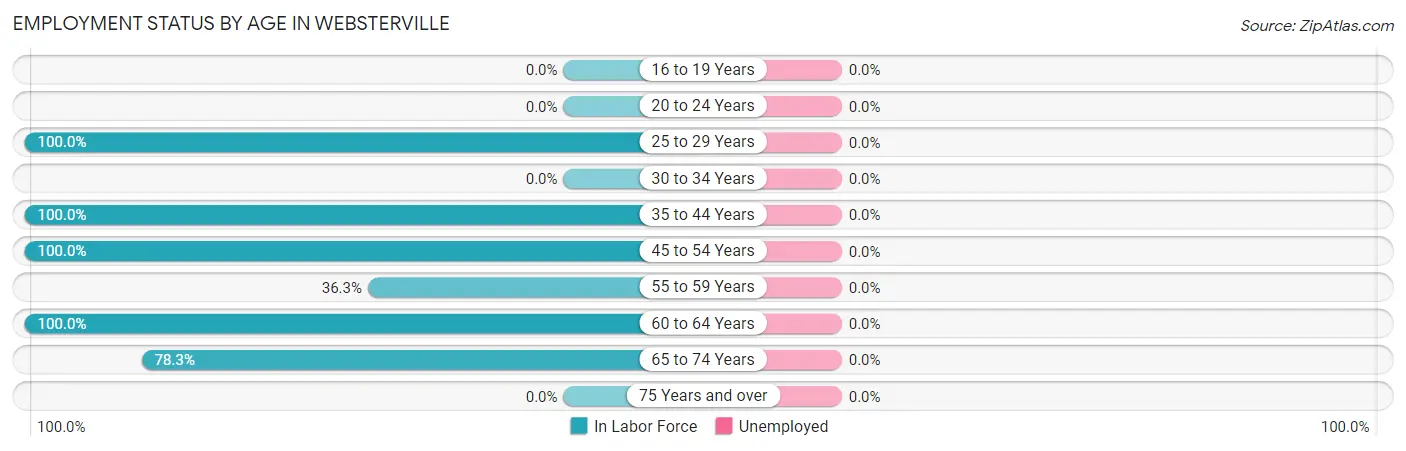
| Age Bracket | In Labor Force | Unemployed |
| 16 to 19 Years | 0 (0.0%) | 0 (0.0%) |
| 20 to 24 Years | 0 (0.0%) | 0 (0.0%) |
| 25 to 29 Years | 14 (100.0%) | 0 (0.0%) |
| 30 to 34 Years | 0 (0.0%) | 0 (0.0%) |
| 35 to 44 Years | 21 (100.0%) | 0 (0.0%) |
| 45 to 54 Years | 26 (100.0%) | 0 (0.0%) |
| 55 to 59 Years | 29 (36.3%) | 0 (0.0%) |
| 60 to 64 Years | 27 (100.0%) | 0 (0.0%) |
| 65 to 74 Years | 36 (78.3%) | 0 (0.0%) |
| 75 Years and over | 0 (0.0%) | 0 (0.0%) |
| Total | 153 (71.5%) | 0 (0.0%) |
Employment Status by Educational Attainment in Websterville
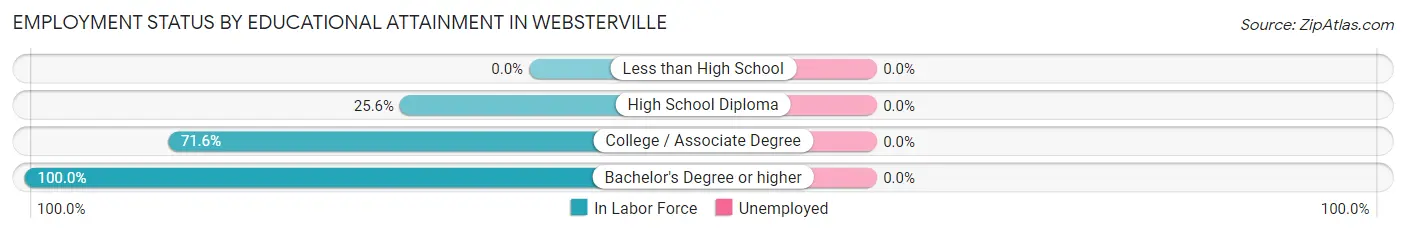
| Educational Attainment | In Labor Force | Unemployed |
| Less than High School | 0 (0.0%) | 0 (0.0%) |
| High School Diploma | 11 (25.6%) | 0 (0.0%) |
| College / Associate Degree | 48 (71.6%) | 0 (0.0%) |
| Bachelor's Degree or higher | 58 (100.0%) | 0 (0.0%) |
| Total | 117 (69.6%) | 0 (0.0%) |
Employment Occupations by Sex in Websterville
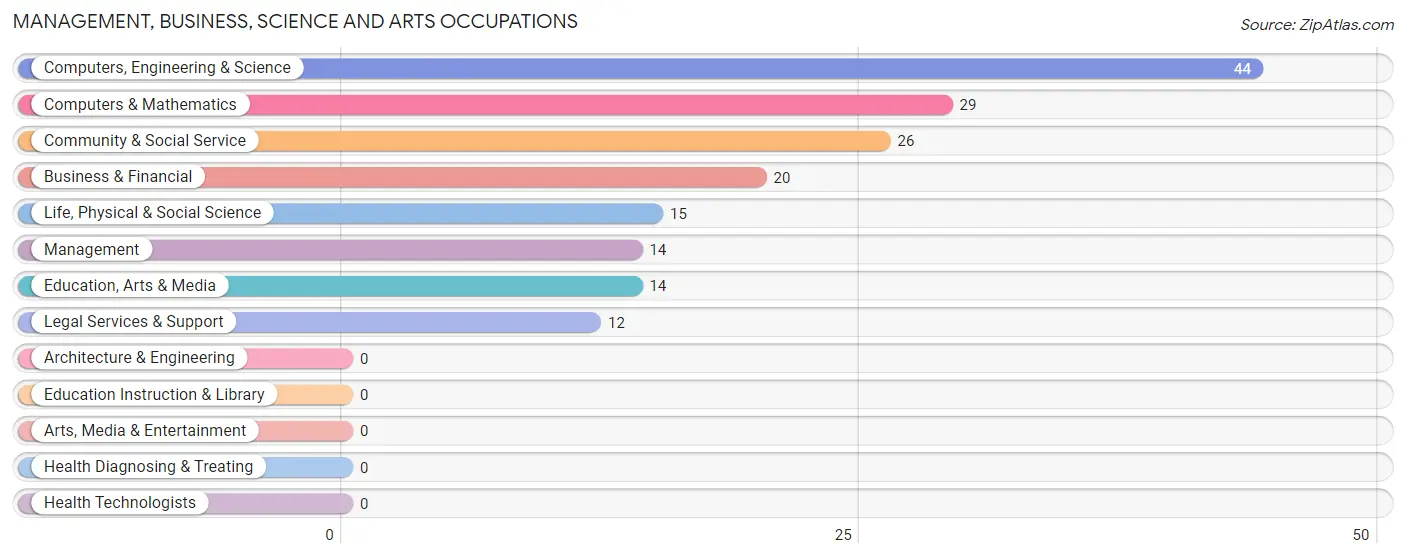
Management, Business, Science and Arts Occupations
The most common Management, Business, Science and Arts occupations in Websterville are Computers, Engineering & Science (44 | 28.8%), Computers & Mathematics (29 | 19.0%), Community & Social Service (26 | 17.0%), Business & Financial (20 | 13.1%), and Life, Physical & Social Science (15 | 9.8%).
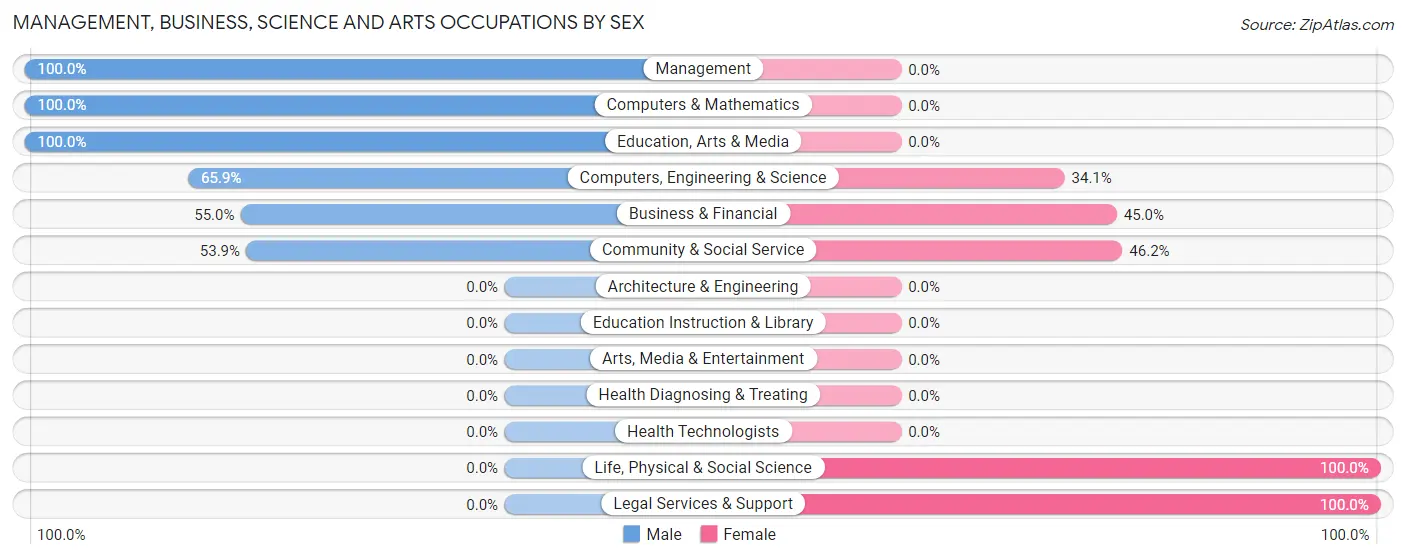
Management, Business, Science and Arts Occupations by Sex
Within the Management, Business, Science and Arts occupations in Websterville, the most male-oriented occupations are Management (100.0%), Computers & Mathematics (100.0%), and Education, Arts & Media (100.0%), while the most female-oriented occupations are Life, Physical & Social Science (100.0%), Legal Services & Support (100.0%), and Community & Social Service (46.2%).
| Occupation | Male | Female |
| Management | 14 (100.0%) | 0 (0.0%) |
| Business & Financial | 11 (55.0%) | 9 (45.0%) |
| Computers, Engineering & Science | 29 (65.9%) | 15 (34.1%) |
| Computers & Mathematics | 29 (100.0%) | 0 (0.0%) |
| Architecture & Engineering | 0 (0.0%) | 0 (0.0%) |
| Life, Physical & Social Science | 0 (0.0%) | 15 (100.0%) |
| Community & Social Service | 14 (53.8%) | 12 (46.2%) |
| Education, Arts & Media | 14 (100.0%) | 0 (0.0%) |
| Legal Services & Support | 0 (0.0%) | 12 (100.0%) |
| Education Instruction & Library | 0 (0.0%) | 0 (0.0%) |
| Arts, Media & Entertainment | 0 (0.0%) | 0 (0.0%) |
| Health Diagnosing & Treating | 0 (0.0%) | 0 (0.0%) |
| Health Technologists | 0 (0.0%) | 0 (0.0%) |
| Total (Category) | 68 (65.4%) | 36 (34.6%) |
| Total (Overall) | 81 (52.9%) | 72 (47.1%) |
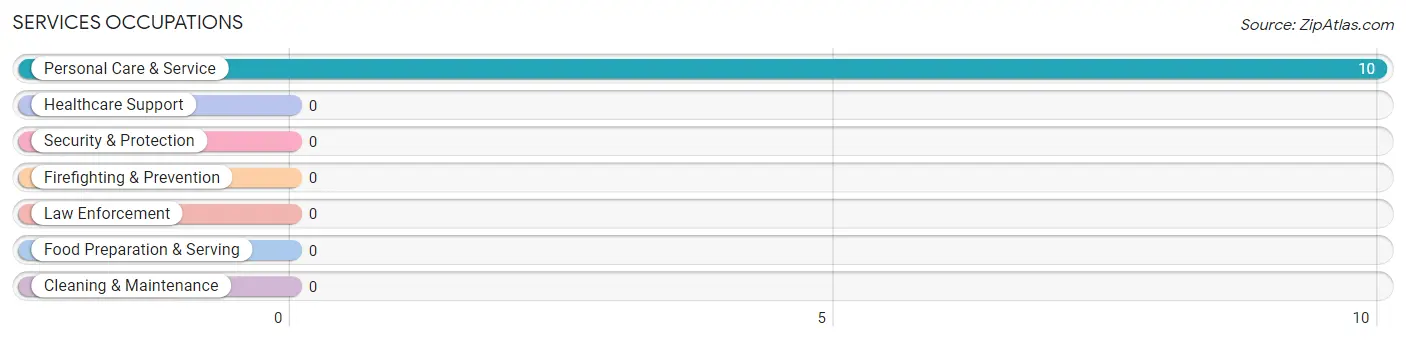
Services Occupations
The most common Services occupations in Websterville are , and Personal Care & Service (10 | 6.5%).
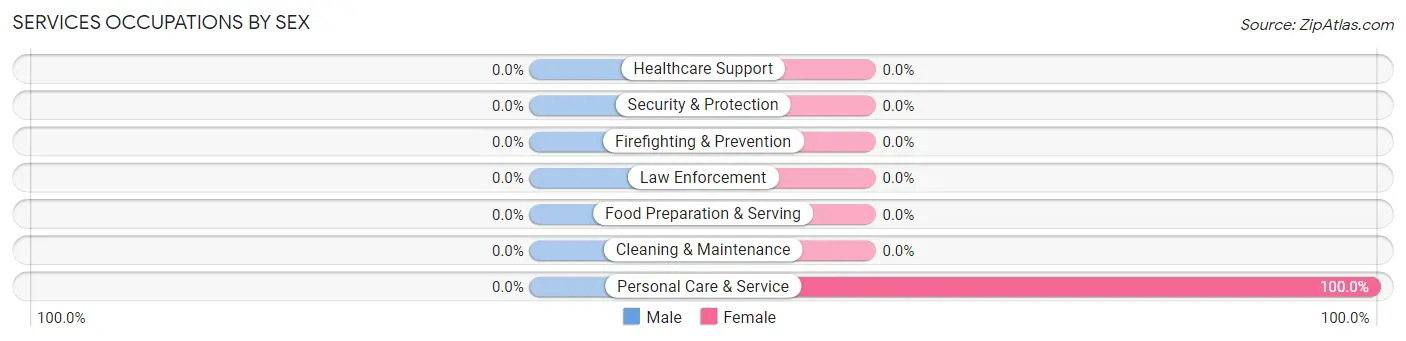
Services Occupations by Sex
| Occupation | Male | Female |
| Healthcare Support | 0 (0.0%) | 0 (0.0%) |
| Security & Protection | 0 (0.0%) | 0 (0.0%) |
| Firefighting & Prevention | 0 (0.0%) | 0 (0.0%) |
| Law Enforcement | 0 (0.0%) | 0 (0.0%) |
| Food Preparation & Serving | 0 (0.0%) | 0 (0.0%) |
| Cleaning & Maintenance | 0 (0.0%) | 0 (0.0%) |
| Personal Care & Service | 0 (0.0%) | 10 (100.0%) |
| Total (Category) | 0 (0.0%) | 10 (100.0%) |
| Total (Overall) | 81 (52.9%) | 72 (47.1%) |
Sales and Office Occupations
The most common Sales and Office occupations in Websterville are , and Office & Administration (26 | 17.0%).

Sales and Office Occupations by Sex

| Occupation | Male | Female |
| Sales & Related | 0 (0.0%) | 0 (0.0%) |
| Office & Administration | 0 (0.0%) | 26 (100.0%) |
| Total (Category) | 0 (0.0%) | 26 (100.0%) |
| Total (Overall) | 81 (52.9%) | 72 (47.1%) |
Natural Resources, Construction and Maintenance Occupations
Natural Resources, Construction and Maintenance Occupations by Sex
| Occupation | Male | Female |
| Farming, Fishing & Forestry | 0 (0.0%) | 0 (0.0%) |
| Construction & Extraction | 0 (0.0%) | 0 (0.0%) |
| Installation, Maintenance & Repair | 0 (0.0%) | 0 (0.0%) |
| Total (Category) | 0 (0.0%) | 0 (0.0%) |
| Total (Overall) | 81 (52.9%) | 72 (47.1%) |
Production, Transportation and Moving Occupations
The most common Production, Transportation and Moving occupations in Websterville are , and Material Moving (13 | 8.5%).
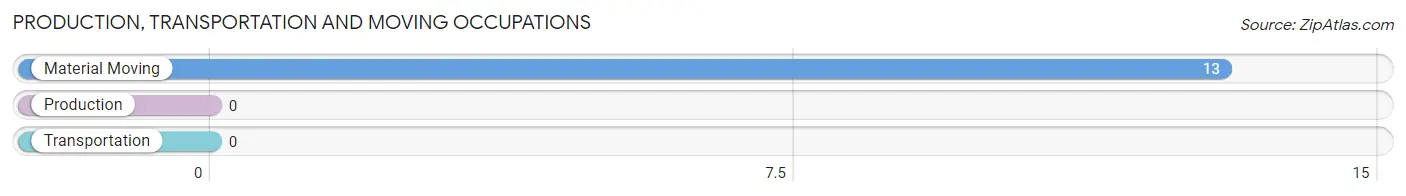
Production, Transportation and Moving Occupations by Sex
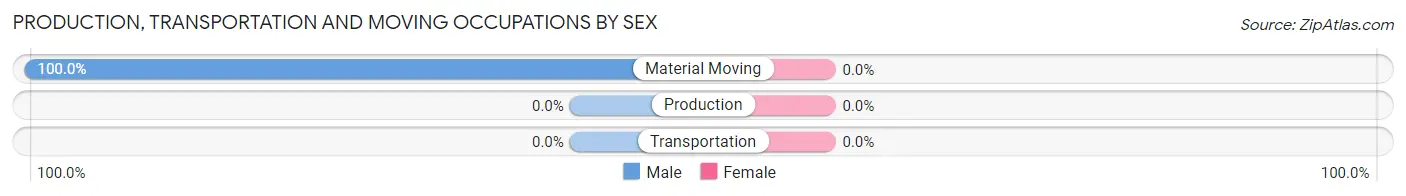
| Occupation | Male | Female |
| Production | 0 (0.0%) | 0 (0.0%) |
| Transportation | 0 (0.0%) | 0 (0.0%) |
| Material Moving | 13 (100.0%) | 0 (0.0%) |
| Total (Category) | 13 (100.0%) | 0 (0.0%) |
| Total (Overall) | 81 (52.9%) | 72 (47.1%) |
Employment Industries by Sex in Websterville
Employment Industries in Websterville
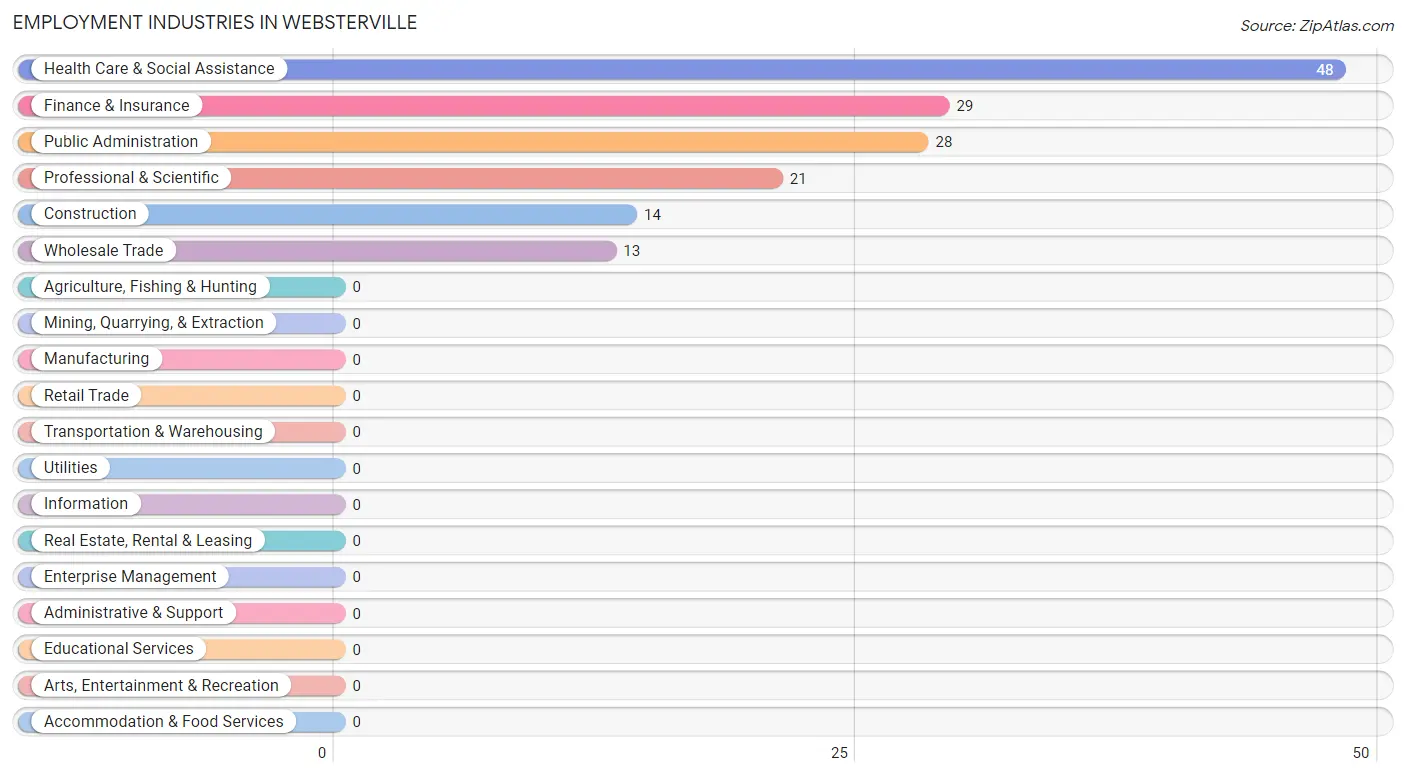
The major employment industries in Websterville include Health Care & Social Assistance (48 | 31.4%), Finance & Insurance (29 | 19.0%), Public Administration (28 | 18.3%), Professional & Scientific (21 | 13.7%), and Construction (14 | 9.1%).
Employment Industries by Sex in Websterville
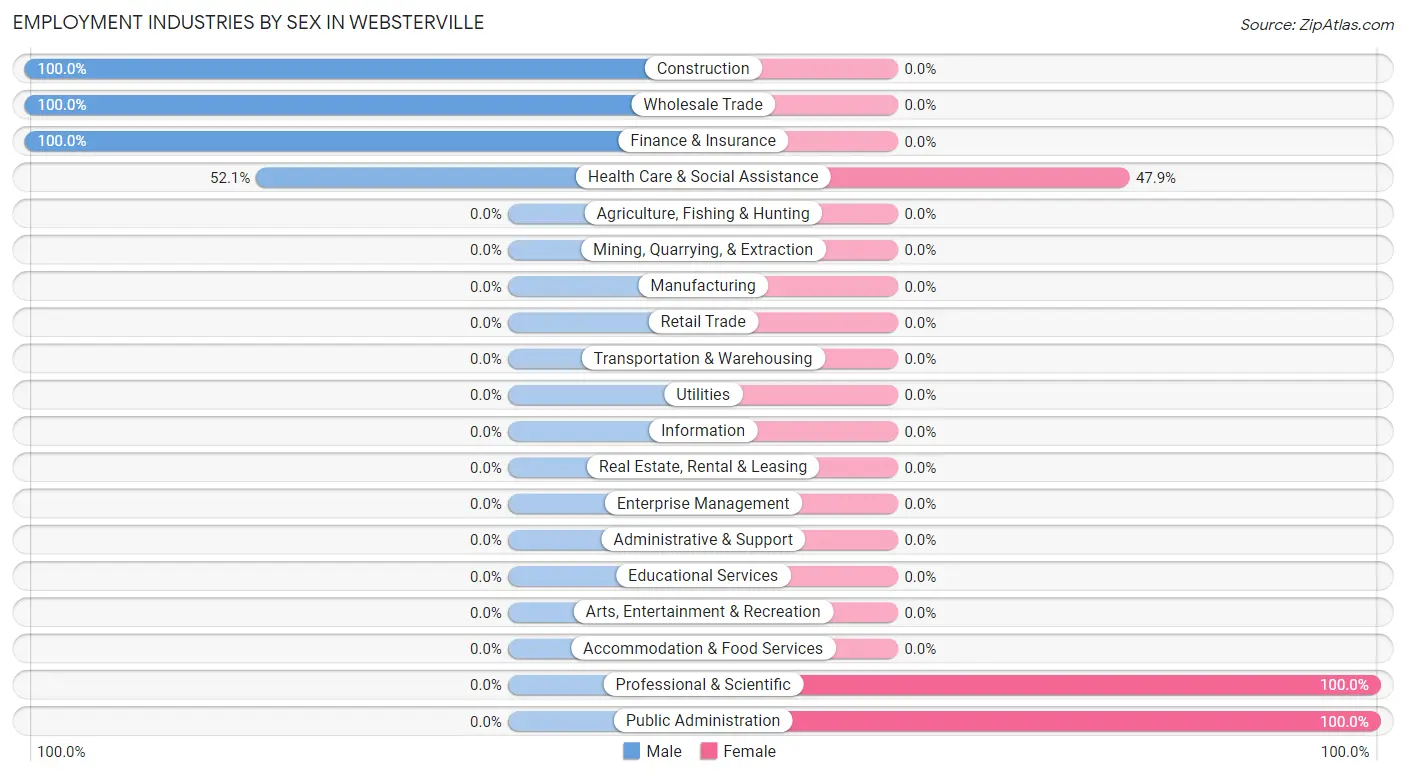
The Websterville industries that see more men than women are Construction (100.0%), Wholesale Trade (100.0%), and Finance & Insurance (100.0%), whereas the industries that tend to have a higher number of women are Professional & Scientific (100.0%), Public Administration (100.0%), and Health Care & Social Assistance (47.9%).
| Industry | Male | Female |
| Agriculture, Fishing & Hunting | 0 (0.0%) | 0 (0.0%) |
| Mining, Quarrying, & Extraction | 0 (0.0%) | 0 (0.0%) |
| Construction | 14 (100.0%) | 0 (0.0%) |
| Manufacturing | 0 (0.0%) | 0 (0.0%) |
| Wholesale Trade | 13 (100.0%) | 0 (0.0%) |
| Retail Trade | 0 (0.0%) | 0 (0.0%) |
| Transportation & Warehousing | 0 (0.0%) | 0 (0.0%) |
| Utilities | 0 (0.0%) | 0 (0.0%) |
| Information | 0 (0.0%) | 0 (0.0%) |
| Finance & Insurance | 29 (100.0%) | 0 (0.0%) |
| Real Estate, Rental & Leasing | 0 (0.0%) | 0 (0.0%) |
| Professional & Scientific | 0 (0.0%) | 21 (100.0%) |
| Enterprise Management | 0 (0.0%) | 0 (0.0%) |
| Administrative & Support | 0 (0.0%) | 0 (0.0%) |
| Educational Services | 0 (0.0%) | 0 (0.0%) |
| Health Care & Social Assistance | 25 (52.1%) | 23 (47.9%) |
| Arts, Entertainment & Recreation | 0 (0.0%) | 0 (0.0%) |
| Accommodation & Food Services | 0 (0.0%) | 0 (0.0%) |
| Public Administration | 0 (0.0%) | 28 (100.0%) |
| Total | 81 (52.9%) | 72 (47.1%) |
Education in Websterville
School Enrollment in Websterville
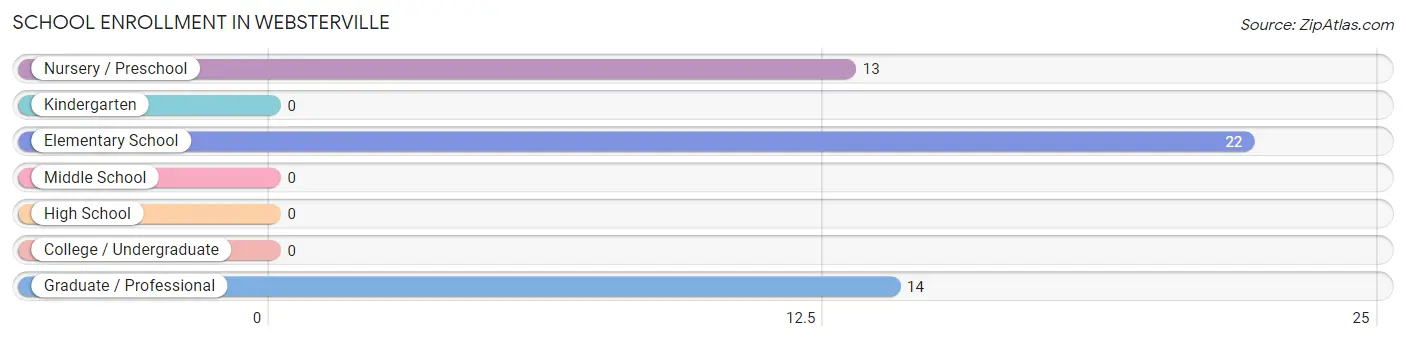
The most common levels of schooling among the 49 students in Websterville are elementary school (22 | 44.9%), graduate / professional (14 | 28.6%), and nursery / preschool (13 | 26.5%).
| School Level | # Students | % Students |
| Nursery / Preschool | 13 | 26.5% |
| Kindergarten | 0 | 0.0% |
| Elementary School | 22 | 44.9% |
| Middle School | 0 | 0.0% |
| High School | 0 | 0.0% |
| College / Undergraduate | 0 | 0.0% |
| Graduate / Professional | 14 | 28.6% |
| Total | 49 | 100.0% |
School Enrollment by Age by Funding Source in Websterville
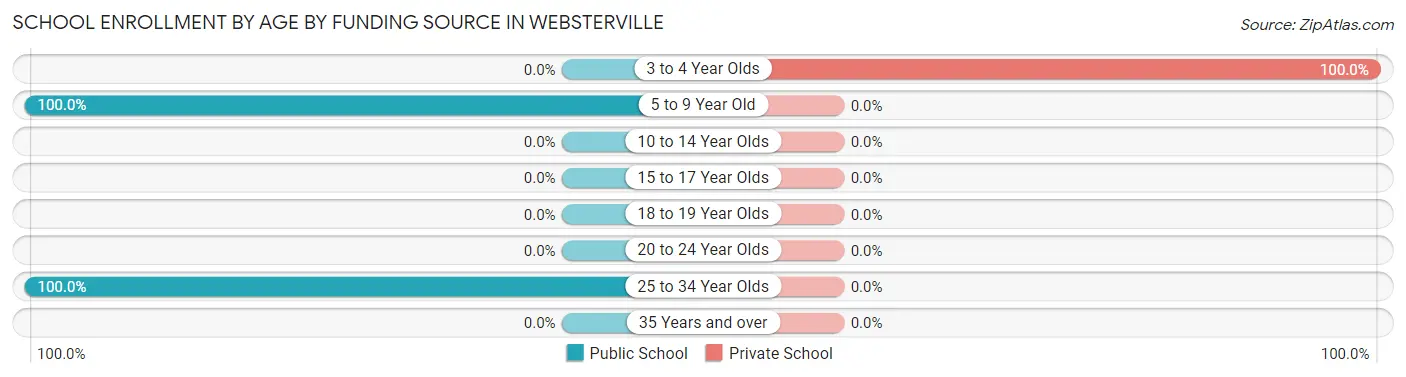
Out of a total of 49 students who are enrolled in schools in Websterville, 13 (26.5%) attend a private institution, while the remaining 36 (73.5%) are enrolled in public schools. The age group of 3 to 4 year olds has the highest likelihood of being enrolled in private schools, with 13 (100.0% in the age bracket) enrolled. Conversely, the age group of 5 to 9 year old has the lowest likelihood of being enrolled in a private school, with 22 (100.0% in the age bracket) attending a public institution.
| Age Bracket | Public School | Private School |
| 3 to 4 Year Olds | 0 (0.0%) | 13 (100.0%) |
| 5 to 9 Year Old | 22 (100.0%) | 0 (0.0%) |
| 10 to 14 Year Olds | 0 (0.0%) | 0 (0.0%) |
| 15 to 17 Year Olds | 0 (0.0%) | 0 (0.0%) |
| 18 to 19 Year Olds | 0 (0.0%) | 0 (0.0%) |
| 20 to 24 Year Olds | 0 (0.0%) | 0 (0.0%) |
| 25 to 34 Year Olds | 14 (100.0%) | 0 (0.0%) |
| 35 Years and over | 0 (0.0%) | 0 (0.0%) |
| Total | 36 (73.5%) | 13 (26.5%) |
Educational Attainment by Field of Study in Websterville
Computers & mathematics (29 | 40.3%), bio, nature & agricultural (15 | 20.8%), business (14 | 19.4%), and arts & humanities (14 | 19.4%) are the most common fields of study among 72 individuals in Websterville who have obtained a bachelor's degree or higher.
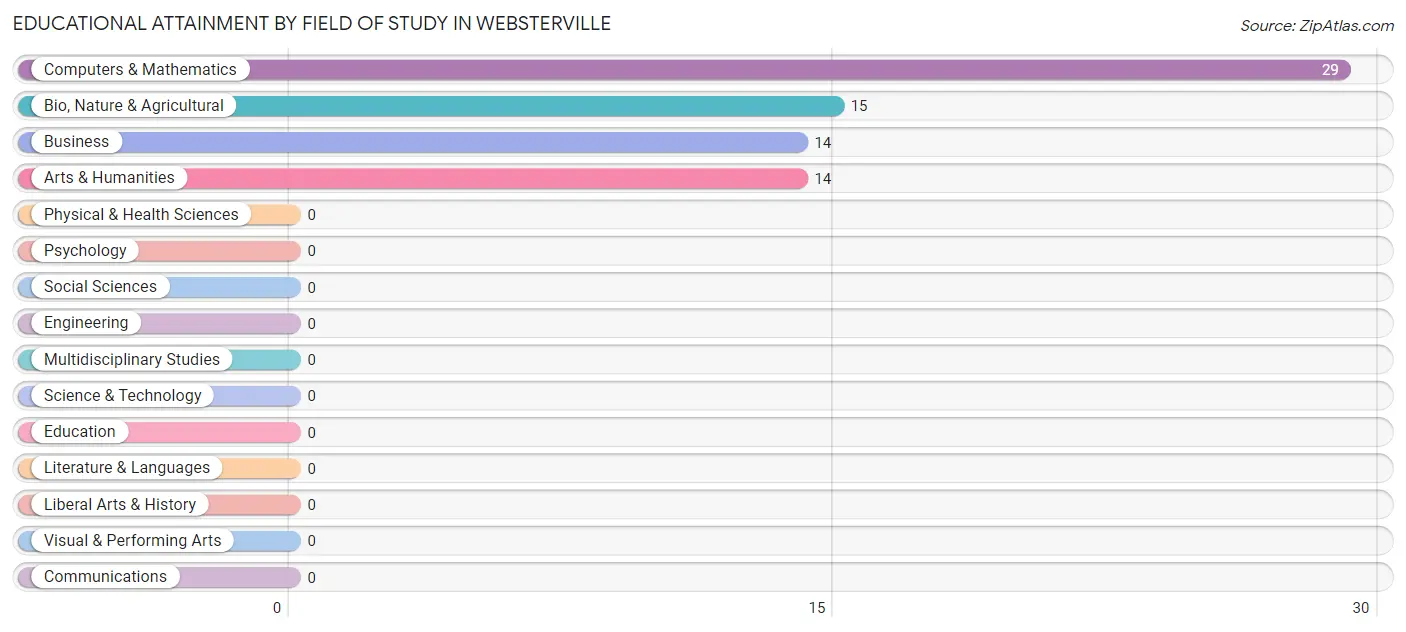
| Field of Study | # Graduates | % Graduates |
| Computers & Mathematics | 29 | 40.3% |
| Bio, Nature & Agricultural | 15 | 20.8% |
| Physical & Health Sciences | 0 | 0.0% |
| Psychology | 0 | 0.0% |
| Social Sciences | 0 | 0.0% |
| Engineering | 0 | 0.0% |
| Multidisciplinary Studies | 0 | 0.0% |
| Science & Technology | 0 | 0.0% |
| Business | 14 | 19.4% |
| Education | 0 | 0.0% |
| Literature & Languages | 0 | 0.0% |
| Liberal Arts & History | 0 | 0.0% |
| Visual & Performing Arts | 0 | 0.0% |
| Communications | 0 | 0.0% |
| Arts & Humanities | 14 | 19.4% |
| Total | 72 | 100.0% |
Transportation & Commute in Websterville
Vehicle Availability by Sex in Websterville
The most prevalent vehicle ownership categories in Websterville are males with 2 vehicles (40, accounting for 49.4%) and females with 2 vehicles (10, making up 55.6%).
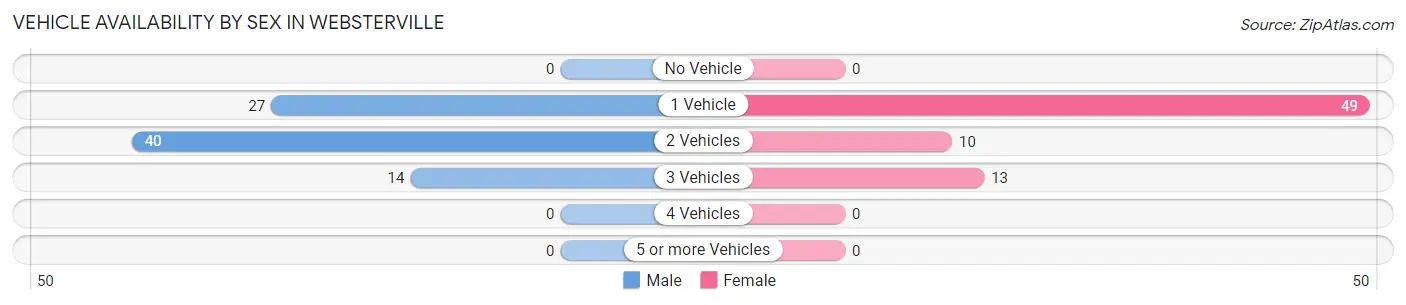
| Vehicles Available | Male | Female |
| No Vehicle | 0 (0.0%) | 0 (0.0%) |
| 1 Vehicle | 27 (33.3%) | 49 (68.1%) |
| 2 Vehicles | 40 (49.4%) | 10 (13.9%) |
| 3 Vehicles | 14 (17.3%) | 13 (18.1%) |
| 4 Vehicles | 0 (0.0%) | 0 (0.0%) |
| 5 or more Vehicles | 0 (0.0%) | 0 (0.0%) |
| Total | 81 (100.0%) | 72 (100.0%) |
Commute Time in Websterville
The most frequently occuring commute durations in Websterville are 10 to 14 minutes (38 commuters, 24.8%), 20 to 24 minutes (37 commuters, 24.2%), and 5 to 9 minutes (36 commuters, 23.5%).
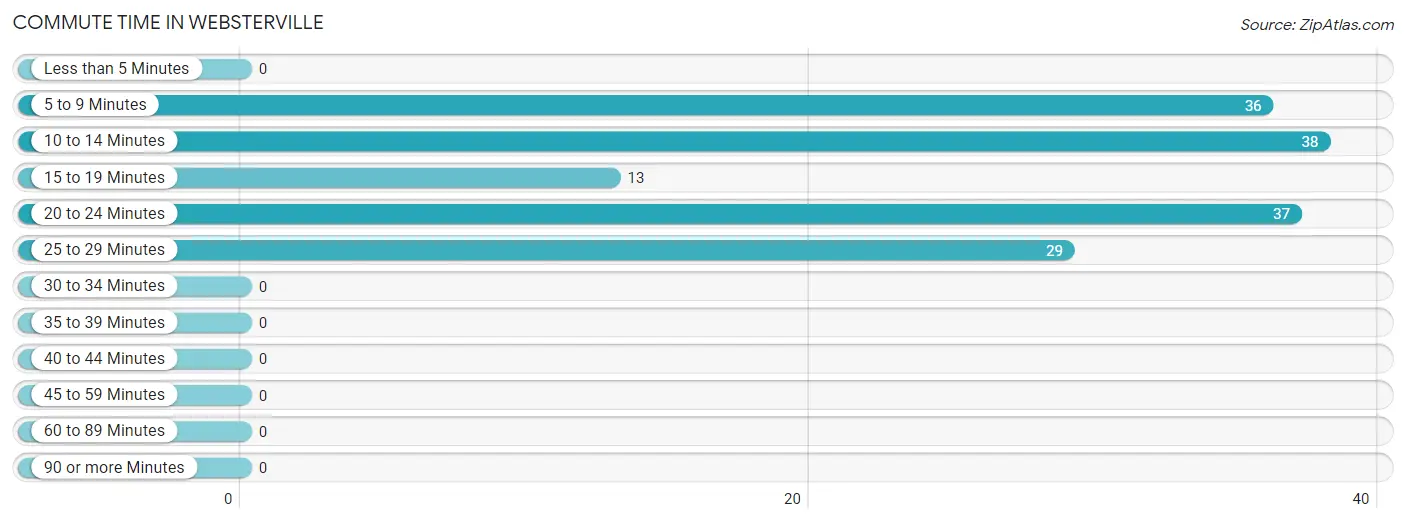
| Commute Time | # Commuters | % Commuters |
| Less than 5 Minutes | 0 | 0.0% |
| 5 to 9 Minutes | 36 | 23.5% |
| 10 to 14 Minutes | 38 | 24.8% |
| 15 to 19 Minutes | 13 | 8.5% |
| 20 to 24 Minutes | 37 | 24.2% |
| 25 to 29 Minutes | 29 | 19.0% |
| 30 to 34 Minutes | 0 | 0.0% |
| 35 to 39 Minutes | 0 | 0.0% |
| 40 to 44 Minutes | 0 | 0.0% |
| 45 to 59 Minutes | 0 | 0.0% |
| 60 to 89 Minutes | 0 | 0.0% |
| 90 or more Minutes | 0 | 0.0% |
Commute Time by Sex in Websterville
The most common commute times in Websterville are 25 to 29 minutes (29 commuters, 35.8%) for males and 20 to 24 minutes (24 commuters, 33.3%) for females.
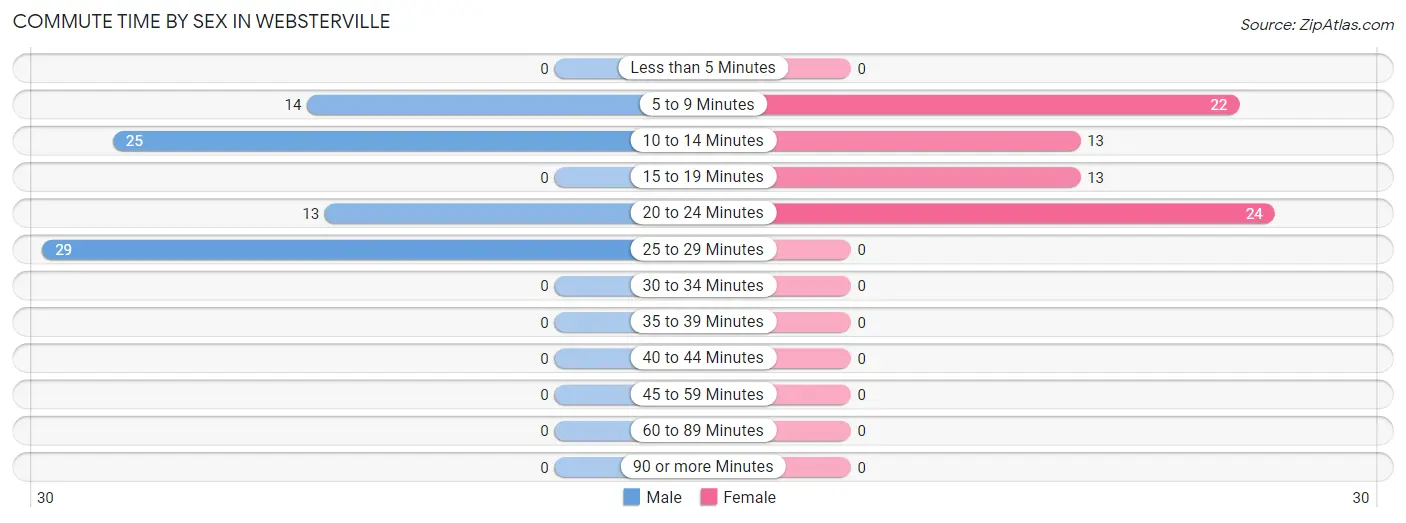
| Commute Time | Male | Female |
| Less than 5 Minutes | 0 (0.0%) | 0 (0.0%) |
| 5 to 9 Minutes | 14 (17.3%) | 22 (30.6%) |
| 10 to 14 Minutes | 25 (30.9%) | 13 (18.1%) |
| 15 to 19 Minutes | 0 (0.0%) | 13 (18.1%) |
| 20 to 24 Minutes | 13 (16.1%) | 24 (33.3%) |
| 25 to 29 Minutes | 29 (35.8%) | 0 (0.0%) |
| 30 to 34 Minutes | 0 (0.0%) | 0 (0.0%) |
| 35 to 39 Minutes | 0 (0.0%) | 0 (0.0%) |
| 40 to 44 Minutes | 0 (0.0%) | 0 (0.0%) |
| 45 to 59 Minutes | 0 (0.0%) | 0 (0.0%) |
| 60 to 89 Minutes | 0 (0.0%) | 0 (0.0%) |
| 90 or more Minutes | 0 (0.0%) | 0 (0.0%) |
Time of Departure to Work by Sex in Websterville
The most frequent times of departure to work in Websterville are 7:30 AM to 7:59 AM (29, 35.8%) for males and 8:00 AM to 8:29 AM (19, 26.4%) for females.
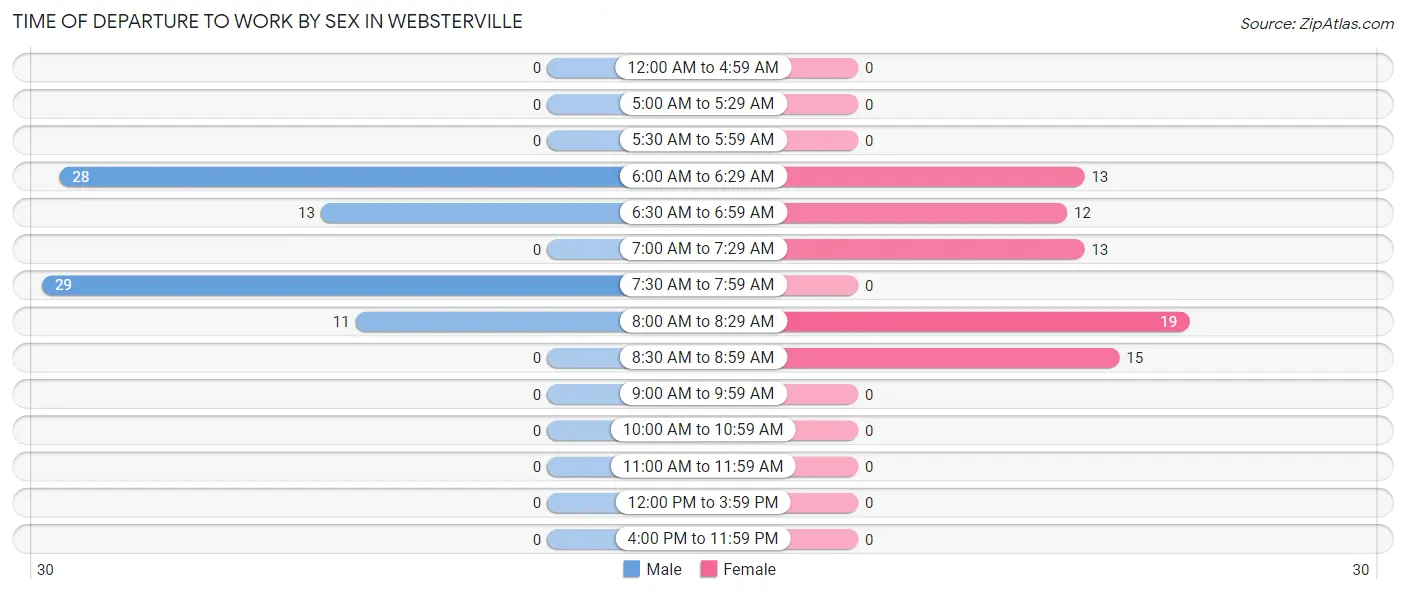
| Time of Departure | Male | Female |
| 12:00 AM to 4:59 AM | 0 (0.0%) | 0 (0.0%) |
| 5:00 AM to 5:29 AM | 0 (0.0%) | 0 (0.0%) |
| 5:30 AM to 5:59 AM | 0 (0.0%) | 0 (0.0%) |
| 6:00 AM to 6:29 AM | 28 (34.6%) | 13 (18.1%) |
| 6:30 AM to 6:59 AM | 13 (16.1%) | 12 (16.7%) |
| 7:00 AM to 7:29 AM | 0 (0.0%) | 13 (18.1%) |
| 7:30 AM to 7:59 AM | 29 (35.8%) | 0 (0.0%) |
| 8:00 AM to 8:29 AM | 11 (13.6%) | 19 (26.4%) |
| 8:30 AM to 8:59 AM | 0 (0.0%) | 15 (20.8%) |
| 9:00 AM to 9:59 AM | 0 (0.0%) | 0 (0.0%) |
| 10:00 AM to 10:59 AM | 0 (0.0%) | 0 (0.0%) |
| 11:00 AM to 11:59 AM | 0 (0.0%) | 0 (0.0%) |
| 12:00 PM to 3:59 PM | 0 (0.0%) | 0 (0.0%) |
| 4:00 PM to 11:59 PM | 0 (0.0%) | 0 (0.0%) |
| Total | 81 (100.0%) | 72 (100.0%) |
Housing Occupancy in Websterville
Occupancy by Ownership in Websterville
Of the total 159 dwellings in Websterville, owner-occupied units account for 135 (84.9%), while renter-occupied units make up 24 (15.1%).
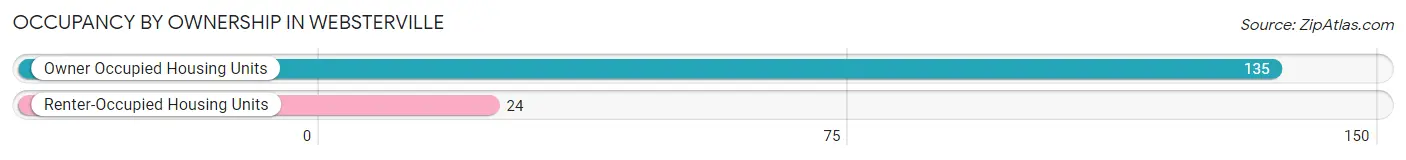
| Occupancy | # Housing Units | % Housing Units |
| Owner Occupied Housing Units | 135 | 84.9% |
| Renter-Occupied Housing Units | 24 | 15.1% |
| Total Occupied Housing Units | 159 | 100.0% |
Occupancy by Household Size in Websterville
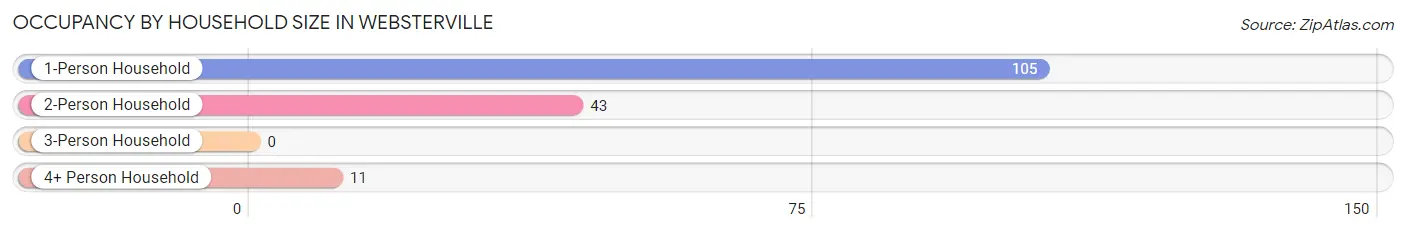
| Household Size | # Housing Units | % Housing Units |
| 1-Person Household | 105 | 66.0% |
| 2-Person Household | 43 | 27.0% |
| 3-Person Household | 0 | 0.0% |
| 4+ Person Household | 11 | 6.9% |
| Total Housing Units | 159 | 100.0% |
Occupancy by Ownership by Household Size in Websterville
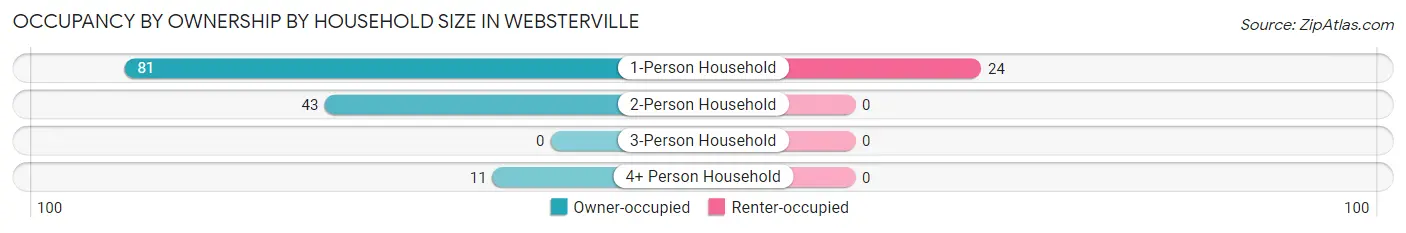
| Household Size | Owner-occupied | Renter-occupied |
| 1-Person Household | 81 (77.1%) | 24 (22.9%) |
| 2-Person Household | 43 (100.0%) | 0 (0.0%) |
| 3-Person Household | 0 (0.0%) | 0 (0.0%) |
| 4+ Person Household | 11 (100.0%) | 0 (0.0%) |
| Total Housing Units | 135 (84.9%) | 24 (15.1%) |
Occupancy by Educational Attainment in Websterville
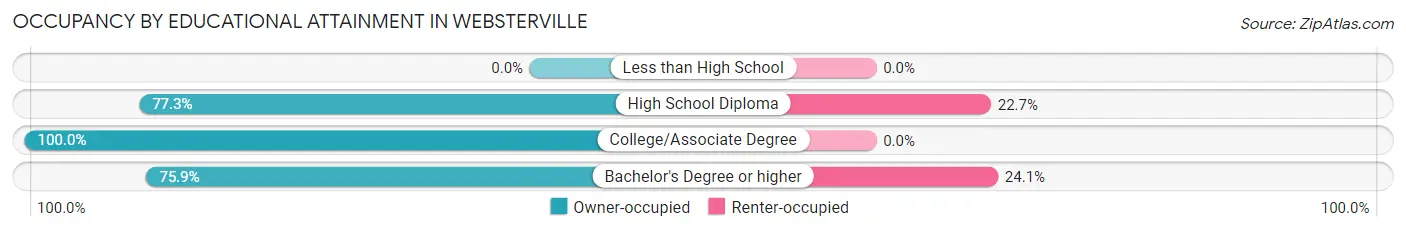
| Household Size | Owner-occupied | Renter-occupied |
| Less than High School | 0 (0.0%) | 0 (0.0%) |
| High School Diploma | 34 (77.3%) | 10 (22.7%) |
| College/Associate Degree | 57 (100.0%) | 0 (0.0%) |
| Bachelor's Degree or higher | 44 (75.9%) | 14 (24.1%) |
Occupancy by Age of Householder in Websterville
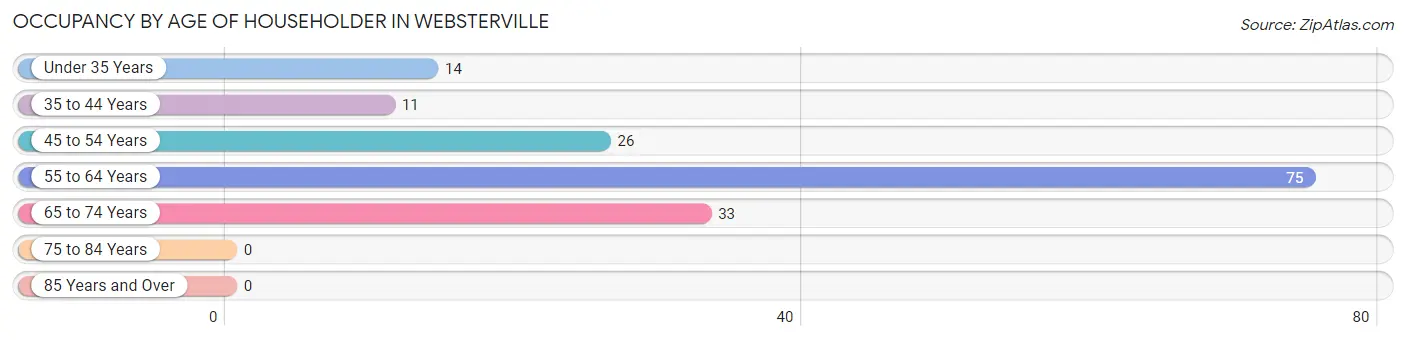
| Age Bracket | # Households | % Households |
| Under 35 Years | 14 | 8.8% |
| 35 to 44 Years | 11 | 6.9% |
| 45 to 54 Years | 26 | 16.4% |
| 55 to 64 Years | 75 | 47.2% |
| 65 to 74 Years | 33 | 20.7% |
| 75 to 84 Years | 0 | 0.0% |
| 85 Years and Over | 0 | 0.0% |
| Total | 159 | 100.0% |
Housing Finances in Websterville
Median Income by Occupancy in Websterville
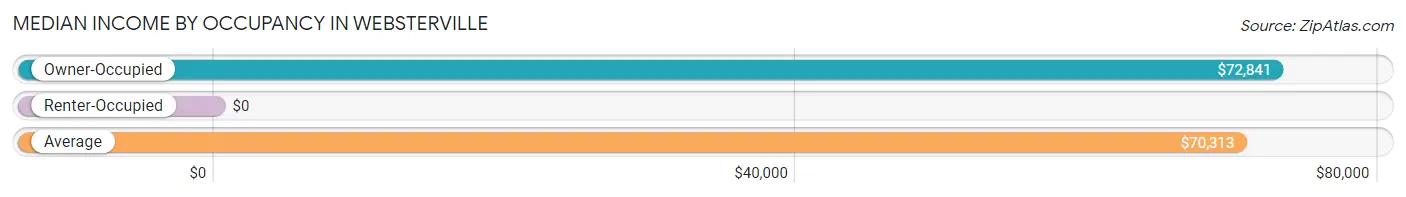
| Occupancy Type | # Households | Median Income |
| Owner-Occupied | 135 (84.9%) | $72,841 |
| Renter-Occupied | 24 (15.1%) | $0 |
| Average | 159 (100.0%) | $70,313 |
Occupancy by Householder Income Bracket in Websterville
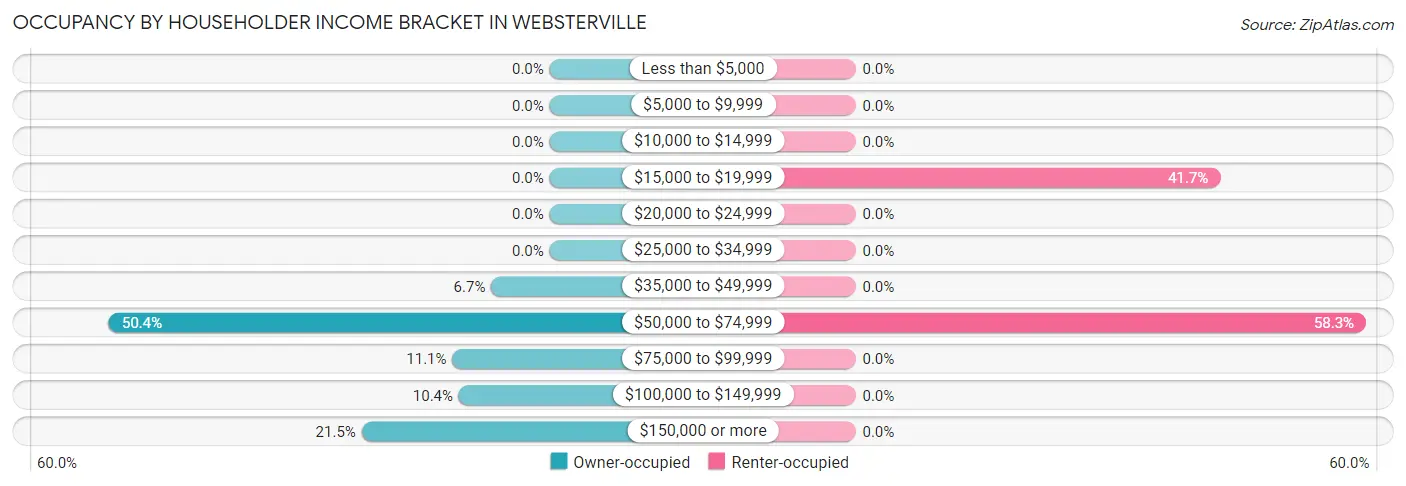
| Income Bracket | Owner-occupied | Renter-occupied |
| Less than $5,000 | 0 (0.0%) | 0 (0.0%) |
| $5,000 to $9,999 | 0 (0.0%) | 0 (0.0%) |
| $10,000 to $14,999 | 0 (0.0%) | 0 (0.0%) |
| $15,000 to $19,999 | 0 (0.0%) | 10 (41.7%) |
| $20,000 to $24,999 | 0 (0.0%) | 0 (0.0%) |
| $25,000 to $34,999 | 0 (0.0%) | 0 (0.0%) |
| $35,000 to $49,999 | 9 (6.7%) | 0 (0.0%) |
| $50,000 to $74,999 | 68 (50.4%) | 14 (58.3%) |
| $75,000 to $99,999 | 15 (11.1%) | 0 (0.0%) |
| $100,000 to $149,999 | 14 (10.4%) | 0 (0.0%) |
| $150,000 or more | 29 (21.5%) | 0 (0.0%) |
| Total | 135 (100.0%) | 24 (100.0%) |
Monthly Housing Cost Tiers in Websterville
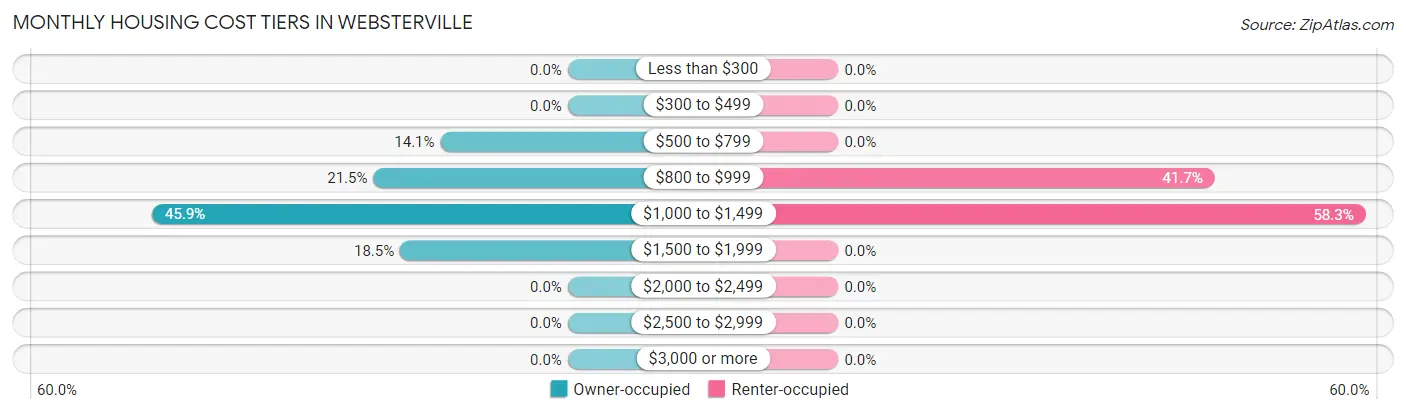
| Monthly Cost | Owner-occupied | Renter-occupied |
| Less than $300 | 0 (0.0%) | 0 (0.0%) |
| $300 to $499 | 0 (0.0%) | 0 (0.0%) |
| $500 to $799 | 19 (14.1%) | 0 (0.0%) |
| $800 to $999 | 29 (21.5%) | 10 (41.7%) |
| $1,000 to $1,499 | 62 (45.9%) | 14 (58.3%) |
| $1,500 to $1,999 | 25 (18.5%) | 0 (0.0%) |
| $2,000 to $2,499 | 0 (0.0%) | 0 (0.0%) |
| $2,500 to $2,999 | 0 (0.0%) | 0 (0.0%) |
| $3,000 or more | 0 (0.0%) | 0 (0.0%) |
| Total | 135 (100.0%) | 24 (100.0%) |
Physical Housing Characteristics in Websterville
Housing Structures in Websterville
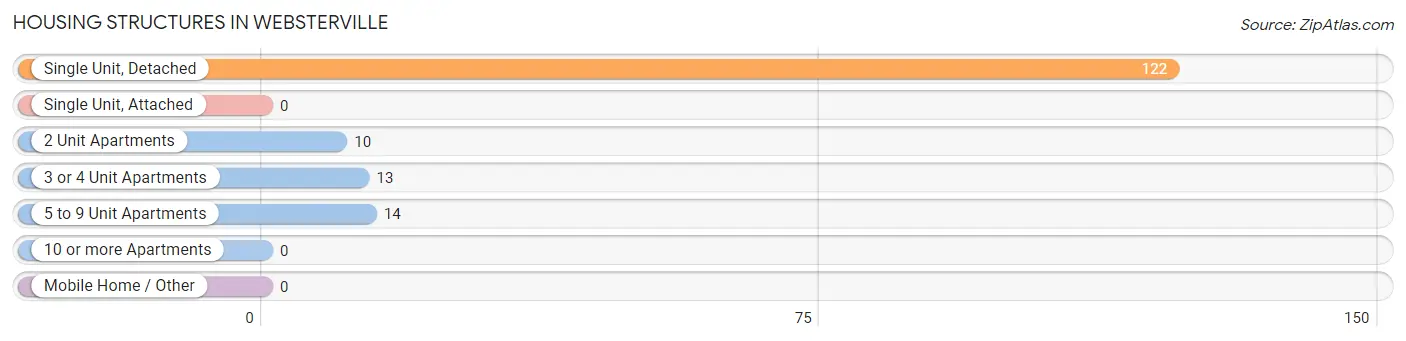
| Structure Type | # Housing Units | % Housing Units |
| Single Unit, Detached | 122 | 76.7% |
| Single Unit, Attached | 0 | 0.0% |
| 2 Unit Apartments | 10 | 6.3% |
| 3 or 4 Unit Apartments | 13 | 8.2% |
| 5 to 9 Unit Apartments | 14 | 8.8% |
| 10 or more Apartments | 0 | 0.0% |
| Mobile Home / Other | 0 | 0.0% |
| Total | 159 | 100.0% |
Housing Structures by Occupancy in Websterville
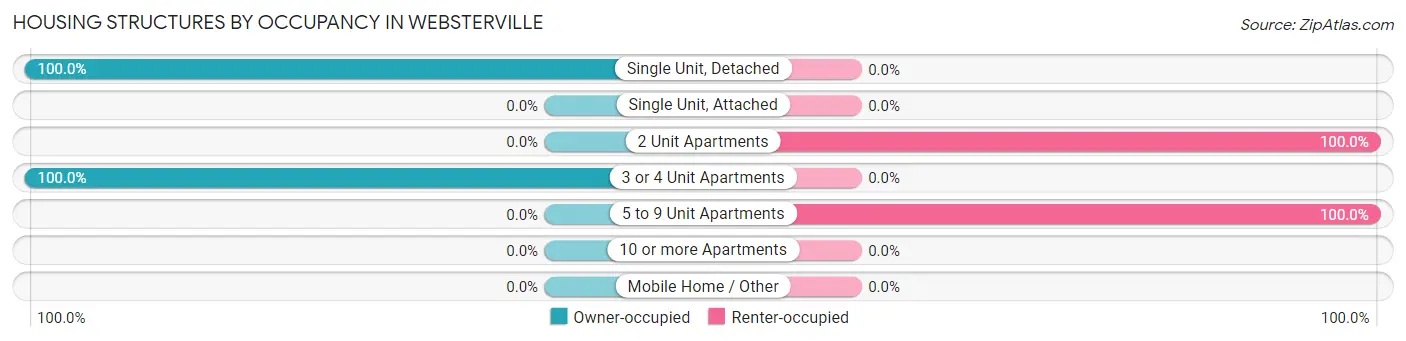
| Structure Type | Owner-occupied | Renter-occupied |
| Single Unit, Detached | 122 (100.0%) | 0 (0.0%) |
| Single Unit, Attached | 0 (0.0%) | 0 (0.0%) |
| 2 Unit Apartments | 0 (0.0%) | 10 (100.0%) |
| 3 or 4 Unit Apartments | 13 (100.0%) | 0 (0.0%) |
| 5 to 9 Unit Apartments | 0 (0.0%) | 14 (100.0%) |
| 10 or more Apartments | 0 (0.0%) | 0 (0.0%) |
| Mobile Home / Other | 0 (0.0%) | 0 (0.0%) |
| Total | 135 (84.9%) | 24 (15.1%) |
Housing Structures by Number of Rooms in Websterville
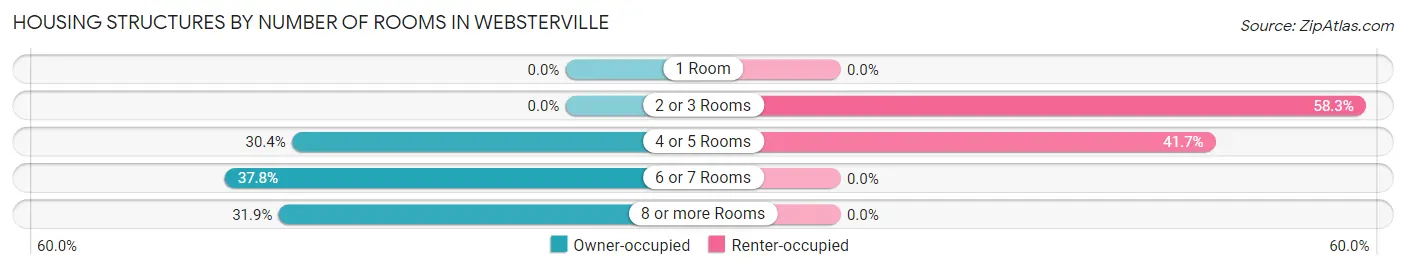
| Number of Rooms | Owner-occupied | Renter-occupied |
| 1 Room | 0 (0.0%) | 0 (0.0%) |
| 2 or 3 Rooms | 0 (0.0%) | 14 (58.3%) |
| 4 or 5 Rooms | 41 (30.4%) | 10 (41.7%) |
| 6 or 7 Rooms | 51 (37.8%) | 0 (0.0%) |
| 8 or more Rooms | 43 (31.9%) | 0 (0.0%) |
| Total | 135 (100.0%) | 24 (100.0%) |
Housing Structure by Heating Type in Websterville
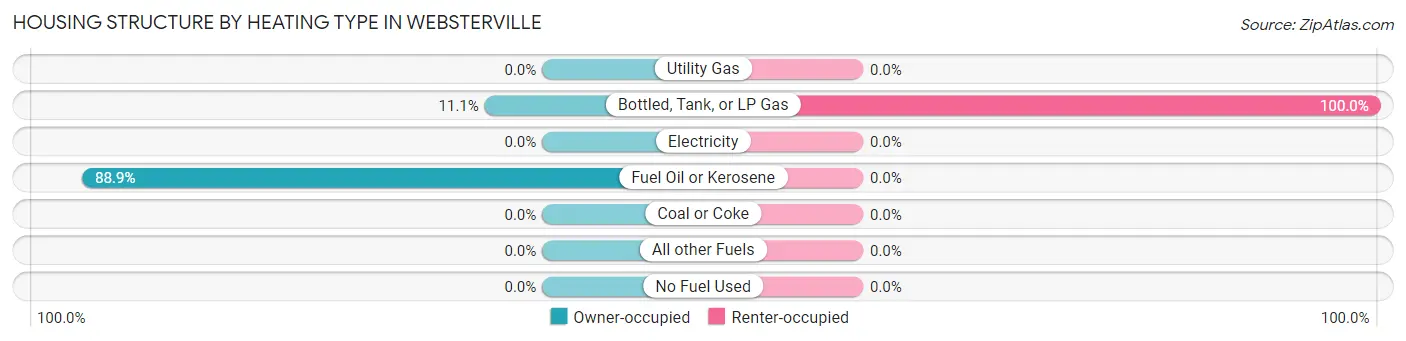
| Heating Type | Owner-occupied | Renter-occupied |
| Utility Gas | 0 (0.0%) | 0 (0.0%) |
| Bottled, Tank, or LP Gas | 15 (11.1%) | 24 (100.0%) |
| Electricity | 0 (0.0%) | 0 (0.0%) |
| Fuel Oil or Kerosene | 120 (88.9%) | 0 (0.0%) |
| Coal or Coke | 0 (0.0%) | 0 (0.0%) |
| All other Fuels | 0 (0.0%) | 0 (0.0%) |
| No Fuel Used | 0 (0.0%) | 0 (0.0%) |
| Total | 135 (100.0%) | 24 (100.0%) |
Household Vehicle Usage in Websterville
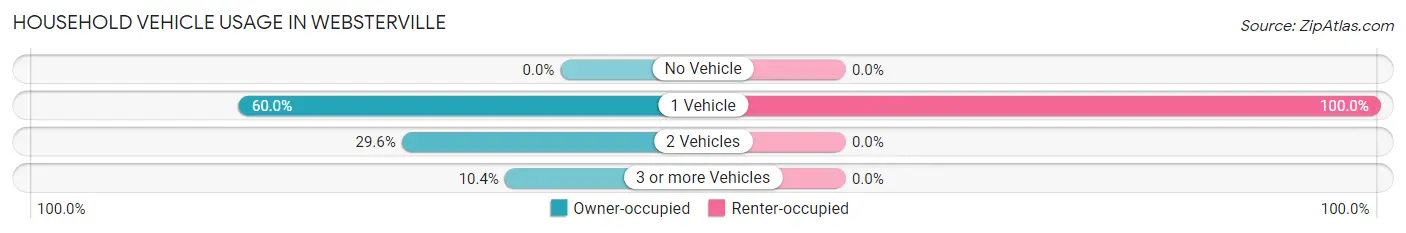
| Vehicles per Household | Owner-occupied | Renter-occupied |
| No Vehicle | 0 (0.0%) | 0 (0.0%) |
| 1 Vehicle | 81 (60.0%) | 24 (100.0%) |
| 2 Vehicles | 40 (29.6%) | 0 (0.0%) |
| 3 or more Vehicles | 14 (10.4%) | 0 (0.0%) |
| Total | 135 (100.0%) | 24 (100.0%) |
Real Estate & Mortgages in Websterville
Real Estate and Mortgage Overview in Websterville
| Characteristic | Without Mortgage | With Mortgage |
| Housing Units | 32 | 103 |
| Median Property Value | - | - |
| Median Household Income | - | - |
| Monthly Housing Costs | - | - |
| Real Estate Taxes | - | - |
Property Value by Mortgage Status in Websterville
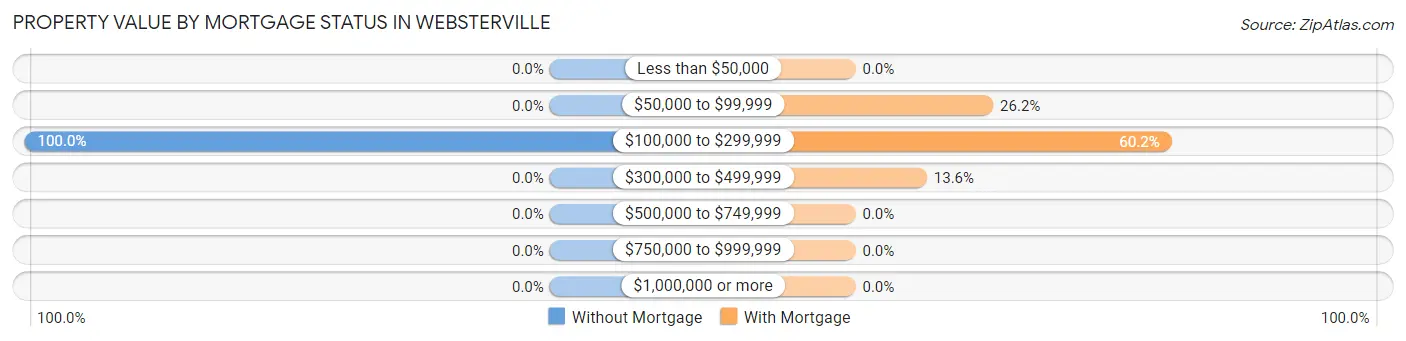
| Property Value | Without Mortgage | With Mortgage |
| Less than $50,000 | 0 (0.0%) | 0 (0.0%) |
| $50,000 to $99,999 | 0 (0.0%) | 27 (26.2%) |
| $100,000 to $299,999 | 32 (100.0%) | 62 (60.2%) |
| $300,000 to $499,999 | 0 (0.0%) | 14 (13.6%) |
| $500,000 to $749,999 | 0 (0.0%) | 0 (0.0%) |
| $750,000 to $999,999 | 0 (0.0%) | 0 (0.0%) |
| $1,000,000 or more | 0 (0.0%) | 0 (0.0%) |
| Total | 32 (100.0%) | 103 (100.0%) |
Household Income by Mortgage Status in Websterville
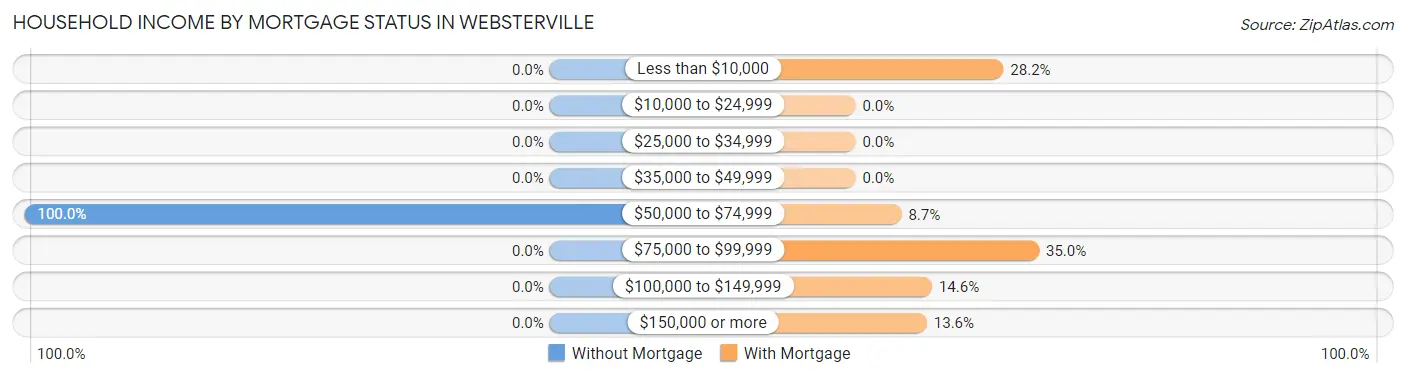
| Household Income | Without Mortgage | With Mortgage |
| Less than $10,000 | 0 (0.0%) | 29 (28.2%) |
| $10,000 to $24,999 | 0 (0.0%) | 0 (0.0%) |
| $25,000 to $34,999 | 0 (0.0%) | 0 (0.0%) |
| $35,000 to $49,999 | 0 (0.0%) | 0 (0.0%) |
| $50,000 to $74,999 | 32 (100.0%) | 9 (8.7%) |
| $75,000 to $99,999 | 0 (0.0%) | 36 (34.9%) |
| $100,000 to $149,999 | 0 (0.0%) | 15 (14.6%) |
| $150,000 or more | 0 (0.0%) | 14 (13.6%) |
| Total | 32 (100.0%) | 103 (100.0%) |
Property Value to Household Income Ratio in Websterville
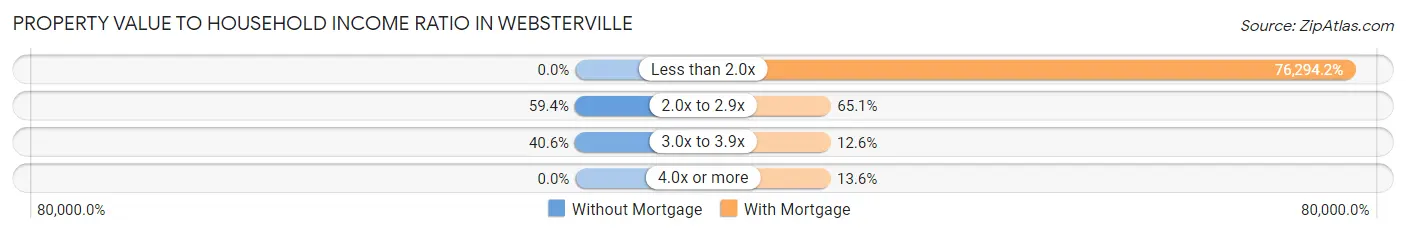
| Value-to-Income Ratio | Without Mortgage | With Mortgage |
| Less than 2.0x | 0 (0.0%) | 78,583 (76,294.2%) |
| 2.0x to 2.9x | 19 (59.4%) | 67 (65.0%) |
| 3.0x to 3.9x | 13 (40.6%) | 13 (12.6%) |
| 4.0x or more | 0 (0.0%) | 14 (13.6%) |
| Total | 32 (100.0%) | 103 (100.0%) |
Real Estate Taxes by Mortgage Status in Websterville
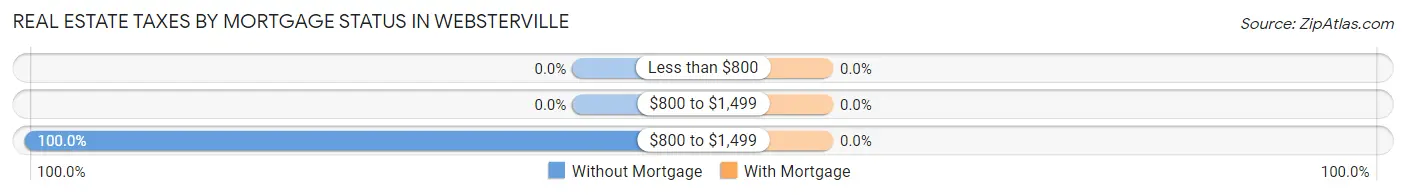
| Property Taxes | Without Mortgage | With Mortgage |
| Less than $800 | 0 (0.0%) | 0 (0.0%) |
| $800 to $1,499 | 0 (0.0%) | 0 (0.0%) |
| $800 to $1,499 | 32 (100.0%) | 0 (0.0%) |
| Total | 32 (100.0%) | 103 (100.0%) |
Health & Disability in Websterville
Health Insurance Coverage by Age in Websterville
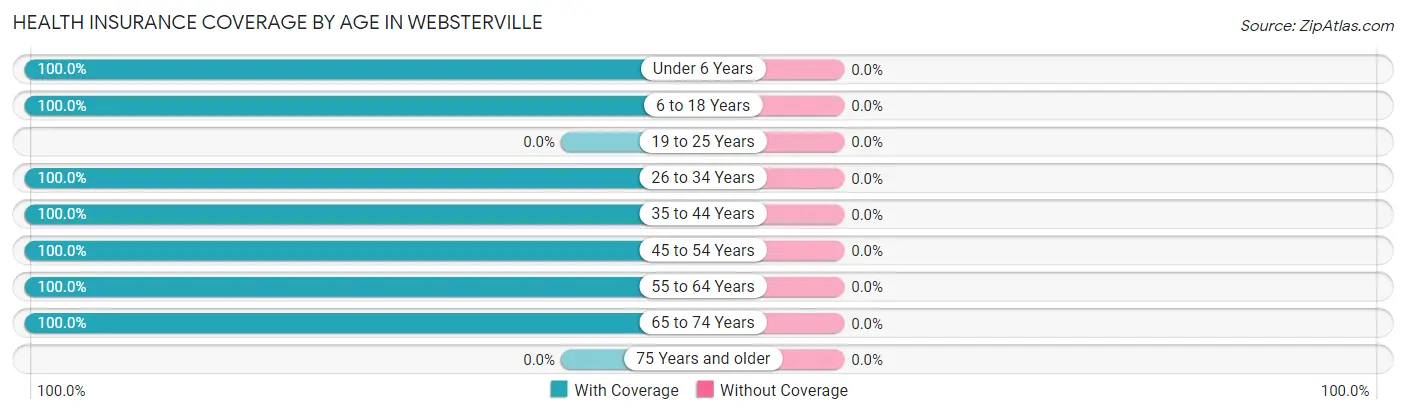
| Age Bracket | With Coverage | Without Coverage |
| Under 6 Years | 13 (100.0%) | 0 (0.0%) |
| 6 to 18 Years | 22 (100.0%) | 0 (0.0%) |
| 19 to 25 Years | 0 (0.0%) | 0 (0.0%) |
| 26 to 34 Years | 14 (100.0%) | 0 (0.0%) |
| 35 to 44 Years | 21 (100.0%) | 0 (0.0%) |
| 45 to 54 Years | 26 (100.0%) | 0 (0.0%) |
| 55 to 64 Years | 107 (100.0%) | 0 (0.0%) |
| 65 to 74 Years | 46 (100.0%) | 0 (0.0%) |
| 75 Years and older | 0 (0.0%) | 0 (0.0%) |
| Total | 249 (100.0%) | 0 (0.0%) |
Health Insurance Coverage by Citizenship Status in Websterville
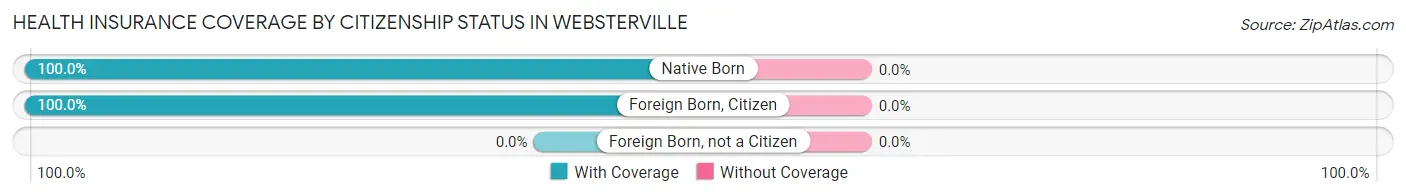
| Citizenship Status | With Coverage | Without Coverage |
| Native Born | 13 (100.0%) | 0 (0.0%) |
| Foreign Born, Citizen | 22 (100.0%) | 0 (0.0%) |
| Foreign Born, not a Citizen | 0 (0.0%) | 0 (0.0%) |
Health Insurance Coverage by Household Income in Websterville
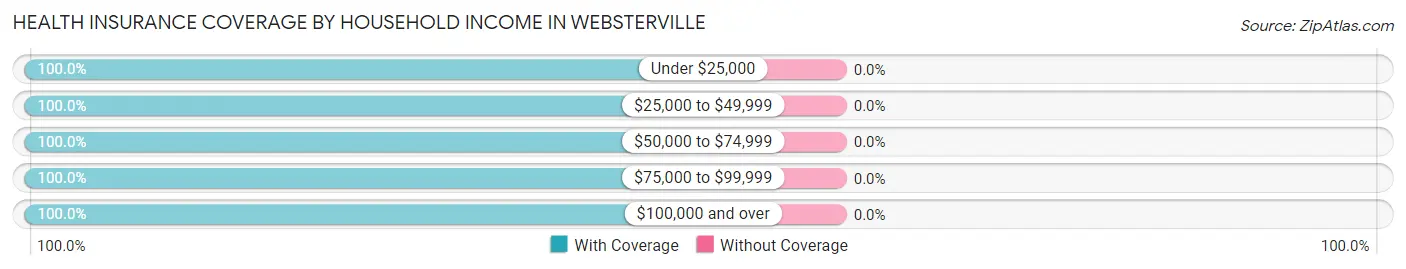
| Household Income | With Coverage | Without Coverage |
| Under $25,000 | 10 (100.0%) | 0 (0.0%) |
| $25,000 to $49,999 | 9 (100.0%) | 0 (0.0%) |
| $50,000 to $74,999 | 127 (100.0%) | 0 (0.0%) |
| $75,000 to $99,999 | 15 (100.0%) | 0 (0.0%) |
| $100,000 and over | 88 (100.0%) | 0 (0.0%) |
Public vs Private Health Insurance Coverage by Age in Websterville
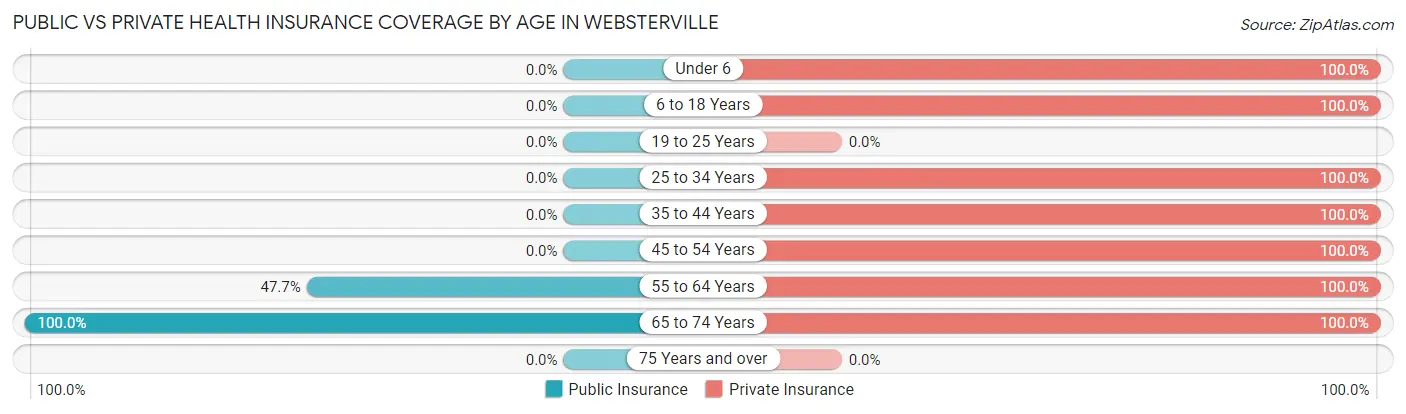
| Age Bracket | Public Insurance | Private Insurance |
| Under 6 | 0 (0.0%) | 13 (100.0%) |
| 6 to 18 Years | 0 (0.0%) | 22 (100.0%) |
| 19 to 25 Years | 0 (0.0%) | 0 (0.0%) |
| 25 to 34 Years | 0 (0.0%) | 14 (100.0%) |
| 35 to 44 Years | 0 (0.0%) | 21 (100.0%) |
| 45 to 54 Years | 0 (0.0%) | 26 (100.0%) |
| 55 to 64 Years | 51 (47.7%) | 107 (100.0%) |
| 65 to 74 Years | 46 (100.0%) | 46 (100.0%) |
| 75 Years and over | 0 (0.0%) | 0 (0.0%) |
| Total | 97 (39.0%) | 249 (100.0%) |
Disability Status by Sex by Age in Websterville
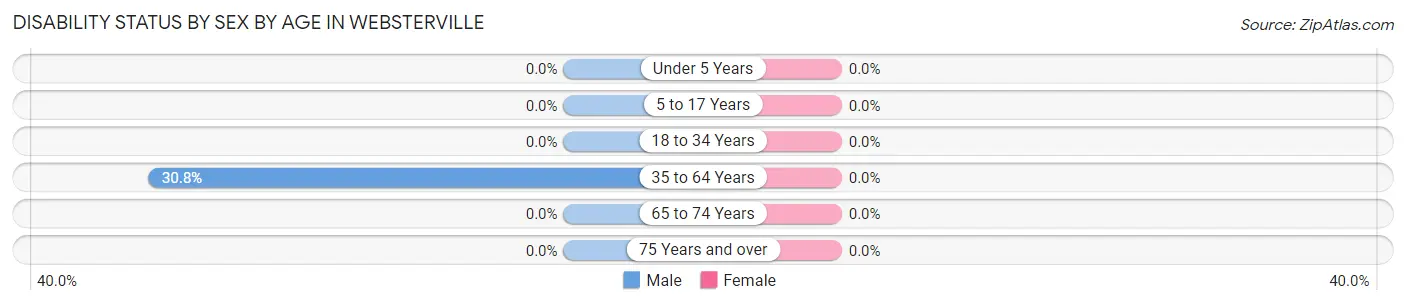
| Age Bracket | Male | Female |
| Under 5 Years | 0 (0.0%) | 0 (0.0%) |
| 5 to 17 Years | 0 (0.0%) | 0 (0.0%) |
| 18 to 34 Years | 0 (0.0%) | 0 (0.0%) |
| 35 to 64 Years | 32 (30.8%) | 0 (0.0%) |
| 65 to 74 Years | 0 (0.0%) | 0 (0.0%) |
| 75 Years and over | 0 (0.0%) | 0 (0.0%) |
Disability Class by Sex by Age in Websterville
Disability Class: Hearing Difficulty
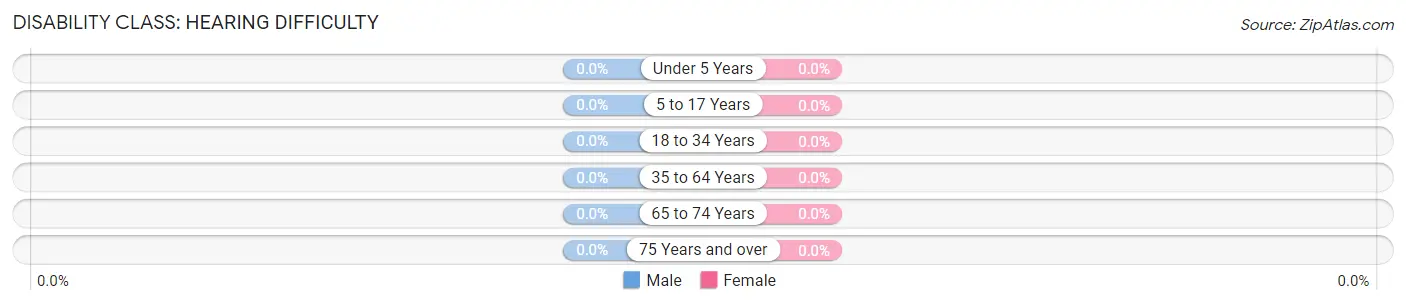
| Age Bracket | Male | Female |
| Under 5 Years | 0 (0.0%) | 0 (0.0%) |
| 5 to 17 Years | 0 (0.0%) | 0 (0.0%) |
| 18 to 34 Years | 0 (0.0%) | 0 (0.0%) |
| 35 to 64 Years | 0 (0.0%) | 0 (0.0%) |
| 65 to 74 Years | 0 (0.0%) | 0 (0.0%) |
| 75 Years and over | 0 (0.0%) | 0 (0.0%) |
Disability Class: Vision Difficulty
| Age Bracket | Male | Female |
| Under 5 Years | 0 (0.0%) | 0 (0.0%) |
| 5 to 17 Years | 0 (0.0%) | 0 (0.0%) |
| 18 to 34 Years | 0 (0.0%) | 0 (0.0%) |
| 35 to 64 Years | 0 (0.0%) | 0 (0.0%) |
| 65 to 74 Years | 0 (0.0%) | 0 (0.0%) |
| 75 Years and over | 0 (0.0%) | 0 (0.0%) |
Disability Class: Cognitive Difficulty
| Age Bracket | Male | Female |
| 5 to 17 Years | 0 (0.0%) | 0 (0.0%) |
| 18 to 34 Years | 0 (0.0%) | 0 (0.0%) |
| 35 to 64 Years | 0 (0.0%) | 0 (0.0%) |
| 65 to 74 Years | 0 (0.0%) | 0 (0.0%) |
| 75 Years and over | 0 (0.0%) | 0 (0.0%) |
Disability Class: Ambulatory Difficulty
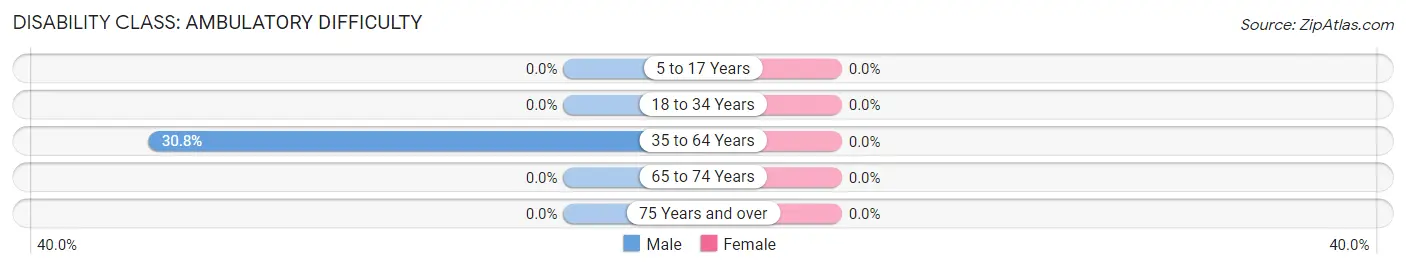
| Age Bracket | Male | Female |
| 5 to 17 Years | 0 (0.0%) | 0 (0.0%) |
| 18 to 34 Years | 0 (0.0%) | 0 (0.0%) |
| 35 to 64 Years | 32 (30.8%) | 0 (0.0%) |
| 65 to 74 Years | 0 (0.0%) | 0 (0.0%) |
| 75 Years and over | 0 (0.0%) | 0 (0.0%) |
Disability Class: Self-Care Difficulty
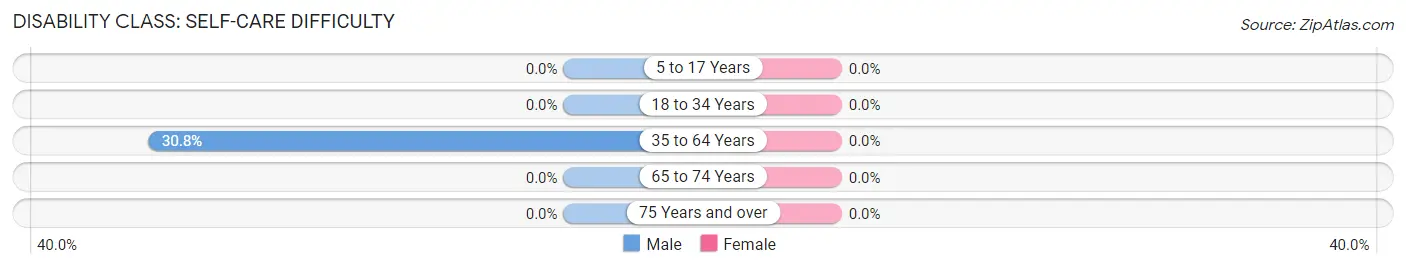
| Age Bracket | Male | Female |
| 5 to 17 Years | 0 (0.0%) | 0 (0.0%) |
| 18 to 34 Years | 0 (0.0%) | 0 (0.0%) |
| 35 to 64 Years | 32 (30.8%) | 0 (0.0%) |
| 65 to 74 Years | 0 (0.0%) | 0 (0.0%) |
| 75 Years and over | 0 (0.0%) | 0 (0.0%) |
Technology Access in Websterville
Computing Device Access in Websterville
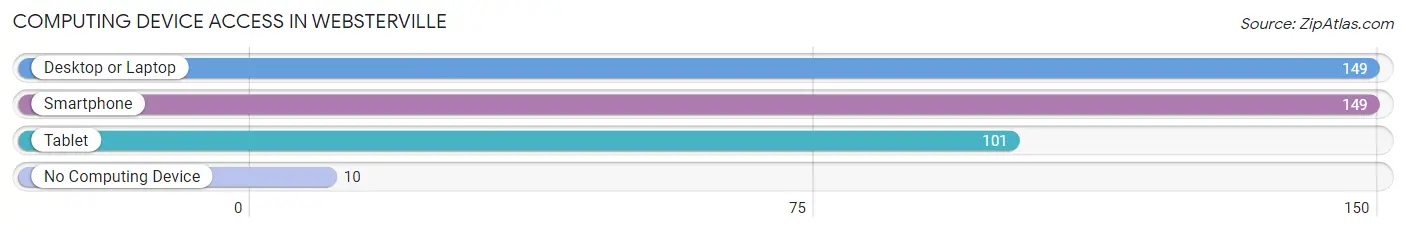
| Device Type | # Households | % Households |
| Desktop or Laptop | 149 | 93.7% |
| Smartphone | 149 | 93.7% |
| Tablet | 101 | 63.5% |
| No Computing Device | 10 | 6.3% |
| Total | 159 | 100.0% |
Internet Access in Websterville
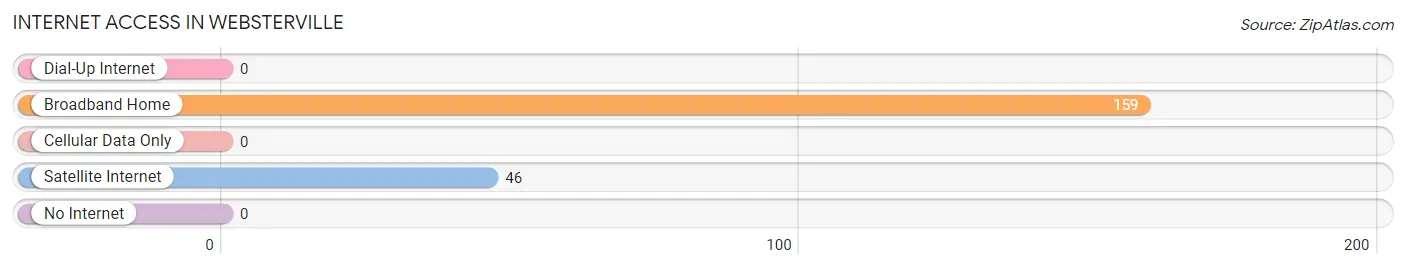
| Internet Type | # Households | % Households |
| Dial-Up Internet | 0 | 0.0% |
| Broadband Home | 159 | 100.0% |
| Cellular Data Only | 0 | 0.0% |
| Satellite Internet | 46 | 28.9% |
| No Internet | 0 | 0.0% |
| Total | 159 | 100.0% |
Websterville Summary
Websterville is a small town located in the state of Vermont in the United States. It is situated in the Lamoille County, and is part of the larger Lamoille Valley region. The town has a population of around 1,000 people, and is located in the foothills of the Green Mountains.
Geography
Websterville is located in the Lamoille Valley region of Vermont, and is situated in the foothills of the Green Mountains. The town is located in the northern part of the state, and is bordered by the towns of Johnson, Hyde Park, and Morristown. The town is situated on the Lamoille River, and is surrounded by rolling hills and forests. The town is located at an elevation of around 1,000 feet, and has a total area of around 4.5 square miles.
History
Websterville was first settled in 1790 by a group of settlers from Massachusetts. The town was named after the first settler, John Webber, who was a Revolutionary War veteran. The town was originally a farming community, and the settlers grew crops such as corn, wheat, and potatoes. The town also had a sawmill and a gristmill, which were used to process the crops.
In the late 19th century, the town began to develop into a small industrial center. The town had several factories, including a paper mill, a woolen mill, and a shoe factory. The town also had a railroad station, which connected the town to the larger cities in the region.
Economy
The economy of Websterville is largely based on agriculture and tourism. The town is home to several farms, which produce a variety of crops, including corn, wheat, and potatoes. The town also has several small businesses, including restaurants, shops, and a few small manufacturing companies.
The town is also a popular tourist destination, and is home to several attractions, including the Lamoille Valley Rail Trail, which is a popular hiking and biking trail. The town also has several historic sites, including the Websterville Historic District, which is listed on the National Register of Historic Places.
Demographics
As of the 2010 census, the population of Websterville was 1,000 people. The town has a population density of around 222 people per square mile. The median age of the population is around 44 years old, and the median household income is around $50,000. The town is predominantly white, with around 95% of the population being white. The town also has a small Hispanic population, with around 4% of the population being Hispanic.
Common Questions
What is Per Capita Income in Websterville?
Per Capita income in Websterville is $53,525.
What is the Median Family Income in Websterville?
Median Family Income in Websterville is $167,672.
What is the Median Household income in Websterville?
Median Household Income in Websterville is $70,313.
What is Inequality or Gini Index in Websterville?
Inequality or Gini Index in Websterville is 0.27.
What is the Total Population of Websterville?
Total Population of Websterville is 249.
What is the Total Male Population of Websterville?
Total Male Population of Websterville is 132.
What is the Total Female Population of Websterville?
Total Female Population of Websterville is 117.
What is the Ratio of Males per 100 Females in Websterville?
There are 112.82 Males per 100 Females in Websterville.
What is the Ratio of Females per 100 Males in Websterville?
There are 88.64 Females per 100 Males in Websterville.
What is the Median Population Age in Websterville?
Median Population Age in Websterville is 56.9 Years.
What is the Average Family Size in Websterville
Average Family Size in Websterville is 2.7 People.
What is the Average Household Size in Websterville
Average Household Size in Websterville is 1.6 People.
How Large is the Labor Force in Websterville?
There are 153 People in the Labor Forcein in Websterville.
What is the Percentage of People in the Labor Force in Websterville?
71.5% of People are in the Labor Force in Websterville.