Montpelier, VT Map & Demographics
Montpelier Map
Montpelier Overview
$48,616
PER CAPITA INCOME
$112,216
AVG FAMILY INCOME
$76,143
AVG HOUSEHOLD INCOME
13.9%
WAGE / INCOME GAP [ % ]
86.1¢/ $1
WAGE / INCOME GAP [ $ ]
0.41
INEQUALITY / GINI INDEX
8,030
TOTAL POPULATION
3,515
MALE POPULATION
4,515
FEMALE POPULATION
77.85
MALES / 100 FEMALES
128.45
FEMALES / 100 MALES
44.0
MEDIAN AGE
2.8
AVG FAMILY SIZE
2.1
AVG HOUSEHOLD SIZE
4,640
LABOR FORCE [ PEOPLE ]
67.8%
PERCENT IN LABOR FORCE
3.0%
UNEMPLOYMENT RATE
Montpelier Zip Codes
Montpelier Area Codes
Income in Montpelier
Income Overview in Montpelier
Per Capita Income in Montpelier is $48,616, while median incomes of families and households are $112,216 and $76,143 respectively.
| Characteristic | Number | Measure |
| Per Capita Income | 8,030 | $48,616 |
| Median Family Income | 1,841 | $112,216 |
| Mean Family Income | 1,841 | $133,529 |
| Median Household Income | 3,861 | $76,143 |
| Mean Household Income | 3,861 | $98,855 |
| Income Deficit | 1,841 | $0 |
| Wage / Income Gap (%) | 8,030 | 13.93% |
| Wage / Income Gap ($) | 8,030 | 86.07¢ per $1 |
| Gini / Inequality Index | 8,030 | 0.41 |
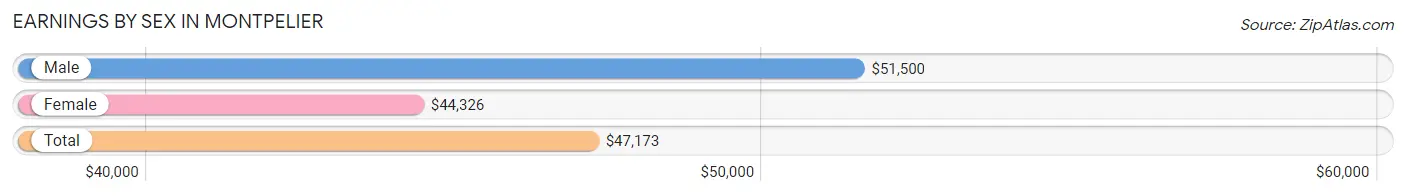
Earnings by Sex in Montpelier
Average Earnings in Montpelier are $47,173, $51,500 for men and $44,326 for women, a difference of 13.9%.
| Sex | Number | Average Earnings |
| Male | 2,320 (47.2%) | $51,500 |
| Female | 2,599 (52.8%) | $44,326 |
| Total | 4,919 (100.0%) | $47,173 |
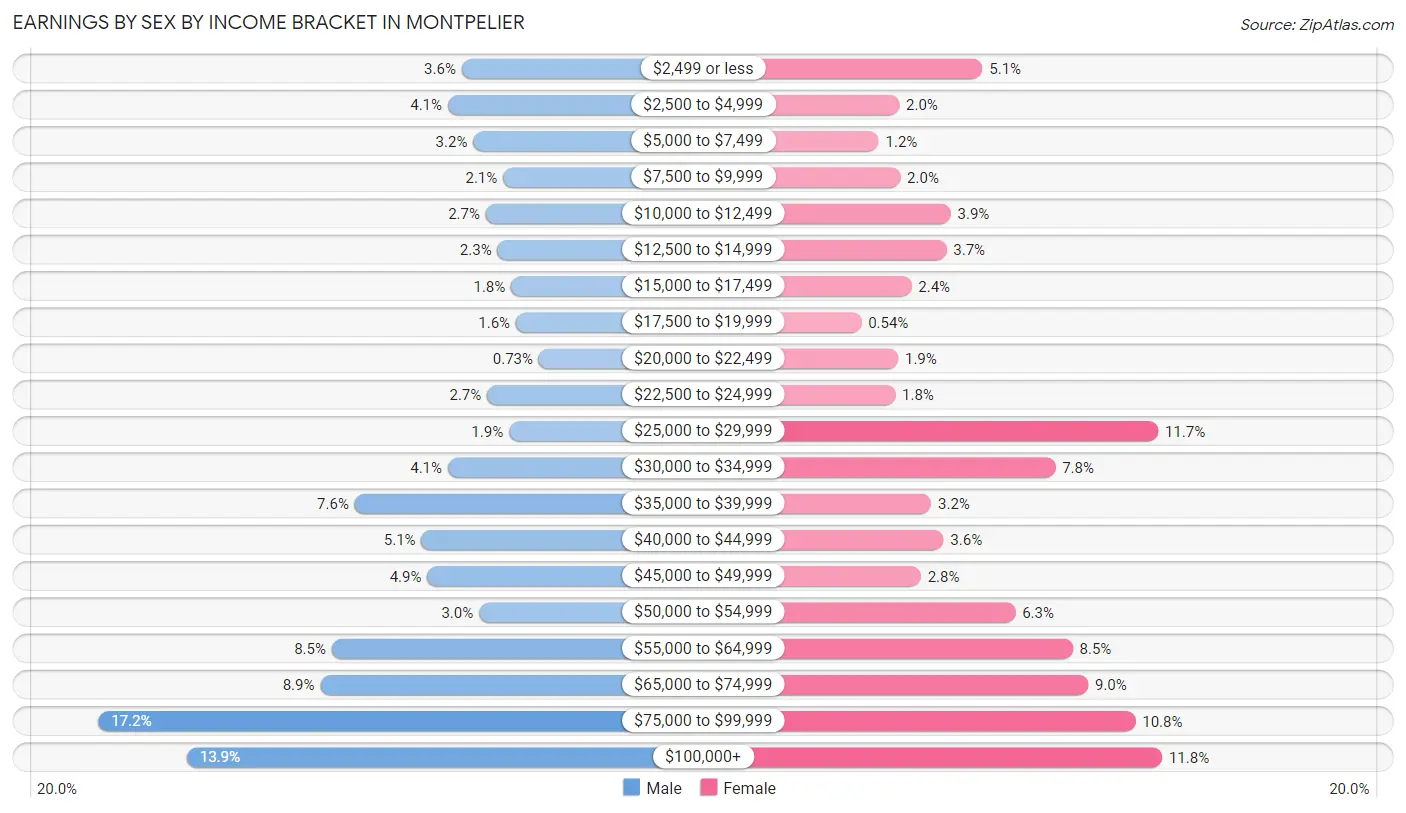
Earnings by Sex by Income Bracket in Montpelier
The most common earnings brackets in Montpelier are $75,000 to $99,999 for men (400 | 17.2%) and $100,000+ for women (307 | 11.8%).
| Income | Male | Female |
| $2,499 or less | 84 (3.6%) | 132 (5.1%) |
| $2,500 to $4,999 | 96 (4.1%) | 51 (2.0%) |
| $5,000 to $7,499 | 74 (3.2%) | 31 (1.2%) |
| $7,500 to $9,999 | 48 (2.1%) | 52 (2.0%) |
| $10,000 to $12,499 | 63 (2.7%) | 101 (3.9%) |
| $12,500 to $14,999 | 53 (2.3%) | 97 (3.7%) |
| $15,000 to $17,499 | 41 (1.8%) | 63 (2.4%) |
| $17,500 to $19,999 | 37 (1.6%) | 14 (0.5%) |
| $20,000 to $22,499 | 17 (0.7%) | 50 (1.9%) |
| $22,500 to $24,999 | 62 (2.7%) | 47 (1.8%) |
| $25,000 to $29,999 | 43 (1.8%) | 303 (11.7%) |
| $30,000 to $34,999 | 96 (4.1%) | 203 (7.8%) |
| $35,000 to $39,999 | 177 (7.6%) | 82 (3.2%) |
| $40,000 to $44,999 | 119 (5.1%) | 94 (3.6%) |
| $45,000 to $49,999 | 114 (4.9%) | 72 (2.8%) |
| $50,000 to $54,999 | 69 (3.0%) | 164 (6.3%) |
| $55,000 to $64,999 | 197 (8.5%) | 220 (8.5%) |
| $65,000 to $74,999 | 207 (8.9%) | 235 (9.0%) |
| $75,000 to $99,999 | 400 (17.2%) | 281 (10.8%) |
| $100,000+ | 323 (13.9%) | 307 (11.8%) |
| Total | 2,320 (100.0%) | 2,599 (100.0%) |
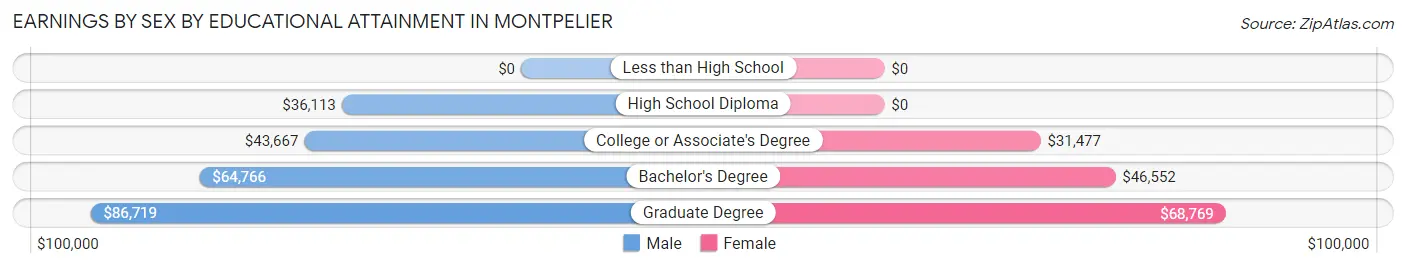
Earnings by Sex by Educational Attainment in Montpelier
Average earnings in Montpelier are $62,396 for men and $50,223 for women, a difference of 19.5%. Men with an educational attainment of graduate degree enjoy the highest average annual earnings of $86,719, while those with high school diploma education earn the least with $36,113. Women with an educational attainment of graduate degree earn the most with the average annual earnings of $68,769, while those with college or associate's degree education have the smallest earnings of $31,477.
| Educational Attainment | Male Income | Female Income |
| Less than High School | - | - |
| High School Diploma | $36,113 | $0 |
| College or Associate's Degree | $43,667 | $31,477 |
| Bachelor's Degree | $64,766 | $46,552 |
| Graduate Degree | $86,719 | $68,769 |
| Total | $62,396 | $50,223 |
Family Income in Montpelier
Family Income Brackets in Montpelier
According to the Montpelier family income data, there are 481 families falling into the $100,000 to $149,999 income range, which is the most common income bracket and makes up 26.1% of all families. Conversely, the $10,000 to $14,999 income bracket is the least frequent group with only 13 families (0.7%) belonging to this category.
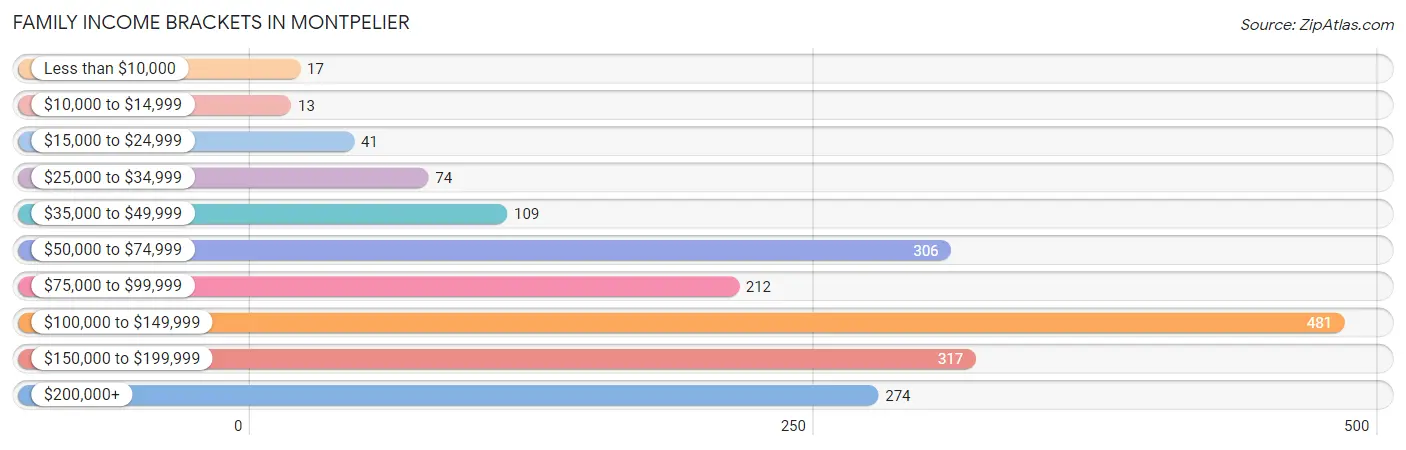
| Income Bracket | # Families | % Families |
| Less than $10,000 | 17 | 0.9% |
| $10,000 to $14,999 | 13 | 0.7% |
| $15,000 to $24,999 | 41 | 2.2% |
| $25,000 to $34,999 | 74 | 4.0% |
| $35,000 to $49,999 | 109 | 5.9% |
| $50,000 to $74,999 | 306 | 16.6% |
| $75,000 to $99,999 | 212 | 11.5% |
| $100,000 to $149,999 | 481 | 26.1% |
| $150,000 to $199,999 | 317 | 17.2% |
| $200,000+ | 274 | 14.9% |
Family Income by Famaliy Size in Montpelier
4-person families (333 | 18.1%) account for the highest median family income in Montpelier with $141,685 per family, while 2-person families (1,120 | 60.8%) have the highest median income of $50,268 per family member.
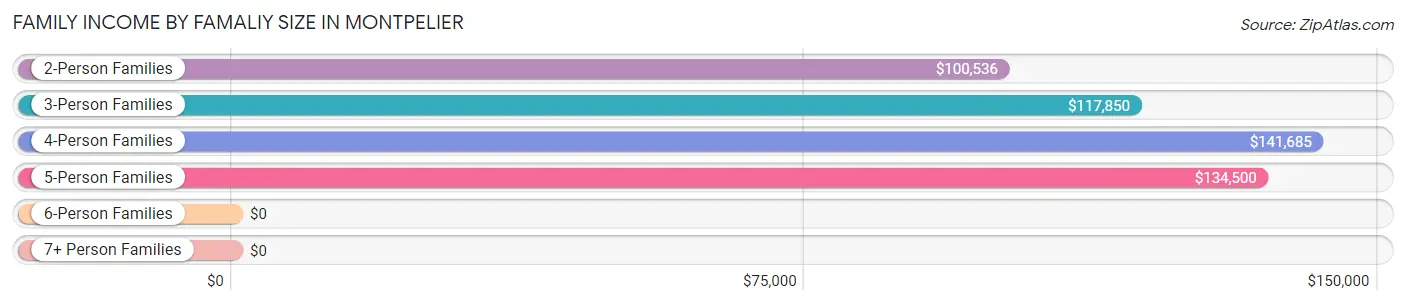
| Income Bracket | # Families | Median Income |
| 2-Person Families | 1,120 (60.8%) | $100,536 |
| 3-Person Families | 320 (17.4%) | $117,850 |
| 4-Person Families | 333 (18.1%) | $141,685 |
| 5-Person Families | 38 (2.1%) | $134,500 |
| 6-Person Families | 30 (1.6%) | $0 |
| 7+ Person Families | 0 (0.0%) | $0 |
| Total | 1,841 (100.0%) | $112,216 |
Family Income by Number of Earners in Montpelier
The median family income in Montpelier is $112,216, with families comprising 3+ earners (123) having the highest median family income of $158,472, while families with 1 earner (459) have the lowest median family income of $71,688, accounting for 6.7% and 24.9% of families, respectively.
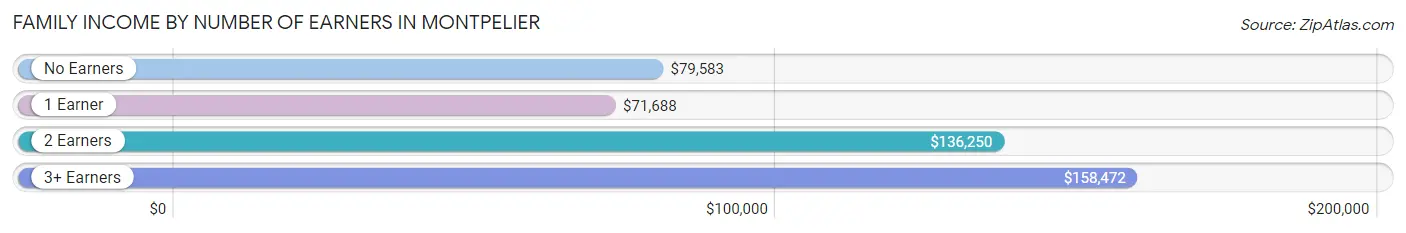
| Number of Earners | # Families | Median Income |
| No Earners | 311 (16.9%) | $79,583 |
| 1 Earner | 459 (24.9%) | $71,688 |
| 2 Earners | 948 (51.5%) | $136,250 |
| 3+ Earners | 123 (6.7%) | $158,472 |
| Total | 1,841 (100.0%) | $112,216 |
Household Income in Montpelier
Household Income Brackets in Montpelier
With 776 households falling in the category, the $100,000 to $149,999 income range is the most frequent in Montpelier, accounting for 20.1% of all households. In contrast, only 54 households (1.4%) fall into the less than $10,000 income bracket, making it the least populous group.
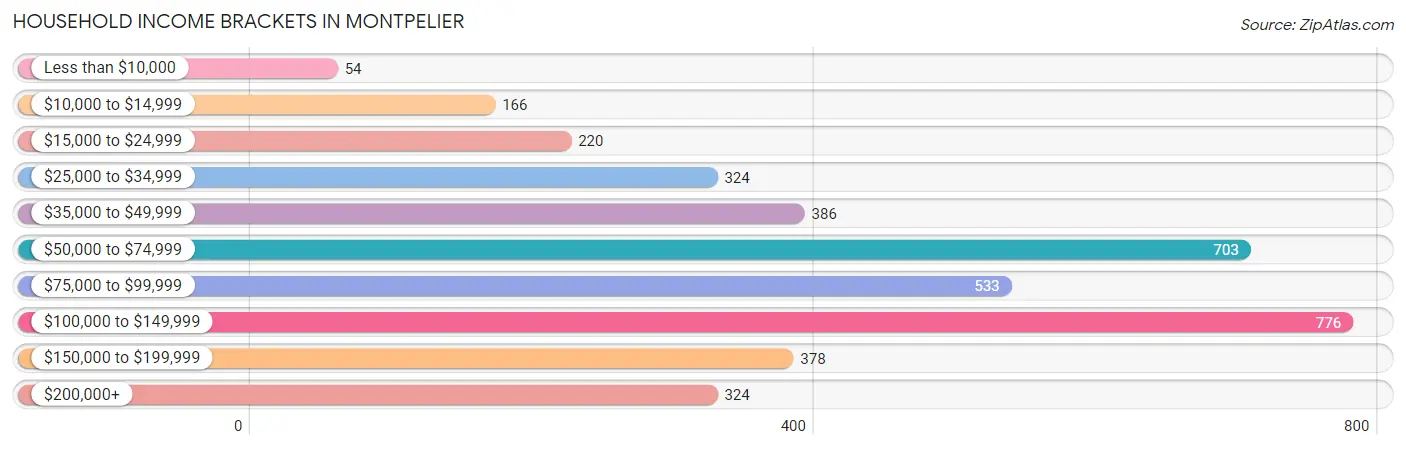
| Income Bracket | # Households | % Households |
| Less than $10,000 | 54 | 1.4% |
| $10,000 to $14,999 | 166 | 4.3% |
| $15,000 to $24,999 | 220 | 5.7% |
| $25,000 to $34,999 | 324 | 8.4% |
| $35,000 to $49,999 | 386 | 10.0% |
| $50,000 to $74,999 | 703 | 18.2% |
| $75,000 to $99,999 | 533 | 13.8% |
| $100,000 to $149,999 | 776 | 20.1% |
| $150,000 to $199,999 | 378 | 9.8% |
| $200,000+ | 324 | 8.4% |
Household Income by Householder Age in Montpelier
The median household income in Montpelier is $76,143, with the highest median household income of $95,101 found in the 45 to 64 years age bracket for the primary householder. A total of 1,315 households (34.1%) fall into this category. Meanwhile, the 65+ years age bracket for the primary householder has the lowest median household income of $61,688, with 1,237 households (32.0%) in this group.
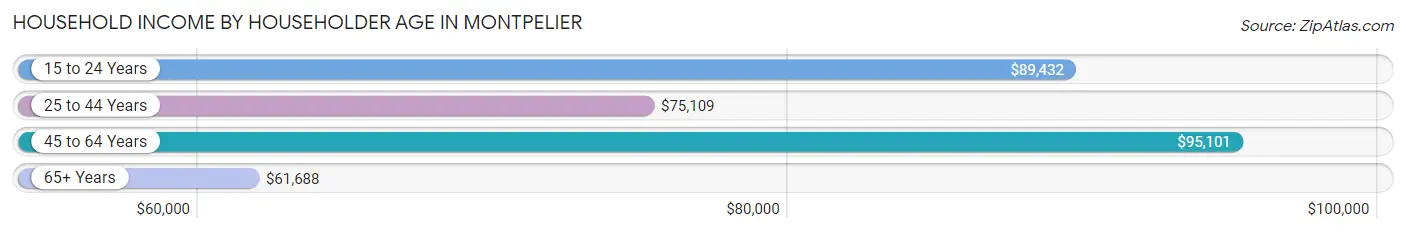
| Income Bracket | # Households | Median Income |
| 15 to 24 Years | 39 (1.0%) | $89,432 |
| 25 to 44 Years | 1,270 (32.9%) | $75,109 |
| 45 to 64 Years | 1,315 (34.1%) | $95,101 |
| 65+ Years | 1,237 (32.0%) | $61,688 |
| Total | 3,861 (100.0%) | $76,143 |
Poverty in Montpelier
Income Below Poverty by Sex and Age in Montpelier
With 5.6% poverty level for males and 7.1% for females among the residents of Montpelier, 5 year old males and 15 year old females are the most vulnerable to poverty, with 13 males (100.0%) and 16 females (19.5%) in their respective age groups living below the poverty level.
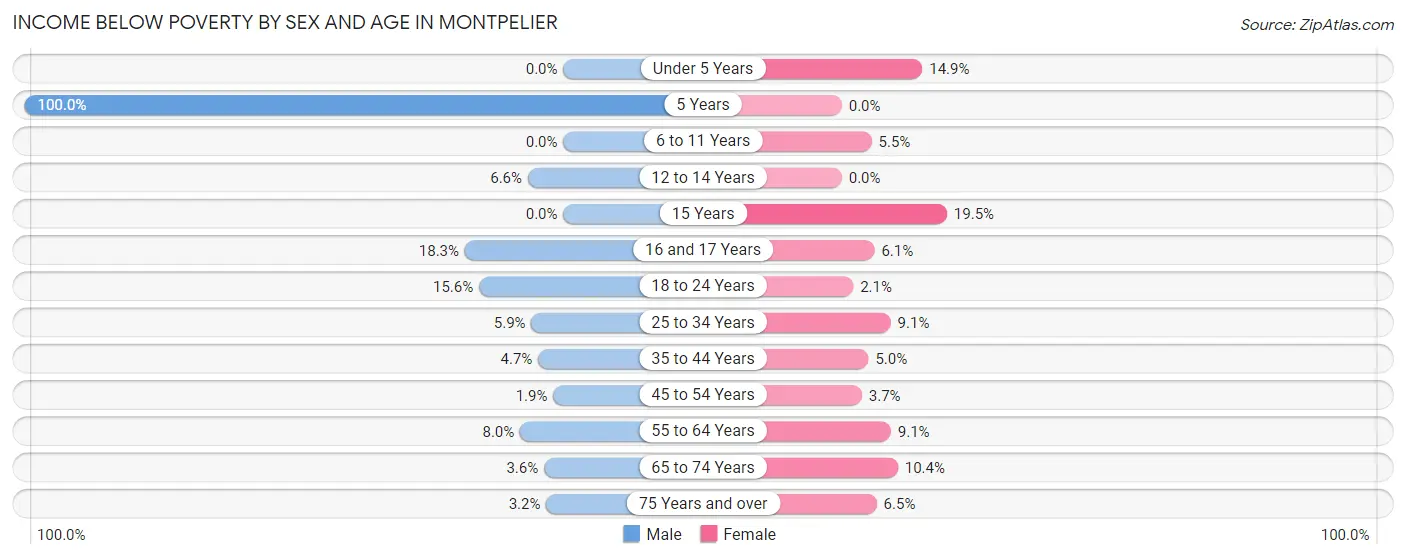
| Age Bracket | Male | Female |
| Under 5 Years | 0 (0.0%) | 13 (14.9%) |
| 5 Years | 13 (100.0%) | 0 (0.0%) |
| 6 to 11 Years | 0 (0.0%) | 13 (5.5%) |
| 12 to 14 Years | 6 (6.6%) | 0 (0.0%) |
| 15 Years | 0 (0.0%) | 16 (19.5%) |
| 16 and 17 Years | 17 (18.3%) | 6 (6.1%) |
| 18 to 24 Years | 48 (15.6%) | 4 (2.1%) |
| 25 to 34 Years | 30 (5.9%) | 70 (9.1%) |
| 35 to 44 Years | 22 (4.7%) | 25 (5.0%) |
| 45 to 54 Years | 10 (1.9%) | 24 (3.7%) |
| 55 to 64 Years | 26 (8.0%) | 49 (9.1%) |
| 65 to 74 Years | 19 (3.6%) | 62 (10.4%) |
| 75 Years and over | 6 (3.2%) | 33 (6.5%) |
| Total | 197 (5.6%) | 315 (7.1%) |
Income Above Poverty by Sex and Age in Montpelier
According to the poverty statistics in Montpelier, males aged under 5 years and females aged 5 years are the age groups that are most secure financially, with 100.0% of males and 100.0% of females in these age groups living above the poverty line.
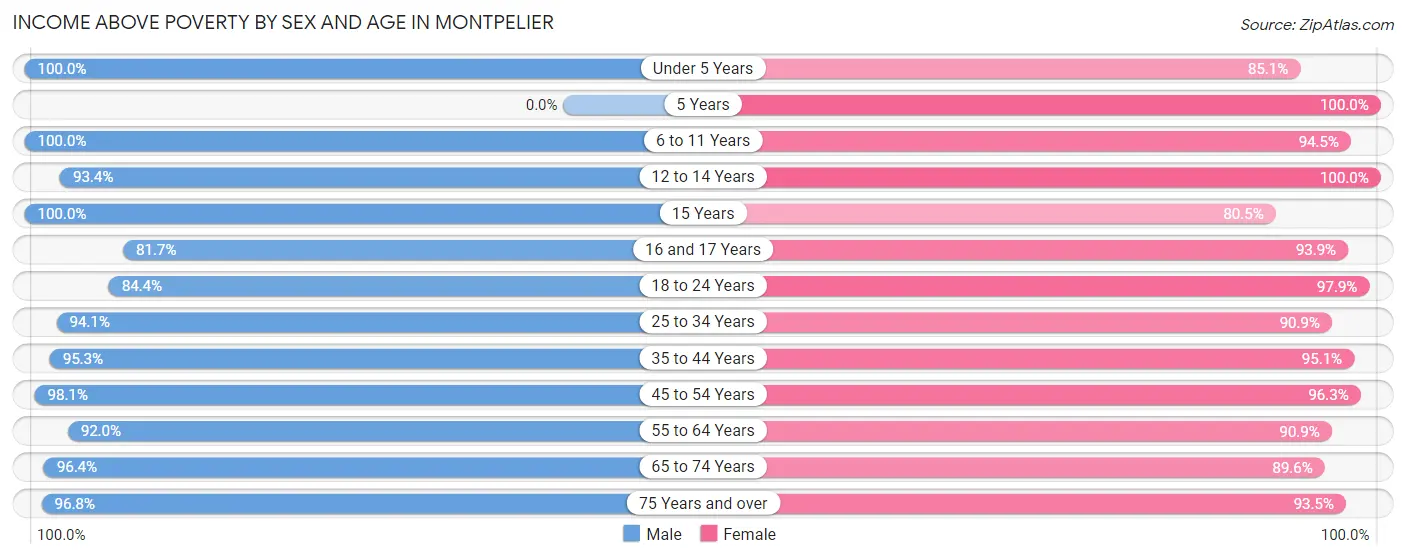
| Age Bracket | Male | Female |
| Under 5 Years | 93 (100.0%) | 74 (85.1%) |
| 5 Years | 0 (0.0%) | 32 (100.0%) |
| 6 to 11 Years | 294 (100.0%) | 222 (94.5%) |
| 12 to 14 Years | 85 (93.4%) | 168 (100.0%) |
| 15 Years | 67 (100.0%) | 66 (80.5%) |
| 16 and 17 Years | 76 (81.7%) | 93 (93.9%) |
| 18 to 24 Years | 259 (84.4%) | 185 (97.9%) |
| 25 to 34 Years | 476 (94.1%) | 702 (90.9%) |
| 35 to 44 Years | 448 (95.3%) | 480 (95.1%) |
| 45 to 54 Years | 527 (98.1%) | 619 (96.3%) |
| 55 to 64 Years | 298 (92.0%) | 489 (90.9%) |
| 65 to 74 Years | 511 (96.4%) | 534 (89.6%) |
| 75 Years and over | 184 (96.8%) | 477 (93.5%) |
| Total | 3,318 (94.4%) | 4,141 (92.9%) |
Income Below Poverty Among Married-Couple Families in Montpelier
The poverty statistics for married-couple families in Montpelier show that 0.4% or 5 of the total 1,363 families live below the poverty line. Families with no children have the highest poverty rate of 0.6%, comprising of 5 families. On the other hand, families with 1 or 2 children have the lowest poverty rate of 0.0%, which includes 0 families.
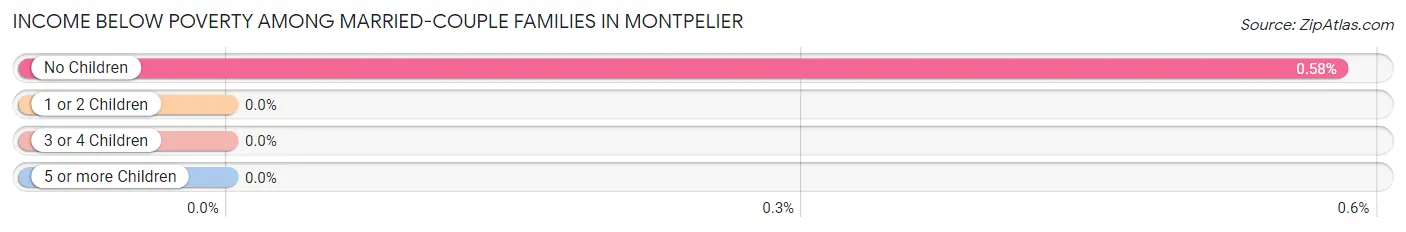
| Children | Above Poverty | Below Poverty |
| No Children | 862 (99.4%) | 5 (0.6%) |
| 1 or 2 Children | 439 (100.0%) | 0 (0.0%) |
| 3 or 4 Children | 57 (100.0%) | 0 (0.0%) |
| 5 or more Children | 0 (0.0%) | 0 (0.0%) |
| Total | 1,358 (99.6%) | 5 (0.4%) |
Income Below Poverty Among Single-Parent Households in Montpelier
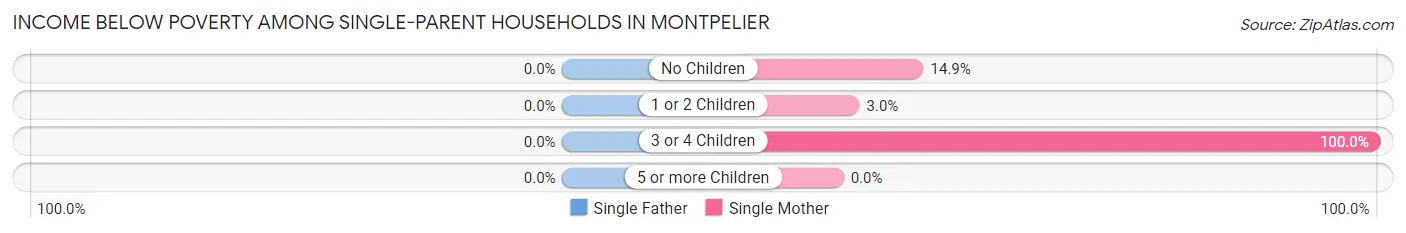
| Children | Single Father | Single Mother |
| No Children | 0 (0.0%) | 18 (14.9%) |
| 1 or 2 Children | 0 (0.0%) | 7 (3.0%) |
| 3 or 4 Children | 0 (0.0%) | 9 (100.0%) |
| 5 or more Children | 0 (0.0%) | 0 (0.0%) |
| Total | 0 (0.0%) | 34 (9.3%) |
Income Below Poverty Among Married-Couple vs Single-Parent Households in Montpelier
The poverty data for Montpelier shows that 5 of the married-couple family households (0.4%) and 34 of the single-parent households (7.1%) are living below the poverty level. Within the married-couple family households, those with no children have the highest poverty rate, with 5 households (0.6%) falling below the poverty line. Among the single-parent households, those with 3 or 4 children have the highest poverty rate, with 9 household (100.0%) living below poverty.
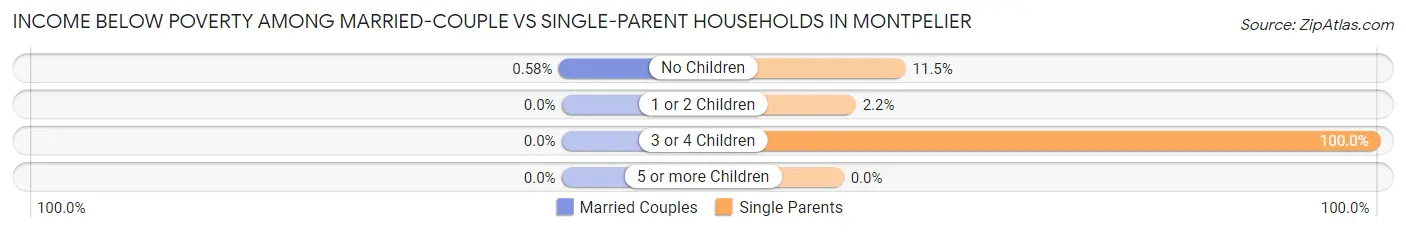
| Children | Married-Couple Families | Single-Parent Households |
| No Children | 5 (0.6%) | 18 (11.5%) |
| 1 or 2 Children | 0 (0.0%) | 7 (2.2%) |
| 3 or 4 Children | 0 (0.0%) | 9 (100.0%) |
| 5 or more Children | 0 (0.0%) | 0 (0.0%) |
| Total | 5 (0.4%) | 34 (7.1%) |
Race in Montpelier
The most populous races in Montpelier are White / Caucasian (7,354 | 91.6%), Two or more Races (426 | 5.3%), and Hispanic or Latino (234 | 2.9%).
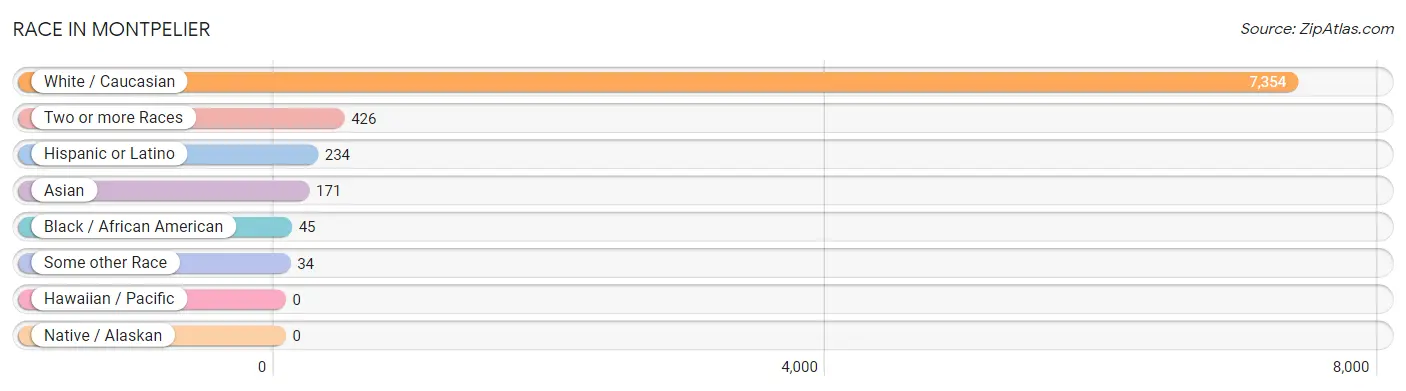
| Race | # Population | % Population |
| Asian | 171 | 2.1% |
| Black / African American | 45 | 0.6% |
| Hawaiian / Pacific | 0 | 0.0% |
| Hispanic or Latino | 234 | 2.9% |
| Native / Alaskan | 0 | 0.0% |
| White / Caucasian | 7,354 | 91.6% |
| Two or more Races | 426 | 5.3% |
| Some other Race | 34 | 0.4% |
| Total | 8,030 | 100.0% |
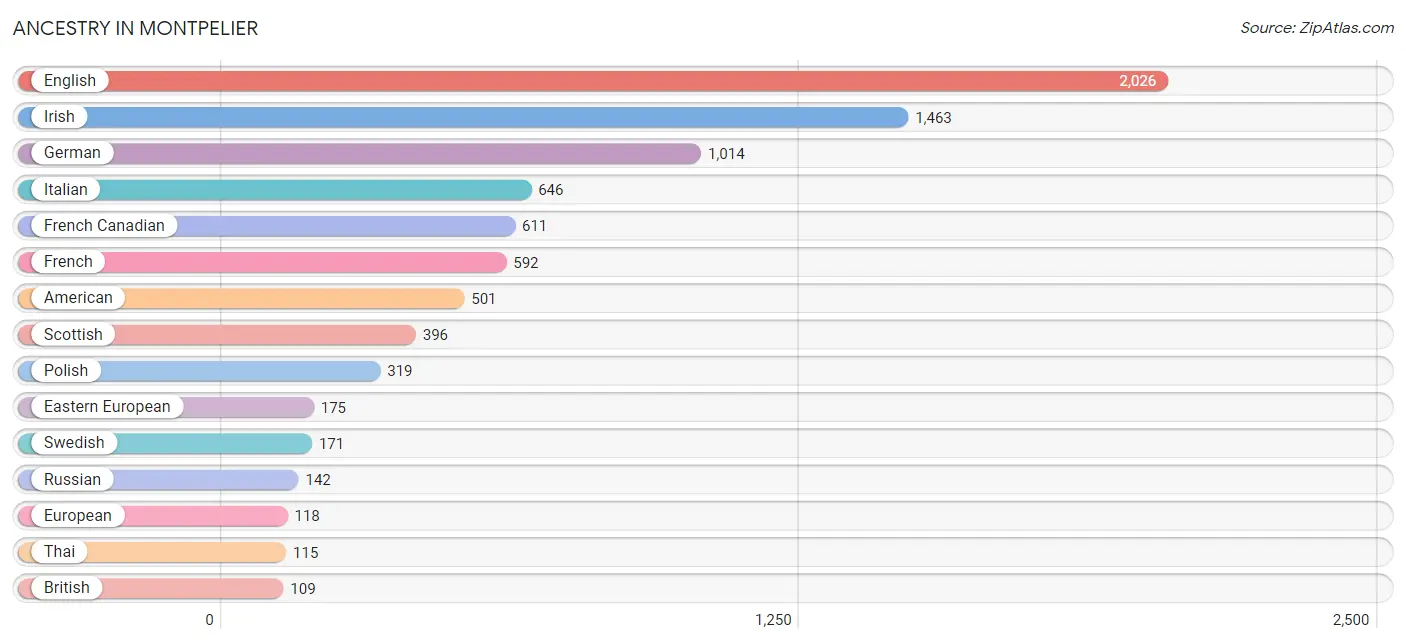
Ancestry in Montpelier
The most populous ancestries reported in Montpelier are English (2,026 | 25.2%), Irish (1,463 | 18.2%), German (1,014 | 12.6%), Italian (646 | 8.0%), and French Canadian (611 | 7.6%), together accounting for 71.7% of all Montpelier residents.
| Ancestry | # Population | % Population |
| African | 2 | 0.0% |
| American | 501 | 6.2% |
| Arab | 27 | 0.3% |
| Armenian | 13 | 0.2% |
| Austrian | 13 | 0.2% |
| Belgian | 6 | 0.1% |
| Bhutanese | 3 | 0.0% |
| Blackfeet | 4 | 0.1% |
| British | 109 | 1.4% |
| Burmese | 43 | 0.5% |
| Canadian | 29 | 0.4% |
| Celtic | 17 | 0.2% |
| Central American Indian | 5 | 0.1% |
| Cherokee | 2 | 0.0% |
| Colombian | 19 | 0.2% |
| Croatian | 22 | 0.3% |
| Czech | 9 | 0.1% |
| Czechoslovakian | 11 | 0.1% |
| Danish | 29 | 0.4% |
| Dominican | 7 | 0.1% |
| Dutch | 100 | 1.3% |
| Eastern European | 175 | 2.2% |
| English | 2,026 | 25.2% |
| European | 118 | 1.5% |
| Finnish | 63 | 0.8% |
| French | 592 | 7.4% |
| French Canadian | 611 | 7.6% |
| German | 1,014 | 12.6% |
| Greek | 102 | 1.3% |
| Hungarian | 66 | 0.8% |
| Indian (Asian) | 16 | 0.2% |
| Iranian | 11 | 0.1% |
| Irish | 1,463 | 18.2% |
| Iroquois | 7 | 0.1% |
| Italian | 646 | 8.0% |
| Korean | 6 | 0.1% |
| Lebanese | 27 | 0.3% |
| Lithuanian | 57 | 0.7% |
| Mexican | 62 | 0.8% |
| Northern European | 7 | 0.1% |
| Norwegian | 55 | 0.7% |
| Polish | 319 | 4.0% |
| Portuguese | 34 | 0.4% |
| Puerto Rican | 29 | 0.4% |
| Romanian | 16 | 0.2% |
| Russian | 142 | 1.8% |
| Scandinavian | 21 | 0.3% |
| Scotch-Irish | 70 | 0.9% |
| Scottish | 396 | 4.9% |
| Serbian | 9 | 0.1% |
| Shoshone | 10 | 0.1% |
| Slavic | 21 | 0.3% |
| Slovak | 20 | 0.3% |
| South American | 19 | 0.2% |
| Spaniard | 30 | 0.4% |
| Spanish | 11 | 0.1% |
| Subsaharan African | 10 | 0.1% |
| Swedish | 171 | 2.1% |
| Swiss | 8 | 0.1% |
| Thai | 115 | 1.4% |
| Ukrainian | 7 | 0.1% |
| Vietnamese | 3 | 0.0% |
| Welsh | 74 | 0.9% |
| Yugoslavian | 42 | 0.5% | View All 64 Rows |
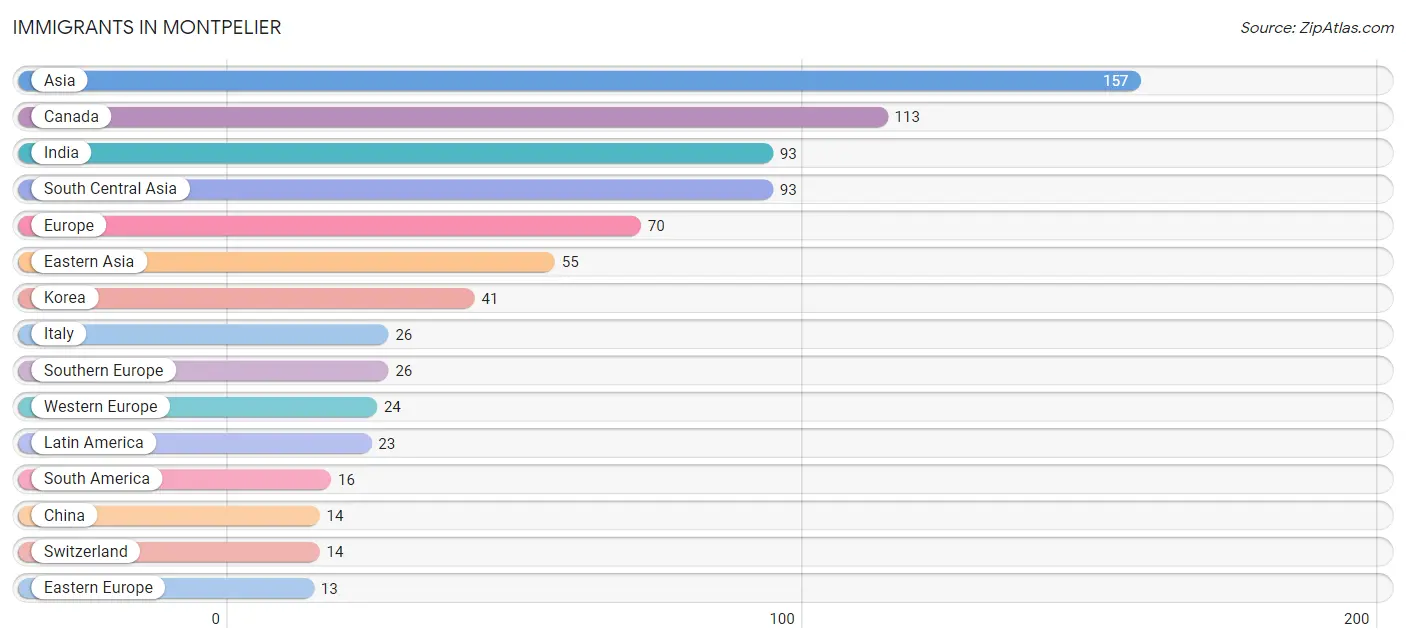
Immigrants in Montpelier
The most numerous immigrant groups reported in Montpelier came from Asia (157 | 2.0%), Canada (113 | 1.4%), India (93 | 1.2%), South Central Asia (93 | 1.2%), and Europe (70 | 0.9%), together accounting for 6.6% of all Montpelier residents.
| Immigration Origin | # Population | % Population |
| Asia | 157 | 2.0% |
| Bosnia and Herzegovina | 10 | 0.1% |
| Canada | 113 | 1.4% |
| Caribbean | 7 | 0.1% |
| Chile | 1 | 0.0% |
| China | 14 | 0.2% |
| Colombia | 7 | 0.1% |
| Denmark | 3 | 0.0% |
| Dominican Republic | 7 | 0.1% |
| Eastern Asia | 55 | 0.7% |
| Eastern Europe | 13 | 0.2% |
| Europe | 70 | 0.9% |
| France | 5 | 0.1% |
| Guyana | 8 | 0.1% |
| India | 93 | 1.2% |
| Italy | 26 | 0.3% |
| Korea | 41 | 0.5% |
| Latin America | 23 | 0.3% |
| Lithuania | 3 | 0.0% |
| Malaysia | 9 | 0.1% |
| Netherlands | 5 | 0.1% |
| Northern Europe | 7 | 0.1% |
| South America | 16 | 0.2% |
| South Central Asia | 93 | 1.2% |
| South Eastern Asia | 9 | 0.1% |
| Southern Europe | 26 | 0.3% |
| Switzerland | 14 | 0.2% |
| Western Europe | 24 | 0.3% | View All 28 Rows |
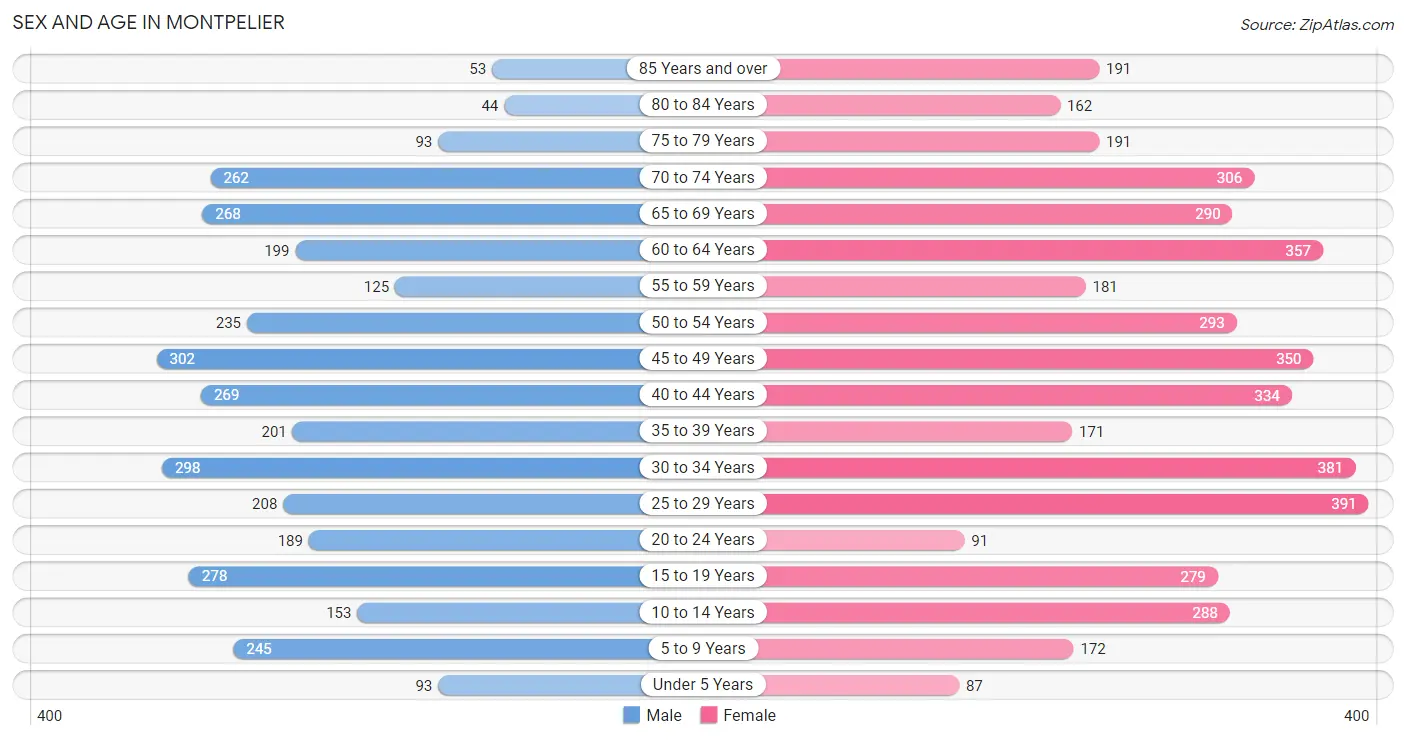
Sex and Age in Montpelier
Sex and Age in Montpelier
The most populous age groups in Montpelier are 45 to 49 Years (302 | 8.6%) for men and 25 to 29 Years (391 | 8.7%) for women.
| Age Bracket | Male | Female |
| Under 5 Years | 93 (2.6%) | 87 (1.9%) |
| 5 to 9 Years | 245 (7.0%) | 172 (3.8%) |
| 10 to 14 Years | 153 (4.3%) | 288 (6.4%) |
| 15 to 19 Years | 278 (7.9%) | 279 (6.2%) |
| 20 to 24 Years | 189 (5.4%) | 91 (2.0%) |
| 25 to 29 Years | 208 (5.9%) | 391 (8.7%) |
| 30 to 34 Years | 298 (8.5%) | 381 (8.4%) |
| 35 to 39 Years | 201 (5.7%) | 171 (3.8%) |
| 40 to 44 Years | 269 (7.6%) | 334 (7.4%) |
| 45 to 49 Years | 302 (8.6%) | 350 (7.7%) |
| 50 to 54 Years | 235 (6.7%) | 293 (6.5%) |
| 55 to 59 Years | 125 (3.6%) | 181 (4.0%) |
| 60 to 64 Years | 199 (5.7%) | 357 (7.9%) |
| 65 to 69 Years | 268 (7.6%) | 290 (6.4%) |
| 70 to 74 Years | 262 (7.4%) | 306 (6.8%) |
| 75 to 79 Years | 93 (2.6%) | 191 (4.2%) |
| 80 to 84 Years | 44 (1.3%) | 162 (3.6%) |
| 85 Years and over | 53 (1.5%) | 191 (4.2%) |
| Total | 3,515 (100.0%) | 4,515 (100.0%) |
Families and Households in Montpelier
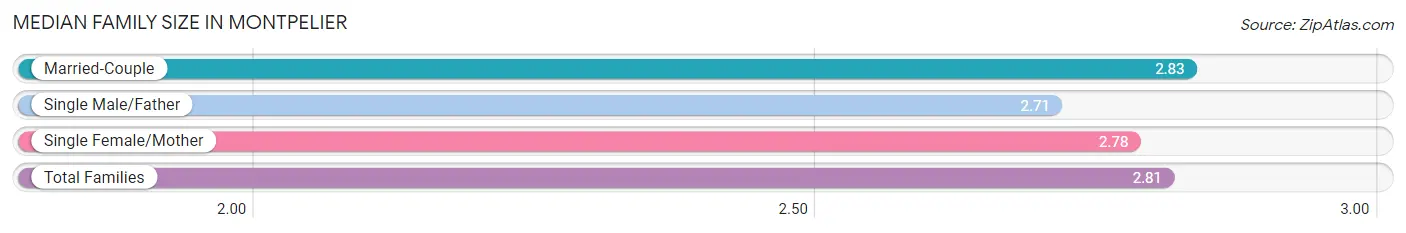
Median Family Size in Montpelier
The median family size in Montpelier is 2.81 persons per family, with married-couple families (1,363 | 74.0%) accounting for the largest median family size of 2.83 persons per family. On the other hand, single male/father families (112 | 6.1%) represent the smallest median family size with 2.71 persons per family.
| Family Type | # Families | Family Size |
| Married-Couple | 1,363 (74.0%) | 2.83 |
| Single Male/Father | 112 (6.1%) | 2.71 |
| Single Female/Mother | 366 (19.9%) | 2.78 |
| Total Families | 1,841 (100.0%) | 2.81 |
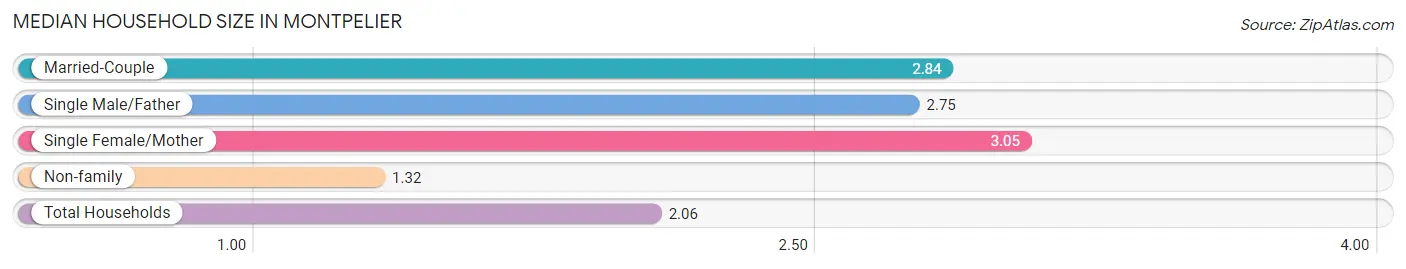
Median Household Size in Montpelier
The median household size in Montpelier is 2.06 persons per household, with single female/mother households (366 | 9.5%) accounting for the largest median household size of 3.05 persons per household. non-family households (2,020 | 52.3%) represent the smallest median household size with 1.32 persons per household.
| Household Type | # Households | Household Size |
| Married-Couple | 1,363 (35.3%) | 2.84 |
| Single Male/Father | 112 (2.9%) | 2.75 |
| Single Female/Mother | 366 (9.5%) | 3.05 |
| Non-family | 2,020 (52.3%) | 1.32 |
| Total Households | 3,861 (100.0%) | 2.06 |
Household Size by Marriage Status in Montpelier
Out of a total of 3,861 households in Montpelier, 1,841 (47.7%) are family households, while 2,020 (52.3%) are nonfamily households. The most numerous type of family households are 2-person households, comprising 1,073, and the most common type of nonfamily households are 1-person households, comprising 1,536.
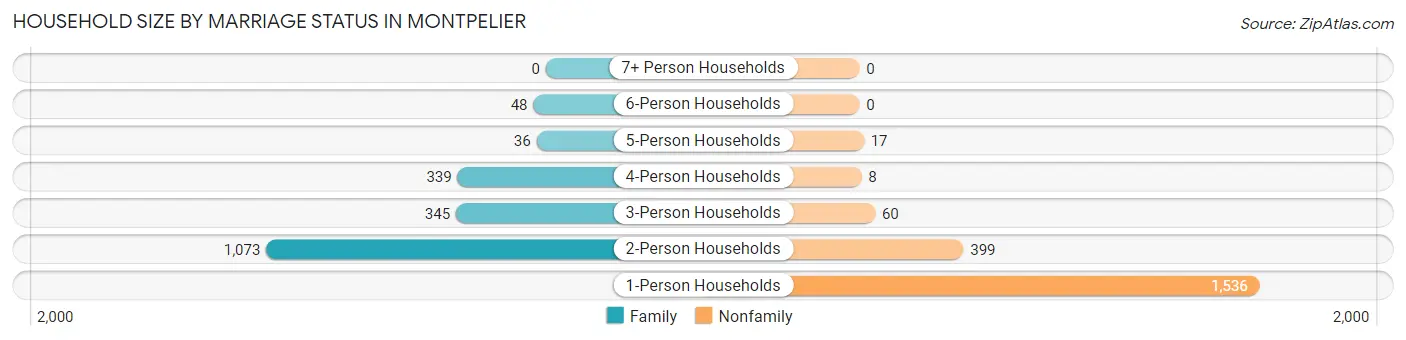
| Household Size | Family Households | Nonfamily Households |
| 1-Person Households | - | 1,536 (39.8%) |
| 2-Person Households | 1,073 (27.8%) | 399 (10.3%) |
| 3-Person Households | 345 (8.9%) | 60 (1.5%) |
| 4-Person Households | 339 (8.8%) | 8 (0.2%) |
| 5-Person Households | 36 (0.9%) | 17 (0.4%) |
| 6-Person Households | 48 (1.2%) | 0 (0.0%) |
| 7+ Person Households | 0 (0.0%) | 0 (0.0%) |
| Total | 1,841 (47.7%) | 2,020 (52.3%) |
Female Fertility in Montpelier
Fertility by Age in Montpelier
Average fertility rate in Montpelier is 35.0 births per 1,000 women. Women in the age bracket of 20 to 34 years have the highest fertility rate with 83.0 births per 1,000 women. Women in the age bracket of 20 to 34 years acount for 100.0% of all women with births.
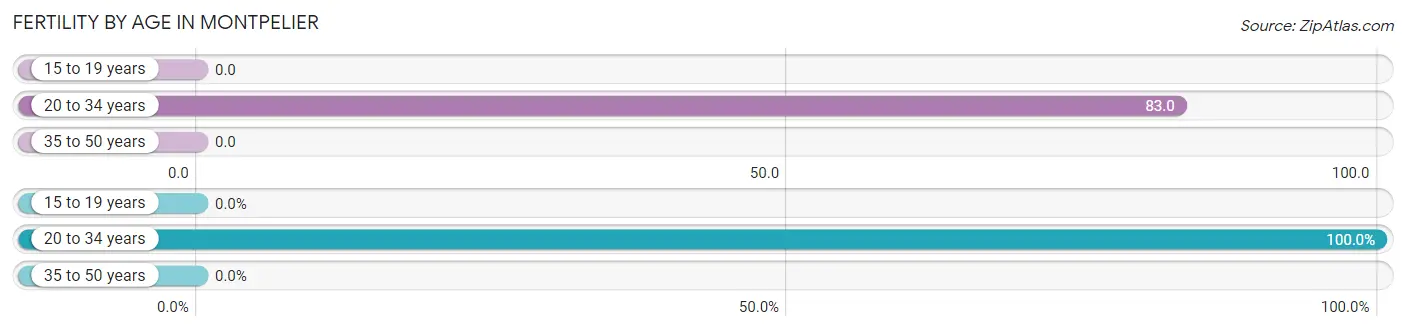
| Age Bracket | Women with Births | Births / 1,000 Women |
| 15 to 19 years | 0 (0.0%) | 0.0 |
| 20 to 34 years | 72 (100.0%) | 83.0 |
| 35 to 50 years | 0 (0.0%) | 0.0 |
| Total | 72 (100.0%) | 35.0 |
Fertility by Age by Marriage Status in Montpelier
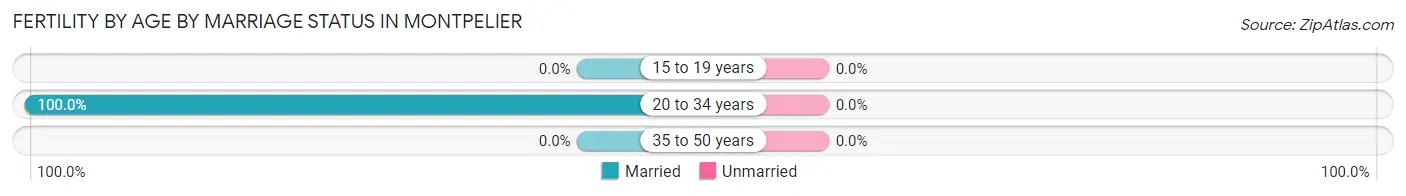
| Age Bracket | Married | Unmarried |
| 15 to 19 years | 0 (0.0%) | 0 (0.0%) |
| 20 to 34 years | 72 (100.0%) | 0 (0.0%) |
| 35 to 50 years | 0 (0.0%) | 0 (0.0%) |
| Total | 72 (100.0%) | 0 (0.0%) |
Fertility by Education in Montpelier
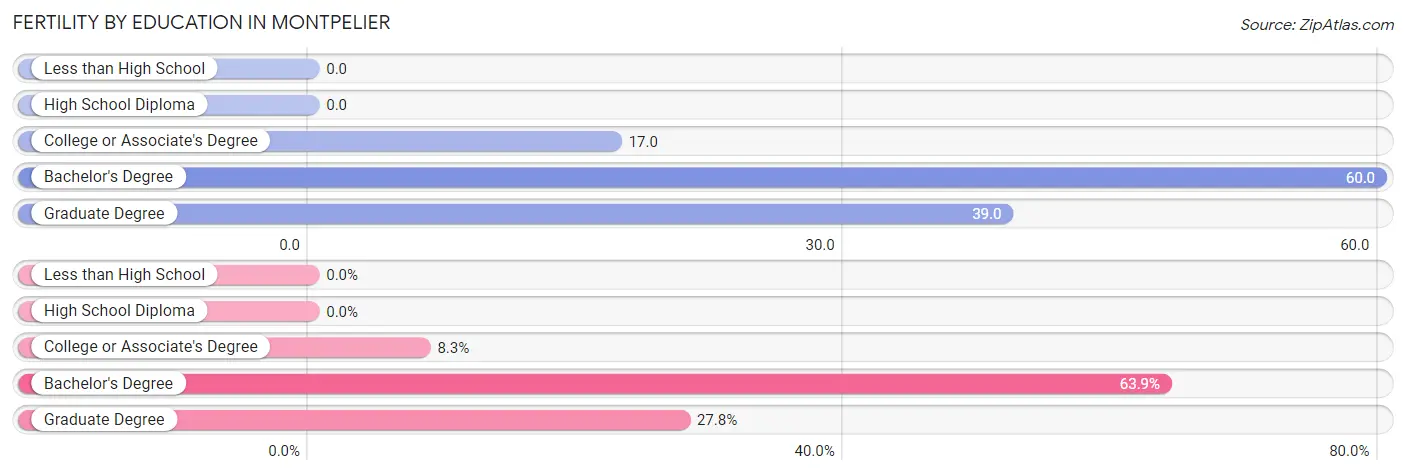
| Educational Attainment | Women with Births | Births / 1,000 Women |
| Less than High School | 0 (0.0%) | 0.0 |
| High School Diploma | 0 (0.0%) | 0.0 |
| College or Associate's Degree | 6 (8.3%) | 17.0 |
| Bachelor's Degree | 46 (63.9%) | 60.0 |
| Graduate Degree | 20 (27.8%) | 39.0 |
| Total | 72 (100.0%) | 35.0 |
Fertility by Education by Marriage Status in Montpelier
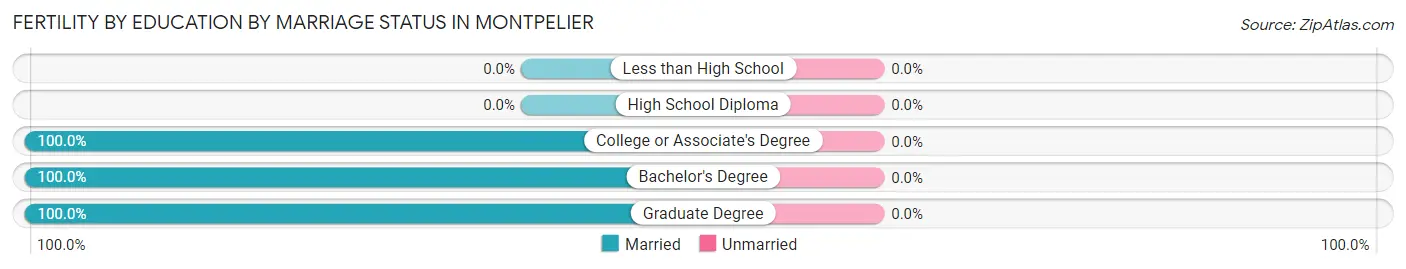
| Educational Attainment | Married | Unmarried |
| Less than High School | 0 (0.0%) | 0 (0.0%) |
| High School Diploma | 0 (0.0%) | 0 (0.0%) |
| College or Associate's Degree | 6 (100.0%) | 0 (0.0%) |
| Bachelor's Degree | 46 (100.0%) | 0 (0.0%) |
| Graduate Degree | 20 (100.0%) | 0 (0.0%) |
| Total | 72 (100.0%) | 0 (0.0%) |
Employment Characteristics in Montpelier
Employment by Class of Employer in Montpelier
Among the 4,444 employed individuals in Montpelier, private company employees (1,759 | 39.6%), not-for-profit organizations (1,120 | 25.2%), and state government employees (653 | 14.7%) make up the most common classes of employment.
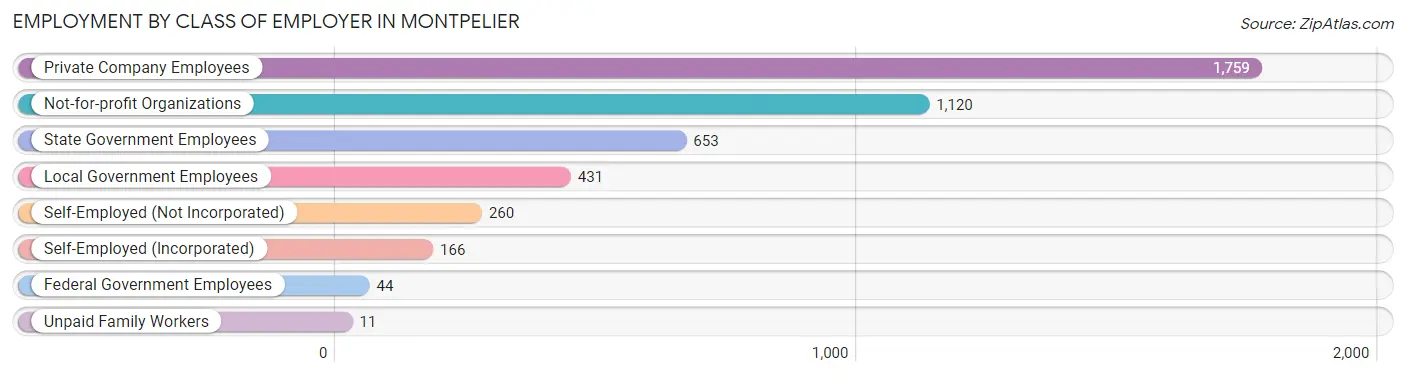
| Employer Class | # Employees | % Employees |
| Private Company Employees | 1,759 | 39.6% |
| Self-Employed (Incorporated) | 166 | 3.7% |
| Self-Employed (Not Incorporated) | 260 | 5.9% |
| Not-for-profit Organizations | 1,120 | 25.2% |
| Local Government Employees | 431 | 9.7% |
| State Government Employees | 653 | 14.7% |
| Federal Government Employees | 44 | 1.0% |
| Unpaid Family Workers | 11 | 0.3% |
| Total | 4,444 | 100.0% |
Employment Status by Age in Montpelier
According to the labor force statistics for Montpelier, out of the total population over 16 years of age (6,843), 67.8% or 4,640 individuals are in the labor force, with 3.0% or 139 of them unemployed. The age group with the highest labor force participation rate is 35 to 44 years, with 95.7% or 933 individuals in the labor force. Within the labor force, the 16 to 19 years age range has the highest percentage of unemployed individuals, with 10.9% or 19 of them being unemployed.
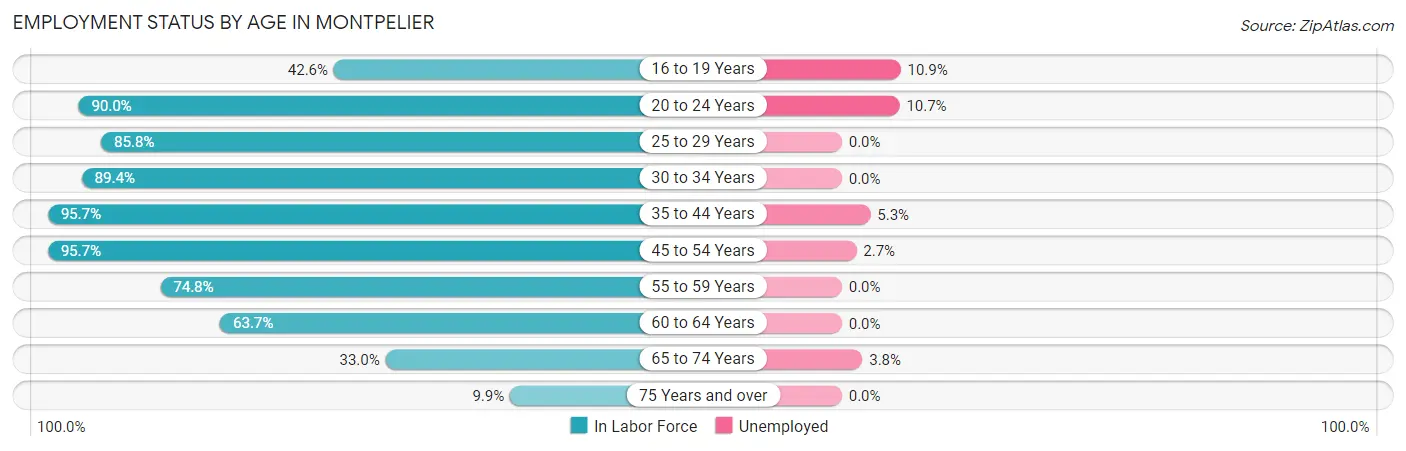
| Age Bracket | In Labor Force | Unemployed |
| 16 to 19 Years | 174 (42.6%) | 19 (10.9%) |
| 20 to 24 Years | 252 (90.0%) | 27 (10.7%) |
| 25 to 29 Years | 514 (85.8%) | 0 (0.0%) |
| 30 to 34 Years | 607 (89.4%) | 0 (0.0%) |
| 35 to 44 Years | 933 (95.7%) | 49 (5.3%) |
| 45 to 54 Years | 1,129 (95.7%) | 30 (2.7%) |
| 55 to 59 Years | 229 (74.8%) | 0 (0.0%) |
| 60 to 64 Years | 354 (63.7%) | 0 (0.0%) |
| 65 to 74 Years | 372 (33.0%) | 14 (3.8%) |
| 75 Years and over | 73 (9.9%) | 0 (0.0%) |
| Total | 4,640 (67.8%) | 139 (3.0%) |
Employment Status by Educational Attainment in Montpelier
According to labor force statistics for Montpelier, 87.7% of individuals (3,767) out of the total population between 25 and 64 years of age (4,295) are in the labor force, with 2.1% or 79 of them being unemployed. The group with the highest labor force participation rate are those with the educational attainment of less than high school, with 94.3% or 33 individuals in the labor force. Within the labor force, individuals with high school diploma education have the highest percentage of unemployment, with 6.4% or 27 of them being unemployed.
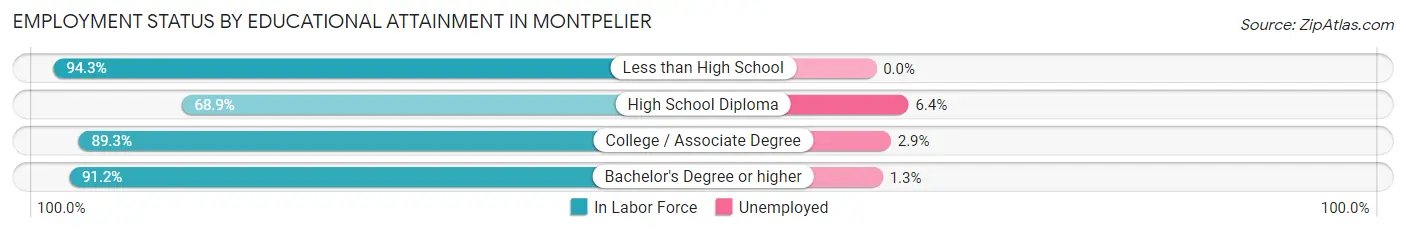
| Educational Attainment | In Labor Force | Unemployed |
| Less than High School | 33 (94.3%) | 0 (0.0%) |
| High School Diploma | 425 (68.9%) | 39 (6.4%) |
| College / Associate Degree | 627 (89.3%) | 20 (2.9%) |
| Bachelor's Degree or higher | 2,682 (91.2%) | 38 (1.3%) |
| Total | 3,767 (87.7%) | 90 (2.1%) |
Employment Occupations by Sex in Montpelier
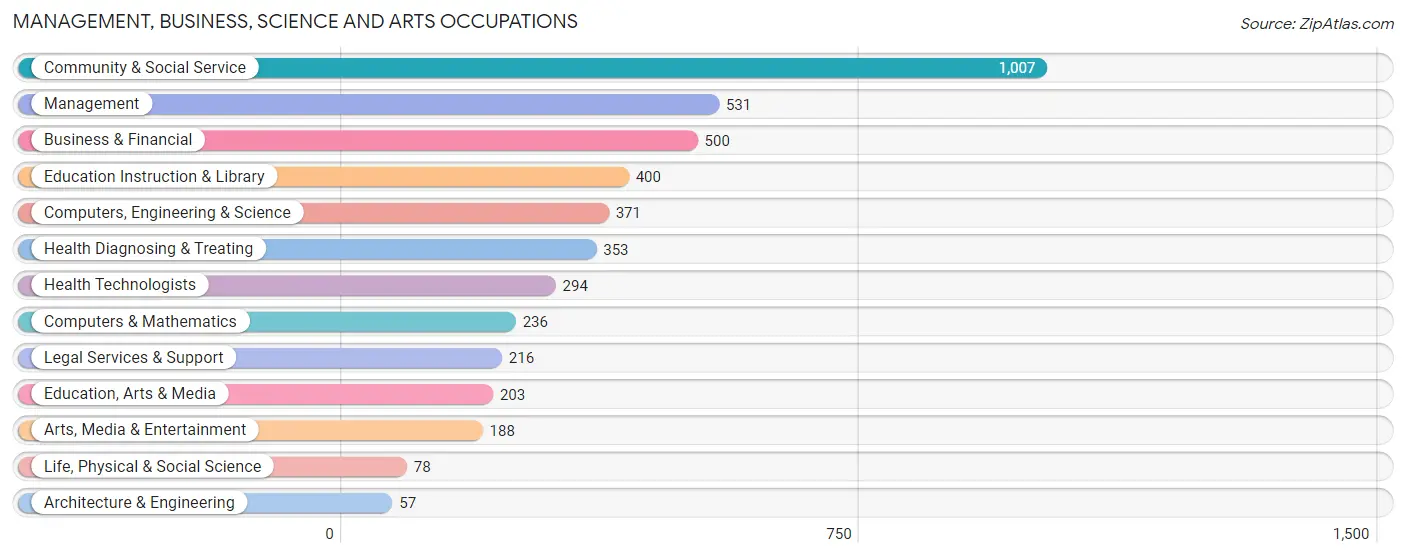
Management, Business, Science and Arts Occupations
The most common Management, Business, Science and Arts occupations in Montpelier are Community & Social Service (1,007 | 22.4%), Management (531 | 11.8%), Business & Financial (500 | 11.1%), Education Instruction & Library (400 | 8.9%), and Computers, Engineering & Science (371 | 8.3%).
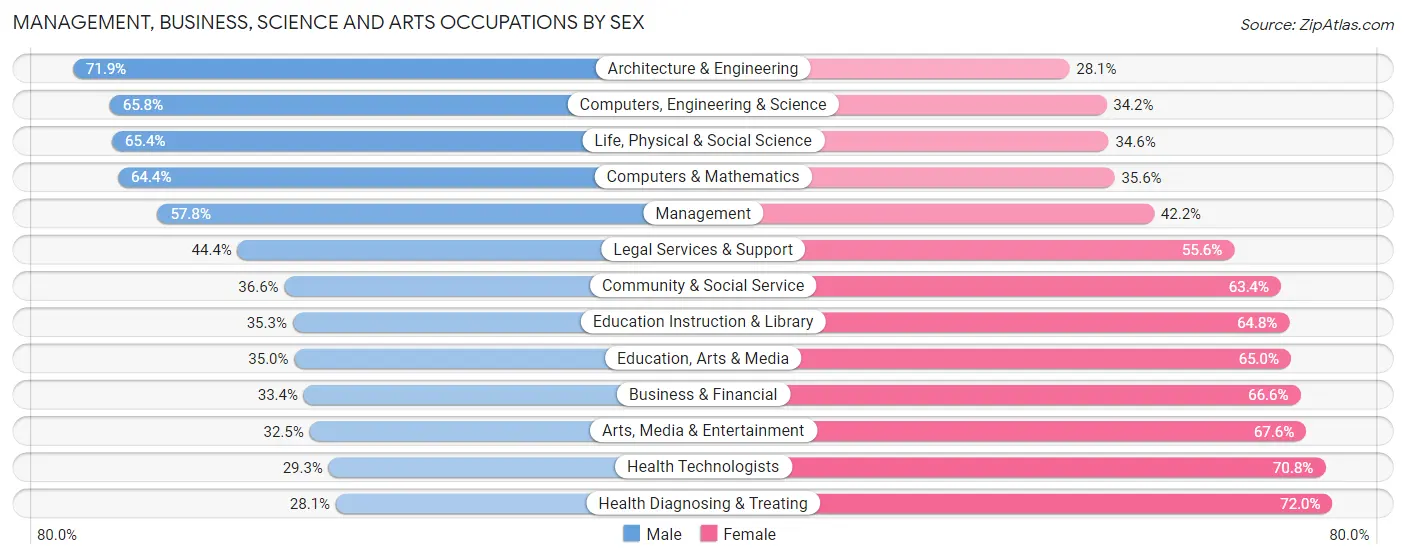
Management, Business, Science and Arts Occupations by Sex
Within the Management, Business, Science and Arts occupations in Montpelier, the most male-oriented occupations are Architecture & Engineering (71.9%), Computers, Engineering & Science (65.8%), and Life, Physical & Social Science (65.4%), while the most female-oriented occupations are Health Diagnosing & Treating (72.0%), Health Technologists (70.8%), and Arts, Media & Entertainment (67.5%).
| Occupation | Male | Female |
| Management | 307 (57.8%) | 224 (42.2%) |
| Business & Financial | 167 (33.4%) | 333 (66.6%) |
| Computers, Engineering & Science | 244 (65.8%) | 127 (34.2%) |
| Computers & Mathematics | 152 (64.4%) | 84 (35.6%) |
| Architecture & Engineering | 41 (71.9%) | 16 (28.1%) |
| Life, Physical & Social Science | 51 (65.4%) | 27 (34.6%) |
| Community & Social Service | 369 (36.6%) | 638 (63.4%) |
| Education, Arts & Media | 71 (35.0%) | 132 (65.0%) |
| Legal Services & Support | 96 (44.4%) | 120 (55.6%) |
| Education Instruction & Library | 141 (35.2%) | 259 (64.7%) |
| Arts, Media & Entertainment | 61 (32.5%) | 127 (67.5%) |
| Health Diagnosing & Treating | 99 (28.1%) | 254 (72.0%) |
| Health Technologists | 86 (29.2%) | 208 (70.8%) |
| Total (Category) | 1,186 (42.9%) | 1,576 (57.1%) |
| Total (Overall) | 2,087 (46.4%) | 2,411 (53.6%) |
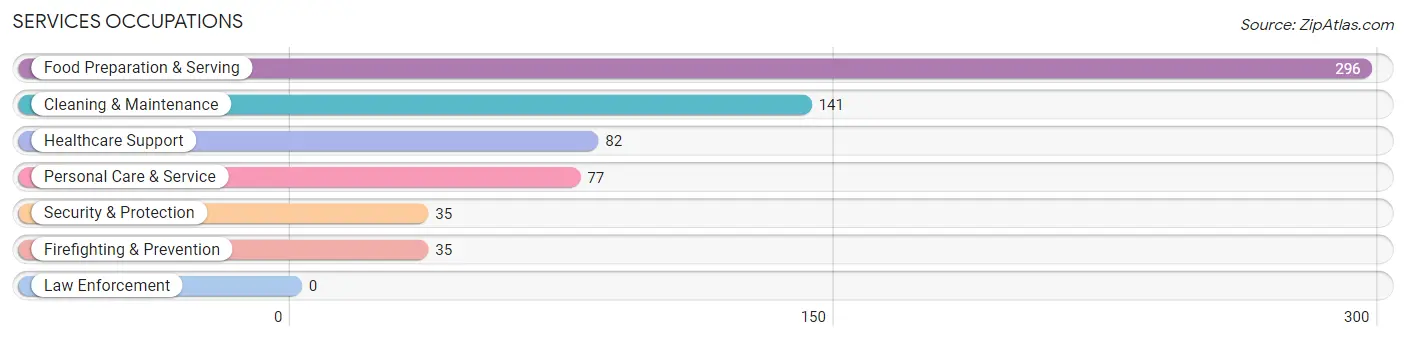
Services Occupations
The most common Services occupations in Montpelier are Food Preparation & Serving (296 | 6.6%), Cleaning & Maintenance (141 | 3.1%), Healthcare Support (82 | 1.8%), Personal Care & Service (77 | 1.7%), and Security & Protection (35 | 0.8%).
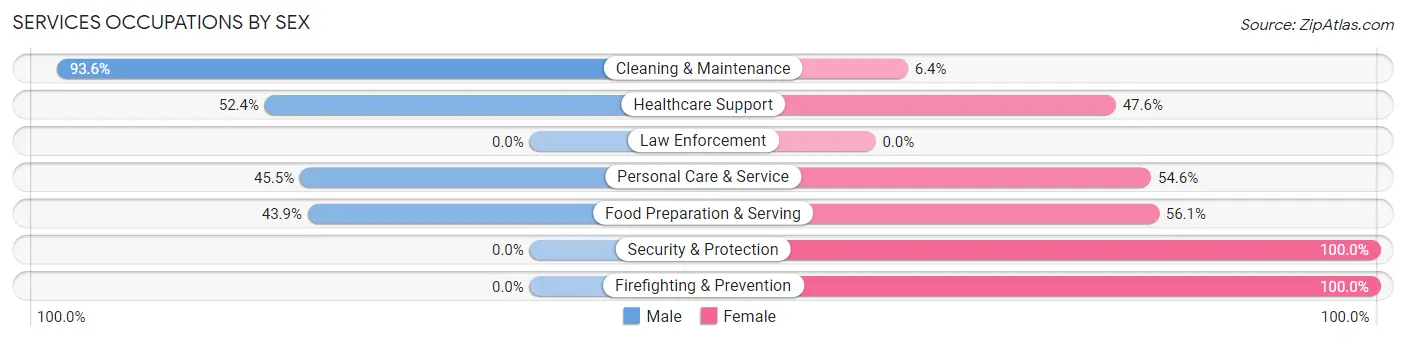
Services Occupations by Sex
Within the Services occupations in Montpelier, the most male-oriented occupations are Cleaning & Maintenance (93.6%), Healthcare Support (52.4%), and Personal Care & Service (45.5%), while the most female-oriented occupations are Security & Protection (100.0%), Firefighting & Prevention (100.0%), and Food Preparation & Serving (56.1%).
| Occupation | Male | Female |
| Healthcare Support | 43 (52.4%) | 39 (47.6%) |
| Security & Protection | 0 (0.0%) | 35 (100.0%) |
| Firefighting & Prevention | 0 (0.0%) | 35 (100.0%) |
| Law Enforcement | 0 (0.0%) | 0 (0.0%) |
| Food Preparation & Serving | 130 (43.9%) | 166 (56.1%) |
| Cleaning & Maintenance | 132 (93.6%) | 9 (6.4%) |
| Personal Care & Service | 35 (45.5%) | 42 (54.5%) |
| Total (Category) | 340 (53.9%) | 291 (46.1%) |
| Total (Overall) | 2,087 (46.4%) | 2,411 (53.6%) |
Sales and Office Occupations
The most common Sales and Office occupations in Montpelier are Office & Administration (356 | 7.9%), and Sales & Related (289 | 6.4%).

Sales and Office Occupations by Sex
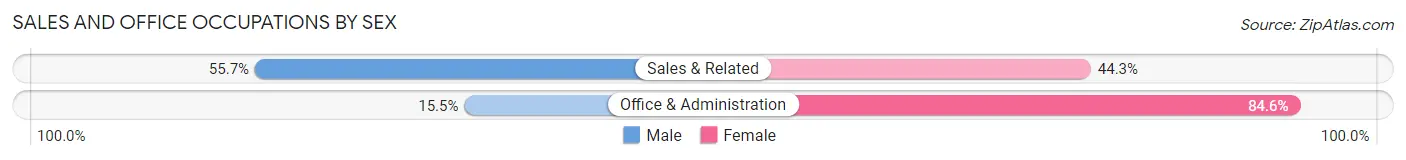
| Occupation | Male | Female |
| Sales & Related | 161 (55.7%) | 128 (44.3%) |
| Office & Administration | 55 (15.4%) | 301 (84.6%) |
| Total (Category) | 216 (33.5%) | 429 (66.5%) |
| Total (Overall) | 2,087 (46.4%) | 2,411 (53.6%) |
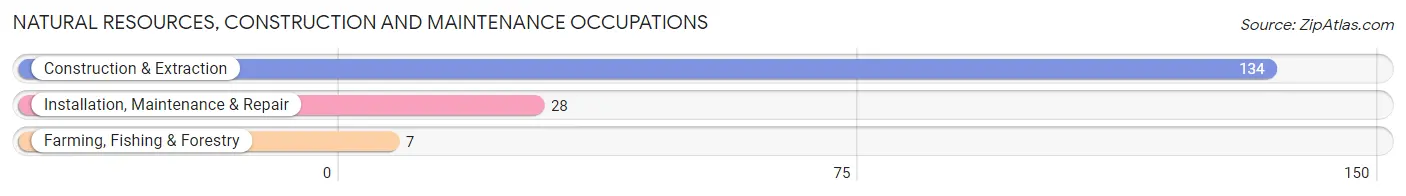
Natural Resources, Construction and Maintenance Occupations
The most common Natural Resources, Construction and Maintenance occupations in Montpelier are Construction & Extraction (134 | 3.0%), Installation, Maintenance & Repair (28 | 0.6%), and Farming, Fishing & Forestry (7 | 0.2%).
Natural Resources, Construction and Maintenance Occupations by Sex
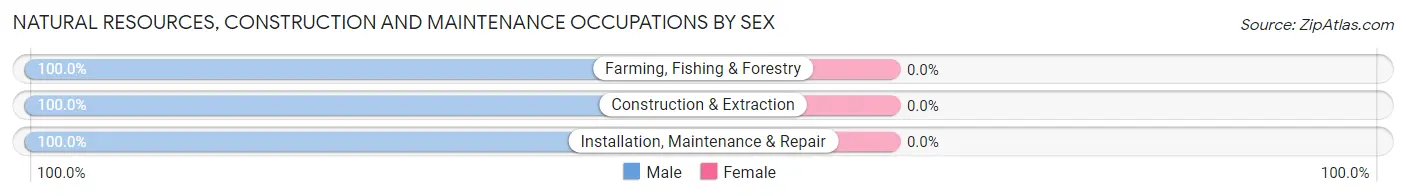
| Occupation | Male | Female |
| Farming, Fishing & Forestry | 7 (100.0%) | 0 (0.0%) |
| Construction & Extraction | 134 (100.0%) | 0 (0.0%) |
| Installation, Maintenance & Repair | 28 (100.0%) | 0 (0.0%) |
| Total (Category) | 169 (100.0%) | 0 (0.0%) |
| Total (Overall) | 2,087 (46.4%) | 2,411 (53.6%) |
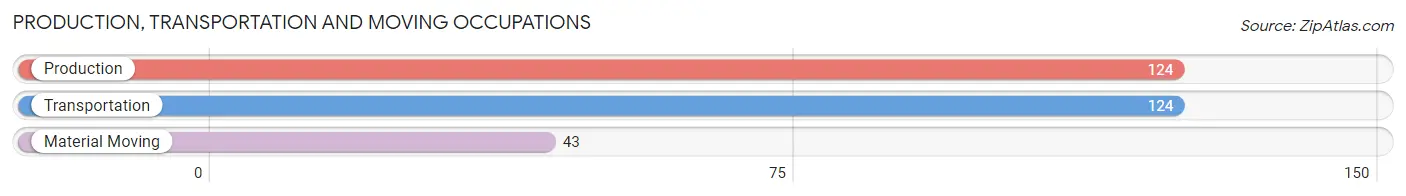
Production, Transportation and Moving Occupations
The most common Production, Transportation and Moving occupations in Montpelier are Production (124 | 2.8%), Transportation (124 | 2.8%), and Material Moving (43 | 1.0%).
Production, Transportation and Moving Occupations by Sex
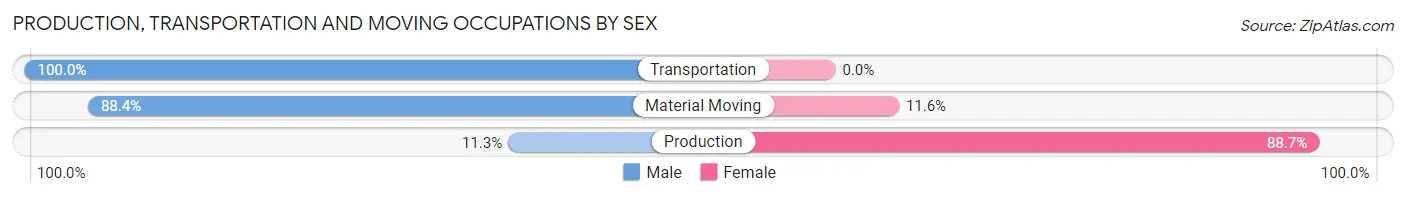
| Occupation | Male | Female |
| Production | 14 (11.3%) | 110 (88.7%) |
| Transportation | 124 (100.0%) | 0 (0.0%) |
| Material Moving | 38 (88.4%) | 5 (11.6%) |
| Total (Category) | 176 (60.5%) | 115 (39.5%) |
| Total (Overall) | 2,087 (46.4%) | 2,411 (53.6%) |
Employment Industries by Sex in Montpelier
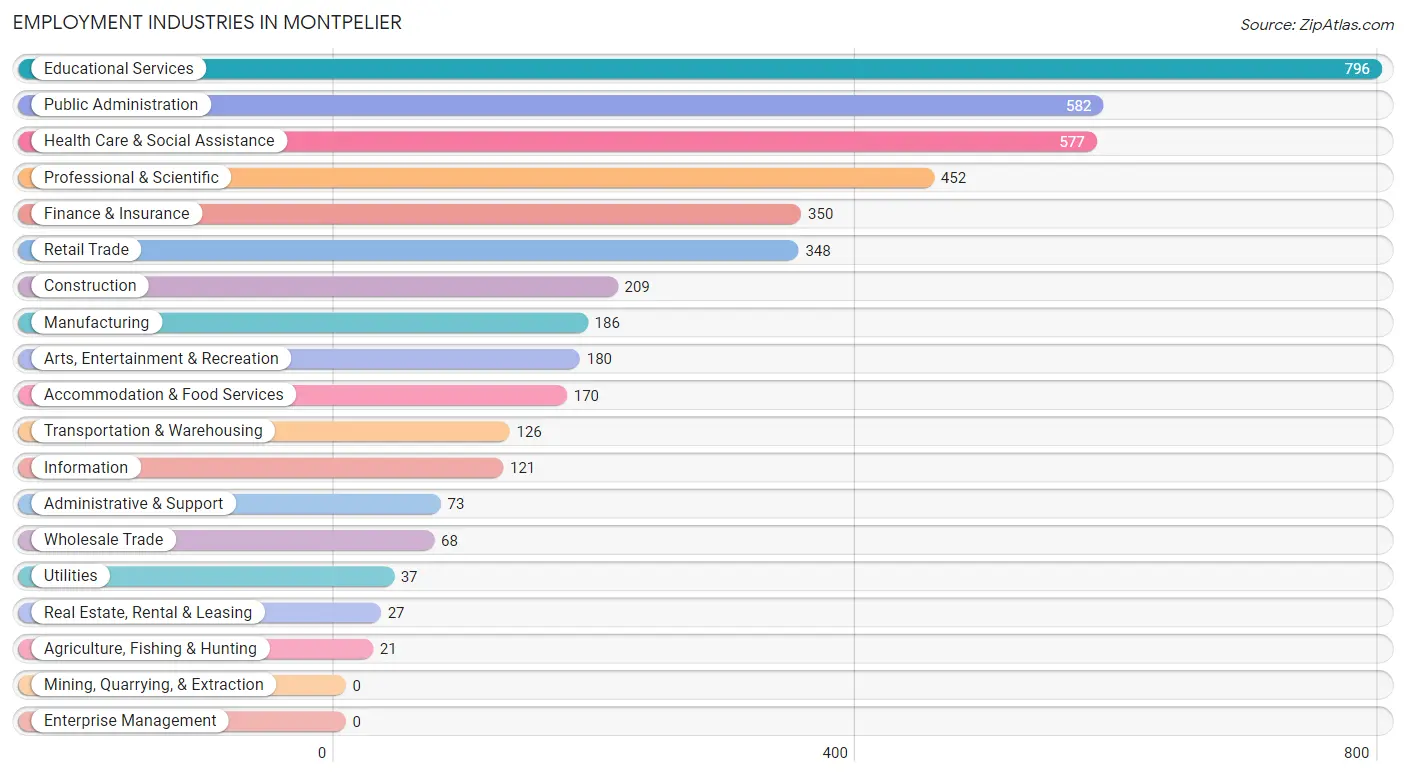
Employment Industries in Montpelier
The major employment industries in Montpelier include Educational Services (796 | 17.7%), Public Administration (582 | 12.9%), Health Care & Social Assistance (577 | 12.8%), Professional & Scientific (452 | 10.1%), and Finance & Insurance (350 | 7.8%).
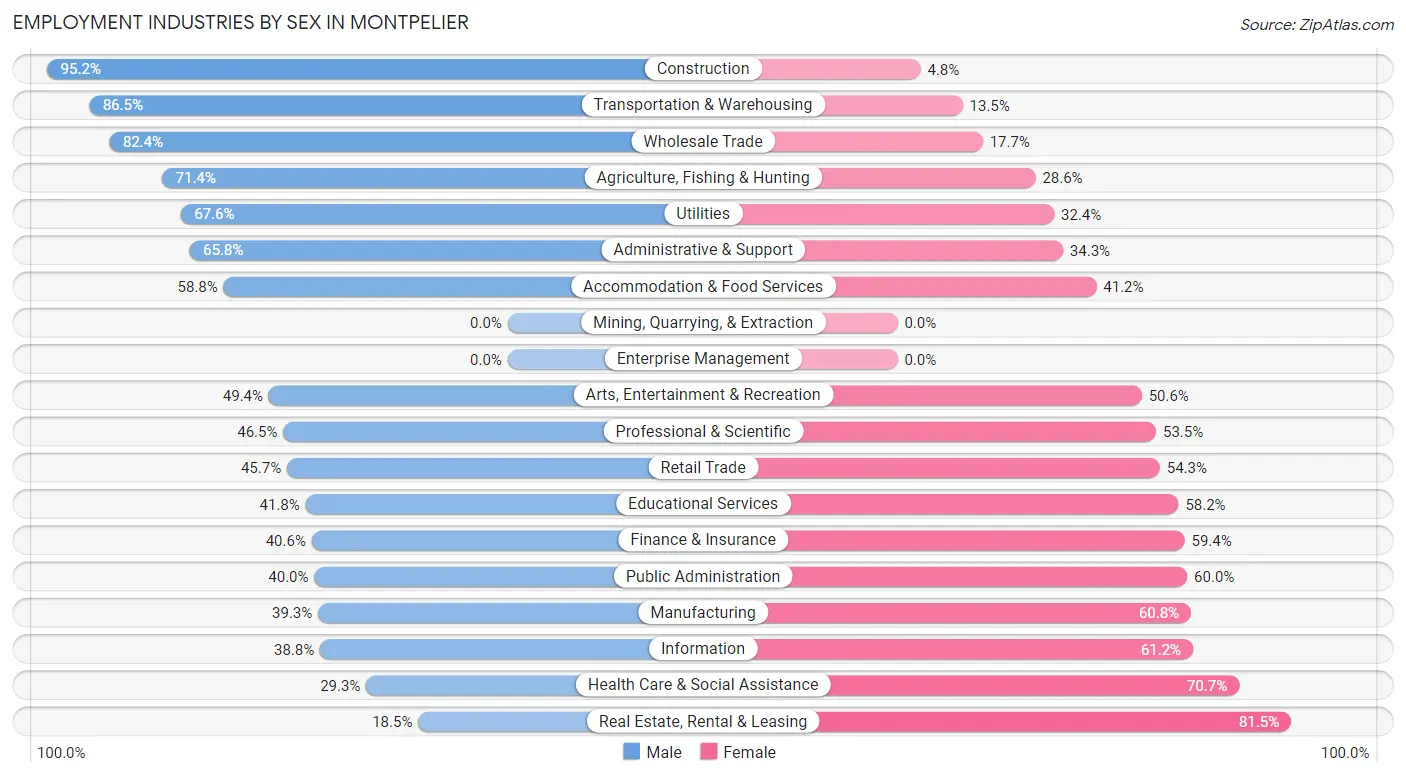
Employment Industries by Sex in Montpelier
The Montpelier industries that see more men than women are Construction (95.2%), Transportation & Warehousing (86.5%), and Wholesale Trade (82.4%), whereas the industries that tend to have a higher number of women are Real Estate, Rental & Leasing (81.5%), Health Care & Social Assistance (70.7%), and Information (61.2%).
| Industry | Male | Female |
| Agriculture, Fishing & Hunting | 15 (71.4%) | 6 (28.6%) |
| Mining, Quarrying, & Extraction | 0 (0.0%) | 0 (0.0%) |
| Construction | 199 (95.2%) | 10 (4.8%) |
| Manufacturing | 73 (39.3%) | 113 (60.8%) |
| Wholesale Trade | 56 (82.4%) | 12 (17.6%) |
| Retail Trade | 159 (45.7%) | 189 (54.3%) |
| Transportation & Warehousing | 109 (86.5%) | 17 (13.5%) |
| Utilities | 25 (67.6%) | 12 (32.4%) |
| Information | 47 (38.8%) | 74 (61.2%) |
| Finance & Insurance | 142 (40.6%) | 208 (59.4%) |
| Real Estate, Rental & Leasing | 5 (18.5%) | 22 (81.5%) |
| Professional & Scientific | 210 (46.5%) | 242 (53.5%) |
| Enterprise Management | 0 (0.0%) | 0 (0.0%) |
| Administrative & Support | 48 (65.7%) | 25 (34.3%) |
| Educational Services | 333 (41.8%) | 463 (58.2%) |
| Health Care & Social Assistance | 169 (29.3%) | 408 (70.7%) |
| Arts, Entertainment & Recreation | 89 (49.4%) | 91 (50.6%) |
| Accommodation & Food Services | 100 (58.8%) | 70 (41.2%) |
| Public Administration | 233 (40.0%) | 349 (60.0%) |
| Total | 2,087 (46.4%) | 2,411 (53.6%) |
Education in Montpelier
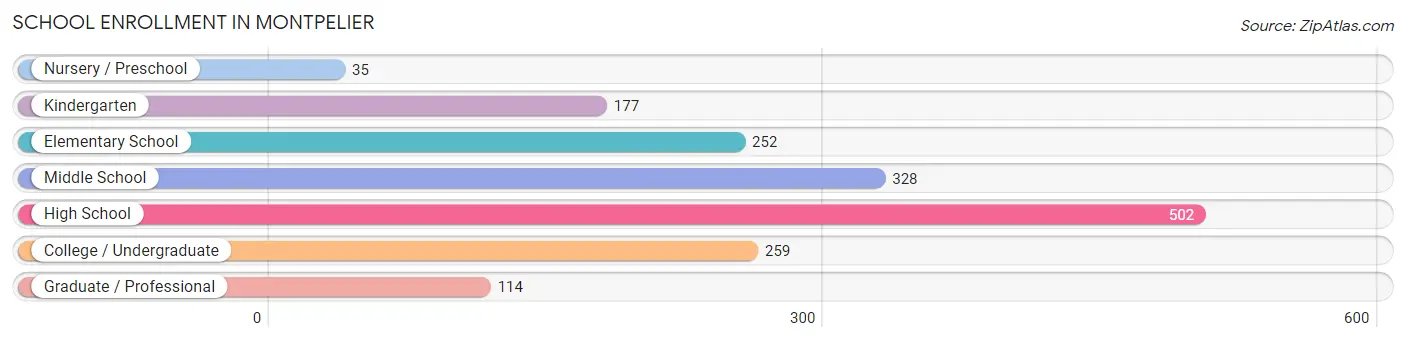
School Enrollment in Montpelier
The most common levels of schooling among the 1,667 students in Montpelier are high school (502 | 30.1%), middle school (328 | 19.7%), and college / undergraduate (259 | 15.5%).
| School Level | # Students | % Students |
| Nursery / Preschool | 35 | 2.1% |
| Kindergarten | 177 | 10.6% |
| Elementary School | 252 | 15.1% |
| Middle School | 328 | 19.7% |
| High School | 502 | 30.1% |
| College / Undergraduate | 259 | 15.5% |
| Graduate / Professional | 114 | 6.8% |
| Total | 1,667 | 100.0% |
School Enrollment by Age by Funding Source in Montpelier
Out of a total of 1,667 students who are enrolled in schools in Montpelier, 313 (18.8%) attend a private institution, while the remaining 1,354 (81.2%) are enrolled in public schools. The age group of 3 to 4 year olds has the highest likelihood of being enrolled in private schools, with 34 (97.1% in the age bracket) enrolled. Conversely, the age group of 15 to 17 year olds has the lowest likelihood of being enrolled in a private school, with 323 (95.3% in the age bracket) attending a public institution.
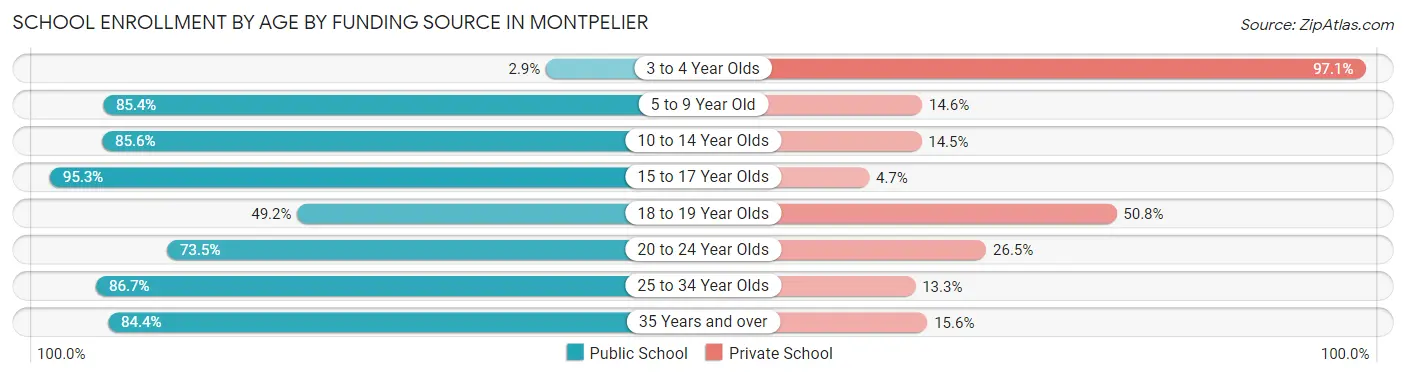
| Age Bracket | Public School | Private School |
| 3 to 4 Year Olds | 1 (2.9%) | 34 (97.1%) |
| 5 to 9 Year Old | 345 (85.4%) | 59 (14.6%) |
| 10 to 14 Year Olds | 361 (85.6%) | 61 (14.4%) |
| 15 to 17 Year Olds | 323 (95.3%) | 16 (4.7%) |
| 18 to 19 Year Olds | 94 (49.2%) | 97 (50.8%) |
| 20 to 24 Year Olds | 36 (73.5%) | 13 (26.5%) |
| 25 to 34 Year Olds | 91 (86.7%) | 14 (13.3%) |
| 35 Years and over | 103 (84.4%) | 19 (15.6%) |
| Total | 1,354 (81.2%) | 313 (18.8%) |
Educational Attainment by Field of Study in Montpelier
Social sciences (608 | 13.8%), education (520 | 11.8%), bio, nature & agricultural (434 | 9.8%), science & technology (423 | 9.6%), and liberal arts & history (409 | 9.3%) are the most common fields of study among 4,415 individuals in Montpelier who have obtained a bachelor's degree or higher.
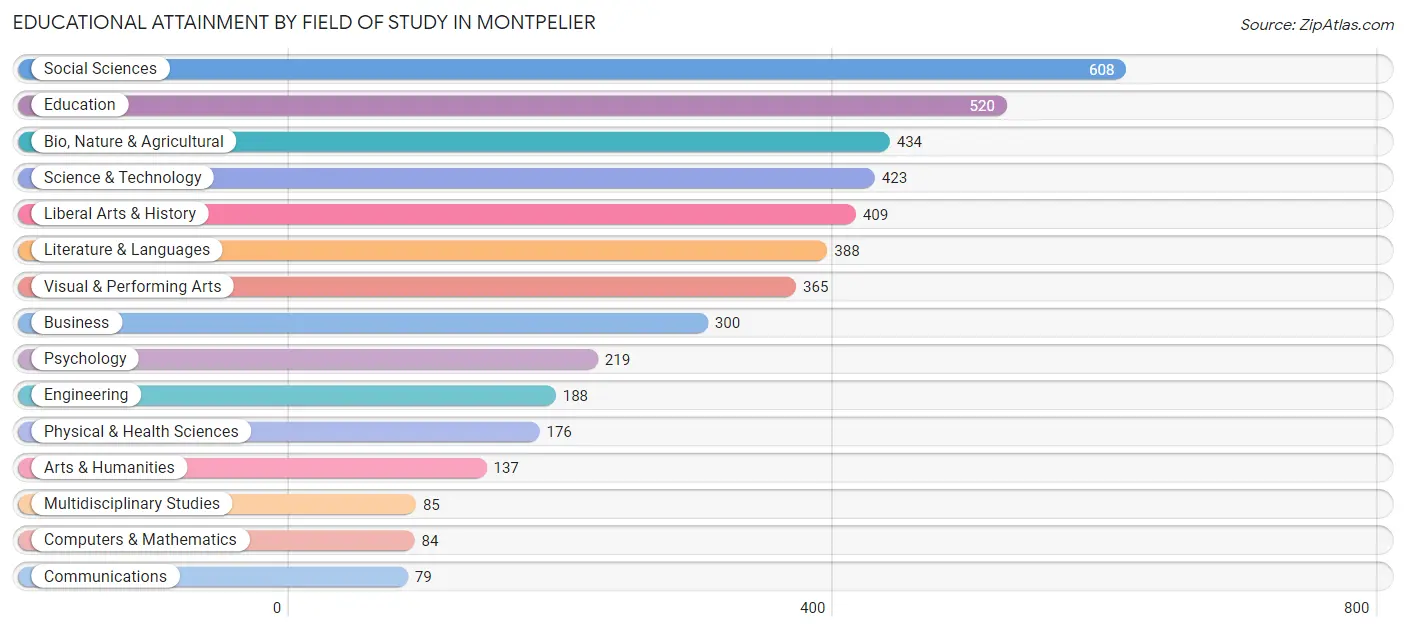
| Field of Study | # Graduates | % Graduates |
| Computers & Mathematics | 84 | 1.9% |
| Bio, Nature & Agricultural | 434 | 9.8% |
| Physical & Health Sciences | 176 | 4.0% |
| Psychology | 219 | 5.0% |
| Social Sciences | 608 | 13.8% |
| Engineering | 188 | 4.3% |
| Multidisciplinary Studies | 85 | 1.9% |
| Science & Technology | 423 | 9.6% |
| Business | 300 | 6.8% |
| Education | 520 | 11.8% |
| Literature & Languages | 388 | 8.8% |
| Liberal Arts & History | 409 | 9.3% |
| Visual & Performing Arts | 365 | 8.3% |
| Communications | 79 | 1.8% |
| Arts & Humanities | 137 | 3.1% |
| Total | 4,415 | 100.0% |
Transportation & Commute in Montpelier
Vehicle Availability by Sex in Montpelier
The most prevalent vehicle ownership categories in Montpelier are males with 2 vehicles (1,154, accounting for 56.2%) and females with 2 vehicles (994, making up 48.3%).
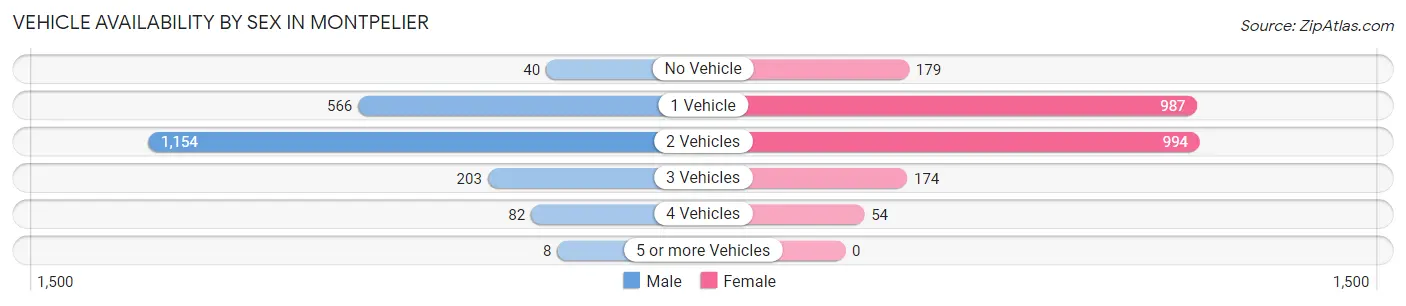
| Vehicles Available | Male | Female |
| No Vehicle | 40 (1.9%) | 179 (7.5%) |
| 1 Vehicle | 566 (27.6%) | 987 (41.3%) |
| 2 Vehicles | 1,154 (56.2%) | 994 (41.6%) |
| 3 Vehicles | 203 (9.9%) | 174 (7.3%) |
| 4 Vehicles | 82 (4.0%) | 54 (2.3%) |
| 5 or more Vehicles | 8 (0.4%) | 0 (0.0%) |
| Total | 2,053 (100.0%) | 2,388 (100.0%) |
Commute Time in Montpelier
The most frequently occuring commute durations in Montpelier are 10 to 14 minutes (727 commuters, 21.4%), 5 to 9 minutes (715 commuters, 21.0%), and 15 to 19 minutes (633 commuters, 18.6%).
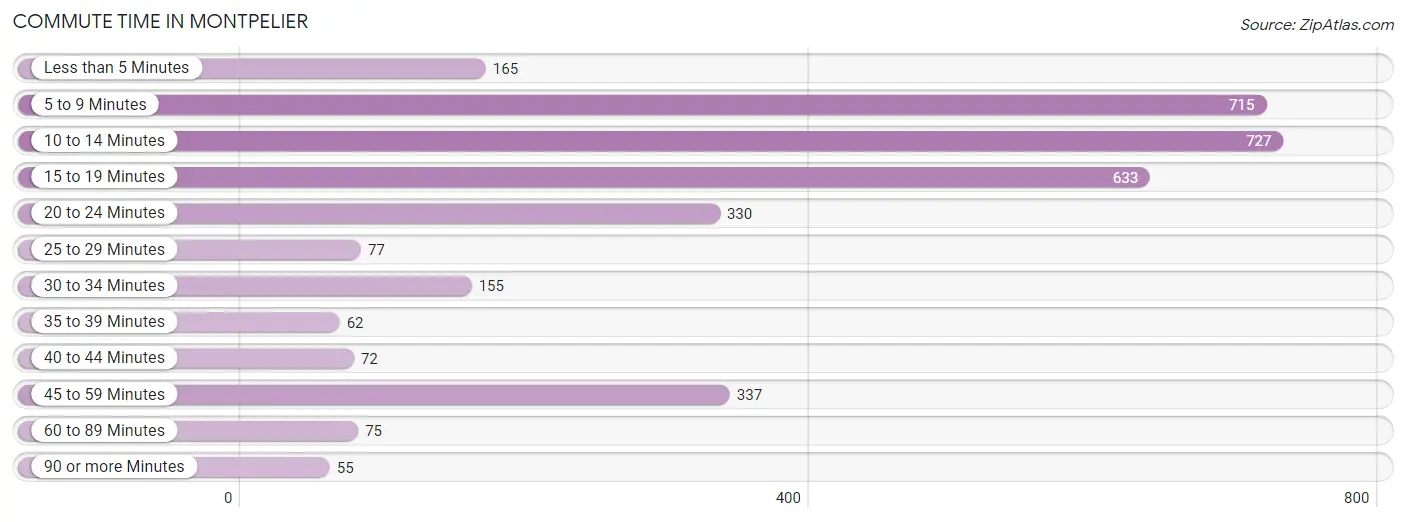
| Commute Time | # Commuters | % Commuters |
| Less than 5 Minutes | 165 | 4.9% |
| 5 to 9 Minutes | 715 | 21.0% |
| 10 to 14 Minutes | 727 | 21.4% |
| 15 to 19 Minutes | 633 | 18.6% |
| 20 to 24 Minutes | 330 | 9.7% |
| 25 to 29 Minutes | 77 | 2.3% |
| 30 to 34 Minutes | 155 | 4.5% |
| 35 to 39 Minutes | 62 | 1.8% |
| 40 to 44 Minutes | 72 | 2.1% |
| 45 to 59 Minutes | 337 | 9.9% |
| 60 to 89 Minutes | 75 | 2.2% |
| 90 or more Minutes | 55 | 1.6% |
Commute Time by Sex in Montpelier
The most common commute times in Montpelier are 10 to 14 minutes (416 commuters, 25.3%) for males and 5 to 9 minutes (410 commuters, 23.3%) for females.
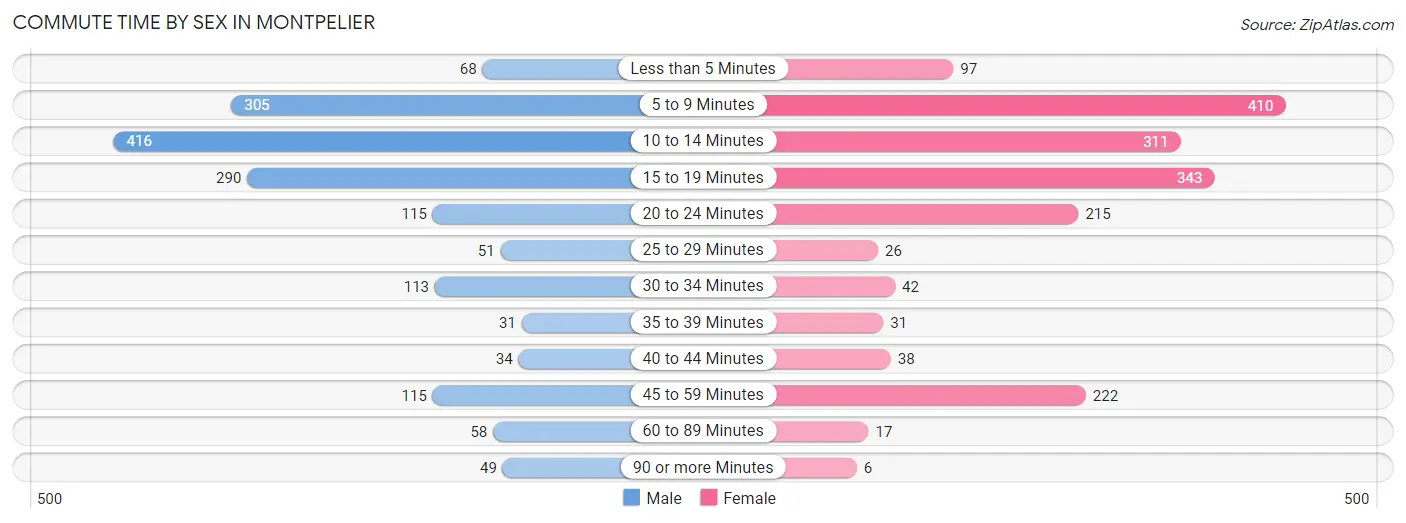
| Commute Time | Male | Female |
| Less than 5 Minutes | 68 (4.1%) | 97 (5.5%) |
| 5 to 9 Minutes | 305 (18.5%) | 410 (23.3%) |
| 10 to 14 Minutes | 416 (25.3%) | 311 (17.7%) |
| 15 to 19 Minutes | 290 (17.6%) | 343 (19.5%) |
| 20 to 24 Minutes | 115 (7.0%) | 215 (12.2%) |
| 25 to 29 Minutes | 51 (3.1%) | 26 (1.5%) |
| 30 to 34 Minutes | 113 (6.9%) | 42 (2.4%) |
| 35 to 39 Minutes | 31 (1.9%) | 31 (1.8%) |
| 40 to 44 Minutes | 34 (2.1%) | 38 (2.2%) |
| 45 to 59 Minutes | 115 (7.0%) | 222 (12.6%) |
| 60 to 89 Minutes | 58 (3.5%) | 17 (1.0%) |
| 90 or more Minutes | 49 (3.0%) | 6 (0.3%) |
Time of Departure to Work by Sex in Montpelier
The most frequent times of departure to work in Montpelier are 7:30 AM to 7:59 AM (288, 17.5%) for males and 7:30 AM to 7:59 AM (378, 21.5%) for females.
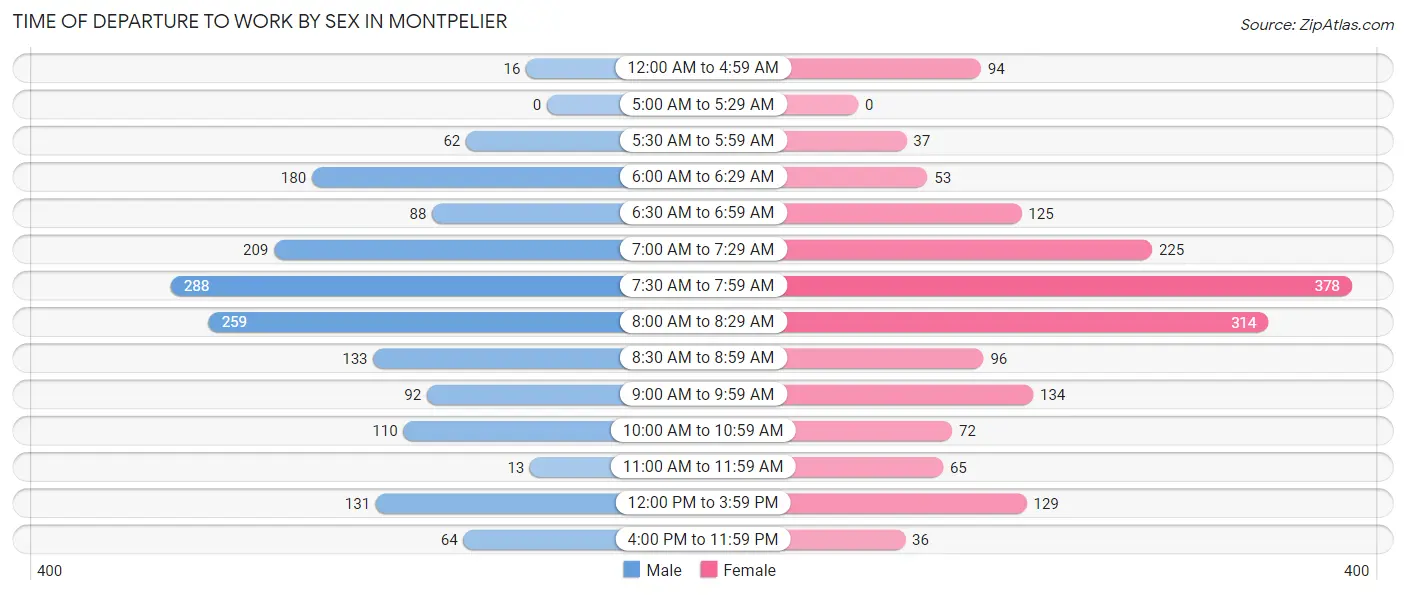
| Time of Departure | Male | Female |
| 12:00 AM to 4:59 AM | 16 (1.0%) | 94 (5.3%) |
| 5:00 AM to 5:29 AM | 0 (0.0%) | 0 (0.0%) |
| 5:30 AM to 5:59 AM | 62 (3.8%) | 37 (2.1%) |
| 6:00 AM to 6:29 AM | 180 (10.9%) | 53 (3.0%) |
| 6:30 AM to 6:59 AM | 88 (5.3%) | 125 (7.1%) |
| 7:00 AM to 7:29 AM | 209 (12.7%) | 225 (12.8%) |
| 7:30 AM to 7:59 AM | 288 (17.5%) | 378 (21.5%) |
| 8:00 AM to 8:29 AM | 259 (15.7%) | 314 (17.9%) |
| 8:30 AM to 8:59 AM | 133 (8.1%) | 96 (5.5%) |
| 9:00 AM to 9:59 AM | 92 (5.6%) | 134 (7.6%) |
| 10:00 AM to 10:59 AM | 110 (6.7%) | 72 (4.1%) |
| 11:00 AM to 11:59 AM | 13 (0.8%) | 65 (3.7%) |
| 12:00 PM to 3:59 PM | 131 (8.0%) | 129 (7.3%) |
| 4:00 PM to 11:59 PM | 64 (3.9%) | 36 (2.1%) |
| Total | 1,645 (100.0%) | 1,758 (100.0%) |
Housing Occupancy in Montpelier
Occupancy by Ownership in Montpelier
Of the total 3,861 dwellings in Montpelier, owner-occupied units account for 2,154 (55.8%), while renter-occupied units make up 1,707 (44.2%).
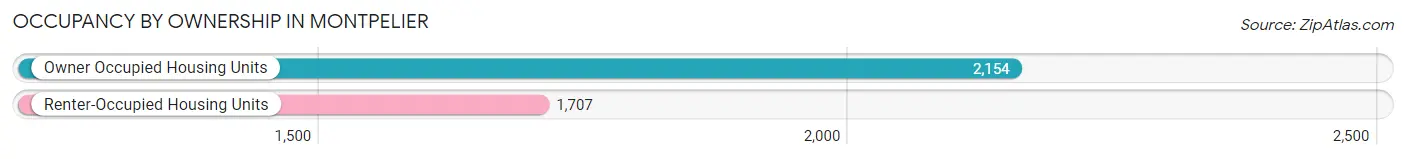
| Occupancy | # Housing Units | % Housing Units |
| Owner Occupied Housing Units | 2,154 | 55.8% |
| Renter-Occupied Housing Units | 1,707 | 44.2% |
| Total Occupied Housing Units | 3,861 | 100.0% |
Occupancy by Household Size in Montpelier
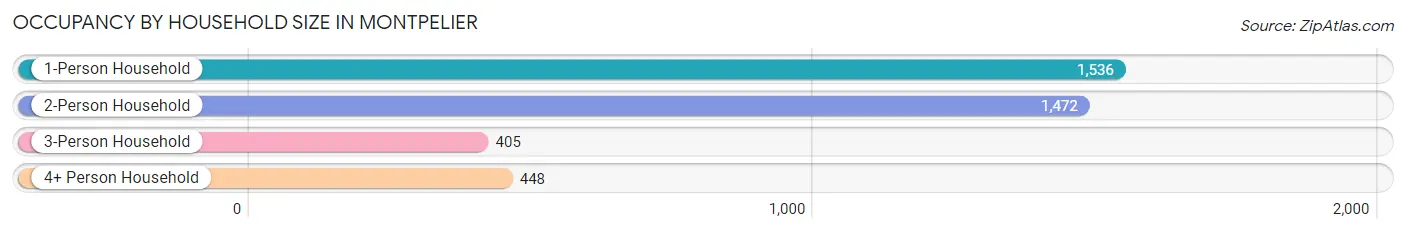
| Household Size | # Housing Units | % Housing Units |
| 1-Person Household | 1,536 | 39.8% |
| 2-Person Household | 1,472 | 38.1% |
| 3-Person Household | 405 | 10.5% |
| 4+ Person Household | 448 | 11.6% |
| Total Housing Units | 3,861 | 100.0% |
Occupancy by Ownership by Household Size in Montpelier
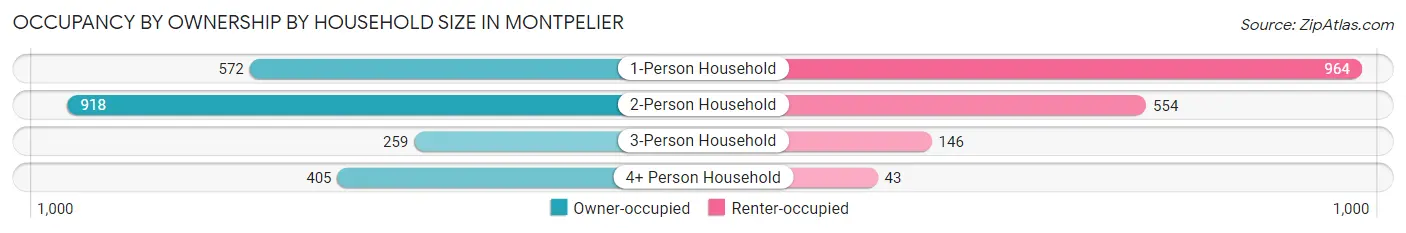
| Household Size | Owner-occupied | Renter-occupied |
| 1-Person Household | 572 (37.2%) | 964 (62.8%) |
| 2-Person Household | 918 (62.4%) | 554 (37.6%) |
| 3-Person Household | 259 (63.9%) | 146 (36.0%) |
| 4+ Person Household | 405 (90.4%) | 43 (9.6%) |
| Total Housing Units | 2,154 (55.8%) | 1,707 (44.2%) |
Occupancy by Educational Attainment in Montpelier
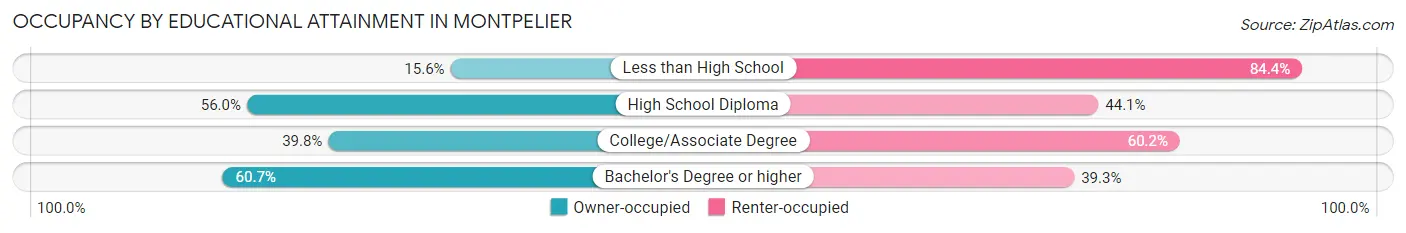
| Household Size | Owner-occupied | Renter-occupied |
| Less than High School | 12 (15.6%) | 65 (84.4%) |
| High School Diploma | 301 (55.9%) | 237 (44.1%) |
| College/Associate Degree | 248 (39.8%) | 375 (60.2%) |
| Bachelor's Degree or higher | 1,593 (60.7%) | 1,030 (39.3%) |
Occupancy by Age of Householder in Montpelier
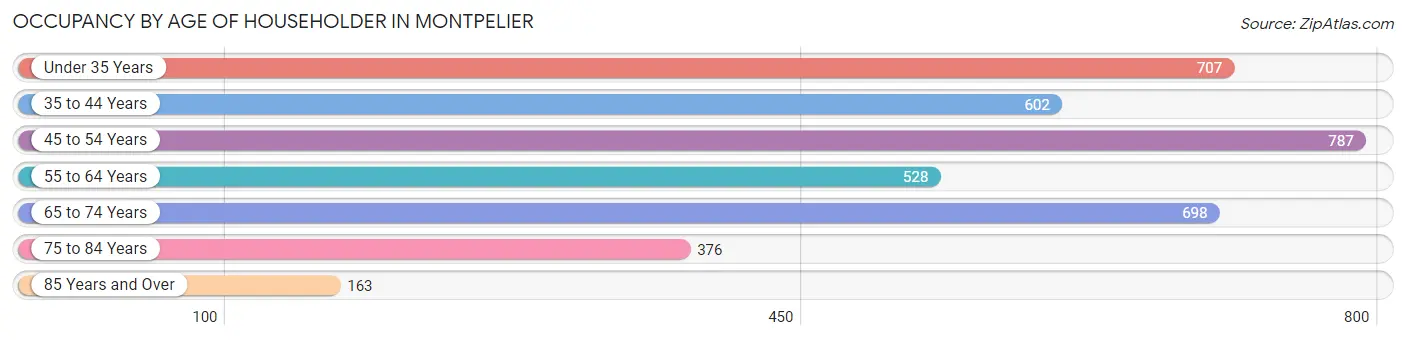
| Age Bracket | # Households | % Households |
| Under 35 Years | 707 | 18.3% |
| 35 to 44 Years | 602 | 15.6% |
| 45 to 54 Years | 787 | 20.4% |
| 55 to 64 Years | 528 | 13.7% |
| 65 to 74 Years | 698 | 18.1% |
| 75 to 84 Years | 376 | 9.7% |
| 85 Years and Over | 163 | 4.2% |
| Total | 3,861 | 100.0% |
Housing Finances in Montpelier
Median Income by Occupancy in Montpelier
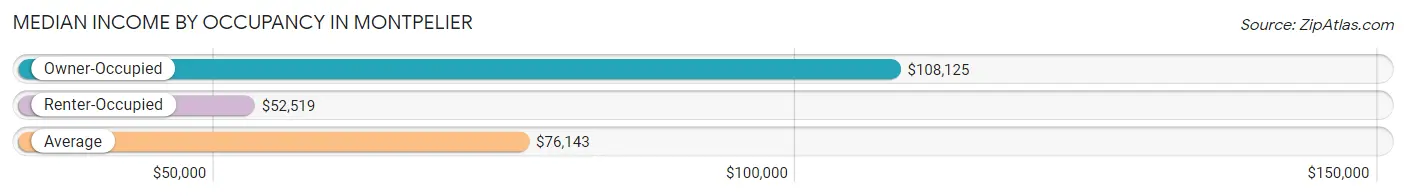
| Occupancy Type | # Households | Median Income |
| Owner-Occupied | 2,154 (55.8%) | $108,125 |
| Renter-Occupied | 1,707 (44.2%) | $52,519 |
| Average | 3,861 (100.0%) | $76,143 |
Occupancy by Householder Income Bracket in Montpelier
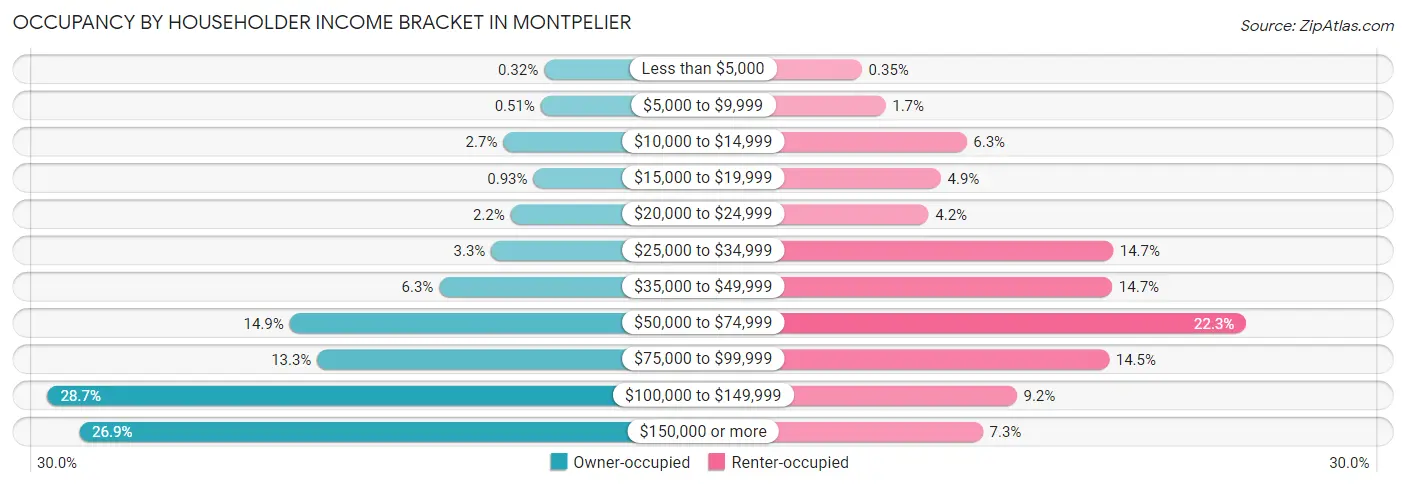
| Income Bracket | Owner-occupied | Renter-occupied |
| Less than $5,000 | 7 (0.3%) | 6 (0.4%) |
| $5,000 to $9,999 | 11 (0.5%) | 29 (1.7%) |
| $10,000 to $14,999 | 57 (2.6%) | 108 (6.3%) |
| $15,000 to $19,999 | 20 (0.9%) | 83 (4.9%) |
| $20,000 to $24,999 | 48 (2.2%) | 71 (4.2%) |
| $25,000 to $34,999 | 72 (3.3%) | 251 (14.7%) |
| $35,000 to $49,999 | 136 (6.3%) | 250 (14.6%) |
| $50,000 to $74,999 | 320 (14.9%) | 381 (22.3%) |
| $75,000 to $99,999 | 286 (13.3%) | 247 (14.5%) |
| $100,000 to $149,999 | 618 (28.7%) | 157 (9.2%) |
| $150,000 or more | 579 (26.9%) | 124 (7.3%) |
| Total | 2,154 (100.0%) | 1,707 (100.0%) |
Monthly Housing Cost Tiers in Montpelier
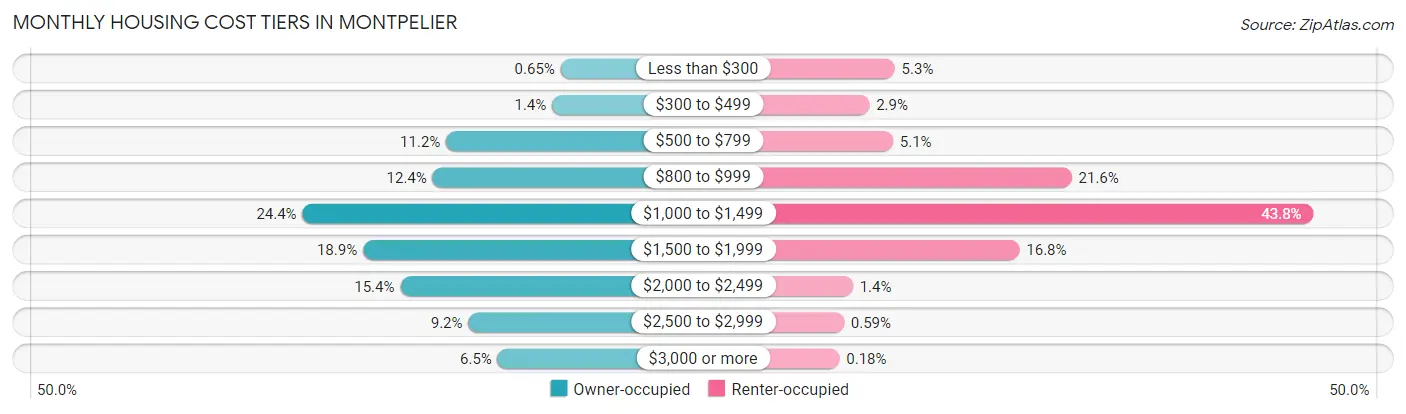
| Monthly Cost | Owner-occupied | Renter-occupied |
| Less than $300 | 14 (0.6%) | 90 (5.3%) |
| $300 to $499 | 31 (1.4%) | 50 (2.9%) |
| $500 to $799 | 241 (11.2%) | 87 (5.1%) |
| $800 to $999 | 268 (12.4%) | 368 (21.6%) |
| $1,000 to $1,499 | 526 (24.4%) | 748 (43.8%) |
| $1,500 to $1,999 | 406 (18.9%) | 286 (16.8%) |
| $2,000 to $2,499 | 332 (15.4%) | 24 (1.4%) |
| $2,500 to $2,999 | 197 (9.1%) | 10 (0.6%) |
| $3,000 or more | 139 (6.5%) | 3 (0.2%) |
| Total | 2,154 (100.0%) | 1,707 (100.0%) |
Physical Housing Characteristics in Montpelier
Housing Structures in Montpelier
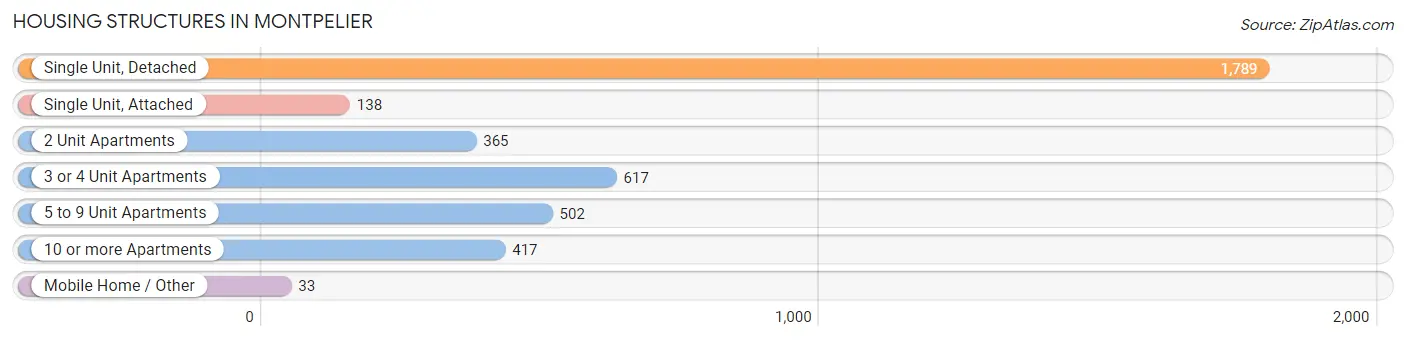
| Structure Type | # Housing Units | % Housing Units |
| Single Unit, Detached | 1,789 | 46.3% |
| Single Unit, Attached | 138 | 3.6% |
| 2 Unit Apartments | 365 | 9.5% |
| 3 or 4 Unit Apartments | 617 | 16.0% |
| 5 to 9 Unit Apartments | 502 | 13.0% |
| 10 or more Apartments | 417 | 10.8% |
| Mobile Home / Other | 33 | 0.9% |
| Total | 3,861 | 100.0% |
Housing Structures by Occupancy in Montpelier
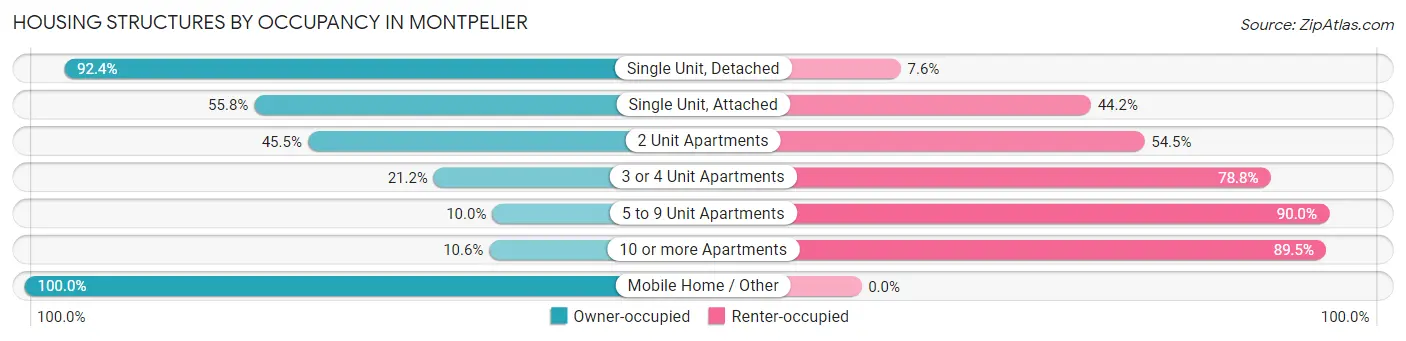
| Structure Type | Owner-occupied | Renter-occupied |
| Single Unit, Detached | 1,653 (92.4%) | 136 (7.6%) |
| Single Unit, Attached | 77 (55.8%) | 61 (44.2%) |
| 2 Unit Apartments | 166 (45.5%) | 199 (54.5%) |
| 3 or 4 Unit Apartments | 131 (21.2%) | 486 (78.8%) |
| 5 to 9 Unit Apartments | 50 (10.0%) | 452 (90.0%) |
| 10 or more Apartments | 44 (10.5%) | 373 (89.4%) |
| Mobile Home / Other | 33 (100.0%) | 0 (0.0%) |
| Total | 2,154 (55.8%) | 1,707 (44.2%) |
Housing Structures by Number of Rooms in Montpelier
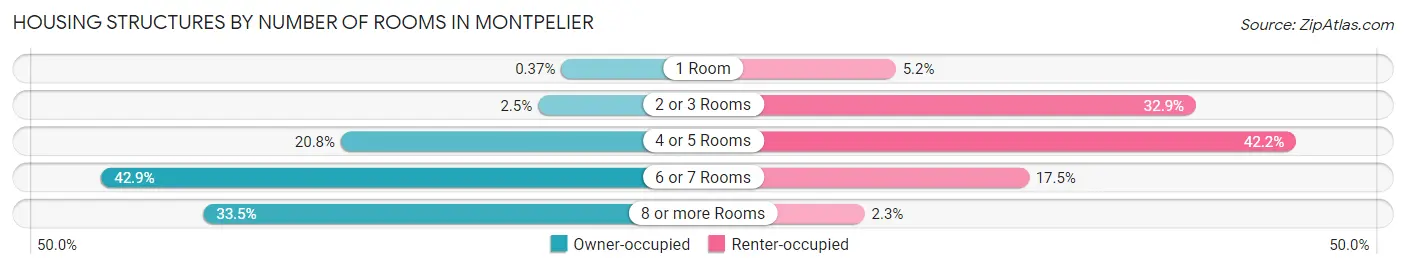
| Number of Rooms | Owner-occupied | Renter-occupied |
| 1 Room | 8 (0.4%) | 88 (5.2%) |
| 2 or 3 Rooms | 54 (2.5%) | 562 (32.9%) |
| 4 or 5 Rooms | 447 (20.7%) | 720 (42.2%) |
| 6 or 7 Rooms | 924 (42.9%) | 298 (17.5%) |
| 8 or more Rooms | 721 (33.5%) | 39 (2.3%) |
| Total | 2,154 (100.0%) | 1,707 (100.0%) |
Housing Structure by Heating Type in Montpelier
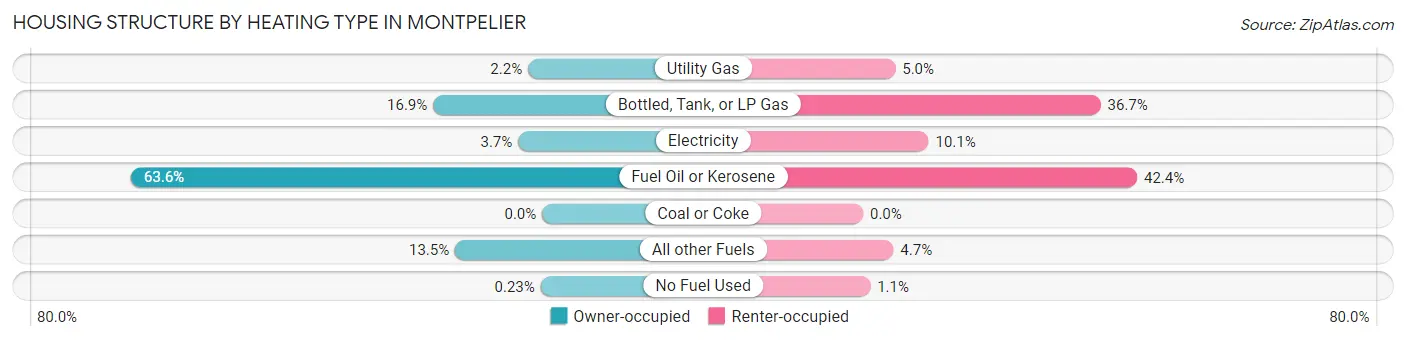
| Heating Type | Owner-occupied | Renter-occupied |
| Utility Gas | 47 (2.2%) | 85 (5.0%) |
| Bottled, Tank, or LP Gas | 363 (16.9%) | 627 (36.7%) |
| Electricity | 80 (3.7%) | 173 (10.1%) |
| Fuel Oil or Kerosene | 1,369 (63.6%) | 723 (42.4%) |
| Coal or Coke | 0 (0.0%) | 0 (0.0%) |
| All other Fuels | 290 (13.5%) | 80 (4.7%) |
| No Fuel Used | 5 (0.2%) | 19 (1.1%) |
| Total | 2,154 (100.0%) | 1,707 (100.0%) |
Household Vehicle Usage in Montpelier
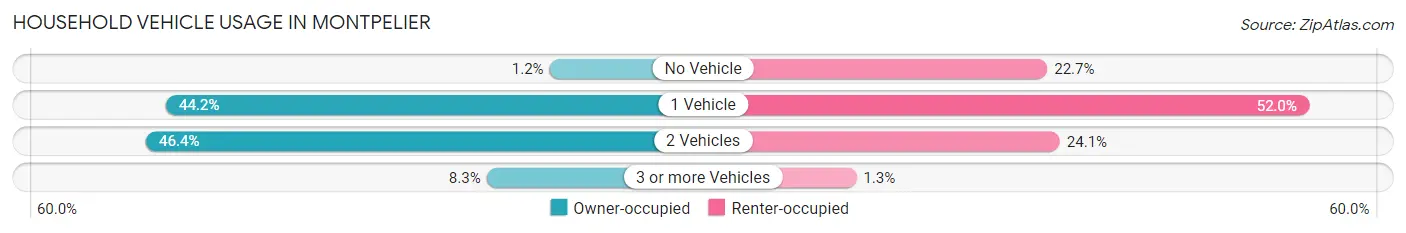
| Vehicles per Household | Owner-occupied | Renter-occupied |
| No Vehicle | 26 (1.2%) | 387 (22.7%) |
| 1 Vehicle | 951 (44.2%) | 887 (52.0%) |
| 2 Vehicles | 999 (46.4%) | 411 (24.1%) |
| 3 or more Vehicles | 178 (8.3%) | 22 (1.3%) |
| Total | 2,154 (100.0%) | 1,707 (100.0%) |
Real Estate & Mortgages in Montpelier
Real Estate and Mortgage Overview in Montpelier
| Characteristic | Without Mortgage | With Mortgage |
| Housing Units | 734 | 1,420 |
| Median Property Value | $319,400 | $330,500 |
| Median Household Income | $90,750 | $447 |
| Monthly Housing Costs | $970 | $139 |
| Real Estate Taxes | $6,657 | $0 |
Property Value by Mortgage Status in Montpelier
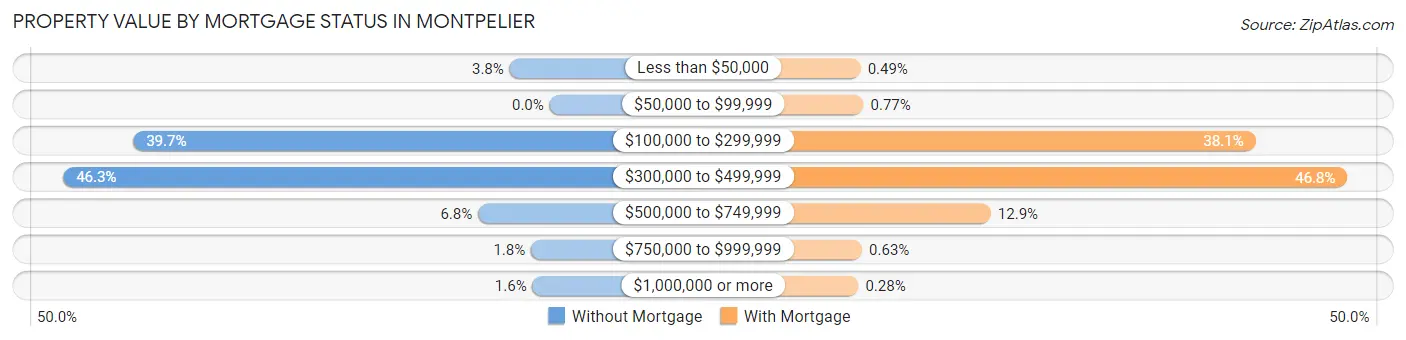
| Property Value | Without Mortgage | With Mortgage |
| Less than $50,000 | 28 (3.8%) | 7 (0.5%) |
| $50,000 to $99,999 | 0 (0.0%) | 11 (0.8%) |
| $100,000 to $299,999 | 291 (39.7%) | 541 (38.1%) |
| $300,000 to $499,999 | 340 (46.3%) | 665 (46.8%) |
| $500,000 to $749,999 | 50 (6.8%) | 183 (12.9%) |
| $750,000 to $999,999 | 13 (1.8%) | 9 (0.6%) |
| $1,000,000 or more | 12 (1.6%) | 4 (0.3%) |
| Total | 734 (100.0%) | 1,420 (100.0%) |
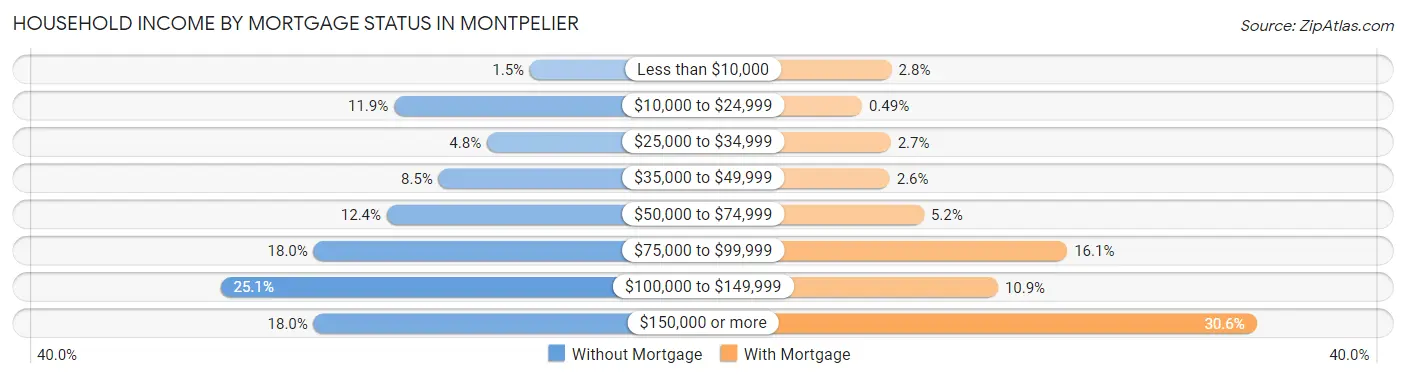
Household Income by Mortgage Status in Montpelier
| Household Income | Without Mortgage | With Mortgage |
| Less than $10,000 | 11 (1.5%) | 39 (2.8%) |
| $10,000 to $24,999 | 87 (11.8%) | 7 (0.5%) |
| $25,000 to $34,999 | 35 (4.8%) | 38 (2.7%) |
| $35,000 to $49,999 | 62 (8.5%) | 37 (2.6%) |
| $50,000 to $74,999 | 91 (12.4%) | 74 (5.2%) |
| $75,000 to $99,999 | 132 (18.0%) | 229 (16.1%) |
| $100,000 to $149,999 | 184 (25.1%) | 154 (10.8%) |
| $150,000 or more | 132 (18.0%) | 434 (30.6%) |
| Total | 734 (100.0%) | 1,420 (100.0%) |
Property Value to Household Income Ratio in Montpelier
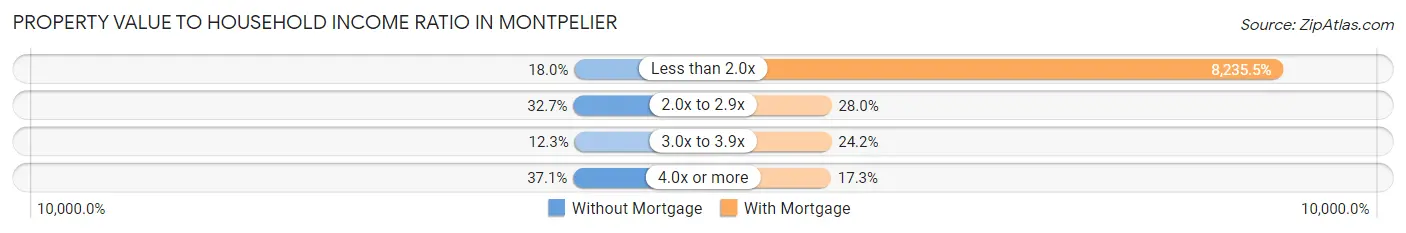
| Value-to-Income Ratio | Without Mortgage | With Mortgage |
| Less than 2.0x | 132 (18.0%) | 116,944 (8,235.5%) |
| 2.0x to 2.9x | 240 (32.7%) | 398 (28.0%) |
| 3.0x to 3.9x | 90 (12.3%) | 343 (24.1%) |
| 4.0x or more | 272 (37.1%) | 246 (17.3%) |
| Total | 734 (100.0%) | 1,420 (100.0%) |
Real Estate Taxes by Mortgage Status in Montpelier
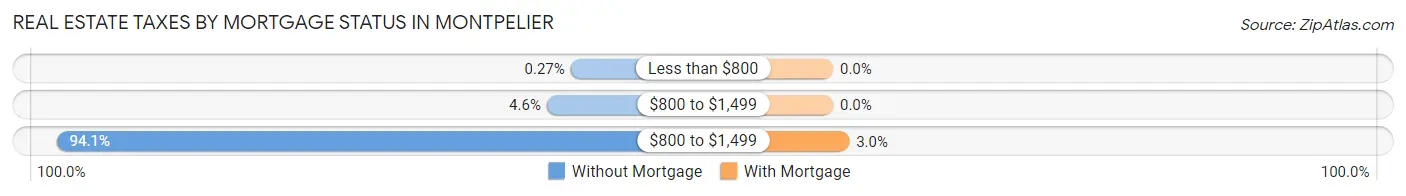
| Property Taxes | Without Mortgage | With Mortgage |
| Less than $800 | 2 (0.3%) | 0 (0.0%) |
| $800 to $1,499 | 34 (4.6%) | 0 (0.0%) |
| $800 to $1,499 | 691 (94.1%) | 42 (3.0%) |
| Total | 734 (100.0%) | 1,420 (100.0%) |
Health & Disability in Montpelier
Health Insurance Coverage by Age in Montpelier
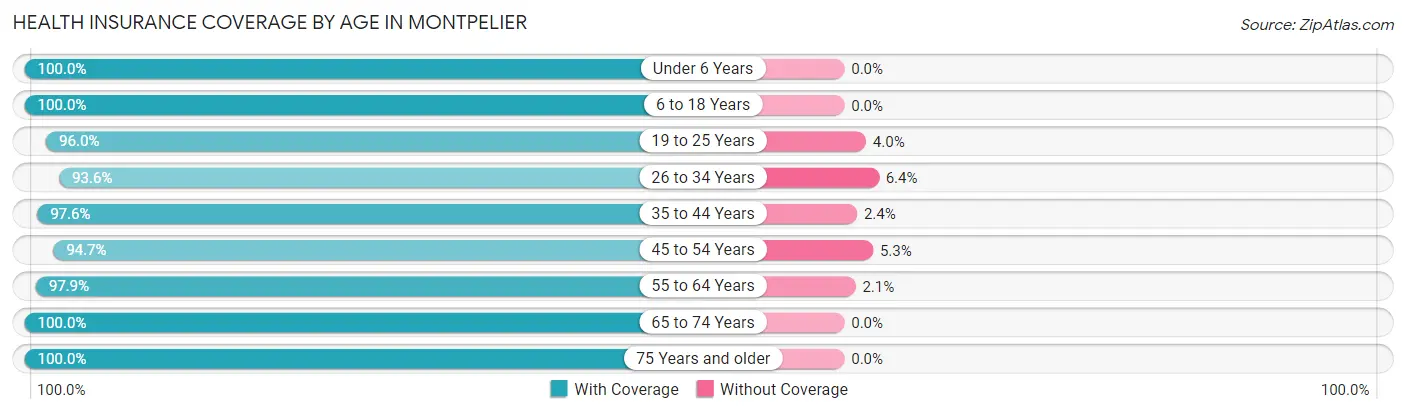
| Age Bracket | With Coverage | Without Coverage |
| Under 6 Years | 225 (100.0%) | 0 (0.0%) |
| 6 to 18 Years | 1,257 (100.0%) | 0 (0.0%) |
| 19 to 25 Years | 453 (96.0%) | 19 (4.0%) |
| 26 to 34 Years | 1,122 (93.6%) | 77 (6.4%) |
| 35 to 44 Years | 952 (97.6%) | 23 (2.4%) |
| 45 to 54 Years | 1,117 (94.7%) | 63 (5.3%) |
| 55 to 64 Years | 844 (97.9%) | 18 (2.1%) |
| 65 to 74 Years | 1,126 (100.0%) | 0 (0.0%) |
| 75 Years and older | 700 (100.0%) | 0 (0.0%) |
| Total | 7,796 (97.5%) | 200 (2.5%) |
Health Insurance Coverage by Citizenship Status in Montpelier
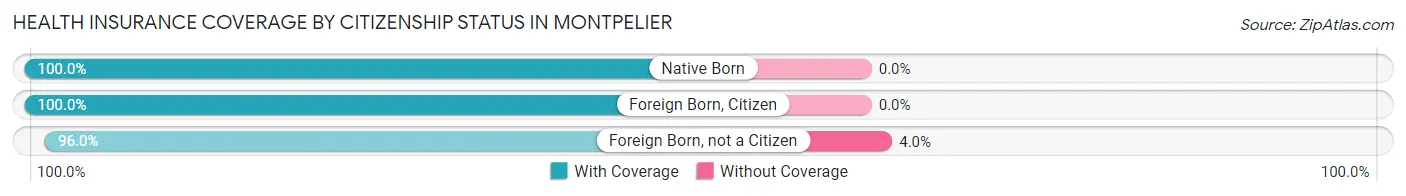
| Citizenship Status | With Coverage | Without Coverage |
| Native Born | 225 (100.0%) | 0 (0.0%) |
| Foreign Born, Citizen | 1,257 (100.0%) | 0 (0.0%) |
| Foreign Born, not a Citizen | 453 (96.0%) | 19 (4.0%) |
Health Insurance Coverage by Household Income in Montpelier
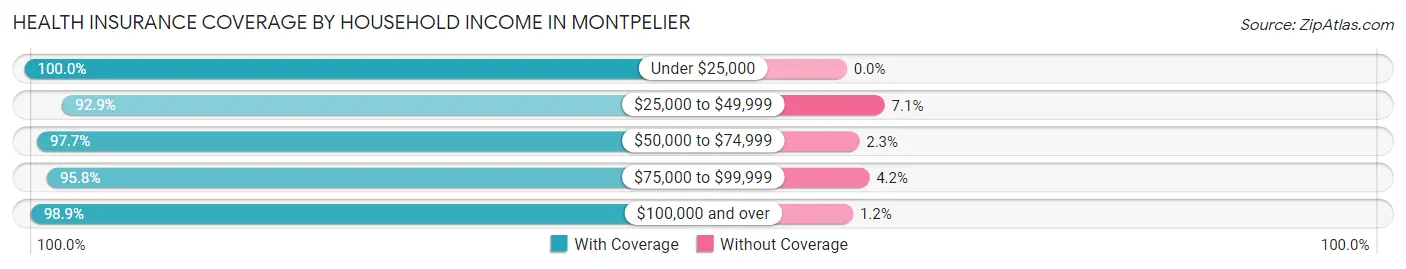
| Household Income | With Coverage | Without Coverage |
| Under $25,000 | 541 (100.0%) | 0 (0.0%) |
| $25,000 to $49,999 | 1,048 (92.9%) | 80 (7.1%) |
| $50,000 to $74,999 | 1,126 (97.7%) | 27 (2.3%) |
| $75,000 to $99,999 | 1,072 (95.8%) | 47 (4.2%) |
| $100,000 and over | 3,971 (98.9%) | 46 (1.1%) |
Public vs Private Health Insurance Coverage by Age in Montpelier
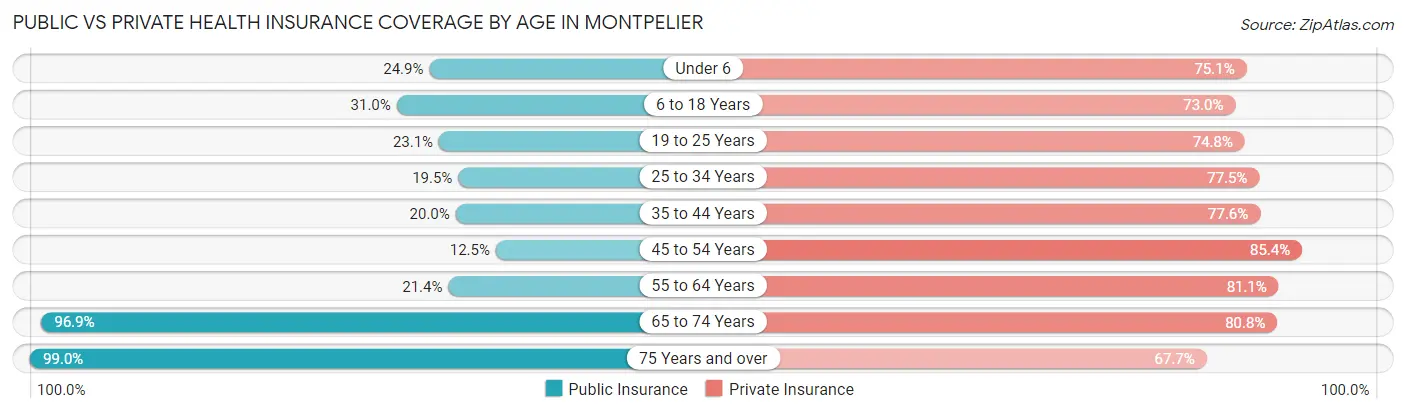
| Age Bracket | Public Insurance | Private Insurance |
| Under 6 | 56 (24.9%) | 169 (75.1%) |
| 6 to 18 Years | 389 (30.9%) | 918 (73.0%) |
| 19 to 25 Years | 109 (23.1%) | 353 (74.8%) |
| 25 to 34 Years | 234 (19.5%) | 929 (77.5%) |
| 35 to 44 Years | 195 (20.0%) | 757 (77.6%) |
| 45 to 54 Years | 148 (12.5%) | 1,008 (85.4%) |
| 55 to 64 Years | 184 (21.3%) | 699 (81.1%) |
| 65 to 74 Years | 1,091 (96.9%) | 910 (80.8%) |
| 75 Years and over | 693 (99.0%) | 474 (67.7%) |
| Total | 3,099 (38.8%) | 6,217 (77.7%) |
Disability Status by Sex by Age in Montpelier
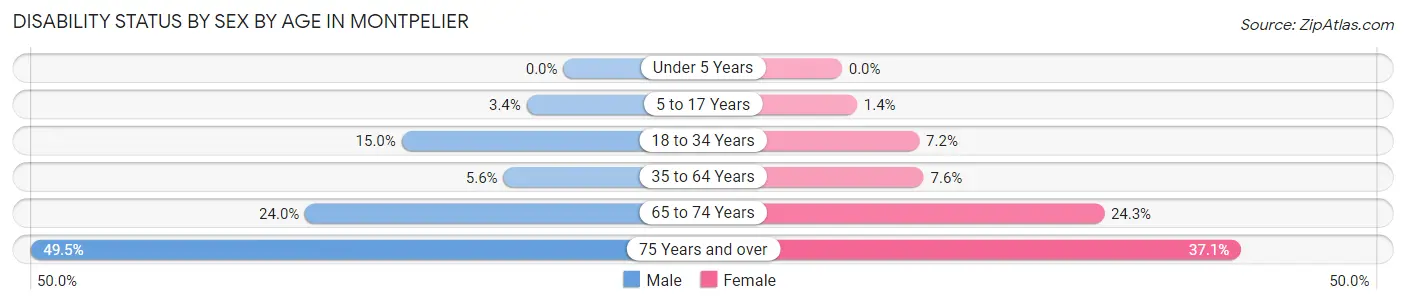
| Age Bracket | Male | Female |
| Under 5 Years | 0 (0.0%) | 0 (0.0%) |
| 5 to 17 Years | 19 (3.4%) | 9 (1.4%) |
| 18 to 34 Years | 122 (15.0%) | 69 (7.2%) |
| 35 to 64 Years | 74 (5.6%) | 128 (7.6%) |
| 65 to 74 Years | 127 (24.0%) | 145 (24.3%) |
| 75 Years and over | 94 (49.5%) | 189 (37.1%) |
Disability Class by Sex by Age in Montpelier
Disability Class: Hearing Difficulty
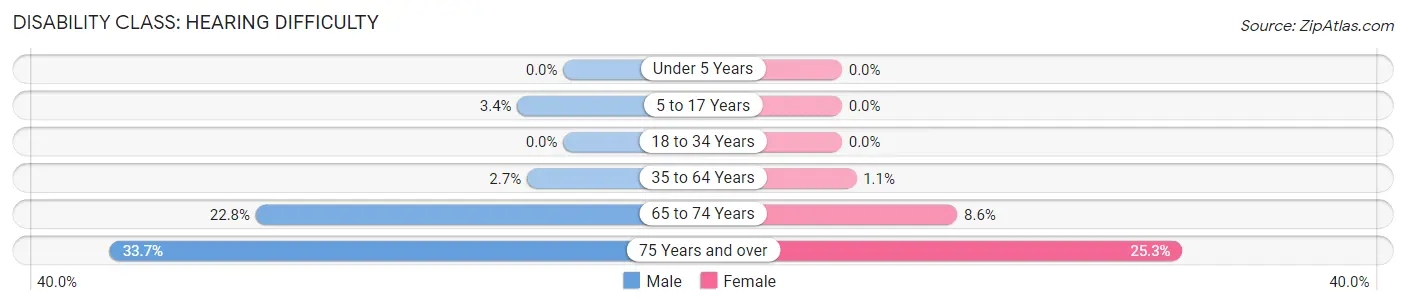
| Age Bracket | Male | Female |
| Under 5 Years | 0 (0.0%) | 0 (0.0%) |
| 5 to 17 Years | 19 (3.4%) | 0 (0.0%) |
| 18 to 34 Years | 0 (0.0%) | 0 (0.0%) |
| 35 to 64 Years | 36 (2.7%) | 18 (1.1%) |
| 65 to 74 Years | 121 (22.8%) | 51 (8.6%) |
| 75 Years and over | 64 (33.7%) | 129 (25.3%) |
Disability Class: Vision Difficulty
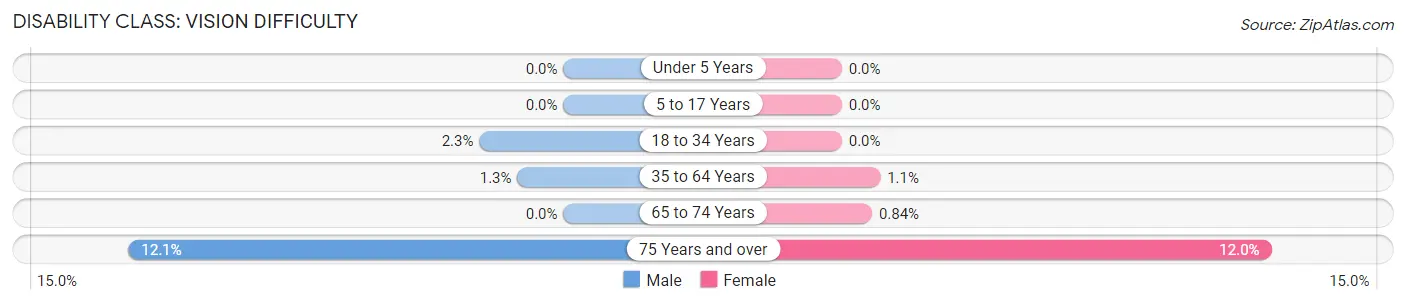
| Age Bracket | Male | Female |
| Under 5 Years | 0 (0.0%) | 0 (0.0%) |
| 5 to 17 Years | 0 (0.0%) | 0 (0.0%) |
| 18 to 34 Years | 19 (2.3%) | 0 (0.0%) |
| 35 to 64 Years | 17 (1.3%) | 18 (1.1%) |
| 65 to 74 Years | 0 (0.0%) | 5 (0.8%) |
| 75 Years and over | 23 (12.1%) | 61 (12.0%) |
Disability Class: Cognitive Difficulty
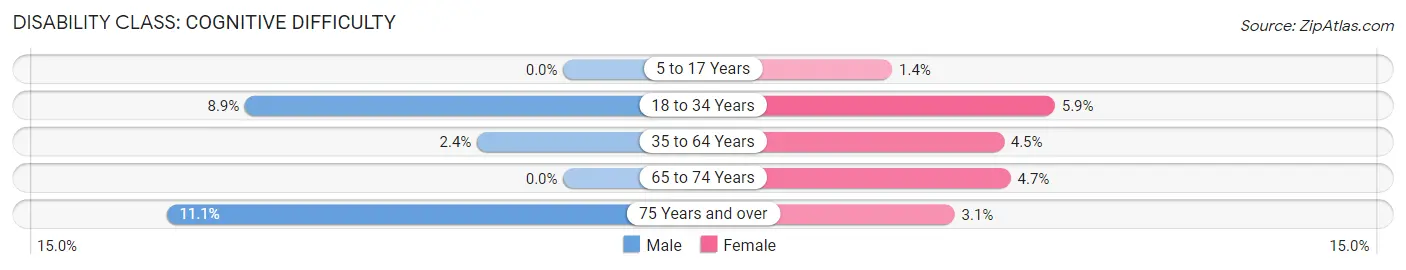
| Age Bracket | Male | Female |
| 5 to 17 Years | 0 (0.0%) | 9 (1.4%) |
| 18 to 34 Years | 72 (8.9%) | 57 (5.9%) |
| 35 to 64 Years | 32 (2.4%) | 76 (4.5%) |
| 65 to 74 Years | 0 (0.0%) | 28 (4.7%) |
| 75 Years and over | 21 (11.1%) | 16 (3.1%) |
Disability Class: Ambulatory Difficulty
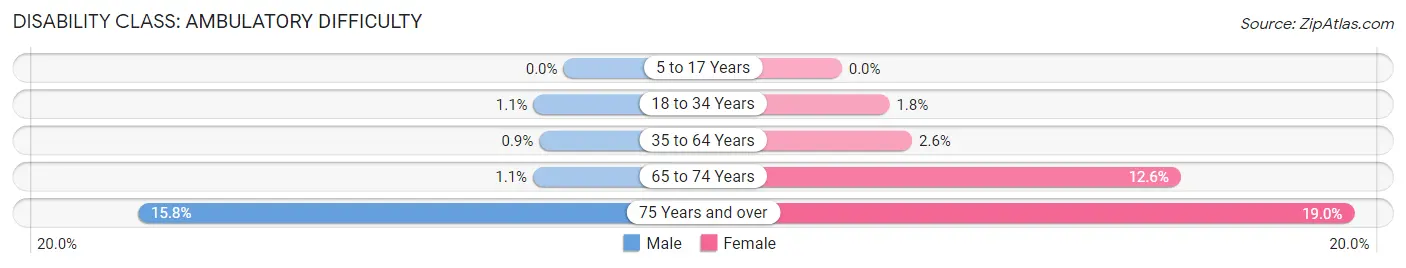
| Age Bracket | Male | Female |
| 5 to 17 Years | 0 (0.0%) | 0 (0.0%) |
| 18 to 34 Years | 9 (1.1%) | 17 (1.8%) |
| 35 to 64 Years | 12 (0.9%) | 44 (2.6%) |
| 65 to 74 Years | 6 (1.1%) | 75 (12.6%) |
| 75 Years and over | 30 (15.8%) | 97 (19.0%) |
Disability Class: Self-Care Difficulty
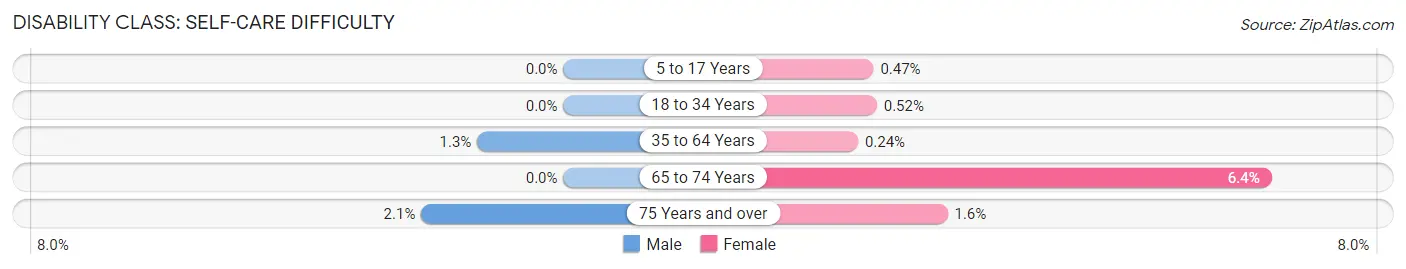
| Age Bracket | Male | Female |
| 5 to 17 Years | 0 (0.0%) | 3 (0.5%) |
| 18 to 34 Years | 0 (0.0%) | 5 (0.5%) |
| 35 to 64 Years | 17 (1.3%) | 4 (0.2%) |
| 65 to 74 Years | 0 (0.0%) | 38 (6.4%) |
| 75 Years and over | 4 (2.1%) | 8 (1.6%) |
Technology Access in Montpelier
Computing Device Access in Montpelier
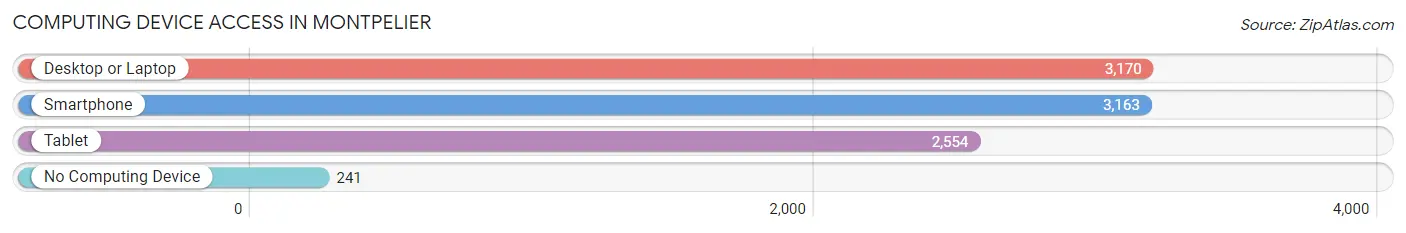
| Device Type | # Households | % Households |
| Desktop or Laptop | 3,170 | 82.1% |
| Smartphone | 3,163 | 81.9% |
| Tablet | 2,554 | 66.1% |
| No Computing Device | 241 | 6.2% |
| Total | 3,861 | 100.0% |
Internet Access in Montpelier
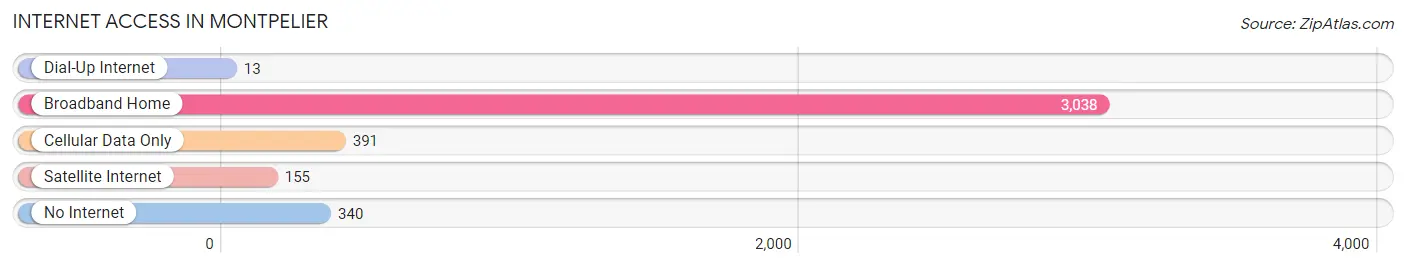
| Internet Type | # Households | % Households |
| Dial-Up Internet | 13 | 0.3% |
| Broadband Home | 3,038 | 78.7% |
| Cellular Data Only | 391 | 10.1% |
| Satellite Internet | 155 | 4.0% |
| No Internet | 340 | 8.8% |
| Total | 3,861 | 100.0% |
Montpelier Summary
Montpelier, Vermont is the capital of the state and the smallest state capital in the United States. It is located in Washington County, in the center of the state, and is the only state capital without a McDonald’s. The city is home to a population of 8,035 people, as of the 2010 census.
History
Montpelier was first settled in 1787 by settlers from Massachusetts and Connecticut. The city was named after the French city of Montpellier, and was incorporated in 1791. The city was originally a farming community, but soon developed into a center of commerce and industry. The city was the site of the first state capitol building, which was built in 1808.
The city was an important center of the abolitionist movement in the 19th century, and was home to several prominent abolitionists, including William Lloyd Garrison and Frederick Douglass. The city was also the site of the first African-American newspaper, The Liberator, which was published by Garrison in 1831.
Geography
Montpelier is located in the center of Vermont, in Washington County. The city is situated on the Winooski River, and is surrounded by hills and mountains. The city is located at an elevation of 645 feet above sea level. The city has a total area of 4.2 square miles, of which 4.1 square miles is land and 0.1 square miles is water.
Economy
Montpelier’s economy is largely based on government and tourism. The city is home to the Vermont State House, the state capitol building, and is a popular destination for tourists. The city is also home to several large employers, including the National Life Group, the Vermont Department of Corrections, and the Vermont State Hospital.
Demographics
As of the 2010 census, Montpelier had a population of 8,035 people. The racial makeup of the city was 94.2% White, 1.2% African American, 0.3% Native American, 1.2% Asian, 0.1% Pacific Islander, 1.2% from other races, and 1.9% from two or more races. The median household income was $45,945, and the median family income was $60,917. The per capita income was $27,845.
Montpelier is a small city with a rich history and a vibrant economy. The city is home to a diverse population, and is a popular destination for tourists. The city is home to several large employers, and is an important center of government and commerce in the state of Vermont.
Common Questions
What is Per Capita Income in Montpelier?
Per Capita income in Montpelier is $48,616.
What is the Median Family Income in Montpelier?
Median Family Income in Montpelier is $112,216.
What is the Median Household income in Montpelier?
Median Household Income in Montpelier is $76,143.
What is Income or Wage Gap in Montpelier?
Income or Wage Gap in Montpelier is 13.9%.
Women in Montpelier earn 86.1 cents for every dollar earned by a man.
What is Inequality or Gini Index in Montpelier?
Inequality or Gini Index in Montpelier is 0.41.
What is the Total Population of Montpelier?
Total Population of Montpelier is 8,030.
What is the Total Male Population of Montpelier?
Total Male Population of Montpelier is 3,515.
What is the Total Female Population of Montpelier?
Total Female Population of Montpelier is 4,515.
What is the Ratio of Males per 100 Females in Montpelier?
There are 77.85 Males per 100 Females in Montpelier.
What is the Ratio of Females per 100 Males in Montpelier?
There are 128.45 Females per 100 Males in Montpelier.
What is the Median Population Age in Montpelier?
Median Population Age in Montpelier is 44.0 Years.
What is the Average Family Size in Montpelier
Average Family Size in Montpelier is 2.8 People.
What is the Average Household Size in Montpelier
Average Household Size in Montpelier is 2.1 People.
How Large is the Labor Force in Montpelier?
There are 4,640 People in the Labor Forcein in Montpelier.
What is the Percentage of People in the Labor Force in Montpelier?
67.8% of People are in the Labor Force in Montpelier.
What is the Unemployment Rate in Montpelier?
Unemployment Rate in Montpelier is 3.0%.