Barre, VT Map & Demographics
Barre Map
Barre Overview
$33,285
PER CAPITA INCOME
$67,946
AVG FAMILY INCOME
$53,798
AVG HOUSEHOLD INCOME
3.7%
WAGE / INCOME GAP [ % ]
96.3¢/ $1
WAGE / INCOME GAP [ $ ]
0.49
INEQUALITY / GINI INDEX
8,488
TOTAL POPULATION
4,066
MALE POPULATION
4,422
FEMALE POPULATION
91.95
MALES / 100 FEMALES
108.76
FEMALES / 100 MALES
40.3
MEDIAN AGE
2.8
AVG FAMILY SIZE
2.2
AVG HOUSEHOLD SIZE
4,289
LABOR FORCE [ PEOPLE ]
60.8%
PERCENT IN LABOR FORCE
7.2%
UNEMPLOYMENT RATE
Barre Zip Codes
Barre Area Codes
Income in Barre
Income Overview in Barre
Per Capita Income in Barre is $33,285, while median incomes of families and households are $67,946 and $53,798 respectively.
| Characteristic | Number | Measure |
| Per Capita Income | 8,488 | $33,285 |
| Median Family Income | 2,003 | $67,946 |
| Mean Family Income | 2,003 | $88,631 |
| Median Household Income | 3,795 | $53,798 |
| Mean Household Income | 3,795 | $71,787 |
| Income Deficit | 2,003 | $0 |
| Wage / Income Gap (%) | 8,488 | 3.68% |
| Wage / Income Gap ($) | 8,488 | 96.32¢ per $1 |
| Gini / Inequality Index | 8,488 | 0.49 |
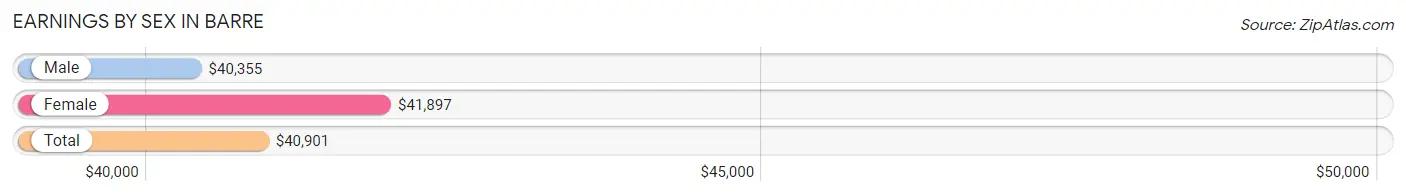
Earnings by Sex in Barre
Average Earnings in Barre are $40,901, $40,355 for men and $41,897 for women, a difference of 3.7%.
| Sex | Number | Average Earnings |
| Male | 2,060 (48.0%) | $40,355 |
| Female | 2,231 (52.0%) | $41,897 |
| Total | 4,291 (100.0%) | $40,901 |
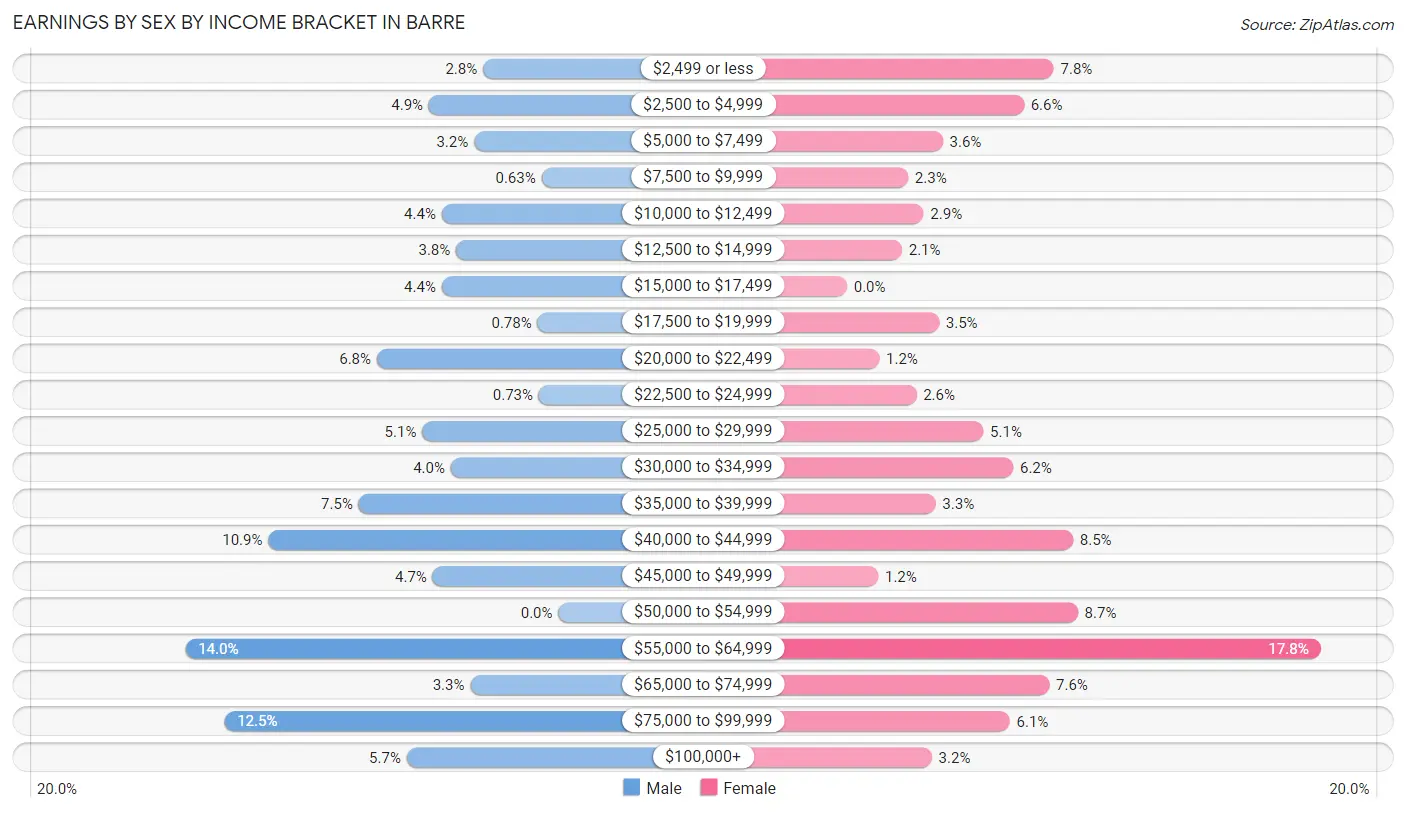
Earnings by Sex by Income Bracket in Barre
The most common earnings brackets in Barre are $55,000 to $64,999 for men (288 | 14.0%) and $55,000 to $64,999 for women (396 | 17.7%).
| Income | Male | Female |
| $2,499 or less | 58 (2.8%) | 173 (7.7%) |
| $2,500 to $4,999 | 100 (4.9%) | 148 (6.6%) |
| $5,000 to $7,499 | 65 (3.2%) | 80 (3.6%) |
| $7,500 to $9,999 | 13 (0.6%) | 51 (2.3%) |
| $10,000 to $12,499 | 90 (4.4%) | 64 (2.9%) |
| $12,500 to $14,999 | 79 (3.8%) | 46 (2.1%) |
| $15,000 to $17,499 | 90 (4.4%) | 0 (0.0%) |
| $17,500 to $19,999 | 16 (0.8%) | 77 (3.5%) |
| $20,000 to $22,499 | 140 (6.8%) | 27 (1.2%) |
| $22,500 to $24,999 | 15 (0.7%) | 58 (2.6%) |
| $25,000 to $29,999 | 105 (5.1%) | 114 (5.1%) |
| $30,000 to $34,999 | 83 (4.0%) | 139 (6.2%) |
| $35,000 to $39,999 | 154 (7.5%) | 74 (3.3%) |
| $40,000 to $44,999 | 224 (10.9%) | 189 (8.5%) |
| $45,000 to $49,999 | 97 (4.7%) | 26 (1.2%) |
| $50,000 to $54,999 | 0 (0.0%) | 193 (8.6%) |
| $55,000 to $64,999 | 288 (14.0%) | 396 (17.7%) |
| $65,000 to $74,999 | 68 (3.3%) | 169 (7.6%) |
| $75,000 to $99,999 | 258 (12.5%) | 136 (6.1%) |
| $100,000+ | 117 (5.7%) | 71 (3.2%) |
| Total | 2,060 (100.0%) | 2,231 (100.0%) |
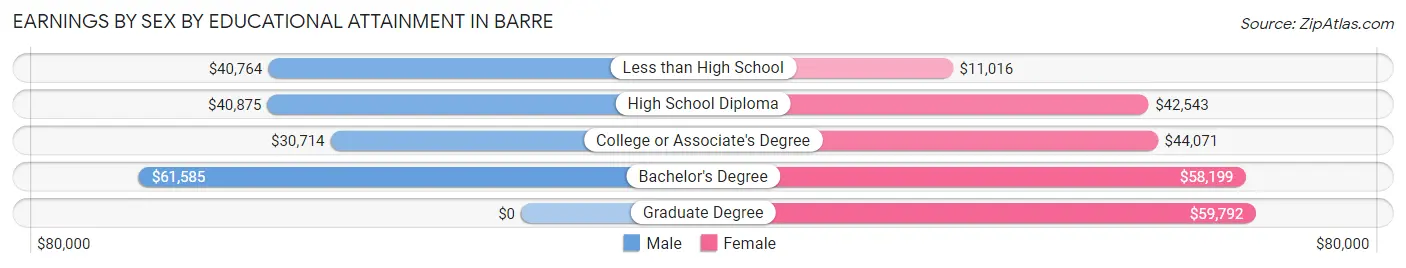
Earnings by Sex by Educational Attainment in Barre
Average earnings in Barre are $42,218 for men and $50,227 for women, a difference of 16.0%. Men with an educational attainment of bachelor's degree enjoy the highest average annual earnings of $61,585, while those with college or associate's degree education earn the least with $30,714. Women with an educational attainment of graduate degree earn the most with the average annual earnings of $59,792, while those with less than high school education have the smallest earnings of $11,016.
| Educational Attainment | Male Income | Female Income |
| Less than High School | $40,764 | $11,016 |
| High School Diploma | $40,875 | $42,543 |
| College or Associate's Degree | $30,714 | $44,071 |
| Bachelor's Degree | $61,585 | $58,199 |
| Graduate Degree | - | - |
| Total | $42,218 | $50,227 |
Family Income in Barre
Family Income Brackets in Barre
According to the Barre family income data, there are 375 families falling into the $75,000 to $99,999 income range, which is the most common income bracket and makes up 18.7% of all families. Conversely, the less than $10,000 income bracket is the least frequent group with only 76 families (3.8%) belonging to this category.
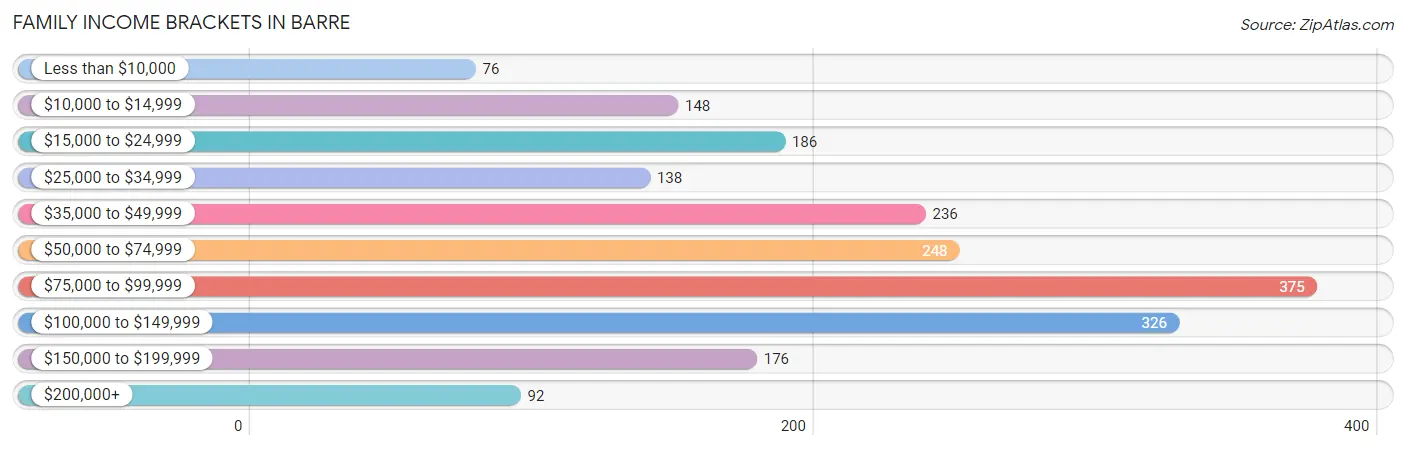
| Income Bracket | # Families | % Families |
| Less than $10,000 | 76 | 3.8% |
| $10,000 to $14,999 | 148 | 7.4% |
| $15,000 to $24,999 | 186 | 9.3% |
| $25,000 to $34,999 | 138 | 6.9% |
| $35,000 to $49,999 | 236 | 11.8% |
| $50,000 to $74,999 | 248 | 12.4% |
| $75,000 to $99,999 | 375 | 18.7% |
| $100,000 to $149,999 | 326 | 16.3% |
| $150,000 to $199,999 | 176 | 8.8% |
| $200,000+ | 92 | 4.6% |
Family Income by Famaliy Size in Barre
2-person families (1,005 | 50.2%) account for the highest median family income in Barre with $79,769 per family, while 2-person families (1,005 | 50.2%) have the highest median income of $39,884 per family member.
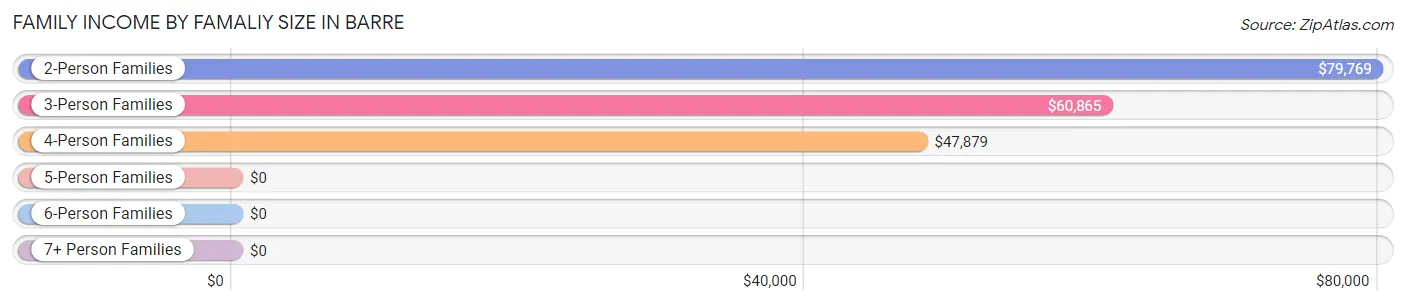
| Income Bracket | # Families | Median Income |
| 2-Person Families | 1,005 (50.2%) | $79,769 |
| 3-Person Families | 644 (32.2%) | $60,865 |
| 4-Person Families | 298 (14.9%) | $47,879 |
| 5-Person Families | 38 (1.9%) | $0 |
| 6-Person Families | 0 (0.0%) | $0 |
| 7+ Person Families | 18 (0.9%) | $0 |
| Total | 2,003 (100.0%) | $67,946 |
Family Income by Number of Earners in Barre
The median family income in Barre is $67,946, with families comprising 3+ earners (202) having the highest median family income of $119,569, while families with no earners (499) have the lowest median family income of $20,996, accounting for 10.1% and 24.9% of families, respectively.
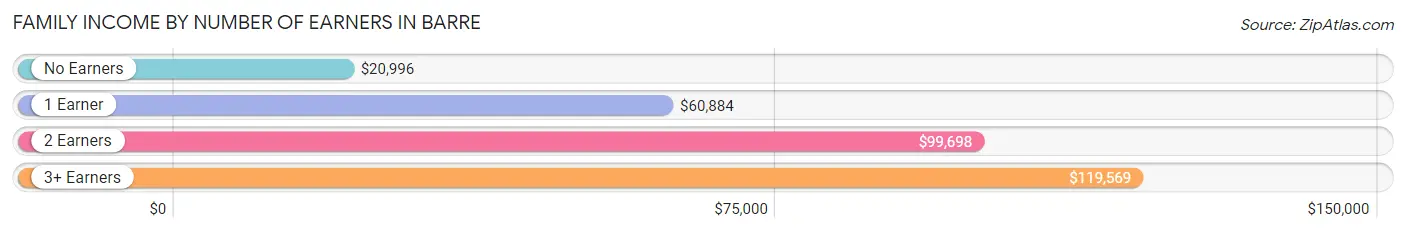
| Number of Earners | # Families | Median Income |
| No Earners | 499 (24.9%) | $20,996 |
| 1 Earner | 550 (27.5%) | $60,884 |
| 2 Earners | 752 (37.5%) | $99,698 |
| 3+ Earners | 202 (10.1%) | $119,569 |
| Total | 2,003 (100.0%) | $67,946 |
Household Income in Barre
Household Income Brackets in Barre
With 691 households falling in the category, the $50,000 to $74,999 income range is the most frequent in Barre, accounting for 18.2% of all households. In contrast, only 156 households (4.1%) fall into the $200,000+ income bracket, making it the least populous group.
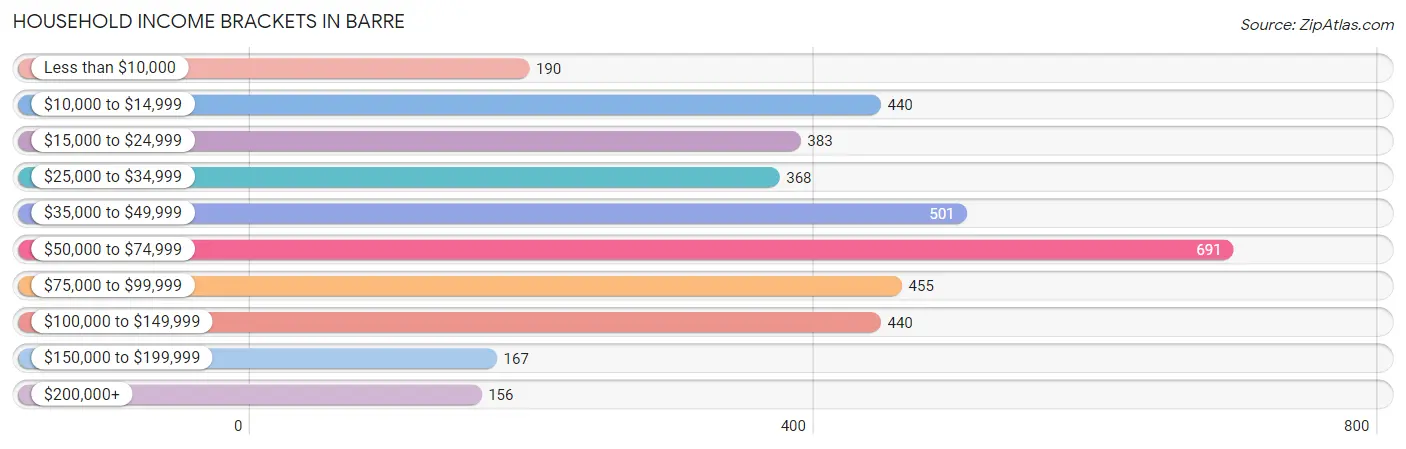
| Income Bracket | # Households | % Households |
| Less than $10,000 | 190 | 5.0% |
| $10,000 to $14,999 | 440 | 11.6% |
| $15,000 to $24,999 | 383 | 10.1% |
| $25,000 to $34,999 | 368 | 9.7% |
| $35,000 to $49,999 | 501 | 13.2% |
| $50,000 to $74,999 | 691 | 18.2% |
| $75,000 to $99,999 | 455 | 12.0% |
| $100,000 to $149,999 | 440 | 11.6% |
| $150,000 to $199,999 | 167 | 4.4% |
| $200,000+ | 156 | 4.1% |
Household Income by Householder Age in Barre
The median household income in Barre is $53,798, with the highest median household income of $60,243 found in the 45 to 64 years age bracket for the primary householder. A total of 1,636 households (43.1%) fall into this category. Meanwhile, the 15 to 24 years age bracket for the primary householder has the lowest median household income of $0, with 92 households (2.4%) in this group.
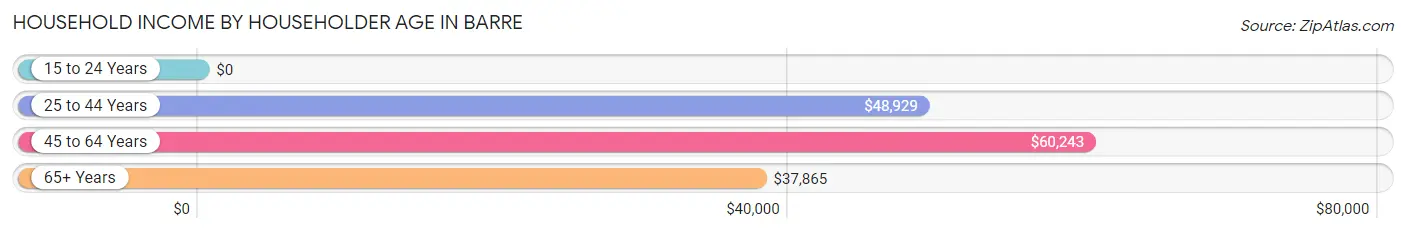
| Income Bracket | # Households | Median Income |
| 15 to 24 Years | 92 (2.4%) | $0 |
| 25 to 44 Years | 1,268 (33.4%) | $48,929 |
| 45 to 64 Years | 1,636 (43.1%) | $60,243 |
| 65+ Years | 799 (21.0%) | $37,865 |
| Total | 3,795 (100.0%) | $53,798 |
Poverty in Barre
Income Below Poverty by Sex and Age in Barre
With 21.4% poverty level for males and 26.6% for females among the residents of Barre, 15 year old males and 16 and 17 year old females are the most vulnerable to poverty, with 45 males (84.9%) and 87 females (61.7%) in their respective age groups living below the poverty level.
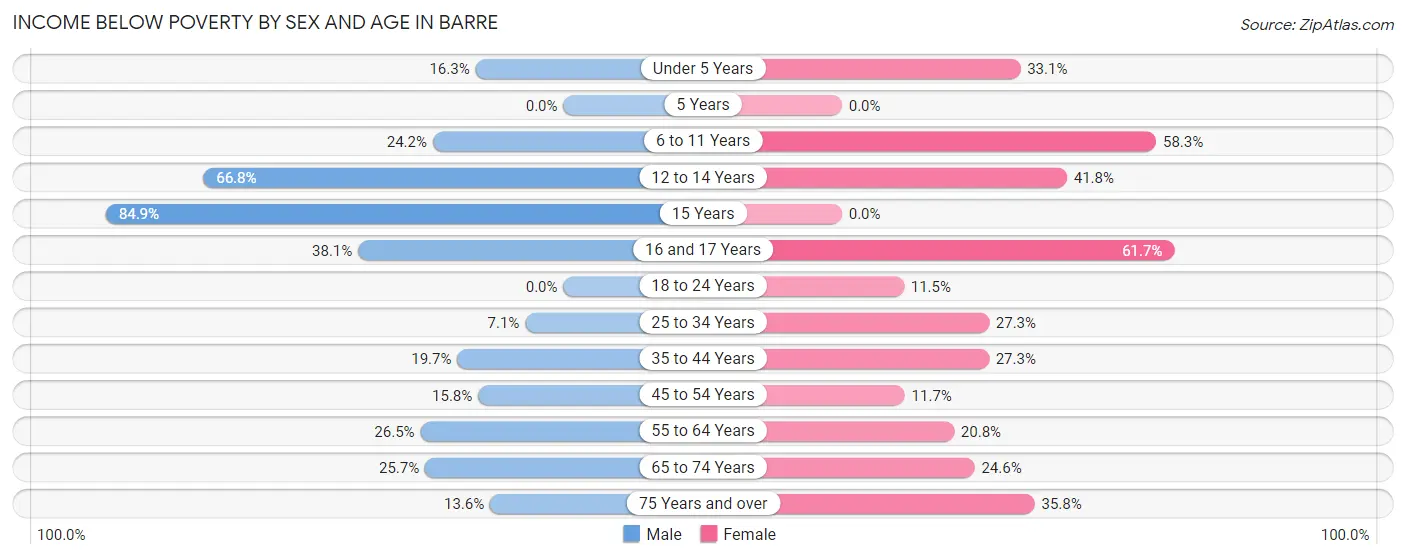
| Age Bracket | Male | Female |
| Under 5 Years | 23 (16.3%) | 51 (33.1%) |
| 5 Years | 0 (0.0%) | 0 (0.0%) |
| 6 to 11 Years | 71 (24.2%) | 147 (58.3%) |
| 12 to 14 Years | 141 (66.8%) | 38 (41.8%) |
| 15 Years | 45 (84.9%) | 0 (0.0%) |
| 16 and 17 Years | 64 (38.1%) | 87 (61.7%) |
| 18 to 24 Years | 0 (0.0%) | 39 (11.5%) |
| 25 to 34 Years | 40 (7.1%) | 205 (27.3%) |
| 35 to 44 Years | 77 (19.7%) | 186 (27.3%) |
| 45 to 54 Years | 78 (15.8%) | 44 (11.7%) |
| 55 to 64 Years | 199 (26.5%) | 175 (20.8%) |
| 65 to 74 Years | 86 (25.7%) | 101 (24.6%) |
| 75 Years and over | 23 (13.6%) | 83 (35.8%) |
| Total | 847 (21.4%) | 1,156 (26.6%) |
Income Above Poverty by Sex and Age in Barre
According to the poverty statistics in Barre, males aged 5 years and females aged 15 years are the age groups that are most secure financially, with 100.0% of males and 100.0% of females in these age groups living above the poverty line.
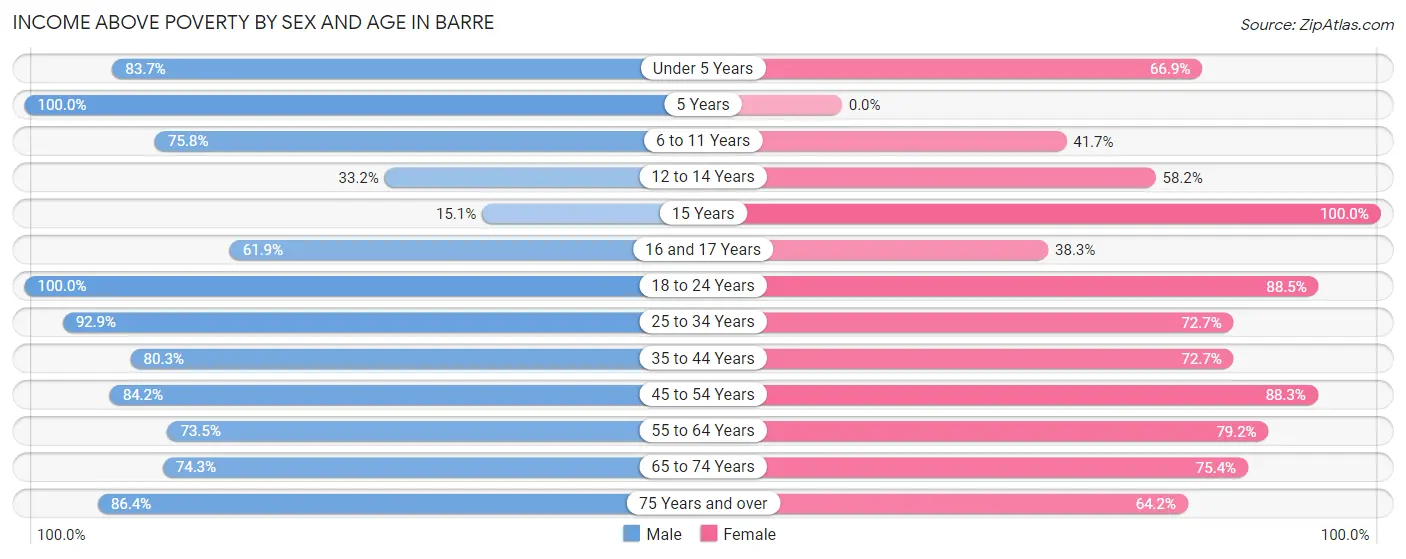
| Age Bracket | Male | Female |
| Under 5 Years | 118 (83.7%) | 103 (66.9%) |
| 5 Years | 100 (100.0%) | 0 (0.0%) |
| 6 to 11 Years | 222 (75.8%) | 105 (41.7%) |
| 12 to 14 Years | 70 (33.2%) | 53 (58.2%) |
| 15 Years | 8 (15.1%) | 71 (100.0%) |
| 16 and 17 Years | 104 (61.9%) | 54 (38.3%) |
| 18 to 24 Years | 296 (100.0%) | 300 (88.5%) |
| 25 to 34 Years | 525 (92.9%) | 546 (72.7%) |
| 35 to 44 Years | 314 (80.3%) | 496 (72.7%) |
| 45 to 54 Years | 415 (84.2%) | 333 (88.3%) |
| 55 to 64 Years | 551 (73.5%) | 666 (79.2%) |
| 65 to 74 Years | 249 (74.3%) | 309 (75.4%) |
| 75 Years and over | 146 (86.4%) | 149 (64.2%) |
| Total | 3,118 (78.6%) | 3,185 (73.4%) |
Income Below Poverty Among Married-Couple Families in Barre
The poverty statistics for married-couple families in Barre show that 8.5% or 94 of the total 1,109 families live below the poverty line. Families with 1 or 2 children have the highest poverty rate of 9.1%, comprising of 33 families. On the other hand, families with 3 or 4 children have the lowest poverty rate of 0.0%, which includes 0 families.
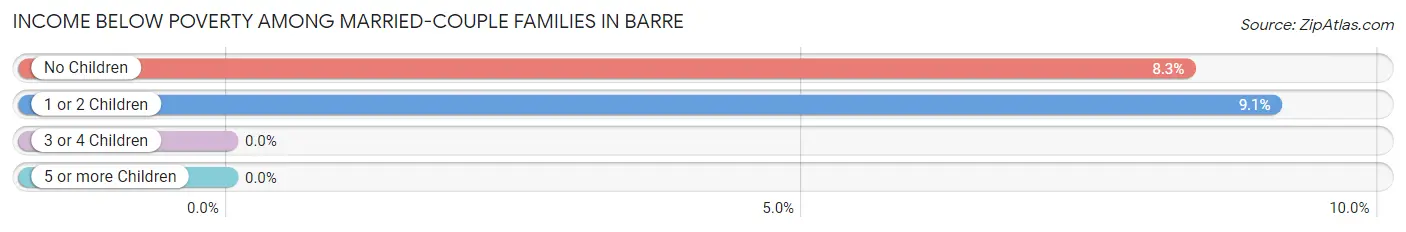
| Children | Above Poverty | Below Poverty |
| No Children | 670 (91.7%) | 61 (8.3%) |
| 1 or 2 Children | 330 (90.9%) | 33 (9.1%) |
| 3 or 4 Children | 15 (100.0%) | 0 (0.0%) |
| 5 or more Children | 0 (0.0%) | 0 (0.0%) |
| Total | 1,015 (91.5%) | 94 (8.5%) |
Income Below Poverty Among Single-Parent Households in Barre
According to the poverty data in Barre, 19.2% or 35 single-father households and 32.7% or 233 single-mother households are living below the poverty line. Among single-father households, those with 3 or 4 children have the highest poverty rate, with 26 households (100.0%) experiencing poverty. Likewise, among single-mother households, those with 1 or 2 children have the highest poverty rate, with 209 households (51.0%) falling below the poverty line.
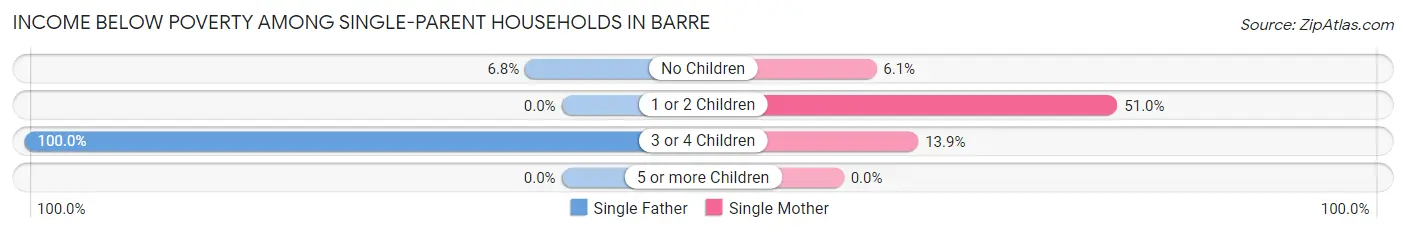
| Children | Single Father | Single Mother |
| No Children | 9 (6.8%) | 14 (6.1%) |
| 1 or 2 Children | 0 (0.0%) | 209 (51.0%) |
| 3 or 4 Children | 26 (100.0%) | 10 (13.9%) |
| 5 or more Children | 0 (0.0%) | 0 (0.0%) |
| Total | 35 (19.2%) | 233 (32.7%) |
Income Below Poverty Among Married-Couple vs Single-Parent Households in Barre
The poverty data for Barre shows that 94 of the married-couple family households (8.5%) and 268 of the single-parent households (30.0%) are living below the poverty level. Within the married-couple family households, those with 1 or 2 children have the highest poverty rate, with 33 households (9.1%) falling below the poverty line. Among the single-parent households, those with 1 or 2 children have the highest poverty rate, with 209 household (48.3%) living below poverty.
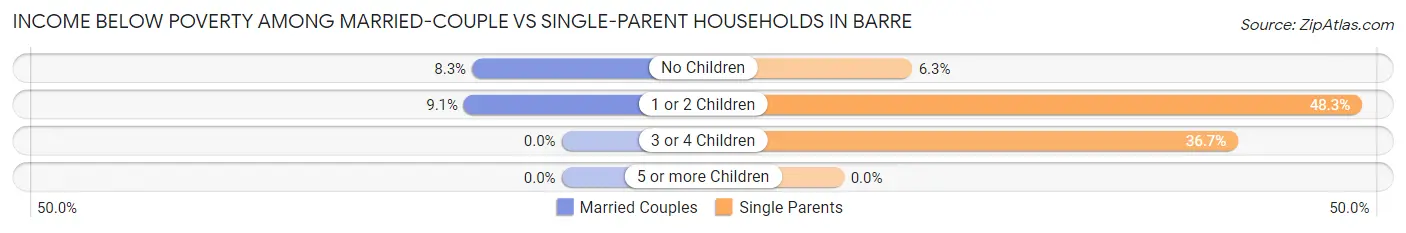
| Children | Married-Couple Families | Single-Parent Households |
| No Children | 61 (8.3%) | 23 (6.3%) |
| 1 or 2 Children | 33 (9.1%) | 209 (48.3%) |
| 3 or 4 Children | 0 (0.0%) | 36 (36.7%) |
| 5 or more Children | 0 (0.0%) | 0 (0.0%) |
| Total | 94 (8.5%) | 268 (30.0%) |
Race in Barre
The most populous races in Barre are White / Caucasian (7,973 | 93.9%), Two or more Races (334 | 3.9%), and Hispanic or Latino (150 | 1.8%).
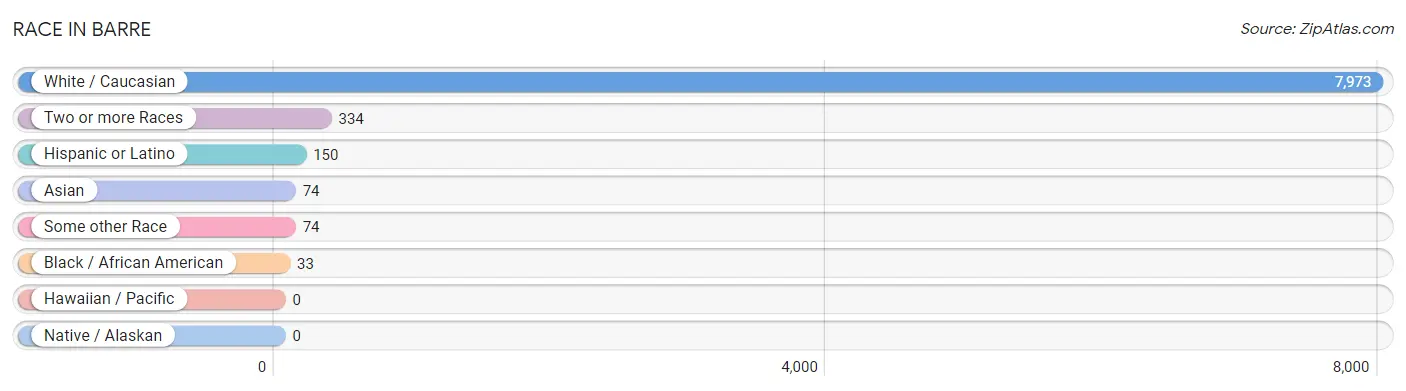
| Race | # Population | % Population |
| Asian | 74 | 0.9% |
| Black / African American | 33 | 0.4% |
| Hawaiian / Pacific | 0 | 0.0% |
| Hispanic or Latino | 150 | 1.8% |
| Native / Alaskan | 0 | 0.0% |
| White / Caucasian | 7,973 | 93.9% |
| Two or more Races | 334 | 3.9% |
| Some other Race | 74 | 0.9% |
| Total | 8,488 | 100.0% |
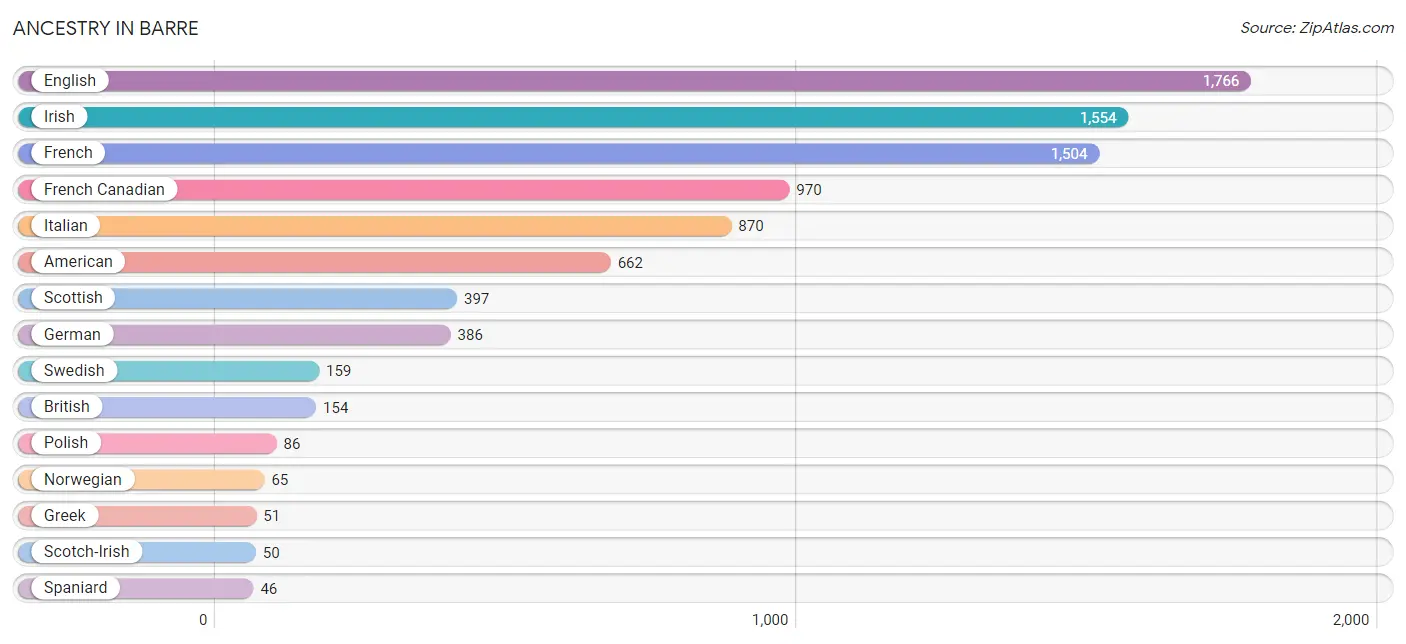
Ancestry in Barre
The most populous ancestries reported in Barre are English (1,766 | 20.8%), Irish (1,554 | 18.3%), French (1,504 | 17.7%), French Canadian (970 | 11.4%), and Italian (870 | 10.2%), together accounting for 78.5% of all Barre residents.
| Ancestry | # Population | % Population |
| American | 662 | 7.8% |
| Arab | 9 | 0.1% |
| Bhutanese | 18 | 0.2% |
| British | 154 | 1.8% |
| Canadian | 31 | 0.4% |
| Celtic | 18 | 0.2% |
| Cherokee | 15 | 0.2% |
| Colombian | 10 | 0.1% |
| Czech | 17 | 0.2% |
| Danish | 15 | 0.2% |
| Dutch | 1 | 0.0% |
| Eastern European | 24 | 0.3% |
| English | 1,766 | 20.8% |
| European | 44 | 0.5% |
| Finnish | 32 | 0.4% |
| French | 1,504 | 17.7% |
| French Canadian | 970 | 11.4% |
| German | 386 | 4.5% |
| Greek | 51 | 0.6% |
| Indian (Asian) | 6 | 0.1% |
| Irish | 1,554 | 18.3% |
| Israeli | 18 | 0.2% |
| Italian | 870 | 10.2% |
| Korean | 37 | 0.4% |
| Latvian | 22 | 0.3% |
| Lithuanian | 18 | 0.2% |
| Navajo | 8 | 0.1% |
| Northern European | 18 | 0.2% |
| Norwegian | 65 | 0.8% |
| Polish | 86 | 1.0% |
| Portuguese | 14 | 0.2% |
| Puerto Rican | 30 | 0.4% |
| Russian | 10 | 0.1% |
| Scandinavian | 14 | 0.2% |
| Scotch-Irish | 50 | 0.6% |
| Scottish | 397 | 4.7% |
| Slovak | 10 | 0.1% |
| South American | 10 | 0.1% |
| Spaniard | 46 | 0.5% |
| Subsaharan African | 27 | 0.3% |
| Swedish | 159 | 1.9% |
| Syrian | 9 | 0.1% |
| Welsh | 16 | 0.2% |
| Yugoslavian | 32 | 0.4% | View All 44 Rows |
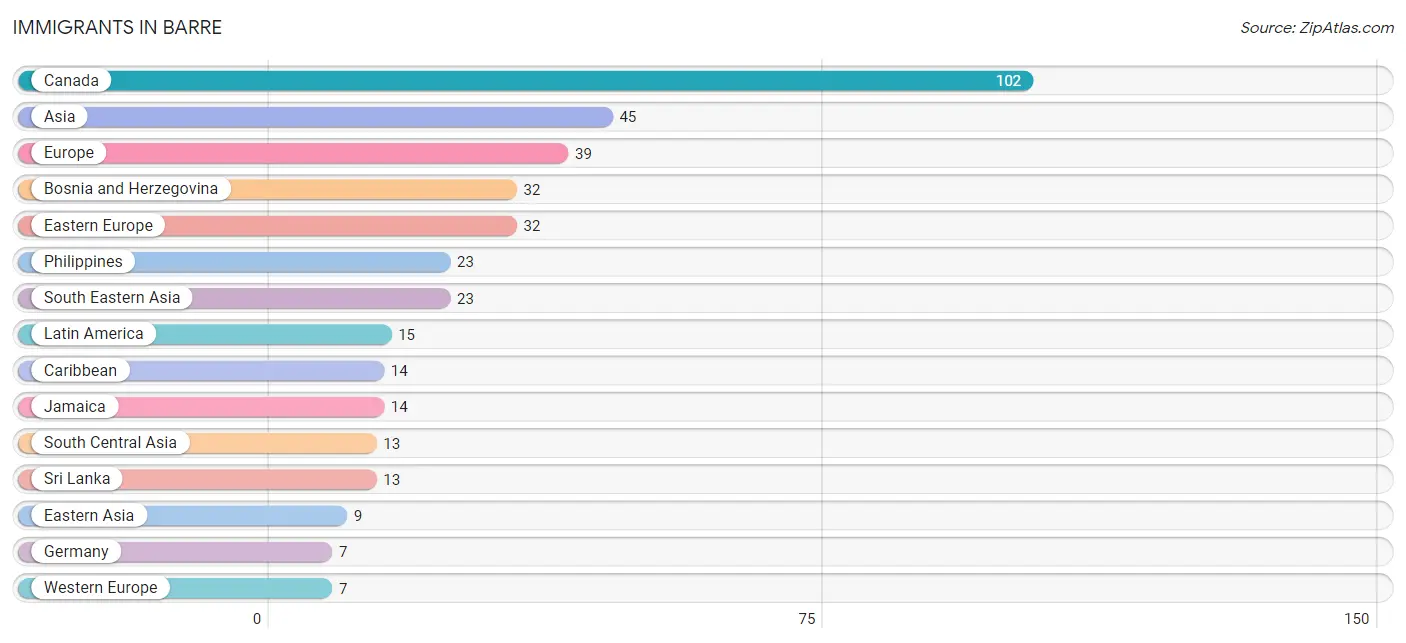
Immigrants in Barre
The most numerous immigrant groups reported in Barre came from Canada (102 | 1.2%), Asia (45 | 0.5%), Europe (39 | 0.5%), Bosnia and Herzegovina (32 | 0.4%), and Eastern Europe (32 | 0.4%), together accounting for 3.0% of all Barre residents.
| Immigration Origin | # Population | % Population |
| Asia | 45 | 0.5% |
| Bosnia and Herzegovina | 32 | 0.4% |
| Canada | 102 | 1.2% |
| Caribbean | 14 | 0.2% |
| China | 6 | 0.1% |
| Colombia | 1 | 0.0% |
| Eastern Asia | 9 | 0.1% |
| Eastern Europe | 32 | 0.4% |
| Europe | 39 | 0.5% |
| Germany | 7 | 0.1% |
| Jamaica | 14 | 0.2% |
| Japan | 3 | 0.0% |
| Latin America | 15 | 0.2% |
| Philippines | 23 | 0.3% |
| South America | 1 | 0.0% |
| South Central Asia | 13 | 0.2% |
| South Eastern Asia | 23 | 0.3% |
| Sri Lanka | 13 | 0.2% |
| Western Europe | 7 | 0.1% | View All 19 Rows |
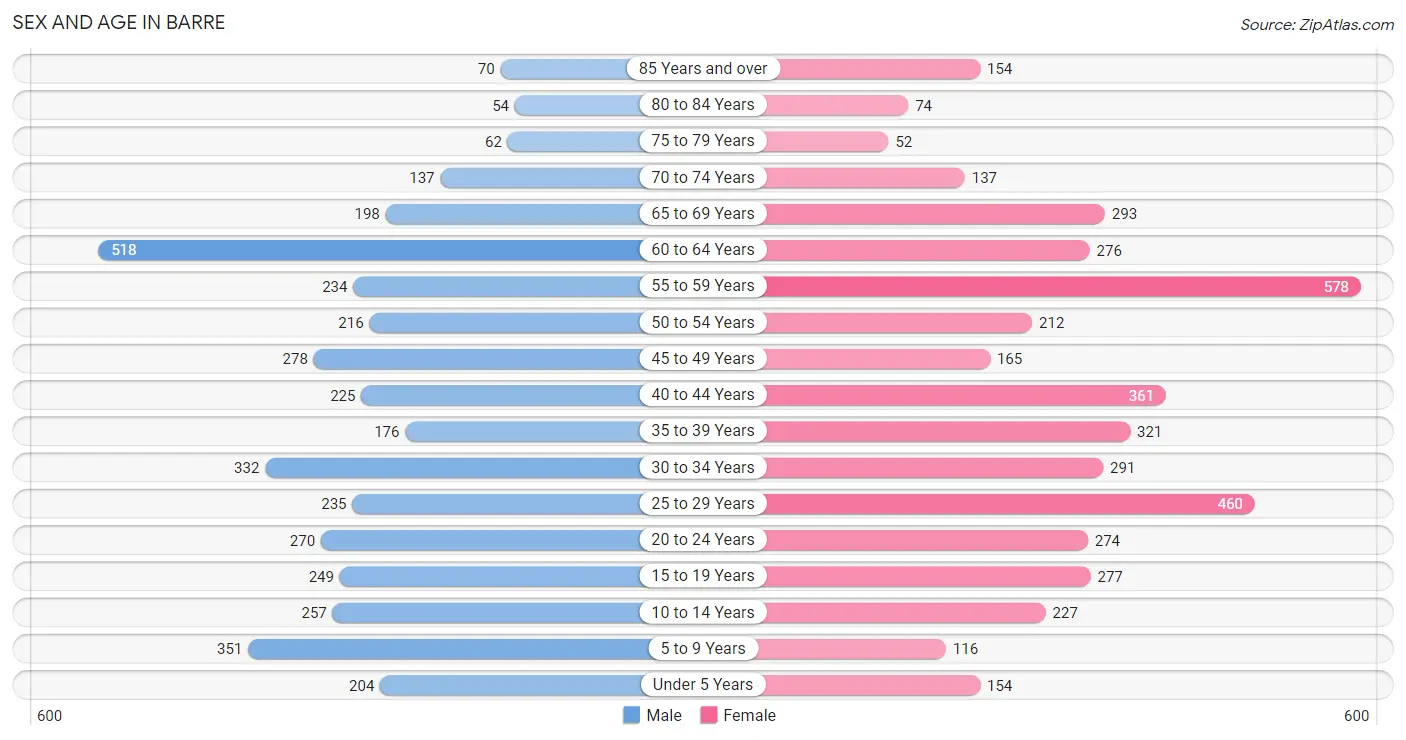
Sex and Age in Barre
Sex and Age in Barre
The most populous age groups in Barre are 60 to 64 Years (518 | 12.7%) for men and 55 to 59 Years (578 | 13.1%) for women.
| Age Bracket | Male | Female |
| Under 5 Years | 204 (5.0%) | 154 (3.5%) |
| 5 to 9 Years | 351 (8.6%) | 116 (2.6%) |
| 10 to 14 Years | 257 (6.3%) | 227 (5.1%) |
| 15 to 19 Years | 249 (6.1%) | 277 (6.3%) |
| 20 to 24 Years | 270 (6.6%) | 274 (6.2%) |
| 25 to 29 Years | 235 (5.8%) | 460 (10.4%) |
| 30 to 34 Years | 332 (8.2%) | 291 (6.6%) |
| 35 to 39 Years | 176 (4.3%) | 321 (7.3%) |
| 40 to 44 Years | 225 (5.5%) | 361 (8.2%) |
| 45 to 49 Years | 278 (6.8%) | 165 (3.7%) |
| 50 to 54 Years | 216 (5.3%) | 212 (4.8%) |
| 55 to 59 Years | 234 (5.8%) | 578 (13.1%) |
| 60 to 64 Years | 518 (12.7%) | 276 (6.2%) |
| 65 to 69 Years | 198 (4.9%) | 293 (6.6%) |
| 70 to 74 Years | 137 (3.4%) | 137 (3.1%) |
| 75 to 79 Years | 62 (1.5%) | 52 (1.2%) |
| 80 to 84 Years | 54 (1.3%) | 74 (1.7%) |
| 85 Years and over | 70 (1.7%) | 154 (3.5%) |
| Total | 4,066 (100.0%) | 4,422 (100.0%) |
Families and Households in Barre
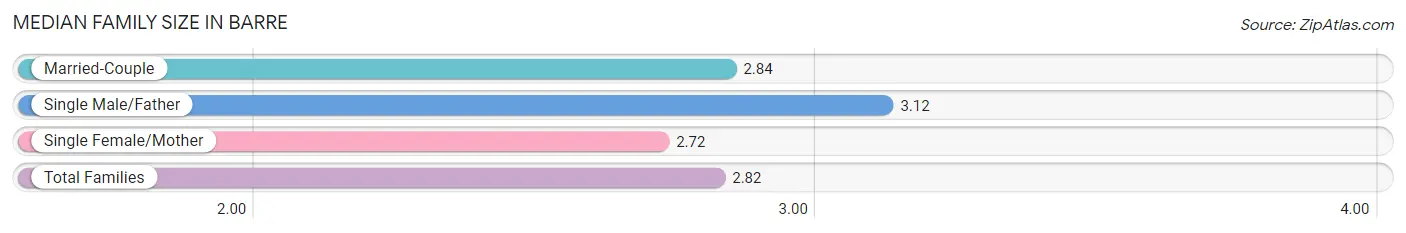
Median Family Size in Barre
The median family size in Barre is 2.82 persons per family, with single male/father families (182 | 9.1%) accounting for the largest median family size of 3.12 persons per family. On the other hand, single female/mother families (712 | 35.5%) represent the smallest median family size with 2.72 persons per family.
| Family Type | # Families | Family Size |
| Married-Couple | 1,109 (55.4%) | 2.84 |
| Single Male/Father | 182 (9.1%) | 3.12 |
| Single Female/Mother | 712 (35.5%) | 2.72 |
| Total Families | 2,003 (100.0%) | 2.82 |
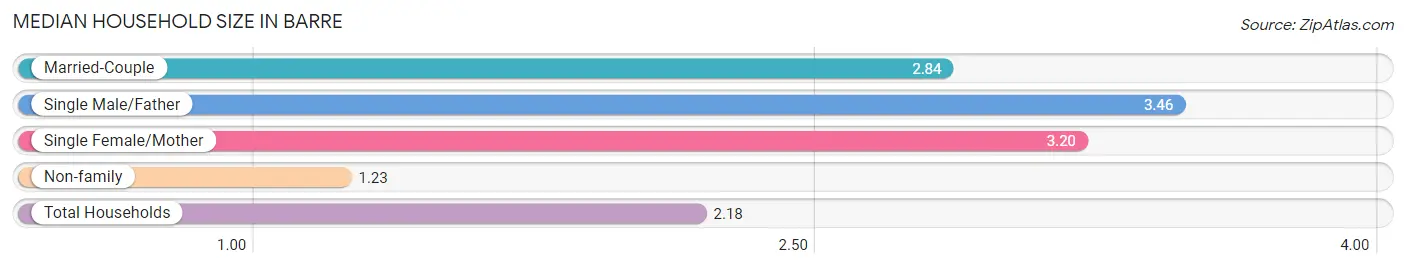
Median Household Size in Barre
The median household size in Barre is 2.18 persons per household, with single male/father households (182 | 4.8%) accounting for the largest median household size of 3.46 persons per household. non-family households (1,792 | 47.2%) represent the smallest median household size with 1.23 persons per household.
| Household Type | # Households | Household Size |
| Married-Couple | 1,109 (29.2%) | 2.84 |
| Single Male/Father | 182 (4.8%) | 3.46 |
| Single Female/Mother | 712 (18.8%) | 3.20 |
| Non-family | 1,792 (47.2%) | 1.23 |
| Total Households | 3,795 (100.0%) | 2.18 |
Household Size by Marriage Status in Barre
Out of a total of 3,795 households in Barre, 2,003 (52.8%) are family households, while 1,792 (47.2%) are nonfamily households. The most numerous type of family households are 2-person households, comprising 937, and the most common type of nonfamily households are 1-person households, comprising 1,399.
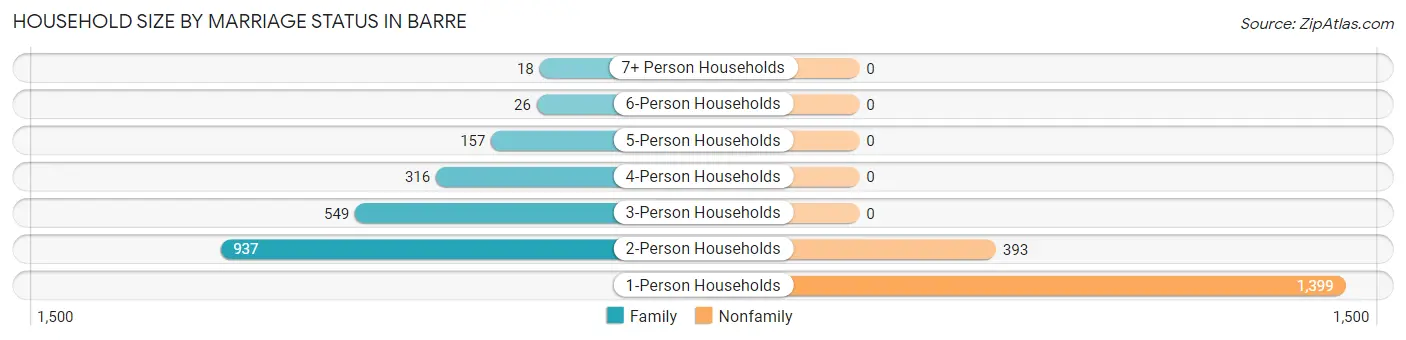
| Household Size | Family Households | Nonfamily Households |
| 1-Person Households | - | 1,399 (36.9%) |
| 2-Person Households | 937 (24.7%) | 393 (10.4%) |
| 3-Person Households | 549 (14.5%) | 0 (0.0%) |
| 4-Person Households | 316 (8.3%) | 0 (0.0%) |
| 5-Person Households | 157 (4.1%) | 0 (0.0%) |
| 6-Person Households | 26 (0.7%) | 0 (0.0%) |
| 7+ Person Households | 18 (0.5%) | 0 (0.0%) |
| Total | 2,003 (52.8%) | 1,792 (47.2%) |
Female Fertility in Barre
Fertility by Age in Barre
Average fertility rate in Barre is 80.0 births per 1,000 women. Women in the age bracket of 20 to 34 years have the highest fertility rate with 157.0 births per 1,000 women. Women in the age bracket of 20 to 34 years acount for 91.0% of all women with births.
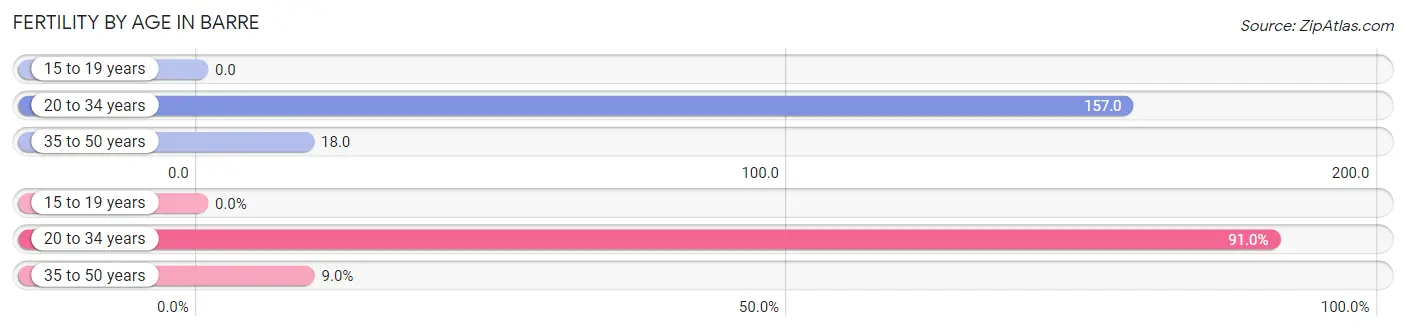
| Age Bracket | Women with Births | Births / 1,000 Women |
| 15 to 19 years | 0 (0.0%) | 0.0 |
| 20 to 34 years | 161 (91.0%) | 157.0 |
| 35 to 50 years | 16 (9.0%) | 18.0 |
| Total | 177 (100.0%) | 80.0 |
Fertility by Age by Marriage Status in Barre
46.3% of women with births (177) in Barre are married. The highest percentage of unmarried women with births falls into 20 to 34 years age bracket with 59.0% of them unmarried at the time of birth, while the lowest percentage of unmarried women with births belong to 35 to 50 years age bracket with 0.0% of them unmarried.
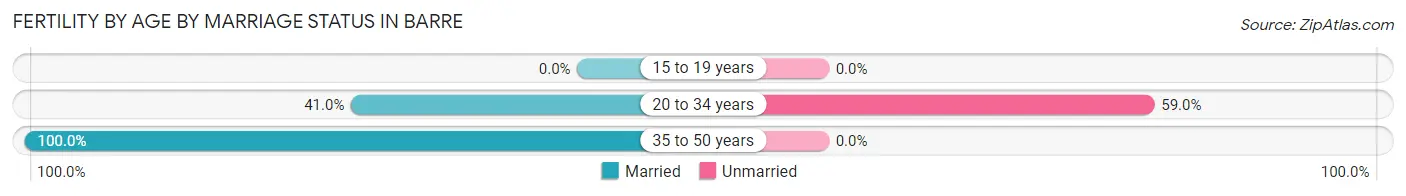
| Age Bracket | Married | Unmarried |
| 15 to 19 years | 0 (0.0%) | 0 (0.0%) |
| 20 to 34 years | 66 (41.0%) | 95 (59.0%) |
| 35 to 50 years | 16 (100.0%) | 0 (0.0%) |
| Total | 82 (46.3%) | 95 (53.7%) |
Fertility by Education in Barre
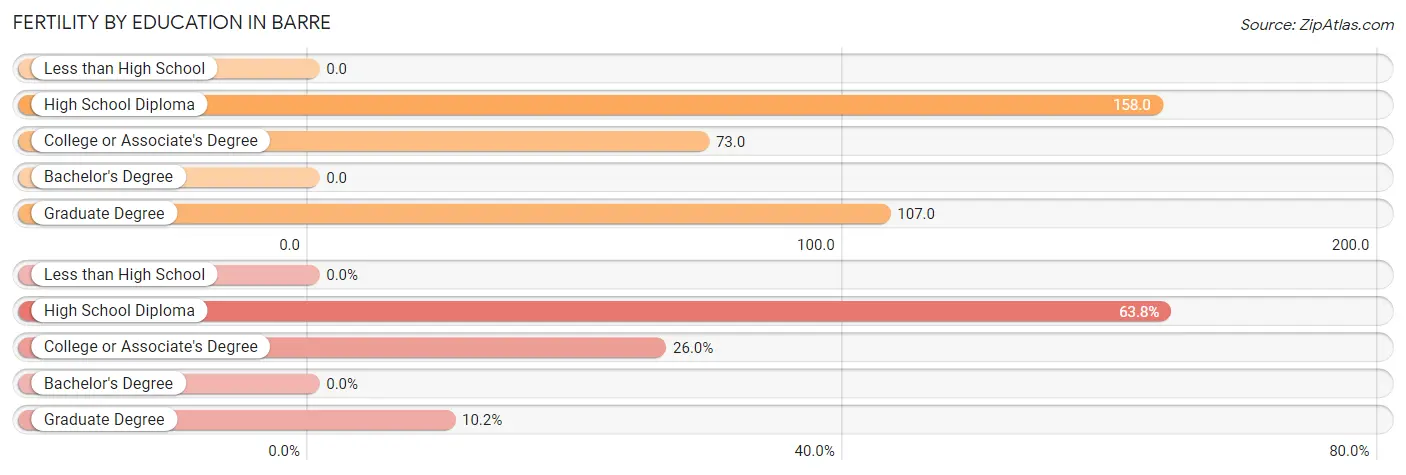
| Educational Attainment | Women with Births | Births / 1,000 Women |
| Less than High School | 0 (0.0%) | 0.0 |
| High School Diploma | 113 (63.8%) | 158.0 |
| College or Associate's Degree | 46 (26.0%) | 73.0 |
| Bachelor's Degree | 0 (0.0%) | 0.0 |
| Graduate Degree | 18 (10.2%) | 107.0 |
| Total | 177 (100.0%) | 80.0 |
Fertility by Education by Marriage Status in Barre
53.7% of women with births in Barre are unmarried. Women with the educational attainment of college or associate's degree are most likely to be married with 100.0% of them married at childbirth, while women with the educational attainment of high school diploma are least likely to be married with 84.1% of them unmarried at childbirth.
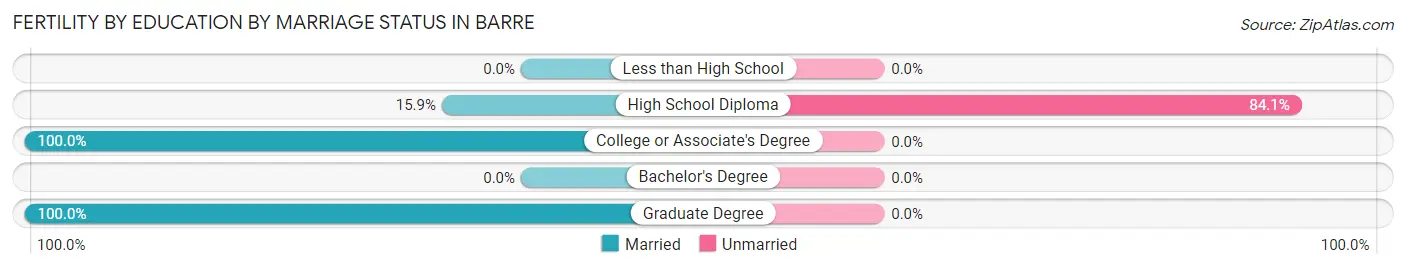
| Educational Attainment | Married | Unmarried |
| Less than High School | 0 (0.0%) | 0 (0.0%) |
| High School Diploma | 18 (15.9%) | 95 (84.1%) |
| College or Associate's Degree | 46 (100.0%) | 0 (0.0%) |
| Bachelor's Degree | 0 (0.0%) | 0 (0.0%) |
| Graduate Degree | 18 (100.0%) | 0 (0.0%) |
| Total | 82 (46.3%) | 95 (53.7%) |
Employment Characteristics in Barre
Employment by Class of Employer in Barre
Among the 3,960 employed individuals in Barre, private company employees (2,159 | 54.5%), not-for-profit organizations (659 | 16.6%), and self-employed (incorporated) (339 | 8.6%) make up the most common classes of employment.
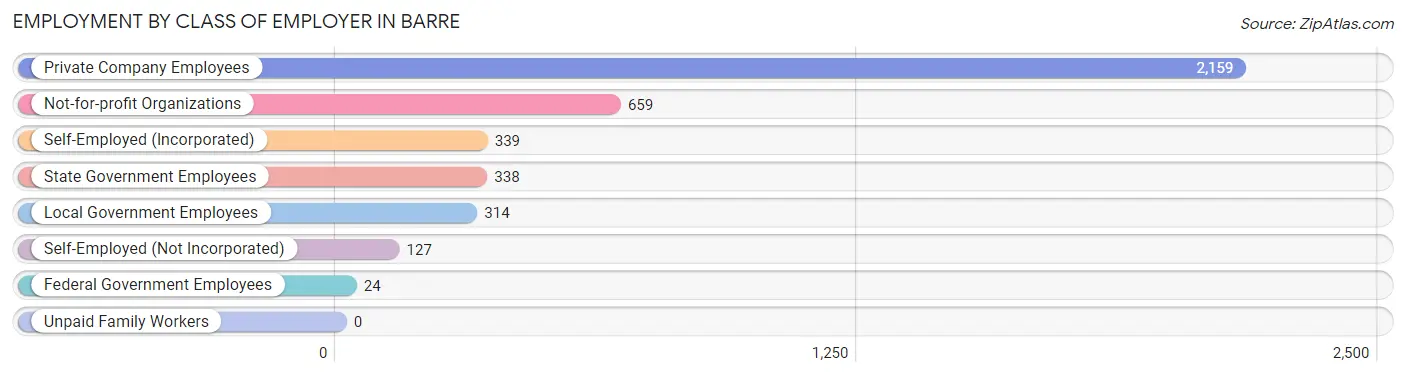
| Employer Class | # Employees | % Employees |
| Private Company Employees | 2,159 | 54.5% |
| Self-Employed (Incorporated) | 339 | 8.6% |
| Self-Employed (Not Incorporated) | 127 | 3.2% |
| Not-for-profit Organizations | 659 | 16.6% |
| Local Government Employees | 314 | 7.9% |
| State Government Employees | 338 | 8.5% |
| Federal Government Employees | 24 | 0.6% |
| Unpaid Family Workers | 0 | 0.0% |
| Total | 3,960 | 100.0% |
Employment Status by Age in Barre
According to the labor force statistics for Barre, out of the total population over 16 years of age (7,055), 60.8% or 4,289 individuals are in the labor force, with 7.2% or 309 of them unemployed. The age group with the highest labor force participation rate is 30 to 34 years, with 84.8% or 528 individuals in the labor force. Within the labor force, the 55 to 59 years age range has the highest percentage of unemployed individuals, with 14.8% or 75 of them being unemployed.
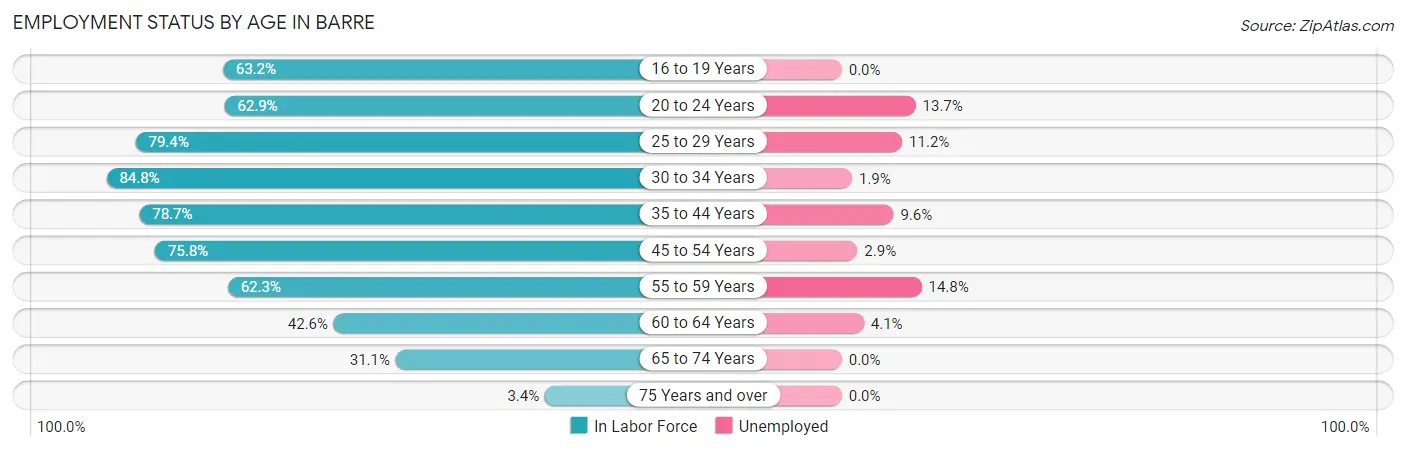
| Age Bracket | In Labor Force | Unemployed |
| 16 to 19 Years | 254 (63.2%) | 0 (0.0%) |
| 20 to 24 Years | 342 (62.9%) | 47 (13.7%) |
| 25 to 29 Years | 552 (79.4%) | 62 (11.2%) |
| 30 to 34 Years | 528 (84.8%) | 10 (1.9%) |
| 35 to 44 Years | 852 (78.7%) | 82 (9.6%) |
| 45 to 54 Years | 660 (75.8%) | 19 (2.9%) |
| 55 to 59 Years | 506 (62.3%) | 75 (14.8%) |
| 60 to 64 Years | 338 (42.6%) | 14 (4.1%) |
| 65 to 74 Years | 238 (31.1%) | 0 (0.0%) |
| 75 Years and over | 16 (3.4%) | 0 (0.0%) |
| Total | 4,289 (60.8%) | 309 (7.2%) |
Employment Status by Educational Attainment in Barre
According to labor force statistics for Barre, 70.4% of individuals (3,434) out of the total population between 25 and 64 years of age (4,878) are in the labor force, with 7.6% or 261 of them being unemployed. The group with the highest labor force participation rate are those with the educational attainment of bachelor's degree or higher, with 89.5% or 1,304 individuals in the labor force. Within the labor force, individuals with high school diploma education have the highest percentage of unemployment, with 16.2% or 213 of them being unemployed.
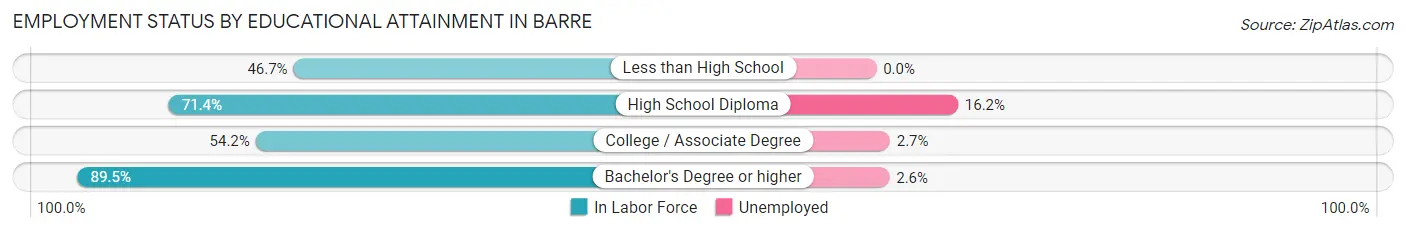
| Educational Attainment | In Labor Force | Unemployed |
| Less than High School | 238 (46.7%) | 0 (0.0%) |
| High School Diploma | 1,312 (71.4%) | 298 (16.2%) |
| College / Associate Degree | 582 (54.2%) | 29 (2.7%) |
| Bachelor's Degree or higher | 1,304 (89.5%) | 38 (2.6%) |
| Total | 3,434 (70.4%) | 371 (7.6%) |
Employment Occupations by Sex in Barre
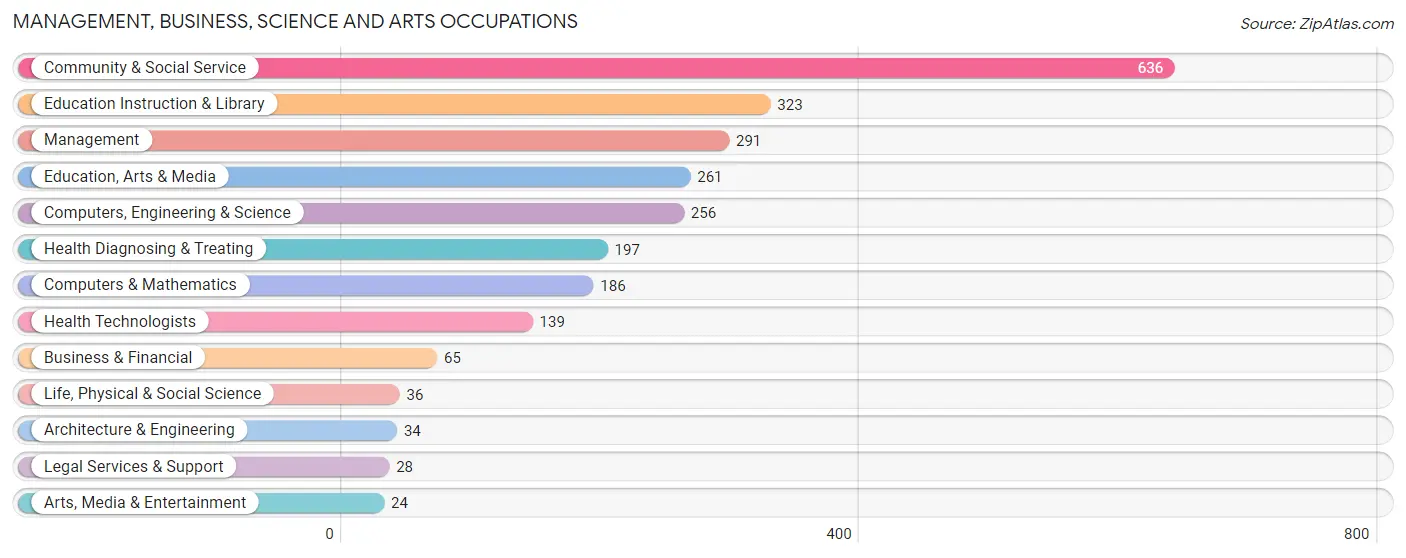
Management, Business, Science and Arts Occupations
The most common Management, Business, Science and Arts occupations in Barre are Community & Social Service (636 | 16.0%), Education Instruction & Library (323 | 8.1%), Management (291 | 7.3%), Education, Arts & Media (261 | 6.6%), and Computers, Engineering & Science (256 | 6.5%).
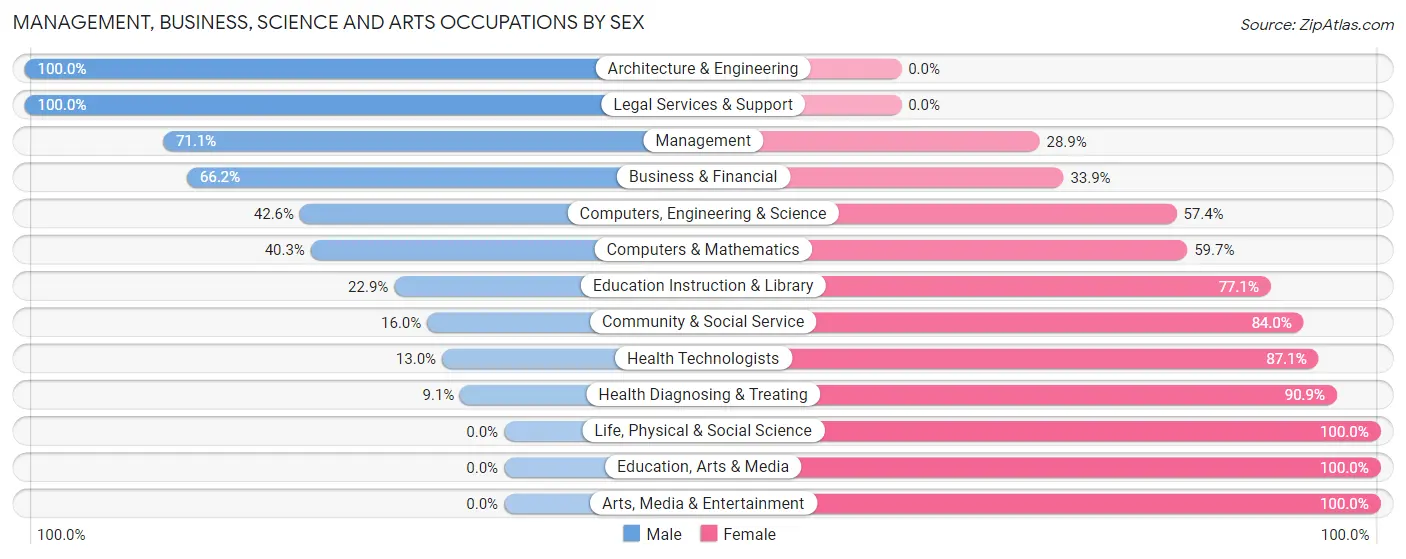
Management, Business, Science and Arts Occupations by Sex
Within the Management, Business, Science and Arts occupations in Barre, the most male-oriented occupations are Architecture & Engineering (100.0%), Legal Services & Support (100.0%), and Management (71.1%), while the most female-oriented occupations are Life, Physical & Social Science (100.0%), Education, Arts & Media (100.0%), and Arts, Media & Entertainment (100.0%).
| Occupation | Male | Female |
| Management | 207 (71.1%) | 84 (28.9%) |
| Business & Financial | 43 (66.1%) | 22 (33.9%) |
| Computers, Engineering & Science | 109 (42.6%) | 147 (57.4%) |
| Computers & Mathematics | 75 (40.3%) | 111 (59.7%) |
| Architecture & Engineering | 34 (100.0%) | 0 (0.0%) |
| Life, Physical & Social Science | 0 (0.0%) | 36 (100.0%) |
| Community & Social Service | 102 (16.0%) | 534 (84.0%) |
| Education, Arts & Media | 0 (0.0%) | 261 (100.0%) |
| Legal Services & Support | 28 (100.0%) | 0 (0.0%) |
| Education Instruction & Library | 74 (22.9%) | 249 (77.1%) |
| Arts, Media & Entertainment | 0 (0.0%) | 24 (100.0%) |
| Health Diagnosing & Treating | 18 (9.1%) | 179 (90.9%) |
| Health Technologists | 18 (13.0%) | 121 (87.1%) |
| Total (Category) | 479 (33.2%) | 966 (66.8%) |
| Total (Overall) | 1,930 (48.6%) | 2,037 (51.3%) |
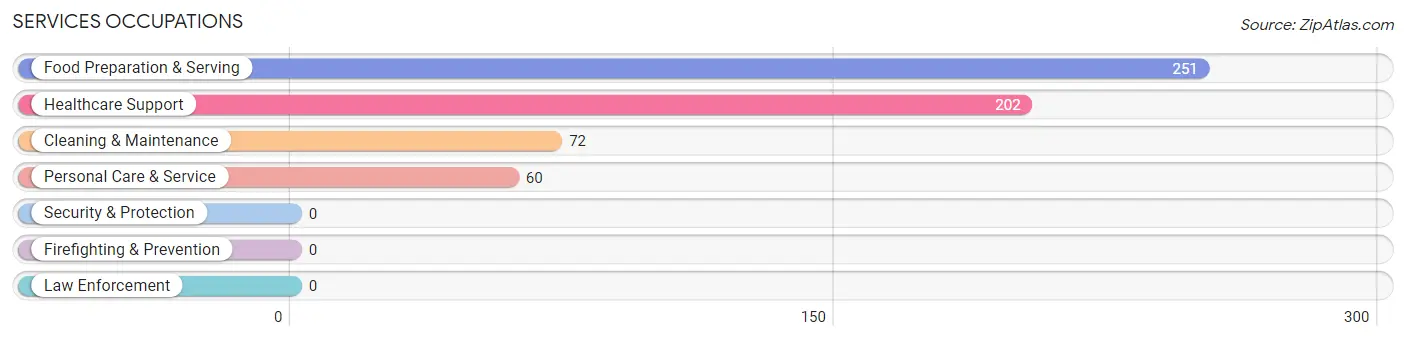
Services Occupations
The most common Services occupations in Barre are Food Preparation & Serving (251 | 6.3%), Healthcare Support (202 | 5.1%), Cleaning & Maintenance (72 | 1.8%), and Personal Care & Service (60 | 1.5%).
Services Occupations by Sex
Within the Services occupations in Barre, the most male-oriented occupations are Cleaning & Maintenance (100.0%), Food Preparation & Serving (72.9%), and Healthcare Support (37.1%), while the most female-oriented occupations are Personal Care & Service (100.0%), Healthcare Support (62.9%), and Food Preparation & Serving (27.1%).

| Occupation | Male | Female |
| Healthcare Support | 75 (37.1%) | 127 (62.9%) |
| Security & Protection | 0 (0.0%) | 0 (0.0%) |
| Firefighting & Prevention | 0 (0.0%) | 0 (0.0%) |
| Law Enforcement | 0 (0.0%) | 0 (0.0%) |
| Food Preparation & Serving | 183 (72.9%) | 68 (27.1%) |
| Cleaning & Maintenance | 72 (100.0%) | 0 (0.0%) |
| Personal Care & Service | 0 (0.0%) | 60 (100.0%) |
| Total (Category) | 330 (56.4%) | 255 (43.6%) |
| Total (Overall) | 1,930 (48.6%) | 2,037 (51.3%) |
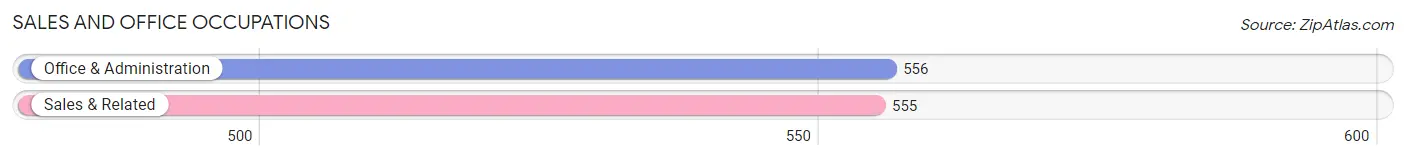
Sales and Office Occupations
The most common Sales and Office occupations in Barre are Office & Administration (556 | 14.0%), and Sales & Related (555 | 14.0%).
Sales and Office Occupations by Sex
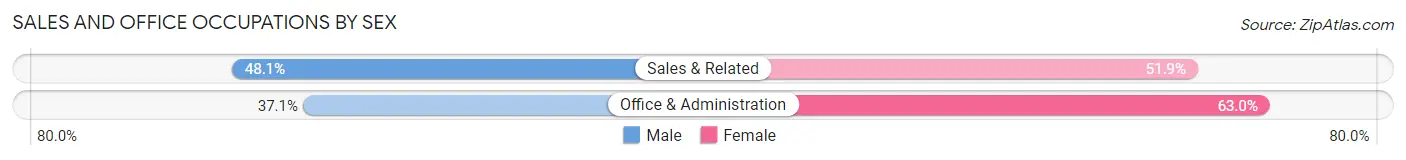
| Occupation | Male | Female |
| Sales & Related | 267 (48.1%) | 288 (51.9%) |
| Office & Administration | 206 (37.0%) | 350 (62.9%) |
| Total (Category) | 473 (42.6%) | 638 (57.4%) |
| Total (Overall) | 1,930 (48.6%) | 2,037 (51.3%) |
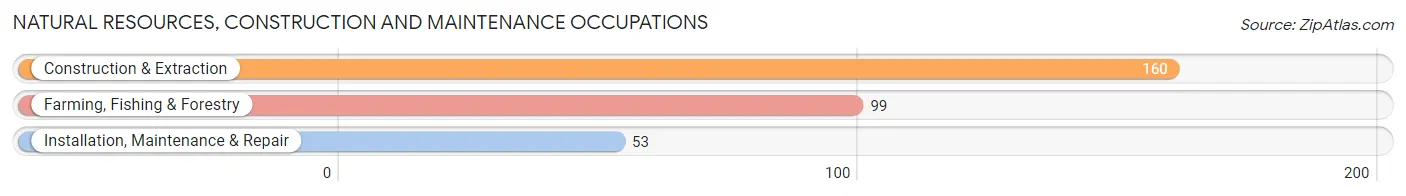
Natural Resources, Construction and Maintenance Occupations
The most common Natural Resources, Construction and Maintenance occupations in Barre are Construction & Extraction (160 | 4.0%), Farming, Fishing & Forestry (99 | 2.5%), and Installation, Maintenance & Repair (53 | 1.3%).
Natural Resources, Construction and Maintenance Occupations by Sex
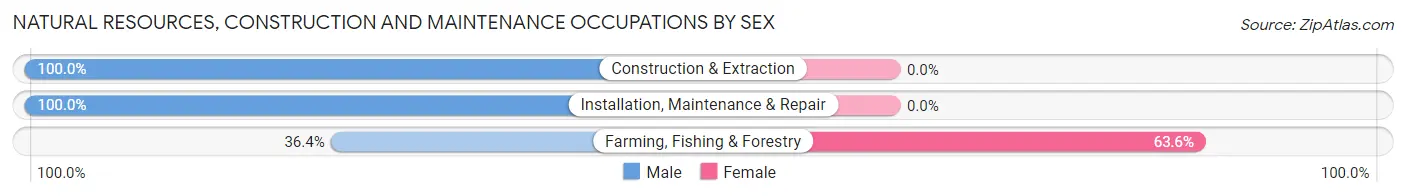
| Occupation | Male | Female |
| Farming, Fishing & Forestry | 36 (36.4%) | 63 (63.6%) |
| Construction & Extraction | 160 (100.0%) | 0 (0.0%) |
| Installation, Maintenance & Repair | 53 (100.0%) | 0 (0.0%) |
| Total (Category) | 249 (79.8%) | 63 (20.2%) |
| Total (Overall) | 1,930 (48.6%) | 2,037 (51.3%) |
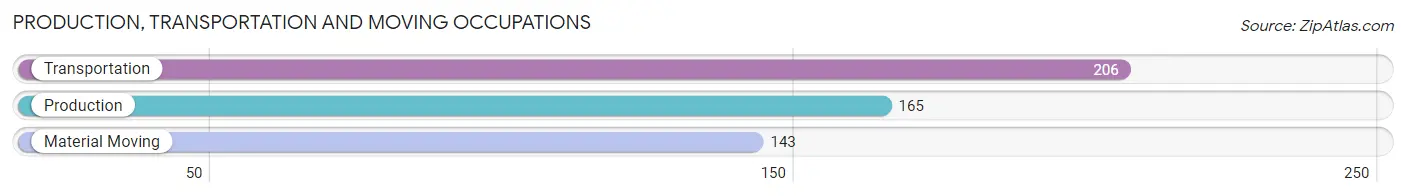
Production, Transportation and Moving Occupations
The most common Production, Transportation and Moving occupations in Barre are Transportation (206 | 5.2%), Production (165 | 4.2%), and Material Moving (143 | 3.6%).
Production, Transportation and Moving Occupations by Sex
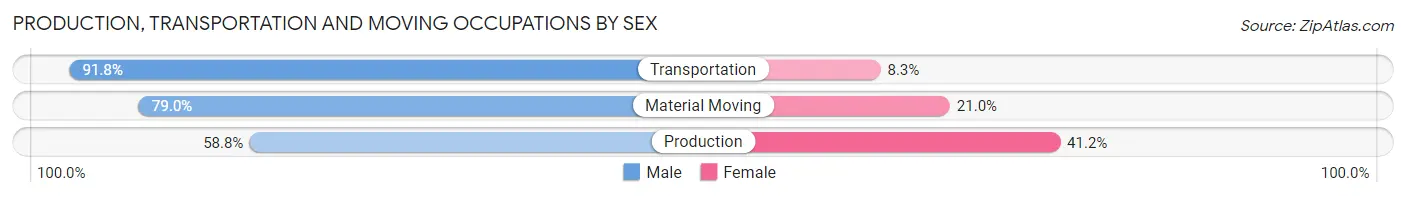
| Occupation | Male | Female |
| Production | 97 (58.8%) | 68 (41.2%) |
| Transportation | 189 (91.7%) | 17 (8.3%) |
| Material Moving | 113 (79.0%) | 30 (21.0%) |
| Total (Category) | 399 (77.6%) | 115 (22.4%) |
| Total (Overall) | 1,930 (48.6%) | 2,037 (51.3%) |
Employment Industries by Sex in Barre
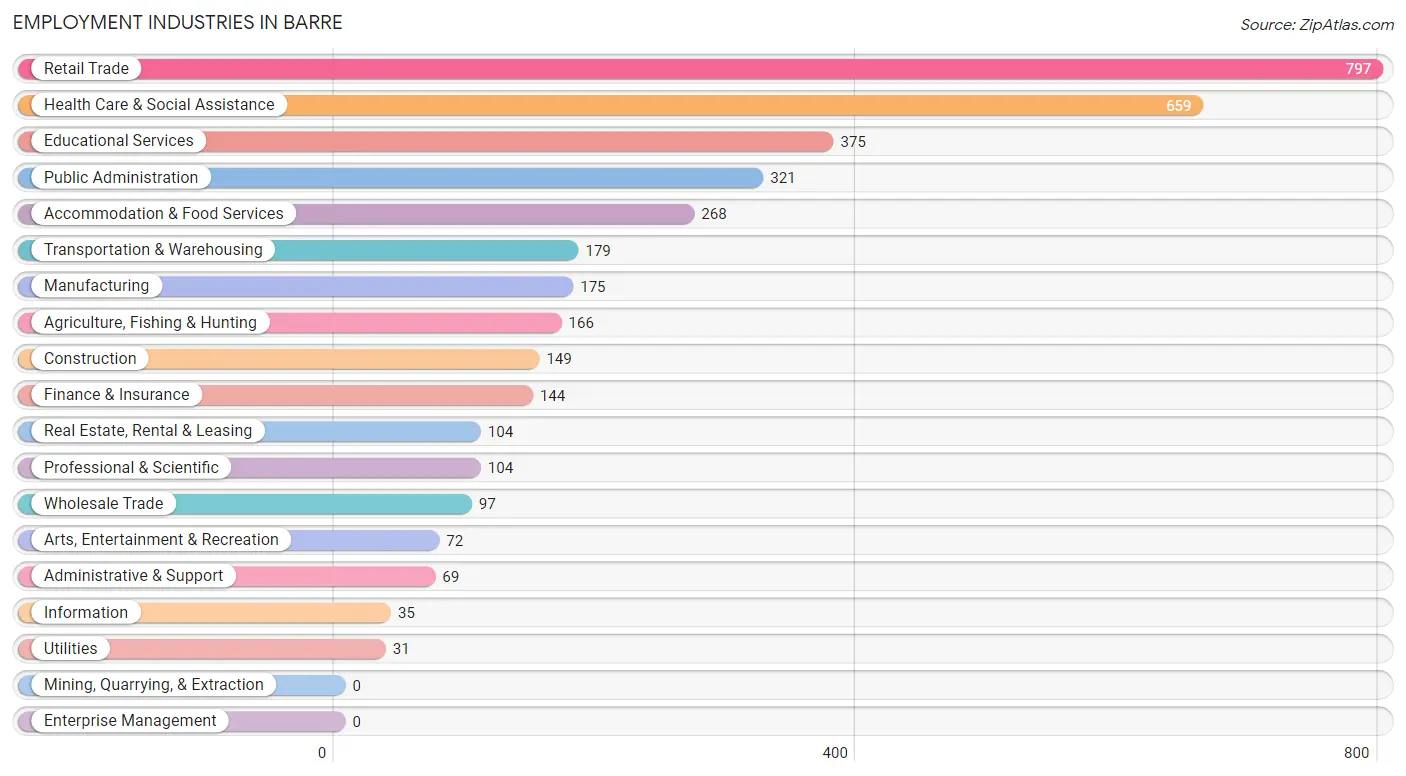
Employment Industries in Barre
The major employment industries in Barre include Retail Trade (797 | 20.1%), Health Care & Social Assistance (659 | 16.6%), Educational Services (375 | 9.5%), Public Administration (321 | 8.1%), and Accommodation & Food Services (268 | 6.8%).
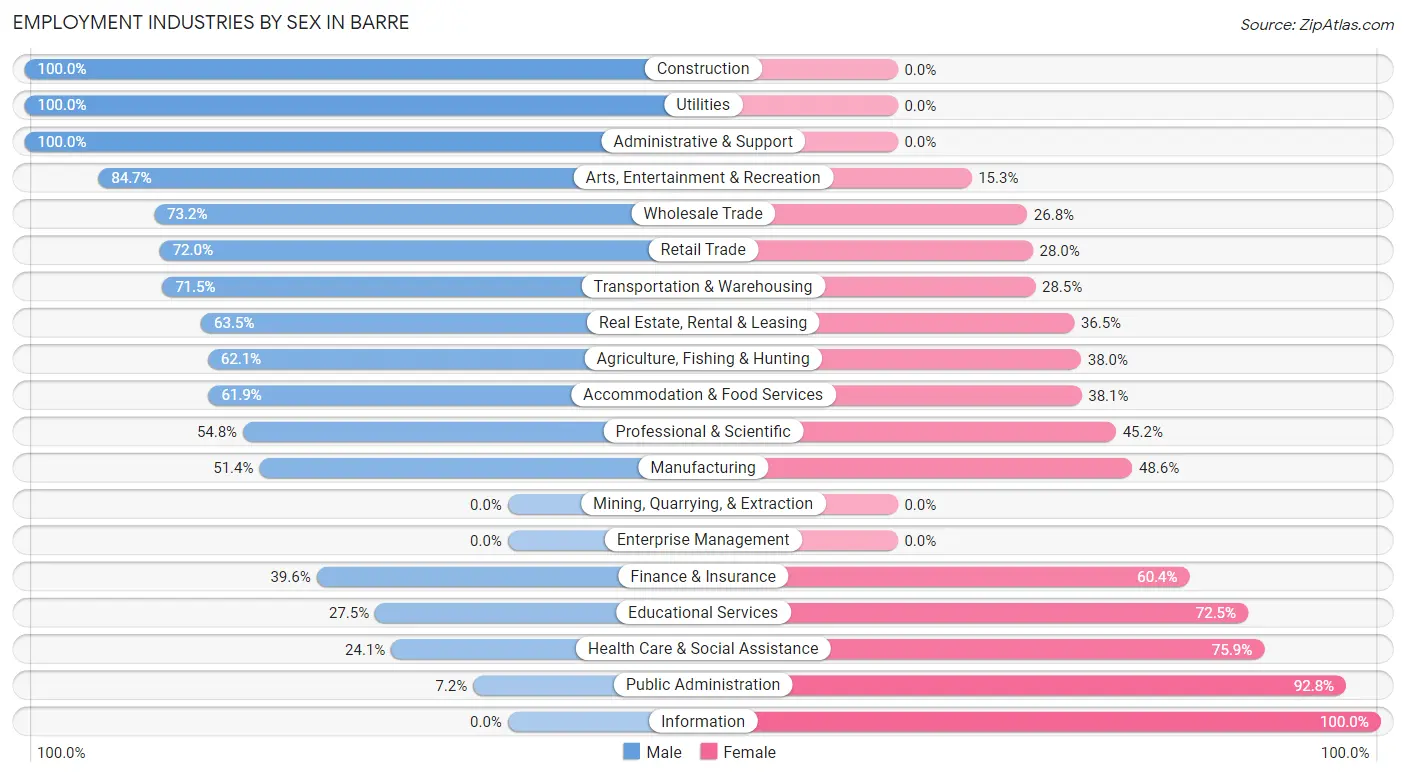
Employment Industries by Sex in Barre
The Barre industries that see more men than women are Construction (100.0%), Utilities (100.0%), and Administrative & Support (100.0%), whereas the industries that tend to have a higher number of women are Information (100.0%), Public Administration (92.8%), and Health Care & Social Assistance (75.9%).
| Industry | Male | Female |
| Agriculture, Fishing & Hunting | 103 (62.1%) | 63 (38.0%) |
| Mining, Quarrying, & Extraction | 0 (0.0%) | 0 (0.0%) |
| Construction | 149 (100.0%) | 0 (0.0%) |
| Manufacturing | 90 (51.4%) | 85 (48.6%) |
| Wholesale Trade | 71 (73.2%) | 26 (26.8%) |
| Retail Trade | 574 (72.0%) | 223 (28.0%) |
| Transportation & Warehousing | 128 (71.5%) | 51 (28.5%) |
| Utilities | 31 (100.0%) | 0 (0.0%) |
| Information | 0 (0.0%) | 35 (100.0%) |
| Finance & Insurance | 57 (39.6%) | 87 (60.4%) |
| Real Estate, Rental & Leasing | 66 (63.5%) | 38 (36.5%) |
| Professional & Scientific | 57 (54.8%) | 47 (45.2%) |
| Enterprise Management | 0 (0.0%) | 0 (0.0%) |
| Administrative & Support | 69 (100.0%) | 0 (0.0%) |
| Educational Services | 103 (27.5%) | 272 (72.5%) |
| Health Care & Social Assistance | 159 (24.1%) | 500 (75.9%) |
| Arts, Entertainment & Recreation | 61 (84.7%) | 11 (15.3%) |
| Accommodation & Food Services | 166 (61.9%) | 102 (38.1%) |
| Public Administration | 23 (7.2%) | 298 (92.8%) |
| Total | 1,930 (48.6%) | 2,037 (51.3%) |
Education in Barre
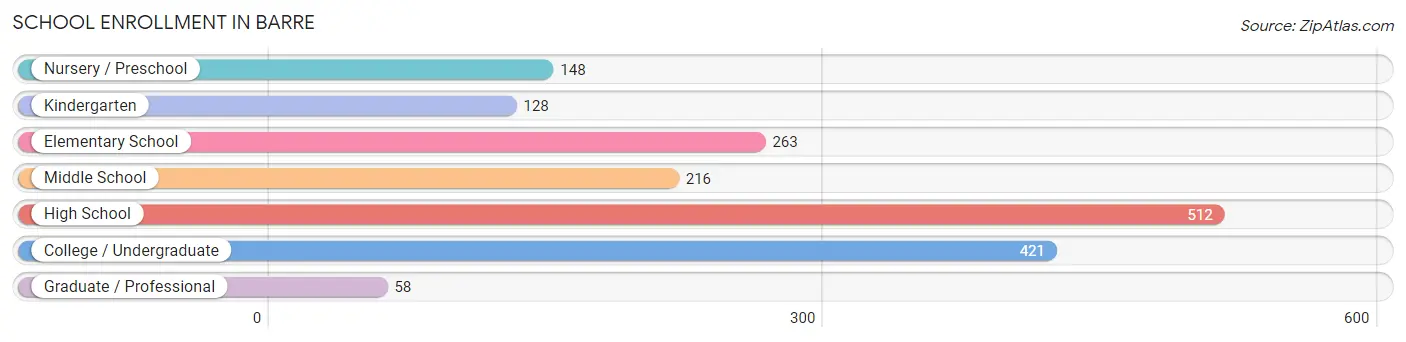
School Enrollment in Barre
The most common levels of schooling among the 1,746 students in Barre are high school (512 | 29.3%), college / undergraduate (421 | 24.1%), and elementary school (263 | 15.1%).
| School Level | # Students | % Students |
| Nursery / Preschool | 148 | 8.5% |
| Kindergarten | 128 | 7.3% |
| Elementary School | 263 | 15.1% |
| Middle School | 216 | 12.4% |
| High School | 512 | 29.3% |
| College / Undergraduate | 421 | 24.1% |
| Graduate / Professional | 58 | 3.3% |
| Total | 1,746 | 100.0% |
School Enrollment by Age by Funding Source in Barre
Out of a total of 1,746 students who are enrolled in schools in Barre, 255 (14.6%) attend a private institution, while the remaining 1,491 (85.4%) are enrolled in public schools. The age group of 3 to 4 year olds has the highest likelihood of being enrolled in private schools, with 37 (77.1% in the age bracket) enrolled. Conversely, the age group of 15 to 17 year olds has the lowest likelihood of being enrolled in a private school, with 433 (100.0% in the age bracket) attending a public institution.
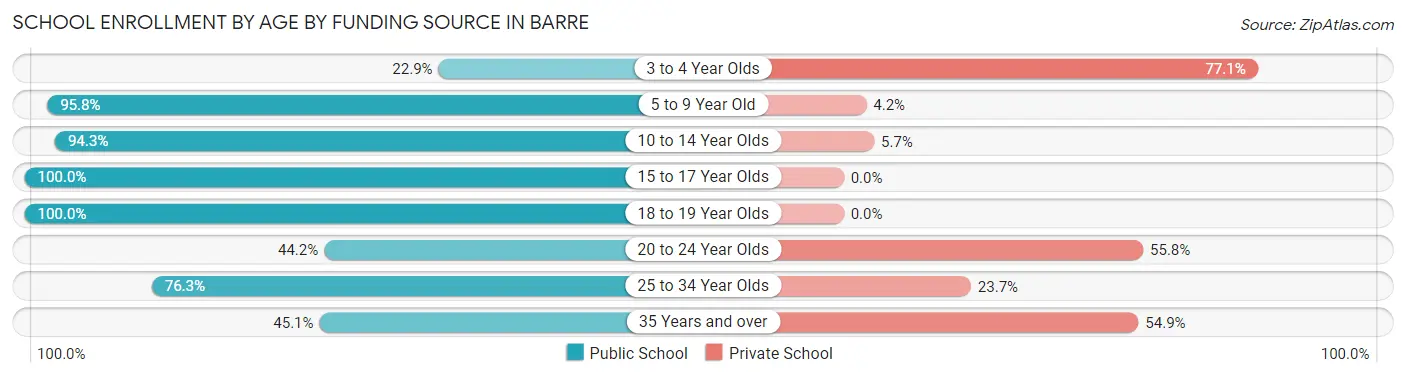
| Age Bracket | Public School | Private School |
| 3 to 4 Year Olds | 11 (22.9%) | 37 (77.1%) |
| 5 to 9 Year Old | 431 (95.8%) | 19 (4.2%) |
| 10 to 14 Year Olds | 316 (94.3%) | 19 (5.7%) |
| 15 to 17 Year Olds | 433 (100.0%) | 0 (0.0%) |
| 18 to 19 Year Olds | 57 (100.0%) | 0 (0.0%) |
| 20 to 24 Year Olds | 88 (44.2%) | 111 (55.8%) |
| 25 to 34 Year Olds | 132 (76.3%) | 41 (23.7%) |
| 35 Years and over | 23 (45.1%) | 28 (54.9%) |
| Total | 1,491 (85.4%) | 255 (14.6%) |
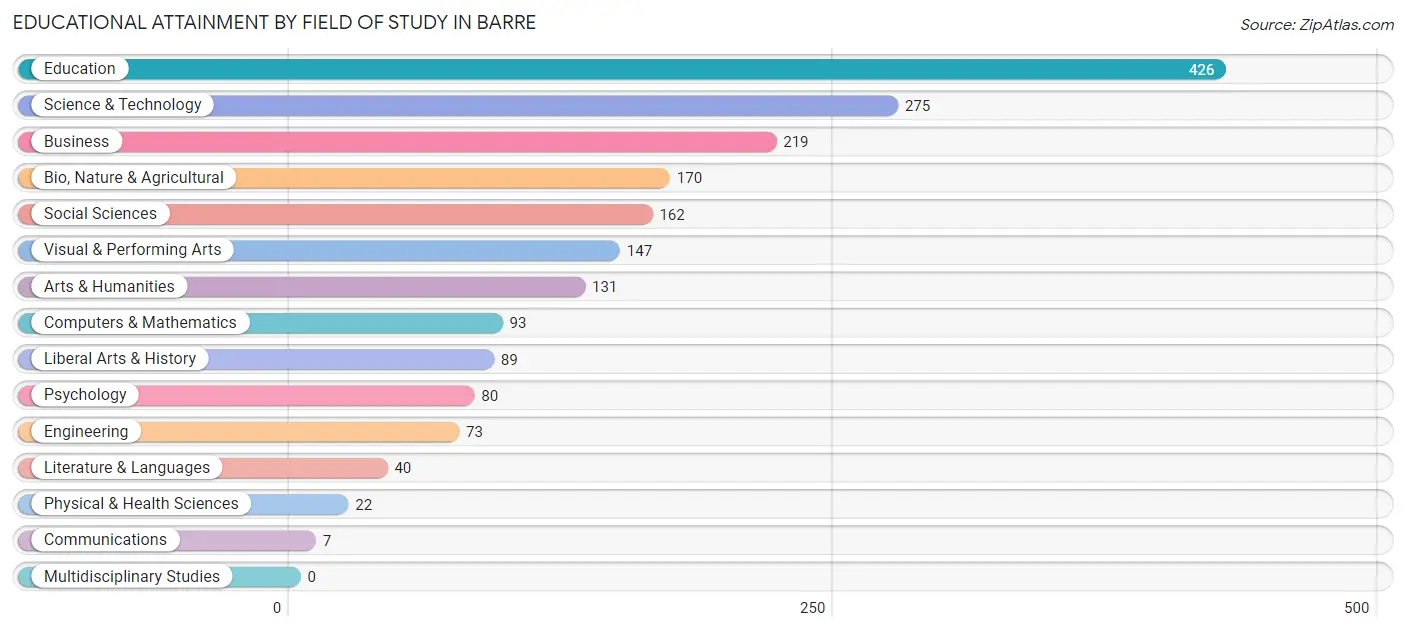
Educational Attainment by Field of Study in Barre
Education (426 | 22.0%), science & technology (275 | 14.2%), business (219 | 11.3%), bio, nature & agricultural (170 | 8.8%), and social sciences (162 | 8.4%) are the most common fields of study among 1,934 individuals in Barre who have obtained a bachelor's degree or higher.
| Field of Study | # Graduates | % Graduates |
| Computers & Mathematics | 93 | 4.8% |
| Bio, Nature & Agricultural | 170 | 8.8% |
| Physical & Health Sciences | 22 | 1.1% |
| Psychology | 80 | 4.1% |
| Social Sciences | 162 | 8.4% |
| Engineering | 73 | 3.8% |
| Multidisciplinary Studies | 0 | 0.0% |
| Science & Technology | 275 | 14.2% |
| Business | 219 | 11.3% |
| Education | 426 | 22.0% |
| Literature & Languages | 40 | 2.1% |
| Liberal Arts & History | 89 | 4.6% |
| Visual & Performing Arts | 147 | 7.6% |
| Communications | 7 | 0.4% |
| Arts & Humanities | 131 | 6.8% |
| Total | 1,934 | 100.0% |
Transportation & Commute in Barre
Vehicle Availability by Sex in Barre
The most prevalent vehicle ownership categories in Barre are males with 2 vehicles (1,052, accounting for 54.2%) and females with 2 vehicles (928, making up 52.2%).
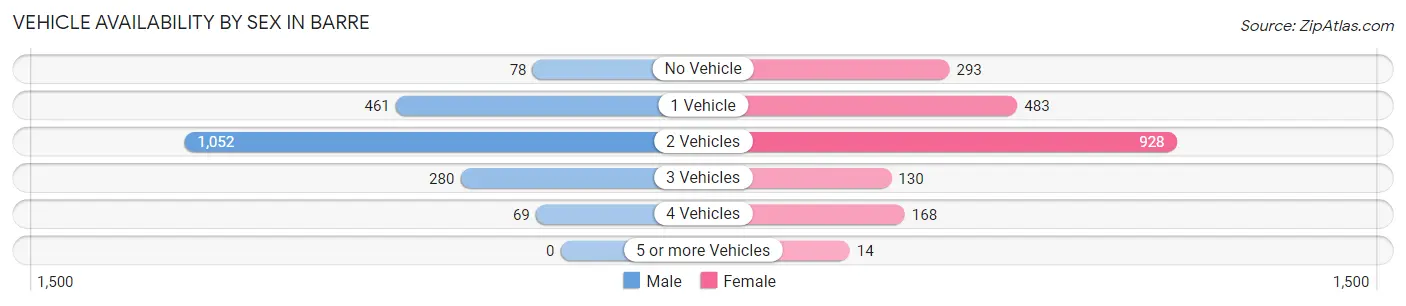
| Vehicles Available | Male | Female |
| No Vehicle | 78 (4.0%) | 293 (14.5%) |
| 1 Vehicle | 461 (23.8%) | 483 (24.0%) |
| 2 Vehicles | 1,052 (54.2%) | 928 (46.0%) |
| 3 Vehicles | 280 (14.4%) | 130 (6.5%) |
| 4 Vehicles | 69 (3.6%) | 168 (8.3%) |
| 5 or more Vehicles | 0 (0.0%) | 14 (0.7%) |
| Total | 1,940 (100.0%) | 2,016 (100.0%) |
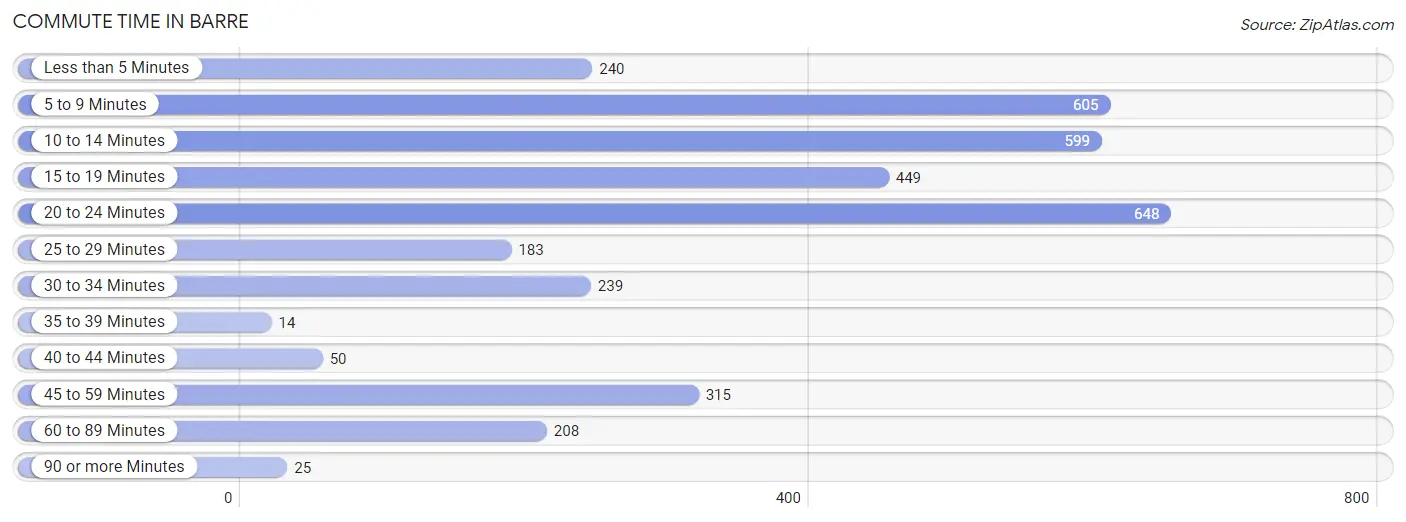
Commute Time in Barre
The most frequently occuring commute durations in Barre are 20 to 24 minutes (648 commuters, 18.1%), 5 to 9 minutes (605 commuters, 16.9%), and 10 to 14 minutes (599 commuters, 16.8%).
| Commute Time | # Commuters | % Commuters |
| Less than 5 Minutes | 240 | 6.7% |
| 5 to 9 Minutes | 605 | 16.9% |
| 10 to 14 Minutes | 599 | 16.8% |
| 15 to 19 Minutes | 449 | 12.6% |
| 20 to 24 Minutes | 648 | 18.1% |
| 25 to 29 Minutes | 183 | 5.1% |
| 30 to 34 Minutes | 239 | 6.7% |
| 35 to 39 Minutes | 14 | 0.4% |
| 40 to 44 Minutes | 50 | 1.4% |
| 45 to 59 Minutes | 315 | 8.8% |
| 60 to 89 Minutes | 208 | 5.8% |
| 90 or more Minutes | 25 | 0.7% |
Commute Time by Sex in Barre
The most common commute times in Barre are 20 to 24 minutes (334 commuters, 18.8%) for males and 5 to 9 minutes (353 commuters, 19.7%) for females.
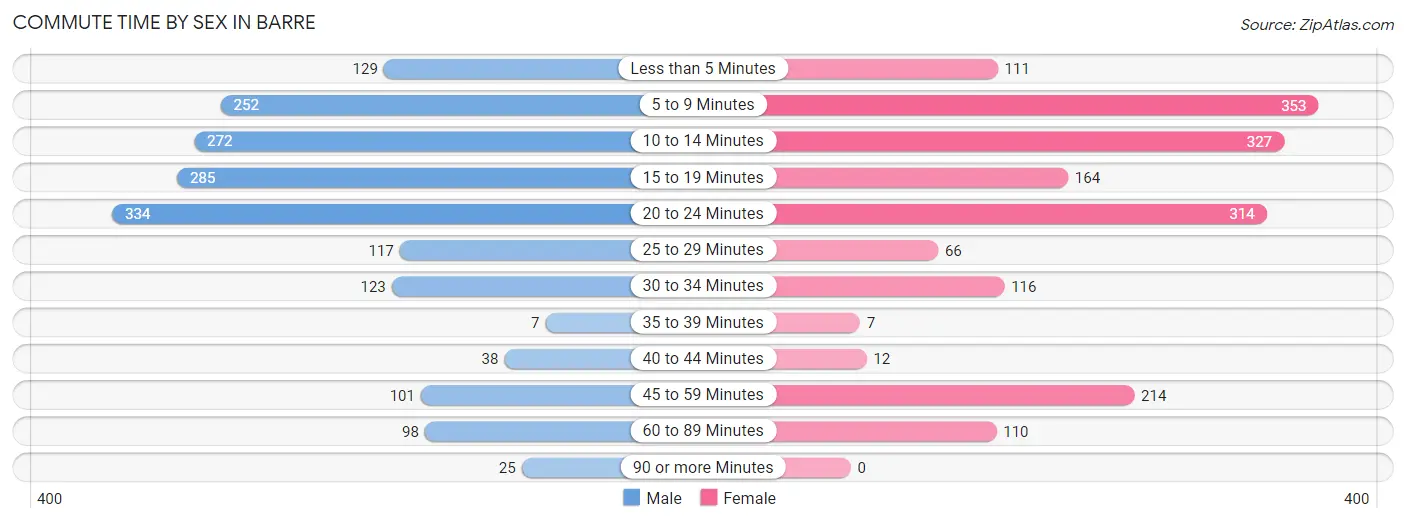
| Commute Time | Male | Female |
| Less than 5 Minutes | 129 (7.2%) | 111 (6.2%) |
| 5 to 9 Minutes | 252 (14.1%) | 353 (19.7%) |
| 10 to 14 Minutes | 272 (15.3%) | 327 (18.2%) |
| 15 to 19 Minutes | 285 (16.0%) | 164 (9.1%) |
| 20 to 24 Minutes | 334 (18.8%) | 314 (17.5%) |
| 25 to 29 Minutes | 117 (6.6%) | 66 (3.7%) |
| 30 to 34 Minutes | 123 (6.9%) | 116 (6.5%) |
| 35 to 39 Minutes | 7 (0.4%) | 7 (0.4%) |
| 40 to 44 Minutes | 38 (2.1%) | 12 (0.7%) |
| 45 to 59 Minutes | 101 (5.7%) | 214 (11.9%) |
| 60 to 89 Minutes | 98 (5.5%) | 110 (6.1%) |
| 90 or more Minutes | 25 (1.4%) | 0 (0.0%) |
Time of Departure to Work by Sex in Barre
The most frequent times of departure to work in Barre are 7:00 AM to 7:29 AM (320, 18.0%) for males and 7:00 AM to 7:29 AM (413, 23.0%) for females.
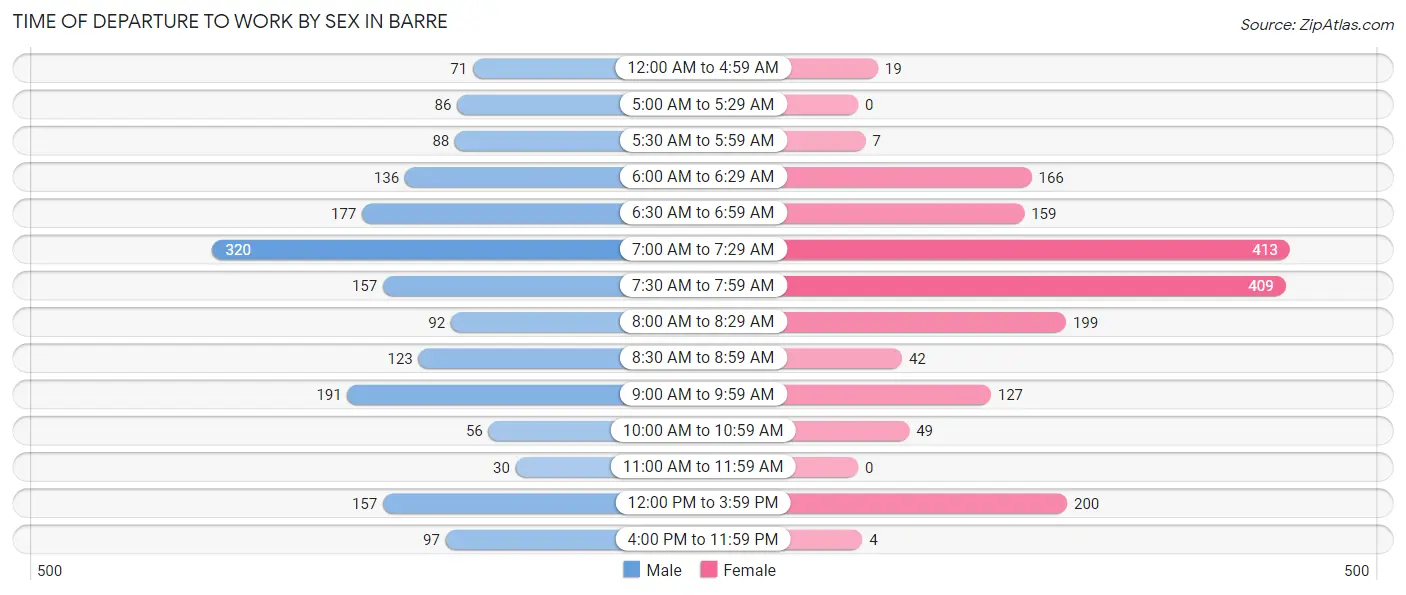
| Time of Departure | Male | Female |
| 12:00 AM to 4:59 AM | 71 (4.0%) | 19 (1.1%) |
| 5:00 AM to 5:29 AM | 86 (4.8%) | 0 (0.0%) |
| 5:30 AM to 5:59 AM | 88 (4.9%) | 7 (0.4%) |
| 6:00 AM to 6:29 AM | 136 (7.6%) | 166 (9.2%) |
| 6:30 AM to 6:59 AM | 177 (9.9%) | 159 (8.9%) |
| 7:00 AM to 7:29 AM | 320 (18.0%) | 413 (23.0%) |
| 7:30 AM to 7:59 AM | 157 (8.8%) | 409 (22.8%) |
| 8:00 AM to 8:29 AM | 92 (5.2%) | 199 (11.1%) |
| 8:30 AM to 8:59 AM | 123 (6.9%) | 42 (2.3%) |
| 9:00 AM to 9:59 AM | 191 (10.7%) | 127 (7.1%) |
| 10:00 AM to 10:59 AM | 56 (3.1%) | 49 (2.7%) |
| 11:00 AM to 11:59 AM | 30 (1.7%) | 0 (0.0%) |
| 12:00 PM to 3:59 PM | 157 (8.8%) | 200 (11.2%) |
| 4:00 PM to 11:59 PM | 97 (5.4%) | 4 (0.2%) |
| Total | 1,781 (100.0%) | 1,794 (100.0%) |
Housing Occupancy in Barre
Occupancy by Ownership in Barre
Of the total 3,795 dwellings in Barre, owner-occupied units account for 1,756 (46.3%), while renter-occupied units make up 2,039 (53.7%).
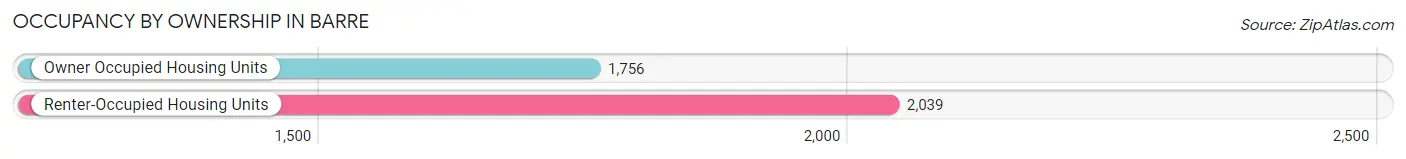
| Occupancy | # Housing Units | % Housing Units |
| Owner Occupied Housing Units | 1,756 | 46.3% |
| Renter-Occupied Housing Units | 2,039 | 53.7% |
| Total Occupied Housing Units | 3,795 | 100.0% |
Occupancy by Household Size in Barre
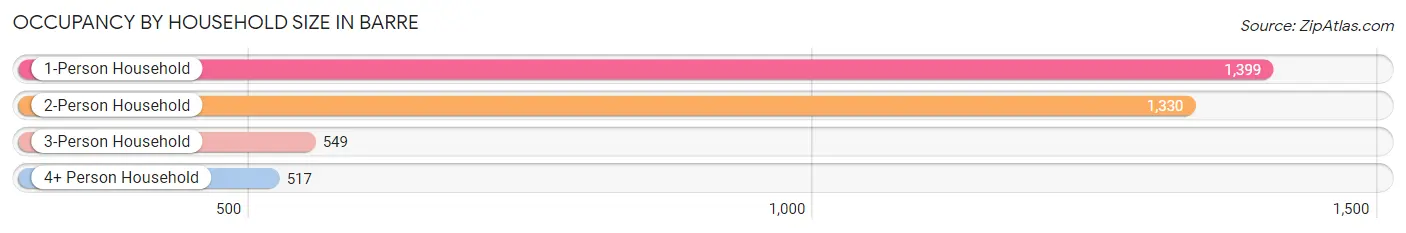
| Household Size | # Housing Units | % Housing Units |
| 1-Person Household | 1,399 | 36.9% |
| 2-Person Household | 1,330 | 35.0% |
| 3-Person Household | 549 | 14.5% |
| 4+ Person Household | 517 | 13.6% |
| Total Housing Units | 3,795 | 100.0% |
Occupancy by Ownership by Household Size in Barre
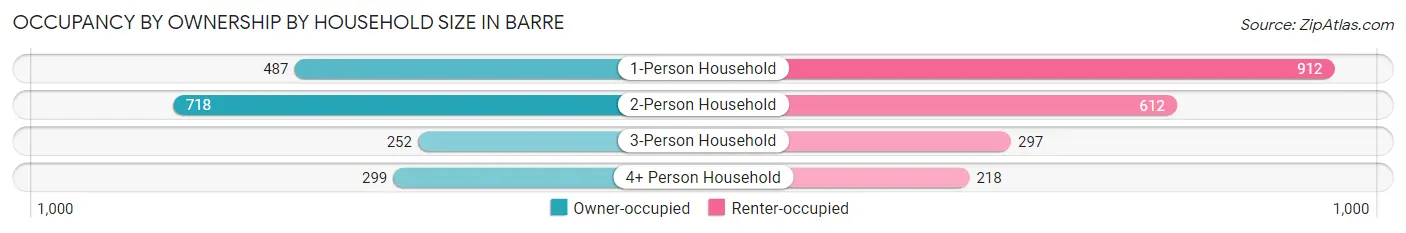
| Household Size | Owner-occupied | Renter-occupied |
| 1-Person Household | 487 (34.8%) | 912 (65.2%) |
| 2-Person Household | 718 (54.0%) | 612 (46.0%) |
| 3-Person Household | 252 (45.9%) | 297 (54.1%) |
| 4+ Person Household | 299 (57.8%) | 218 (42.2%) |
| Total Housing Units | 1,756 (46.3%) | 2,039 (53.7%) |
Occupancy by Educational Attainment in Barre
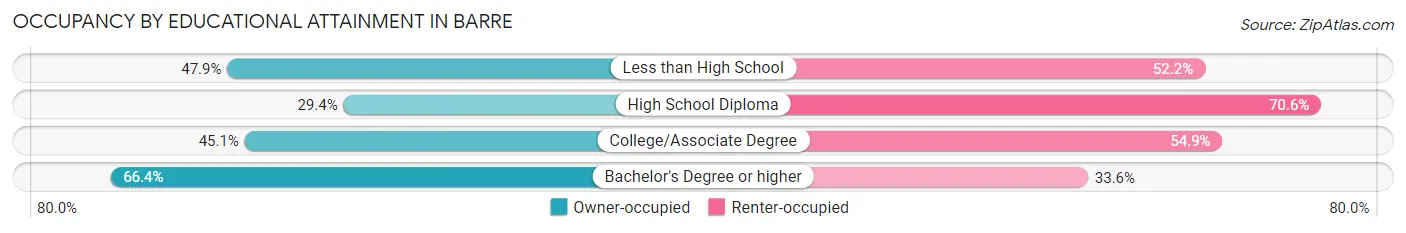
| Household Size | Owner-occupied | Renter-occupied |
| Less than High School | 100 (47.8%) | 109 (52.1%) |
| High School Diploma | 406 (29.4%) | 974 (70.6%) |
| College/Associate Degree | 455 (45.1%) | 554 (54.9%) |
| Bachelor's Degree or higher | 795 (66.4%) | 402 (33.6%) |
Occupancy by Age of Householder in Barre
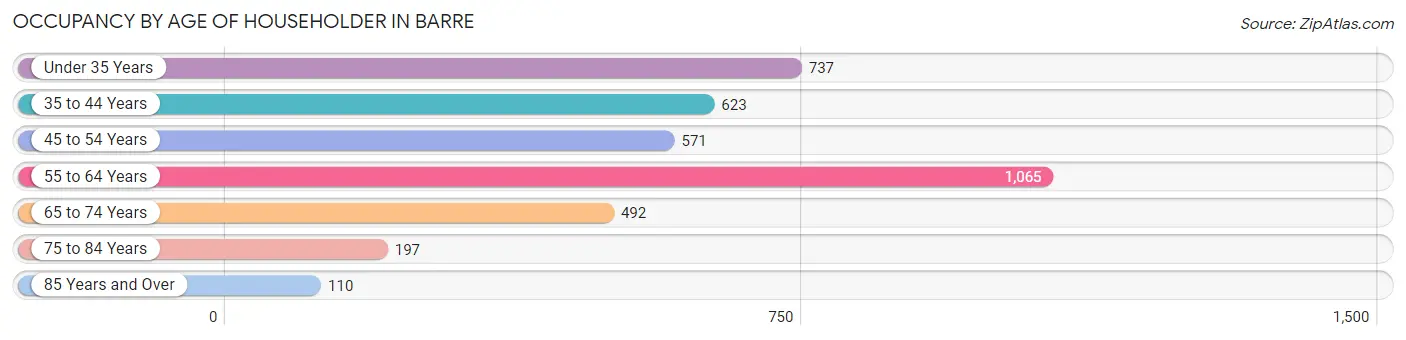
| Age Bracket | # Households | % Households |
| Under 35 Years | 737 | 19.4% |
| 35 to 44 Years | 623 | 16.4% |
| 45 to 54 Years | 571 | 15.0% |
| 55 to 64 Years | 1,065 | 28.1% |
| 65 to 74 Years | 492 | 13.0% |
| 75 to 84 Years | 197 | 5.2% |
| 85 Years and Over | 110 | 2.9% |
| Total | 3,795 | 100.0% |
Housing Finances in Barre
Median Income by Occupancy in Barre
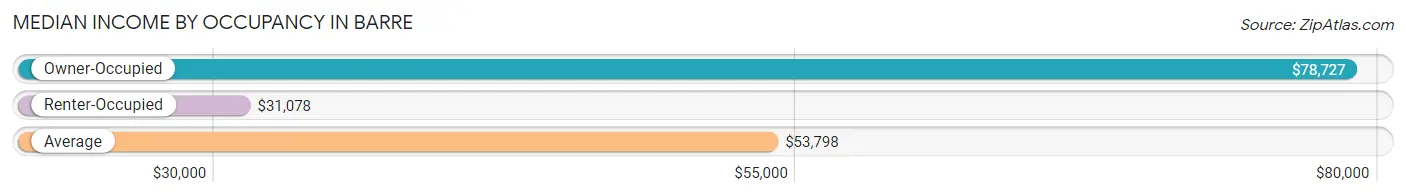
| Occupancy Type | # Households | Median Income |
| Owner-Occupied | 1,756 (46.3%) | $78,727 |
| Renter-Occupied | 2,039 (53.7%) | $31,078 |
| Average | 3,795 (100.0%) | $53,798 |
Occupancy by Householder Income Bracket in Barre
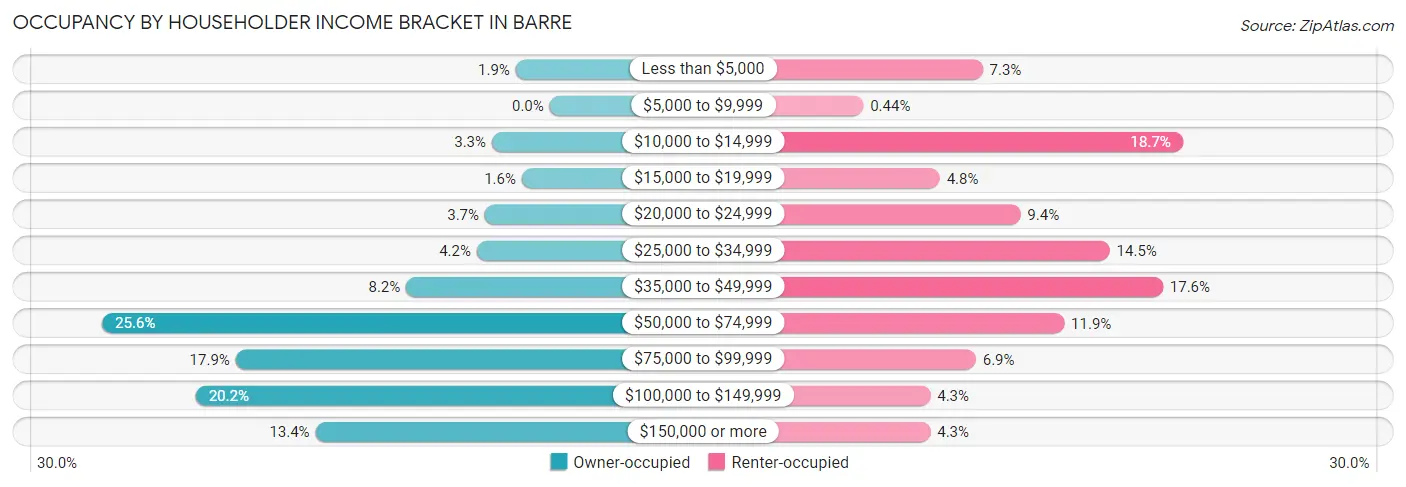
| Income Bracket | Owner-occupied | Renter-occupied |
| Less than $5,000 | 34 (1.9%) | 148 (7.3%) |
| $5,000 to $9,999 | 0 (0.0%) | 9 (0.4%) |
| $10,000 to $14,999 | 58 (3.3%) | 381 (18.7%) |
| $15,000 to $19,999 | 28 (1.6%) | 98 (4.8%) |
| $20,000 to $24,999 | 65 (3.7%) | 192 (9.4%) |
| $25,000 to $34,999 | 73 (4.2%) | 296 (14.5%) |
| $35,000 to $49,999 | 144 (8.2%) | 358 (17.6%) |
| $50,000 to $74,999 | 449 (25.6%) | 243 (11.9%) |
| $75,000 to $99,999 | 315 (17.9%) | 140 (6.9%) |
| $100,000 to $149,999 | 355 (20.2%) | 87 (4.3%) |
| $150,000 or more | 235 (13.4%) | 87 (4.3%) |
| Total | 1,756 (100.0%) | 2,039 (100.0%) |
Monthly Housing Cost Tiers in Barre
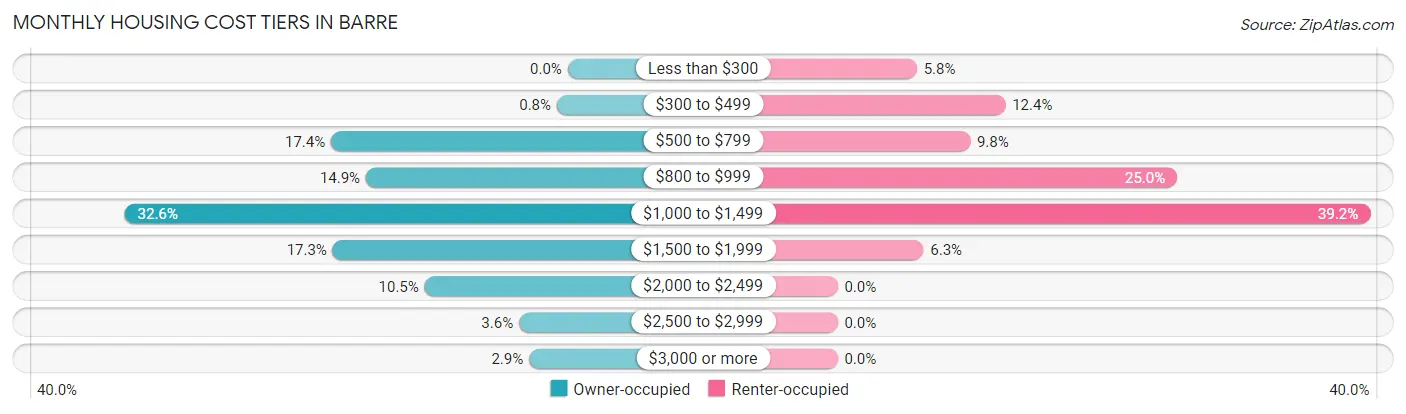
| Monthly Cost | Owner-occupied | Renter-occupied |
| Less than $300 | 0 (0.0%) | 119 (5.8%) |
| $300 to $499 | 14 (0.8%) | 252 (12.4%) |
| $500 to $799 | 306 (17.4%) | 199 (9.8%) |
| $800 to $999 | 261 (14.9%) | 510 (25.0%) |
| $1,000 to $1,499 | 573 (32.6%) | 800 (39.2%) |
| $1,500 to $1,999 | 304 (17.3%) | 129 (6.3%) |
| $2,000 to $2,499 | 185 (10.5%) | 0 (0.0%) |
| $2,500 to $2,999 | 63 (3.6%) | 0 (0.0%) |
| $3,000 or more | 50 (2.9%) | 0 (0.0%) |
| Total | 1,756 (100.0%) | 2,039 (100.0%) |
Physical Housing Characteristics in Barre
Housing Structures in Barre
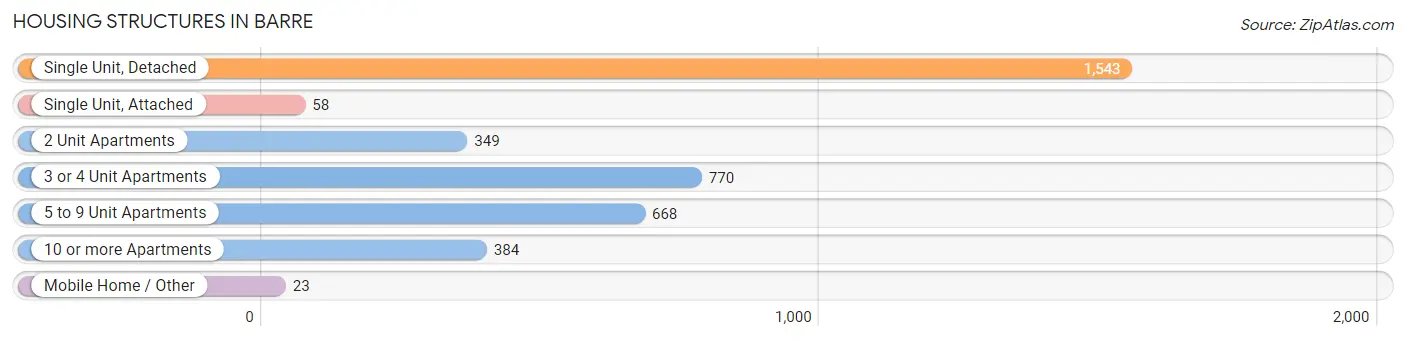
| Structure Type | # Housing Units | % Housing Units |
| Single Unit, Detached | 1,543 | 40.7% |
| Single Unit, Attached | 58 | 1.5% |
| 2 Unit Apartments | 349 | 9.2% |
| 3 or 4 Unit Apartments | 770 | 20.3% |
| 5 to 9 Unit Apartments | 668 | 17.6% |
| 10 or more Apartments | 384 | 10.1% |
| Mobile Home / Other | 23 | 0.6% |
| Total | 3,795 | 100.0% |
Housing Structures by Occupancy in Barre
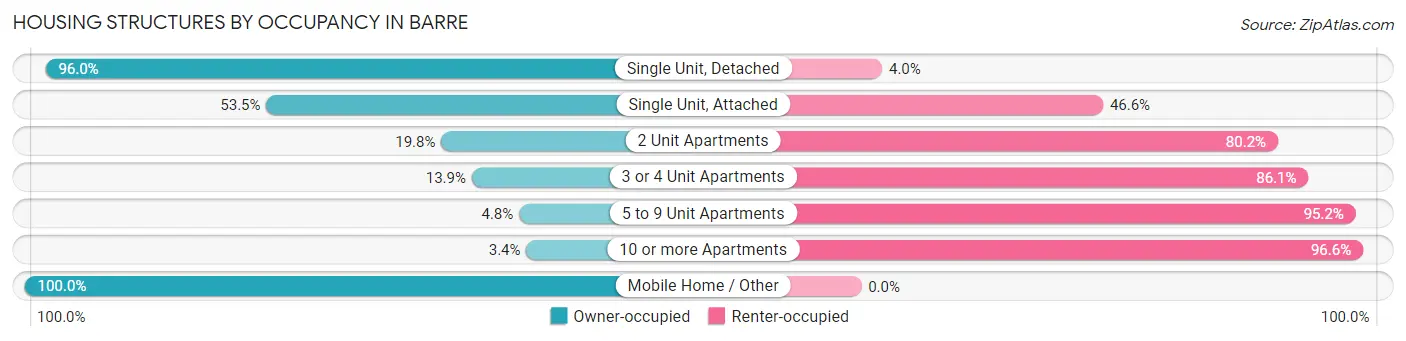
| Structure Type | Owner-occupied | Renter-occupied |
| Single Unit, Detached | 1,481 (96.0%) | 62 (4.0%) |
| Single Unit, Attached | 31 (53.4%) | 27 (46.6%) |
| 2 Unit Apartments | 69 (19.8%) | 280 (80.2%) |
| 3 or 4 Unit Apartments | 107 (13.9%) | 663 (86.1%) |
| 5 to 9 Unit Apartments | 32 (4.8%) | 636 (95.2%) |
| 10 or more Apartments | 13 (3.4%) | 371 (96.6%) |
| Mobile Home / Other | 23 (100.0%) | 0 (0.0%) |
| Total | 1,756 (46.3%) | 2,039 (53.7%) |
Housing Structures by Number of Rooms in Barre
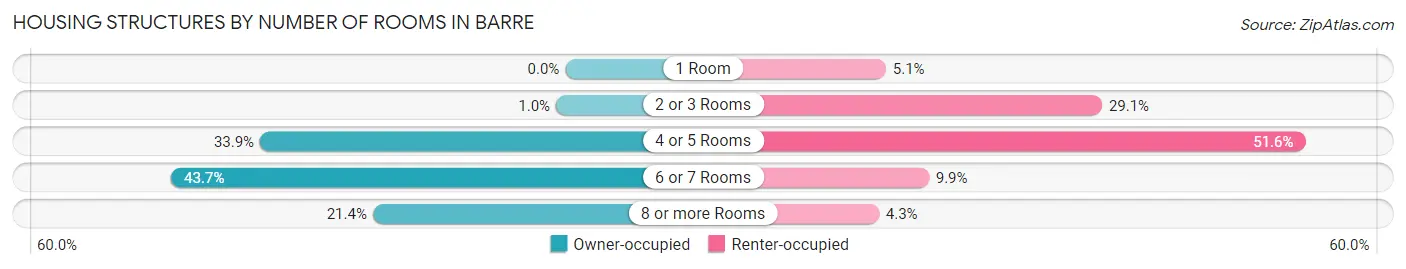
| Number of Rooms | Owner-occupied | Renter-occupied |
| 1 Room | 0 (0.0%) | 104 (5.1%) |
| 2 or 3 Rooms | 18 (1.0%) | 593 (29.1%) |
| 4 or 5 Rooms | 595 (33.9%) | 1,053 (51.6%) |
| 6 or 7 Rooms | 768 (43.7%) | 201 (9.9%) |
| 8 or more Rooms | 375 (21.4%) | 88 (4.3%) |
| Total | 1,756 (100.0%) | 2,039 (100.0%) |
Housing Structure by Heating Type in Barre
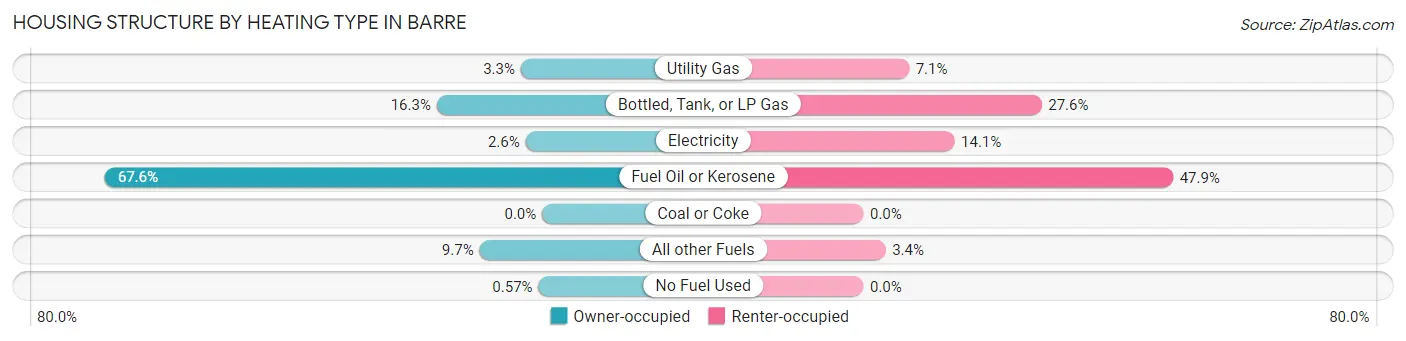
| Heating Type | Owner-occupied | Renter-occupied |
| Utility Gas | 58 (3.3%) | 144 (7.1%) |
| Bottled, Tank, or LP Gas | 286 (16.3%) | 562 (27.6%) |
| Electricity | 45 (2.6%) | 287 (14.1%) |
| Fuel Oil or Kerosene | 1,187 (67.6%) | 976 (47.9%) |
| Coal or Coke | 0 (0.0%) | 0 (0.0%) |
| All other Fuels | 170 (9.7%) | 70 (3.4%) |
| No Fuel Used | 10 (0.6%) | 0 (0.0%) |
| Total | 1,756 (100.0%) | 2,039 (100.0%) |
Household Vehicle Usage in Barre
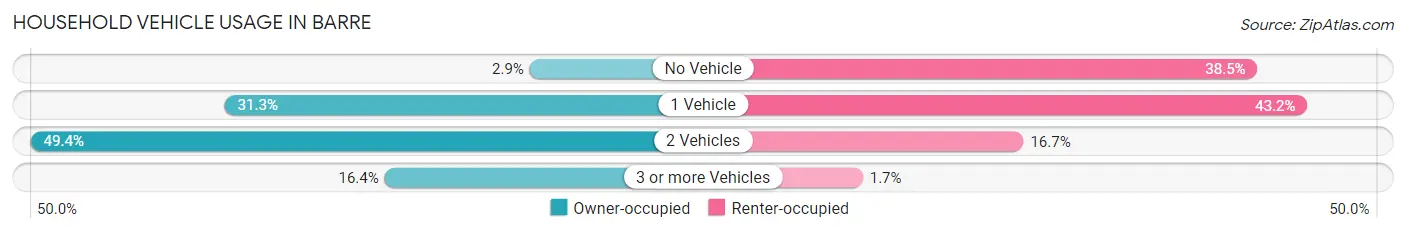
| Vehicles per Household | Owner-occupied | Renter-occupied |
| No Vehicle | 50 (2.9%) | 785 (38.5%) |
| 1 Vehicle | 550 (31.3%) | 880 (43.2%) |
| 2 Vehicles | 868 (49.4%) | 340 (16.7%) |
| 3 or more Vehicles | 288 (16.4%) | 34 (1.7%) |
| Total | 1,756 (100.0%) | 2,039 (100.0%) |
Real Estate & Mortgages in Barre
Real Estate and Mortgage Overview in Barre
| Characteristic | Without Mortgage | With Mortgage |
| Housing Units | 553 | 1,203 |
| Median Property Value | $199,300 | $181,700 |
| Median Household Income | $66,875 | $138 |
| Monthly Housing Costs | $786 | $50 |
| Real Estate Taxes | $5,046 | $35 |
Property Value by Mortgage Status in Barre
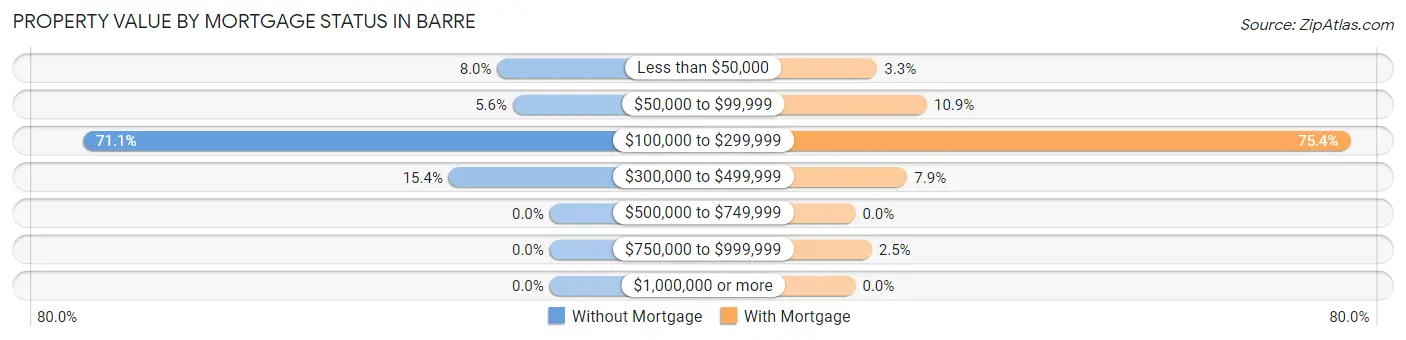
| Property Value | Without Mortgage | With Mortgage |
| Less than $50,000 | 44 (8.0%) | 40 (3.3%) |
| $50,000 to $99,999 | 31 (5.6%) | 131 (10.9%) |
| $100,000 to $299,999 | 393 (71.1%) | 907 (75.4%) |
| $300,000 to $499,999 | 85 (15.4%) | 95 (7.9%) |
| $500,000 to $749,999 | 0 (0.0%) | 0 (0.0%) |
| $750,000 to $999,999 | 0 (0.0%) | 30 (2.5%) |
| $1,000,000 or more | 0 (0.0%) | 0 (0.0%) |
| Total | 553 (100.0%) | 1,203 (100.0%) |
Household Income by Mortgage Status in Barre
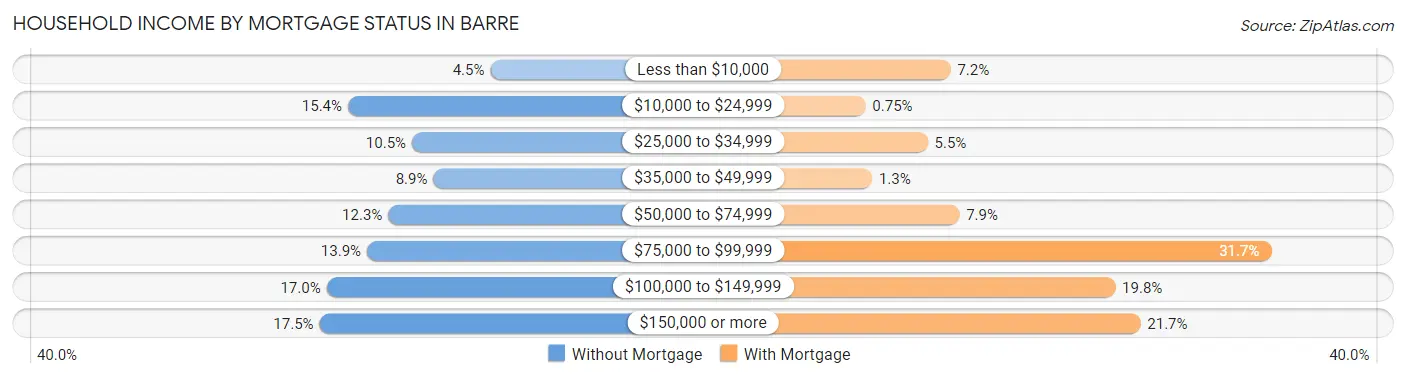
| Household Income | Without Mortgage | With Mortgage |
| Less than $10,000 | 25 (4.5%) | 87 (7.2%) |
| $10,000 to $24,999 | 85 (15.4%) | 9 (0.7%) |
| $25,000 to $34,999 | 58 (10.5%) | 66 (5.5%) |
| $35,000 to $49,999 | 49 (8.9%) | 15 (1.3%) |
| $50,000 to $74,999 | 68 (12.3%) | 95 (7.9%) |
| $75,000 to $99,999 | 77 (13.9%) | 381 (31.7%) |
| $100,000 to $149,999 | 94 (17.0%) | 238 (19.8%) |
| $150,000 or more | 97 (17.5%) | 261 (21.7%) |
| Total | 553 (100.0%) | 1,203 (100.0%) |
Property Value to Household Income Ratio in Barre
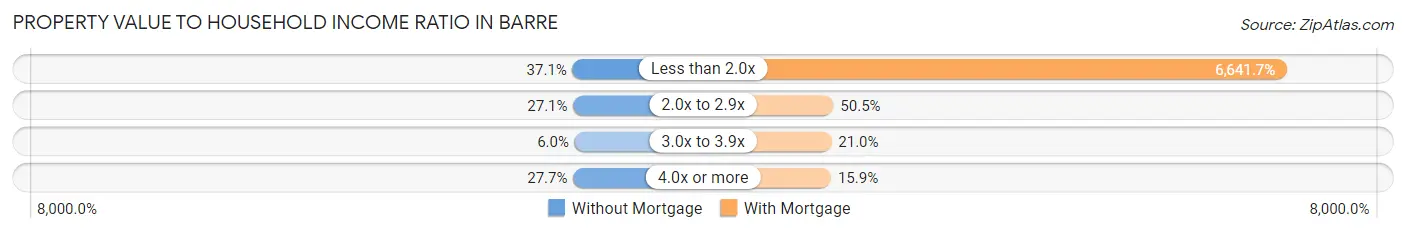
| Value-to-Income Ratio | Without Mortgage | With Mortgage |
| Less than 2.0x | 205 (37.1%) | 79,899 (6,641.6%) |
| 2.0x to 2.9x | 150 (27.1%) | 608 (50.5%) |
| 3.0x to 3.9x | 33 (6.0%) | 252 (20.9%) |
| 4.0x or more | 153 (27.7%) | 191 (15.9%) |
| Total | 553 (100.0%) | 1,203 (100.0%) |
Real Estate Taxes by Mortgage Status in Barre
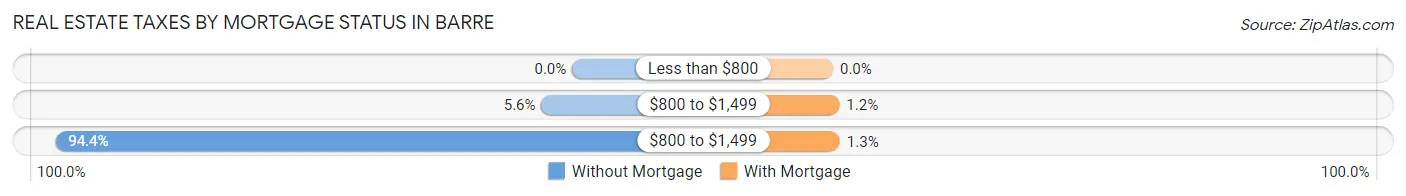
| Property Taxes | Without Mortgage | With Mortgage |
| Less than $800 | 0 (0.0%) | 0 (0.0%) |
| $800 to $1,499 | 31 (5.6%) | 14 (1.2%) |
| $800 to $1,499 | 522 (94.4%) | 15 (1.3%) |
| Total | 553 (100.0%) | 1,203 (100.0%) |
Health & Disability in Barre
Health Insurance Coverage by Age in Barre
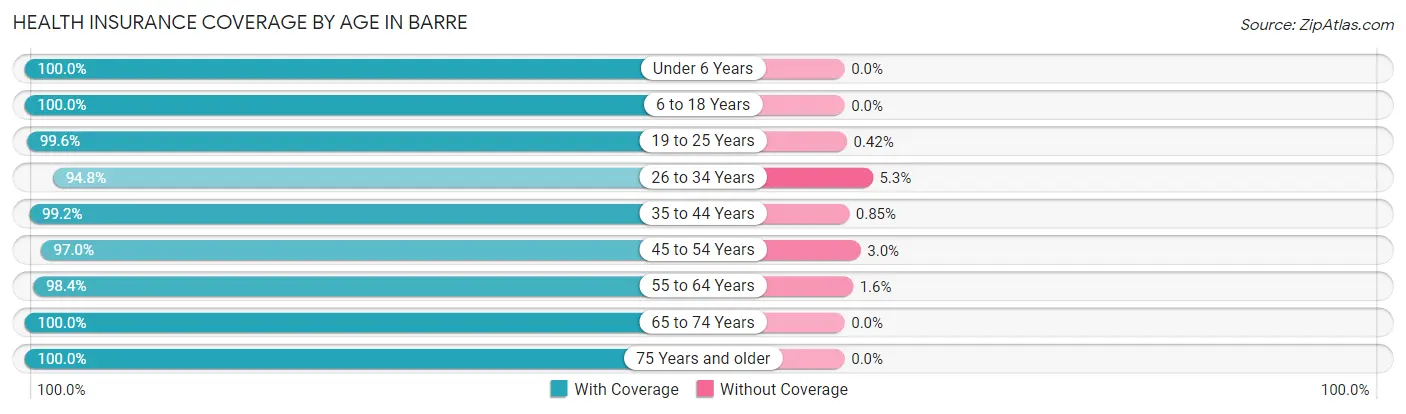
| Age Bracket | With Coverage | Without Coverage |
| Under 6 Years | 458 (100.0%) | 0 (0.0%) |
| 6 to 18 Years | 1,288 (100.0%) | 0 (0.0%) |
| 19 to 25 Years | 703 (99.6%) | 3 (0.4%) |
| 26 to 34 Years | 1,172 (94.8%) | 65 (5.2%) |
| 35 to 44 Years | 1,053 (99.2%) | 9 (0.9%) |
| 45 to 54 Years | 844 (97.0%) | 26 (3.0%) |
| 55 to 64 Years | 1,566 (98.4%) | 25 (1.6%) |
| 65 to 74 Years | 745 (100.0%) | 0 (0.0%) |
| 75 Years and older | 401 (100.0%) | 0 (0.0%) |
| Total | 8,230 (98.5%) | 128 (1.5%) |
Health Insurance Coverage by Citizenship Status in Barre
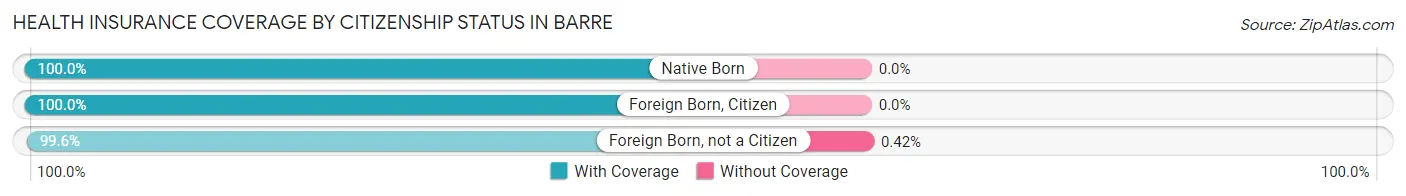
| Citizenship Status | With Coverage | Without Coverage |
| Native Born | 458 (100.0%) | 0 (0.0%) |
| Foreign Born, Citizen | 1,288 (100.0%) | 0 (0.0%) |
| Foreign Born, not a Citizen | 703 (99.6%) | 3 (0.4%) |
Health Insurance Coverage by Household Income in Barre
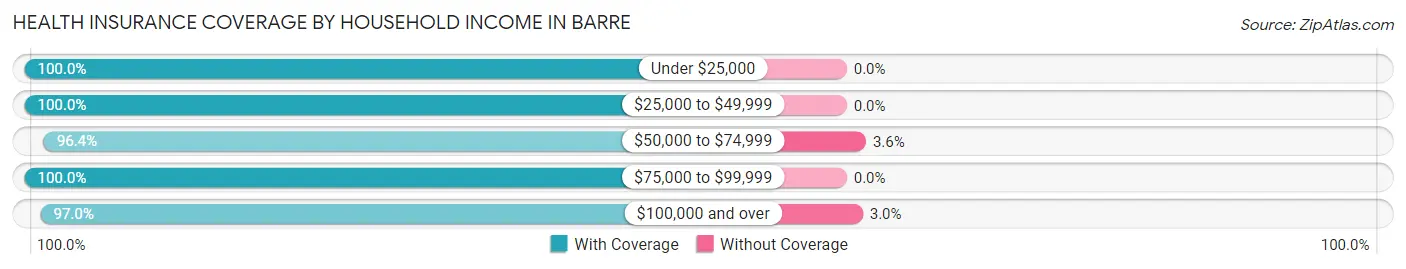
| Household Income | With Coverage | Without Coverage |
| Under $25,000 | 1,437 (100.0%) | 0 (0.0%) |
| $25,000 to $49,999 | 1,972 (100.0%) | 0 (0.0%) |
| $50,000 to $74,999 | 1,608 (96.4%) | 60 (3.6%) |
| $75,000 to $99,999 | 915 (100.0%) | 0 (0.0%) |
| $100,000 and over | 2,204 (97.0%) | 68 (3.0%) |
Public vs Private Health Insurance Coverage by Age in Barre
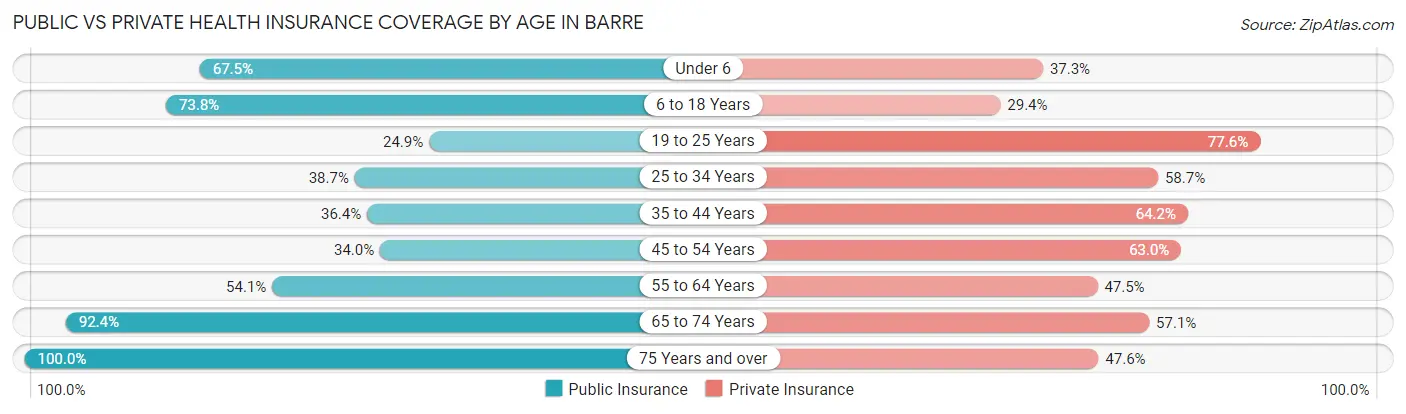
| Age Bracket | Public Insurance | Private Insurance |
| Under 6 | 309 (67.5%) | 171 (37.3%) |
| 6 to 18 Years | 950 (73.8%) | 379 (29.4%) |
| 19 to 25 Years | 176 (24.9%) | 548 (77.6%) |
| 25 to 34 Years | 479 (38.7%) | 726 (58.7%) |
| 35 to 44 Years | 387 (36.4%) | 682 (64.2%) |
| 45 to 54 Years | 296 (34.0%) | 548 (63.0%) |
| 55 to 64 Years | 860 (54.0%) | 755 (47.4%) |
| 65 to 74 Years | 688 (92.3%) | 425 (57.1%) |
| 75 Years and over | 401 (100.0%) | 191 (47.6%) |
| Total | 4,546 (54.4%) | 4,425 (52.9%) |
Disability Status by Sex by Age in Barre
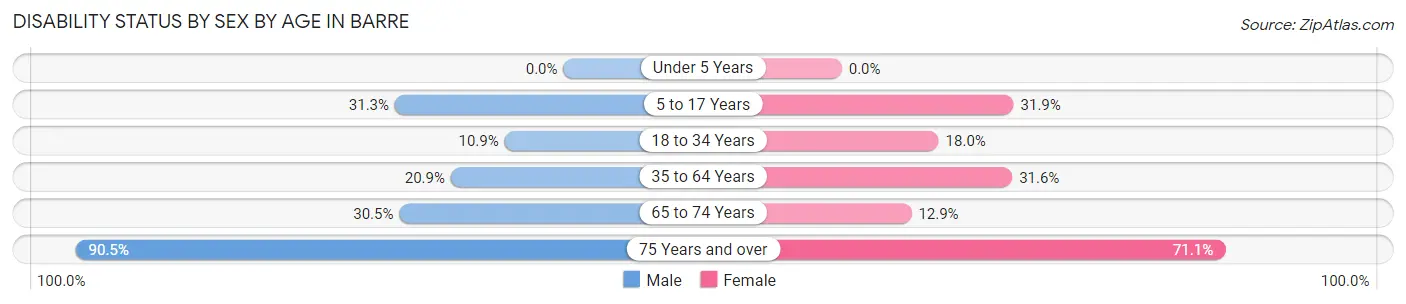
| Age Bracket | Male | Female |
| Under 5 Years | 0 (0.0%) | 0 (0.0%) |
| 5 to 17 Years | 258 (31.3%) | 177 (31.9%) |
| 18 to 34 Years | 94 (10.9%) | 196 (18.0%) |
| 35 to 64 Years | 339 (20.9%) | 601 (31.6%) |
| 65 to 74 Years | 102 (30.4%) | 53 (12.9%) |
| 75 Years and over | 153 (90.5%) | 165 (71.1%) |
Disability Class by Sex by Age in Barre
Disability Class: Hearing Difficulty
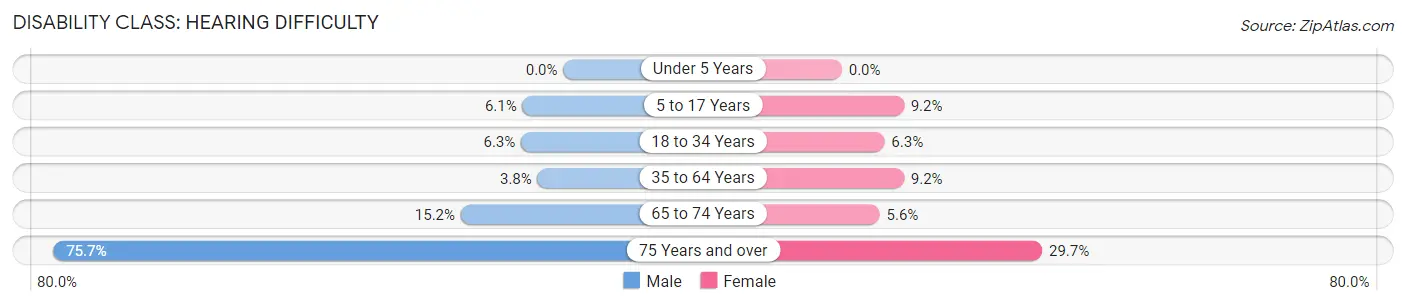
| Age Bracket | Male | Female |
| Under 5 Years | 0 (0.0%) | 0 (0.0%) |
| 5 to 17 Years | 50 (6.1%) | 51 (9.2%) |
| 18 to 34 Years | 54 (6.3%) | 69 (6.3%) |
| 35 to 64 Years | 62 (3.8%) | 175 (9.2%) |
| 65 to 74 Years | 51 (15.2%) | 23 (5.6%) |
| 75 Years and over | 128 (75.7%) | 69 (29.7%) |
Disability Class: Vision Difficulty
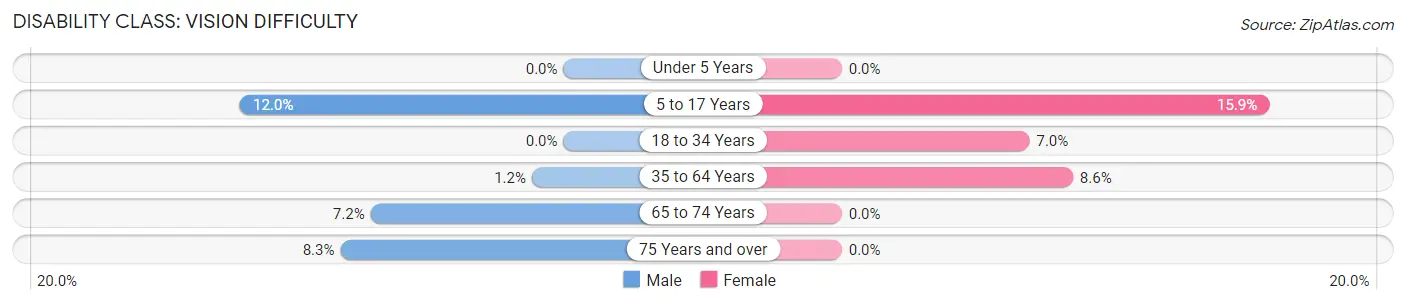
| Age Bracket | Male | Female |
| Under 5 Years | 0 (0.0%) | 0 (0.0%) |
| 5 to 17 Years | 99 (12.0%) | 88 (15.9%) |
| 18 to 34 Years | 0 (0.0%) | 76 (7.0%) |
| 35 to 64 Years | 19 (1.2%) | 163 (8.6%) |
| 65 to 74 Years | 24 (7.2%) | 0 (0.0%) |
| 75 Years and over | 14 (8.3%) | 0 (0.0%) |
Disability Class: Cognitive Difficulty
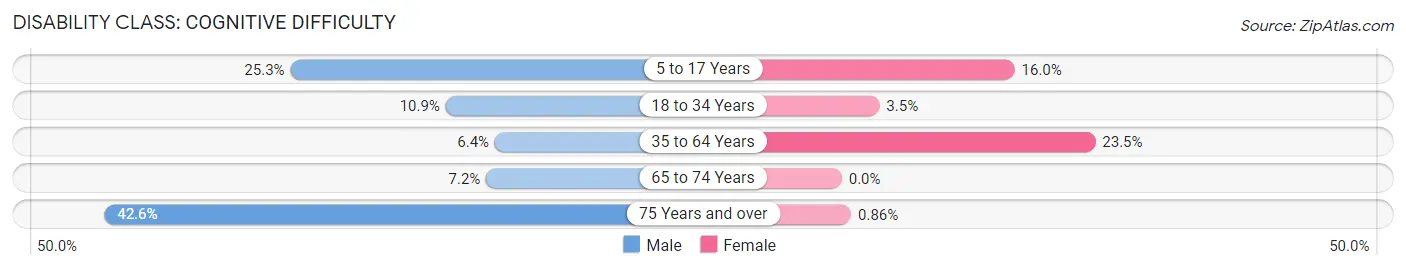
| Age Bracket | Male | Female |
| 5 to 17 Years | 209 (25.3%) | 89 (16.0%) |
| 18 to 34 Years | 94 (10.9%) | 38 (3.5%) |
| 35 to 64 Years | 103 (6.4%) | 447 (23.5%) |
| 65 to 74 Years | 24 (7.2%) | 0 (0.0%) |
| 75 Years and over | 72 (42.6%) | 2 (0.9%) |
Disability Class: Ambulatory Difficulty
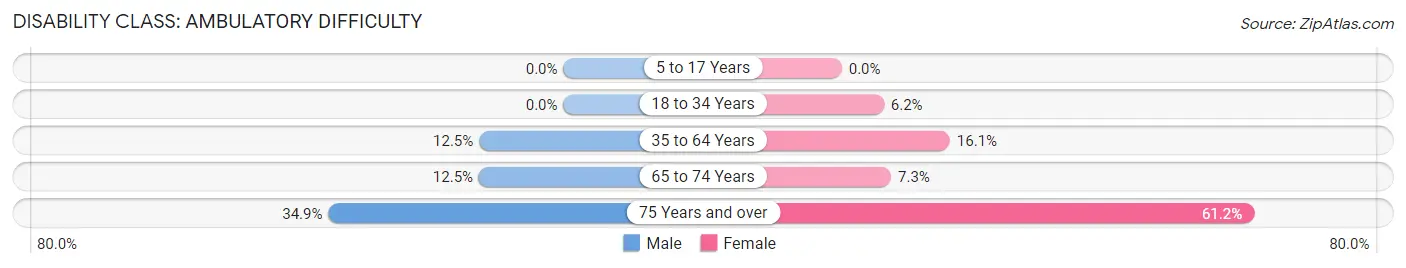
| Age Bracket | Male | Female |
| 5 to 17 Years | 0 (0.0%) | 0 (0.0%) |
| 18 to 34 Years | 0 (0.0%) | 68 (6.2%) |
| 35 to 64 Years | 203 (12.5%) | 305 (16.1%) |
| 65 to 74 Years | 42 (12.5%) | 30 (7.3%) |
| 75 Years and over | 59 (34.9%) | 142 (61.2%) |
Disability Class: Self-Care Difficulty
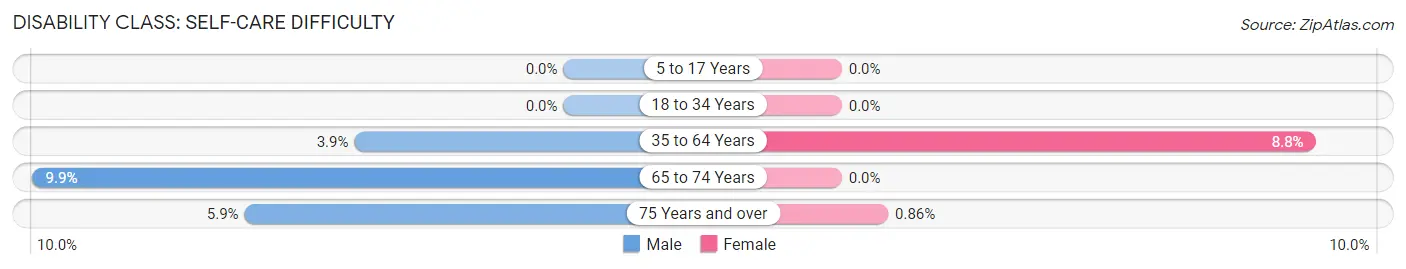
| Age Bracket | Male | Female |
| 5 to 17 Years | 0 (0.0%) | 0 (0.0%) |
| 18 to 34 Years | 0 (0.0%) | 0 (0.0%) |
| 35 to 64 Years | 63 (3.9%) | 167 (8.8%) |
| 65 to 74 Years | 33 (9.9%) | 0 (0.0%) |
| 75 Years and over | 10 (5.9%) | 2 (0.9%) |
Technology Access in Barre
Computing Device Access in Barre
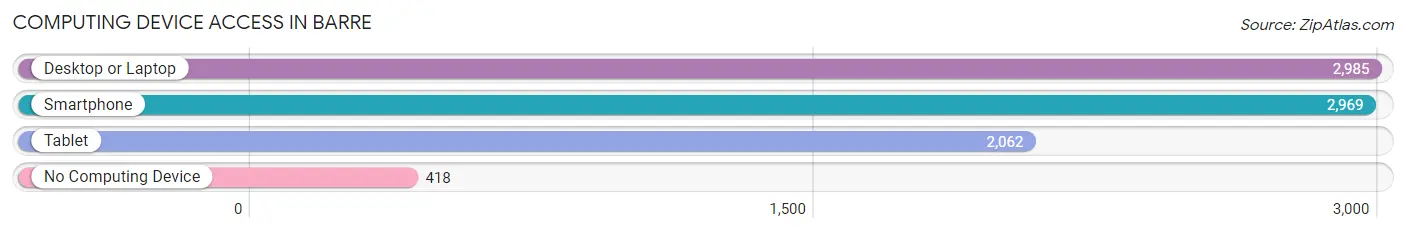
| Device Type | # Households | % Households |
| Desktop or Laptop | 2,985 | 78.7% |
| Smartphone | 2,969 | 78.2% |
| Tablet | 2,062 | 54.3% |
| No Computing Device | 418 | 11.0% |
| Total | 3,795 | 100.0% |
Internet Access in Barre
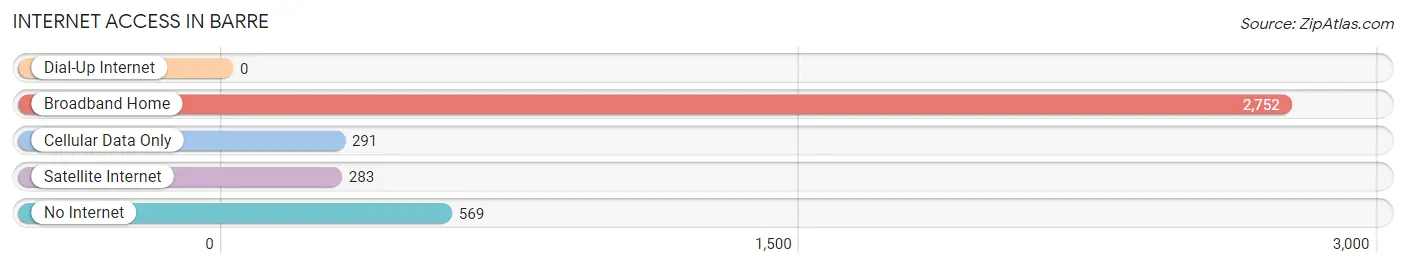
| Internet Type | # Households | % Households |
| Dial-Up Internet | 0 | 0.0% |
| Broadband Home | 2,752 | 72.5% |
| Cellular Data Only | 291 | 7.7% |
| Satellite Internet | 283 | 7.5% |
| No Internet | 569 | 15.0% |
| Total | 3,795 | 100.0% |
Barre Summary
Barre, Vermont is a small city located in Washington County in the central part of the state. It is the largest city in the county and the second largest in the state, with a population of 8,527 as of the 2010 census. The city is situated in the Barre Town, which is part of the Barre-Montpelier metropolitan area.
History
Barre was first settled in 1788 by settlers from Massachusetts and Connecticut. The town was named after Isaac Barre, a British Member of Parliament who had spoken out against the Stamp Act. The town was incorporated in 1793 and grew rapidly due to its location on the Winooski River, which provided power for mills and factories. By the mid-1800s, Barre had become a major industrial center, with granite quarries, sawmills, and factories producing furniture, tools, and other goods.
The city was also home to a large number of immigrants, particularly from Italy, who came to work in the granite quarries. The city's population peaked in the 1950s, but has since declined due to the decline of the granite industry and the out-migration of younger residents.
Geography
Barre is located in central Vermont, in the Barre Town of Washington County. It is situated on the Winooski River, which flows through the city and provides power for the city's mills and factories. The city is surrounded by hills and mountains, including the Green Mountains to the east and the Worcester Range to the west.
The city has a total area of 4.2 square miles, of which 4.1 square miles is land and 0.1 square miles is water. The city is located at an elevation of 1,068 feet above sea level.
Economy
Barre's economy is largely based on the granite industry, which has been a major part of the city's economy since the mid-1800s. The city is home to several granite quarries, which produce a variety of products, including monuments, countertops, and building materials. The city is also home to several manufacturing companies, including a furniture factory and a tool and die shop.
The city is also home to several retail stores, restaurants, and other businesses. The city is served by the Barre-Montpelier Regional Airport, which provides air service to the region.
Demographics
As of the 2010 census, the population of Barre was 8,527. The racial makeup of the city was 94.3% White, 1.2% African American, 0.3% Native American, 0.7% Asian, 0.1% Pacific Islander, 1.2% from other races, and 2.3% from two or more races. Hispanic or Latino of any race were 2.7% of the population.
The median household income in Barre was $41,945, and the median family income was $50,945. The per capita income for the city was $21,845. About 11.3% of families and 14.2% of the population were below the poverty line, including 19.2% of those under age 18 and 8.2% of those age 65 or over.
Common Questions
What is Per Capita Income in Barre?
Per Capita income in Barre is $33,285.
What is the Median Family Income in Barre?
Median Family Income in Barre is $67,946.
What is the Median Household income in Barre?
Median Household Income in Barre is $53,798.
What is Income or Wage Gap in Barre?
Income or Wage Gap in Barre is 3.7%.
Women in Barre earn 96.3 cents for every dollar earned by a man.
What is Inequality or Gini Index in Barre?
Inequality or Gini Index in Barre is 0.49.
What is the Total Population of Barre?
Total Population of Barre is 8,488.
What is the Total Male Population of Barre?
Total Male Population of Barre is 4,066.
What is the Total Female Population of Barre?
Total Female Population of Barre is 4,422.
What is the Ratio of Males per 100 Females in Barre?
There are 91.95 Males per 100 Females in Barre.
What is the Ratio of Females per 100 Males in Barre?
There are 108.76 Females per 100 Males in Barre.
What is the Median Population Age in Barre?
Median Population Age in Barre is 40.3 Years.
What is the Average Family Size in Barre
Average Family Size in Barre is 2.8 People.
What is the Average Household Size in Barre
Average Household Size in Barre is 2.2 People.
How Large is the Labor Force in Barre?
There are 4,289 People in the Labor Forcein in Barre.
What is the Percentage of People in the Labor Force in Barre?
60.8% of People are in the Labor Force in Barre.
What is the Unemployment Rate in Barre?
Unemployment Rate in Barre is 7.2%.