Cities with the Highest Percentage of Owner-Occupied Units in Vermont
RELATED REPORTS & OPTIONS
Highest Owner-Occupied
Vermont
Compare Cities
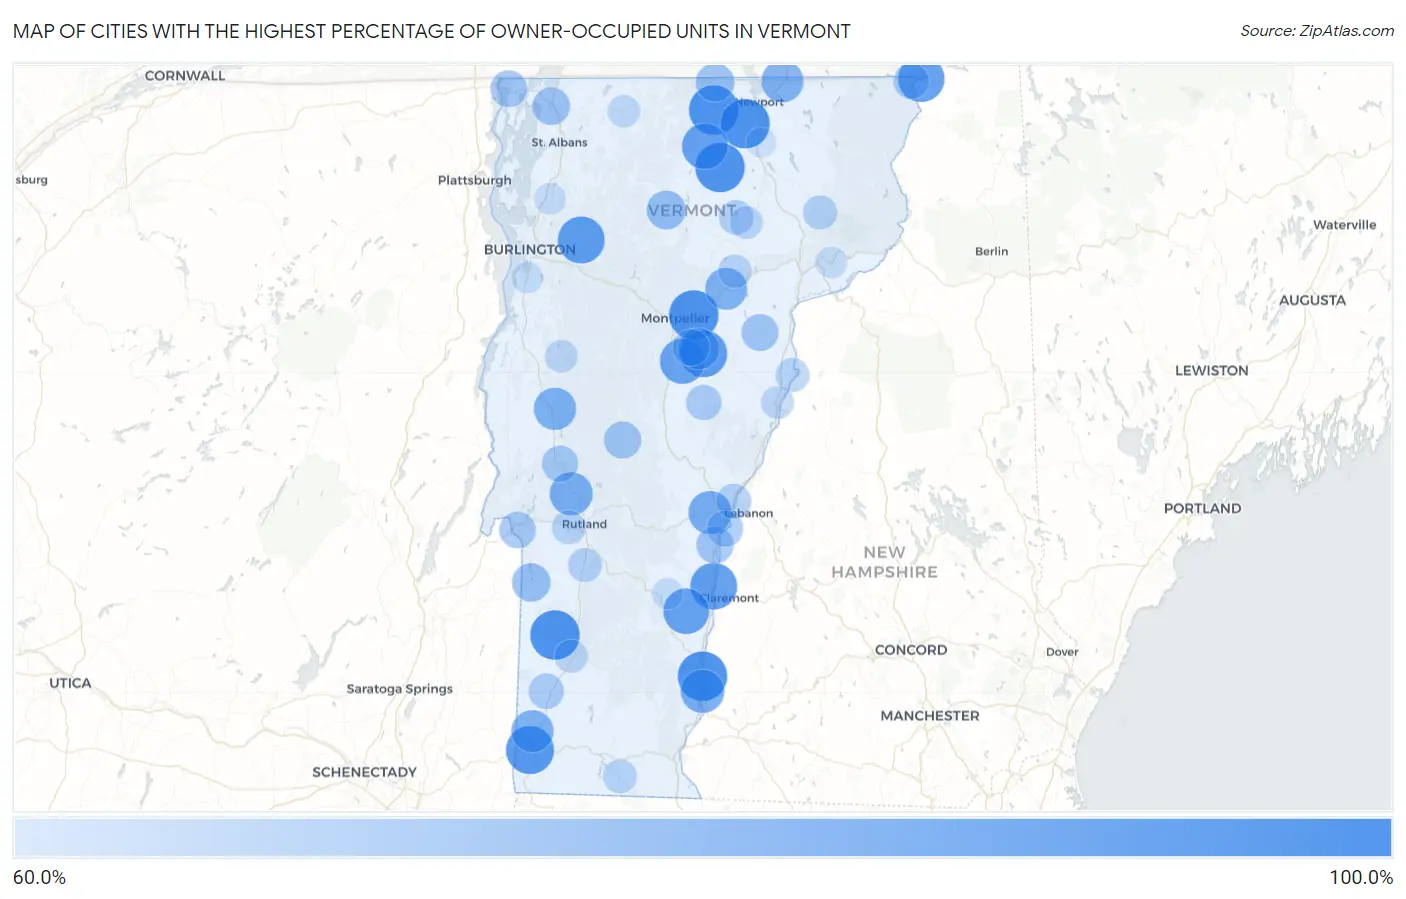
Map of Cities with the Highest Percentage of Owner-Occupied Units in Vermont
0.0%
100.0%
Cities with the Highest Percentage of Owner-Occupied Units in Vermont
| City | % Owner-Occupied | vs State | vs National | |
| 1. | Pownal | 100.0% | 72.7%(+27.3)#1 | 64.8%(+35.2)#227 |
| 2. | North Pownal | 100.0% | 72.7%(+27.3)#2 | 64.8%(+35.2)#349 |
| 3. | Dorset | 100.0% | 72.7%(+27.3)#3 | 64.8%(+35.2)#367 |
| 4. | Lyndon Center | 100.0% | 72.7%(+27.3)#4 | 64.8%(+35.2)#478 |
| 5. | Highgate Center | 100.0% | 72.7%(+27.3)#5 | 64.8%(+35.2)#543 |
| 6. | West Charlotte | 100.0% | 72.7%(+27.3)#6 | 64.8%(+35.2)#639 |
| 7. | Westford | 100.0% | 72.7%(+27.3)#7 | 64.8%(+35.2)#701 |
| 8. | Albany | 100.0% | 72.7%(+27.3)#8 | 64.8%(+35.2)#709 |
| 9. | Troy | 100.0% | 72.7%(+27.3)#9 | 64.8%(+35.2)#998 |
| 10. | North Westminster | 100.0% | 72.7%(+27.3)#10 | 64.8%(+35.2)#1,043 |
| 11. | East Montpelier | 100.0% | 72.7%(+27.3)#11 | 64.8%(+35.2)#1,618 |
| 12. | Stratton Mountain | 100.0% | 72.7%(+27.3)#12 | 64.8%(+35.2)#1,695 |
| 13. | Underhill Center | 100.0% | 72.7%(+27.3)#13 | 64.8%(+35.2)#1,712 |
| 14. | Weston | 100.0% | 72.7%(+27.3)#14 | 64.8%(+35.2)#1,956 |
| 15. | Chimney Hill | 100.0% | 72.7%(+27.3)#15 | 64.8%(+35.2)#1,998 |
| 16. | Bolton | 100.0% | 72.7%(+27.3)#16 | 64.8%(+35.2)#2,014 |
| 17. | Hanksville | 100.0% | 72.7%(+27.3)#17 | 64.8%(+35.2)#2,069 |
| 18. | Coventry | 100.0% | 72.7%(+27.3)#18 | 64.8%(+35.2)#2,422 |
| 19. | Huntington | 99.3% | 72.7%(+26.6)#19 | 64.8%(+34.4)#2,675 |
| 20. | Old Bennington | 97.2% | 72.7%(+24.5)#20 | 64.8%(+32.4)#3,074 |
| 21. | East Barre | 95.4% | 72.7%(+22.7)#21 | 64.8%(+30.6)#3,701 |
| 22. | Jericho | 95.3% | 72.7%(+22.6)#22 | 64.8%(+30.5)#3,749 |
| 23. | Bakersfield | 95.0% | 72.7%(+22.3)#23 | 64.8%(+30.2)#3,875 |
| 24. | Ascutney | 95.0% | 72.7%(+22.3)#24 | 64.8%(+30.1)#3,880 |
| 25. | Beecher Falls | 94.5% | 72.7%(+21.9)#25 | 64.8%(+29.7)#4,054 |
| 26. | Lowell | 93.5% | 72.7%(+20.8)#26 | 64.8%(+28.7)#4,482 |
| 27. | North Springfield | 93.1% | 72.7%(+20.5)#27 | 64.8%(+28.3)#4,630 |
| 28. | Stamford | 92.5% | 72.7%(+19.8)#28 | 64.8%(+27.6)#4,959 |
| 29. | Williamstown | 92.2% | 72.7%(+19.6)#29 | 64.8%(+27.4)#5,072 |
| 30. | East Dorset | 92.2% | 72.7%(+19.5)#30 | 64.8%(+27.4)#5,110 |
| 31. | Wardsboro | 92.2% | 72.7%(+19.5)#31 | 64.8%(+27.3)#5,114 |
| 32. | South Lincoln | 89.5% | 72.7%(+16.8)#32 | 64.8%(+24.7)#6,499 |
| 33. | St. George | 89.4% | 72.7%(+16.8)#33 | 64.8%(+24.6)#6,512 |
| 34. | Westminster | 89.0% | 72.7%(+16.3)#34 | 64.8%(+24.2)#6,754 |
| 35. | Quechee | 88.2% | 72.7%(+15.6)#35 | 64.8%(+23.4)#7,178 |
| 36. | Pittsford | 88.2% | 72.7%(+15.5)#36 | 64.8%(+23.4)#7,213 |
| 37. | North Hyde Park | 88.1% | 72.7%(+15.4)#37 | 64.8%(+23.3)#7,260 |
| 38. | East Middlebury | 86.9% | 72.7%(+14.3)#38 | 64.8%(+22.1)#7,980 |
| 39. | South Shaftsbury | 86.9% | 72.7%(+14.2)#39 | 64.8%(+22.1)#8,003 |
| 40. | Derby Line | 86.3% | 72.7%(+13.7)#40 | 64.8%(+21.5)#8,324 |
| 41. | Marshfield | 86.2% | 72.7%(+13.6)#41 | 64.8%(+21.4)#8,393 |
| 42. | Middletown Springs | 85.4% | 72.7%(+12.7)#42 | 64.8%(+20.6)#8,918 |
| 43. | Underhill Flats | 85.1% | 72.7%(+12.5)#43 | 64.8%(+20.3)#9,106 |
| 44. | Websterville | 84.9% | 72.7%(+12.2)#44 | 64.8%(+20.1)#9,241 |
| 45. | East Poultney | 84.4% | 72.7%(+11.7)#45 | 64.8%(+19.6)#9,518 |
| 46. | Danby | 84.0% | 72.7%(+11.4)#46 | 64.8%(+19.2)#9,745 |
| 47. | Sutton | 83.9% | 72.7%(+11.2)#47 | 64.8%(+19.1)#9,871 |
| 48. | Londonderry | 83.3% | 72.7%(+10.7)#48 | 64.8%(+18.5)#10,219 |
| 49. | New Haven | 82.7% | 72.7%(+9.99)#49 | 64.8%(+17.9)#10,648 |
| 50. | South Hero | 81.5% | 72.7%(+8.80)#50 | 64.8%(+16.7)#11,450 |
| 51. | Chittenden | 81.1% | 72.7%(+8.45)#51 | 64.8%(+16.3)#11,701 |
| 52. | Hyde Park | 81.0% | 72.7%(+8.32)#52 | 64.8%(+16.2)#11,779 |
| 53. | Proctor | 81.0% | 72.7%(+8.30)#53 | 64.8%(+16.2)#11,788 |
| 54. | North Troy | 80.0% | 72.7%(+7.32)#54 | 64.8%(+15.2)#12,424 |
| 55. | Wells | 80.0% | 72.7%(+7.32)#55 | 64.8%(+15.2)#12,432 |
| 56. | Swanton | 78.5% | 72.7%(+5.87)#56 | 64.8%(+13.7)#13,375 |
| 57. | Lunenburg | 77.9% | 72.7%(+5.25)#57 | 64.8%(+13.1)#13,816 |
| 58. | West Pawlet | 77.8% | 72.7%(+5.10)#58 | 64.8%(+13.0)#13,908 |
| 59. | Hartland | 77.7% | 72.7%(+4.99)#59 | 64.8%(+12.9)#13,991 |
| 60. | Rochester | 77.5% | 72.7%(+4.82)#60 | 64.8%(+12.7)#14,107 |
| 61. | Harmonyville | 77.5% | 72.7%(+4.82)#61 | 64.8%(+12.7)#14,109 |
| 62. | Groton | 77.3% | 72.7%(+4.62)#62 | 64.8%(+12.5)#14,237 |
| 63. | South Barre | 77.2% | 72.7%(+4.54)#63 | 64.8%(+12.4)#14,286 |
| 64. | Alburgh | 77.2% | 72.7%(+4.48)#64 | 64.8%(+12.3)#14,322 |
| 65. | Grafton | 77.1% | 72.7%(+4.46)#65 | 64.8%(+12.3)#14,352 |
| 66. | Peacham | 76.8% | 72.7%(+4.09)#66 | 64.8%(+12.0)#14,596 |
| 67. | Fair Haven | 76.7% | 72.7%(+3.98)#67 | 64.8%(+11.8)#14,682 |
| 68. | West Dummerston | 76.5% | 72.7%(+3.79)#68 | 64.8%(+11.7)#14,809 |
| 69. | Brandon | 76.2% | 72.7%(+3.52)#69 | 64.8%(+11.4)#14,984 |
| 70. | North Hartland | 75.7% | 72.7%(+3.04)#70 | 64.8%(+10.9)#15,341 |
| 71. | Pawlet | 75.6% | 72.7%(+2.95)#71 | 64.8%(+10.8)#15,398 |
| 72. | Canaan | 75.2% | 72.7%(+2.50)#72 | 64.8%(+10.4)#15,695 |
| 73. | Pownal Center | 75.0% | 72.7%(+2.32)#73 | 64.8%(+10.2)#15,795 |
| 74. | Arlington | 74.7% | 72.7%(+1.98)#74 | 64.8%(+9.84)#16,035 |
| 75. | Chelsea | 74.5% | 72.7%(+1.85)#75 | 64.8%(+9.71)#16,117 |
| 76. | Wilder | 73.7% | 72.7%(+1.06)#76 | 64.8%(+8.93)#16,629 |
| 77. | Sheffield | 73.6% | 72.7%(+0.932)#77 | 64.8%(+8.79)#16,735 |
| 78. | Killington | 73.5% | 72.7%(+0.866)#78 | 64.8%(+8.73)#16,767 |
| 79. | Greensboro | 73.2% | 72.7%(+0.536)#79 | 64.8%(+8.40)#16,972 |
| 80. | Lincoln | 73.0% | 72.7%(+0.321)#80 | 64.8%(+8.18)#17,136 |
| 81. | East Burke | 72.5% | 72.7%(-0.215)#81 | 64.8%(+7.65)#17,511 |
| 82. | Wallingford | 72.1% | 72.7%(-0.570)#82 | 64.8%(+7.29)#17,748 |
| 83. | West Rutland | 72.0% | 72.7%(-0.666)#83 | 64.8%(+7.20)#17,806 |
| 84. | Bolton Valley | 72.0% | 72.7%(-0.727)#84 | 64.8%(+7.13)#17,846 |
| 85. | Newbury | 71.9% | 72.7%(-0.757)#85 | 64.8%(+7.10)#17,861 |
| 86. | Jacksonville | 71.8% | 72.7%(-0.848)#86 | 64.8%(+7.01)#17,932 |
| 87. | Cabot | 71.3% | 72.7%(-1.37)#87 | 64.8%(+6.49)#18,288 |
| 88. | Manchester Center | 70.7% | 72.7%(-1.94)#88 | 64.8%(+5.92)#18,678 |
| 89. | Greensboro Bend | 70.4% | 72.7%(-2.27)#89 | 64.8%(+5.59)#18,911 |
| 90. | Bradford | 70.3% | 72.7%(-2.34)#90 | 64.8%(+5.52)#18,956 |
| 91. | Bristol | 70.0% | 72.7%(-2.69)#91 | 64.8%(+5.17)#19,203 |
| 92. | Enosburg Falls | 69.6% | 72.7%(-3.12)#92 | 64.8%(+4.74)#19,470 |
| 93. | Wolcott | 68.1% | 72.7%(-4.55)#93 | 64.8%(+3.32)#20,336 |
| 94. | Concord | 67.9% | 72.7%(-4.73)#94 | 64.8%(+3.13)#20,431 |
| 95. | Milton | 67.8% | 72.7%(-4.91)#95 | 64.8%(+2.95)#20,558 |
| 96. | Shelburne | 67.7% | 72.7%(-4.96)#96 | 64.8%(+2.90)#20,590 |
| 97. | Cavendish | 67.7% | 72.7%(-4.99)#97 | 64.8%(+2.88)#20,610 |
| 98. | Jamaica | 67.5% | 72.7%(-5.18)#98 | 64.8%(+2.68)#20,709 |
| 99. | Whitingham | 65.8% | 72.7%(-6.89)#99 | 64.8%(+0.973)#21,739 |
| 100. | Orleans | 65.5% | 72.7%(-7.19)#100 | 64.8%(+0.675)#21,883 |
1
2Common Questions
What are the Top 10 Cities with the Highest Percentage of Owner-Occupied Units in Vermont?
Top 10 Cities with the Highest Percentage of Owner-Occupied Units in Vermont are:
#1
100.0%
#2
100.0%
#3
100.0%
#4
100.0%
#5
100.0%
#6
100.0%
#7
97.2%
#8
95.4%
#9
95.3%
#10
95.0%
What city has the Highest Percentage of Owner-Occupied Units in Vermont?
Dorset has the Highest Percentage of Owner-Occupied Units in Vermont with 100.0%.
What is the Percentage of Owner-Occupied Units in the State of Vermont?
Percentage of Owner-Occupied Units in Vermont is 72.7%.
What is the Percentage of Owner-Occupied Units in the United States?
Percentage of Owner-Occupied Units in the United States is 64.8%.