Fairfax, VT Map & Demographics
Fairfax Map
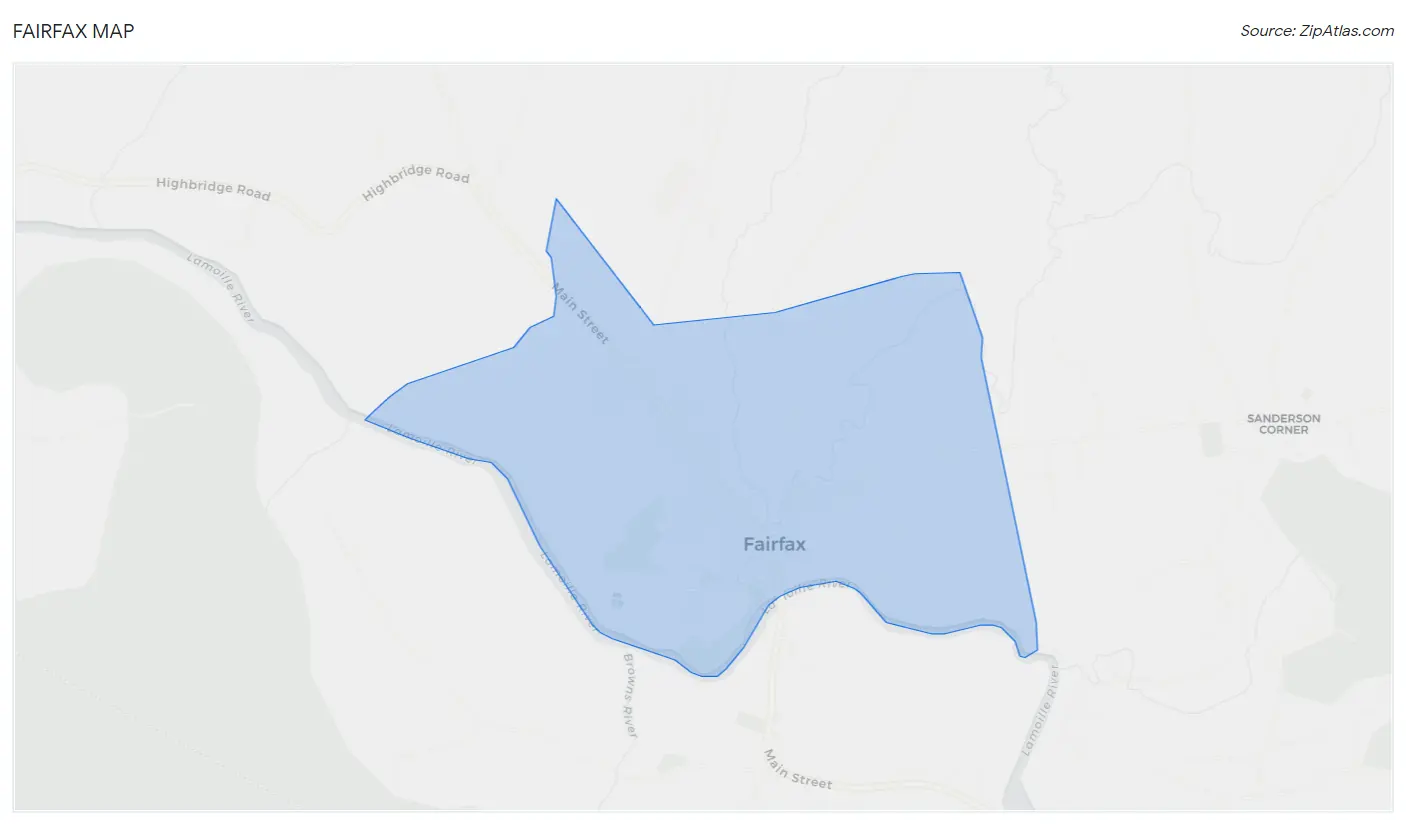
Fairfax Overview
$35,619
PER CAPITA INCOME
$75,313
AVG FAMILY INCOME
$53,869
AVG HOUSEHOLD INCOME
18.0%
WAGE / INCOME GAP [ % ]
82.0¢/ $1
WAGE / INCOME GAP [ $ ]
0.49
INEQUALITY / GINI INDEX
880
TOTAL POPULATION
468
MALE POPULATION
412
FEMALE POPULATION
113.59
MALES / 100 FEMALES
88.03
FEMALES / 100 MALES
47.4
MEDIAN AGE
2.1
AVG FAMILY SIZE
1.7
AVG HOUSEHOLD SIZE
473
LABOR FORCE [ PEOPLE ]
59.1%
PERCENT IN LABOR FORCE
13.5%
UNEMPLOYMENT RATE
Fairfax Zip Codes
Fairfax Area Codes
Income in Fairfax
Income Overview in Fairfax
Per Capita Income in Fairfax is $35,619, while median incomes of families and households are $75,313 and $53,869 respectively.
| Characteristic | Number | Measure |
| Per Capita Income | 880 | $35,619 |
| Median Family Income | 304 | $75,313 |
| Mean Family Income | 304 | $91,313 |
| Median Household Income | 505 | $53,869 |
| Mean Household Income | 505 | $65,578 |
| Income Deficit | 304 | $0 |
| Wage / Income Gap (%) | 880 | 18.00% |
| Wage / Income Gap ($) | 880 | 82.00¢ per $1 |
| Gini / Inequality Index | 880 | 0.49 |
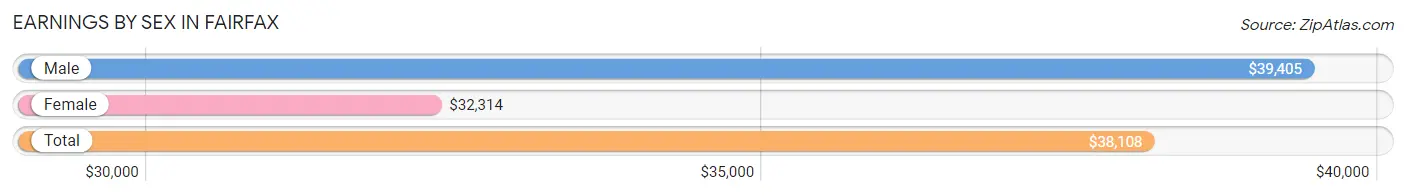
Earnings by Sex in Fairfax
Average Earnings in Fairfax are $38,108, $39,405 for men and $32,314 for women, a difference of 18.0%.
| Sex | Number | Average Earnings |
| Male | 250 (46.8%) | $39,405 |
| Female | 284 (53.2%) | $32,314 |
| Total | 534 (100.0%) | $38,108 |
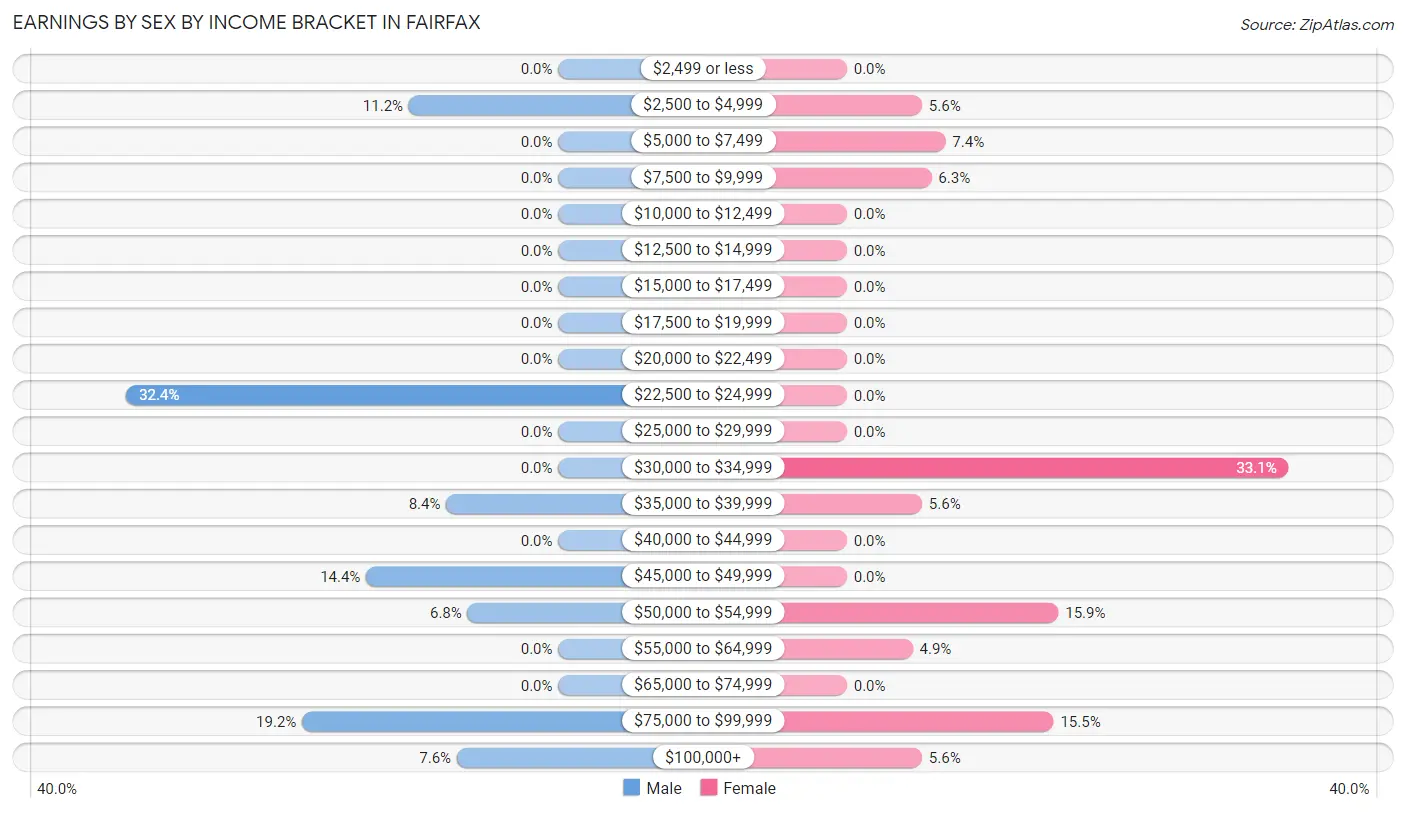
Earnings by Sex by Income Bracket in Fairfax
The most common earnings brackets in Fairfax are $22,500 to $24,999 for men (81 | 32.4%) and $30,000 to $34,999 for women (94 | 33.1%).
| Income | Male | Female |
| $2,499 or less | 0 (0.0%) | 0 (0.0%) |
| $2,500 to $4,999 | 28 (11.2%) | 16 (5.6%) |
| $5,000 to $7,499 | 0 (0.0%) | 21 (7.4%) |
| $7,500 to $9,999 | 0 (0.0%) | 18 (6.3%) |
| $10,000 to $12,499 | 0 (0.0%) | 0 (0.0%) |
| $12,500 to $14,999 | 0 (0.0%) | 0 (0.0%) |
| $15,000 to $17,499 | 0 (0.0%) | 0 (0.0%) |
| $17,500 to $19,999 | 0 (0.0%) | 0 (0.0%) |
| $20,000 to $22,499 | 0 (0.0%) | 0 (0.0%) |
| $22,500 to $24,999 | 81 (32.4%) | 0 (0.0%) |
| $25,000 to $29,999 | 0 (0.0%) | 0 (0.0%) |
| $30,000 to $34,999 | 0 (0.0%) | 94 (33.1%) |
| $35,000 to $39,999 | 21 (8.4%) | 16 (5.6%) |
| $40,000 to $44,999 | 0 (0.0%) | 0 (0.0%) |
| $45,000 to $49,999 | 36 (14.4%) | 0 (0.0%) |
| $50,000 to $54,999 | 17 (6.8%) | 45 (15.9%) |
| $55,000 to $64,999 | 0 (0.0%) | 14 (4.9%) |
| $65,000 to $74,999 | 0 (0.0%) | 0 (0.0%) |
| $75,000 to $99,999 | 48 (19.2%) | 44 (15.5%) |
| $100,000+ | 19 (7.6%) | 16 (5.6%) |
| Total | 250 (100.0%) | 284 (100.0%) |
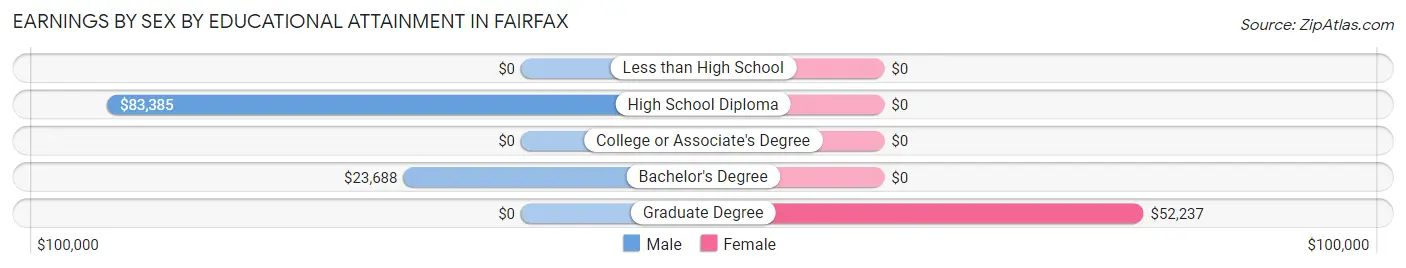
Earnings by Sex by Educational Attainment in Fairfax
Average earnings in Fairfax are $39,405 for men and $32,314 for women, a difference of 18.0%. Men with an educational attainment of high school diploma enjoy the highest average annual earnings of $83,385, while those with bachelor's degree education earn the least with $23,688. Women with an educational attainment of graduate degree earn the most with the average annual earnings of $52,237, while those with graduate degree education have the smallest earnings of $52,237.
| Educational Attainment | Male Income | Female Income |
| Less than High School | - | - |
| High School Diploma | $83,385 | $0 |
| College or Associate's Degree | - | - |
| Bachelor's Degree | $23,688 | $0 |
| Graduate Degree | - | - |
| Total | $39,405 | $32,314 |
Family Income in Fairfax
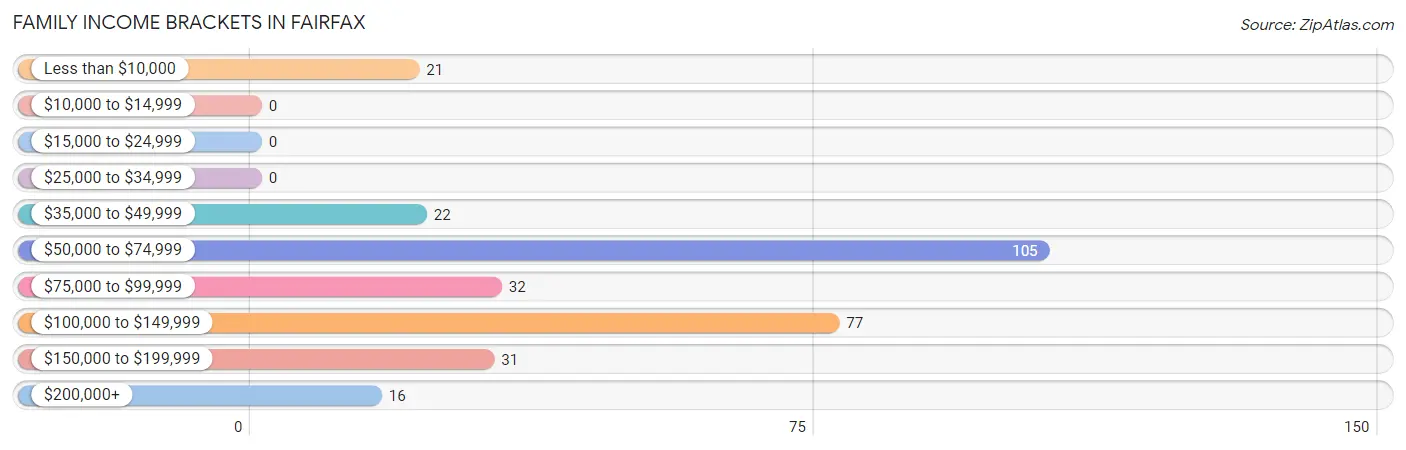
Family Income Brackets in Fairfax
According to the Fairfax family income data, there are 105 families falling into the $50,000 to $74,999 income range, which is the most common income bracket and makes up 34.5% of all families.
| Income Bracket | # Families | % Families |
| Less than $10,000 | 21 | 6.9% |
| $10,000 to $14,999 | 0 | 0.0% |
| $15,000 to $24,999 | 0 | 0.0% |
| $25,000 to $34,999 | 0 | 0.0% |
| $35,000 to $49,999 | 22 | 7.2% |
| $50,000 to $74,999 | 105 | 34.5% |
| $75,000 to $99,999 | 32 | 10.5% |
| $100,000 to $149,999 | 77 | 25.3% |
| $150,000 to $199,999 | 31 | 10.2% |
| $200,000+ | 16 | 5.3% |
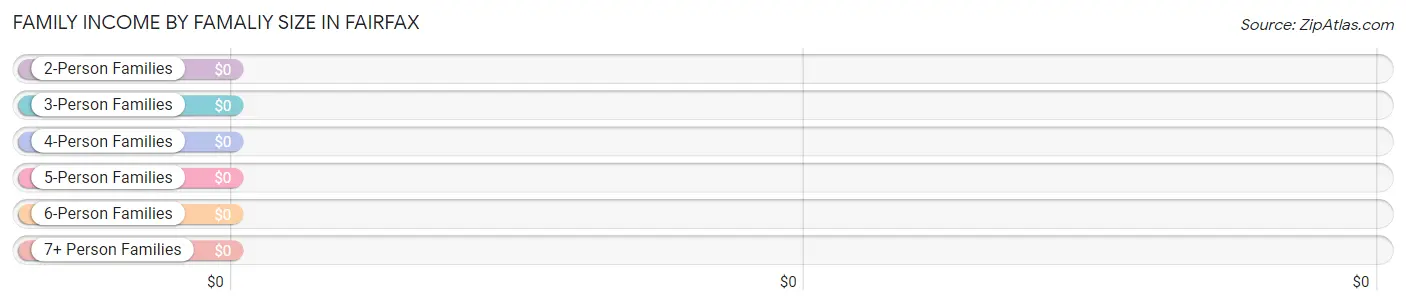
Family Income by Famaliy Size in Fairfax
| Income Bracket | # Families | Median Income |
| 2-Person Families | 270 (88.8%) | $0 |
| 3-Person Families | 18 (5.9%) | $0 |
| 4-Person Families | 16 (5.3%) | $0 |
| 5-Person Families | 0 (0.0%) | $0 |
| 6-Person Families | 0 (0.0%) | $0 |
| 7+ Person Families | 0 (0.0%) | $0 |
| Total | 304 (100.0%) | $75,313 |
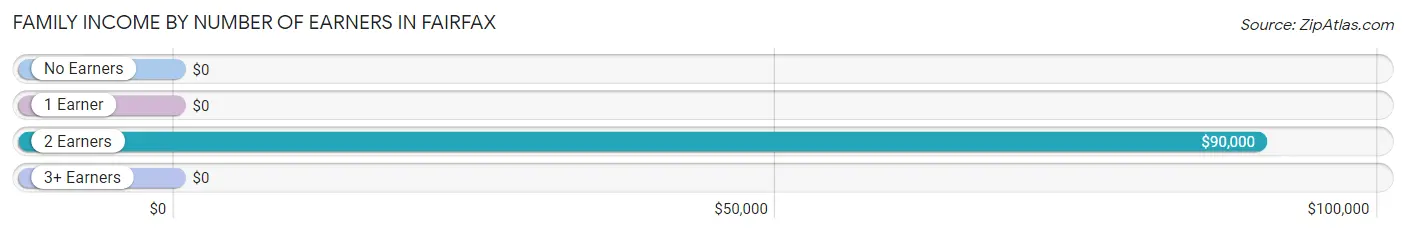
Family Income by Number of Earners in Fairfax
| Number of Earners | # Families | Median Income |
| No Earners | 33 (10.9%) | $0 |
| 1 Earner | 55 (18.1%) | $0 |
| 2 Earners | 216 (71.1%) | $90,000 |
| 3+ Earners | 0 (0.0%) | $0 |
| Total | 304 (100.0%) | $75,313 |
Household Income in Fairfax
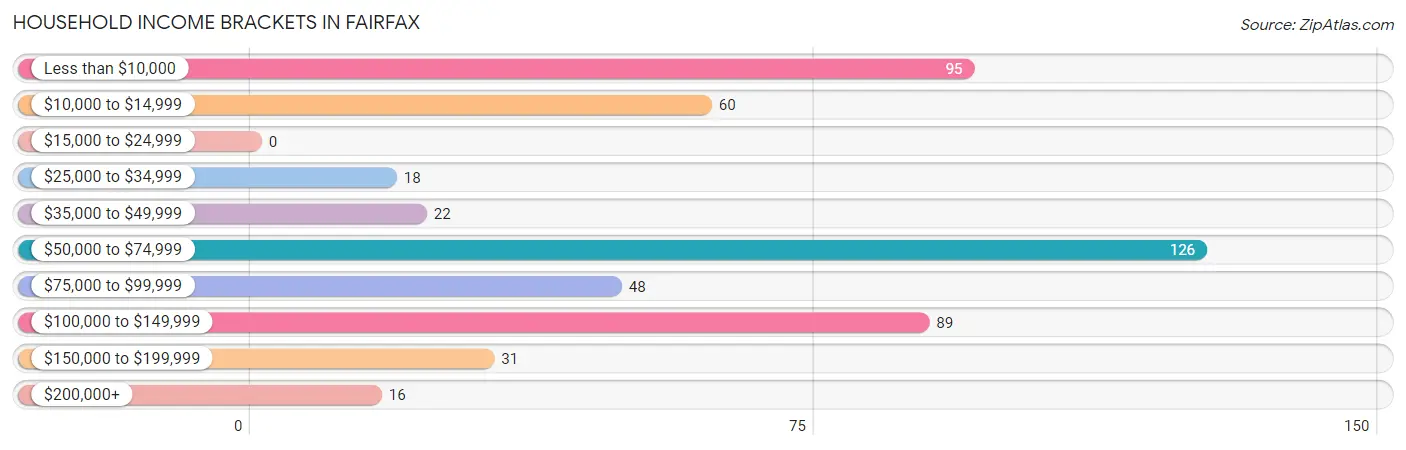
Household Income Brackets in Fairfax
With 126 households falling in the category, the $50,000 to $74,999 income range is the most frequent in Fairfax, accounting for 24.9% of all households.
| Income Bracket | # Households | % Households |
| Less than $10,000 | 95 | 18.8% |
| $10,000 to $14,999 | 60 | 11.9% |
| $15,000 to $24,999 | 0 | 0.0% |
| $25,000 to $34,999 | 18 | 3.6% |
| $35,000 to $49,999 | 22 | 4.4% |
| $50,000 to $74,999 | 126 | 25.0% |
| $75,000 to $99,999 | 48 | 9.5% |
| $100,000 to $149,999 | 89 | 17.6% |
| $150,000 to $199,999 | 31 | 6.1% |
| $200,000+ | 16 | 3.2% |
Household Income by Householder Age in Fairfax
The median household income in Fairfax is $53,869, with the highest median household income of $54,428 found in the 25 to 44 years age bracket for the primary householder. A total of 187 households (37.0%) fall into this category.
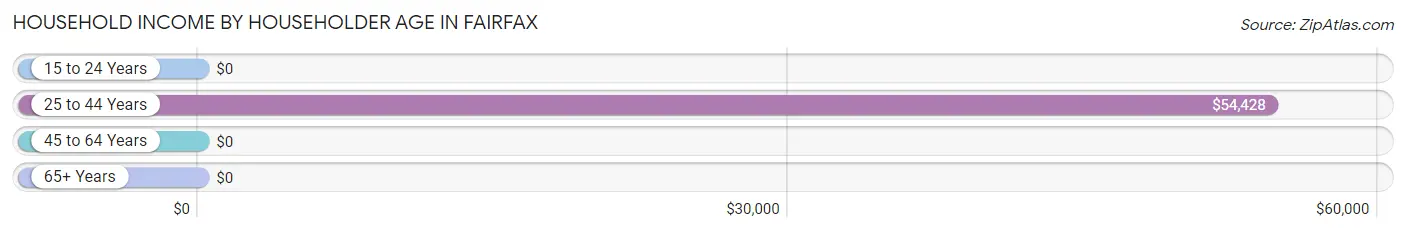
| Income Bracket | # Households | Median Income |
| 15 to 24 Years | 0 (0.0%) | $0 |
| 25 to 44 Years | 187 (37.0%) | $54,428 |
| 45 to 64 Years | 198 (39.2%) | $0 |
| 65+ Years | 120 (23.8%) | $0 |
| Total | 505 (100.0%) | $53,869 |
Poverty in Fairfax
Income Below Poverty by Sex and Age in Fairfax
With 26.3% poverty level for males and 19.7% for females among the residents of Fairfax, under 5 year old males and 65 to 74 year old females are the most vulnerable to poverty, with 21 males (100.0%) and 60 females (43.2%) in their respective age groups living below the poverty level.
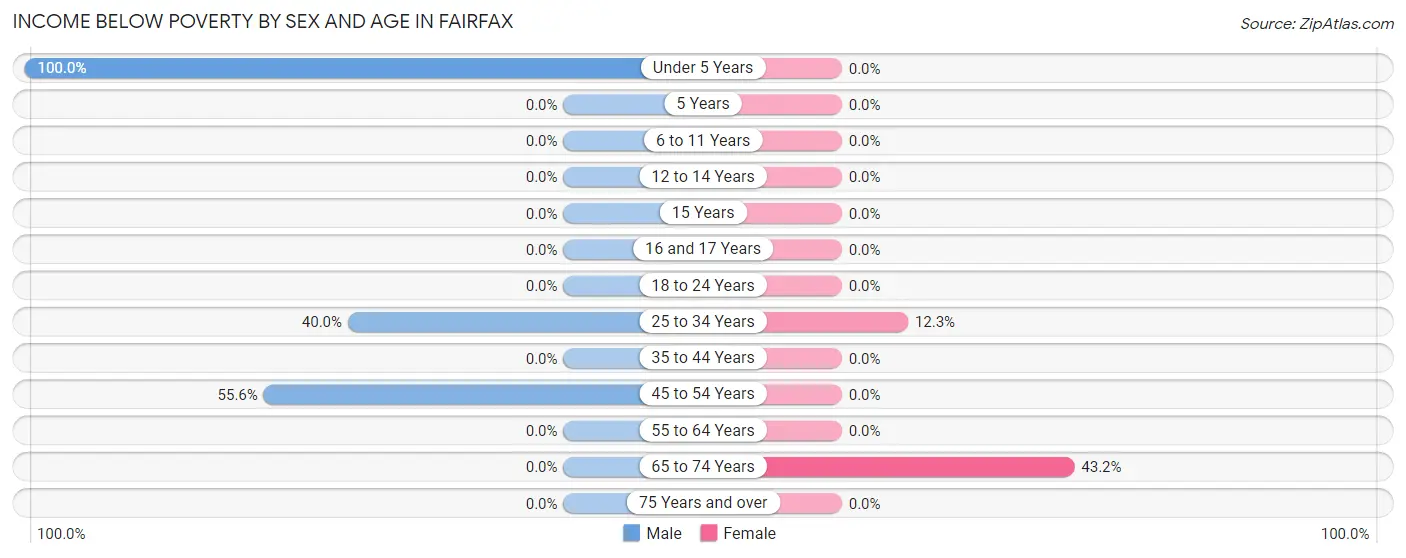
| Age Bracket | Male | Female |
| Under 5 Years | 21 (100.0%) | 0 (0.0%) |
| 5 Years | 0 (0.0%) | 0 (0.0%) |
| 6 to 11 Years | 0 (0.0%) | 0 (0.0%) |
| 12 to 14 Years | 0 (0.0%) | 0 (0.0%) |
| 15 Years | 0 (0.0%) | 0 (0.0%) |
| 16 and 17 Years | 0 (0.0%) | 0 (0.0%) |
| 18 to 24 Years | 0 (0.0%) | 0 (0.0%) |
| 25 to 34 Years | 28 (40.0%) | 21 (12.3%) |
| 35 to 44 Years | 0 (0.0%) | 0 (0.0%) |
| 45 to 54 Years | 74 (55.6%) | 0 (0.0%) |
| 55 to 64 Years | 0 (0.0%) | 0 (0.0%) |
| 65 to 74 Years | 0 (0.0%) | 60 (43.2%) |
| 75 Years and over | 0 (0.0%) | 0 (0.0%) |
| Total | 123 (26.3%) | 81 (19.7%) |
Income Above Poverty by Sex and Age in Fairfax
According to the poverty statistics in Fairfax, males aged 6 to 11 years and females aged under 5 years are the age groups that are most secure financially, with 100.0% of males and 100.0% of females in these age groups living above the poverty line.
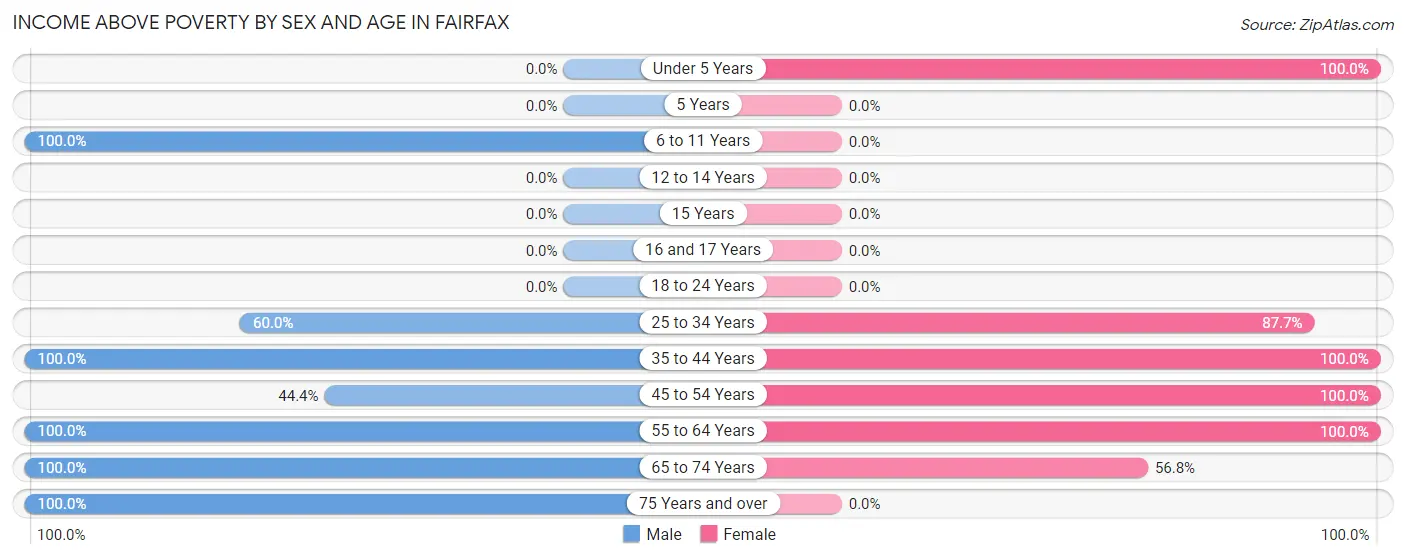
| Age Bracket | Male | Female |
| Under 5 Years | 0 (0.0%) | 23 (100.0%) |
| 5 Years | 0 (0.0%) | 0 (0.0%) |
| 6 to 11 Years | 35 (100.0%) | 0 (0.0%) |
| 12 to 14 Years | 0 (0.0%) | 0 (0.0%) |
| 15 Years | 0 (0.0%) | 0 (0.0%) |
| 16 and 17 Years | 0 (0.0%) | 0 (0.0%) |
| 18 to 24 Years | 0 (0.0%) | 0 (0.0%) |
| 25 to 34 Years | 42 (60.0%) | 150 (87.7%) |
| 35 to 44 Years | 81 (100.0%) | 30 (100.0%) |
| 45 to 54 Years | 59 (44.4%) | 26 (100.0%) |
| 55 to 64 Years | 86 (100.0%) | 23 (100.0%) |
| 65 to 74 Years | 28 (100.0%) | 79 (56.8%) |
| 75 Years and over | 14 (100.0%) | 0 (0.0%) |
| Total | 345 (73.7%) | 331 (80.3%) |
Income Below Poverty Among Married-Couple Families in Fairfax
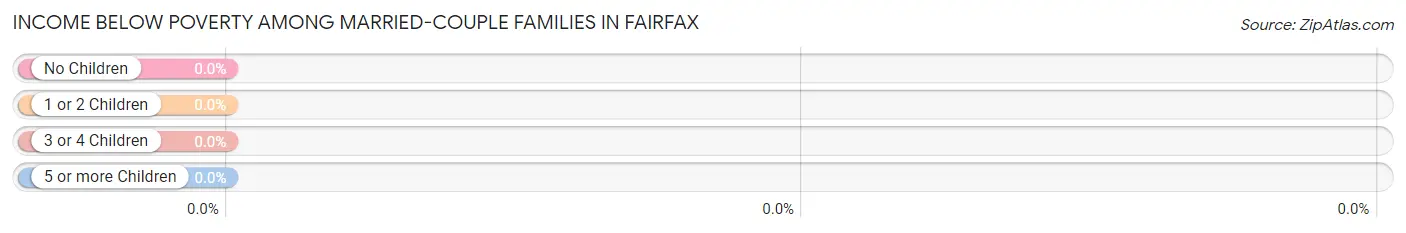
| Children | Above Poverty | Below Poverty |
| No Children | 249 (100.0%) | 0 (0.0%) |
| 1 or 2 Children | 34 (100.0%) | 0 (0.0%) |
| 3 or 4 Children | 0 (0.0%) | 0 (0.0%) |
| 5 or more Children | 0 (0.0%) | 0 (0.0%) |
| Total | 283 (100.0%) | 0 (0.0%) |
Income Below Poverty Among Single-Parent Households in Fairfax
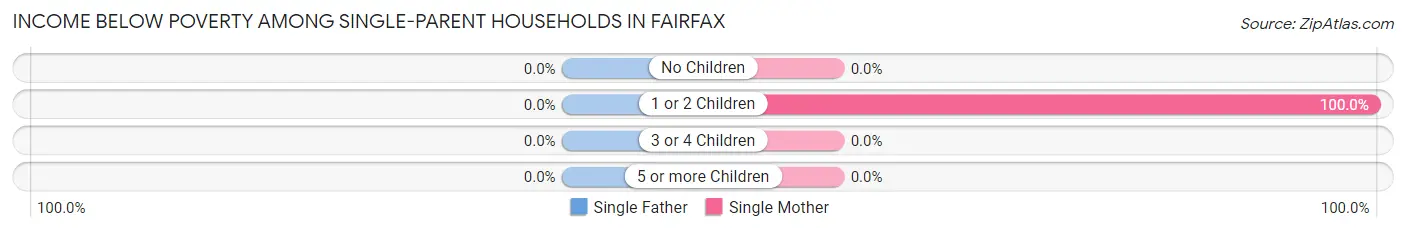
| Children | Single Father | Single Mother |
| No Children | 0 (0.0%) | 0 (0.0%) |
| 1 or 2 Children | 0 (0.0%) | 21 (100.0%) |
| 3 or 4 Children | 0 (0.0%) | 0 (0.0%) |
| 5 or more Children | 0 (0.0%) | 0 (0.0%) |
| Total | 0 (0.0%) | 21 (100.0%) |
Income Below Poverty Among Married-Couple vs Single-Parent Households in Fairfax
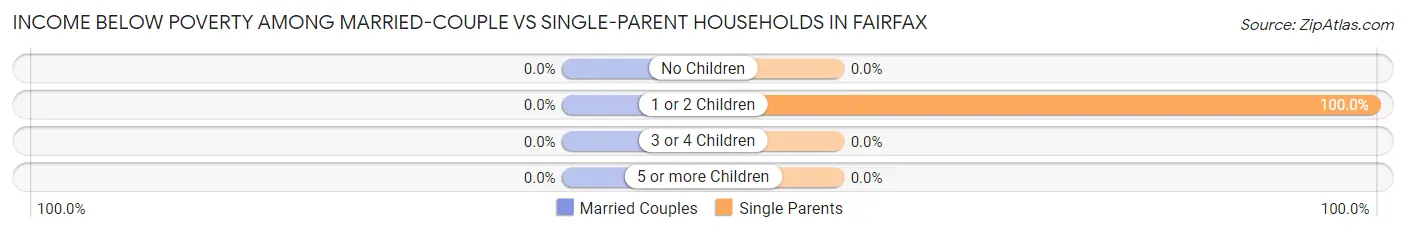
| Children | Married-Couple Families | Single-Parent Households |
| No Children | 0 (0.0%) | 0 (0.0%) |
| 1 or 2 Children | 0 (0.0%) | 21 (100.0%) |
| 3 or 4 Children | 0 (0.0%) | 0 (0.0%) |
| 5 or more Children | 0 (0.0%) | 0 (0.0%) |
| Total | 0 (0.0%) | 21 (100.0%) |
Race in Fairfax
The most populous races in Fairfax are , and White / Caucasian (880 | 100.0%).
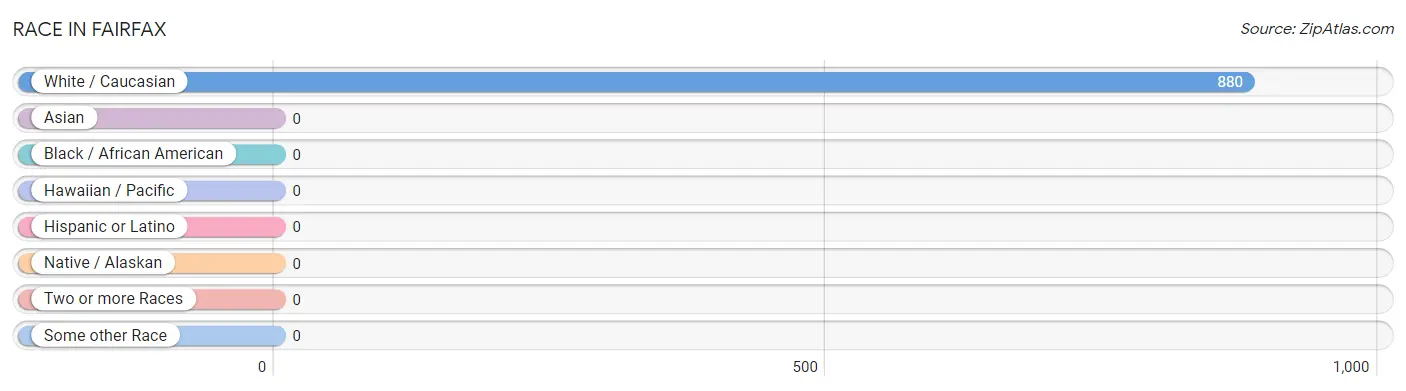
| Race | # Population | % Population |
| Asian | 0 | 0.0% |
| Black / African American | 0 | 0.0% |
| Hawaiian / Pacific | 0 | 0.0% |
| Hispanic or Latino | 0 | 0.0% |
| Native / Alaskan | 0 | 0.0% |
| White / Caucasian | 880 | 100.0% |
| Two or more Races | 0 | 0.0% |
| Some other Race | 0 | 0.0% |
| Total | 880 | 100.0% |
Ancestry in Fairfax
The most populous ancestries reported in Fairfax are American (194 | 22.1%), European (175 | 19.9%), English (123 | 14.0%), French Canadian (110 | 12.5%), and Irish (110 | 12.5%), together accounting for 80.9% of all Fairfax residents.
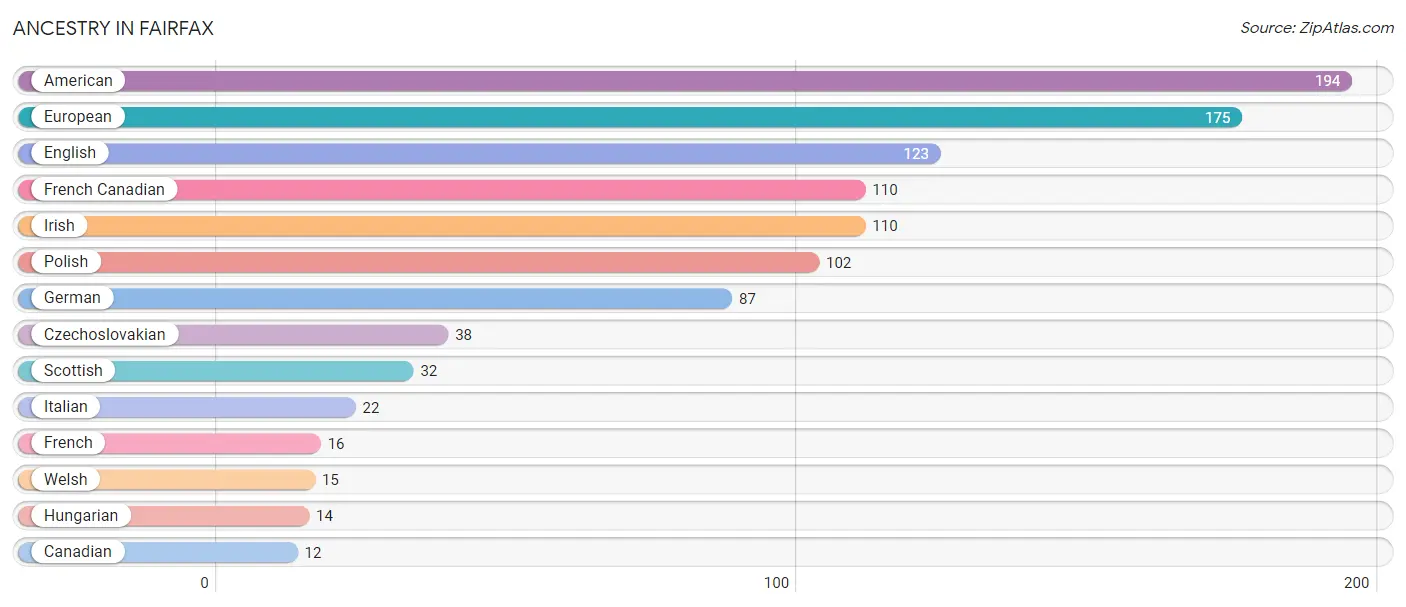
| Ancestry | # Population | % Population |
| American | 194 | 22.1% |
| Canadian | 12 | 1.4% |
| Czechoslovakian | 38 | 4.3% |
| English | 123 | 14.0% |
| European | 175 | 19.9% |
| French | 16 | 1.8% |
| French Canadian | 110 | 12.5% |
| German | 87 | 9.9% |
| Hungarian | 14 | 1.6% |
| Irish | 110 | 12.5% |
| Italian | 22 | 2.5% |
| Polish | 102 | 11.6% |
| Scottish | 32 | 3.6% |
| Welsh | 15 | 1.7% | View All 14 Rows |
Immigrants in Fairfax

| Immigration Origin | # Population | % Population | View All 0 Rows |
Sex and Age in Fairfax
Sex and Age in Fairfax
The most populous age groups in Fairfax are 50 to 54 Years (95 | 20.3%) for men and 30 to 34 Years (94 | 22.8%) for women.
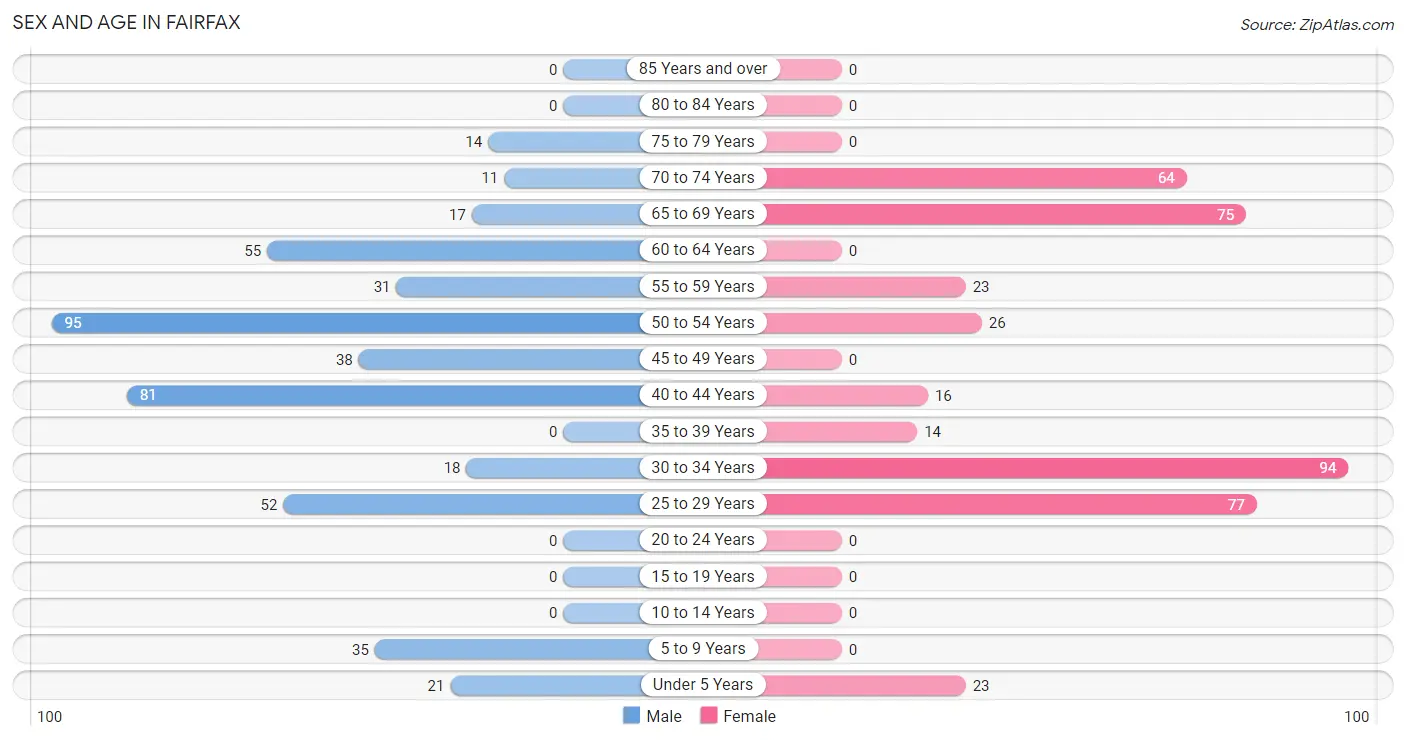
| Age Bracket | Male | Female |
| Under 5 Years | 21 (4.5%) | 23 (5.6%) |
| 5 to 9 Years | 35 (7.5%) | 0 (0.0%) |
| 10 to 14 Years | 0 (0.0%) | 0 (0.0%) |
| 15 to 19 Years | 0 (0.0%) | 0 (0.0%) |
| 20 to 24 Years | 0 (0.0%) | 0 (0.0%) |
| 25 to 29 Years | 52 (11.1%) | 77 (18.7%) |
| 30 to 34 Years | 18 (3.8%) | 94 (22.8%) |
| 35 to 39 Years | 0 (0.0%) | 14 (3.4%) |
| 40 to 44 Years | 81 (17.3%) | 16 (3.9%) |
| 45 to 49 Years | 38 (8.1%) | 0 (0.0%) |
| 50 to 54 Years | 95 (20.3%) | 26 (6.3%) |
| 55 to 59 Years | 31 (6.6%) | 23 (5.6%) |
| 60 to 64 Years | 55 (11.7%) | 0 (0.0%) |
| 65 to 69 Years | 17 (3.6%) | 75 (18.2%) |
| 70 to 74 Years | 11 (2.4%) | 64 (15.5%) |
| 75 to 79 Years | 14 (3.0%) | 0 (0.0%) |
| 80 to 84 Years | 0 (0.0%) | 0 (0.0%) |
| 85 Years and over | 0 (0.0%) | 0 (0.0%) |
| Total | 468 (100.0%) | 412 (100.0%) |
Families and Households in Fairfax
Median Family Size in Fairfax
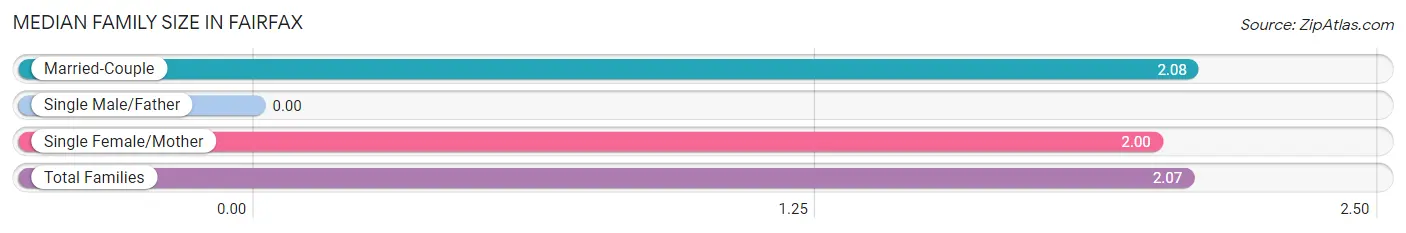
| Family Type | # Families | Family Size |
| Married-Couple | 283 (93.1%) | 2.08 |
| Single Male/Father | 0 (0.0%) | - |
| Single Female/Mother | 21 (6.9%) | 2.00 |
| Total Families | 304 (100.0%) | 2.07 |
Median Household Size in Fairfax
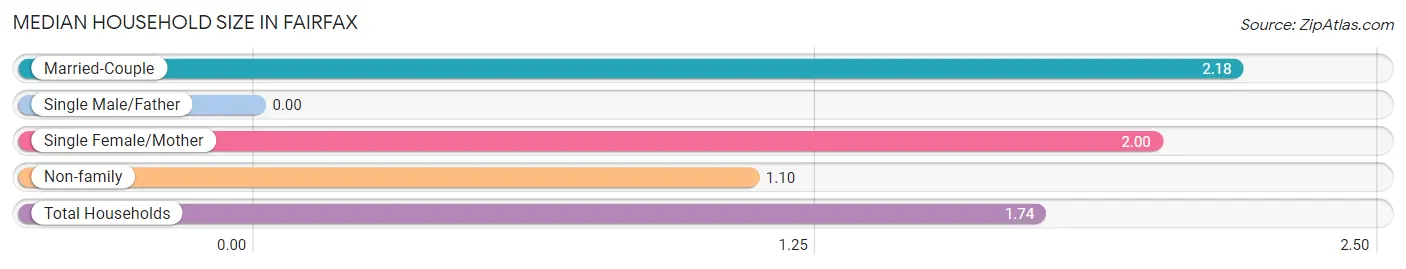
| Household Type | # Households | Household Size |
| Married-Couple | 283 (56.0%) | 2.18 |
| Single Male/Father | 0 (0.0%) | - |
| Single Female/Mother | 21 (4.2%) | 2.00 |
| Non-family | 201 (39.8%) | 1.10 |
| Total Households | 505 (100.0%) | 1.74 |
Household Size by Marriage Status in Fairfax
Out of a total of 505 households in Fairfax, 304 (60.2%) are family households, while 201 (39.8%) are nonfamily households. The most numerous type of family households are 2-person households, comprising 232, and the most common type of nonfamily households are 1-person households, comprising 185.
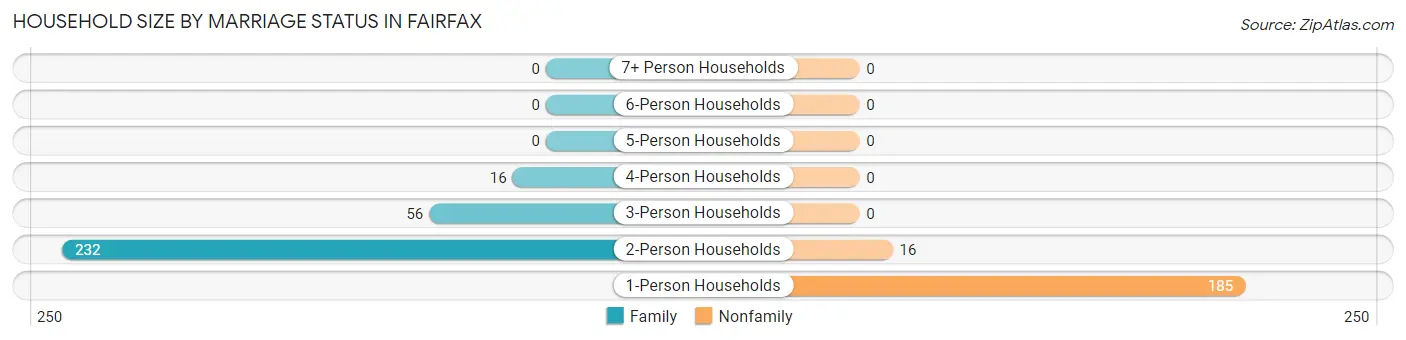
| Household Size | Family Households | Nonfamily Households |
| 1-Person Households | - | 185 (36.6%) |
| 2-Person Households | 232 (45.9%) | 16 (3.2%) |
| 3-Person Households | 56 (11.1%) | 0 (0.0%) |
| 4-Person Households | 16 (3.2%) | 0 (0.0%) |
| 5-Person Households | 0 (0.0%) | 0 (0.0%) |
| 6-Person Households | 0 (0.0%) | 0 (0.0%) |
| 7+ Person Households | 0 (0.0%) | 0 (0.0%) |
| Total | 304 (60.2%) | 201 (39.8%) |
Female Fertility in Fairfax
Fertility by Age in Fairfax
| Age Bracket | Women with Births | Births / 1,000 Women |
| 15 to 19 years | 0 (0.0%) | 0.0 |
| 20 to 34 years | 0 (0.0%) | 0.0 |
| 35 to 50 years | 0 (0.0%) | 0.0 |
| Total | 0 (0.0%) | 0.0 |
Fertility by Age by Marriage Status in Fairfax
| Age Bracket | Married | Unmarried |
| 15 to 19 years | 0 (0.0%) | 0 (0.0%) |
| 20 to 34 years | 0 (0.0%) | 0 (0.0%) |
| 35 to 50 years | 0 (0.0%) | 0 (0.0%) |
| Total | 0 (0.0%) | 0 (0.0%) |
Fertility by Education in Fairfax
| Educational Attainment | Women with Births | Births / 1,000 Women |
| Less than High School | 0 (0.0%) | 0.0 |
| High School Diploma | 0 (0.0%) | 0.0 |
| College or Associate's Degree | 0 (0.0%) | 0.0 |
| Bachelor's Degree | 0 (0.0%) | 0.0 |
| Graduate Degree | 0 (0.0%) | 0.0 |
| Total | 0 (0.0%) | 0.0 |
Fertility by Education by Marriage Status in Fairfax
| Educational Attainment | Married | Unmarried |
| Less than High School | 0 (0.0%) | 0 (0.0%) |
| High School Diploma | 0 (0.0%) | 0 (0.0%) |
| College or Associate's Degree | 0 (0.0%) | 0 (0.0%) |
| Bachelor's Degree | 0 (0.0%) | 0 (0.0%) |
| Graduate Degree | 0 (0.0%) | 0 (0.0%) |
| Total | 0 (0.0%) | 0 (0.0%) |
Employment Characteristics in Fairfax
Employment by Class of Employer in Fairfax
Among the 409 employed individuals in Fairfax, private company employees (350 | 85.6%), not-for-profit organizations (29 | 7.1%), and federal government employees (16 | 3.9%) make up the most common classes of employment.
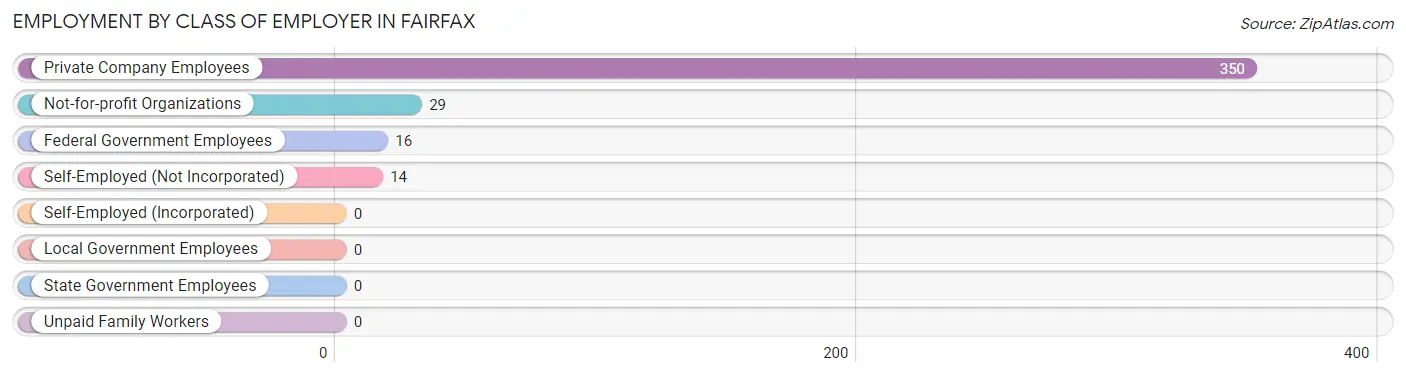
| Employer Class | # Employees | % Employees |
| Private Company Employees | 350 | 85.6% |
| Self-Employed (Incorporated) | 0 | 0.0% |
| Self-Employed (Not Incorporated) | 14 | 3.4% |
| Not-for-profit Organizations | 29 | 7.1% |
| Local Government Employees | 0 | 0.0% |
| State Government Employees | 0 | 0.0% |
| Federal Government Employees | 16 | 3.9% |
| Unpaid Family Workers | 0 | 0.0% |
| Total | 409 | 100.0% |
Employment Status by Age in Fairfax
According to the labor force statistics for Fairfax, out of the total population over 16 years of age (801), 59.1% or 473 individuals are in the labor force, with 13.5% or 64 of them unemployed. The age group with the highest labor force participation rate is 25 to 29 years, with 100.0% or 129 individuals in the labor force. Within the labor force, the 65 to 74 years age range has the highest percentage of unemployed individuals, with 34.0% or 18 of them being unemployed.
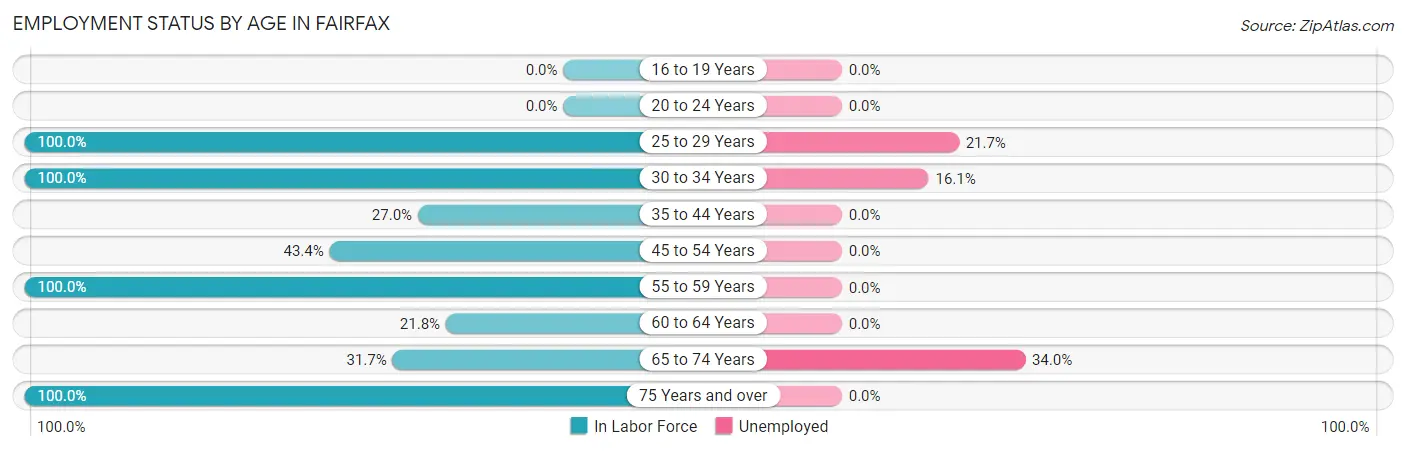
| Age Bracket | In Labor Force | Unemployed |
| 16 to 19 Years | 0 (0.0%) | 0 (0.0%) |
| 20 to 24 Years | 0 (0.0%) | 0 (0.0%) |
| 25 to 29 Years | 129 (100.0%) | 28 (21.7%) |
| 30 to 34 Years | 112 (100.0%) | 18 (16.1%) |
| 35 to 44 Years | 30 (27.0%) | 0 (0.0%) |
| 45 to 54 Years | 69 (43.4%) | 0 (0.0%) |
| 55 to 59 Years | 54 (100.0%) | 0 (0.0%) |
| 60 to 64 Years | 12 (21.8%) | 0 (0.0%) |
| 65 to 74 Years | 53 (31.7%) | 18 (34.0%) |
| 75 Years and over | 14 (100.0%) | 0 (0.0%) |
| Total | 473 (59.1%) | 64 (13.5%) |
Employment Status by Educational Attainment in Fairfax
According to labor force statistics for Fairfax, 65.5% of individuals (406) out of the total population between 25 and 64 years of age (620) are in the labor force, with 11.3% or 46 of them being unemployed. The group with the highest labor force participation rate are those with the educational attainment of less than high school, with 100.0% or 21 individuals in the labor force. Within the labor force, individuals with college / associate degree education have the highest percentage of unemployment, with 18.2% or 18 of them being unemployed.
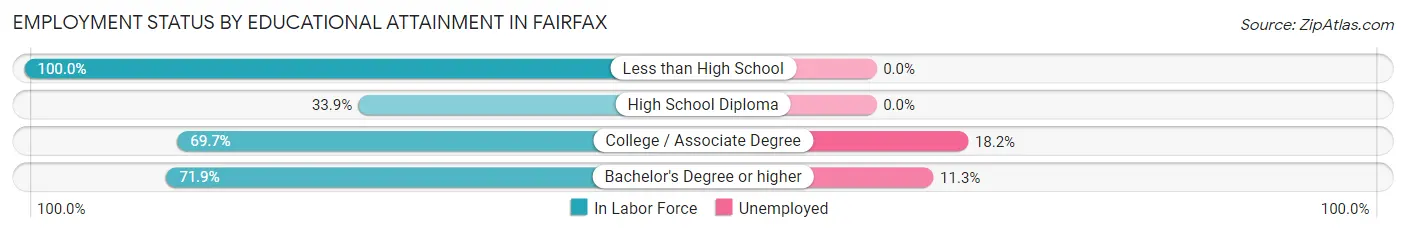
| Educational Attainment | In Labor Force | Unemployed |
| Less than High School | 21 (100.0%) | 0 (0.0%) |
| High School Diploma | 38 (33.9%) | 0 (0.0%) |
| College / Associate Degree | 99 (69.7%) | 26 (18.2%) |
| Bachelor's Degree or higher | 248 (71.9%) | 39 (11.3%) |
| Total | 406 (65.5%) | 70 (11.3%) |
Employment Occupations by Sex in Fairfax
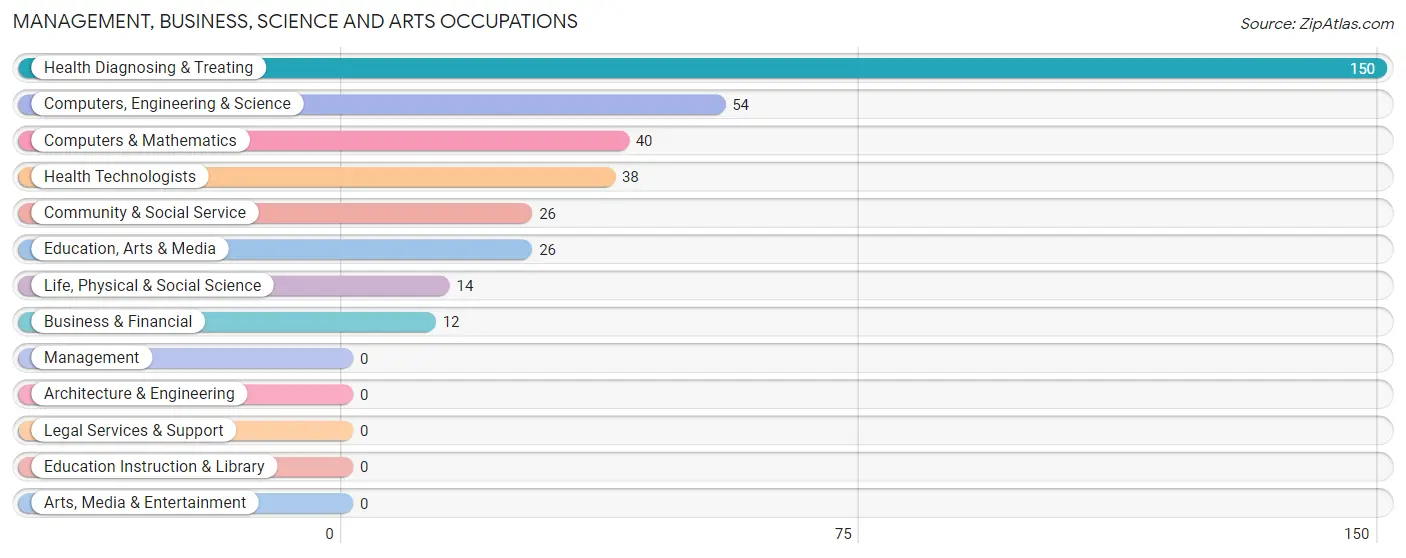
Management, Business, Science and Arts Occupations
The most common Management, Business, Science and Arts occupations in Fairfax are Health Diagnosing & Treating (150 | 36.7%), Computers, Engineering & Science (54 | 13.2%), Computers & Mathematics (40 | 9.8%), Health Technologists (38 | 9.3%), and Community & Social Service (26 | 6.4%).
Management, Business, Science and Arts Occupations by Sex
Within the Management, Business, Science and Arts occupations in Fairfax, the most male-oriented occupations are Business & Financial (100.0%), Computers & Mathematics (60.0%), and Computers, Engineering & Science (44.4%), while the most female-oriented occupations are Life, Physical & Social Science (100.0%), Community & Social Service (100.0%), and Education, Arts & Media (100.0%).
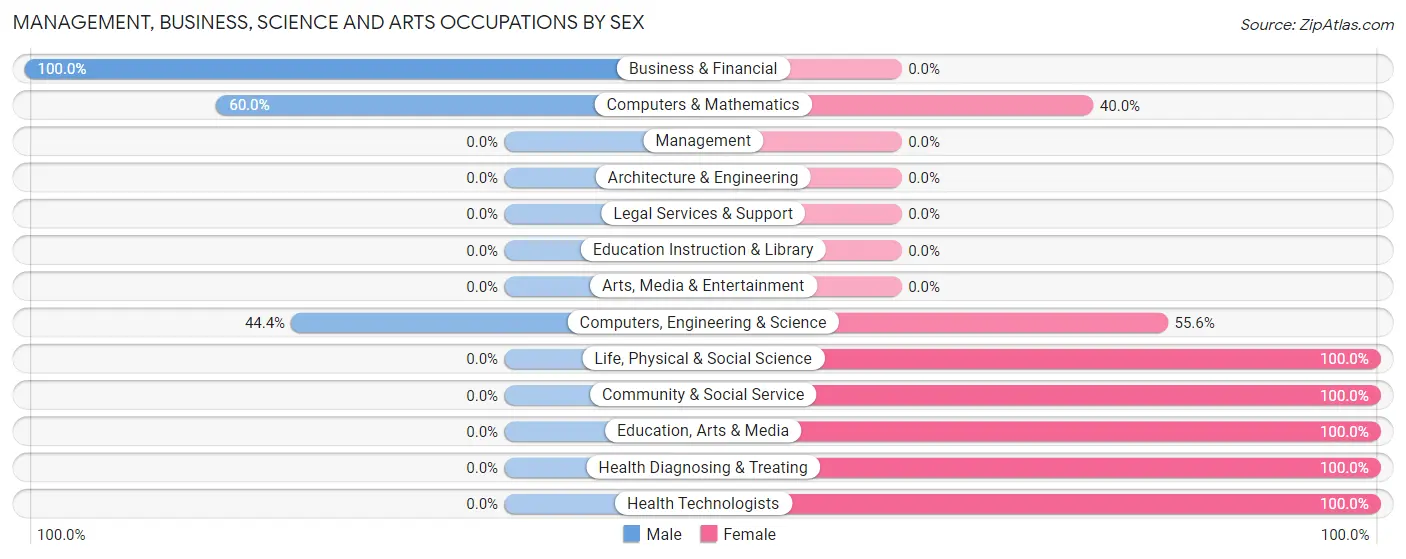
| Occupation | Male | Female |
| Management | 0 (0.0%) | 0 (0.0%) |
| Business & Financial | 12 (100.0%) | 0 (0.0%) |
| Computers, Engineering & Science | 24 (44.4%) | 30 (55.6%) |
| Computers & Mathematics | 24 (60.0%) | 16 (40.0%) |
| Architecture & Engineering | 0 (0.0%) | 0 (0.0%) |
| Life, Physical & Social Science | 0 (0.0%) | 14 (100.0%) |
| Community & Social Service | 0 (0.0%) | 26 (100.0%) |
| Education, Arts & Media | 0 (0.0%) | 26 (100.0%) |
| Legal Services & Support | 0 (0.0%) | 0 (0.0%) |
| Education Instruction & Library | 0 (0.0%) | 0 (0.0%) |
| Arts, Media & Entertainment | 0 (0.0%) | 0 (0.0%) |
| Health Diagnosing & Treating | 0 (0.0%) | 150 (100.0%) |
| Health Technologists | 0 (0.0%) | 38 (100.0%) |
| Total (Category) | 36 (14.9%) | 206 (85.1%) |
| Total (Overall) | 141 (34.5%) | 268 (65.5%) |
Services Occupations
Services Occupations by Sex
| Occupation | Male | Female |
| Healthcare Support | 0 (0.0%) | 0 (0.0%) |
| Security & Protection | 0 (0.0%) | 0 (0.0%) |
| Firefighting & Prevention | 0 (0.0%) | 0 (0.0%) |
| Law Enforcement | 0 (0.0%) | 0 (0.0%) |
| Food Preparation & Serving | 0 (0.0%) | 0 (0.0%) |
| Cleaning & Maintenance | 0 (0.0%) | 0 (0.0%) |
| Personal Care & Service | 0 (0.0%) | 0 (0.0%) |
| Total (Category) | 0 (0.0%) | 0 (0.0%) |
| Total (Overall) | 141 (34.5%) | 268 (65.5%) |
Sales and Office Occupations
The most common Sales and Office occupations in Fairfax are Office & Administration (45 | 11.0%), and Sales & Related (35 | 8.6%).
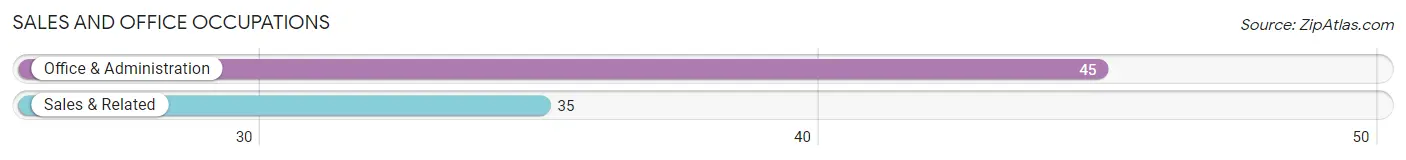
Sales and Office Occupations by Sex
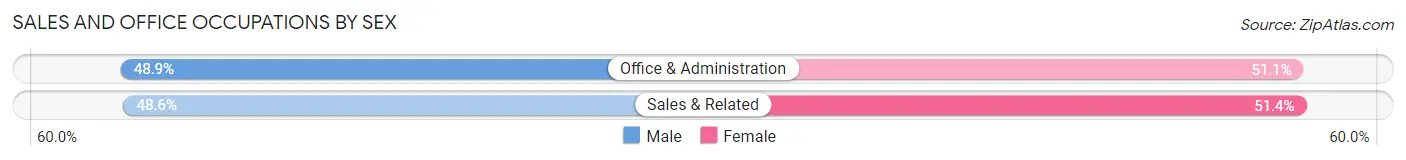
| Occupation | Male | Female |
| Sales & Related | 17 (48.6%) | 18 (51.4%) |
| Office & Administration | 22 (48.9%) | 23 (51.1%) |
| Total (Category) | 39 (48.7%) | 41 (51.2%) |
| Total (Overall) | 141 (34.5%) | 268 (65.5%) |
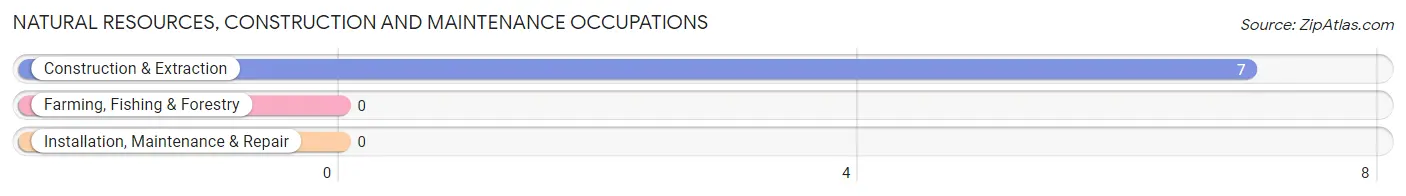
Natural Resources, Construction and Maintenance Occupations
The most common Natural Resources, Construction and Maintenance occupations in Fairfax are , and Construction & Extraction (7 | 1.7%).
Natural Resources, Construction and Maintenance Occupations by Sex
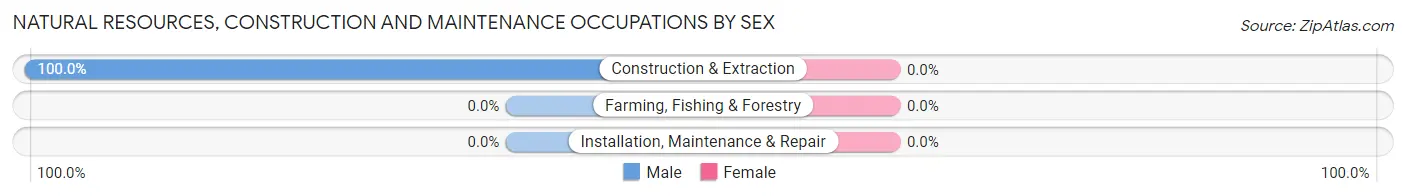
| Occupation | Male | Female |
| Farming, Fishing & Forestry | 0 (0.0%) | 0 (0.0%) |
| Construction & Extraction | 7 (100.0%) | 0 (0.0%) |
| Installation, Maintenance & Repair | 0 (0.0%) | 0 (0.0%) |
| Total (Category) | 7 (100.0%) | 0 (0.0%) |
| Total (Overall) | 141 (34.5%) | 268 (65.5%) |
Production, Transportation and Moving Occupations
The most common Production, Transportation and Moving occupations in Fairfax are Transportation (35 | 8.6%), Production (24 | 5.9%), and Material Moving (21 | 5.1%).
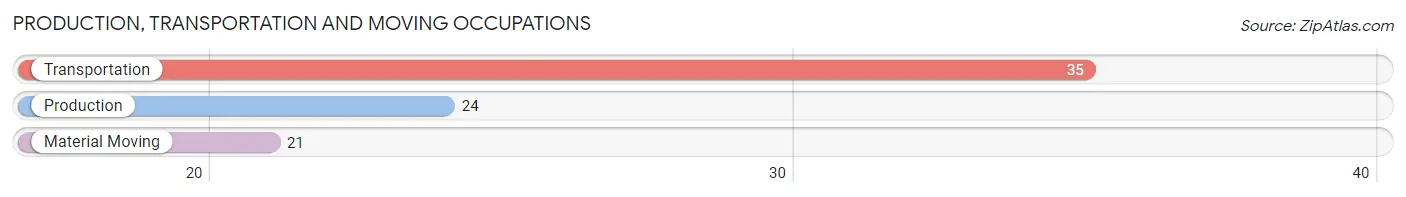
Production, Transportation and Moving Occupations by Sex
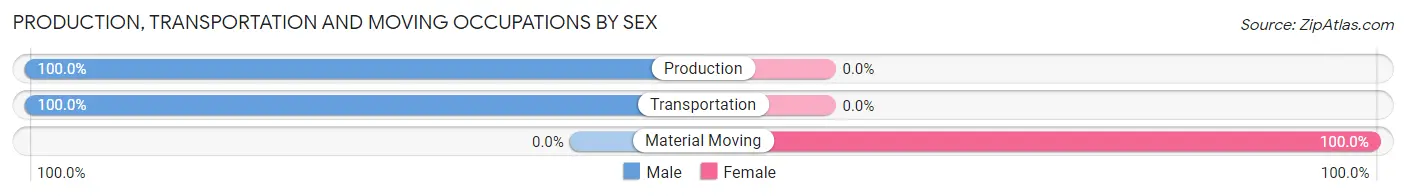
| Occupation | Male | Female |
| Production | 24 (100.0%) | 0 (0.0%) |
| Transportation | 35 (100.0%) | 0 (0.0%) |
| Material Moving | 0 (0.0%) | 21 (100.0%) |
| Total (Category) | 59 (73.8%) | 21 (26.3%) |
| Total (Overall) | 141 (34.5%) | 268 (65.5%) |
Employment Industries by Sex in Fairfax
Employment Industries in Fairfax
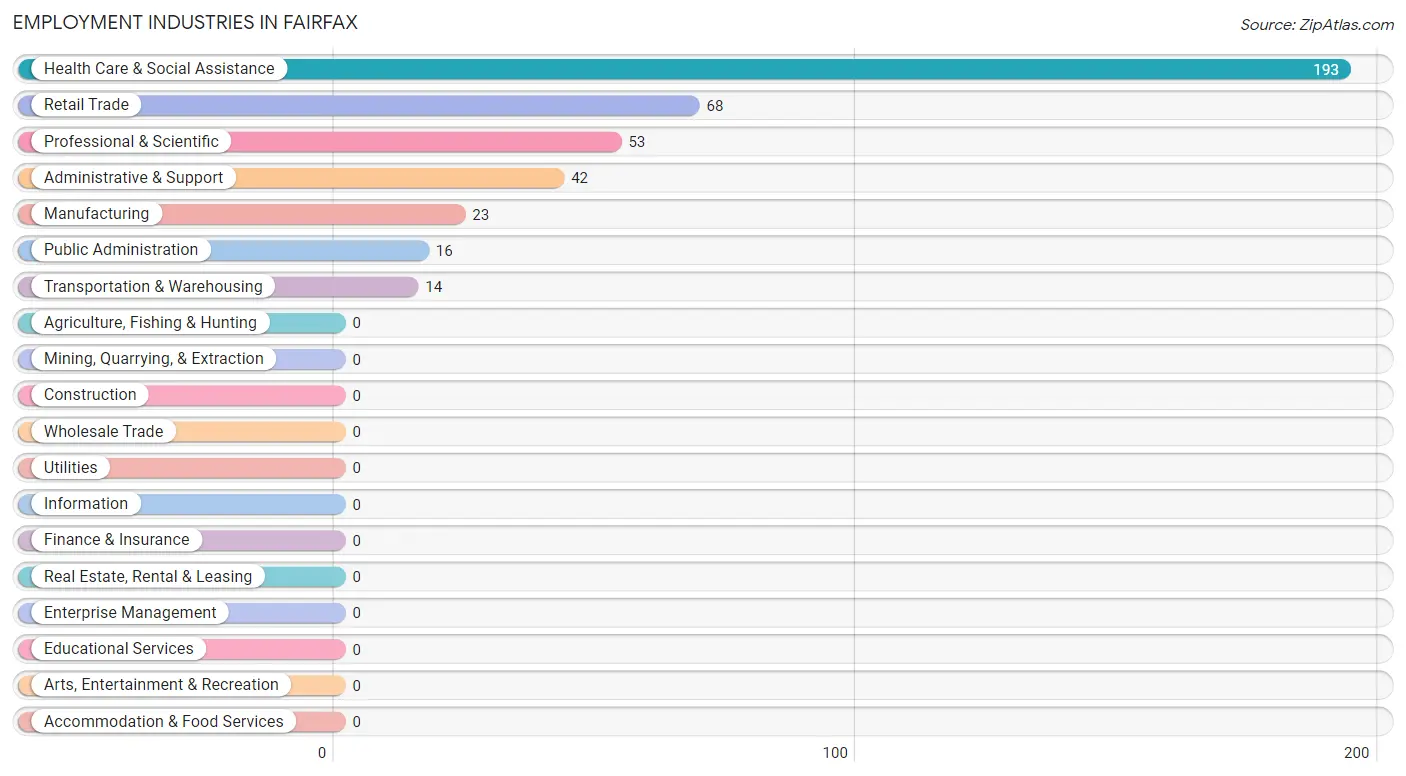
The major employment industries in Fairfax include Health Care & Social Assistance (193 | 47.2%), Retail Trade (68 | 16.6%), Professional & Scientific (53 | 13.0%), Administrative & Support (42 | 10.3%), and Manufacturing (23 | 5.6%).
Employment Industries by Sex in Fairfax
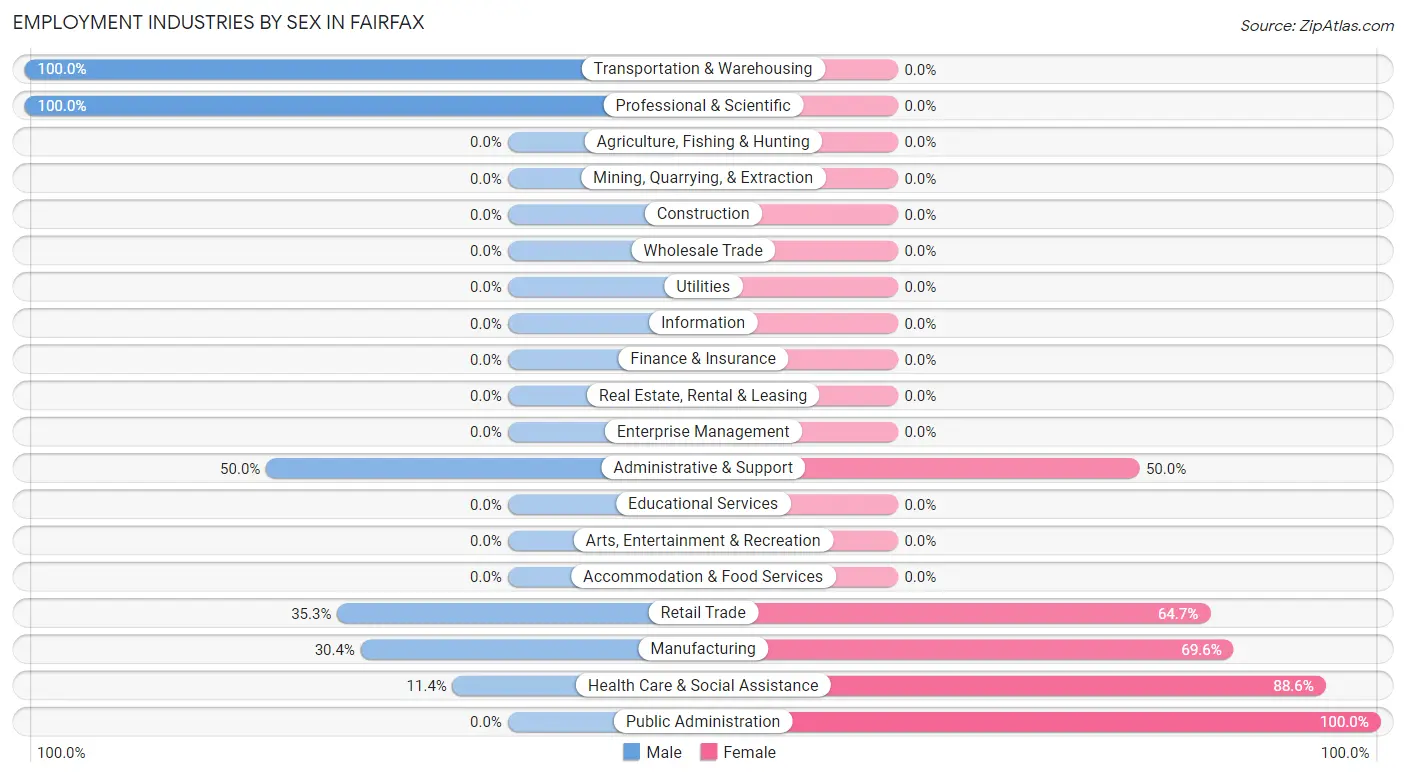
The Fairfax industries that see more men than women are Transportation & Warehousing (100.0%), Professional & Scientific (100.0%), and Administrative & Support (50.0%), whereas the industries that tend to have a higher number of women are Public Administration (100.0%), Health Care & Social Assistance (88.6%), and Manufacturing (69.6%).
| Industry | Male | Female |
| Agriculture, Fishing & Hunting | 0 (0.0%) | 0 (0.0%) |
| Mining, Quarrying, & Extraction | 0 (0.0%) | 0 (0.0%) |
| Construction | 0 (0.0%) | 0 (0.0%) |
| Manufacturing | 7 (30.4%) | 16 (69.6%) |
| Wholesale Trade | 0 (0.0%) | 0 (0.0%) |
| Retail Trade | 24 (35.3%) | 44 (64.7%) |
| Transportation & Warehousing | 14 (100.0%) | 0 (0.0%) |
| Utilities | 0 (0.0%) | 0 (0.0%) |
| Information | 0 (0.0%) | 0 (0.0%) |
| Finance & Insurance | 0 (0.0%) | 0 (0.0%) |
| Real Estate, Rental & Leasing | 0 (0.0%) | 0 (0.0%) |
| Professional & Scientific | 53 (100.0%) | 0 (0.0%) |
| Enterprise Management | 0 (0.0%) | 0 (0.0%) |
| Administrative & Support | 21 (50.0%) | 21 (50.0%) |
| Educational Services | 0 (0.0%) | 0 (0.0%) |
| Health Care & Social Assistance | 22 (11.4%) | 171 (88.6%) |
| Arts, Entertainment & Recreation | 0 (0.0%) | 0 (0.0%) |
| Accommodation & Food Services | 0 (0.0%) | 0 (0.0%) |
| Public Administration | 0 (0.0%) | 16 (100.0%) |
| Total | 141 (34.5%) | 268 (65.5%) |
Education in Fairfax
School Enrollment in Fairfax
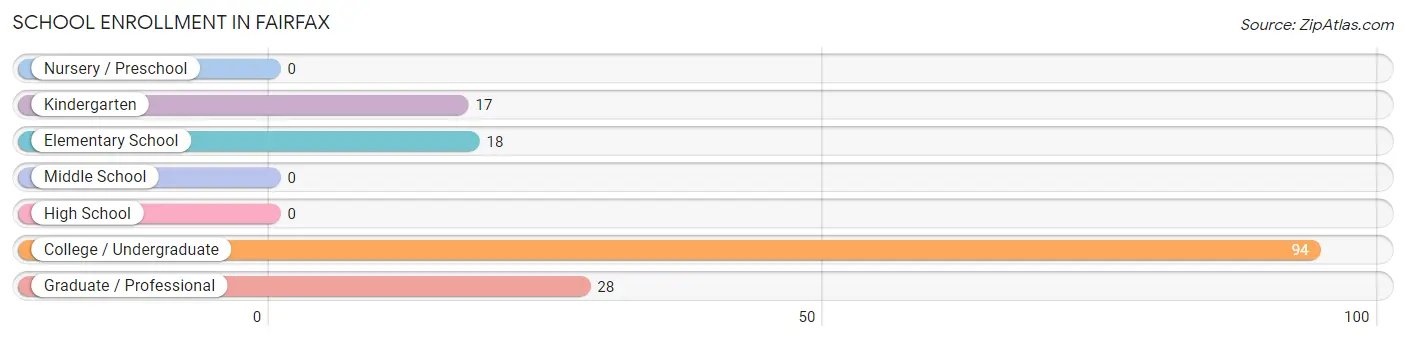
The most common levels of schooling among the 157 students in Fairfax are college / undergraduate (94 | 59.9%), graduate / professional (28 | 17.8%), and elementary school (18 | 11.5%).
| School Level | # Students | % Students |
| Nursery / Preschool | 0 | 0.0% |
| Kindergarten | 17 | 10.8% |
| Elementary School | 18 | 11.5% |
| Middle School | 0 | 0.0% |
| High School | 0 | 0.0% |
| College / Undergraduate | 94 | 59.9% |
| Graduate / Professional | 28 | 17.8% |
| Total | 157 | 100.0% |
School Enrollment by Age by Funding Source in Fairfax
Out of a total of 157 students who are enrolled in schools in Fairfax, 28 (17.8%) attend a private institution, while the remaining 129 (82.2%) are enrolled in public schools. The age group of 25 to 34 year olds has the highest likelihood of being enrolled in private schools, with 28 (23.0% in the age bracket) enrolled. Conversely, the age group of 5 to 9 year old has the lowest likelihood of being enrolled in a private school, with 35 (100.0% in the age bracket) attending a public institution.
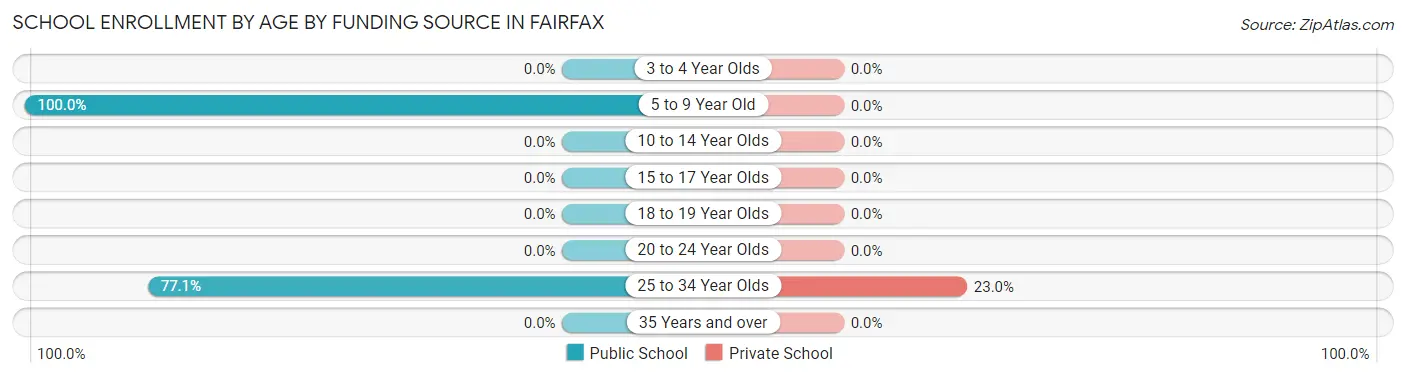
| Age Bracket | Public School | Private School |
| 3 to 4 Year Olds | 0 (0.0%) | 0 (0.0%) |
| 5 to 9 Year Old | 35 (100.0%) | 0 (0.0%) |
| 10 to 14 Year Olds | 0 (0.0%) | 0 (0.0%) |
| 15 to 17 Year Olds | 0 (0.0%) | 0 (0.0%) |
| 18 to 19 Year Olds | 0 (0.0%) | 0 (0.0%) |
| 20 to 24 Year Olds | 0 (0.0%) | 0 (0.0%) |
| 25 to 34 Year Olds | 94 (77.0%) | 28 (23.0%) |
| 35 Years and over | 0 (0.0%) | 0 (0.0%) |
| Total | 129 (82.2%) | 28 (17.8%) |
Educational Attainment by Field of Study in Fairfax
Psychology (117 | 21.6%), literature & languages (94 | 17.3%), visual & performing arts (93 | 17.2%), bio, nature & agricultural (66 | 12.2%), and liberal arts & history (54 | 10.0%) are the most common fields of study among 542 individuals in Fairfax who have obtained a bachelor's degree or higher.
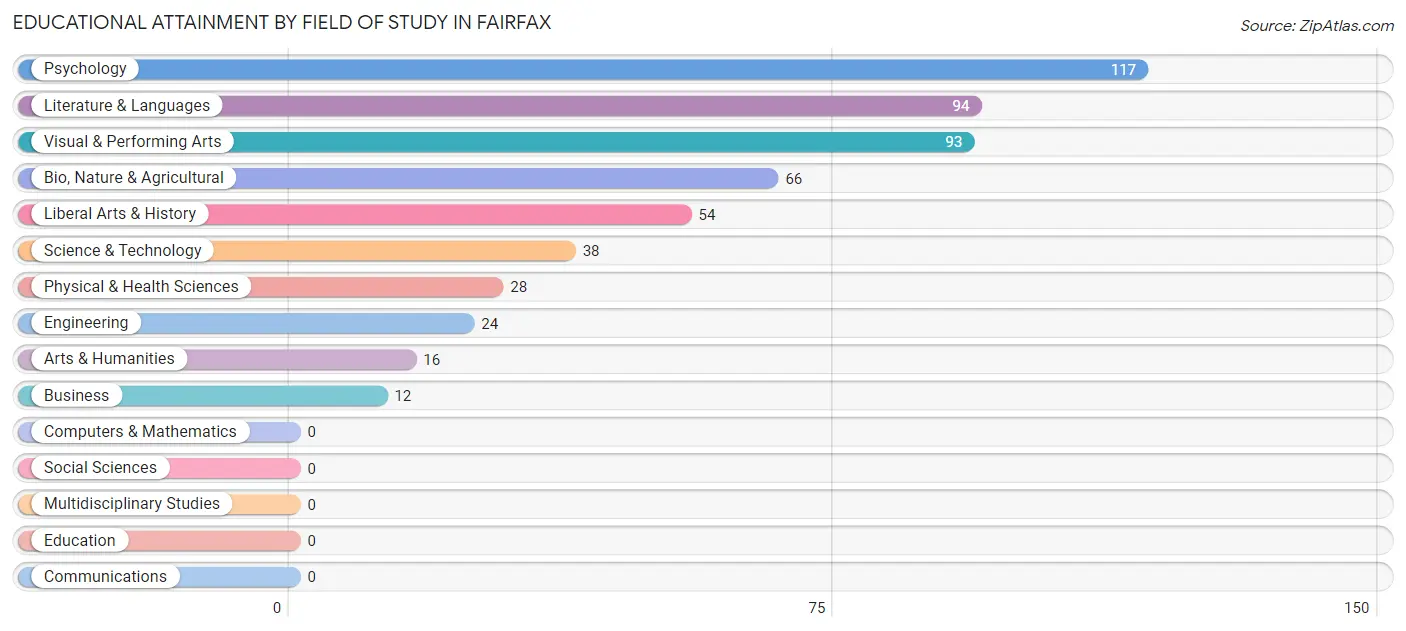
| Field of Study | # Graduates | % Graduates |
| Computers & Mathematics | 0 | 0.0% |
| Bio, Nature & Agricultural | 66 | 12.2% |
| Physical & Health Sciences | 28 | 5.2% |
| Psychology | 117 | 21.6% |
| Social Sciences | 0 | 0.0% |
| Engineering | 24 | 4.4% |
| Multidisciplinary Studies | 0 | 0.0% |
| Science & Technology | 38 | 7.0% |
| Business | 12 | 2.2% |
| Education | 0 | 0.0% |
| Literature & Languages | 94 | 17.3% |
| Liberal Arts & History | 54 | 10.0% |
| Visual & Performing Arts | 93 | 17.2% |
| Communications | 0 | 0.0% |
| Arts & Humanities | 16 | 2.9% |
| Total | 542 | 100.0% |
Transportation & Commute in Fairfax
Vehicle Availability by Sex in Fairfax
The most prevalent vehicle ownership categories in Fairfax are males with 2 vehicles (105, accounting for 74.5%) and females with 2 vehicles (209, making up 39.2%).
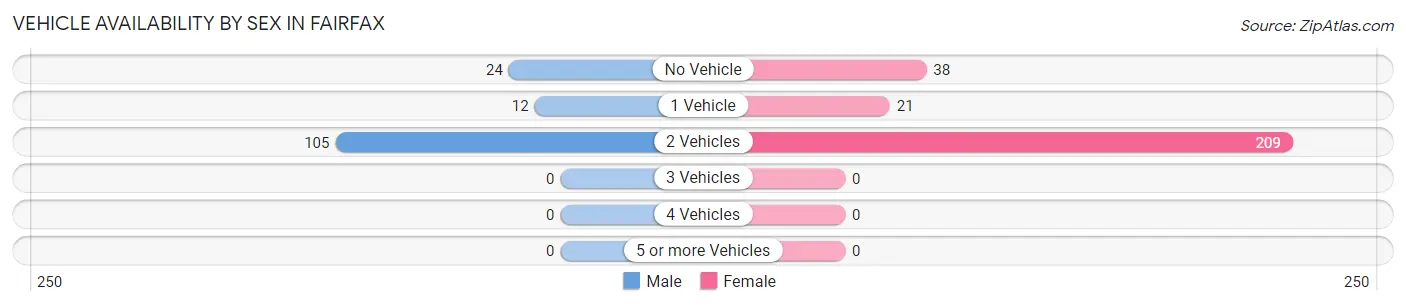
| Vehicles Available | Male | Female |
| No Vehicle | 24 (17.0%) | 38 (14.2%) |
| 1 Vehicle | 12 (8.5%) | 21 (7.8%) |
| 2 Vehicles | 105 (74.5%) | 209 (78.0%) |
| 3 Vehicles | 0 (0.0%) | 0 (0.0%) |
| 4 Vehicles | 0 (0.0%) | 0 (0.0%) |
| 5 or more Vehicles | 0 (0.0%) | 0 (0.0%) |
| Total | 141 (100.0%) | 268 (100.0%) |
Commute Time in Fairfax
The most frequently occuring commute durations in Fairfax are 30 to 34 minutes (132 commuters, 38.7%), 25 to 29 minutes (94 commuters, 27.6%), and 90 or more minutes (26 commuters, 7.6%).
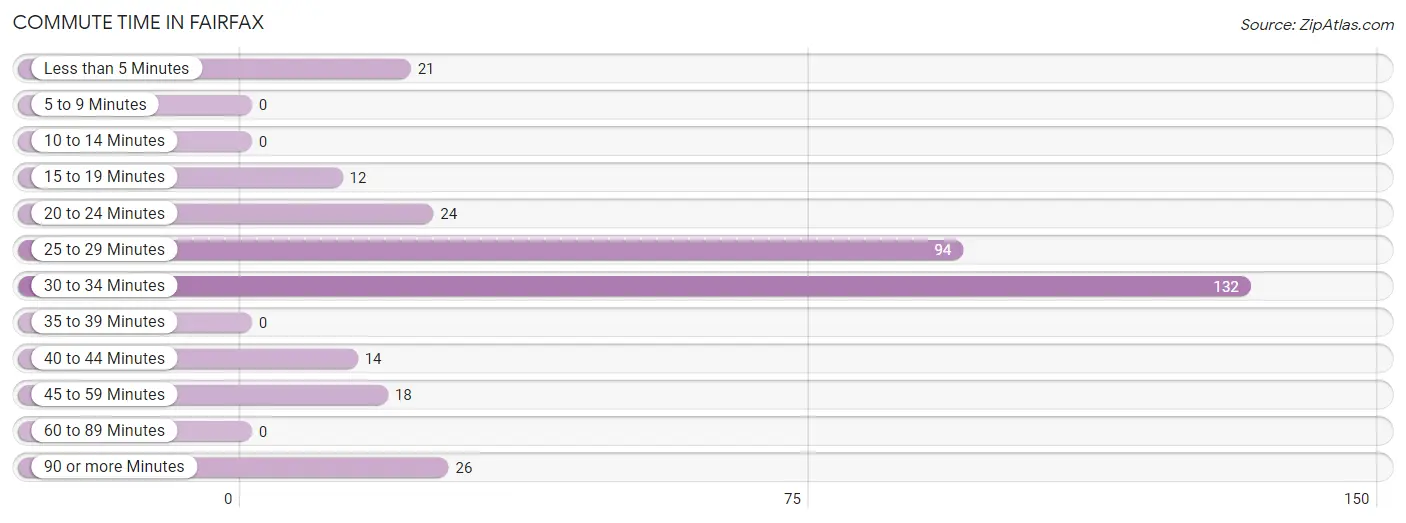
| Commute Time | # Commuters | % Commuters |
| Less than 5 Minutes | 21 | 6.2% |
| 5 to 9 Minutes | 0 | 0.0% |
| 10 to 14 Minutes | 0 | 0.0% |
| 15 to 19 Minutes | 12 | 3.5% |
| 20 to 24 Minutes | 24 | 7.0% |
| 25 to 29 Minutes | 94 | 27.6% |
| 30 to 34 Minutes | 132 | 38.7% |
| 35 to 39 Minutes | 0 | 0.0% |
| 40 to 44 Minutes | 14 | 4.1% |
| 45 to 59 Minutes | 18 | 5.3% |
| 60 to 89 Minutes | 0 | 0.0% |
| 90 or more Minutes | 26 | 7.6% |
Commute Time by Sex in Fairfax
The most common commute times in Fairfax are 30 to 34 minutes (55 commuters, 46.2%) for males and 25 to 29 minutes (94 commuters, 42.3%) for females.
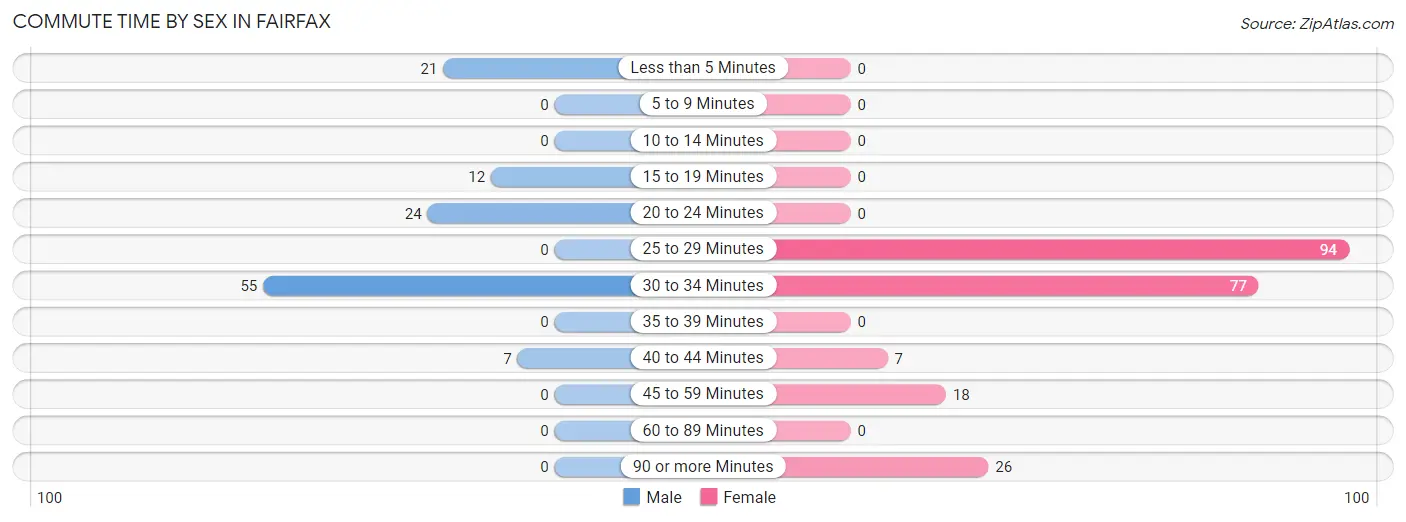
| Commute Time | Male | Female |
| Less than 5 Minutes | 21 (17.6%) | 0 (0.0%) |
| 5 to 9 Minutes | 0 (0.0%) | 0 (0.0%) |
| 10 to 14 Minutes | 0 (0.0%) | 0 (0.0%) |
| 15 to 19 Minutes | 12 (10.1%) | 0 (0.0%) |
| 20 to 24 Minutes | 24 (20.2%) | 0 (0.0%) |
| 25 to 29 Minutes | 0 (0.0%) | 94 (42.3%) |
| 30 to 34 Minutes | 55 (46.2%) | 77 (34.7%) |
| 35 to 39 Minutes | 0 (0.0%) | 0 (0.0%) |
| 40 to 44 Minutes | 7 (5.9%) | 7 (3.2%) |
| 45 to 59 Minutes | 0 (0.0%) | 18 (8.1%) |
| 60 to 89 Minutes | 0 (0.0%) | 0 (0.0%) |
| 90 or more Minutes | 0 (0.0%) | 26 (11.7%) |
Time of Departure to Work by Sex in Fairfax
The most frequent times of departure to work in Fairfax are 8:00 AM to 8:29 AM (36, 30.2%) for males and 12:00 PM to 3:59 PM (94, 42.3%) for females.
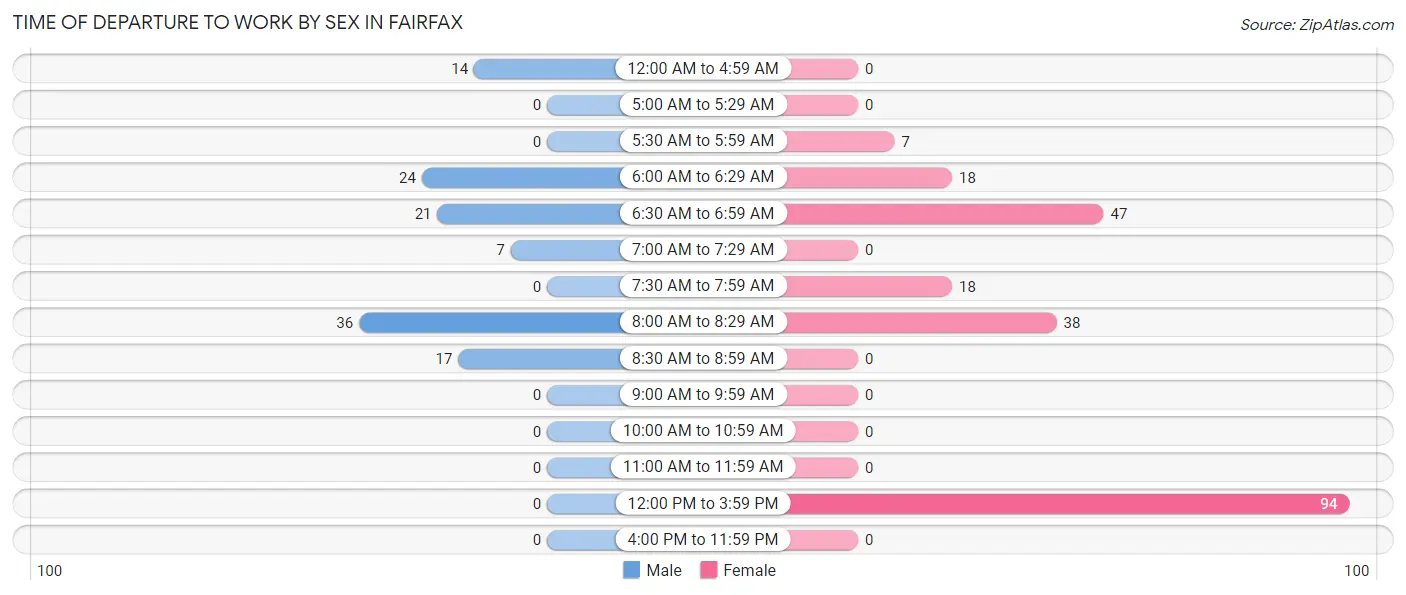
| Time of Departure | Male | Female |
| 12:00 AM to 4:59 AM | 14 (11.8%) | 0 (0.0%) |
| 5:00 AM to 5:29 AM | 0 (0.0%) | 0 (0.0%) |
| 5:30 AM to 5:59 AM | 0 (0.0%) | 7 (3.2%) |
| 6:00 AM to 6:29 AM | 24 (20.2%) | 18 (8.1%) |
| 6:30 AM to 6:59 AM | 21 (17.6%) | 47 (21.2%) |
| 7:00 AM to 7:29 AM | 7 (5.9%) | 0 (0.0%) |
| 7:30 AM to 7:59 AM | 0 (0.0%) | 18 (8.1%) |
| 8:00 AM to 8:29 AM | 36 (30.2%) | 38 (17.1%) |
| 8:30 AM to 8:59 AM | 17 (14.3%) | 0 (0.0%) |
| 9:00 AM to 9:59 AM | 0 (0.0%) | 0 (0.0%) |
| 10:00 AM to 10:59 AM | 0 (0.0%) | 0 (0.0%) |
| 11:00 AM to 11:59 AM | 0 (0.0%) | 0 (0.0%) |
| 12:00 PM to 3:59 PM | 0 (0.0%) | 94 (42.3%) |
| 4:00 PM to 11:59 PM | 0 (0.0%) | 0 (0.0%) |
| Total | 119 (100.0%) | 222 (100.0%) |
Housing Occupancy in Fairfax
Occupancy by Ownership in Fairfax
Of the total 505 dwellings in Fairfax, owner-occupied units account for 179 (35.4%), while renter-occupied units make up 326 (64.5%).
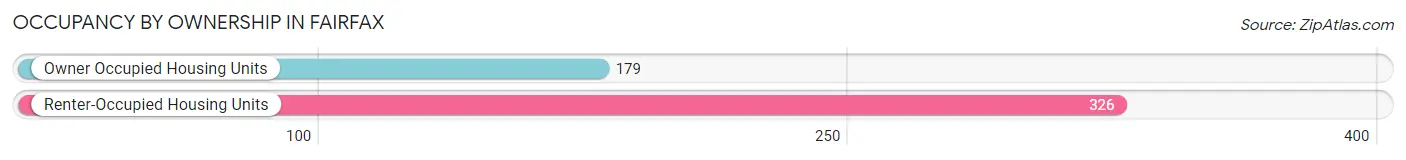
| Occupancy | # Housing Units | % Housing Units |
| Owner Occupied Housing Units | 179 | 35.4% |
| Renter-Occupied Housing Units | 326 | 64.5% |
| Total Occupied Housing Units | 505 | 100.0% |
Occupancy by Household Size in Fairfax
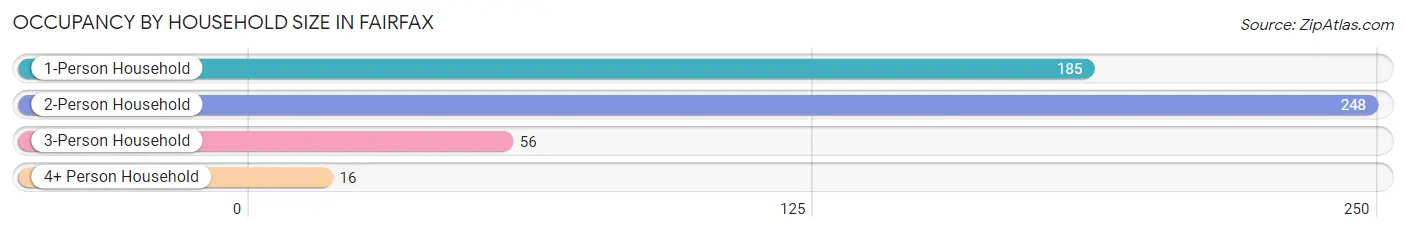
| Household Size | # Housing Units | % Housing Units |
| 1-Person Household | 185 | 36.6% |
| 2-Person Household | 248 | 49.1% |
| 3-Person Household | 56 | 11.1% |
| 4+ Person Household | 16 | 3.2% |
| Total Housing Units | 505 | 100.0% |
Occupancy by Ownership by Household Size in Fairfax
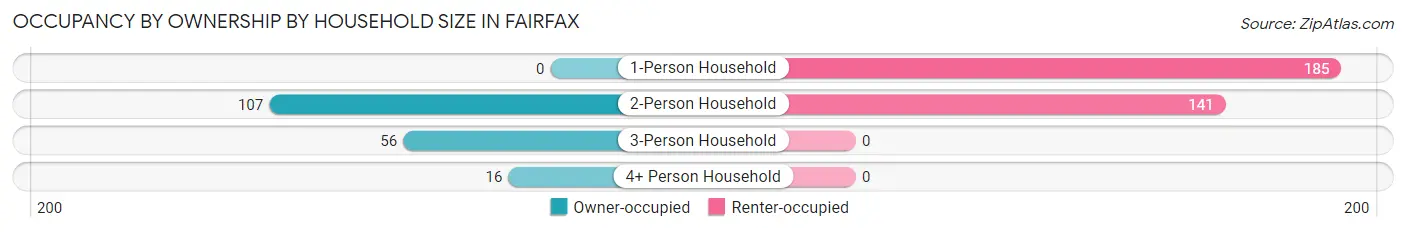
| Household Size | Owner-occupied | Renter-occupied |
| 1-Person Household | 0 (0.0%) | 185 (100.0%) |
| 2-Person Household | 107 (43.1%) | 141 (56.9%) |
| 3-Person Household | 56 (100.0%) | 0 (0.0%) |
| 4+ Person Household | 16 (100.0%) | 0 (0.0%) |
| Total Housing Units | 179 (35.4%) | 326 (64.5%) |
Occupancy by Educational Attainment in Fairfax
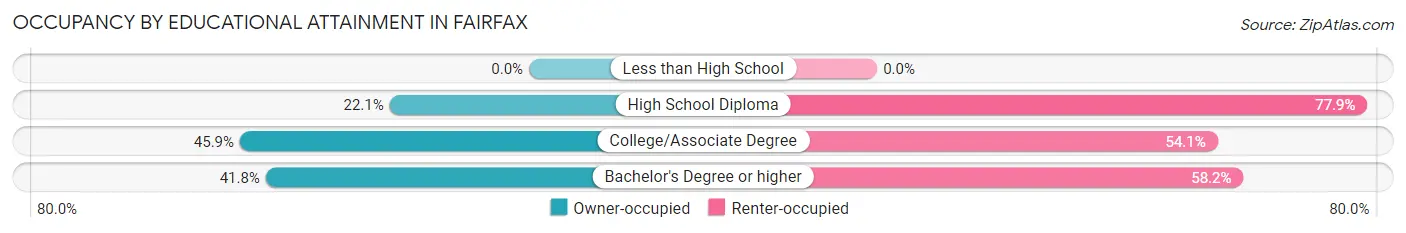
| Household Size | Owner-occupied | Renter-occupied |
| Less than High School | 0 (0.0%) | 0 (0.0%) |
| High School Diploma | 42 (22.1%) | 148 (77.9%) |
| College/Associate Degree | 61 (45.9%) | 72 (54.1%) |
| Bachelor's Degree or higher | 76 (41.8%) | 106 (58.2%) |
Occupancy by Age of Householder in Fairfax
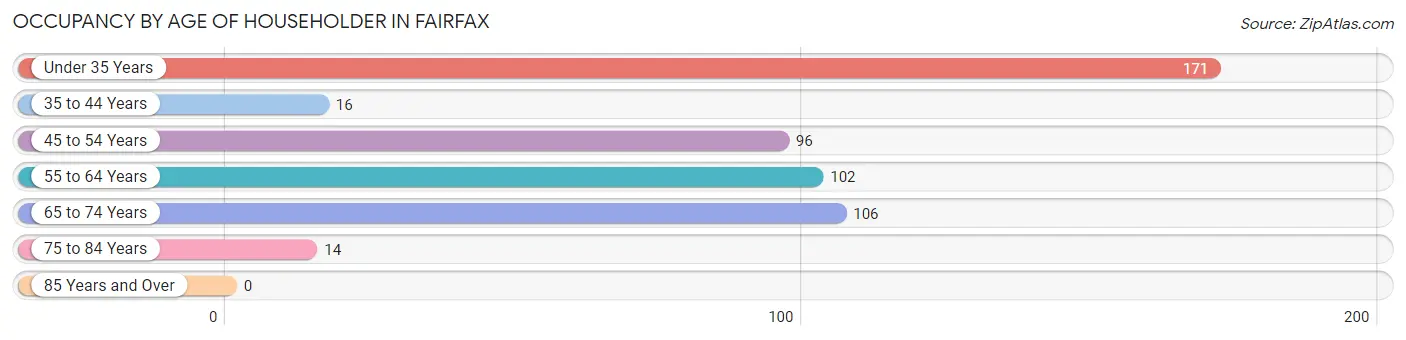
| Age Bracket | # Households | % Households |
| Under 35 Years | 171 | 33.9% |
| 35 to 44 Years | 16 | 3.2% |
| 45 to 54 Years | 96 | 19.0% |
| 55 to 64 Years | 102 | 20.2% |
| 65 to 74 Years | 106 | 21.0% |
| 75 to 84 Years | 14 | 2.8% |
| 85 Years and Over | 0 | 0.0% |
| Total | 505 | 100.0% |
Housing Finances in Fairfax
Median Income by Occupancy in Fairfax
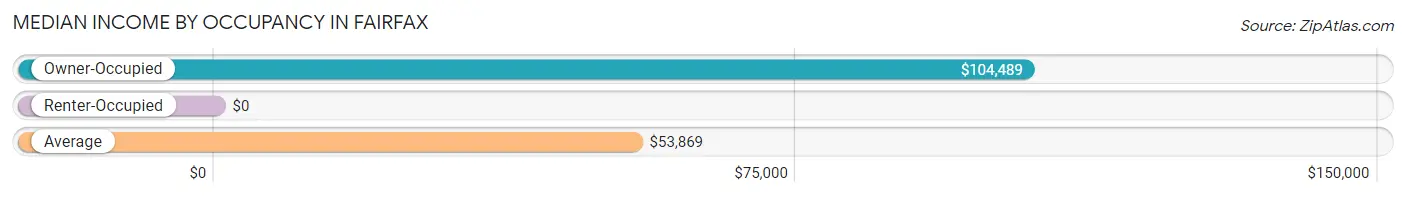
| Occupancy Type | # Households | Median Income |
| Owner-Occupied | 179 (35.4%) | $104,489 |
| Renter-Occupied | 326 (64.5%) | $0 |
| Average | 505 (100.0%) | $53,869 |
Occupancy by Householder Income Bracket in Fairfax
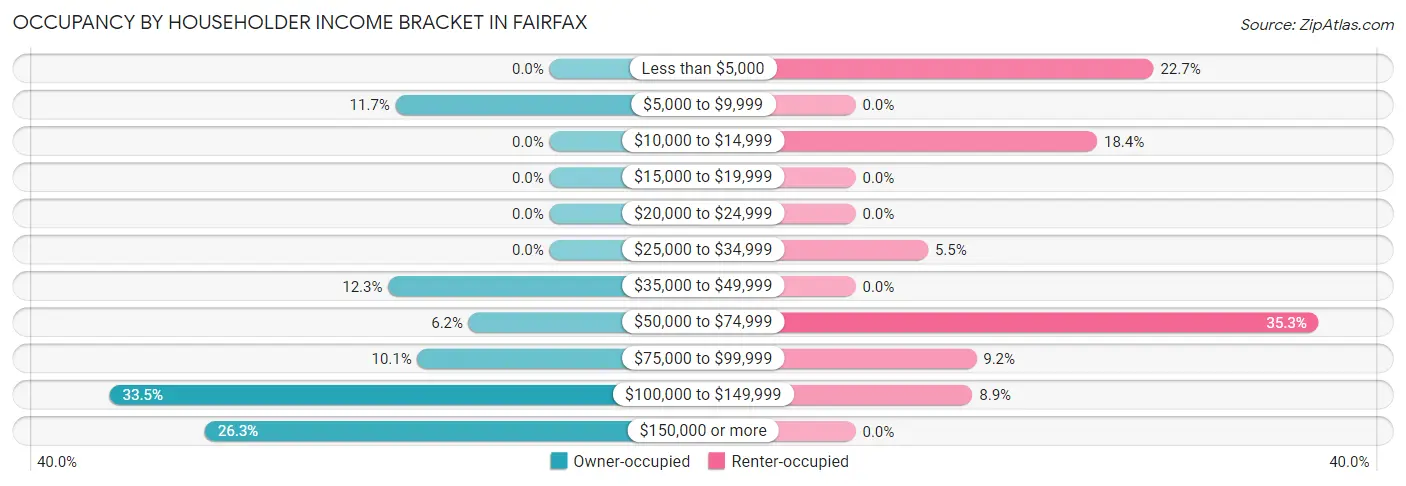
| Income Bracket | Owner-occupied | Renter-occupied |
| Less than $5,000 | 0 (0.0%) | 74 (22.7%) |
| $5,000 to $9,999 | 21 (11.7%) | 0 (0.0%) |
| $10,000 to $14,999 | 0 (0.0%) | 60 (18.4%) |
| $15,000 to $19,999 | 0 (0.0%) | 0 (0.0%) |
| $20,000 to $24,999 | 0 (0.0%) | 0 (0.0%) |
| $25,000 to $34,999 | 0 (0.0%) | 18 (5.5%) |
| $35,000 to $49,999 | 22 (12.3%) | 0 (0.0%) |
| $50,000 to $74,999 | 11 (6.1%) | 115 (35.3%) |
| $75,000 to $99,999 | 18 (10.1%) | 30 (9.2%) |
| $100,000 to $149,999 | 60 (33.5%) | 29 (8.9%) |
| $150,000 or more | 47 (26.3%) | 0 (0.0%) |
| Total | 179 (100.0%) | 326 (100.0%) |
Monthly Housing Cost Tiers in Fairfax
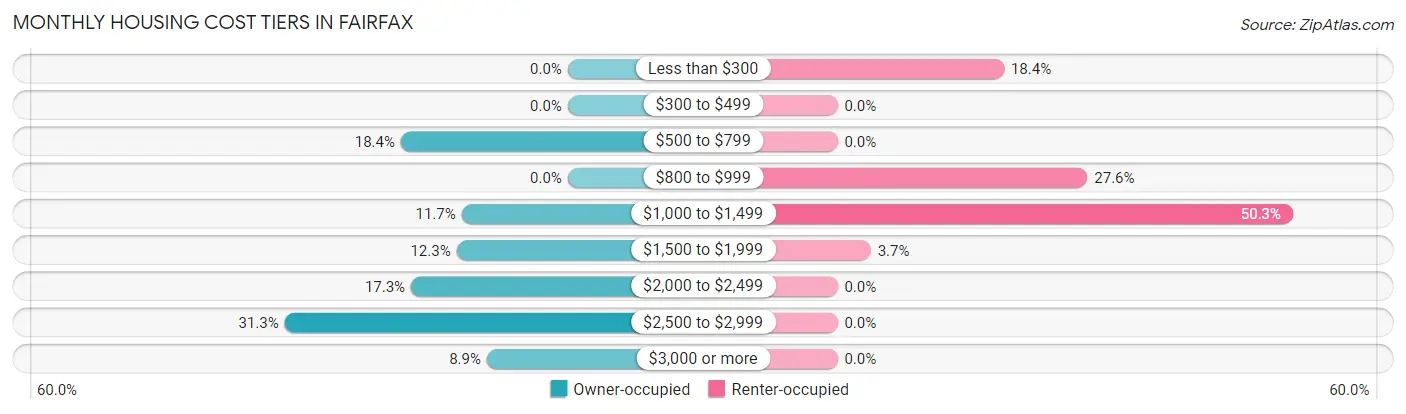
| Monthly Cost | Owner-occupied | Renter-occupied |
| Less than $300 | 0 (0.0%) | 60 (18.4%) |
| $300 to $499 | 0 (0.0%) | 0 (0.0%) |
| $500 to $799 | 33 (18.4%) | 0 (0.0%) |
| $800 to $999 | 0 (0.0%) | 90 (27.6%) |
| $1,000 to $1,499 | 21 (11.7%) | 164 (50.3%) |
| $1,500 to $1,999 | 22 (12.3%) | 12 (3.7%) |
| $2,000 to $2,499 | 31 (17.3%) | 0 (0.0%) |
| $2,500 to $2,999 | 56 (31.3%) | 0 (0.0%) |
| $3,000 or more | 16 (8.9%) | 0 (0.0%) |
| Total | 179 (100.0%) | 326 (100.0%) |
Physical Housing Characteristics in Fairfax
Housing Structures in Fairfax
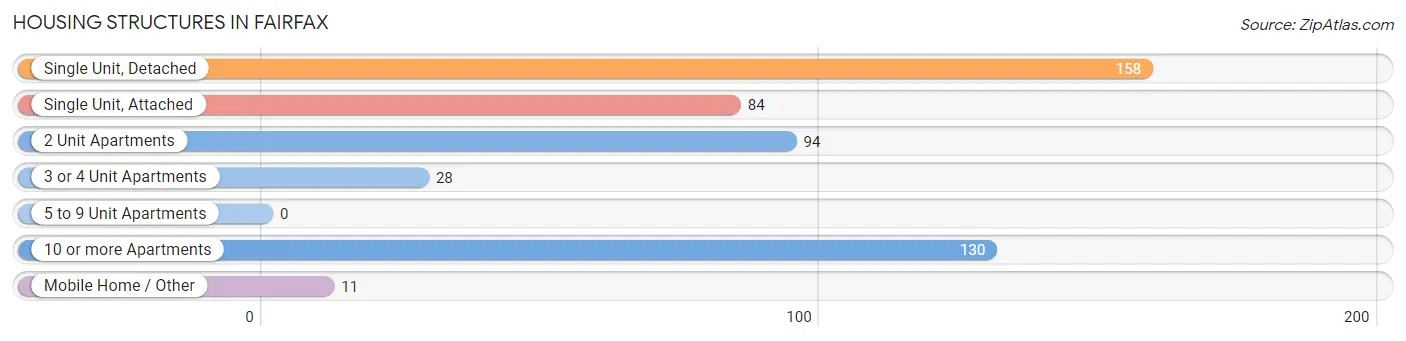
| Structure Type | # Housing Units | % Housing Units |
| Single Unit, Detached | 158 | 31.3% |
| Single Unit, Attached | 84 | 16.6% |
| 2 Unit Apartments | 94 | 18.6% |
| 3 or 4 Unit Apartments | 28 | 5.5% |
| 5 to 9 Unit Apartments | 0 | 0.0% |
| 10 or more Apartments | 130 | 25.7% |
| Mobile Home / Other | 11 | 2.2% |
| Total | 505 | 100.0% |
Housing Structures by Occupancy in Fairfax
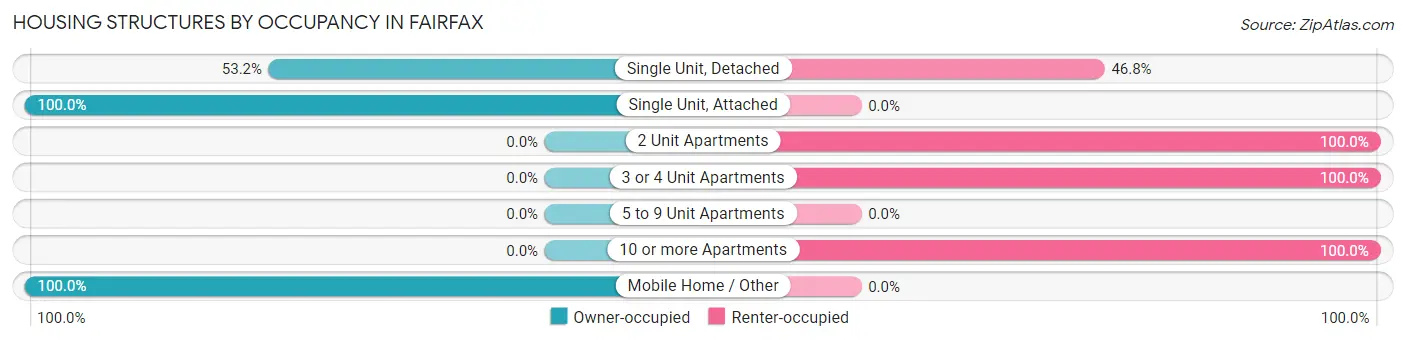
| Structure Type | Owner-occupied | Renter-occupied |
| Single Unit, Detached | 84 (53.2%) | 74 (46.8%) |
| Single Unit, Attached | 84 (100.0%) | 0 (0.0%) |
| 2 Unit Apartments | 0 (0.0%) | 94 (100.0%) |
| 3 or 4 Unit Apartments | 0 (0.0%) | 28 (100.0%) |
| 5 to 9 Unit Apartments | 0 (0.0%) | 0 (0.0%) |
| 10 or more Apartments | 0 (0.0%) | 130 (100.0%) |
| Mobile Home / Other | 11 (100.0%) | 0 (0.0%) |
| Total | 179 (35.4%) | 326 (64.5%) |
Housing Structures by Number of Rooms in Fairfax
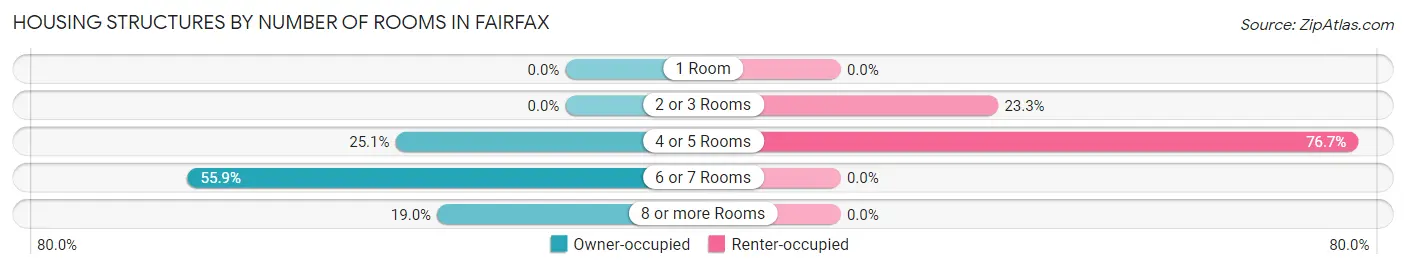
| Number of Rooms | Owner-occupied | Renter-occupied |
| 1 Room | 0 (0.0%) | 0 (0.0%) |
| 2 or 3 Rooms | 0 (0.0%) | 76 (23.3%) |
| 4 or 5 Rooms | 45 (25.1%) | 250 (76.7%) |
| 6 or 7 Rooms | 100 (55.9%) | 0 (0.0%) |
| 8 or more Rooms | 34 (19.0%) | 0 (0.0%) |
| Total | 179 (100.0%) | 326 (100.0%) |
Housing Structure by Heating Type in Fairfax
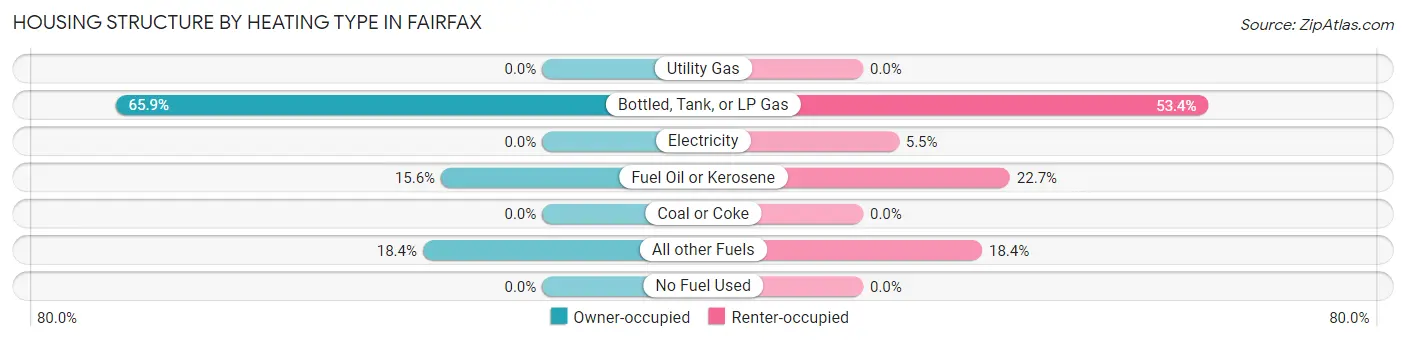
| Heating Type | Owner-occupied | Renter-occupied |
| Utility Gas | 0 (0.0%) | 0 (0.0%) |
| Bottled, Tank, or LP Gas | 118 (65.9%) | 174 (53.4%) |
| Electricity | 0 (0.0%) | 18 (5.5%) |
| Fuel Oil or Kerosene | 28 (15.6%) | 74 (22.7%) |
| Coal or Coke | 0 (0.0%) | 0 (0.0%) |
| All other Fuels | 33 (18.4%) | 60 (18.4%) |
| No Fuel Used | 0 (0.0%) | 0 (0.0%) |
| Total | 179 (100.0%) | 326 (100.0%) |
Household Vehicle Usage in Fairfax
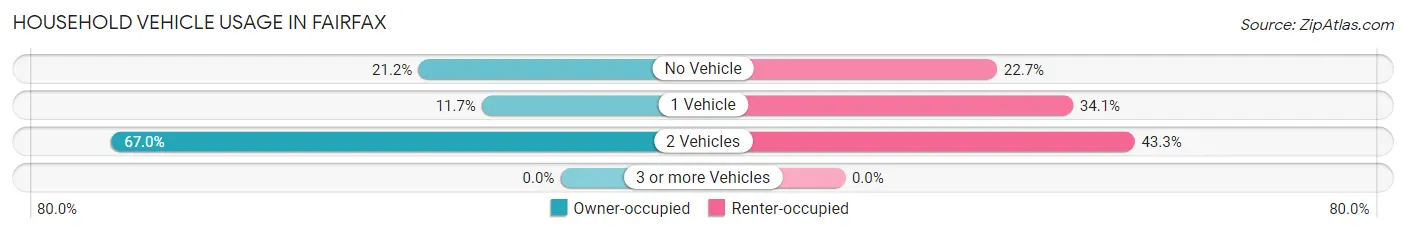
| Vehicles per Household | Owner-occupied | Renter-occupied |
| No Vehicle | 38 (21.2%) | 74 (22.7%) |
| 1 Vehicle | 21 (11.7%) | 111 (34.1%) |
| 2 Vehicles | 120 (67.0%) | 141 (43.2%) |
| 3 or more Vehicles | 0 (0.0%) | 0 (0.0%) |
| Total | 179 (100.0%) | 326 (100.0%) |
Real Estate & Mortgages in Fairfax
Real Estate and Mortgage Overview in Fairfax
| Characteristic | Without Mortgage | With Mortgage |
| Housing Units | 33 | 146 |
| Median Property Value | - | - |
| Median Household Income | - | - |
| Monthly Housing Costs | - | - |
| Real Estate Taxes | - | - |
Property Value by Mortgage Status in Fairfax
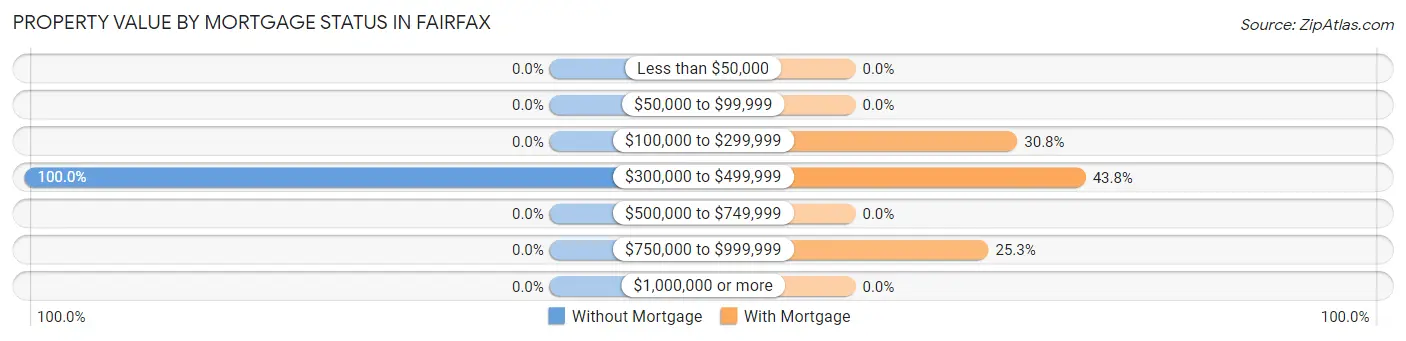
| Property Value | Without Mortgage | With Mortgage |
| Less than $50,000 | 0 (0.0%) | 0 (0.0%) |
| $50,000 to $99,999 | 0 (0.0%) | 0 (0.0%) |
| $100,000 to $299,999 | 0 (0.0%) | 45 (30.8%) |
| $300,000 to $499,999 | 33 (100.0%) | 64 (43.8%) |
| $500,000 to $749,999 | 0 (0.0%) | 0 (0.0%) |
| $750,000 to $999,999 | 0 (0.0%) | 37 (25.3%) |
| $1,000,000 or more | 0 (0.0%) | 0 (0.0%) |
| Total | 33 (100.0%) | 146 (100.0%) |
Household Income by Mortgage Status in Fairfax
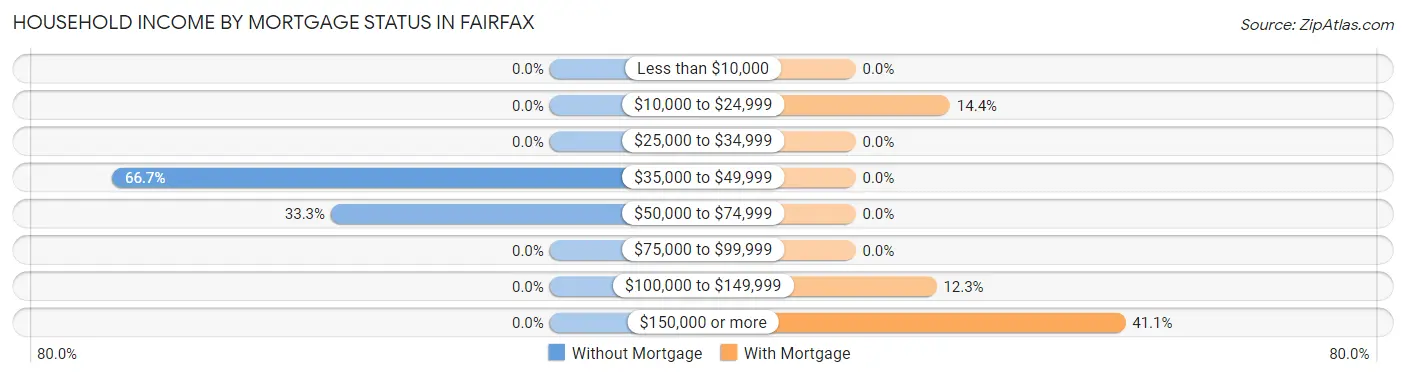
| Household Income | Without Mortgage | With Mortgage |
| Less than $10,000 | 0 (0.0%) | 0 (0.0%) |
| $10,000 to $24,999 | 0 (0.0%) | 21 (14.4%) |
| $25,000 to $34,999 | 0 (0.0%) | 0 (0.0%) |
| $35,000 to $49,999 | 22 (66.7%) | 0 (0.0%) |
| $50,000 to $74,999 | 11 (33.3%) | 0 (0.0%) |
| $75,000 to $99,999 | 0 (0.0%) | 0 (0.0%) |
| $100,000 to $149,999 | 0 (0.0%) | 18 (12.3%) |
| $150,000 or more | 0 (0.0%) | 60 (41.1%) |
| Total | 33 (100.0%) | 146 (100.0%) |
Property Value to Household Income Ratio in Fairfax
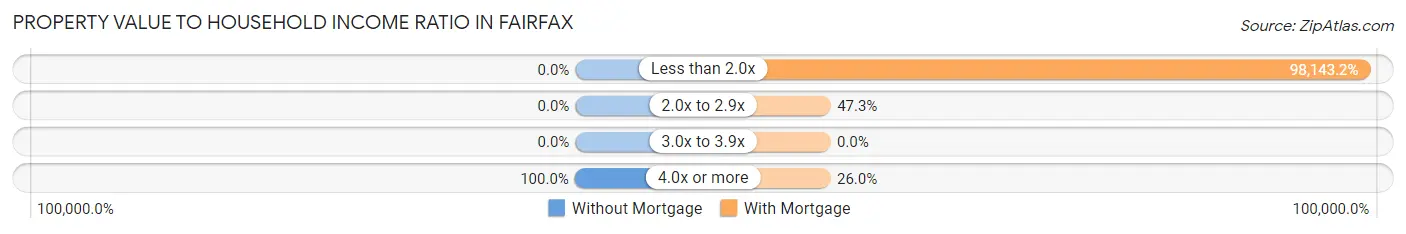
| Value-to-Income Ratio | Without Mortgage | With Mortgage |
| Less than 2.0x | 0 (0.0%) | 143,289 (98,143.2%) |
| 2.0x to 2.9x | 0 (0.0%) | 69 (47.3%) |
| 3.0x to 3.9x | 0 (0.0%) | 0 (0.0%) |
| 4.0x or more | 33 (100.0%) | 38 (26.0%) |
| Total | 33 (100.0%) | 146 (100.0%) |
Real Estate Taxes by Mortgage Status in Fairfax
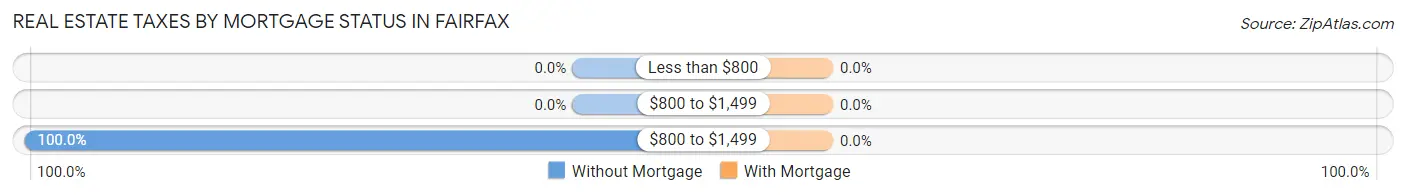
| Property Taxes | Without Mortgage | With Mortgage |
| Less than $800 | 0 (0.0%) | 0 (0.0%) |
| $800 to $1,499 | 0 (0.0%) | 0 (0.0%) |
| $800 to $1,499 | 33 (100.0%) | 0 (0.0%) |
| Total | 33 (100.0%) | 146 (100.0%) |
Health & Disability in Fairfax
Health Insurance Coverage by Age in Fairfax
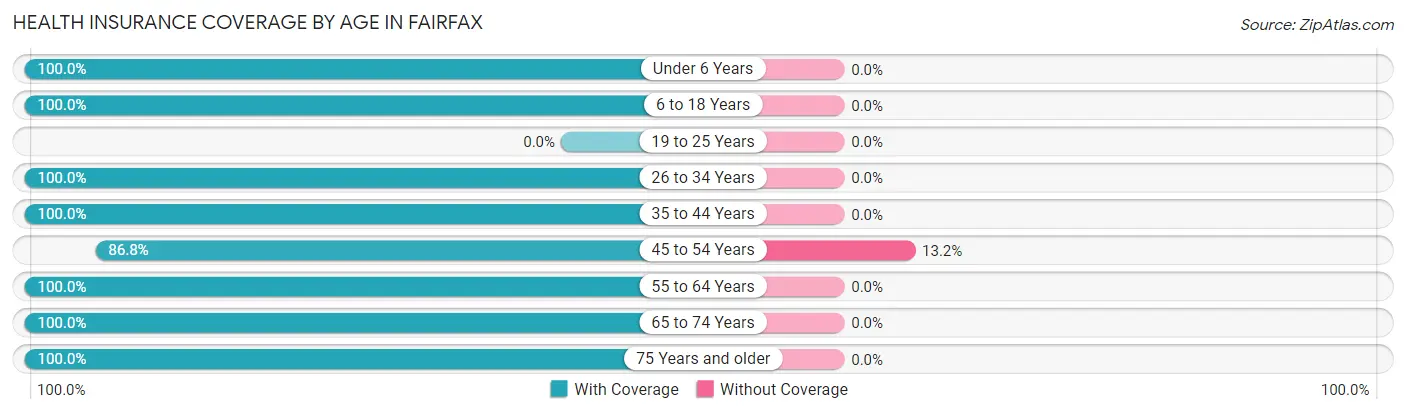
| Age Bracket | With Coverage | Without Coverage |
| Under 6 Years | 44 (100.0%) | 0 (0.0%) |
| 6 to 18 Years | 35 (100.0%) | 0 (0.0%) |
| 19 to 25 Years | 0 (0.0%) | 0 (0.0%) |
| 26 to 34 Years | 241 (100.0%) | 0 (0.0%) |
| 35 to 44 Years | 111 (100.0%) | 0 (0.0%) |
| 45 to 54 Years | 138 (86.8%) | 21 (13.2%) |
| 55 to 64 Years | 109 (100.0%) | 0 (0.0%) |
| 65 to 74 Years | 167 (100.0%) | 0 (0.0%) |
| 75 Years and older | 14 (100.0%) | 0 (0.0%) |
| Total | 859 (97.6%) | 21 (2.4%) |
Health Insurance Coverage by Citizenship Status in Fairfax
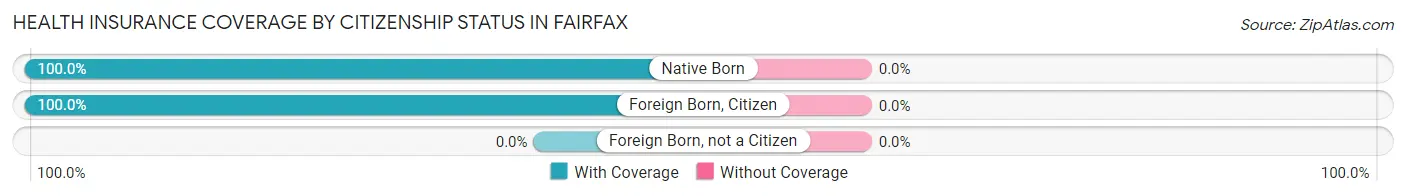
| Citizenship Status | With Coverage | Without Coverage |
| Native Born | 44 (100.0%) | 0 (0.0%) |
| Foreign Born, Citizen | 35 (100.0%) | 0 (0.0%) |
| Foreign Born, not a Citizen | 0 (0.0%) | 0 (0.0%) |
Health Insurance Coverage by Household Income in Fairfax
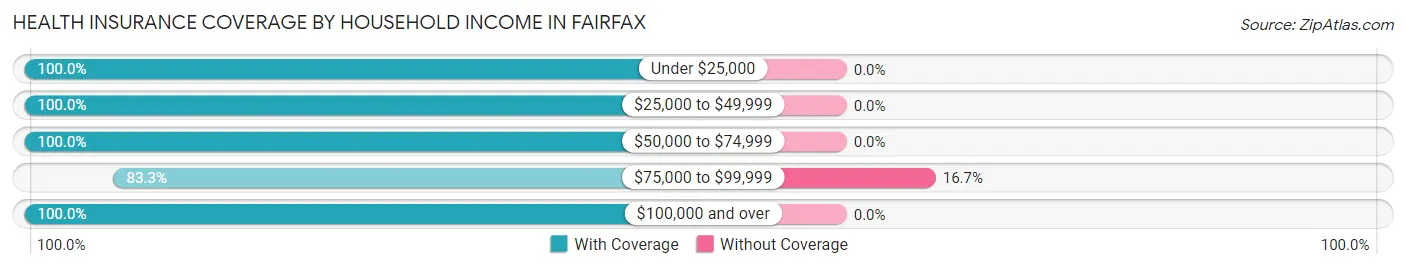
| Household Income | With Coverage | Without Coverage |
| Under $25,000 | 176 (100.0%) | 0 (0.0%) |
| $25,000 to $49,999 | 55 (100.0%) | 0 (0.0%) |
| $50,000 to $74,999 | 219 (100.0%) | 0 (0.0%) |
| $75,000 to $99,999 | 105 (83.3%) | 21 (16.7%) |
| $100,000 and over | 304 (100.0%) | 0 (0.0%) |
Public vs Private Health Insurance Coverage by Age in Fairfax
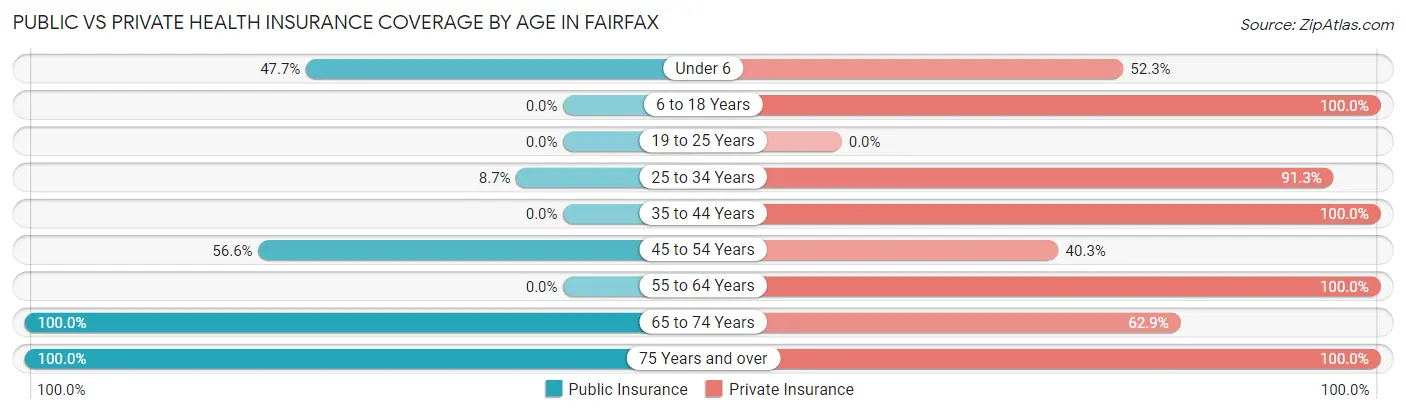
| Age Bracket | Public Insurance | Private Insurance |
| Under 6 | 21 (47.7%) | 23 (52.3%) |
| 6 to 18 Years | 0 (0.0%) | 35 (100.0%) |
| 19 to 25 Years | 0 (0.0%) | 0 (0.0%) |
| 25 to 34 Years | 21 (8.7%) | 220 (91.3%) |
| 35 to 44 Years | 0 (0.0%) | 111 (100.0%) |
| 45 to 54 Years | 90 (56.6%) | 64 (40.3%) |
| 55 to 64 Years | 0 (0.0%) | 109 (100.0%) |
| 65 to 74 Years | 167 (100.0%) | 105 (62.9%) |
| 75 Years and over | 14 (100.0%) | 14 (100.0%) |
| Total | 313 (35.6%) | 681 (77.4%) |
Disability Status by Sex by Age in Fairfax
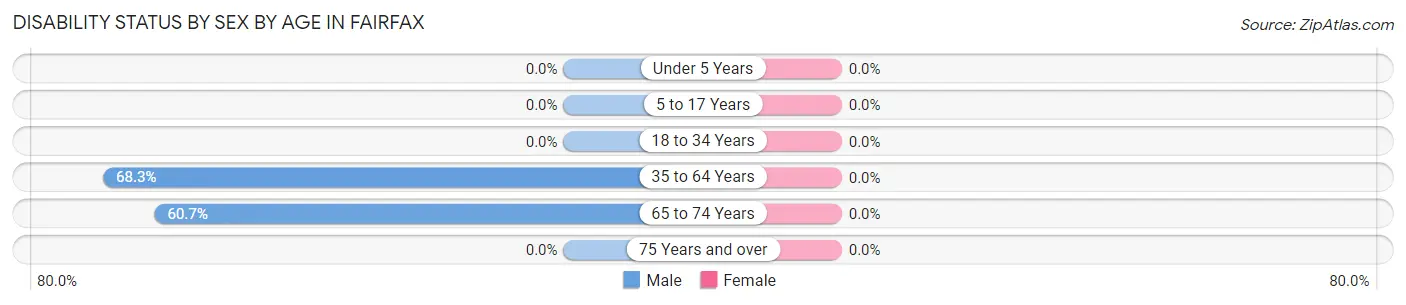
| Age Bracket | Male | Female |
| Under 5 Years | 0 (0.0%) | 0 (0.0%) |
| 5 to 17 Years | 0 (0.0%) | 0 (0.0%) |
| 18 to 34 Years | 0 (0.0%) | 0 (0.0%) |
| 35 to 64 Years | 205 (68.3%) | 0 (0.0%) |
| 65 to 74 Years | 17 (60.7%) | 0 (0.0%) |
| 75 Years and over | 0 (0.0%) | 0 (0.0%) |
Disability Class by Sex by Age in Fairfax
Disability Class: Hearing Difficulty
| Age Bracket | Male | Female |
| Under 5 Years | 0 (0.0%) | 0 (0.0%) |
| 5 to 17 Years | 0 (0.0%) | 0 (0.0%) |
| 18 to 34 Years | 0 (0.0%) | 0 (0.0%) |
| 35 to 64 Years | 0 (0.0%) | 0 (0.0%) |
| 65 to 74 Years | 0 (0.0%) | 0 (0.0%) |
| 75 Years and over | 0 (0.0%) | 0 (0.0%) |
Disability Class: Vision Difficulty
| Age Bracket | Male | Female |
| Under 5 Years | 0 (0.0%) | 0 (0.0%) |
| 5 to 17 Years | 0 (0.0%) | 0 (0.0%) |
| 18 to 34 Years | 0 (0.0%) | 0 (0.0%) |
| 35 to 64 Years | 12 (4.0%) | 0 (0.0%) |
| 65 to 74 Years | 0 (0.0%) | 0 (0.0%) |
| 75 Years and over | 0 (0.0%) | 0 (0.0%) |
Disability Class: Cognitive Difficulty
| Age Bracket | Male | Female |
| 5 to 17 Years | 0 (0.0%) | 0 (0.0%) |
| 18 to 34 Years | 0 (0.0%) | 0 (0.0%) |
| 35 to 64 Years | 16 (5.3%) | 0 (0.0%) |
| 65 to 74 Years | 0 (0.0%) | 0 (0.0%) |
| 75 Years and over | 0 (0.0%) | 0 (0.0%) |
Disability Class: Ambulatory Difficulty
| Age Bracket | Male | Female |
| 5 to 17 Years | 0 (0.0%) | 0 (0.0%) |
| 18 to 34 Years | 0 (0.0%) | 0 (0.0%) |
| 35 to 64 Years | 74 (24.7%) | 0 (0.0%) |
| 65 to 74 Years | 17 (60.7%) | 0 (0.0%) |
| 75 Years and over | 0 (0.0%) | 0 (0.0%) |
Disability Class: Self-Care Difficulty
| Age Bracket | Male | Female |
| 5 to 17 Years | 0 (0.0%) | 0 (0.0%) |
| 18 to 34 Years | 0 (0.0%) | 0 (0.0%) |
| 35 to 64 Years | 0 (0.0%) | 0 (0.0%) |
| 65 to 74 Years | 0 (0.0%) | 0 (0.0%) |
| 75 Years and over | 0 (0.0%) | 0 (0.0%) |
Technology Access in Fairfax
Computing Device Access in Fairfax
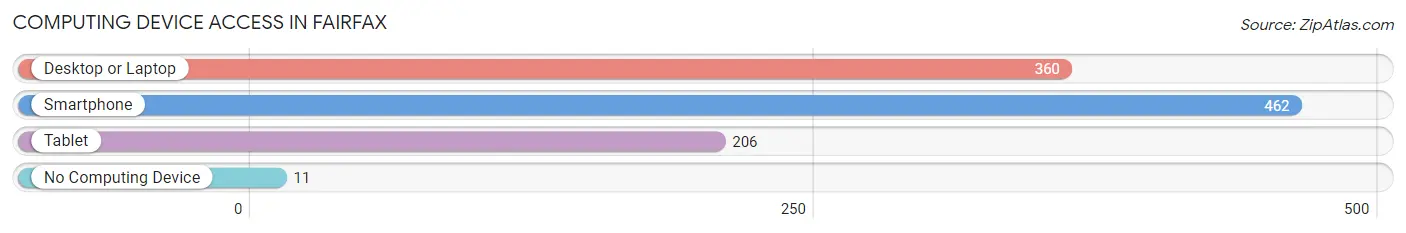
| Device Type | # Households | % Households |
| Desktop or Laptop | 360 | 71.3% |
| Smartphone | 462 | 91.5% |
| Tablet | 206 | 40.8% |
| No Computing Device | 11 | 2.2% |
| Total | 505 | 100.0% |
Internet Access in Fairfax
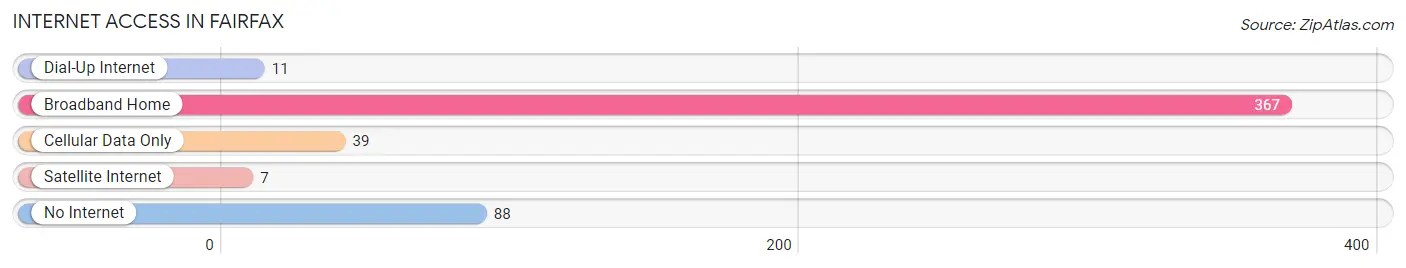
| Internet Type | # Households | % Households |
| Dial-Up Internet | 11 | 2.2% |
| Broadband Home | 367 | 72.7% |
| Cellular Data Only | 39 | 7.7% |
| Satellite Internet | 7 | 1.4% |
| No Internet | 88 | 17.4% |
| Total | 505 | 100.0% |
Fairfax Summary
Fairfax, Vermont is a small town located in the northwestern part of the state, in Franklin County. It is situated on the banks of the Lamoille River, and is surrounded by the Green Mountains. The town has a population of 2,541 people, according to the 2010 census.
History
The area that is now Fairfax was first settled in 1790 by a group of settlers from Massachusetts. The town was originally known as “New Boston”, but was later renamed Fairfax in honor of Thomas Fairfax, 6th Lord Fairfax of Cameron. The town was officially incorporated in 1798.
In the early 19th century, Fairfax was a thriving agricultural community. The town was known for its dairy farms, and the local cheese industry was a major source of income for the town. The town also had a number of sawmills, gristmills, and other small industries.
In the late 19th century, Fairfax began to experience a decline in its economy. The town’s population began to decline, and many of the local industries closed. The town’s economy was further hurt by the Great Depression, and the population continued to decline.
In the late 20th century, Fairfax began to experience a resurgence. The town’s population began to increase, and new businesses began to open. The town’s economy is now largely based on tourism, with many visitors coming to the area to enjoy the town’s natural beauty and outdoor activities.
Geography
Fairfax is located in the northwestern part of Vermont, in Franklin County. The town is situated on the banks of the Lamoille River, and is surrounded by the Green Mountains. The town has a total area of 24.2 square miles, of which 24.1 square miles is land and 0.1 square miles is water.
The town is located in a rural area, and is home to a number of small farms and wooded areas. The town is also home to a number of small lakes and ponds, including Lake Carmi, Lake Iroquois, and Lake Champlain.
Economy
The economy of Fairfax is largely based on tourism. The town is home to a number of small businesses, including restaurants, shops, and lodging. The town is also home to a number of outdoor recreation areas, including hiking trails, ski resorts, and fishing spots.
The town is also home to a number of small industries, including a sawmill, a gristmill, and a cheese factory. The town is also home to a number of small farms, which produce a variety of crops, including corn, hay, and apples.
Demographics
According to the 2010 census, Fairfax has a population of 2,541 people. The town has a median household income of $50,945, and a median family income of $60,945. The town has a poverty rate of 11.3%, and a unemployment rate of 4.3%.
The town is predominantly white, with 92.3% of the population identifying as white. The town also has a small Hispanic population, with 4.2% of the population identifying as Hispanic or Latino. The town also has a small African American population, with 1.2% of the population identifying as African American.
Conclusion
Fairfax, Vermont is a small town located in the northwestern part of the state, in Franklin County. The town has a population of 2,541 people, according to the 2010 census. The town’s economy is largely based on tourism, with many visitors coming to the area to enjoy the town’s natural beauty and outdoor activities. The town is predominantly white, with 92.3% of the population identifying as white. The town also has a small Hispanic population, with 4.2% of the population identifying as Hispanic or Latino. The town also has a small African American population, with 1.2% of the population identifying as African American.
Common Questions
What is Per Capita Income in Fairfax?
Per Capita income in Fairfax is $35,619.
What is the Median Family Income in Fairfax?
Median Family Income in Fairfax is $75,313.
What is the Median Household income in Fairfax?
Median Household Income in Fairfax is $53,869.
What is Income or Wage Gap in Fairfax?
Income or Wage Gap in Fairfax is 18.0%.
Women in Fairfax earn 82.0 cents for every dollar earned by a man.
What is Inequality or Gini Index in Fairfax?
Inequality or Gini Index in Fairfax is 0.49.
What is the Total Population of Fairfax?
Total Population of Fairfax is 880.
What is the Total Male Population of Fairfax?
Total Male Population of Fairfax is 468.
What is the Total Female Population of Fairfax?
Total Female Population of Fairfax is 412.
What is the Ratio of Males per 100 Females in Fairfax?
There are 113.59 Males per 100 Females in Fairfax.
What is the Ratio of Females per 100 Males in Fairfax?
There are 88.03 Females per 100 Males in Fairfax.
What is the Median Population Age in Fairfax?
Median Population Age in Fairfax is 47.4 Years.
What is the Average Family Size in Fairfax
Average Family Size in Fairfax is 2.1 People.
What is the Average Household Size in Fairfax
Average Household Size in Fairfax is 1.7 People.
How Large is the Labor Force in Fairfax?
There are 473 People in the Labor Forcein in Fairfax.
What is the Percentage of People in the Labor Force in Fairfax?
59.1% of People are in the Labor Force in Fairfax.
What is the Unemployment Rate in Fairfax?
Unemployment Rate in Fairfax is 13.5%.