South Burlington, VT Map & Demographics
South Burlington Map
South Burlington Overview
$53,110
PER CAPITA INCOME
$115,528
AVG FAMILY INCOME
$90,410
AVG HOUSEHOLD INCOME
17.5%
WAGE / INCOME GAP [ % ]
82.5¢/ $1
WAGE / INCOME GAP [ $ ]
0.45
INEQUALITY / GINI INDEX
20,241
TOTAL POPULATION
9,759
MALE POPULATION
10,482
FEMALE POPULATION
93.10
MALES / 100 FEMALES
107.41
FEMALES / 100 MALES
38.7
MEDIAN AGE
2.8
AVG FAMILY SIZE
2.3
AVG HOUSEHOLD SIZE
12,619
LABOR FORCE [ PEOPLE ]
74.5%
PERCENT IN LABOR FORCE
5.4%
UNEMPLOYMENT RATE
South Burlington Zip Codes
South Burlington Area Codes
Income in South Burlington
Income Overview in South Burlington
Per Capita Income in South Burlington is $53,110, while median incomes of families and households are $115,528 and $90,410 respectively.
| Characteristic | Number | Measure |
| Per Capita Income | 20,241 | $53,110 |
| Median Family Income | 4,927 | $115,528 |
| Mean Family Income | 4,927 | $156,890 |
| Median Household Income | 8,783 | $90,410 |
| Mean Household Income | 8,783 | $123,108 |
| Income Deficit | 4,927 | $0 |
| Wage / Income Gap (%) | 20,241 | 17.54% |
| Wage / Income Gap ($) | 20,241 | 82.46¢ per $1 |
| Gini / Inequality Index | 20,241 | 0.45 |
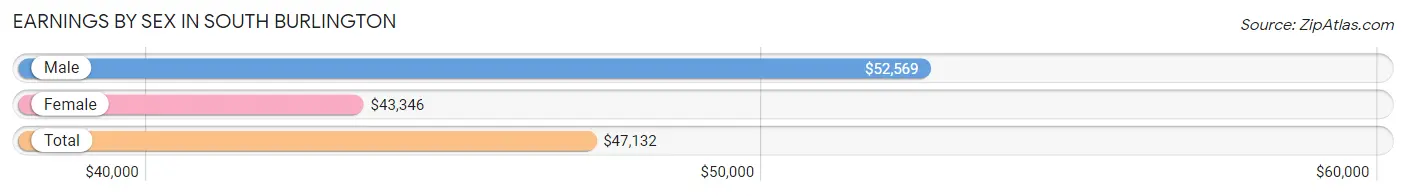
Earnings by Sex in South Burlington
Average Earnings in South Burlington are $47,132, $52,569 for men and $43,346 for women, a difference of 17.5%.
| Sex | Number | Average Earnings |
| Male | 6,502 (50.2%) | $52,569 |
| Female | 6,444 (49.8%) | $43,346 |
| Total | 12,946 (100.0%) | $47,132 |
Earnings by Sex by Income Bracket in South Burlington
The most common earnings brackets in South Burlington are $100,000+ for men (1,473 | 22.7%) and $100,000+ for women (960 | 14.9%).
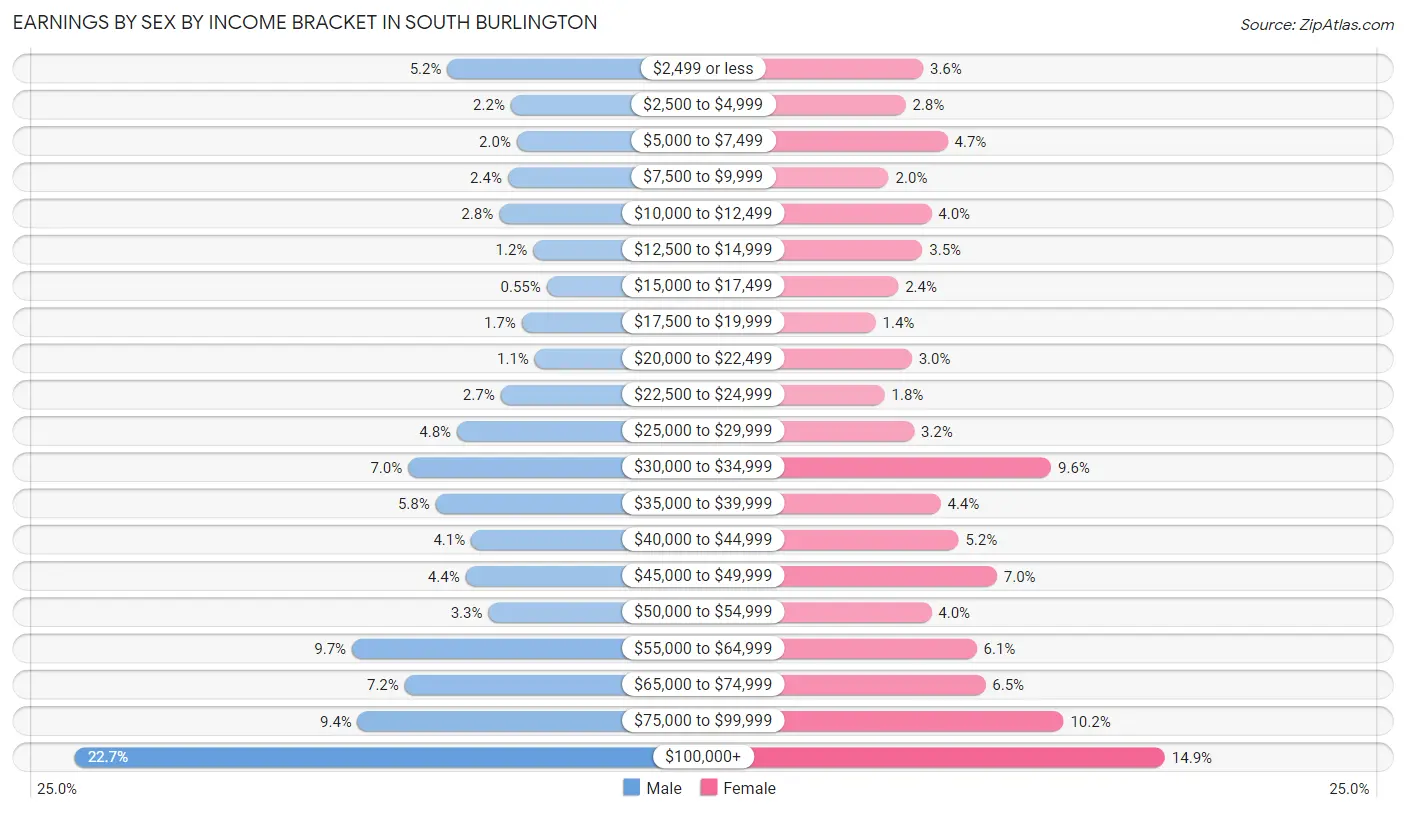
| Income | Male | Female |
| $2,499 or less | 338 (5.2%) | 230 (3.6%) |
| $2,500 to $4,999 | 145 (2.2%) | 177 (2.8%) |
| $5,000 to $7,499 | 127 (1.9%) | 304 (4.7%) |
| $7,500 to $9,999 | 154 (2.4%) | 126 (2.0%) |
| $10,000 to $12,499 | 181 (2.8%) | 255 (4.0%) |
| $12,500 to $14,999 | 77 (1.2%) | 228 (3.5%) |
| $15,000 to $17,499 | 36 (0.5%) | 155 (2.4%) |
| $17,500 to $19,999 | 112 (1.7%) | 87 (1.3%) |
| $20,000 to $22,499 | 72 (1.1%) | 196 (3.0%) |
| $22,500 to $24,999 | 176 (2.7%) | 114 (1.8%) |
| $25,000 to $29,999 | 309 (4.8%) | 203 (3.2%) |
| $30,000 to $34,999 | 458 (7.0%) | 617 (9.6%) |
| $35,000 to $39,999 | 374 (5.8%) | 283 (4.4%) |
| $40,000 to $44,999 | 266 (4.1%) | 337 (5.2%) |
| $45,000 to $49,999 | 283 (4.3%) | 453 (7.0%) |
| $50,000 to $54,999 | 213 (3.3%) | 255 (4.0%) |
| $55,000 to $64,999 | 629 (9.7%) | 392 (6.1%) |
| $65,000 to $74,999 | 468 (7.2%) | 418 (6.5%) |
| $75,000 to $99,999 | 611 (9.4%) | 654 (10.2%) |
| $100,000+ | 1,473 (22.7%) | 960 (14.9%) |
| Total | 6,502 (100.0%) | 6,444 (100.0%) |
Earnings by Sex by Educational Attainment in South Burlington
Average earnings in South Burlington are $63,463 for men and $51,307 for women, a difference of 19.2%. Men with an educational attainment of graduate degree enjoy the highest average annual earnings of $100,859, while those with high school diploma education earn the least with $35,347. Women with an educational attainment of graduate degree earn the most with the average annual earnings of $66,793, while those with high school diploma education have the smallest earnings of $29,625.
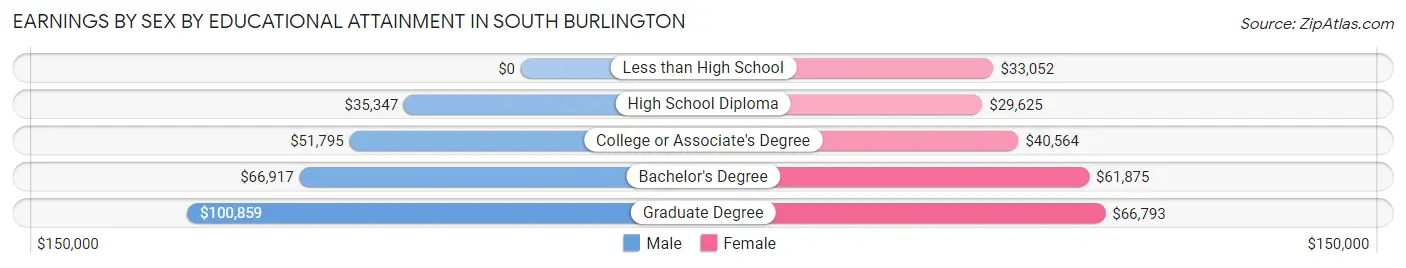
| Educational Attainment | Male Income | Female Income |
| Less than High School | - | - |
| High School Diploma | $35,347 | $29,625 |
| College or Associate's Degree | $51,795 | $40,564 |
| Bachelor's Degree | $66,917 | $61,875 |
| Graduate Degree | $100,859 | $66,793 |
| Total | $63,463 | $51,307 |
Family Income in South Burlington
Family Income Brackets in South Burlington
According to the South Burlington family income data, there are 1,281 families falling into the $200,000+ income range, which is the most common income bracket and makes up 26.0% of all families. Conversely, the less than $10,000 income bracket is the least frequent group with only 74 families (1.5%) belonging to this category.
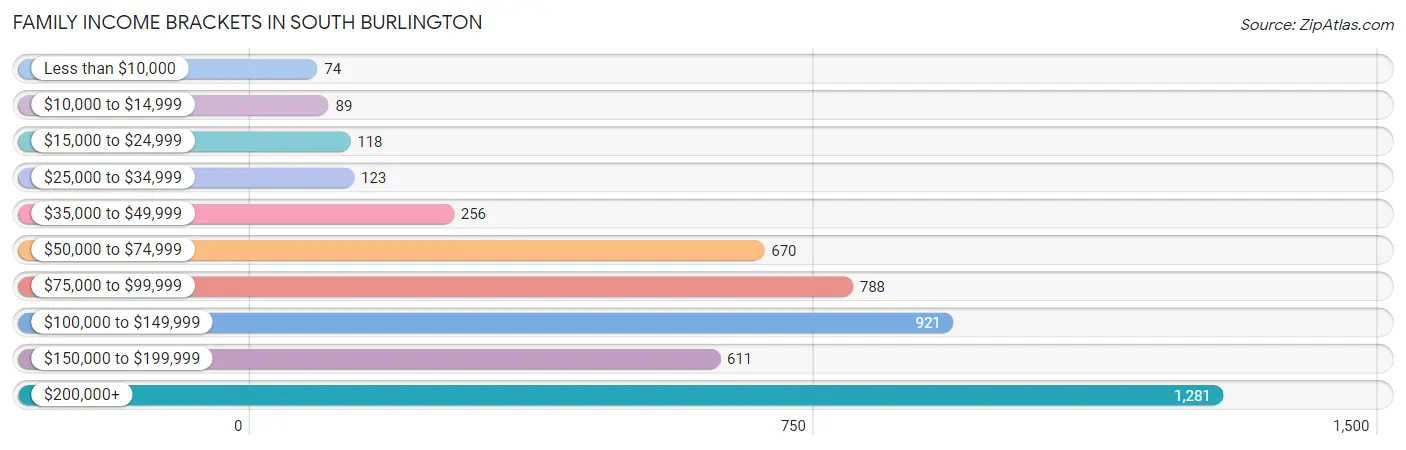
| Income Bracket | # Families | % Families |
| Less than $10,000 | 74 | 1.5% |
| $10,000 to $14,999 | 89 | 1.8% |
| $15,000 to $24,999 | 118 | 2.4% |
| $25,000 to $34,999 | 123 | 2.5% |
| $35,000 to $49,999 | 256 | 5.2% |
| $50,000 to $74,999 | 670 | 13.6% |
| $75,000 to $99,999 | 788 | 16.0% |
| $100,000 to $149,999 | 921 | 18.7% |
| $150,000 to $199,999 | 611 | 12.4% |
| $200,000+ | 1,281 | 26.0% |
Family Income by Famaliy Size in South Burlington
6-person families (67 | 1.4%) account for the highest median family income in South Burlington with $250,001 per family, while 3-person families (1,136 | 23.1%) have the highest median income of $50,663 per family member.
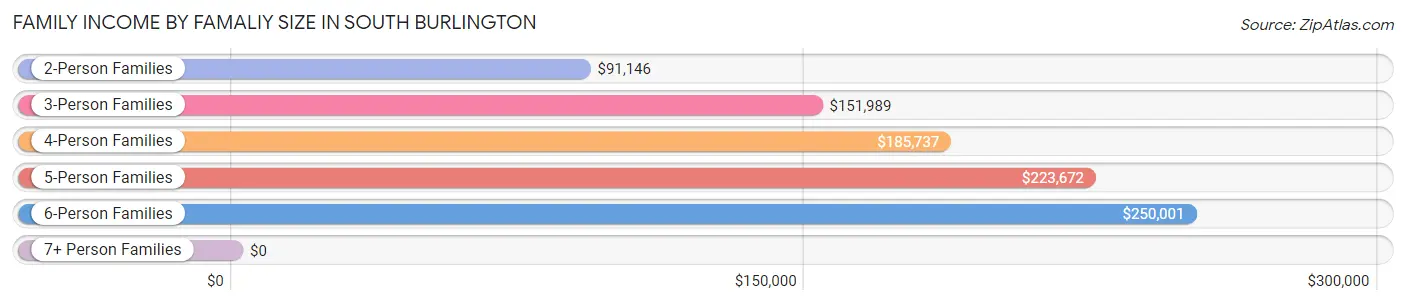
| Income Bracket | # Families | Median Income |
| 2-Person Families | 2,568 (52.1%) | $91,146 |
| 3-Person Families | 1,136 (23.1%) | $151,989 |
| 4-Person Families | 927 (18.8%) | $185,737 |
| 5-Person Families | 201 (4.1%) | $223,672 |
| 6-Person Families | 67 (1.4%) | $250,001 |
| 7+ Person Families | 28 (0.6%) | $0 |
| Total | 4,927 (100.0%) | $115,528 |
Family Income by Number of Earners in South Burlington
The median family income in South Burlington is $115,528, with families comprising 3+ earners (705) having the highest median family income of $171,716, while families with no earners (624) have the lowest median family income of $66,429, accounting for 14.3% and 12.7% of families, respectively.
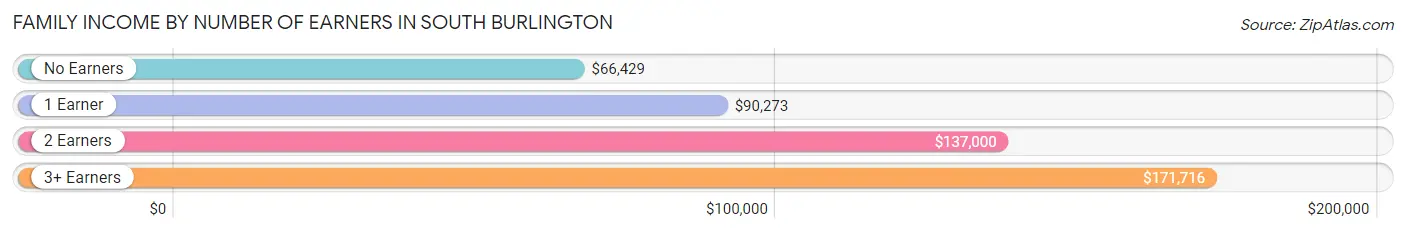
| Number of Earners | # Families | Median Income |
| No Earners | 624 (12.7%) | $66,429 |
| 1 Earner | 1,112 (22.6%) | $90,273 |
| 2 Earners | 2,486 (50.5%) | $137,000 |
| 3+ Earners | 705 (14.3%) | $171,716 |
| Total | 4,927 (100.0%) | $115,528 |
Household Income in South Burlington
Household Income Brackets in South Burlington
With 1,555 households falling in the category, the $100,000 to $149,999 income range is the most frequent in South Burlington, accounting for 17.7% of all households. In contrast, only 123 households (1.4%) fall into the $10,000 to $14,999 income bracket, making it the least populous group.
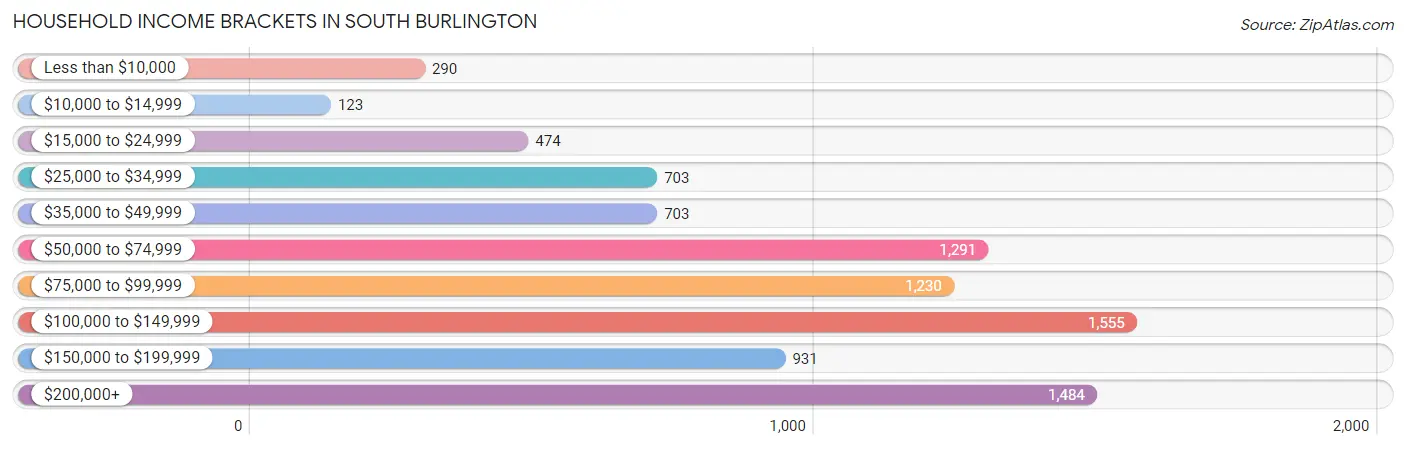
| Income Bracket | # Households | % Households |
| Less than $10,000 | 290 | 3.3% |
| $10,000 to $14,999 | 123 | 1.4% |
| $15,000 to $24,999 | 474 | 5.4% |
| $25,000 to $34,999 | 703 | 8.0% |
| $35,000 to $49,999 | 703 | 8.0% |
| $50,000 to $74,999 | 1,291 | 14.7% |
| $75,000 to $99,999 | 1,230 | 14.0% |
| $100,000 to $149,999 | 1,555 | 17.7% |
| $150,000 to $199,999 | 931 | 10.6% |
| $200,000+ | 1,484 | 16.9% |
Household Income by Householder Age in South Burlington
The median household income in South Burlington is $90,410, with the highest median household income of $113,854 found in the 45 to 64 years age bracket for the primary householder. A total of 2,945 households (33.5%) fall into this category. Meanwhile, the 15 to 24 years age bracket for the primary householder has the lowest median household income of $54,472, with 569 households (6.5%) in this group.
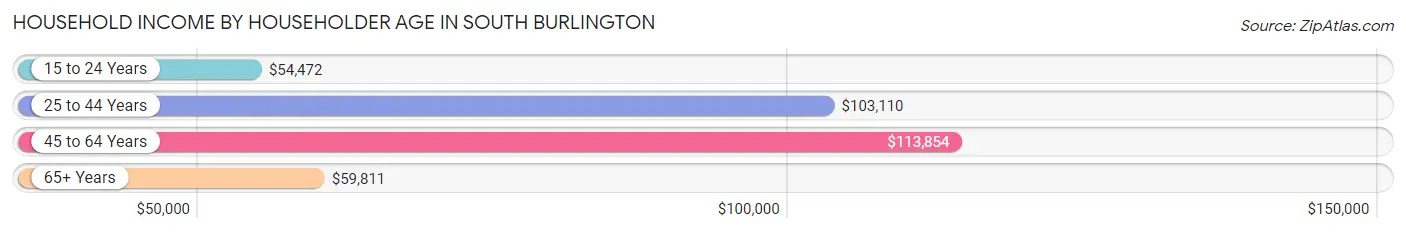
| Income Bracket | # Households | Median Income |
| 15 to 24 Years | 569 (6.5%) | $54,472 |
| 25 to 44 Years | 2,942 (33.5%) | $103,110 |
| 45 to 64 Years | 2,945 (33.5%) | $113,854 |
| 65+ Years | 2,327 (26.5%) | $59,811 |
| Total | 8,783 (100.0%) | $90,410 |
Poverty in South Burlington
Income Below Poverty by Sex and Age in South Burlington
With 6.4% poverty level for males and 9.6% for females among the residents of South Burlington, 25 to 34 year old males and 18 to 24 year old females are the most vulnerable to poverty, with 245 males (17.9%) and 475 females (40.4%) in their respective age groups living below the poverty level.
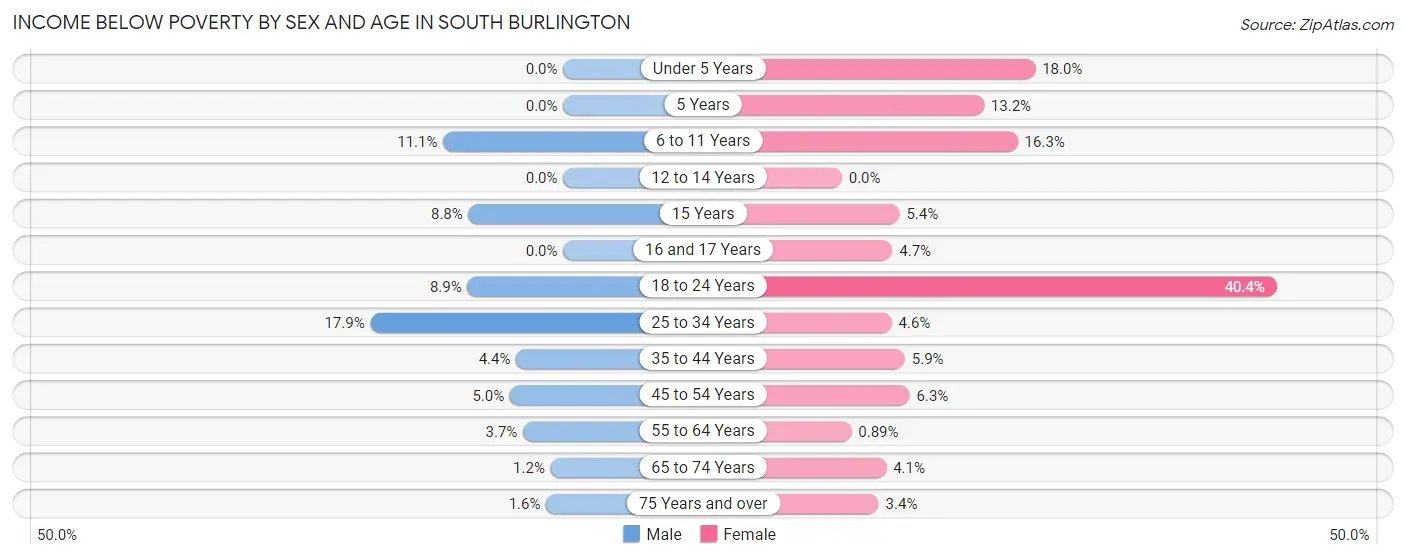
| Age Bracket | Male | Female |
| Under 5 Years | 0 (0.0%) | 77 (17.9%) |
| 5 Years | 0 (0.0%) | 19 (13.2%) |
| 6 to 11 Years | 91 (11.1%) | 79 (16.3%) |
| 12 to 14 Years | 0 (0.0%) | 0 (0.0%) |
| 15 Years | 8 (8.8%) | 10 (5.3%) |
| 16 and 17 Years | 0 (0.0%) | 10 (4.7%) |
| 18 to 24 Years | 87 (8.9%) | 475 (40.4%) |
| 25 to 34 Years | 245 (17.9%) | 65 (4.6%) |
| 35 to 44 Years | 65 (4.4%) | 85 (5.9%) |
| 45 to 54 Years | 62 (5.0%) | 80 (6.3%) |
| 55 to 64 Years | 48 (3.7%) | 12 (0.9%) |
| 65 to 74 Years | 10 (1.2%) | 34 (4.1%) |
| 75 Years and over | 8 (1.6%) | 35 (3.4%) |
| Total | 624 (6.4%) | 981 (9.6%) |
Income Above Poverty by Sex and Age in South Burlington
According to the poverty statistics in South Burlington, males aged under 5 years and females aged 12 to 14 years are the age groups that are most secure financially, with 100.0% of males and 100.0% of females in these age groups living above the poverty line.
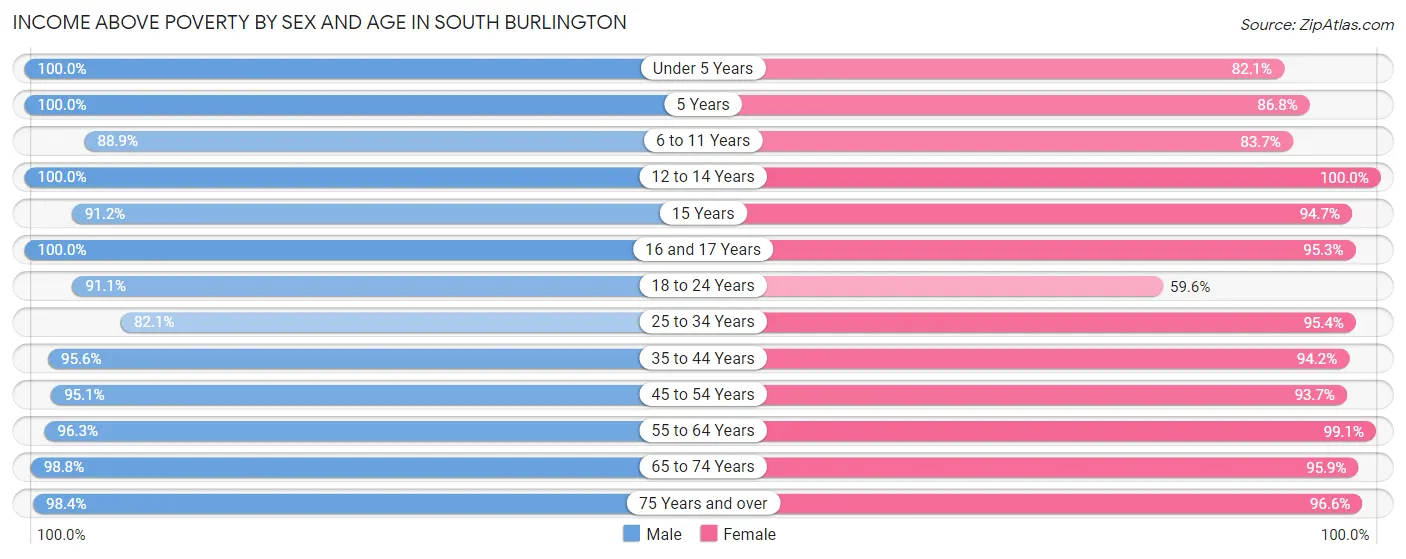
| Age Bracket | Male | Female |
| Under 5 Years | 451 (100.0%) | 352 (82.1%) |
| 5 Years | 80 (100.0%) | 125 (86.8%) |
| 6 to 11 Years | 726 (88.9%) | 405 (83.7%) |
| 12 to 14 Years | 292 (100.0%) | 313 (100.0%) |
| 15 Years | 83 (91.2%) | 177 (94.7%) |
| 16 and 17 Years | 259 (100.0%) | 203 (95.3%) |
| 18 to 24 Years | 892 (91.1%) | 702 (59.6%) |
| 25 to 34 Years | 1,124 (82.1%) | 1,343 (95.4%) |
| 35 to 44 Years | 1,421 (95.6%) | 1,368 (94.2%) |
| 45 to 54 Years | 1,190 (95.1%) | 1,192 (93.7%) |
| 55 to 64 Years | 1,240 (96.3%) | 1,335 (99.1%) |
| 65 to 74 Years | 844 (98.8%) | 792 (95.9%) |
| 75 Years and over | 498 (98.4%) | 989 (96.6%) |
| Total | 9,100 (93.6%) | 9,296 (90.4%) |
Income Below Poverty Among Married-Couple Families in South Burlington
The poverty statistics for married-couple families in South Burlington show that 0.8% or 31 of the total 3,947 families live below the poverty line. Families with 1 or 2 children have the highest poverty rate of 1.3%, comprising of 20 families. On the other hand, families with 3 or 4 children have the lowest poverty rate of 0.0%, which includes 0 families.
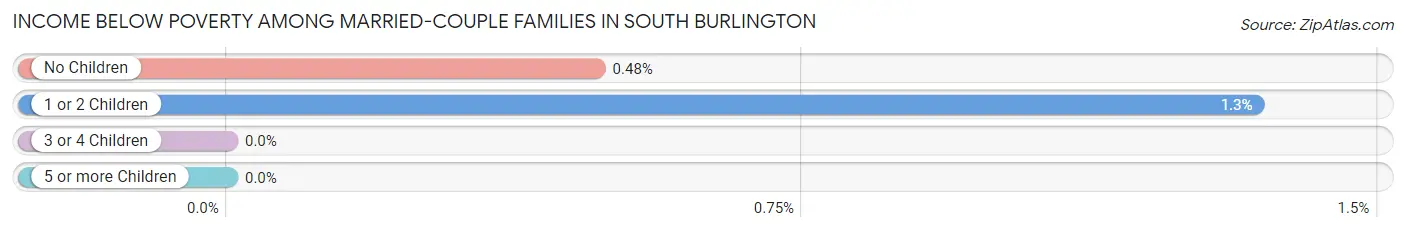
| Children | Above Poverty | Below Poverty |
| No Children | 2,280 (99.5%) | 11 (0.5%) |
| 1 or 2 Children | 1,475 (98.7%) | 20 (1.3%) |
| 3 or 4 Children | 161 (100.0%) | 0 (0.0%) |
| 5 or more Children | 0 (0.0%) | 0 (0.0%) |
| Total | 3,916 (99.2%) | 31 (0.8%) |
Income Below Poverty Among Single-Parent Households in South Burlington
According to the poverty data in South Burlington, 17.3% or 55 single-father households and 26.7% or 177 single-mother households are living below the poverty line. Among single-father households, those with 1 or 2 children have the highest poverty rate, with 55 households (28.1%) experiencing poverty. Likewise, among single-mother households, those with 1 or 2 children have the highest poverty rate, with 177 households (41.5%) falling below the poverty line.
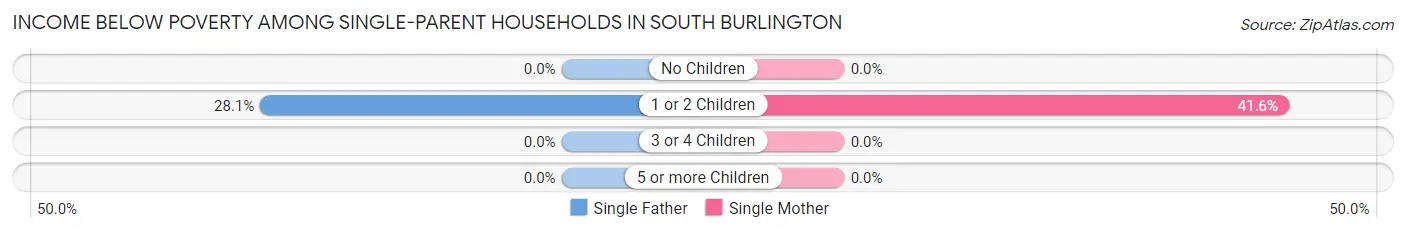
| Children | Single Father | Single Mother |
| No Children | 0 (0.0%) | 0 (0.0%) |
| 1 or 2 Children | 55 (28.1%) | 177 (41.5%) |
| 3 or 4 Children | 0 (0.0%) | 0 (0.0%) |
| 5 or more Children | 0 (0.0%) | 0 (0.0%) |
| Total | 55 (17.3%) | 177 (26.7%) |
Income Below Poverty Among Married-Couple vs Single-Parent Households in South Burlington
The poverty data for South Burlington shows that 31 of the married-couple family households (0.8%) and 232 of the single-parent households (23.7%) are living below the poverty level. Within the married-couple family households, those with 1 or 2 children have the highest poverty rate, with 20 households (1.3%) falling below the poverty line. Among the single-parent households, those with 1 or 2 children have the highest poverty rate, with 232 household (37.3%) living below poverty.
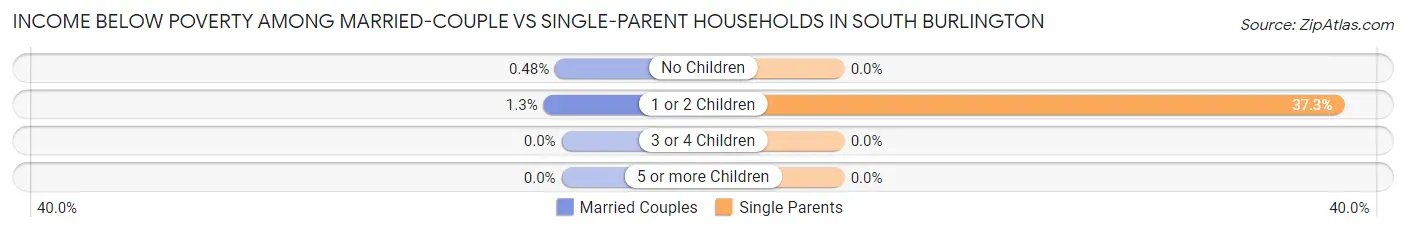
| Children | Married-Couple Families | Single-Parent Households |
| No Children | 11 (0.5%) | 0 (0.0%) |
| 1 or 2 Children | 20 (1.3%) | 232 (37.3%) |
| 3 or 4 Children | 0 (0.0%) | 0 (0.0%) |
| 5 or more Children | 0 (0.0%) | 0 (0.0%) |
| Total | 31 (0.8%) | 232 (23.7%) |
Race in South Burlington
The most populous races in South Burlington are White / Caucasian (16,637 | 82.2%), Asian (1,849 | 9.1%), and Two or more Races (1,116 | 5.5%).
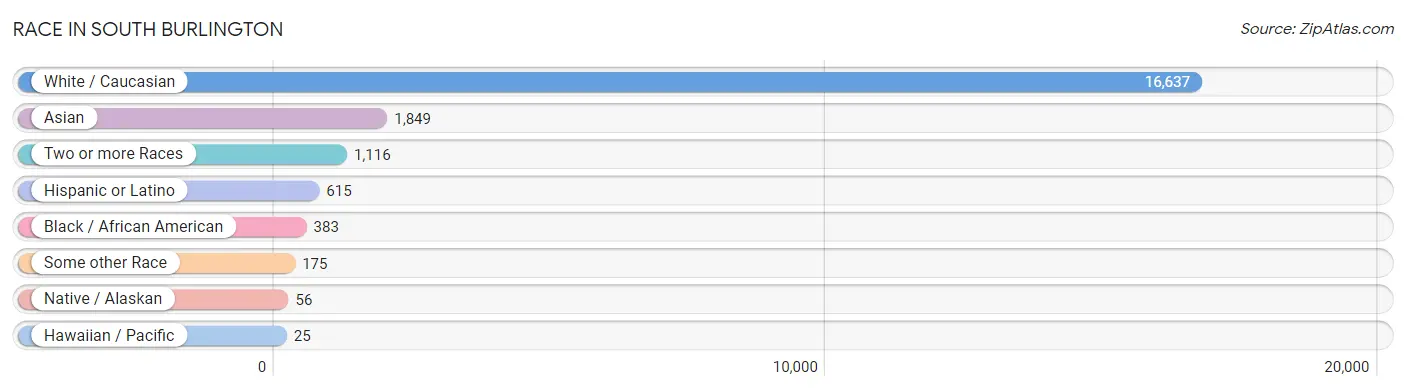
| Race | # Population | % Population |
| Asian | 1,849 | 9.1% |
| Black / African American | 383 | 1.9% |
| Hawaiian / Pacific | 25 | 0.1% |
| Hispanic or Latino | 615 | 3.0% |
| Native / Alaskan | 56 | 0.3% |
| White / Caucasian | 16,637 | 82.2% |
| Two or more Races | 1,116 | 5.5% |
| Some other Race | 175 | 0.9% |
| Total | 20,241 | 100.0% |
Ancestry in South Burlington
The most populous ancestries reported in South Burlington are Irish (2,989 | 14.8%), English (2,986 | 14.7%), French Canadian (1,940 | 9.6%), German (1,845 | 9.1%), and Italian (1,587 | 7.8%), together accounting for 56.1% of all South Burlington residents.
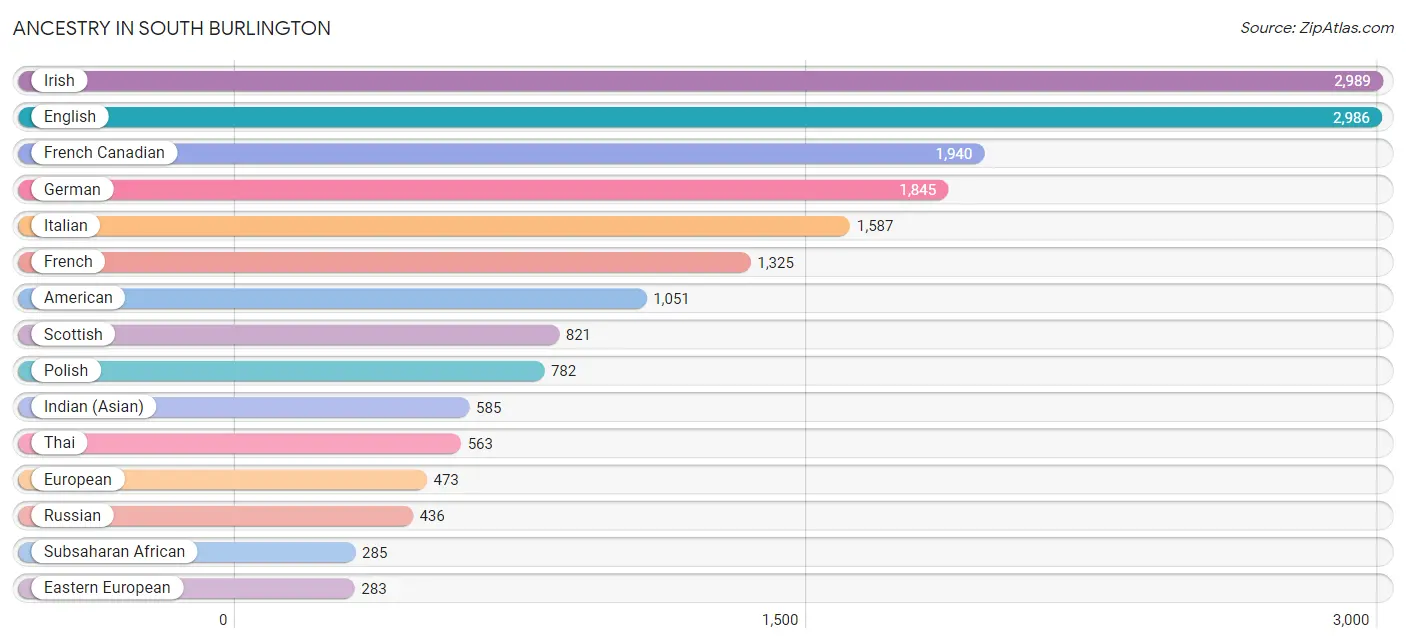
| Ancestry | # Population | % Population |
| African | 103 | 0.5% |
| American | 1,051 | 5.2% |
| Arab | 21 | 0.1% |
| Austrian | 43 | 0.2% |
| Belgian | 8 | 0.0% |
| Bhutanese | 81 | 0.4% |
| Blackfeet | 43 | 0.2% |
| British | 237 | 1.2% |
| Burmese | 84 | 0.4% |
| Canadian | 272 | 1.3% |
| Central American | 62 | 0.3% |
| Cheyenne | 16 | 0.1% |
| Colombian | 31 | 0.2% |
| Costa Rican | 55 | 0.3% |
| Croatian | 22 | 0.1% |
| Cuban | 151 | 0.7% |
| Czech | 14 | 0.1% |
| Danish | 20 | 0.1% |
| Dominican | 20 | 0.1% |
| Dutch | 150 | 0.7% |
| Eastern European | 283 | 1.4% |
| Ecuadorian | 13 | 0.1% |
| English | 2,986 | 14.7% |
| European | 473 | 2.3% |
| Filipino | 28 | 0.1% |
| Finnish | 26 | 0.1% |
| French | 1,325 | 6.6% |
| French Canadian | 1,940 | 9.6% |
| German | 1,845 | 9.1% |
| German Russian | 38 | 0.2% |
| Ghanaian | 10 | 0.1% |
| Greek | 162 | 0.8% |
| Haitian | 35 | 0.2% |
| Hungarian | 140 | 0.7% |
| Indian (Asian) | 585 | 2.9% |
| Indonesian | 228 | 1.1% |
| Irish | 2,989 | 14.8% |
| Iroquois | 32 | 0.2% |
| Italian | 1,587 | 7.8% |
| Jamaican | 96 | 0.5% |
| Korean | 200 | 1.0% |
| Latvian | 8 | 0.0% |
| Lebanese | 21 | 0.1% |
| Lithuanian | 133 | 0.7% |
| Macedonian | 36 | 0.2% |
| Mexican | 28 | 0.1% |
| Native Hawaiian | 5 | 0.0% |
| Nicaraguan | 7 | 0.0% |
| Nigerian | 17 | 0.1% |
| Northern European | 145 | 0.7% |
| Norwegian | 157 | 0.8% |
| Pakistani | 11 | 0.1% |
| Peruvian | 97 | 0.5% |
| Polish | 782 | 3.9% |
| Portuguese | 57 | 0.3% |
| Puerto Rican | 57 | 0.3% |
| Romanian | 18 | 0.1% |
| Russian | 436 | 2.1% |
| Scandinavian | 63 | 0.3% |
| Scotch-Irish | 108 | 0.5% |
| Scottish | 821 | 4.1% |
| Slavic | 4 | 0.0% |
| Slovak | 40 | 0.2% |
| Slovene | 19 | 0.1% |
| South American | 220 | 1.1% |
| South American Indian | 31 | 0.2% |
| Spaniard | 21 | 0.1% |
| Spanish | 27 | 0.1% |
| Sri Lankan | 20 | 0.1% |
| Subsaharan African | 285 | 1.4% |
| Swedish | 195 | 1.0% |
| Swiss | 40 | 0.2% |
| Thai | 563 | 2.8% |
| Turkish | 64 | 0.3% |
| Ukrainian | 85 | 0.4% |
| Uruguayan | 39 | 0.2% |
| Venezuelan | 40 | 0.2% |
| Welsh | 171 | 0.8% |
| Yugoslavian | 164 | 0.8% | View All 79 Rows |
Immigrants in South Burlington
The most numerous immigrant groups reported in South Burlington came from Asia (1,394 | 6.9%), South Central Asia (597 | 2.9%), Europe (494 | 2.4%), Eastern Asia (454 | 2.2%), and China (384 | 1.9%), together accounting for 16.4% of all South Burlington residents.
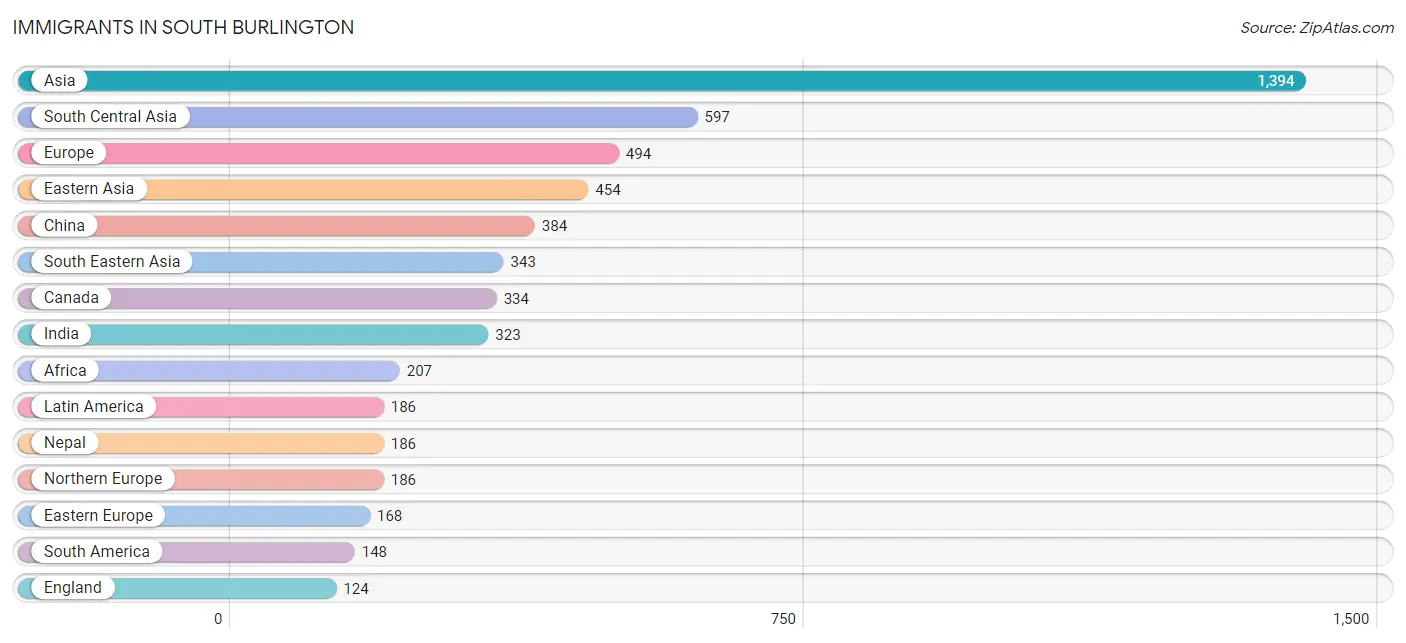
| Immigration Origin | # Population | % Population |
| Africa | 207 | 1.0% |
| Asia | 1,394 | 6.9% |
| Austria | 19 | 0.1% |
| Bosnia and Herzegovina | 52 | 0.3% |
| Canada | 334 | 1.7% |
| Caribbean | 17 | 0.1% |
| Central America | 21 | 0.1% |
| China | 384 | 1.9% |
| Colombia | 16 | 0.1% |
| Dominican Republic | 9 | 0.0% |
| Eastern Africa | 58 | 0.3% |
| Eastern Asia | 454 | 2.2% |
| Eastern Europe | 168 | 0.8% |
| Ecuador | 23 | 0.1% |
| England | 124 | 0.6% |
| Europe | 494 | 2.4% |
| France | 24 | 0.1% |
| Germany | 40 | 0.2% |
| Ghana | 65 | 0.3% |
| Greece | 21 | 0.1% |
| Hong Kong | 4 | 0.0% |
| India | 323 | 1.6% |
| Ireland | 13 | 0.1% |
| Jamaica | 8 | 0.0% |
| Japan | 8 | 0.0% |
| Korea | 62 | 0.3% |
| Latin America | 186 | 0.9% |
| Mexico | 14 | 0.1% |
| Middle Africa | 84 | 0.4% |
| Nepal | 186 | 0.9% |
| Netherlands | 18 | 0.1% |
| Nicaragua | 7 | 0.0% |
| Northern Europe | 186 | 0.9% |
| Peru | 60 | 0.3% |
| Philippines | 84 | 0.4% |
| Poland | 41 | 0.2% |
| Romania | 18 | 0.1% |
| Russia | 57 | 0.3% |
| South America | 148 | 0.7% |
| South Central Asia | 597 | 2.9% |
| South Eastern Asia | 343 | 1.7% |
| Southern Europe | 39 | 0.2% |
| Spain | 18 | 0.1% |
| Sri Lanka | 26 | 0.1% |
| Taiwan | 97 | 0.5% |
| Thailand | 11 | 0.1% |
| Uganda | 6 | 0.0% |
| Uruguay | 30 | 0.2% |
| Uzbekistan | 19 | 0.1% |
| Venezuela | 19 | 0.1% |
| Vietnam | 20 | 0.1% |
| Western Africa | 65 | 0.3% |
| Western Europe | 101 | 0.5% |
| Zaire | 84 | 0.4% | View All 54 Rows |
Sex and Age in South Burlington
Sex and Age in South Burlington
The most populous age groups in South Burlington are 35 to 39 Years (1,004 | 10.3%) for men and 20 to 24 Years (1,158 | 11.1%) for women.
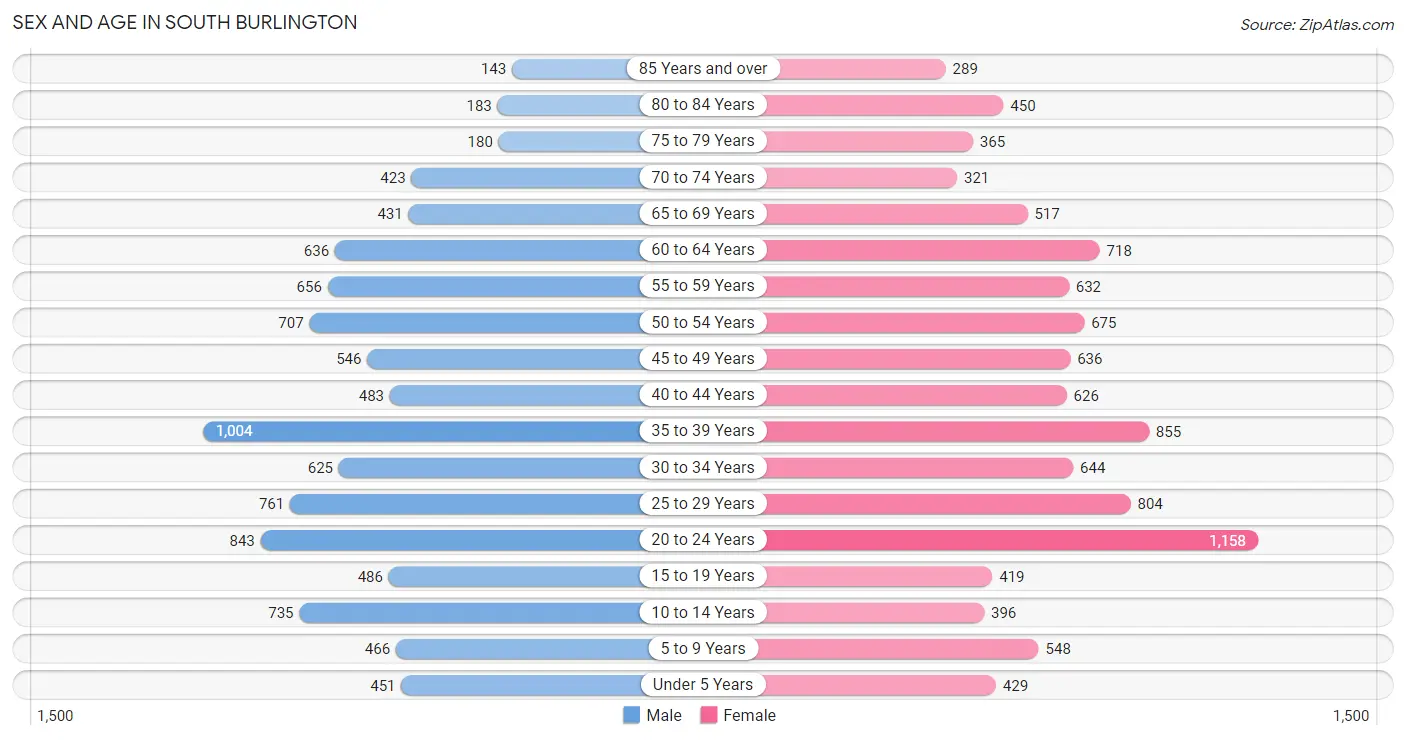
| Age Bracket | Male | Female |
| Under 5 Years | 451 (4.6%) | 429 (4.1%) |
| 5 to 9 Years | 466 (4.8%) | 548 (5.2%) |
| 10 to 14 Years | 735 (7.5%) | 396 (3.8%) |
| 15 to 19 Years | 486 (5.0%) | 419 (4.0%) |
| 20 to 24 Years | 843 (8.6%) | 1,158 (11.1%) |
| 25 to 29 Years | 761 (7.8%) | 804 (7.7%) |
| 30 to 34 Years | 625 (6.4%) | 644 (6.1%) |
| 35 to 39 Years | 1,004 (10.3%) | 855 (8.2%) |
| 40 to 44 Years | 483 (5.0%) | 626 (6.0%) |
| 45 to 49 Years | 546 (5.6%) | 636 (6.1%) |
| 50 to 54 Years | 707 (7.2%) | 675 (6.4%) |
| 55 to 59 Years | 656 (6.7%) | 632 (6.0%) |
| 60 to 64 Years | 636 (6.5%) | 718 (6.9%) |
| 65 to 69 Years | 431 (4.4%) | 517 (4.9%) |
| 70 to 74 Years | 423 (4.3%) | 321 (3.1%) |
| 75 to 79 Years | 180 (1.8%) | 365 (3.5%) |
| 80 to 84 Years | 183 (1.9%) | 450 (4.3%) |
| 85 Years and over | 143 (1.5%) | 289 (2.8%) |
| Total | 9,759 (100.0%) | 10,482 (100.0%) |
Families and Households in South Burlington
Median Family Size in South Burlington
The median family size in South Burlington is 2.80 persons per family, with married-couple families (3,947 | 80.1%) accounting for the largest median family size of 2.87 persons per family. On the other hand, single female/mother families (662 | 13.4%) represent the smallest median family size with 2.42 persons per family.
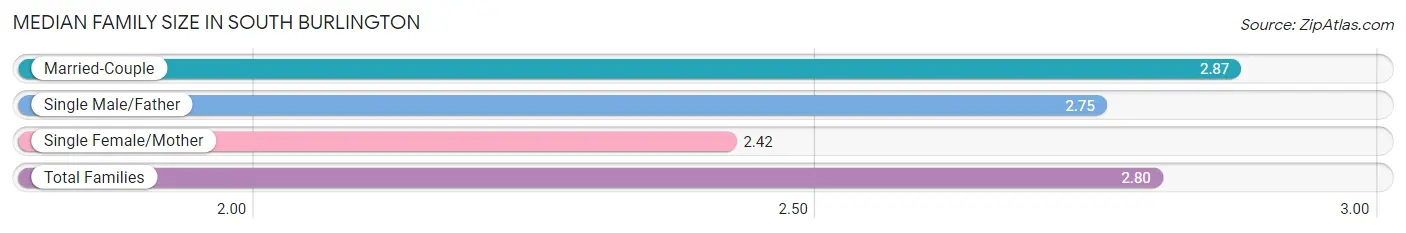
| Family Type | # Families | Family Size |
| Married-Couple | 3,947 (80.1%) | 2.87 |
| Single Male/Father | 318 (6.5%) | 2.75 |
| Single Female/Mother | 662 (13.4%) | 2.42 |
| Total Families | 4,927 (100.0%) | 2.80 |
Median Household Size in South Burlington
The median household size in South Burlington is 2.27 persons per household, with single male/father households (318 | 3.6%) accounting for the largest median household size of 3.2 persons per household. non-family households (3,856 | 43.9%) represent the smallest median household size with 1.49 persons per household.
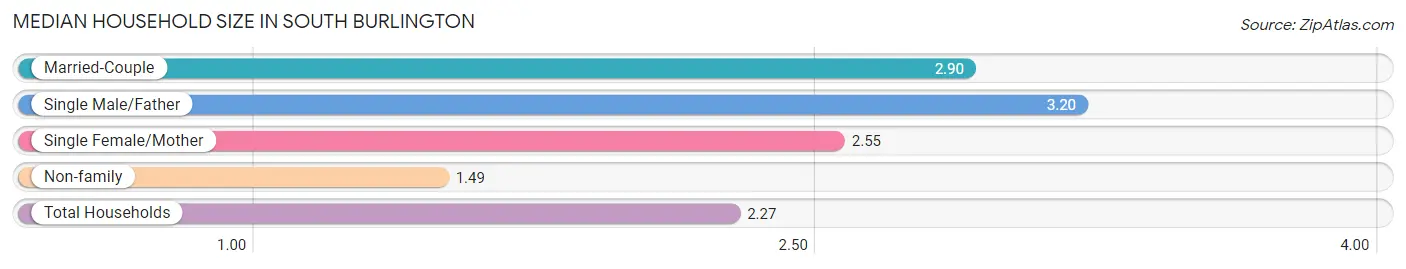
| Household Type | # Households | Household Size |
| Married-Couple | 3,947 (44.9%) | 2.90 |
| Single Male/Father | 318 (3.6%) | 3.20 |
| Single Female/Mother | 662 (7.5%) | 2.55 |
| Non-family | 3,856 (43.9%) | 1.49 |
| Total Households | 8,783 (100.0%) | 2.27 |
Household Size by Marriage Status in South Burlington
Out of a total of 8,783 households in South Burlington, 4,927 (56.1%) are family households, while 3,856 (43.9%) are nonfamily households. The most numerous type of family households are 2-person households, comprising 2,387, and the most common type of nonfamily households are 1-person households, comprising 2,572.
| Household Size | Family Households | Nonfamily Households |
| 1-Person Households | - | 2,572 (29.3%) |
| 2-Person Households | 2,387 (27.2%) | 971 (11.1%) |
| 3-Person Households | 1,265 (14.4%) | 104 (1.2%) |
| 4-Person Households | 864 (9.8%) | 137 (1.6%) |
| 5-Person Households | 316 (3.6%) | 0 (0.0%) |
| 6-Person Households | 67 (0.8%) | 72 (0.8%) |
| 7+ Person Households | 28 (0.3%) | 0 (0.0%) |
| Total | 4,927 (56.1%) | 3,856 (43.9%) |
Female Fertility in South Burlington
Fertility by Age in South Burlington
Average fertility rate in South Burlington is 31.0 births per 1,000 women. Women in the age bracket of 20 to 34 years have the highest fertility rate with 54.0 births per 1,000 women. Women in the age bracket of 20 to 34 years acount for 85.9% of all women with births.
| Age Bracket | Women with Births | Births / 1,000 Women |
| 15 to 19 years | 0 (0.0%) | 0.0 |
| 20 to 34 years | 140 (85.9%) | 54.0 |
| 35 to 50 years | 23 (14.1%) | 10.0 |
| Total | 163 (100.0%) | 31.0 |
Fertility by Age by Marriage Status in South Burlington
| Age Bracket | Married | Unmarried |
| 15 to 19 years | 0 (0.0%) | 0 (0.0%) |
| 20 to 34 years | 140 (100.0%) | 0 (0.0%) |
| 35 to 50 years | 23 (100.0%) | 0 (0.0%) |
| Total | 163 (100.0%) | 0 (0.0%) |
Fertility by Education in South Burlington
| Educational Attainment | Women with Births | Births / 1,000 Women |
| Less than High School | 0 (0.0%) | 0.0 |
| High School Diploma | 0 (0.0%) | 0.0 |
| College or Associate's Degree | 64 (39.3%) | 55.0 |
| Bachelor's Degree | 88 (54.0%) | 42.0 |
| Graduate Degree | 11 (6.8%) | 10.0 |
| Total | 163 (100.0%) | 31.0 |
Fertility by Education by Marriage Status in South Burlington
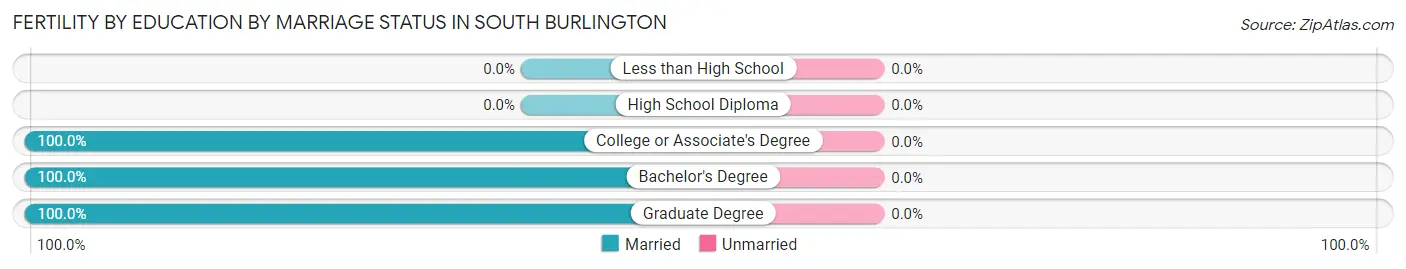
| Educational Attainment | Married | Unmarried |
| Less than High School | 0 (0.0%) | 0 (0.0%) |
| High School Diploma | 0 (0.0%) | 0 (0.0%) |
| College or Associate's Degree | 64 (100.0%) | 0 (0.0%) |
| Bachelor's Degree | 88 (100.0%) | 0 (0.0%) |
| Graduate Degree | 11 (100.0%) | 0 (0.0%) |
| Total | 163 (100.0%) | 0 (0.0%) |
Employment Characteristics in South Burlington
Employment by Class of Employer in South Burlington
Among the 11,778 employed individuals in South Burlington, private company employees (7,117 | 60.4%), not-for-profit organizations (2,414 | 20.5%), and local government employees (634 | 5.4%) make up the most common classes of employment.
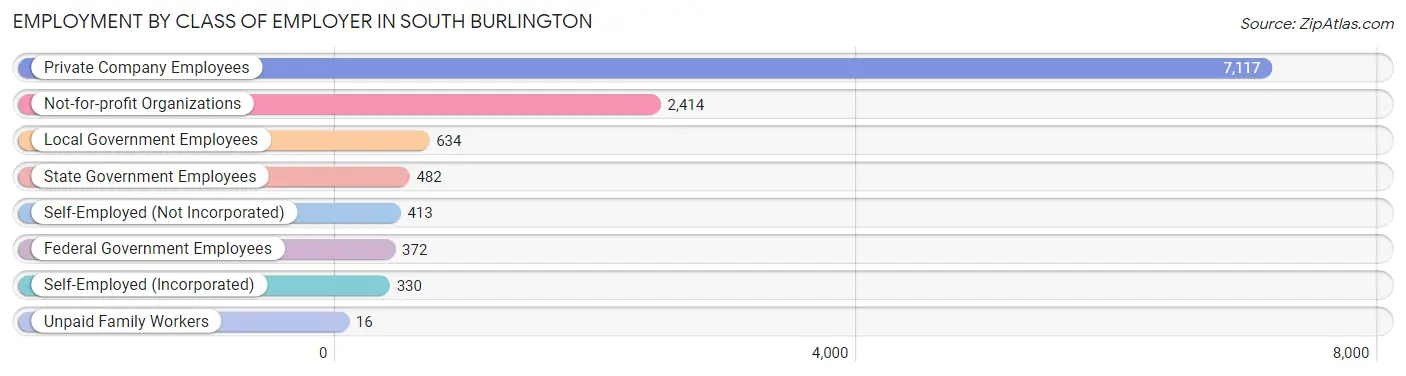
| Employer Class | # Employees | % Employees |
| Private Company Employees | 7,117 | 60.4% |
| Self-Employed (Incorporated) | 330 | 2.8% |
| Self-Employed (Not Incorporated) | 413 | 3.5% |
| Not-for-profit Organizations | 2,414 | 20.5% |
| Local Government Employees | 634 | 5.4% |
| State Government Employees | 482 | 4.1% |
| Federal Government Employees | 372 | 3.2% |
| Unpaid Family Workers | 16 | 0.1% |
| Total | 11,778 | 100.0% |
Employment Status by Age in South Burlington
According to the labor force statistics for South Burlington, out of the total population over 16 years of age (16,938), 74.5% or 12,619 individuals are in the labor force, with 5.4% or 681 of them unemployed. The age group with the highest labor force participation rate is 20 to 24 years, with 96.8% or 1,937 individuals in the labor force. Within the labor force, the 16 to 19 years age range has the highest percentage of unemployed individuals, with 7.7% or 29 of them being unemployed.
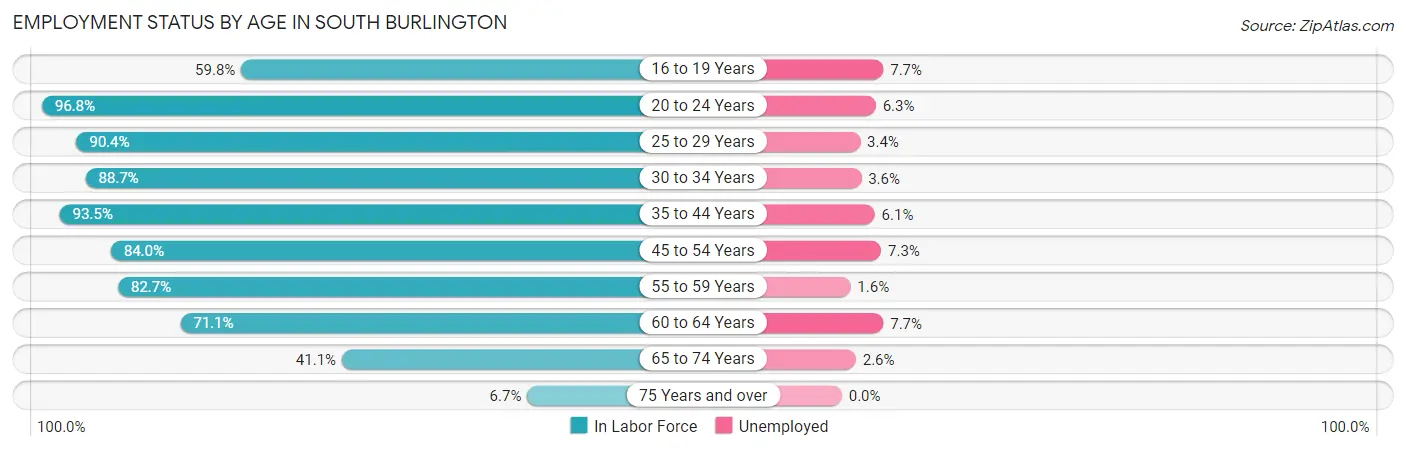
| Age Bracket | In Labor Force | Unemployed |
| 16 to 19 Years | 375 (59.8%) | 29 (7.7%) |
| 20 to 24 Years | 1,937 (96.8%) | 122 (6.3%) |
| 25 to 29 Years | 1,415 (90.4%) | 48 (3.4%) |
| 30 to 34 Years | 1,126 (88.7%) | 41 (3.6%) |
| 35 to 44 Years | 2,775 (93.5%) | 169 (6.1%) |
| 45 to 54 Years | 2,154 (84.0%) | 157 (7.3%) |
| 55 to 59 Years | 1,065 (82.7%) | 17 (1.6%) |
| 60 to 64 Years | 963 (71.1%) | 74 (7.7%) |
| 65 to 74 Years | 695 (41.1%) | 18 (2.6%) |
| 75 Years and over | 108 (6.7%) | 0 (0.0%) |
| Total | 12,619 (74.5%) | 681 (5.4%) |
Employment Status by Educational Attainment in South Burlington
According to labor force statistics for South Burlington, 86.3% of individuals (9,500) out of the total population between 25 and 64 years of age (11,008) are in the labor force, with 5.3% or 504 of them being unemployed. The group with the highest labor force participation rate are those with the educational attainment of bachelor's degree or higher, with 90.8% or 6,573 individuals in the labor force. Within the labor force, individuals with less than high school education have the highest percentage of unemployment, with 23.8% or 29 of them being unemployed.
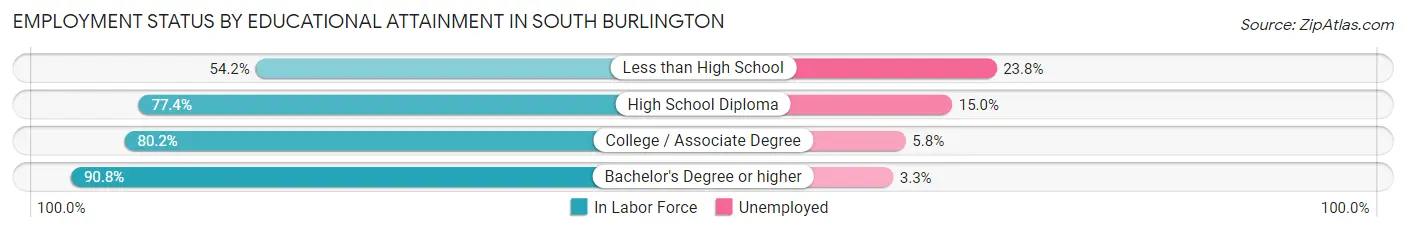
| Educational Attainment | In Labor Force | Unemployed |
| Less than High School | 122 (54.2%) | 54 (23.8%) |
| High School Diploma | 1,083 (77.4%) | 210 (15.0%) |
| College / Associate Degree | 1,720 (80.2%) | 124 (5.8%) |
| Bachelor's Degree or higher | 6,573 (90.8%) | 239 (3.3%) |
| Total | 9,500 (86.3%) | 583 (5.3%) |
Employment Occupations by Sex in South Burlington
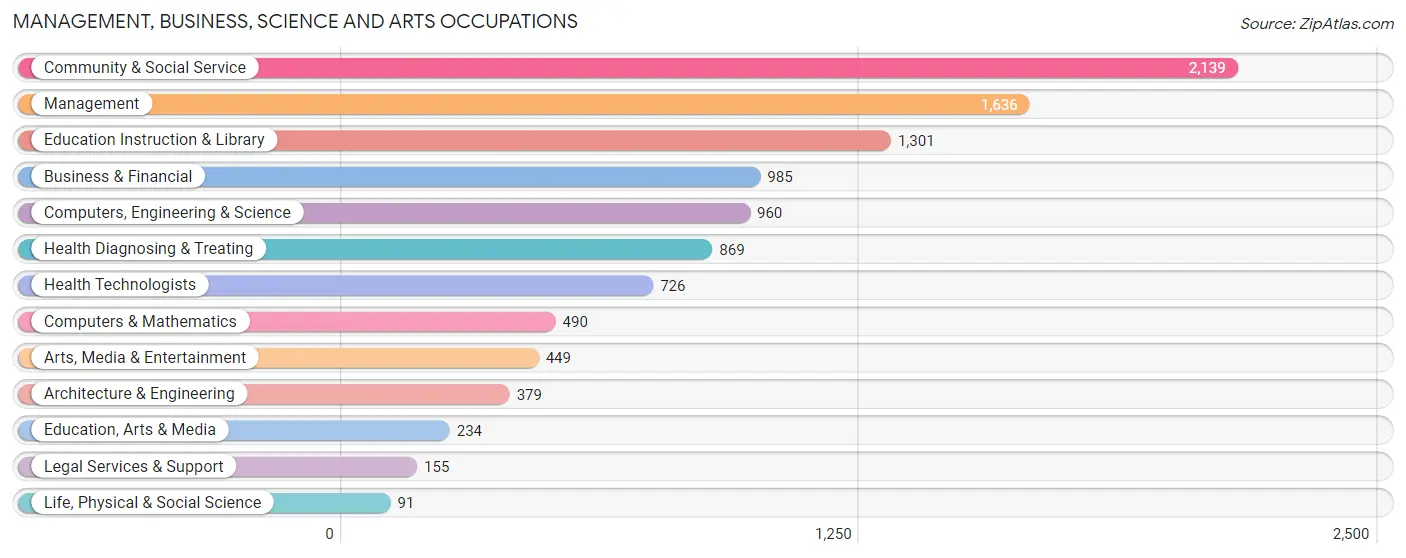
Management, Business, Science and Arts Occupations
The most common Management, Business, Science and Arts occupations in South Burlington are Community & Social Service (2,139 | 18.0%), Management (1,636 | 13.8%), Education Instruction & Library (1,301 | 10.9%), Business & Financial (985 | 8.3%), and Computers, Engineering & Science (960 | 8.1%).
Management, Business, Science and Arts Occupations by Sex
Within the Management, Business, Science and Arts occupations in South Burlington, the most male-oriented occupations are Architecture & Engineering (86.5%), Computers & Mathematics (81.4%), and Computers, Engineering & Science (79.8%), while the most female-oriented occupations are Health Diagnosing & Treating (81.0%), Health Technologists (80.7%), and Arts, Media & Entertainment (74.6%).
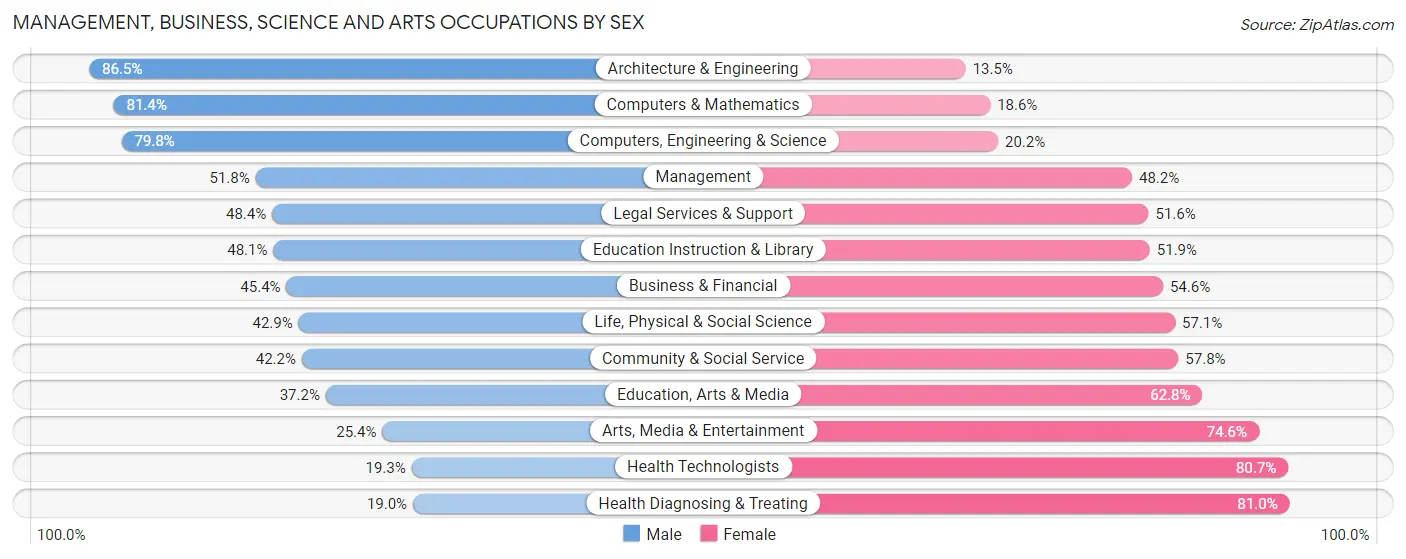
| Occupation | Male | Female |
| Management | 848 (51.8%) | 788 (48.2%) |
| Business & Financial | 447 (45.4%) | 538 (54.6%) |
| Computers, Engineering & Science | 766 (79.8%) | 194 (20.2%) |
| Computers & Mathematics | 399 (81.4%) | 91 (18.6%) |
| Architecture & Engineering | 328 (86.5%) | 51 (13.5%) |
| Life, Physical & Social Science | 39 (42.9%) | 52 (57.1%) |
| Community & Social Service | 902 (42.2%) | 1,237 (57.8%) |
| Education, Arts & Media | 87 (37.2%) | 147 (62.8%) |
| Legal Services & Support | 75 (48.4%) | 80 (51.6%) |
| Education Instruction & Library | 626 (48.1%) | 675 (51.9%) |
| Arts, Media & Entertainment | 114 (25.4%) | 335 (74.6%) |
| Health Diagnosing & Treating | 165 (19.0%) | 704 (81.0%) |
| Health Technologists | 140 (19.3%) | 586 (80.7%) |
| Total (Category) | 3,128 (47.5%) | 3,461 (52.5%) |
| Total (Overall) | 5,850 (49.2%) | 6,045 (50.8%) |
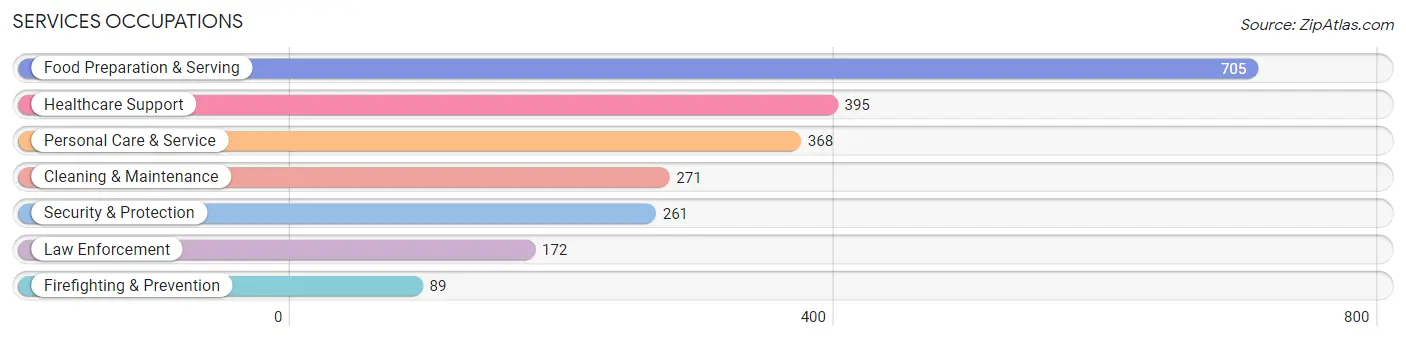
Services Occupations
The most common Services occupations in South Burlington are Food Preparation & Serving (705 | 5.9%), Healthcare Support (395 | 3.3%), Personal Care & Service (368 | 3.1%), Cleaning & Maintenance (271 | 2.3%), and Security & Protection (261 | 2.2%).
Services Occupations by Sex
Within the Services occupations in South Burlington, the most male-oriented occupations are Law Enforcement (100.0%), Security & Protection (85.8%), and Food Preparation & Serving (73.3%), while the most female-oriented occupations are Personal Care & Service (80.4%), Healthcare Support (55.4%), and Firefighting & Prevention (41.6%).
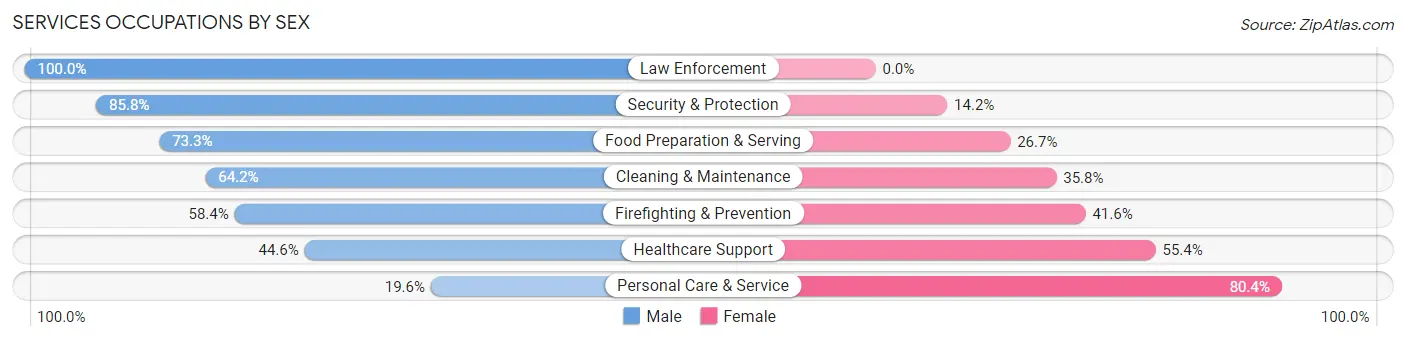
| Occupation | Male | Female |
| Healthcare Support | 176 (44.6%) | 219 (55.4%) |
| Security & Protection | 224 (85.8%) | 37 (14.2%) |
| Firefighting & Prevention | 52 (58.4%) | 37 (41.6%) |
| Law Enforcement | 172 (100.0%) | 0 (0.0%) |
| Food Preparation & Serving | 517 (73.3%) | 188 (26.7%) |
| Cleaning & Maintenance | 174 (64.2%) | 97 (35.8%) |
| Personal Care & Service | 72 (19.6%) | 296 (80.4%) |
| Total (Category) | 1,163 (58.2%) | 837 (41.8%) |
| Total (Overall) | 5,850 (49.2%) | 6,045 (50.8%) |
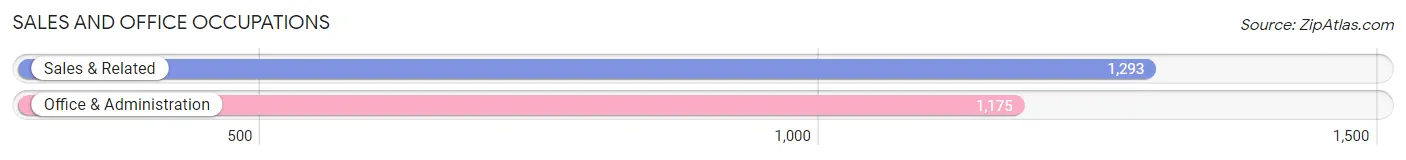
Sales and Office Occupations
The most common Sales and Office occupations in South Burlington are Sales & Related (1,293 | 10.9%), and Office & Administration (1,175 | 9.9%).
Sales and Office Occupations by Sex
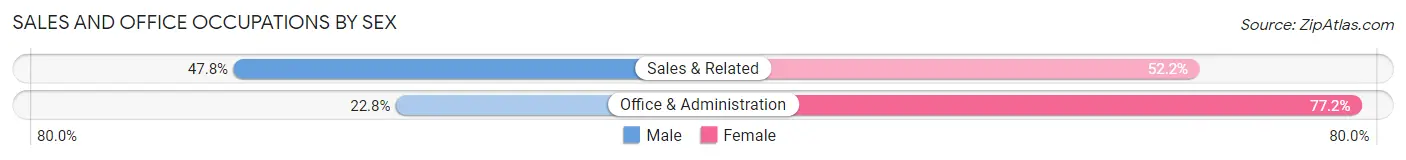
| Occupation | Male | Female |
| Sales & Related | 618 (47.8%) | 675 (52.2%) |
| Office & Administration | 268 (22.8%) | 907 (77.2%) |
| Total (Category) | 886 (35.9%) | 1,582 (64.1%) |
| Total (Overall) | 5,850 (49.2%) | 6,045 (50.8%) |
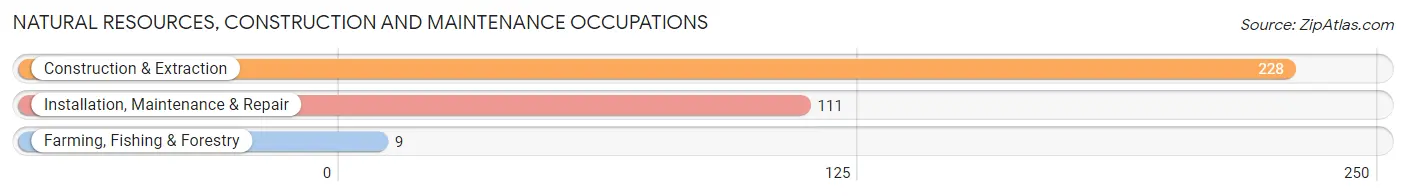
Natural Resources, Construction and Maintenance Occupations
The most common Natural Resources, Construction and Maintenance occupations in South Burlington are Construction & Extraction (228 | 1.9%), Installation, Maintenance & Repair (111 | 0.9%), and Farming, Fishing & Forestry (9 | 0.1%).
Natural Resources, Construction and Maintenance Occupations by Sex
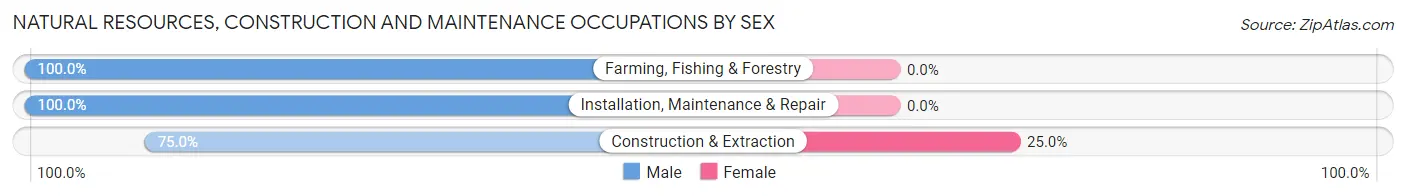
| Occupation | Male | Female |
| Farming, Fishing & Forestry | 9 (100.0%) | 0 (0.0%) |
| Construction & Extraction | 171 (75.0%) | 57 (25.0%) |
| Installation, Maintenance & Repair | 111 (100.0%) | 0 (0.0%) |
| Total (Category) | 291 (83.6%) | 57 (16.4%) |
| Total (Overall) | 5,850 (49.2%) | 6,045 (50.8%) |
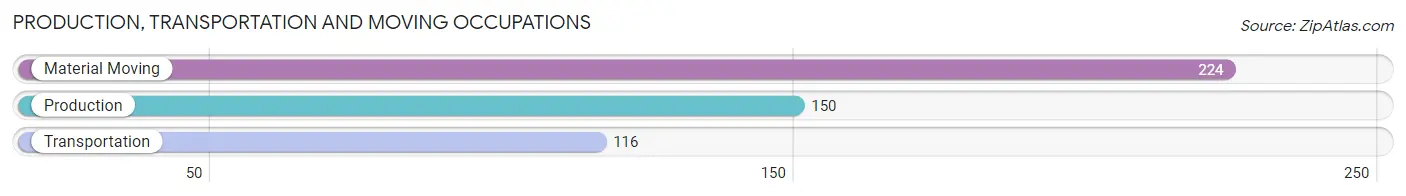
Production, Transportation and Moving Occupations
The most common Production, Transportation and Moving occupations in South Burlington are Material Moving (224 | 1.9%), Production (150 | 1.3%), and Transportation (116 | 1.0%).
Production, Transportation and Moving Occupations by Sex
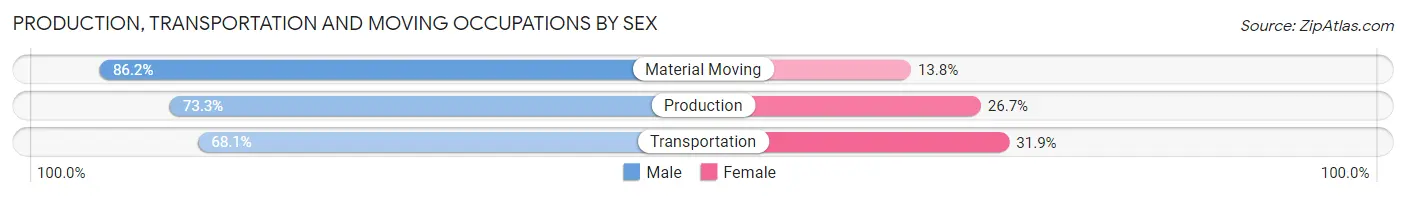
| Occupation | Male | Female |
| Production | 110 (73.3%) | 40 (26.7%) |
| Transportation | 79 (68.1%) | 37 (31.9%) |
| Material Moving | 193 (86.2%) | 31 (13.8%) |
| Total (Category) | 382 (78.0%) | 108 (22.0%) |
| Total (Overall) | 5,850 (49.2%) | 6,045 (50.8%) |
Employment Industries by Sex in South Burlington
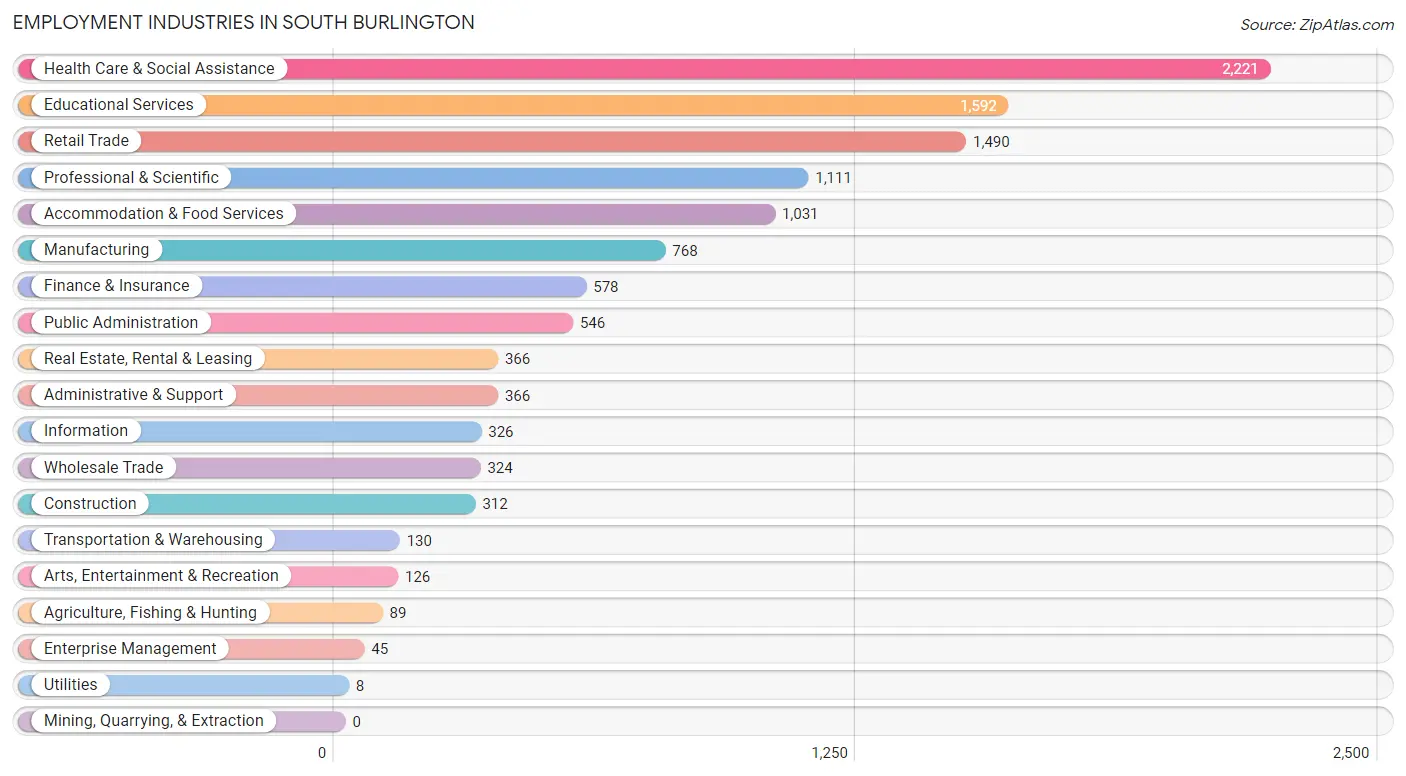
Employment Industries in South Burlington
The major employment industries in South Burlington include Health Care & Social Assistance (2,221 | 18.7%), Educational Services (1,592 | 13.4%), Retail Trade (1,490 | 12.5%), Professional & Scientific (1,111 | 9.3%), and Accommodation & Food Services (1,031 | 8.7%).
Employment Industries by Sex in South Burlington
The South Burlington industries that see more men than women are Utilities (100.0%), Transportation & Warehousing (86.9%), and Agriculture, Fishing & Hunting (85.4%), whereas the industries that tend to have a higher number of women are Enterprise Management (100.0%), Administrative & Support (89.9%), and Arts, Entertainment & Recreation (88.9%).
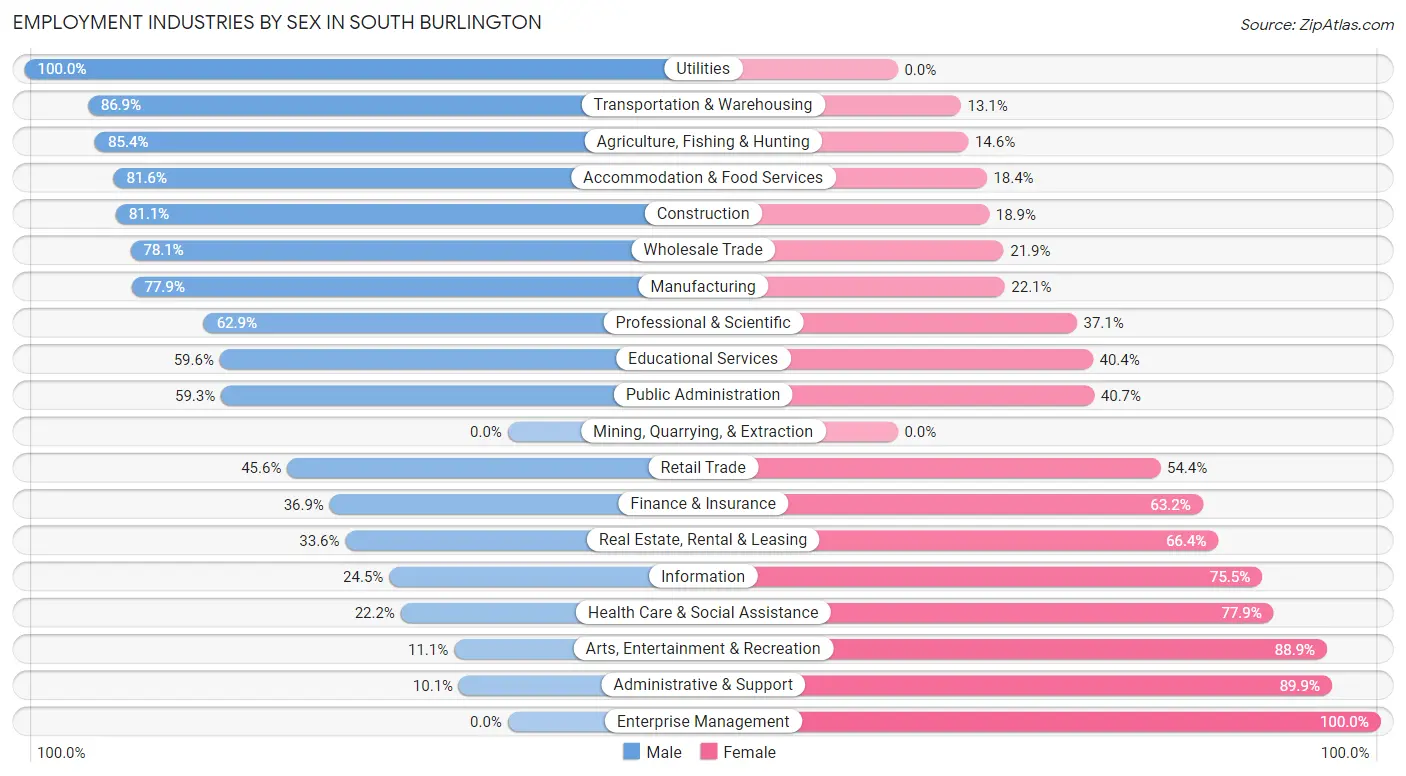
| Industry | Male | Female |
| Agriculture, Fishing & Hunting | 76 (85.4%) | 13 (14.6%) |
| Mining, Quarrying, & Extraction | 0 (0.0%) | 0 (0.0%) |
| Construction | 253 (81.1%) | 59 (18.9%) |
| Manufacturing | 598 (77.9%) | 170 (22.1%) |
| Wholesale Trade | 253 (78.1%) | 71 (21.9%) |
| Retail Trade | 680 (45.6%) | 810 (54.4%) |
| Transportation & Warehousing | 113 (86.9%) | 17 (13.1%) |
| Utilities | 8 (100.0%) | 0 (0.0%) |
| Information | 80 (24.5%) | 246 (75.5%) |
| Finance & Insurance | 213 (36.8%) | 365 (63.1%) |
| Real Estate, Rental & Leasing | 123 (33.6%) | 243 (66.4%) |
| Professional & Scientific | 699 (62.9%) | 412 (37.1%) |
| Enterprise Management | 0 (0.0%) | 45 (100.0%) |
| Administrative & Support | 37 (10.1%) | 329 (89.9%) |
| Educational Services | 949 (59.6%) | 643 (40.4%) |
| Health Care & Social Assistance | 492 (22.2%) | 1,729 (77.8%) |
| Arts, Entertainment & Recreation | 14 (11.1%) | 112 (88.9%) |
| Accommodation & Food Services | 841 (81.6%) | 190 (18.4%) |
| Public Administration | 324 (59.3%) | 222 (40.7%) |
| Total | 5,850 (49.2%) | 6,045 (50.8%) |
Education in South Burlington
School Enrollment in South Burlington
The most common levels of schooling among the 4,596 students in South Burlington are college / undergraduate (966 | 21.0%), middle school (889 | 19.3%), and high school (840 | 18.3%).
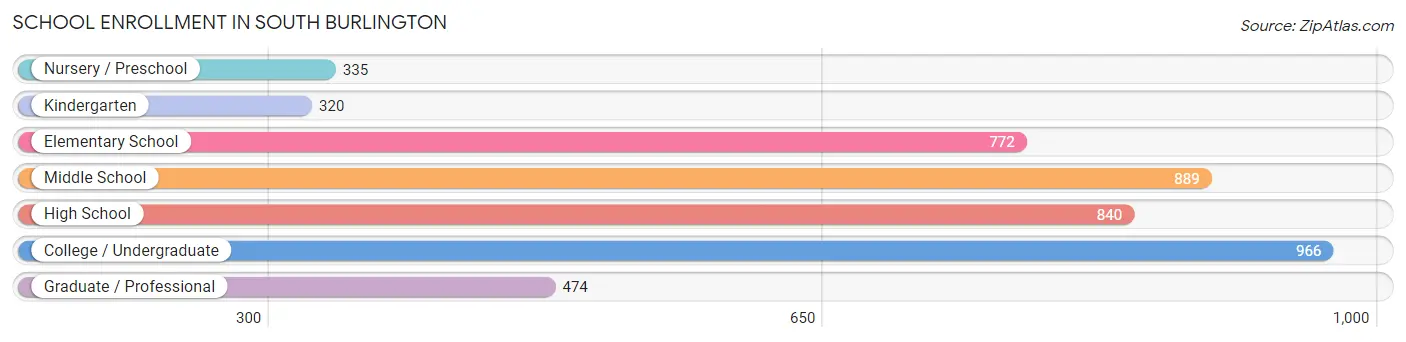
| School Level | # Students | % Students |
| Nursery / Preschool | 335 | 7.3% |
| Kindergarten | 320 | 7.0% |
| Elementary School | 772 | 16.8% |
| Middle School | 889 | 19.3% |
| High School | 840 | 18.3% |
| College / Undergraduate | 966 | 21.0% |
| Graduate / Professional | 474 | 10.3% |
| Total | 4,596 | 100.0% |
School Enrollment by Age by Funding Source in South Burlington
Out of a total of 4,596 students who are enrolled in schools in South Burlington, 791 (17.2%) attend a private institution, while the remaining 3,805 (82.8%) are enrolled in public schools. The age group of 3 to 4 year olds has the highest likelihood of being enrolled in private schools, with 231 (83.7% in the age bracket) enrolled. Conversely, the age group of 15 to 17 year olds has the lowest likelihood of being enrolled in a private school, with 725 (98.4% in the age bracket) attending a public institution.
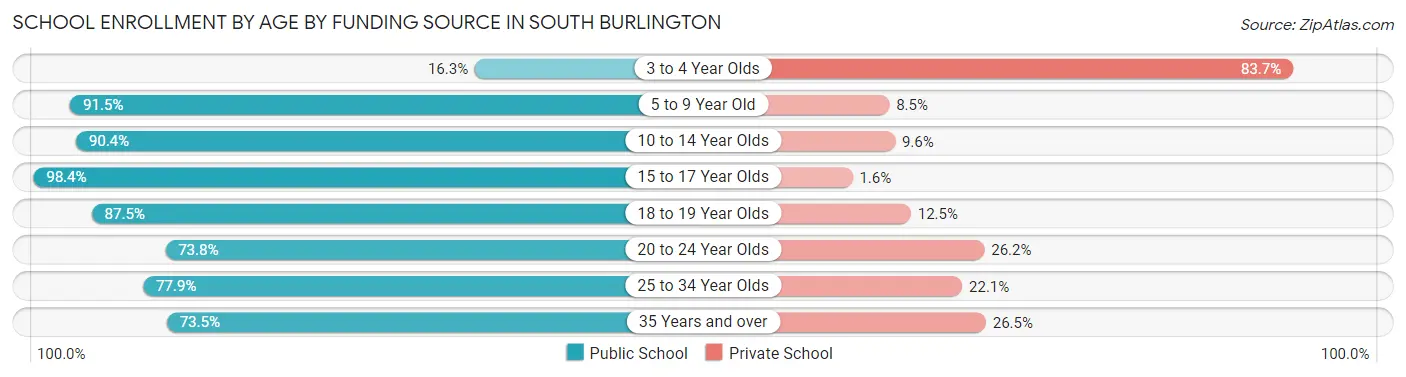
| Age Bracket | Public School | Private School |
| 3 to 4 Year Olds | 45 (16.3%) | 231 (83.7%) |
| 5 to 9 Year Old | 896 (91.5%) | 83 (8.5%) |
| 10 to 14 Year Olds | 1,003 (90.4%) | 106 (9.6%) |
| 15 to 17 Year Olds | 725 (98.4%) | 12 (1.6%) |
| 18 to 19 Year Olds | 105 (87.5%) | 15 (12.5%) |
| 20 to 24 Year Olds | 552 (73.8%) | 196 (26.2%) |
| 25 to 34 Year Olds | 318 (77.9%) | 90 (22.1%) |
| 35 Years and over | 161 (73.5%) | 58 (26.5%) |
| Total | 3,805 (82.8%) | 791 (17.2%) |
Educational Attainment by Field of Study in South Burlington
Business (1,463 | 14.5%), science & technology (1,068 | 10.6%), social sciences (976 | 9.7%), education (959 | 9.5%), and bio, nature & agricultural (892 | 8.9%) are the most common fields of study among 10,062 individuals in South Burlington who have obtained a bachelor's degree or higher.
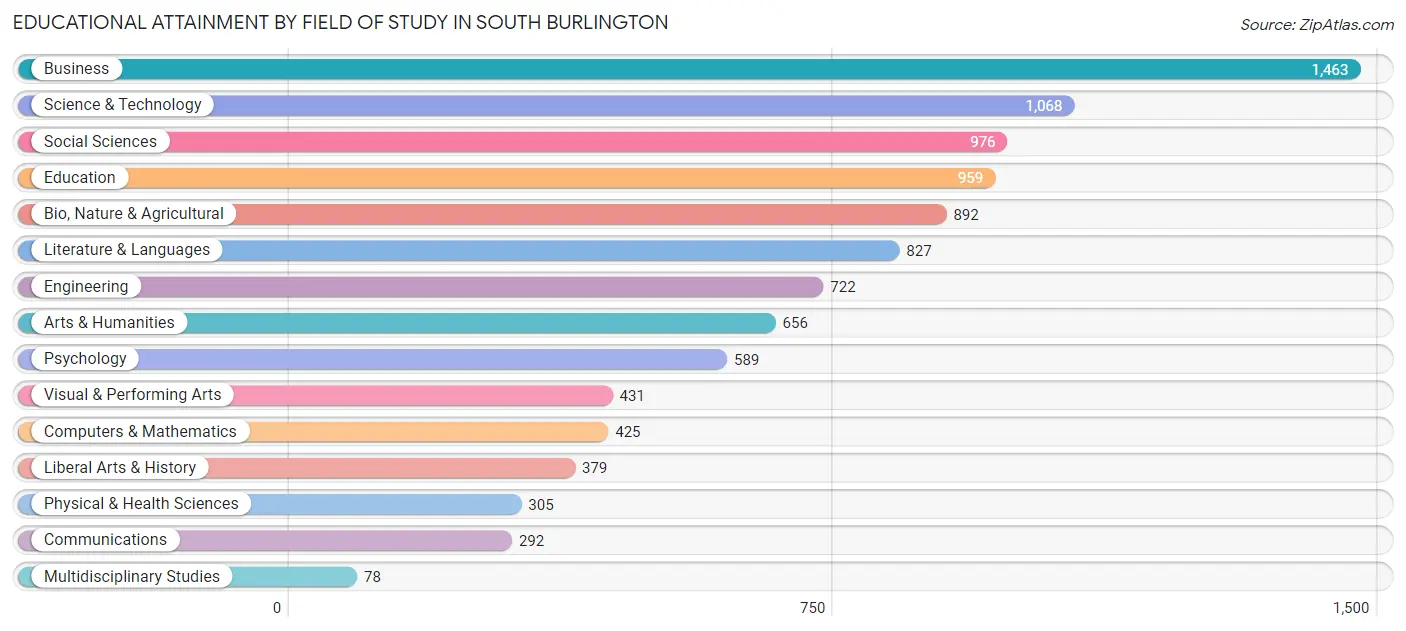
| Field of Study | # Graduates | % Graduates |
| Computers & Mathematics | 425 | 4.2% |
| Bio, Nature & Agricultural | 892 | 8.9% |
| Physical & Health Sciences | 305 | 3.0% |
| Psychology | 589 | 5.9% |
| Social Sciences | 976 | 9.7% |
| Engineering | 722 | 7.2% |
| Multidisciplinary Studies | 78 | 0.8% |
| Science & Technology | 1,068 | 10.6% |
| Business | 1,463 | 14.5% |
| Education | 959 | 9.5% |
| Literature & Languages | 827 | 8.2% |
| Liberal Arts & History | 379 | 3.8% |
| Visual & Performing Arts | 431 | 4.3% |
| Communications | 292 | 2.9% |
| Arts & Humanities | 656 | 6.5% |
| Total | 10,062 | 100.0% |
Transportation & Commute in South Burlington
Vehicle Availability by Sex in South Burlington
The most prevalent vehicle ownership categories in South Burlington are males with 2 vehicles (3,360, accounting for 57.4%) and females with 2 vehicles (3,239, making up 57.0%).
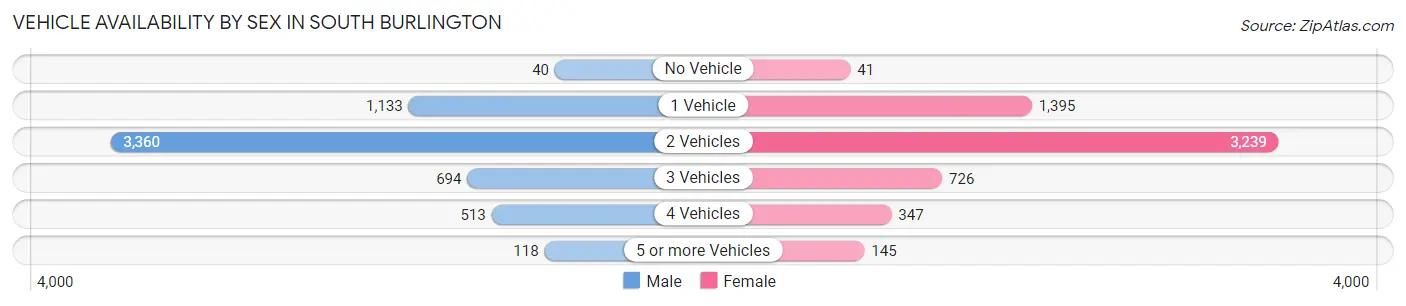
| Vehicles Available | Male | Female |
| No Vehicle | 40 (0.7%) | 41 (0.7%) |
| 1 Vehicle | 1,133 (19.3%) | 1,395 (23.7%) |
| 2 Vehicles | 3,360 (57.4%) | 3,239 (55.0%) |
| 3 Vehicles | 694 (11.8%) | 726 (12.3%) |
| 4 Vehicles | 513 (8.8%) | 347 (5.9%) |
| 5 or more Vehicles | 118 (2.0%) | 145 (2.5%) |
| Total | 5,858 (100.0%) | 5,893 (100.0%) |
Commute Time in South Burlington
The most frequently occuring commute durations in South Burlington are 10 to 14 minutes (2,967 commuters, 29.8%), 15 to 19 minutes (2,565 commuters, 25.8%), and 5 to 9 minutes (1,277 commuters, 12.8%).
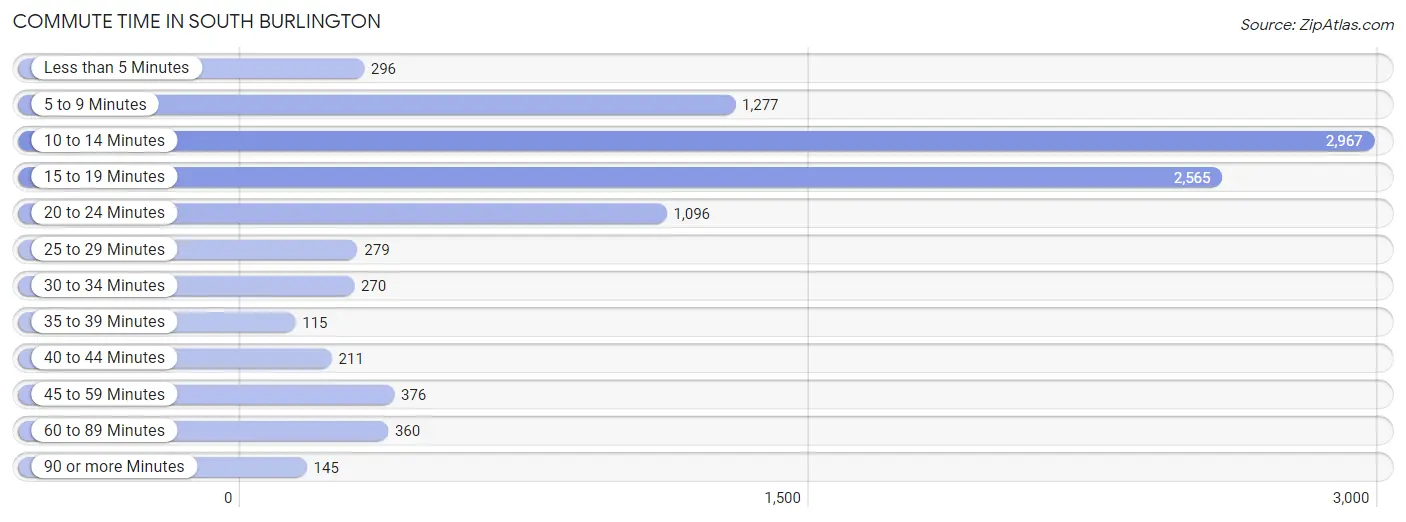
| Commute Time | # Commuters | % Commuters |
| Less than 5 Minutes | 296 | 3.0% |
| 5 to 9 Minutes | 1,277 | 12.8% |
| 10 to 14 Minutes | 2,967 | 29.8% |
| 15 to 19 Minutes | 2,565 | 25.8% |
| 20 to 24 Minutes | 1,096 | 11.0% |
| 25 to 29 Minutes | 279 | 2.8% |
| 30 to 34 Minutes | 270 | 2.7% |
| 35 to 39 Minutes | 115 | 1.1% |
| 40 to 44 Minutes | 211 | 2.1% |
| 45 to 59 Minutes | 376 | 3.8% |
| 60 to 89 Minutes | 360 | 3.6% |
| 90 or more Minutes | 145 | 1.5% |
Commute Time by Sex in South Burlington
The most common commute times in South Burlington are 10 to 14 minutes (1,415 commuters, 29.3%) for males and 10 to 14 minutes (1,552 commuters, 30.3%) for females.
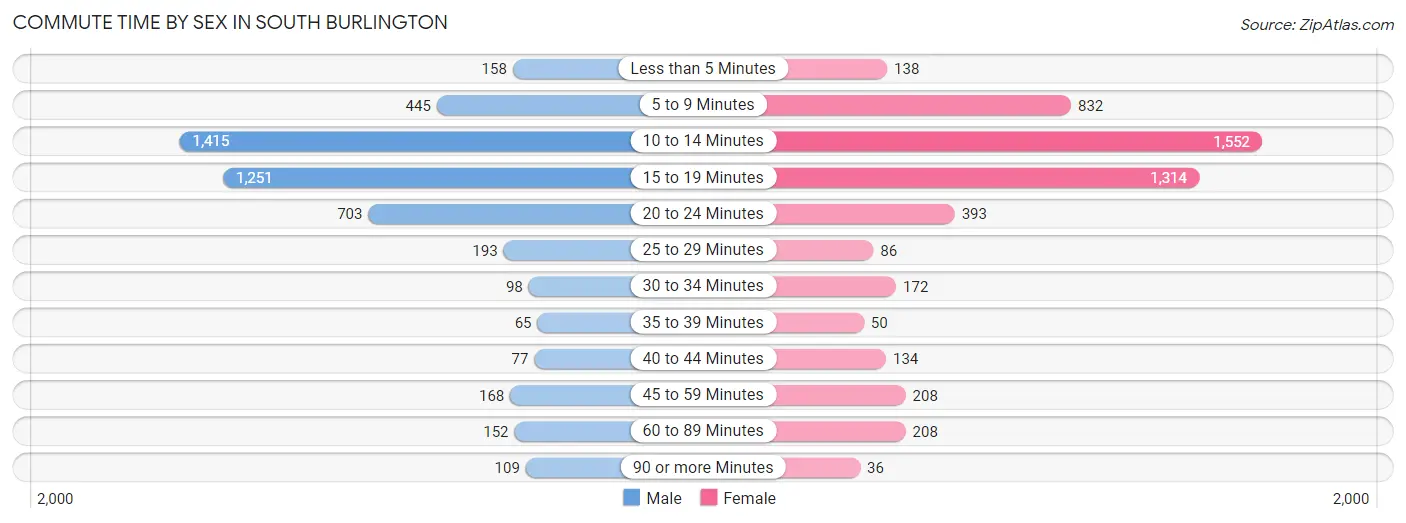
| Commute Time | Male | Female |
| Less than 5 Minutes | 158 (3.3%) | 138 (2.7%) |
| 5 to 9 Minutes | 445 (9.2%) | 832 (16.2%) |
| 10 to 14 Minutes | 1,415 (29.3%) | 1,552 (30.3%) |
| 15 to 19 Minutes | 1,251 (25.9%) | 1,314 (25.7%) |
| 20 to 24 Minutes | 703 (14.5%) | 393 (7.7%) |
| 25 to 29 Minutes | 193 (4.0%) | 86 (1.7%) |
| 30 to 34 Minutes | 98 (2.0%) | 172 (3.4%) |
| 35 to 39 Minutes | 65 (1.3%) | 50 (1.0%) |
| 40 to 44 Minutes | 77 (1.6%) | 134 (2.6%) |
| 45 to 59 Minutes | 168 (3.5%) | 208 (4.1%) |
| 60 to 89 Minutes | 152 (3.1%) | 208 (4.1%) |
| 90 or more Minutes | 109 (2.2%) | 36 (0.7%) |
Time of Departure to Work by Sex in South Burlington
The most frequent times of departure to work in South Burlington are 8:00 AM to 8:29 AM (1,032, 21.3%) for males and 8:00 AM to 8:29 AM (1,324, 25.8%) for females.
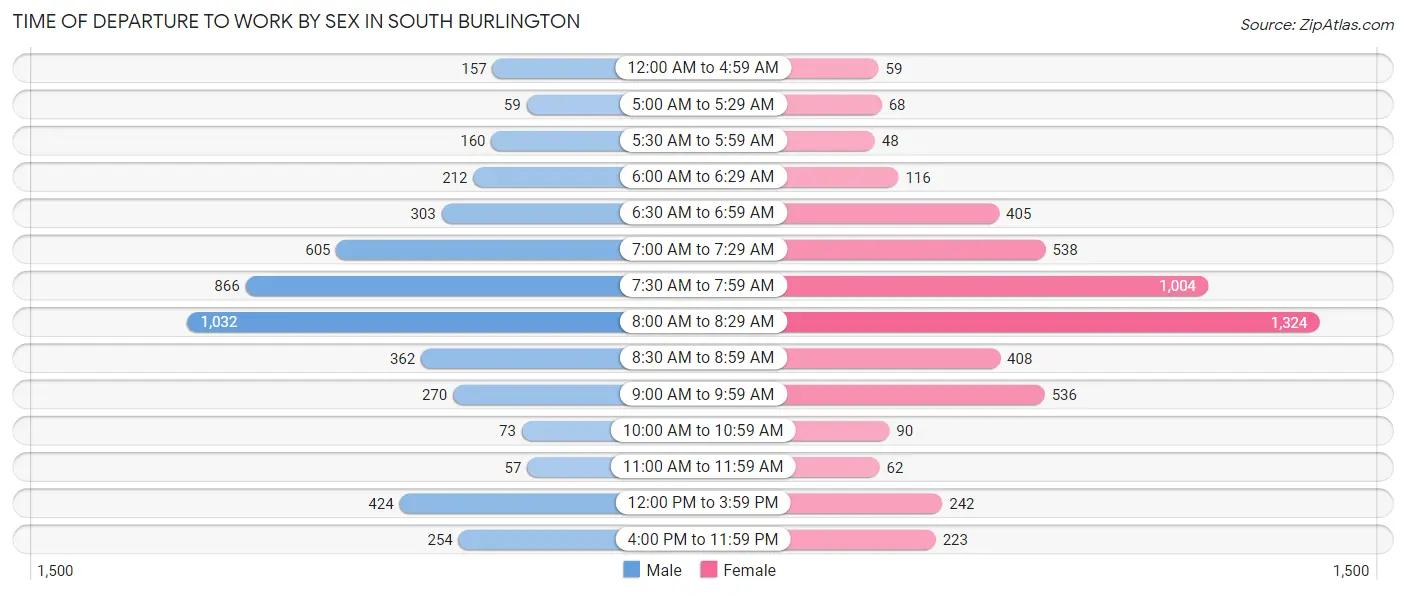
| Time of Departure | Male | Female |
| 12:00 AM to 4:59 AM | 157 (3.3%) | 59 (1.1%) |
| 5:00 AM to 5:29 AM | 59 (1.2%) | 68 (1.3%) |
| 5:30 AM to 5:59 AM | 160 (3.3%) | 48 (0.9%) |
| 6:00 AM to 6:29 AM | 212 (4.4%) | 116 (2.3%) |
| 6:30 AM to 6:59 AM | 303 (6.3%) | 405 (7.9%) |
| 7:00 AM to 7:29 AM | 605 (12.5%) | 538 (10.5%) |
| 7:30 AM to 7:59 AM | 866 (17.9%) | 1,004 (19.6%) |
| 8:00 AM to 8:29 AM | 1,032 (21.3%) | 1,324 (25.8%) |
| 8:30 AM to 8:59 AM | 362 (7.5%) | 408 (8.0%) |
| 9:00 AM to 9:59 AM | 270 (5.6%) | 536 (10.5%) |
| 10:00 AM to 10:59 AM | 73 (1.5%) | 90 (1.8%) |
| 11:00 AM to 11:59 AM | 57 (1.2%) | 62 (1.2%) |
| 12:00 PM to 3:59 PM | 424 (8.8%) | 242 (4.7%) |
| 4:00 PM to 11:59 PM | 254 (5.2%) | 223 (4.3%) |
| Total | 4,834 (100.0%) | 5,123 (100.0%) |
Housing Occupancy in South Burlington
Occupancy by Ownership in South Burlington
Of the total 8,783 dwellings in South Burlington, owner-occupied units account for 5,221 (59.4%), while renter-occupied units make up 3,562 (40.6%).
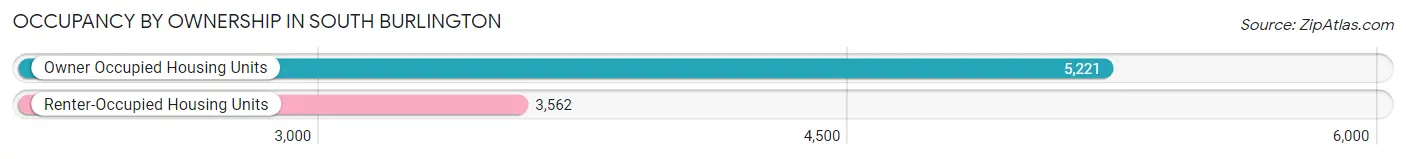
| Occupancy | # Housing Units | % Housing Units |
| Owner Occupied Housing Units | 5,221 | 59.4% |
| Renter-Occupied Housing Units | 3,562 | 40.6% |
| Total Occupied Housing Units | 8,783 | 100.0% |
Occupancy by Household Size in South Burlington
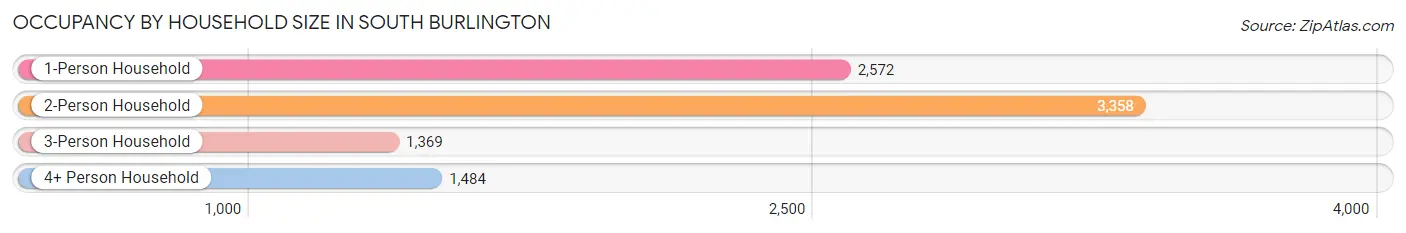
| Household Size | # Housing Units | % Housing Units |
| 1-Person Household | 2,572 | 29.3% |
| 2-Person Household | 3,358 | 38.2% |
| 3-Person Household | 1,369 | 15.6% |
| 4+ Person Household | 1,484 | 16.9% |
| Total Housing Units | 8,783 | 100.0% |
Occupancy by Ownership by Household Size in South Burlington
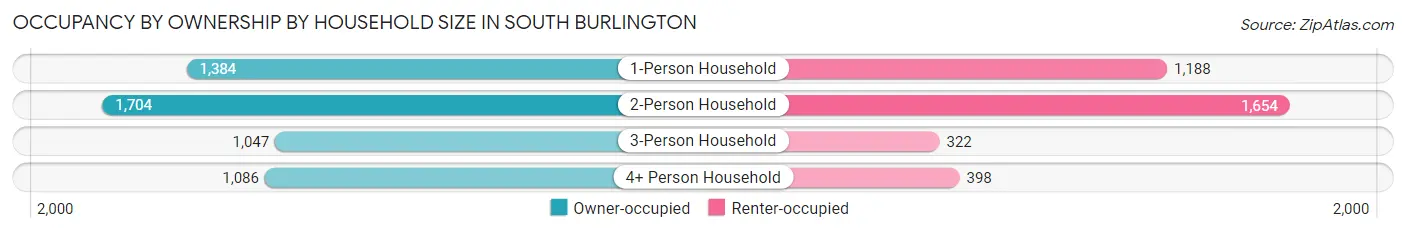
| Household Size | Owner-occupied | Renter-occupied |
| 1-Person Household | 1,384 (53.8%) | 1,188 (46.2%) |
| 2-Person Household | 1,704 (50.7%) | 1,654 (49.3%) |
| 3-Person Household | 1,047 (76.5%) | 322 (23.5%) |
| 4+ Person Household | 1,086 (73.2%) | 398 (26.8%) |
| Total Housing Units | 5,221 (59.4%) | 3,562 (40.6%) |
Occupancy by Educational Attainment in South Burlington
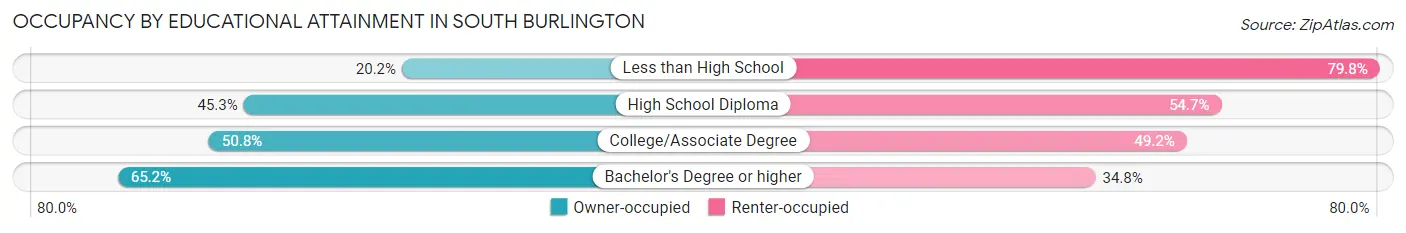
| Household Size | Owner-occupied | Renter-occupied |
| Less than High School | 26 (20.2%) | 103 (79.8%) |
| High School Diploma | 455 (45.3%) | 550 (54.7%) |
| College/Associate Degree | 870 (50.8%) | 844 (49.2%) |
| Bachelor's Degree or higher | 3,870 (65.2%) | 2,065 (34.8%) |
Occupancy by Age of Householder in South Burlington
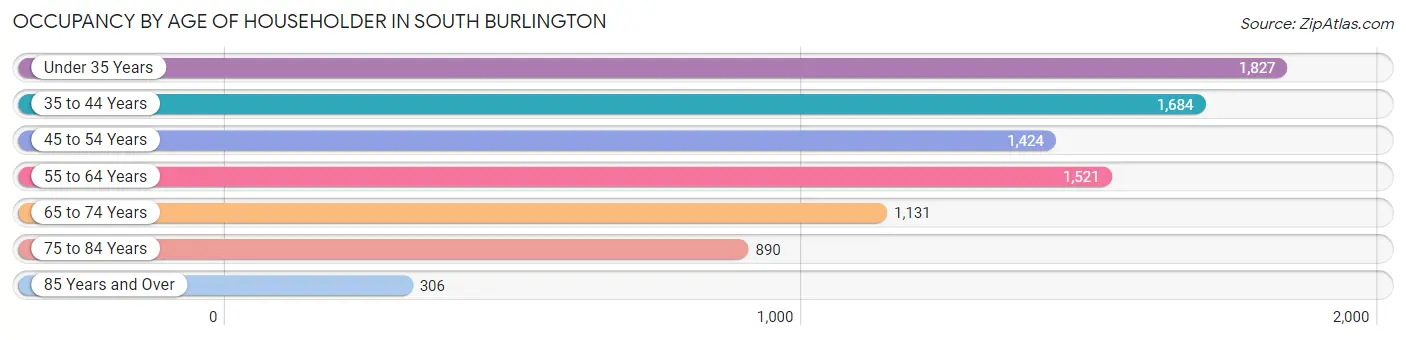
| Age Bracket | # Households | % Households |
| Under 35 Years | 1,827 | 20.8% |
| 35 to 44 Years | 1,684 | 19.2% |
| 45 to 54 Years | 1,424 | 16.2% |
| 55 to 64 Years | 1,521 | 17.3% |
| 65 to 74 Years | 1,131 | 12.9% |
| 75 to 84 Years | 890 | 10.1% |
| 85 Years and Over | 306 | 3.5% |
| Total | 8,783 | 100.0% |
Housing Finances in South Burlington
Median Income by Occupancy in South Burlington
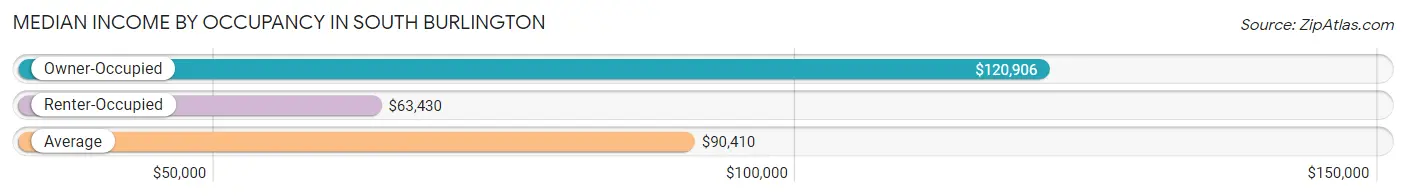
| Occupancy Type | # Households | Median Income |
| Owner-Occupied | 5,221 (59.4%) | $120,906 |
| Renter-Occupied | 3,562 (40.6%) | $63,430 |
| Average | 8,783 (100.0%) | $90,410 |
Occupancy by Householder Income Bracket in South Burlington
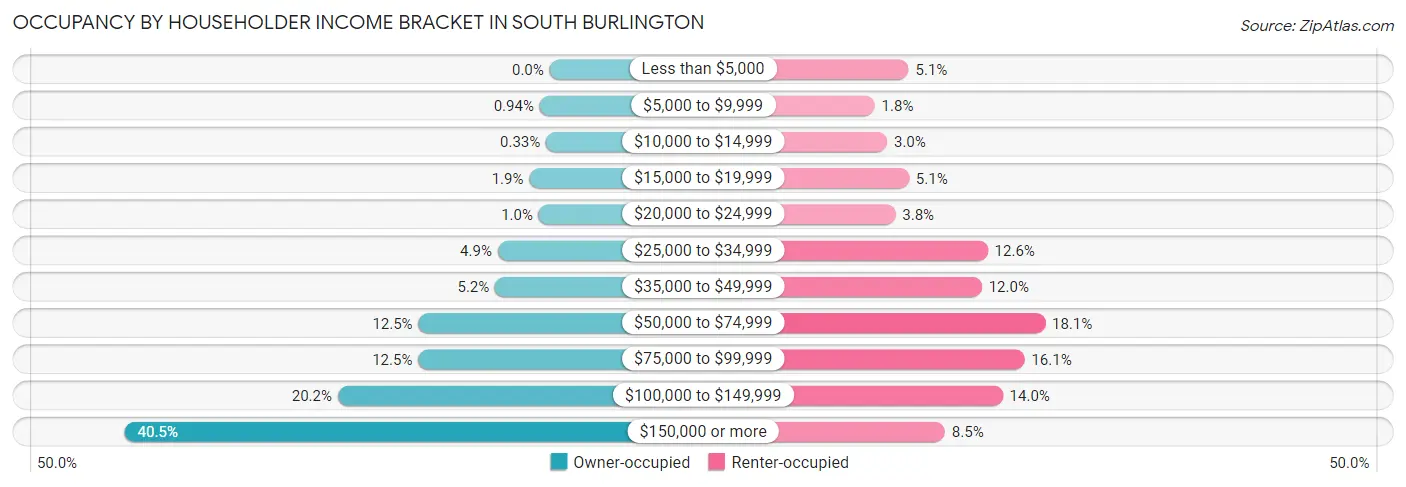
| Income Bracket | Owner-occupied | Renter-occupied |
| Less than $5,000 | 0 (0.0%) | 180 (5.1%) |
| $5,000 to $9,999 | 49 (0.9%) | 65 (1.8%) |
| $10,000 to $14,999 | 17 (0.3%) | 107 (3.0%) |
| $15,000 to $19,999 | 101 (1.9%) | 181 (5.1%) |
| $20,000 to $24,999 | 54 (1.0%) | 135 (3.8%) |
| $25,000 to $34,999 | 258 (4.9%) | 448 (12.6%) |
| $35,000 to $49,999 | 271 (5.2%) | 428 (12.0%) |
| $50,000 to $74,999 | 652 (12.5%) | 643 (18.0%) |
| $75,000 to $99,999 | 653 (12.5%) | 573 (16.1%) |
| $100,000 to $149,999 | 1,053 (20.2%) | 499 (14.0%) |
| $150,000 or more | 2,113 (40.5%) | 303 (8.5%) |
| Total | 5,221 (100.0%) | 3,562 (100.0%) |
Monthly Housing Cost Tiers in South Burlington
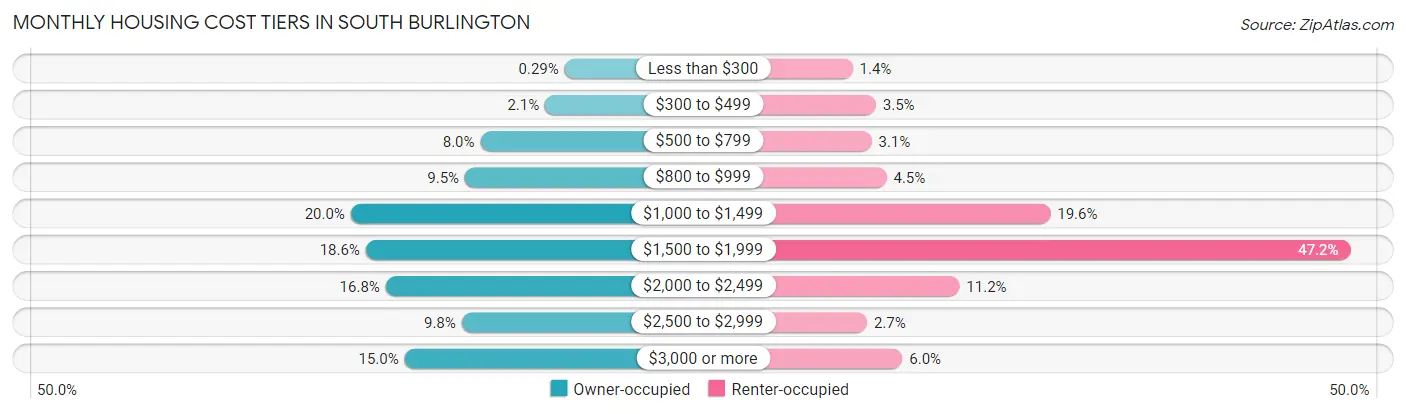
| Monthly Cost | Owner-occupied | Renter-occupied |
| Less than $300 | 15 (0.3%) | 50 (1.4%) |
| $300 to $499 | 109 (2.1%) | 126 (3.5%) |
| $500 to $799 | 420 (8.0%) | 112 (3.1%) |
| $800 to $999 | 494 (9.5%) | 161 (4.5%) |
| $1,000 to $1,499 | 1,043 (20.0%) | 698 (19.6%) |
| $1,500 to $1,999 | 971 (18.6%) | 1,682 (47.2%) |
| $2,000 to $2,499 | 875 (16.8%) | 400 (11.2%) |
| $2,500 to $2,999 | 510 (9.8%) | 97 (2.7%) |
| $3,000 or more | 784 (15.0%) | 213 (6.0%) |
| Total | 5,221 (100.0%) | 3,562 (100.0%) |
Physical Housing Characteristics in South Burlington
Housing Structures in South Burlington
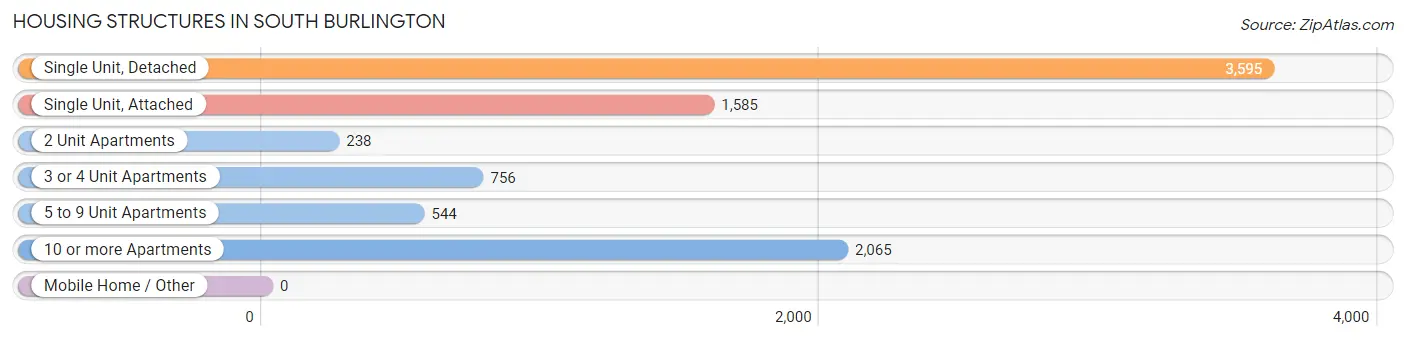
| Structure Type | # Housing Units | % Housing Units |
| Single Unit, Detached | 3,595 | 40.9% |
| Single Unit, Attached | 1,585 | 18.0% |
| 2 Unit Apartments | 238 | 2.7% |
| 3 or 4 Unit Apartments | 756 | 8.6% |
| 5 to 9 Unit Apartments | 544 | 6.2% |
| 10 or more Apartments | 2,065 | 23.5% |
| Mobile Home / Other | 0 | 0.0% |
| Total | 8,783 | 100.0% |
Housing Structures by Occupancy in South Burlington
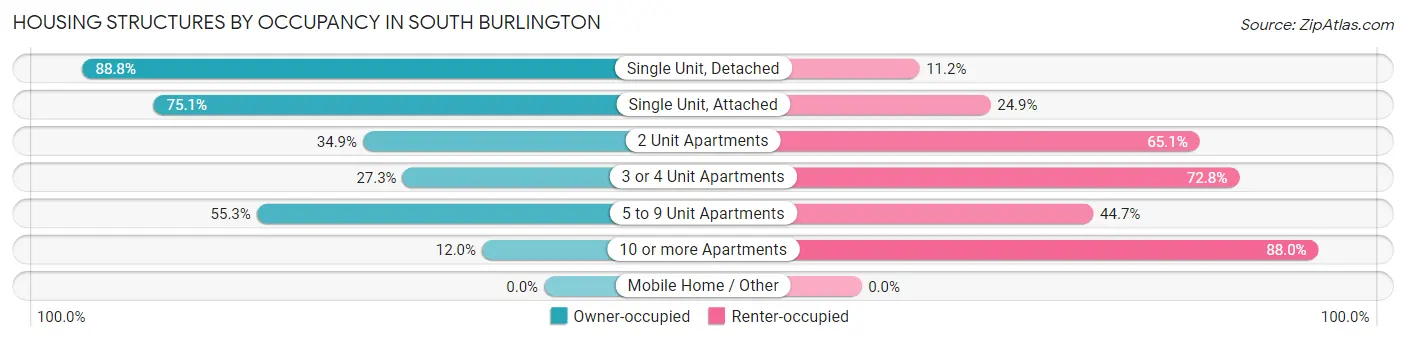
| Structure Type | Owner-occupied | Renter-occupied |
| Single Unit, Detached | 3,193 (88.8%) | 402 (11.2%) |
| Single Unit, Attached | 1,191 (75.1%) | 394 (24.9%) |
| 2 Unit Apartments | 83 (34.9%) | 155 (65.1%) |
| 3 or 4 Unit Apartments | 206 (27.3%) | 550 (72.8%) |
| 5 to 9 Unit Apartments | 301 (55.3%) | 243 (44.7%) |
| 10 or more Apartments | 247 (12.0%) | 1,818 (88.0%) |
| Mobile Home / Other | 0 (0.0%) | 0 (0.0%) |
| Total | 5,221 (59.4%) | 3,562 (40.6%) |
Housing Structures by Number of Rooms in South Burlington
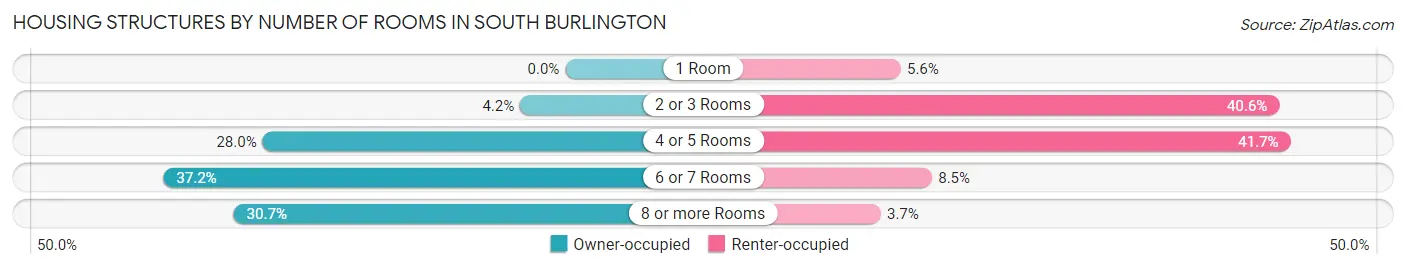
| Number of Rooms | Owner-occupied | Renter-occupied |
| 1 Room | 0 (0.0%) | 198 (5.6%) |
| 2 or 3 Rooms | 218 (4.2%) | 1,447 (40.6%) |
| 4 or 5 Rooms | 1,462 (28.0%) | 1,484 (41.7%) |
| 6 or 7 Rooms | 1,940 (37.2%) | 301 (8.5%) |
| 8 or more Rooms | 1,601 (30.7%) | 132 (3.7%) |
| Total | 5,221 (100.0%) | 3,562 (100.0%) |
Housing Structure by Heating Type in South Burlington
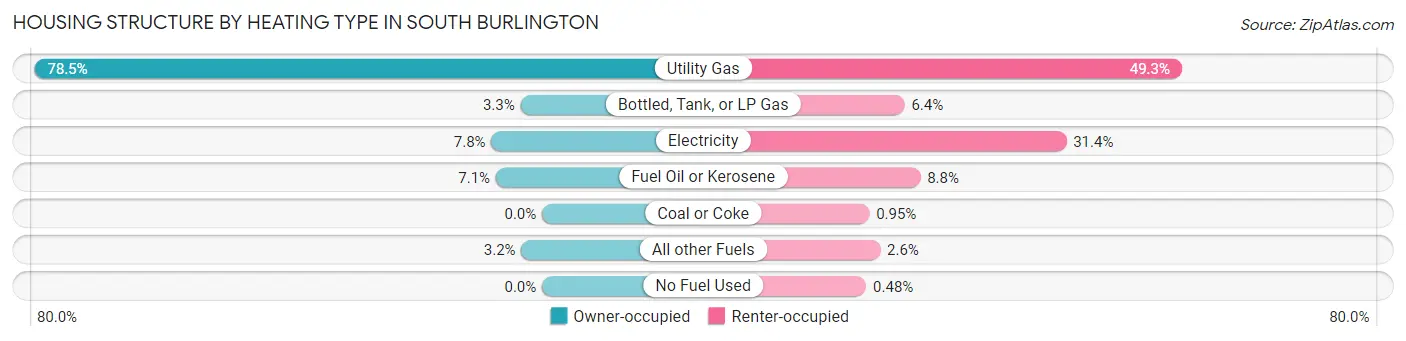
| Heating Type | Owner-occupied | Renter-occupied |
| Utility Gas | 4,098 (78.5%) | 1,755 (49.3%) |
| Bottled, Tank, or LP Gas | 174 (3.3%) | 228 (6.4%) |
| Electricity | 409 (7.8%) | 1,119 (31.4%) |
| Fuel Oil or Kerosene | 373 (7.1%) | 315 (8.8%) |
| Coal or Coke | 0 (0.0%) | 34 (0.9%) |
| All other Fuels | 167 (3.2%) | 94 (2.6%) |
| No Fuel Used | 0 (0.0%) | 17 (0.5%) |
| Total | 5,221 (100.0%) | 3,562 (100.0%) |
Household Vehicle Usage in South Burlington
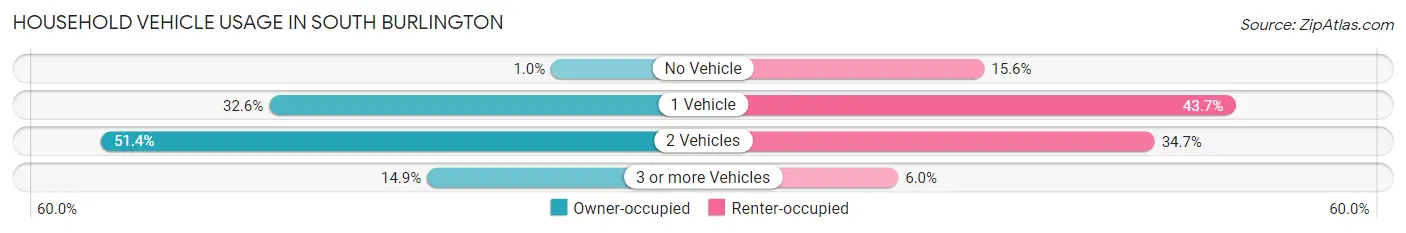
| Vehicles per Household | Owner-occupied | Renter-occupied |
| No Vehicle | 54 (1.0%) | 556 (15.6%) |
| 1 Vehicle | 1,703 (32.6%) | 1,557 (43.7%) |
| 2 Vehicles | 2,685 (51.4%) | 1,236 (34.7%) |
| 3 or more Vehicles | 779 (14.9%) | 213 (6.0%) |
| Total | 5,221 (100.0%) | 3,562 (100.0%) |
Real Estate & Mortgages in South Burlington
Real Estate and Mortgage Overview in South Burlington
| Characteristic | Without Mortgage | With Mortgage |
| Housing Units | 1,536 | 3,685 |
| Median Property Value | $407,300 | $375,000 |
| Median Household Income | $96,176 | $1,579 |
| Monthly Housing Costs | $987 | $767 |
| Real Estate Taxes | $6,466 | $34 |
Property Value by Mortgage Status in South Burlington
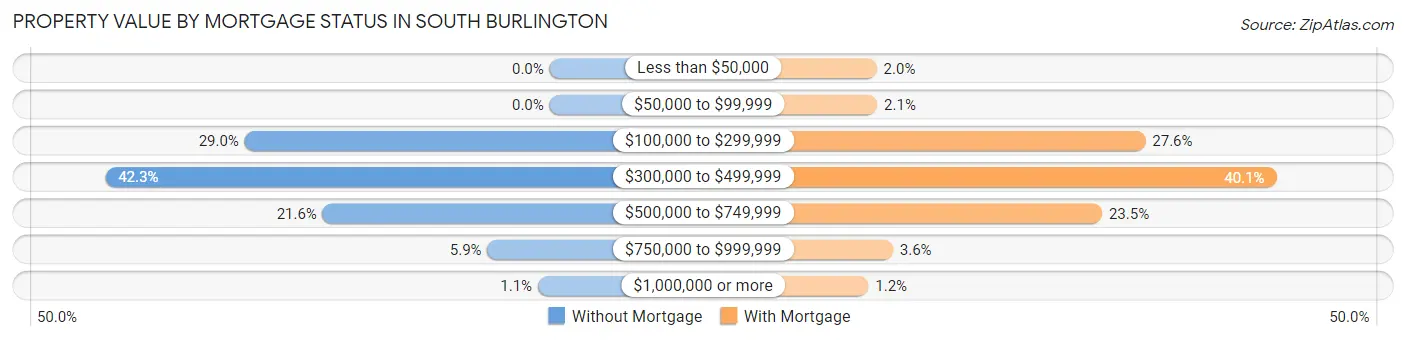
| Property Value | Without Mortgage | With Mortgage |
| Less than $50,000 | 0 (0.0%) | 74 (2.0%) |
| $50,000 to $99,999 | 0 (0.0%) | 76 (2.1%) |
| $100,000 to $299,999 | 446 (29.0%) | 1,017 (27.6%) |
| $300,000 to $499,999 | 650 (42.3%) | 1,477 (40.1%) |
| $500,000 to $749,999 | 332 (21.6%) | 865 (23.5%) |
| $750,000 to $999,999 | 91 (5.9%) | 131 (3.5%) |
| $1,000,000 or more | 17 (1.1%) | 45 (1.2%) |
| Total | 1,536 (100.0%) | 3,685 (100.0%) |
Household Income by Mortgage Status in South Burlington
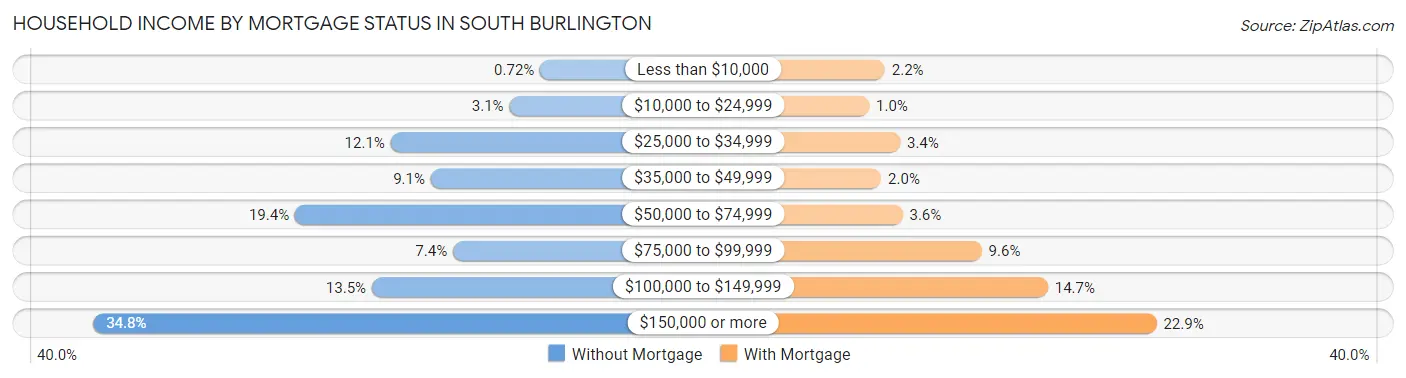
| Household Income | Without Mortgage | With Mortgage |
| Less than $10,000 | 11 (0.7%) | 82 (2.2%) |
| $10,000 to $24,999 | 47 (3.1%) | 38 (1.0%) |
| $25,000 to $34,999 | 186 (12.1%) | 125 (3.4%) |
| $35,000 to $49,999 | 139 (9.0%) | 72 (1.9%) |
| $50,000 to $74,999 | 298 (19.4%) | 132 (3.6%) |
| $75,000 to $99,999 | 113 (7.4%) | 354 (9.6%) |
| $100,000 to $149,999 | 208 (13.5%) | 540 (14.6%) |
| $150,000 or more | 534 (34.8%) | 845 (22.9%) |
| Total | 1,536 (100.0%) | 3,685 (100.0%) |
Property Value to Household Income Ratio in South Burlington
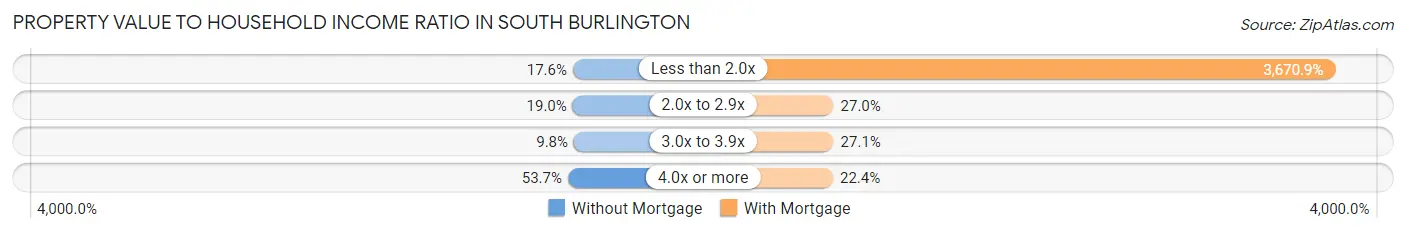
| Value-to-Income Ratio | Without Mortgage | With Mortgage |
| Less than 2.0x | 270 (17.6%) | 135,274 (3,670.9%) |
| 2.0x to 2.9x | 292 (19.0%) | 993 (27.0%) |
| 3.0x to 3.9x | 150 (9.8%) | 998 (27.1%) |
| 4.0x or more | 824 (53.6%) | 826 (22.4%) |
| Total | 1,536 (100.0%) | 3,685 (100.0%) |
Real Estate Taxes by Mortgage Status in South Burlington
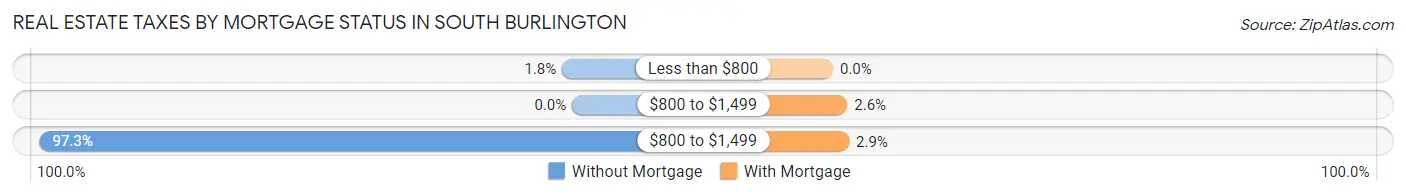
| Property Taxes | Without Mortgage | With Mortgage |
| Less than $800 | 28 (1.8%) | 0 (0.0%) |
| $800 to $1,499 | 0 (0.0%) | 96 (2.6%) |
| $800 to $1,499 | 1,494 (97.3%) | 108 (2.9%) |
| Total | 1,536 (100.0%) | 3,685 (100.0%) |
Health & Disability in South Burlington
Health Insurance Coverage by Age in South Burlington
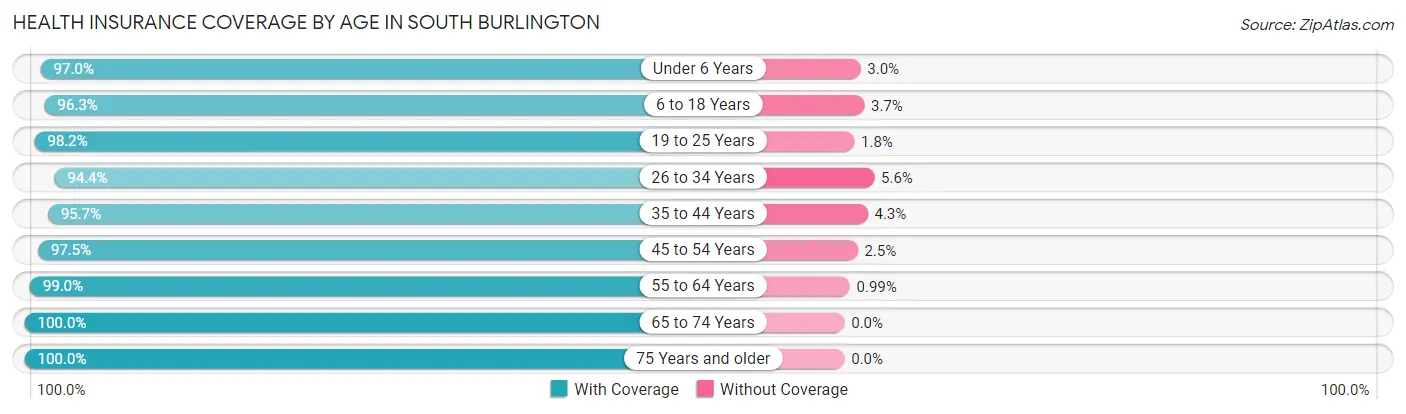
| Age Bracket | With Coverage | Without Coverage |
| Under 6 Years | 1,071 (97.0%) | 33 (3.0%) |
| 6 to 18 Years | 2,654 (96.3%) | 102 (3.7%) |
| 19 to 25 Years | 2,311 (98.2%) | 43 (1.8%) |
| 26 to 34 Years | 2,310 (94.4%) | 136 (5.6%) |
| 35 to 44 Years | 2,812 (95.7%) | 127 (4.3%) |
| 45 to 54 Years | 2,462 (97.5%) | 62 (2.5%) |
| 55 to 64 Years | 2,609 (99.0%) | 26 (1.0%) |
| 65 to 74 Years | 1,680 (100.0%) | 0 (0.0%) |
| 75 Years and older | 1,530 (100.0%) | 0 (0.0%) |
| Total | 19,439 (97.4%) | 529 (2.6%) |
Health Insurance Coverage by Citizenship Status in South Burlington
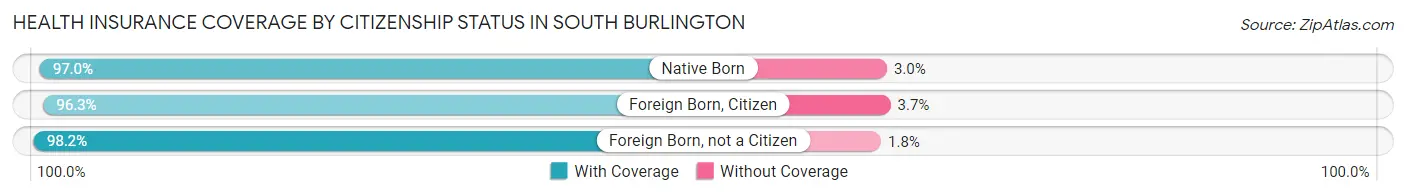
| Citizenship Status | With Coverage | Without Coverage |
| Native Born | 1,071 (97.0%) | 33 (3.0%) |
| Foreign Born, Citizen | 2,654 (96.3%) | 102 (3.7%) |
| Foreign Born, not a Citizen | 2,311 (98.2%) | 43 (1.8%) |
Health Insurance Coverage by Household Income in South Burlington
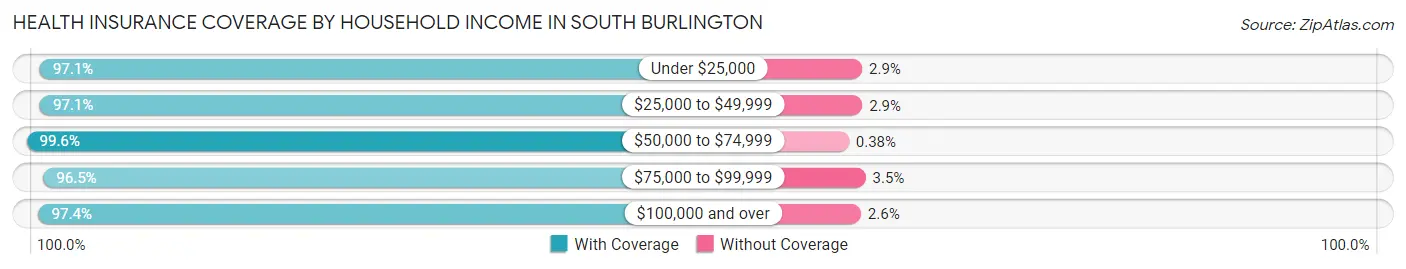
| Household Income | With Coverage | Without Coverage |
| Under $25,000 | 1,251 (97.1%) | 37 (2.9%) |
| $25,000 to $49,999 | 2,144 (97.1%) | 64 (2.9%) |
| $50,000 to $74,999 | 2,385 (99.6%) | 9 (0.4%) |
| $75,000 to $99,999 | 3,006 (96.5%) | 110 (3.5%) |
| $100,000 and over | 10,564 (97.4%) | 286 (2.6%) |
Public vs Private Health Insurance Coverage by Age in South Burlington
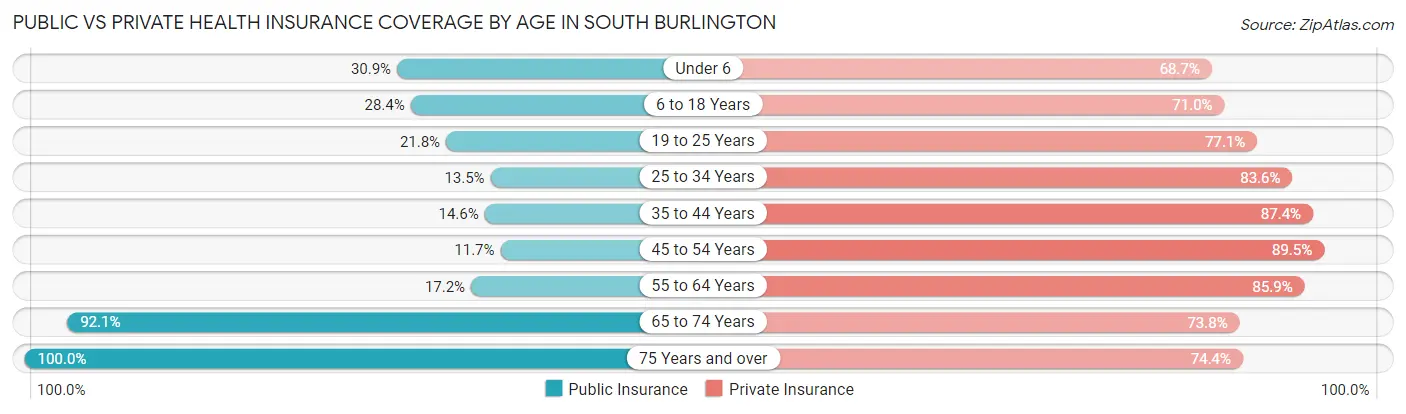
| Age Bracket | Public Insurance | Private Insurance |
| Under 6 | 341 (30.9%) | 758 (68.7%) |
| 6 to 18 Years | 782 (28.4%) | 1,957 (71.0%) |
| 19 to 25 Years | 513 (21.8%) | 1,815 (77.1%) |
| 25 to 34 Years | 331 (13.5%) | 2,045 (83.6%) |
| 35 to 44 Years | 430 (14.6%) | 2,570 (87.4%) |
| 45 to 54 Years | 295 (11.7%) | 2,259 (89.5%) |
| 55 to 64 Years | 452 (17.2%) | 2,263 (85.9%) |
| 65 to 74 Years | 1,547 (92.1%) | 1,240 (73.8%) |
| 75 Years and over | 1,530 (100.0%) | 1,139 (74.4%) |
| Total | 6,221 (31.1%) | 16,046 (80.4%) |
Disability Status by Sex by Age in South Burlington
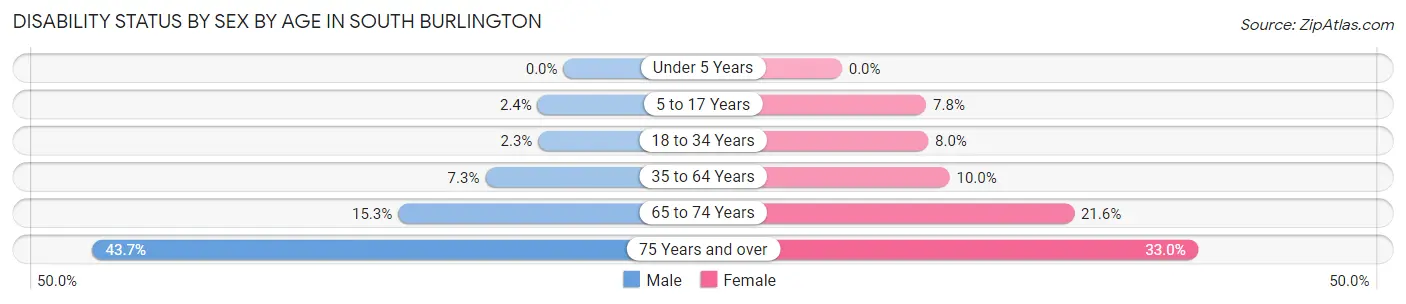
| Age Bracket | Male | Female |
| Under 5 Years | 0 (0.0%) | 0 (0.0%) |
| 5 to 17 Years | 37 (2.4%) | 105 (7.8%) |
| 18 to 34 Years | 54 (2.3%) | 207 (8.0%) |
| 35 to 64 Years | 292 (7.2%) | 407 (10.0%) |
| 65 to 74 Years | 131 (15.3%) | 178 (21.5%) |
| 75 Years and over | 221 (43.7%) | 338 (33.0%) |
Disability Class by Sex by Age in South Burlington
Disability Class: Hearing Difficulty
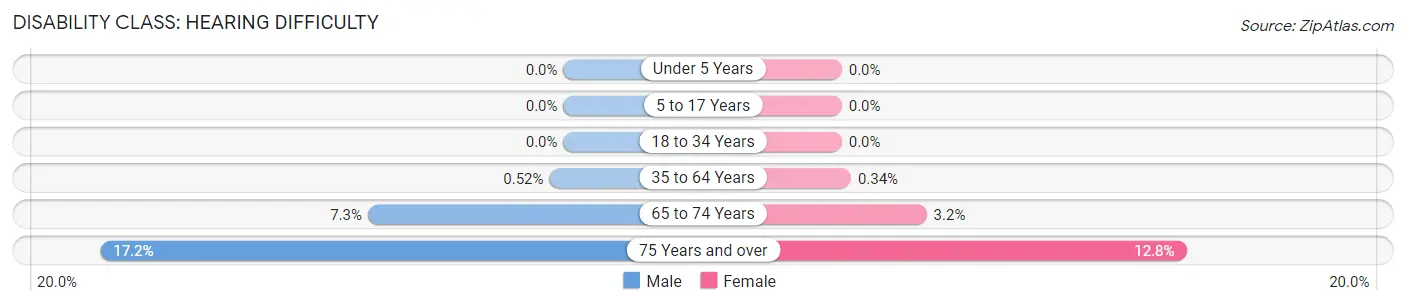
| Age Bracket | Male | Female |
| Under 5 Years | 0 (0.0%) | 0 (0.0%) |
| 5 to 17 Years | 0 (0.0%) | 0 (0.0%) |
| 18 to 34 Years | 0 (0.0%) | 0 (0.0%) |
| 35 to 64 Years | 21 (0.5%) | 14 (0.3%) |
| 65 to 74 Years | 62 (7.3%) | 26 (3.2%) |
| 75 Years and over | 87 (17.2%) | 131 (12.8%) |
Disability Class: Vision Difficulty
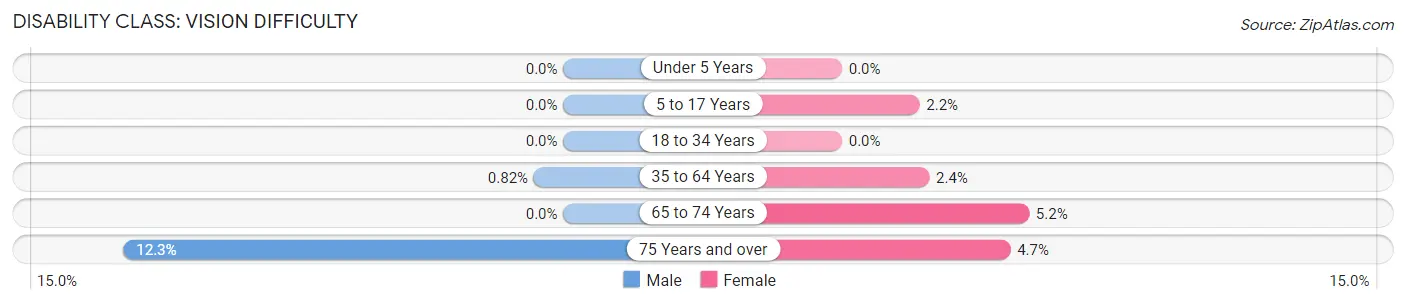
| Age Bracket | Male | Female |
| Under 5 Years | 0 (0.0%) | 0 (0.0%) |
| 5 to 17 Years | 0 (0.0%) | 29 (2.2%) |
| 18 to 34 Years | 0 (0.0%) | 0 (0.0%) |
| 35 to 64 Years | 33 (0.8%) | 99 (2.4%) |
| 65 to 74 Years | 0 (0.0%) | 43 (5.2%) |
| 75 Years and over | 62 (12.2%) | 48 (4.7%) |
Disability Class: Cognitive Difficulty
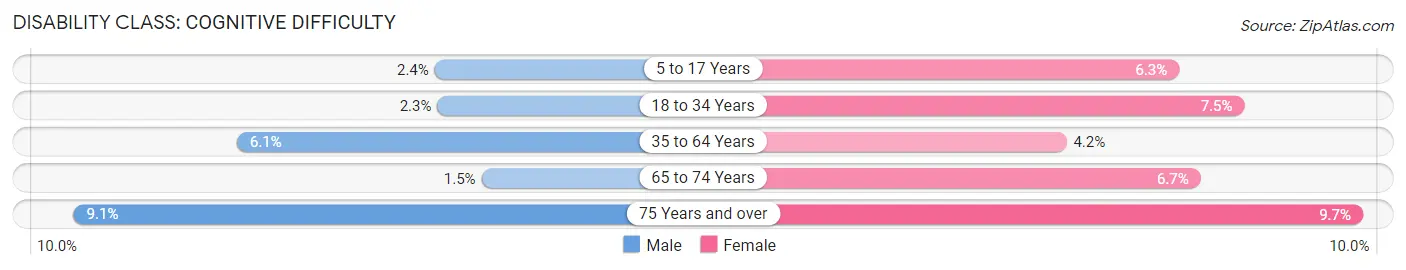
| Age Bracket | Male | Female |
| 5 to 17 Years | 37 (2.4%) | 84 (6.3%) |
| 18 to 34 Years | 54 (2.3%) | 193 (7.5%) |
| 35 to 64 Years | 244 (6.1%) | 170 (4.2%) |
| 65 to 74 Years | 13 (1.5%) | 55 (6.7%) |
| 75 Years and over | 46 (9.1%) | 99 (9.7%) |
Disability Class: Ambulatory Difficulty
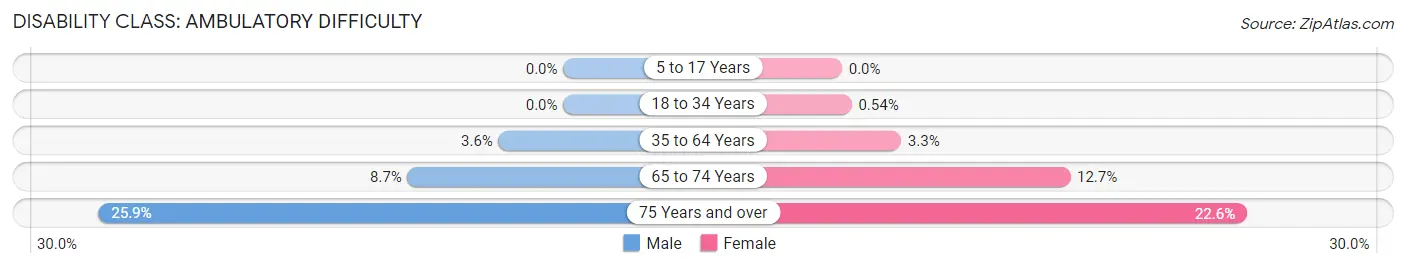
| Age Bracket | Male | Female |
| 5 to 17 Years | 0 (0.0%) | 0 (0.0%) |
| 18 to 34 Years | 0 (0.0%) | 14 (0.5%) |
| 35 to 64 Years | 145 (3.6%) | 134 (3.3%) |
| 65 to 74 Years | 74 (8.7%) | 105 (12.7%) |
| 75 Years and over | 131 (25.9%) | 231 (22.6%) |
Disability Class: Self-Care Difficulty
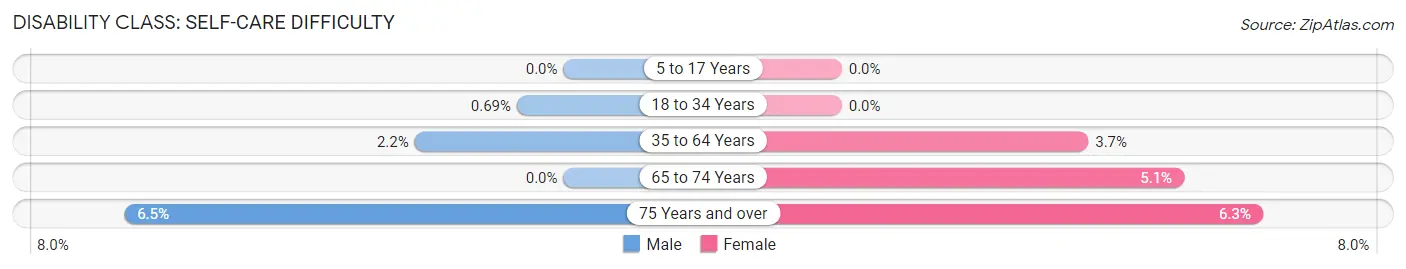
| Age Bracket | Male | Female |
| 5 to 17 Years | 0 (0.0%) | 0 (0.0%) |
| 18 to 34 Years | 16 (0.7%) | 0 (0.0%) |
| 35 to 64 Years | 89 (2.2%) | 149 (3.7%) |
| 65 to 74 Years | 0 (0.0%) | 42 (5.1%) |
| 75 Years and over | 33 (6.5%) | 64 (6.2%) |
Technology Access in South Burlington
Computing Device Access in South Burlington
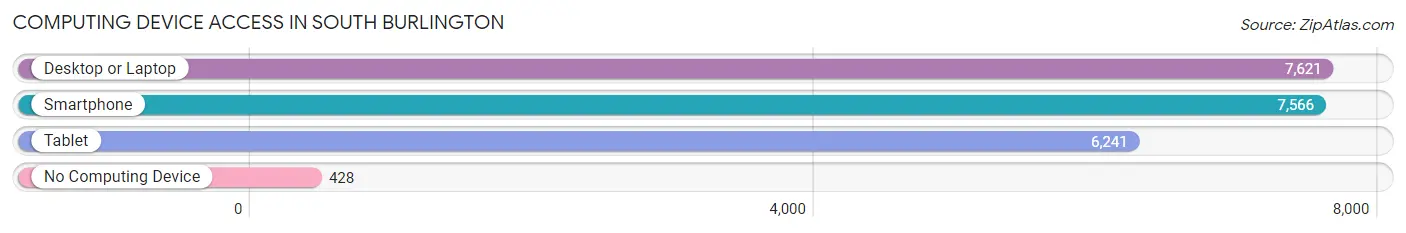
| Device Type | # Households | % Households |
| Desktop or Laptop | 7,621 | 86.8% |
| Smartphone | 7,566 | 86.1% |
| Tablet | 6,241 | 71.1% |
| No Computing Device | 428 | 4.9% |
| Total | 8,783 | 100.0% |
Internet Access in South Burlington
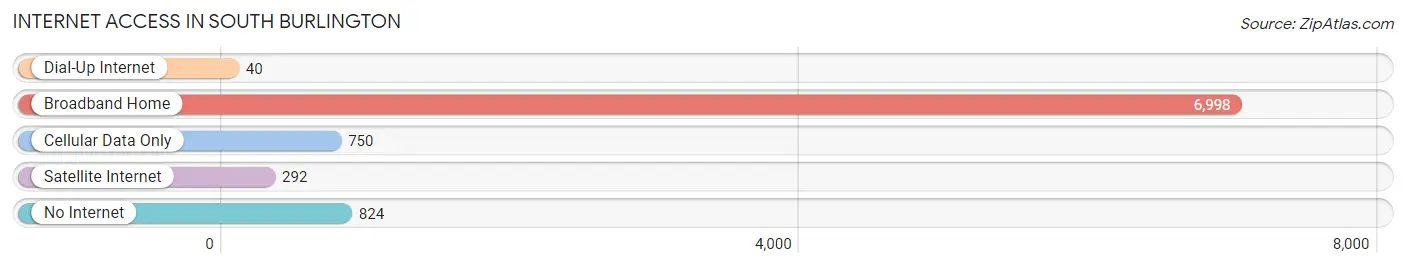
| Internet Type | # Households | % Households |
| Dial-Up Internet | 40 | 0.5% |
| Broadband Home | 6,998 | 79.7% |
| Cellular Data Only | 750 | 8.5% |
| Satellite Internet | 292 | 3.3% |
| No Internet | 824 | 9.4% |
| Total | 8,783 | 100.0% |
South Burlington Summary
History
South Burlington is a city located in Chittenden County, Vermont, United States. It is the second largest city in the state, with a population of 18,791 as of the 2010 census. The city is situated on the shores of Lake Champlain, and is part of the Burlington metropolitan area.
The area that is now South Burlington was originally inhabited by the Abenaki people, who called the area “Winooski”, meaning “wild onion”. The first European settlers arrived in the area in the late 1700s, and the town was officially incorporated in 1865.
In the early 1900s, the city began to grow rapidly, as the Burlington and Lamoille Railroad was built through the area. This allowed for the development of industry, and the city soon became a hub for manufacturing and transportation.
During World War II, the city was home to a large military base, which was used to train troops for the war effort. After the war, the base was closed, and the city shifted its focus to education and technology. In the late 20th century, the city experienced a period of rapid growth, as new businesses and residents moved to the area.
Geography
South Burlington is located in the northwestern corner of Vermont, on the shores of Lake Champlain. The city is bordered by the towns of Williston to the north, Shelburne to the east, and Colchester to the south. The city covers an area of 16.7 square miles, and has an elevation of 315 feet.
The city is located in a temperate climate zone, with cold winters and warm summers. The average temperature in January is 19°F, and the average temperature in July is 73°F. The city receives an average of 43 inches of precipitation per year.
Economy
South Burlington’s economy is largely based on education, technology, and healthcare. The city is home to the University of Vermont, which is the state’s largest employer. Other major employers in the city include IBM, GE Healthcare, and the Burlington International Airport.
The city also has a thriving retail sector, with several shopping centers and malls. The city is also home to a number of restaurants, bars, and entertainment venues.
Demographics
As of the 2010 census, South Burlington had a population of 18,791. The racial makeup of the city was 87.3% White, 4.2% African American, 0.5% Native American, 4.2% Asian, 0.1% Pacific Islander, and 3.7% from other races. The median household income was $60,945, and the median family income was $76,945.
The city is home to a diverse population, with a variety of religious and cultural backgrounds. The city is also home to a large number of immigrants, with the largest groups coming from India, China, and Mexico.
Common Questions
What is Per Capita Income in South Burlington?
Per Capita income in South Burlington is $53,110.
What is the Median Family Income in South Burlington?
Median Family Income in South Burlington is $115,528.
What is the Median Household income in South Burlington?
Median Household Income in South Burlington is $90,410.
What is Income or Wage Gap in South Burlington?
Income or Wage Gap in South Burlington is 17.5%.
Women in South Burlington earn 82.5 cents for every dollar earned by a man.
What is Inequality or Gini Index in South Burlington?
Inequality or Gini Index in South Burlington is 0.45.
What is the Total Population of South Burlington?
Total Population of South Burlington is 20,241.
What is the Total Male Population of South Burlington?
Total Male Population of South Burlington is 9,759.
What is the Total Female Population of South Burlington?
Total Female Population of South Burlington is 10,482.
What is the Ratio of Males per 100 Females in South Burlington?
There are 93.10 Males per 100 Females in South Burlington.
What is the Ratio of Females per 100 Males in South Burlington?
There are 107.41 Females per 100 Males in South Burlington.
What is the Median Population Age in South Burlington?
Median Population Age in South Burlington is 38.7 Years.
What is the Average Family Size in South Burlington
Average Family Size in South Burlington is 2.8 People.
What is the Average Household Size in South Burlington
Average Household Size in South Burlington is 2.3 People.
How Large is the Labor Force in South Burlington?
There are 12,619 People in the Labor Forcein in South Burlington.
What is the Percentage of People in the Labor Force in South Burlington?
74.5% of People are in the Labor Force in South Burlington.
What is the Unemployment Rate in South Burlington?
Unemployment Rate in South Burlington is 5.4%.