Zip Codes with the Highest Percentage of Population Employed in Computer, Engineering & Science in Burlington, VT
RELATED REPORTS & OPTIONS
Computer, Engineering & Science
Burlington
Compare Zip Codes
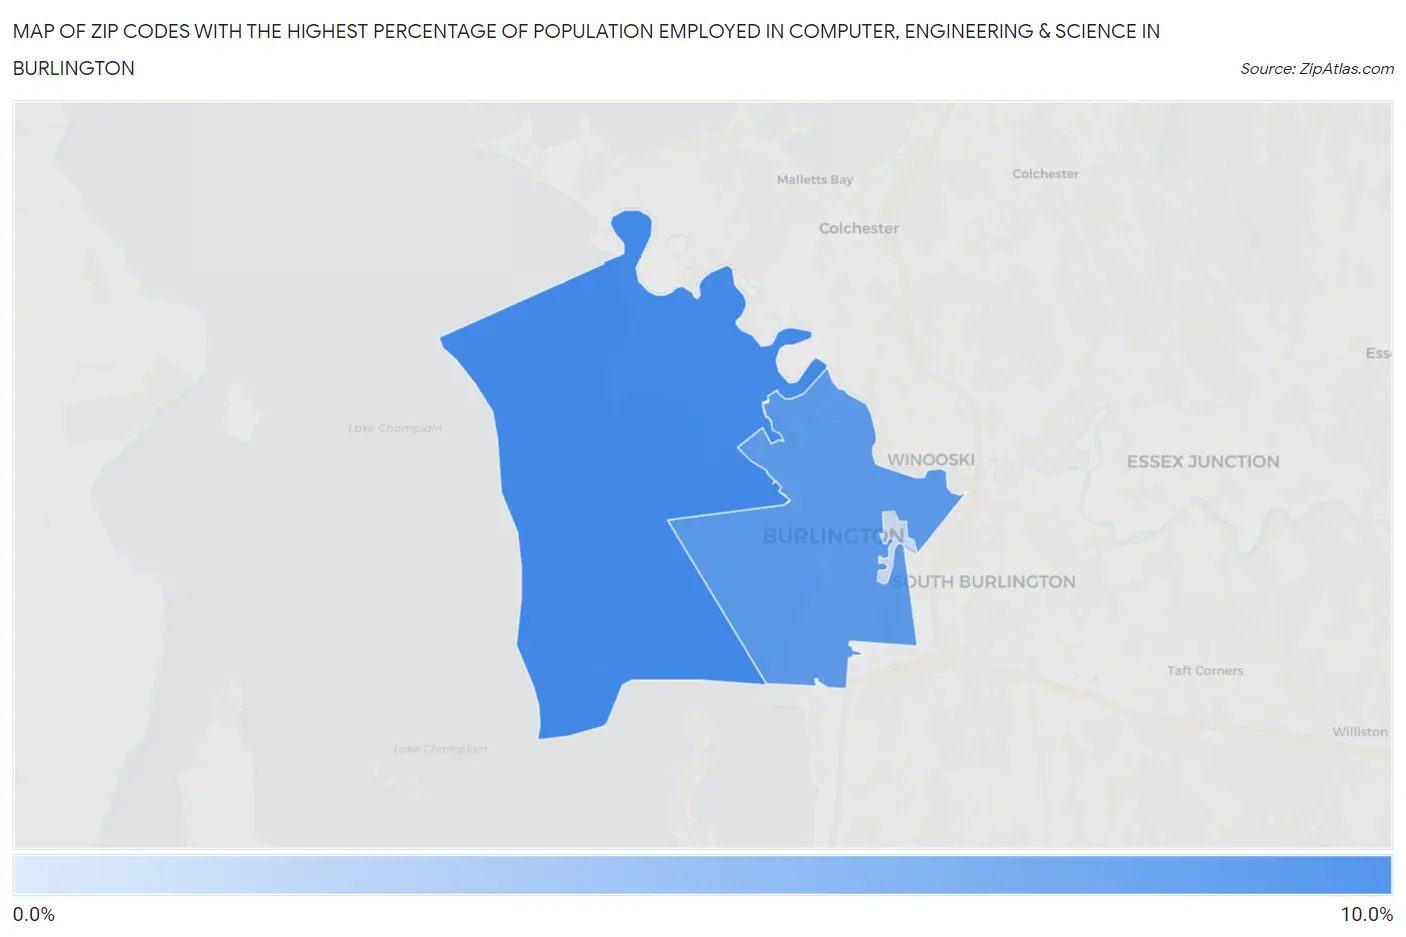
Map of Zip Codes with the Highest Percentage of Population Employed in Computer, Engineering & Science in Burlington
1.7%
9.5%
Zip Codes with the Highest Percentage of Population Employed in Computer, Engineering & Science in Burlington, VT
| Zip Code | % Employed | vs State | vs National | |
| 1. | 05408 | 9.5% | 6.0%(+3.49)#26 | 6.8%(+2.71)#3,619 |
| 2. | 05401 | 8.0% | 6.0%(+2.06)#41 | 6.8%(+1.28)#5,216 |
| 3. | 05405 | 1.7% | 6.0%(-4.33)#189 | 6.8%(-5.11)#23,084 |
1
Common Questions
What are the Top Zip Codes with the Highest Percentage of Population Employed in Computer, Engineering & Science in Burlington, VT?
Top Zip Codes with the Highest Percentage of Population Employed in Computer, Engineering & Science in Burlington, VT are:
What zip code has the Highest Percentage of Population Employed in Computer, Engineering & Science in Burlington, VT?
05408 has the Highest Percentage of Population Employed in Computer, Engineering & Science in Burlington, VT with 9.5%.
What is the Percentage of Population Employed in Computer, Engineering & Science in Burlington, VT?
Percentage of Population Employed in Computer, Engineering & Science in Burlington is 8.1%.
What is the Percentage of Population Employed in Computer, Engineering & Science in Vermont?
Percentage of Population Employed in Computer, Engineering & Science in Vermont is 6.0%.
What is the Percentage of Population Employed in Computer, Engineering & Science in the United States?
Percentage of Population Employed in Computer, Engineering & Science in the United States is 6.8%.