Cities with the Largest Irish Community in Vermont
RELATED REPORTS & OPTIONS
Irish
Vermont
Compare Cities
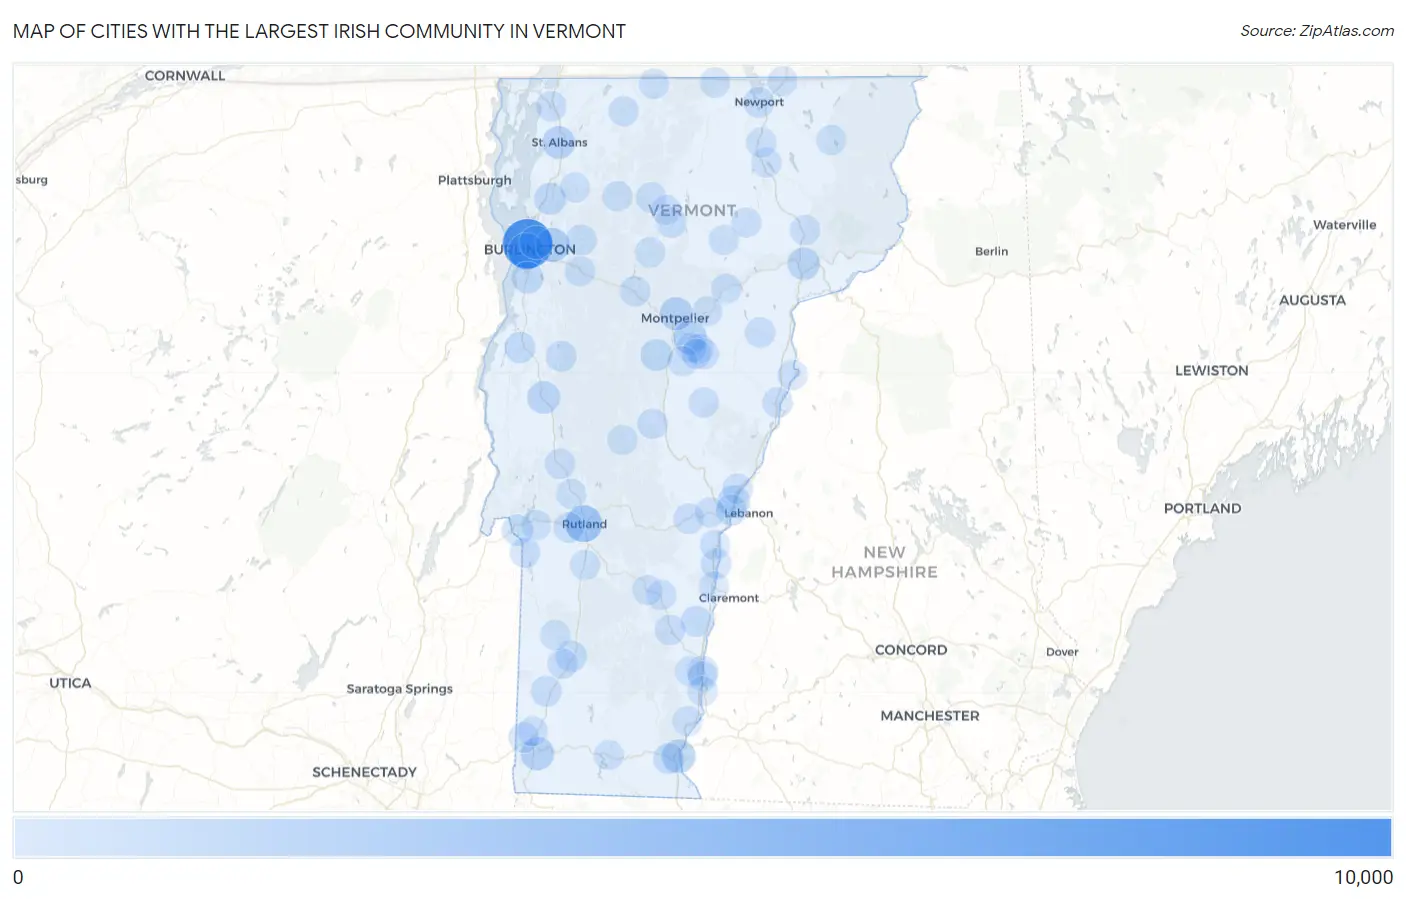
Map of Cities with the Largest Irish Community in Vermont
0
10,000
Cities with the Largest Irish Community in Vermont
| City | Irish | vs State | vs National | |
| 1. | Burlington | 9,124 | 105,520(8.65%)#1 | 31,313,347(0.03%)#313 |
| 2. | Rutland | 3,061 | 105,520(2.90%)#2 | 31,313,347(0.01%)#1,443 |
| 3. | South Burlington | 2,989 | 105,520(2.83%)#3 | 31,313,347(0.01%)#1,500 |
| 4. | Essex Junction | 1,855 | 105,520(1.76%)#4 | 31,313,347(0.01%)#2,462 |
| 5. | Brattleboro | 1,596 | 105,520(1.51%)#5 | 31,313,347(0.01%)#2,901 |
| 6. | Barre | 1,554 | 105,520(1.47%)#6 | 31,313,347(0.00%)#2,973 |
| 7. | Winooski | 1,532 | 105,520(1.45%)#7 | 31,313,347(0.00%)#3,014 |
| 8. | Bennington | 1,482 | 105,520(1.40%)#8 | 31,313,347(0.00%)#3,094 |
| 9. | Montpelier | 1,463 | 105,520(1.39%)#9 | 31,313,347(0.00%)#3,127 |
| 10. | St Albans | 1,273 | 105,520(1.21%)#10 | 31,313,347(0.00%)#3,517 |
| 11. | Middlebury | 1,161 | 105,520(1.10%)#11 | 31,313,347(0.00%)#3,793 |
| 12. | St Johnsbury | 1,111 | 105,520(1.05%)#12 | 31,313,347(0.00%)#3,929 |
| 13. | Northfield | 887 | 105,520(0.84%)#13 | 31,313,347(0.00%)#4,678 |
| 14. | Shelburne | 878 | 105,520(0.83%)#14 | 31,313,347(0.00%)#4,720 |
| 15. | Milton | 829 | 105,520(0.79%)#15 | 31,313,347(0.00%)#4,921 |
| 16. | Wilder | 810 | 105,520(0.77%)#16 | 31,313,347(0.00%)#4,991 |
| 17. | Manchester Center | 577 | 105,520(0.55%)#17 | 31,313,347(0.00%)#6,300 |
| 18. | Fair Haven | 528 | 105,520(0.50%)#18 | 31,313,347(0.00%)#6,655 |
| 19. | Vergennes | 502 | 105,520(0.48%)#19 | 31,313,347(0.00%)#6,863 |
| 20. | White River Junction | 458 | 105,520(0.43%)#20 | 31,313,347(0.00%)#7,260 |
| 21. | Springfield | 448 | 105,520(0.42%)#21 | 31,313,347(0.00%)#7,335 |
| 22. | Jericho | 430 | 105,520(0.41%)#22 | 31,313,347(0.00%)#7,515 |
| 23. | Newport | 406 | 105,520(0.38%)#23 | 31,313,347(0.00%)#7,759 |
| 24. | West Brattleboro | 389 | 105,520(0.37%)#24 | 31,313,347(0.00%)#7,967 |
| 25. | Bellows Falls | 348 | 105,520(0.33%)#25 | 31,313,347(0.00%)#8,446 |
| 26. | Proctor | 346 | 105,520(0.33%)#26 | 31,313,347(0.00%)#8,478 |
| 27. | Morrisville | 340 | 105,520(0.32%)#27 | 31,313,347(0.00%)#8,565 |
| 28. | Bristol | 340 | 105,520(0.32%)#28 | 31,313,347(0.00%)#8,568 |
| 29. | Arlington | 332 | 105,520(0.31%)#29 | 31,313,347(0.00%)#8,687 |
| 30. | Windsor | 326 | 105,520(0.31%)#30 | 31,313,347(0.00%)#8,794 |
| 31. | West Rutland | 294 | 105,520(0.28%)#31 | 31,313,347(0.00%)#9,275 |
| 32. | Johnson | 282 | 105,520(0.27%)#32 | 31,313,347(0.00%)#9,492 |
| 33. | Chester | 262 | 105,520(0.25%)#33 | 31,313,347(0.00%)#9,859 |
| 34. | Woodstock | 260 | 105,520(0.25%)#34 | 31,313,347(0.00%)#9,912 |
| 35. | East Barre | 236 | 105,520(0.22%)#35 | 31,313,347(0.00%)#10,434 |
| 36. | North Bennington | 228 | 105,520(0.22%)#36 | 31,313,347(0.00%)#10,647 |
| 37. | Randolph | 224 | 105,520(0.21%)#37 | 31,313,347(0.00%)#10,750 |
| 38. | Manchester | 217 | 105,520(0.21%)#38 | 31,313,347(0.00%)#10,945 |
| 39. | Groton | 212 | 105,520(0.20%)#39 | 31,313,347(0.00%)#11,073 |
| 40. | Richmond | 207 | 105,520(0.20%)#40 | 31,313,347(0.00%)#11,191 |
| 41. | Waterbury | 205 | 105,520(0.19%)#41 | 31,313,347(0.00%)#11,249 |
| 42. | Swanton | 204 | 105,520(0.19%)#42 | 31,313,347(0.00%)#11,267 |
| 43. | Brandon | 202 | 105,520(0.19%)#43 | 31,313,347(0.00%)#11,317 |
| 44. | Castleton Four Corners | 202 | 105,520(0.19%)#44 | 31,313,347(0.00%)#11,330 |
| 45. | Bradford | 190 | 105,520(0.18%)#45 | 31,313,347(0.00%)#11,641 |
| 46. | Jeffersonville | 189 | 105,520(0.18%)#46 | 31,313,347(0.00%)#11,682 |
| 47. | Poultney | 174 | 105,520(0.16%)#47 | 31,313,347(0.00%)#12,123 |
| 48. | Enosburg Falls | 167 | 105,520(0.16%)#48 | 31,313,347(0.00%)#12,340 |
| 49. | Marshfield | 158 | 105,520(0.15%)#49 | 31,313,347(0.00%)#12,672 |
| 50. | Lyndon Center | 149 | 105,520(0.14%)#50 | 31,313,347(0.00%)#12,997 |
| 51. | Lyndonville | 147 | 105,520(0.14%)#51 | 31,313,347(0.00%)#13,065 |
| 52. | Richford | 143 | 105,520(0.14%)#52 | 31,313,347(0.00%)#13,218 |
| 53. | Proctorsville | 133 | 105,520(0.13%)#53 | 31,313,347(0.00%)#13,654 |
| 54. | Dorset | 132 | 105,520(0.13%)#54 | 31,313,347(0.00%)#13,695 |
| 55. | Hartford | 131 | 105,520(0.12%)#55 | 31,313,347(0.00%)#13,742 |
| 56. | Norwich | 129 | 105,520(0.12%)#56 | 31,313,347(0.00%)#13,820 |
| 57. | Chelsea | 128 | 105,520(0.12%)#57 | 31,313,347(0.00%)#13,876 |
| 58. | Stowe | 127 | 105,520(0.12%)#58 | 31,313,347(0.00%)#13,906 |
| 59. | Barton | 126 | 105,520(0.12%)#59 | 31,313,347(0.00%)#13,965 |
| 60. | Underhill Flats | 126 | 105,520(0.12%)#60 | 31,313,347(0.00%)#13,967 |
| 61. | Island Pond | 125 | 105,520(0.12%)#61 | 31,313,347(0.00%)#14,001 |
| 62. | Plainfield | 125 | 105,520(0.12%)#62 | 31,313,347(0.00%)#14,011 |
| 63. | Ludlow | 124 | 105,520(0.12%)#63 | 31,313,347(0.00%)#14,050 |
| 64. | Orleans | 123 | 105,520(0.12%)#64 | 31,313,347(0.00%)#14,087 |
| 65. | South Barre | 120 | 105,520(0.11%)#65 | 31,313,347(0.00%)#14,203 |
| 66. | Hyde Park | 118 | 105,520(0.11%)#66 | 31,313,347(0.00%)#14,323 |
| 67. | Quechee | 116 | 105,520(0.11%)#67 | 31,313,347(0.00%)#14,418 |
| 68. | Wallingford | 113 | 105,520(0.11%)#68 | 31,313,347(0.00%)#14,548 |
| 69. | West Pawlet | 113 | 105,520(0.11%)#69 | 31,313,347(0.00%)#14,567 |
| 70. | Fairfax | 110 | 105,520(0.10%)#70 | 31,313,347(0.00%)#14,697 |
| 71. | Stamford | 109 | 105,520(0.10%)#71 | 31,313,347(0.00%)#14,749 |
| 72. | Saxtons River | 107 | 105,520(0.10%)#72 | 31,313,347(0.00%)#14,866 |
| 73. | Putney | 106 | 105,520(0.10%)#73 | 31,313,347(0.00%)#14,940 |
| 74. | Hardwick | 99 | 105,520(0.09%)#74 | 31,313,347(0.00%)#15,346 |
| 75. | Websterville | 99 | 105,520(0.09%)#75 | 31,313,347(0.00%)#15,387 |
| 76. | Pownal Center | 97 | 105,520(0.09%)#76 | 31,313,347(0.00%)#15,495 |
| 77. | North Westminster | 97 | 105,520(0.09%)#77 | 31,313,347(0.00%)#15,512 |
| 78. | Huntington | 95 | 105,520(0.09%)#78 | 31,313,347(0.00%)#15,608 |
| 79. | North Troy | 92 | 105,520(0.09%)#79 | 31,313,347(0.00%)#15,792 |
| 80. | Newbury | 91 | 105,520(0.09%)#80 | 31,313,347(0.00%)#15,894 |
| 81. | Castleton | 88 | 105,520(0.08%)#81 | 31,313,347(0.00%)#16,035 |
| 82. | South Shaftsbury | 86 | 105,520(0.08%)#82 | 31,313,347(0.00%)#16,210 |
| 83. | North Pownal | 82 | 105,520(0.08%)#83 | 31,313,347(0.00%)#16,479 |
| 84. | Pittsford | 78 | 105,520(0.07%)#84 | 31,313,347(0.00%)#16,766 |
| 85. | Lyndon | 78 | 105,520(0.07%)#85 | 31,313,347(0.00%)#16,795 |
| 86. | St. George | 77 | 105,520(0.07%)#86 | 31,313,347(0.00%)#16,870 |
| 87. | Wilmington | 75 | 105,520(0.07%)#87 | 31,313,347(0.00%)#17,040 |
| 88. | Lunenburg | 75 | 105,520(0.07%)#88 | 31,313,347(0.00%)#17,046 |
| 89. | Derby Line | 74 | 105,520(0.07%)#89 | 31,313,347(0.00%)#17,081 |
| 90. | Ascutney | 74 | 105,520(0.07%)#90 | 31,313,347(0.00%)#17,106 |
| 91. | West Woodstock | 74 | 105,520(0.07%)#91 | 31,313,347(0.00%)#17,113 |
| 92. | Westminster | 71 | 105,520(0.07%)#92 | 31,313,347(0.00%)#17,318 |
| 93. | North Hyde Park | 69 | 105,520(0.07%)#93 | 31,313,347(0.00%)#17,505 |
| 94. | Gilman | 69 | 105,520(0.07%)#94 | 31,313,347(0.00%)#17,517 |
| 95. | North Clarendon | 68 | 105,520(0.06%)#95 | 31,313,347(0.00%)#17,592 |
| 96. | Hartland | 66 | 105,520(0.06%)#96 | 31,313,347(0.00%)#17,736 |
| 97. | Williamstown | 65 | 105,520(0.06%)#97 | 31,313,347(0.00%)#17,795 |
| 98. | Graniteville | 60 | 105,520(0.06%)#98 | 31,313,347(0.00%)#18,291 |
| 99. | Rochester | 59 | 105,520(0.06%)#99 | 31,313,347(0.00%)#18,418 |
| 100. | Greensboro Bend | 59 | 105,520(0.06%)#100 | 31,313,347(0.00%)#18,419 |
1
2Common Questions
What are the Top 10 Cities with the Largest Irish Community in Vermont?
Top 10 Cities with the Largest Irish Community in Vermont are:
#1
9,124
#2
3,061
#3
2,989
#4
1,855
#5
1,596
#6
1,554
#7
1,532
#8
1,482
#9
1,463
#10
1,273
What city has the Largest Irish Community in Vermont?
Burlington has the Largest Irish Community in Vermont with 9,124.
What is the Total Irish Population in the State of Vermont?
Total Irish Population in Vermont is 105,520.
What is the Total Irish Population in the United States?
Total Irish Population in the United States is 31,313,347.