Milton, VT Map & Demographics
Milton Map
Milton Overview
$35,095
PER CAPITA INCOME
$105,938
AVG FAMILY INCOME
$81,526
AVG HOUSEHOLD INCOME
8.3%
WAGE / INCOME GAP [ % ]
91.7¢/ $1
WAGE / INCOME GAP [ $ ]
0.38
INEQUALITY / GINI INDEX
3,712
TOTAL POPULATION
1,961
MALE POPULATION
1,751
FEMALE POPULATION
111.99
MALES / 100 FEMALES
89.29
FEMALES / 100 MALES
40.3
MEDIAN AGE
3.2
AVG FAMILY SIZE
2.7
AVG HOUSEHOLD SIZE
2,175
LABOR FORCE [ PEOPLE ]
69.5%
PERCENT IN LABOR FORCE
16.0%
UNEMPLOYMENT RATE
Milton Zip Codes
Milton Area Codes
Income in Milton
Income Overview in Milton
Per Capita Income in Milton is $35,095, while median incomes of families and households are $105,938 and $81,526 respectively.
| Characteristic | Number | Measure |
| Per Capita Income | 3,712 | $35,095 |
| Median Family Income | 936 | $105,938 |
| Mean Family Income | 936 | $108,177 |
| Median Household Income | 1,396 | $81,526 |
| Mean Household Income | 1,396 | $90,819 |
| Income Deficit | 936 | $0 |
| Wage / Income Gap (%) | 3,712 | 8.33% |
| Wage / Income Gap ($) | 3,712 | 91.67¢ per $1 |
| Gini / Inequality Index | 3,712 | 0.38 |
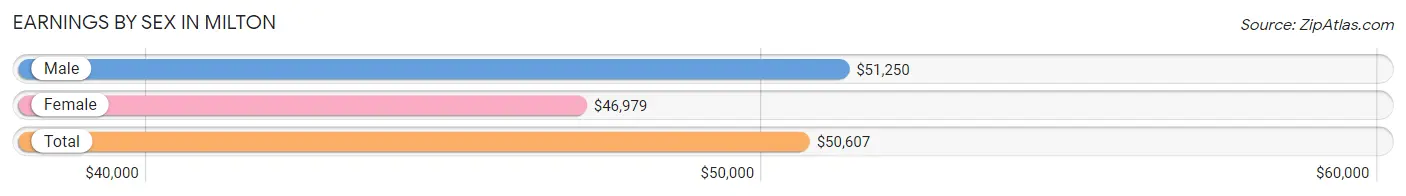
Earnings by Sex in Milton
Average Earnings in Milton are $50,607, $51,250 for men and $46,979 for women, a difference of 8.3%.
| Sex | Number | Average Earnings |
| Male | 1,053 (55.0%) | $51,250 |
| Female | 861 (45.0%) | $46,979 |
| Total | 1,914 (100.0%) | $50,607 |
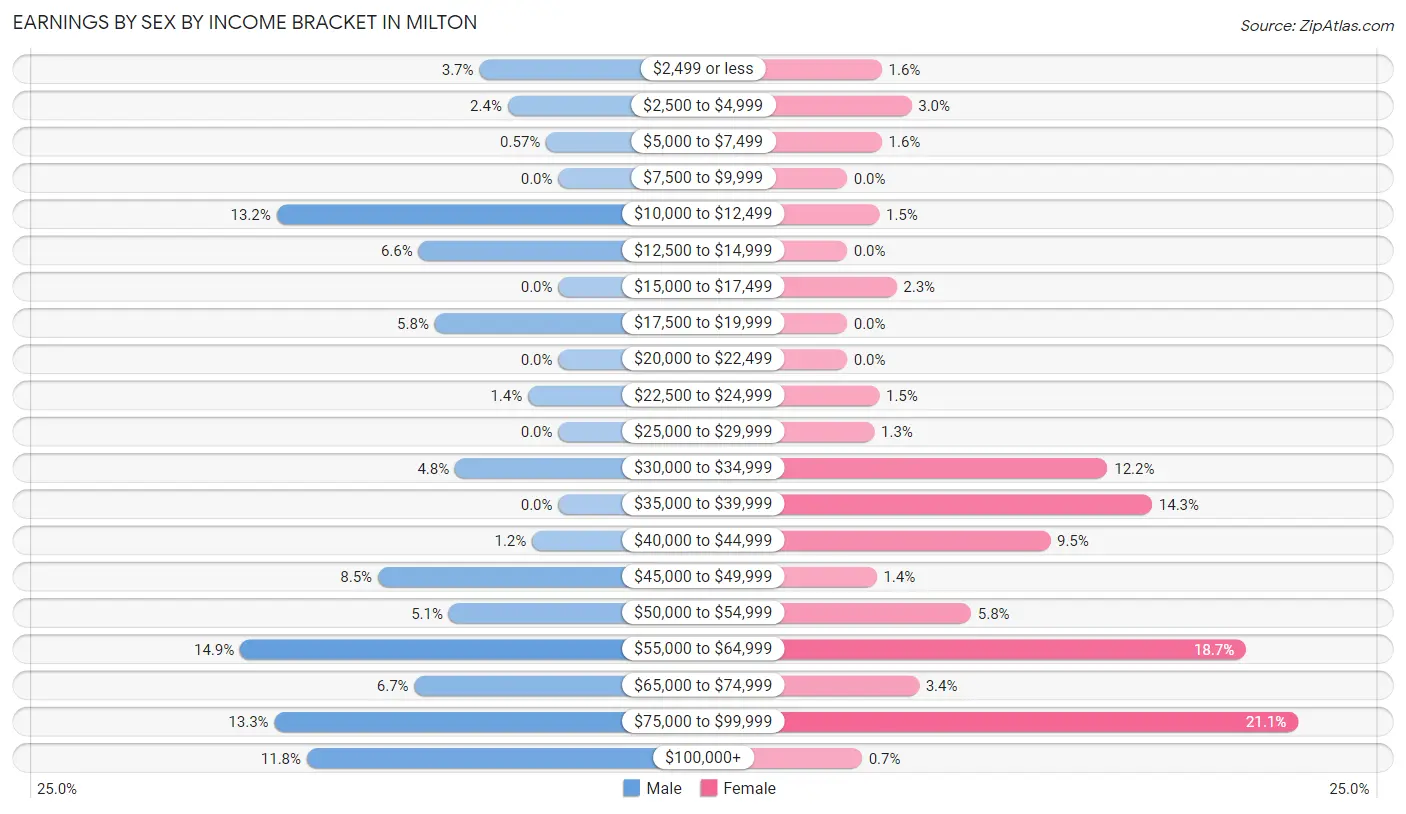
Earnings by Sex by Income Bracket in Milton
The most common earnings brackets in Milton are $55,000 to $64,999 for men (157 | 14.9%) and $75,000 to $99,999 for women (182 | 21.1%).
| Income | Male | Female |
| $2,499 or less | 39 (3.7%) | 14 (1.6%) |
| $2,500 to $4,999 | 25 (2.4%) | 26 (3.0%) |
| $5,000 to $7,499 | 6 (0.6%) | 14 (1.6%) |
| $7,500 to $9,999 | 0 (0.0%) | 0 (0.0%) |
| $10,000 to $12,499 | 139 (13.2%) | 13 (1.5%) |
| $12,500 to $14,999 | 69 (6.6%) | 0 (0.0%) |
| $15,000 to $17,499 | 0 (0.0%) | 20 (2.3%) |
| $17,500 to $19,999 | 61 (5.8%) | 0 (0.0%) |
| $20,000 to $22,499 | 0 (0.0%) | 0 (0.0%) |
| $22,500 to $24,999 | 15 (1.4%) | 13 (1.5%) |
| $25,000 to $29,999 | 0 (0.0%) | 11 (1.3%) |
| $30,000 to $34,999 | 51 (4.8%) | 105 (12.2%) |
| $35,000 to $39,999 | 0 (0.0%) | 123 (14.3%) |
| $40,000 to $44,999 | 13 (1.2%) | 82 (9.5%) |
| $45,000 to $49,999 | 89 (8.5%) | 12 (1.4%) |
| $50,000 to $54,999 | 54 (5.1%) | 50 (5.8%) |
| $55,000 to $64,999 | 157 (14.9%) | 161 (18.7%) |
| $65,000 to $74,999 | 71 (6.7%) | 29 (3.4%) |
| $75,000 to $99,999 | 140 (13.3%) | 182 (21.1%) |
| $100,000+ | 124 (11.8%) | 6 (0.7%) |
| Total | 1,053 (100.0%) | 861 (100.0%) |
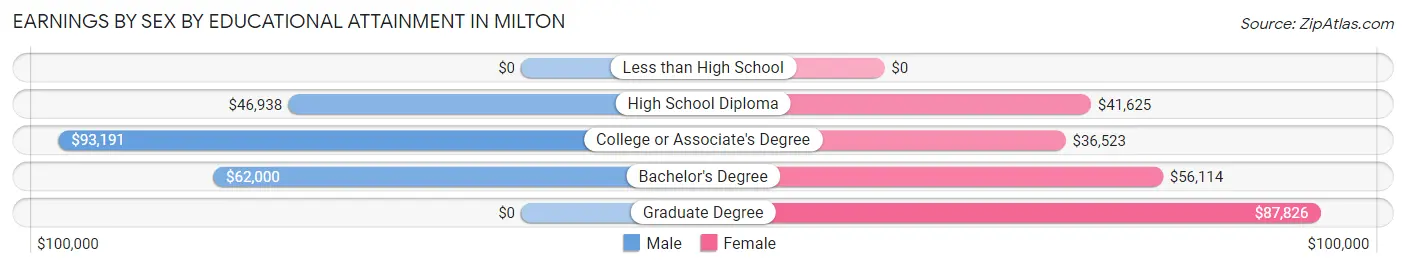
Earnings by Sex by Educational Attainment in Milton
Average earnings in Milton are $59,943 for men and $50,484 for women, a difference of 15.8%. Men with an educational attainment of college or associate's degree enjoy the highest average annual earnings of $93,191, while those with high school diploma education earn the least with $46,938. Women with an educational attainment of graduate degree earn the most with the average annual earnings of $87,826, while those with college or associate's degree education have the smallest earnings of $36,523.
| Educational Attainment | Male Income | Female Income |
| Less than High School | - | - |
| High School Diploma | $46,938 | $41,625 |
| College or Associate's Degree | $93,191 | $36,523 |
| Bachelor's Degree | $62,000 | $56,114 |
| Graduate Degree | - | - |
| Total | $59,943 | $50,484 |
Family Income in Milton
Family Income Brackets in Milton
According to the Milton family income data, there are 317 families falling into the $100,000 to $149,999 income range, which is the most common income bracket and makes up 33.9% of all families.
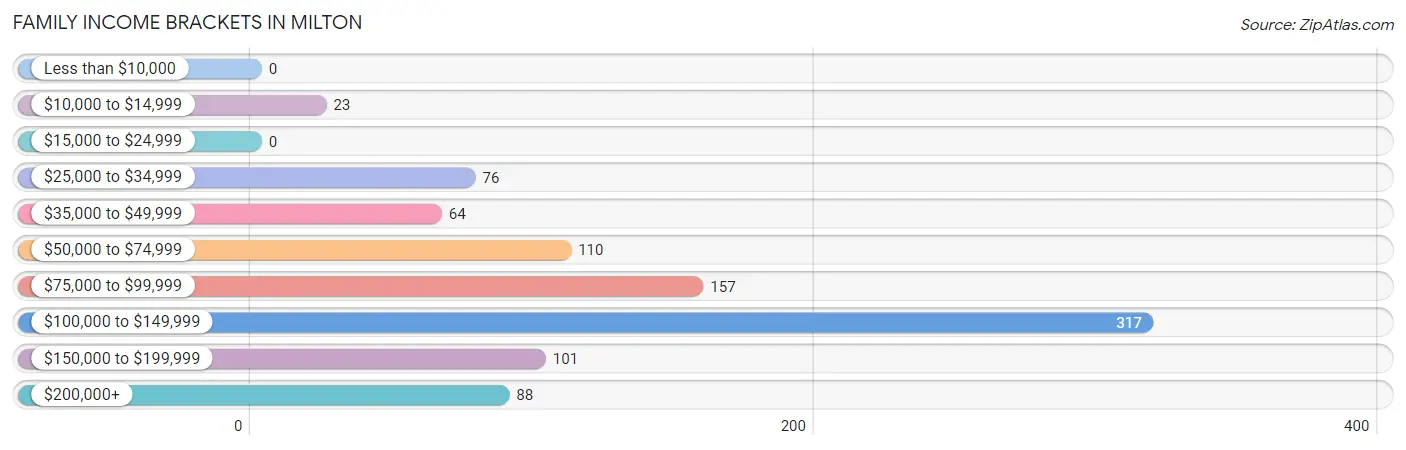
| Income Bracket | # Families | % Families |
| Less than $10,000 | 0 | 0.0% |
| $10,000 to $14,999 | 23 | 2.5% |
| $15,000 to $24,999 | 0 | 0.0% |
| $25,000 to $34,999 | 76 | 8.1% |
| $35,000 to $49,999 | 64 | 6.8% |
| $50,000 to $74,999 | 110 | 11.8% |
| $75,000 to $99,999 | 157 | 16.8% |
| $100,000 to $149,999 | 317 | 33.9% |
| $150,000 to $199,999 | 101 | 10.8% |
| $200,000+ | 88 | 9.4% |
Family Income by Famaliy Size in Milton
2-person families (501 | 53.5%) account for the highest median family income in Milton with $115,625 per family, while 2-person families (501 | 53.5%) have the highest median income of $57,812 per family member.
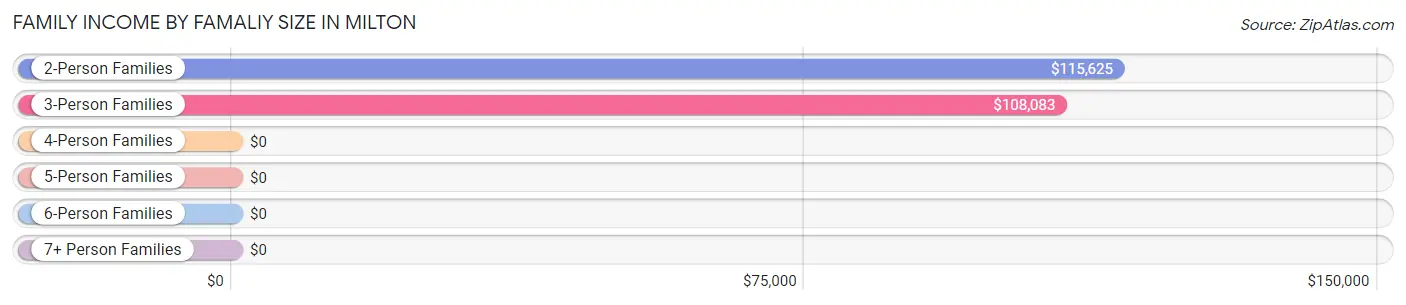
| Income Bracket | # Families | Median Income |
| 2-Person Families | 501 (53.5%) | $115,625 |
| 3-Person Families | 158 (16.9%) | $108,083 |
| 4-Person Families | 231 (24.7%) | $0 |
| 5-Person Families | 46 (4.9%) | $0 |
| 6-Person Families | 0 (0.0%) | $0 |
| 7+ Person Families | 0 (0.0%) | $0 |
| Total | 936 (100.0%) | $105,938 |
Family Income by Number of Earners in Milton
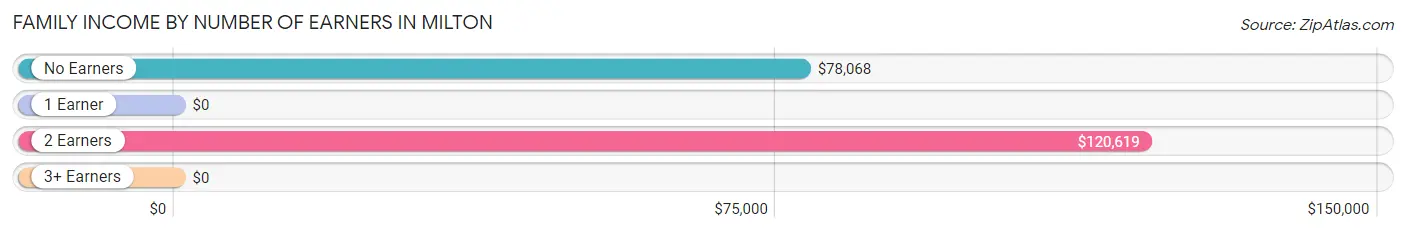
| Number of Earners | # Families | Median Income |
| No Earners | 56 (6.0%) | $78,068 |
| 1 Earner | 292 (31.2%) | $0 |
| 2 Earners | 541 (57.8%) | $120,619 |
| 3+ Earners | 47 (5.0%) | $0 |
| Total | 936 (100.0%) | $105,938 |
Household Income in Milton
Household Income Brackets in Milton
With 334 households falling in the category, the $100,000 to $149,999 income range is the most frequent in Milton, accounting for 23.9% of all households. In contrast, only 18 households (1.3%) fall into the less than $10,000 income bracket, making it the least populous group.
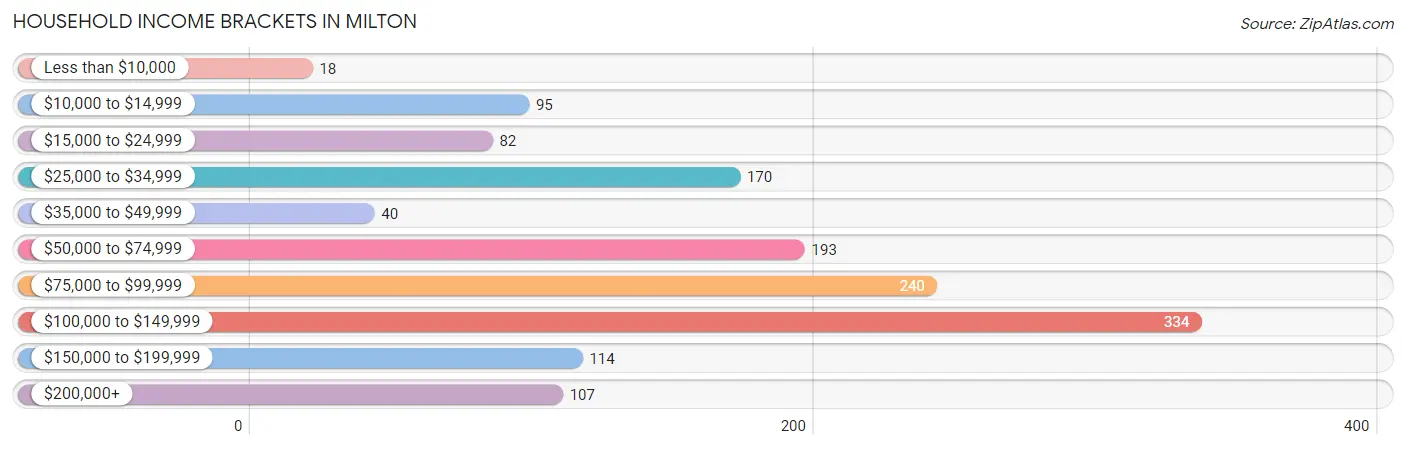
| Income Bracket | # Households | % Households |
| Less than $10,000 | 18 | 1.3% |
| $10,000 to $14,999 | 95 | 6.8% |
| $15,000 to $24,999 | 82 | 5.9% |
| $25,000 to $34,999 | 170 | 12.2% |
| $35,000 to $49,999 | 40 | 2.9% |
| $50,000 to $74,999 | 193 | 13.8% |
| $75,000 to $99,999 | 240 | 17.2% |
| $100,000 to $149,999 | 334 | 23.9% |
| $150,000 to $199,999 | 114 | 8.2% |
| $200,000+ | 107 | 7.7% |
Household Income by Householder Age in Milton
The median household income in Milton is $81,526, with the highest median household income of $100,948 found in the 25 to 44 years age bracket for the primary householder. A total of 354 households (25.4%) fall into this category. Meanwhile, the 15 to 24 years age bracket for the primary householder has the lowest median household income of $0, with 17 households (1.2%) in this group.
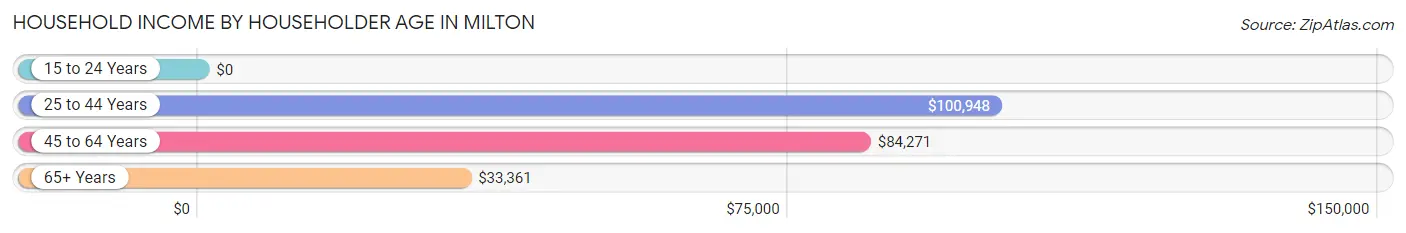
| Income Bracket | # Households | Median Income |
| 15 to 24 Years | 17 (1.2%) | $0 |
| 25 to 44 Years | 354 (25.4%) | $100,948 |
| 45 to 64 Years | 697 (49.9%) | $84,271 |
| 65+ Years | 328 (23.5%) | $33,361 |
| Total | 1,396 (100.0%) | $81,526 |
Poverty in Milton
Income Below Poverty by Sex and Age in Milton
With 10.3% poverty level for males and 4.1% for females among the residents of Milton, 45 to 54 year old males and 75 year old and over females are the most vulnerable to poverty, with 41 males (27.0%) and 18 females (32.7%) in their respective age groups living below the poverty level.
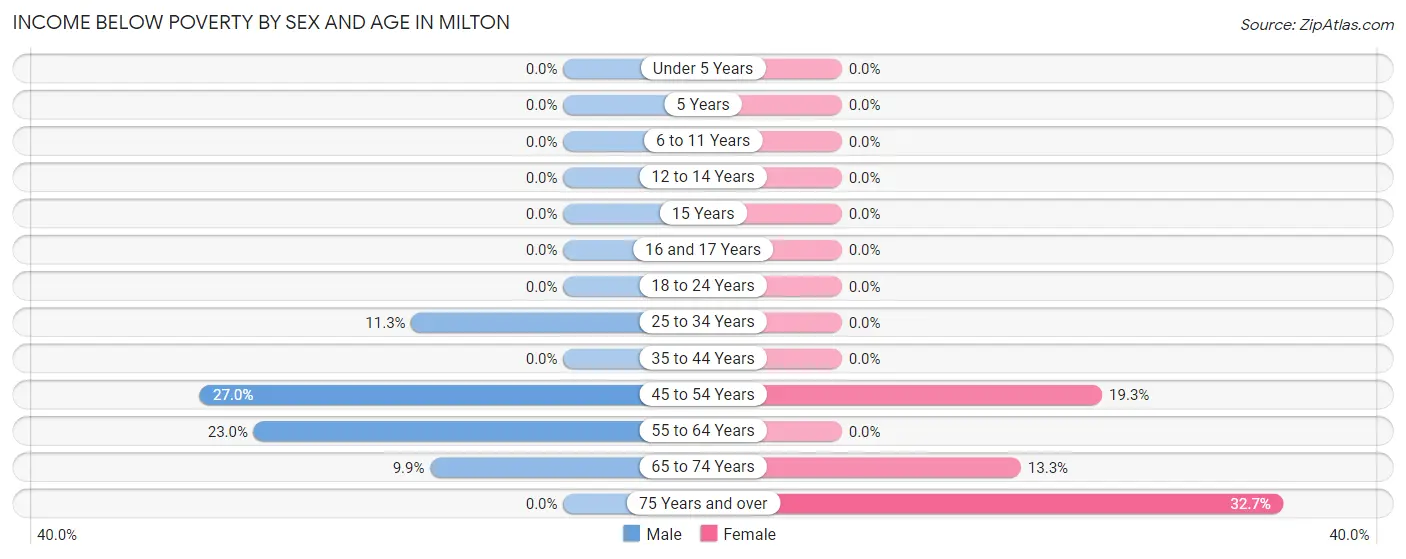
| Age Bracket | Male | Female |
| Under 5 Years | 0 (0.0%) | 0 (0.0%) |
| 5 Years | 0 (0.0%) | 0 (0.0%) |
| 6 to 11 Years | 0 (0.0%) | 0 (0.0%) |
| 12 to 14 Years | 0 (0.0%) | 0 (0.0%) |
| 15 Years | 0 (0.0%) | 0 (0.0%) |
| 16 and 17 Years | 0 (0.0%) | 0 (0.0%) |
| 18 to 24 Years | 0 (0.0%) | 0 (0.0%) |
| 25 to 34 Years | 37 (11.3%) | 0 (0.0%) |
| 35 to 44 Years | 0 (0.0%) | 0 (0.0%) |
| 45 to 54 Years | 41 (27.0%) | 23 (19.3%) |
| 55 to 64 Years | 108 (23.0%) | 0 (0.0%) |
| 65 to 74 Years | 16 (9.9%) | 31 (13.3%) |
| 75 Years and over | 0 (0.0%) | 18 (32.7%) |
| Total | 202 (10.3%) | 72 (4.1%) |
Income Above Poverty by Sex and Age in Milton
According to the poverty statistics in Milton, males aged under 5 years and females aged under 5 years are the age groups that are most secure financially, with 100.0% of males and 100.0% of females in these age groups living above the poverty line.
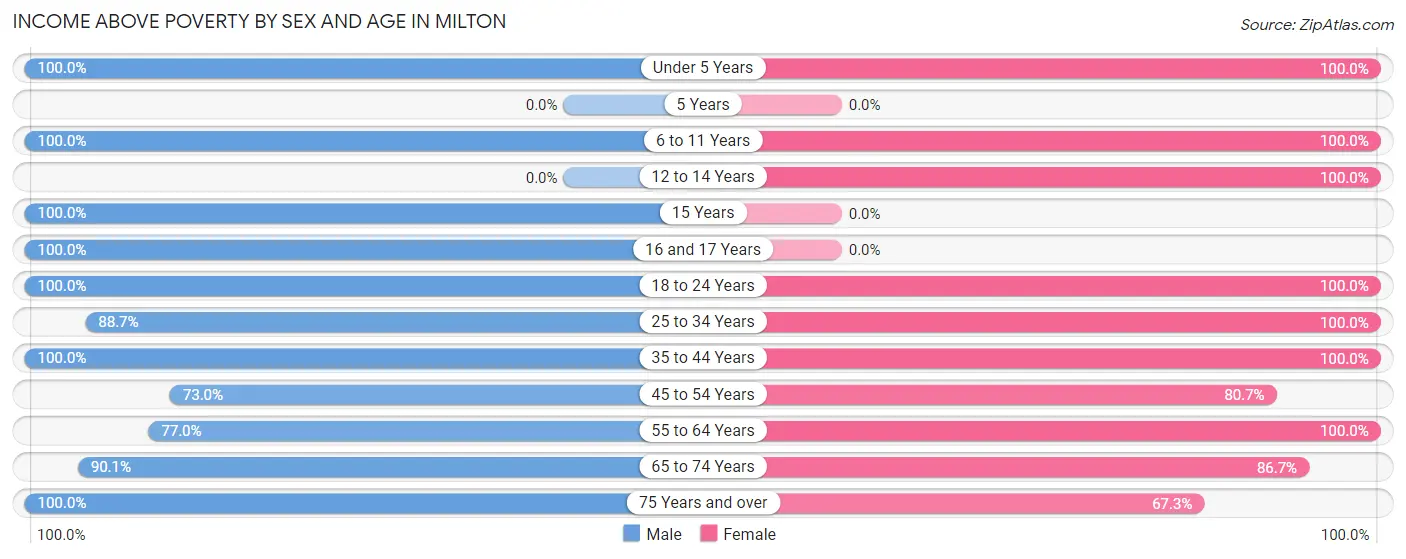
| Age Bracket | Male | Female |
| Under 5 Years | 83 (100.0%) | 136 (100.0%) |
| 5 Years | 0 (0.0%) | 0 (0.0%) |
| 6 to 11 Years | 157 (100.0%) | 93 (100.0%) |
| 12 to 14 Years | 0 (0.0%) | 101 (100.0%) |
| 15 Years | 12 (100.0%) | 0 (0.0%) |
| 16 and 17 Years | 59 (100.0%) | 0 (0.0%) |
| 18 to 24 Years | 443 (100.0%) | 23 (100.0%) |
| 25 to 34 Years | 291 (88.7%) | 325 (100.0%) |
| 35 to 44 Years | 87 (100.0%) | 139 (100.0%) |
| 45 to 54 Years | 111 (73.0%) | 96 (80.7%) |
| 55 to 64 Years | 362 (77.0%) | 527 (100.0%) |
| 65 to 74 Years | 146 (90.1%) | 202 (86.7%) |
| 75 Years and over | 8 (100.0%) | 37 (67.3%) |
| Total | 1,759 (89.7%) | 1,679 (95.9%) |
Income Below Poverty Among Married-Couple Families in Milton
The poverty statistics for married-couple families in Milton show that 3.4% or 23 of the total 673 families live below the poverty line. Families with no children have the highest poverty rate of 4.5%, comprising of 23 families. On the other hand, families with 1 or 2 children have the lowest poverty rate of 0.0%, which includes 0 families.
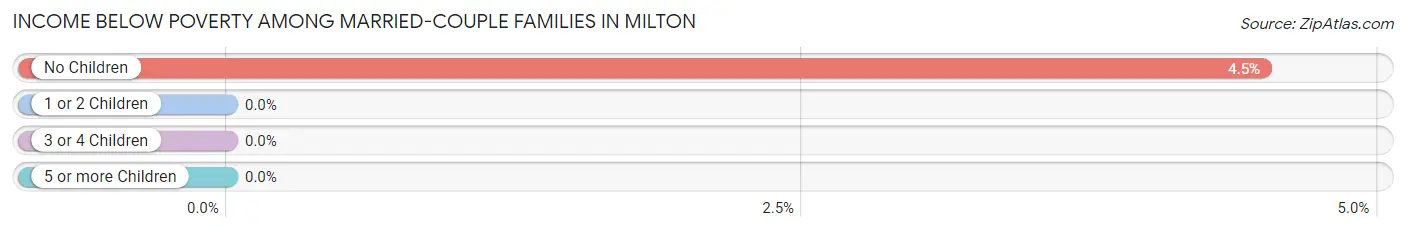
| Children | Above Poverty | Below Poverty |
| No Children | 488 (95.5%) | 23 (4.5%) |
| 1 or 2 Children | 161 (100.0%) | 0 (0.0%) |
| 3 or 4 Children | 1 (100.0%) | 0 (0.0%) |
| 5 or more Children | 0 (0.0%) | 0 (0.0%) |
| Total | 650 (96.6%) | 23 (3.4%) |
Income Below Poverty Among Single-Parent Households in Milton
| Children | Single Father | Single Mother |
| No Children | 0 (0.0%) | 0 (0.0%) |
| 1 or 2 Children | 0 (0.0%) | 0 (0.0%) |
| 3 or 4 Children | 0 (0.0%) | 0 (0.0%) |
| 5 or more Children | 0 (0.0%) | 0 (0.0%) |
| Total | 0 (0.0%) | 0 (0.0%) |
Income Below Poverty Among Married-Couple vs Single-Parent Households in Milton
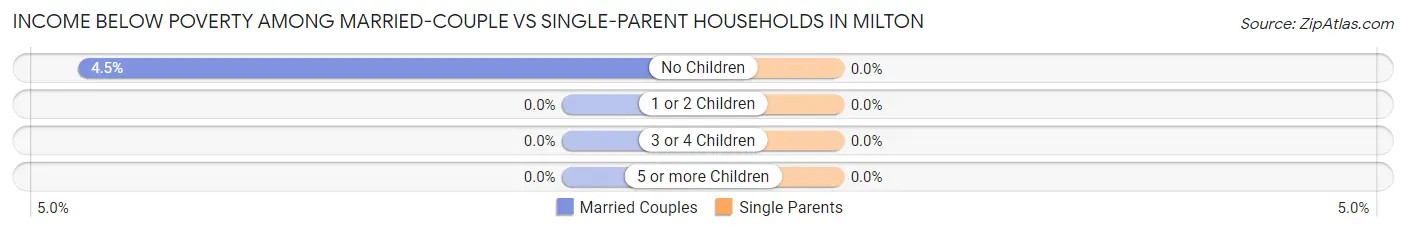
| Children | Married-Couple Families | Single-Parent Households |
| No Children | 23 (4.5%) | 0 (0.0%) |
| 1 or 2 Children | 0 (0.0%) | 0 (0.0%) |
| 3 or 4 Children | 0 (0.0%) | 0 (0.0%) |
| 5 or more Children | 0 (0.0%) | 0 (0.0%) |
| Total | 23 (3.4%) | 0 (0.0%) |
Race in Milton
The most populous races in Milton are White / Caucasian (3,417 | 92.0%), Black / African American (202 | 5.4%), and Two or more Races (80 | 2.2%).
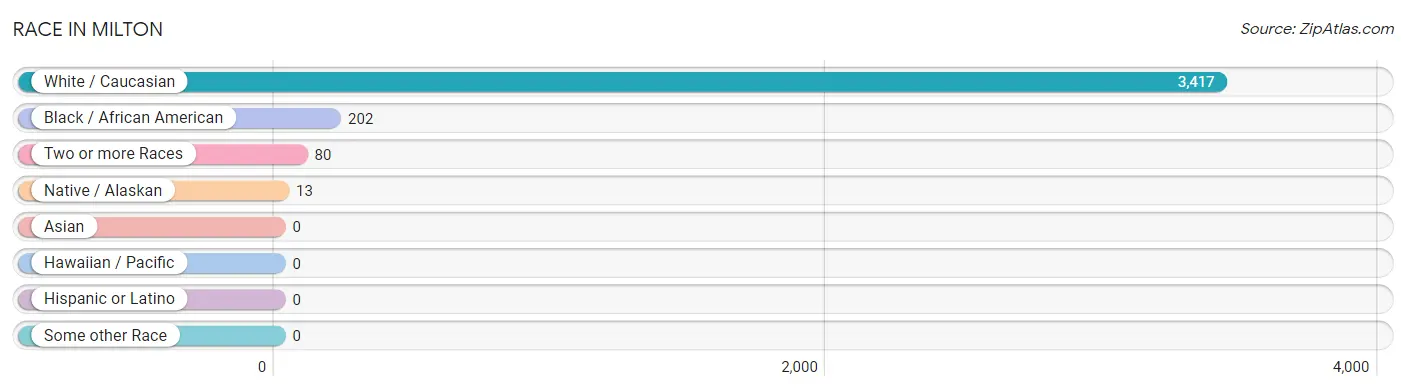
| Race | # Population | % Population |
| Asian | 0 | 0.0% |
| Black / African American | 202 | 5.4% |
| Hawaiian / Pacific | 0 | 0.0% |
| Hispanic or Latino | 0 | 0.0% |
| Native / Alaskan | 13 | 0.4% |
| White / Caucasian | 3,417 | 92.0% |
| Two or more Races | 80 | 2.2% |
| Some other Race | 0 | 0.0% |
| Total | 3,712 | 100.0% |
Ancestry in Milton
The most populous ancestries reported in Milton are French (916 | 24.7%), Irish (829 | 22.3%), French Canadian (759 | 20.4%), English (462 | 12.4%), and American (243 | 6.6%), together accounting for 86.5% of all Milton residents.
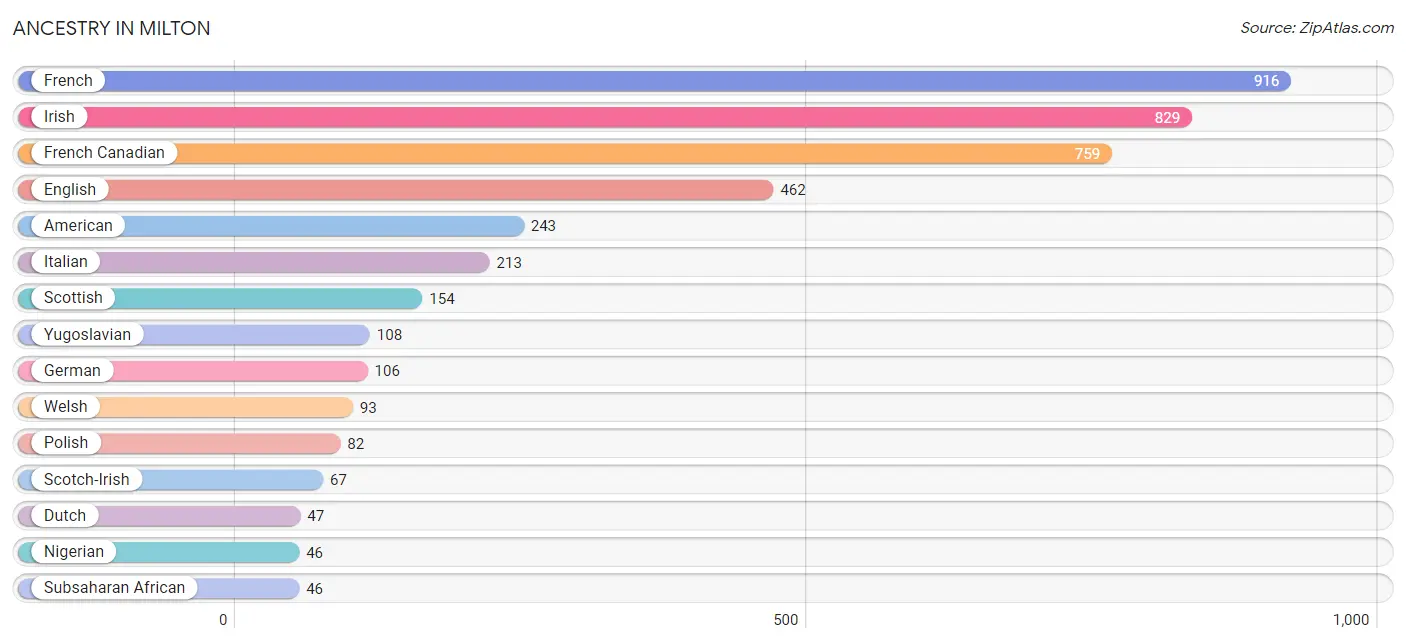
| Ancestry | # Population | % Population |
| American | 243 | 6.6% |
| Arab | 17 | 0.5% |
| Canadian | 4 | 0.1% |
| Dutch | 47 | 1.3% |
| English | 462 | 12.4% |
| European | 6 | 0.2% |
| Finnish | 11 | 0.3% |
| French | 916 | 24.7% |
| French Canadian | 759 | 20.4% |
| German | 106 | 2.9% |
| Irish | 829 | 22.3% |
| Iroquois | 15 | 0.4% |
| Italian | 213 | 5.7% |
| Lebanese | 17 | 0.5% |
| Lithuanian | 18 | 0.5% |
| Nigerian | 46 | 1.2% |
| Norwegian | 26 | 0.7% |
| Polish | 82 | 2.2% |
| Portuguese | 11 | 0.3% |
| Scotch-Irish | 67 | 1.8% |
| Scottish | 154 | 4.2% |
| Subsaharan African | 46 | 1.2% |
| Swiss | 17 | 0.5% |
| Welsh | 93 | 2.5% |
| Yugoslavian | 108 | 2.9% | View All 25 Rows |
Immigrants in Milton
The most numerous immigrant groups reported in Milton came from Europe (121 | 3.3%), Bosnia and Herzegovina (108 | 2.9%), Eastern Europe (108 | 2.9%), Canada (18 | 0.5%), and Germany (13 | 0.4%), together accounting for 9.9% of all Milton residents.
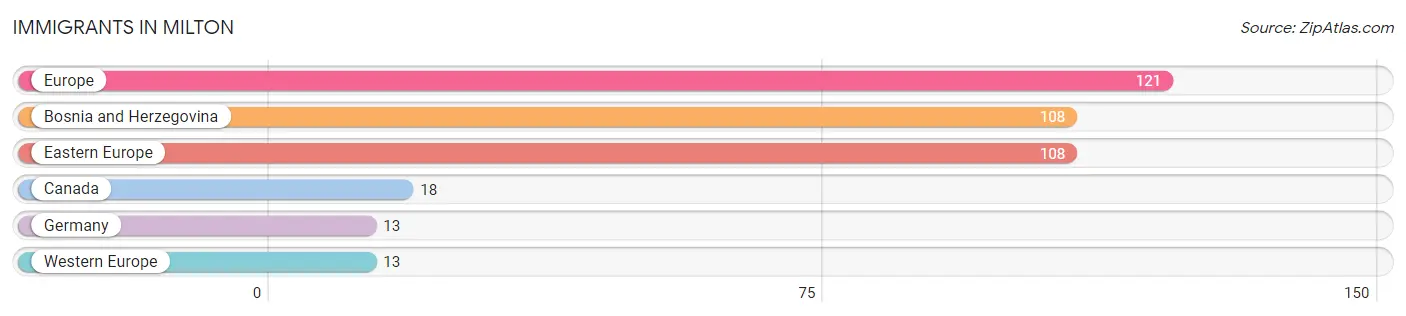
| Immigration Origin | # Population | % Population |
| Bosnia and Herzegovina | 108 | 2.9% |
| Canada | 18 | 0.5% |
| Eastern Europe | 108 | 2.9% |
| Europe | 121 | 3.3% |
| Germany | 13 | 0.4% |
| Western Europe | 13 | 0.4% | View All 6 Rows |
Sex and Age in Milton
Sex and Age in Milton
The most populous age groups in Milton are 15 to 19 Years (402 | 20.5%) for men and 60 to 64 Years (291 | 16.6%) for women.
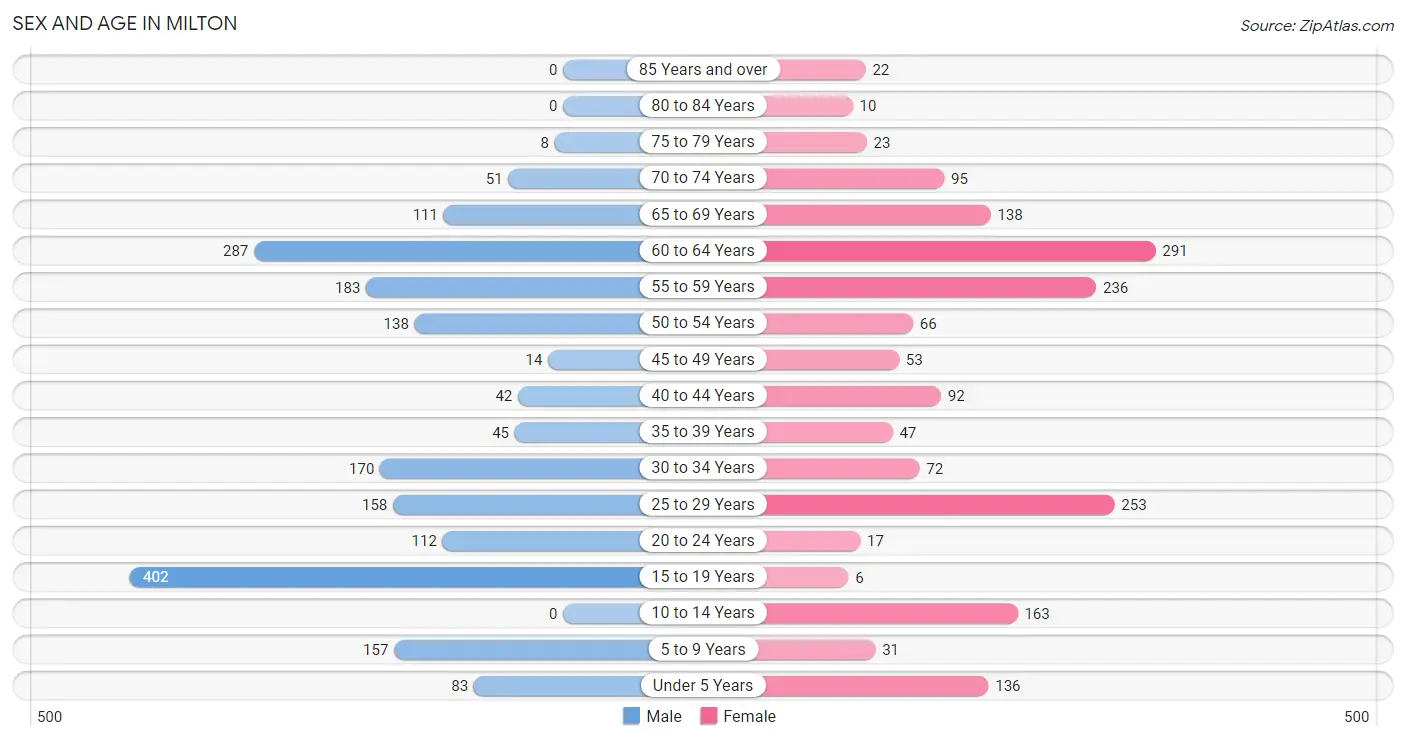
| Age Bracket | Male | Female |
| Under 5 Years | 83 (4.2%) | 136 (7.8%) |
| 5 to 9 Years | 157 (8.0%) | 31 (1.8%) |
| 10 to 14 Years | 0 (0.0%) | 163 (9.3%) |
| 15 to 19 Years | 402 (20.5%) | 6 (0.3%) |
| 20 to 24 Years | 112 (5.7%) | 17 (1.0%) |
| 25 to 29 Years | 158 (8.1%) | 253 (14.4%) |
| 30 to 34 Years | 170 (8.7%) | 72 (4.1%) |
| 35 to 39 Years | 45 (2.3%) | 47 (2.7%) |
| 40 to 44 Years | 42 (2.1%) | 92 (5.2%) |
| 45 to 49 Years | 14 (0.7%) | 53 (3.0%) |
| 50 to 54 Years | 138 (7.0%) | 66 (3.8%) |
| 55 to 59 Years | 183 (9.3%) | 236 (13.5%) |
| 60 to 64 Years | 287 (14.6%) | 291 (16.6%) |
| 65 to 69 Years | 111 (5.7%) | 138 (7.9%) |
| 70 to 74 Years | 51 (2.6%) | 95 (5.4%) |
| 75 to 79 Years | 8 (0.4%) | 23 (1.3%) |
| 80 to 84 Years | 0 (0.0%) | 10 (0.6%) |
| 85 Years and over | 0 (0.0%) | 22 (1.3%) |
| Total | 1,961 (100.0%) | 1,751 (100.0%) |
Families and Households in Milton
Median Family Size in Milton
The median family size in Milton is 3.19 persons per family, with single female/mother families (228 | 24.4%) accounting for the largest median family size of 3.5 persons per family. On the other hand, single male/father families (35 | 3.7%) represent the smallest median family size with 2.40 persons per family.
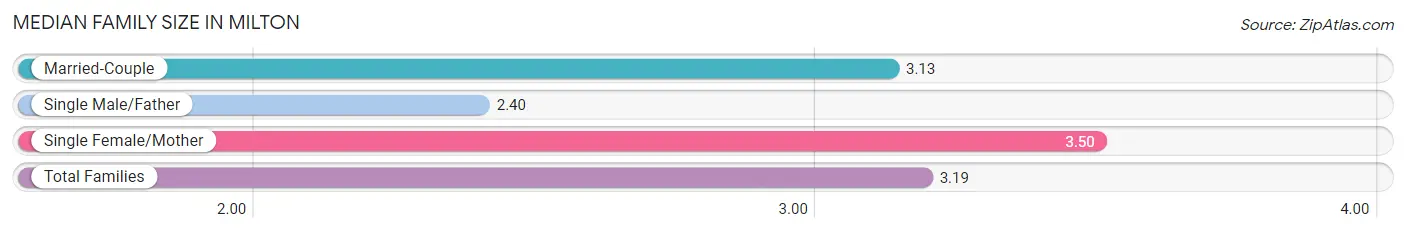
| Family Type | # Families | Family Size |
| Married-Couple | 673 (71.9%) | 3.13 |
| Single Male/Father | 35 (3.7%) | 2.40 |
| Single Female/Mother | 228 (24.4%) | 3.50 |
| Total Families | 936 (100.0%) | 3.19 |
Median Household Size in Milton
The median household size in Milton is 2.66 persons per household, with single female/mother households (228 | 16.3%) accounting for the largest median household size of 4.44 persons per household. non-family households (460 | 33.0%) represent the smallest median household size with 1.11 persons per household.
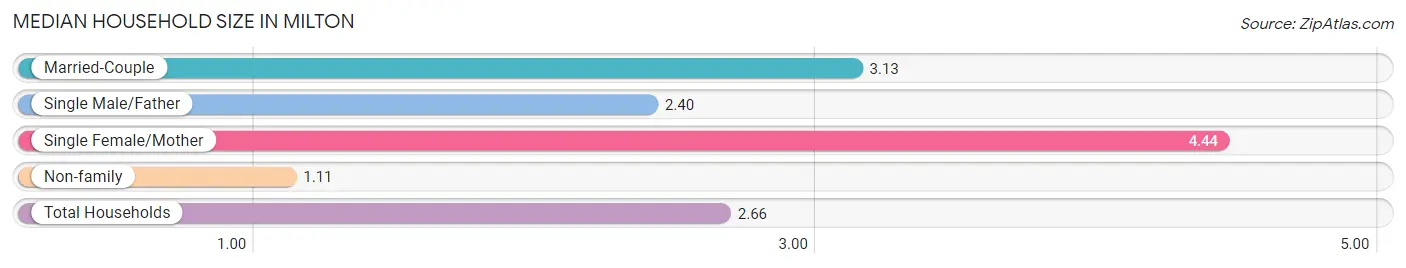
| Household Type | # Households | Household Size |
| Married-Couple | 673 (48.2%) | 3.13 |
| Single Male/Father | 35 (2.5%) | 2.40 |
| Single Female/Mother | 228 (16.3%) | 4.44 |
| Non-family | 460 (33.0%) | 1.11 |
| Total Households | 1,396 (100.0%) | 2.66 |
Household Size by Marriage Status in Milton
Out of a total of 1,396 households in Milton, 936 (67.0%) are family households, while 460 (33.0%) are nonfamily households. The most numerous type of family households are 2-person households, comprising 501, and the most common type of nonfamily households are 1-person households, comprising 410.
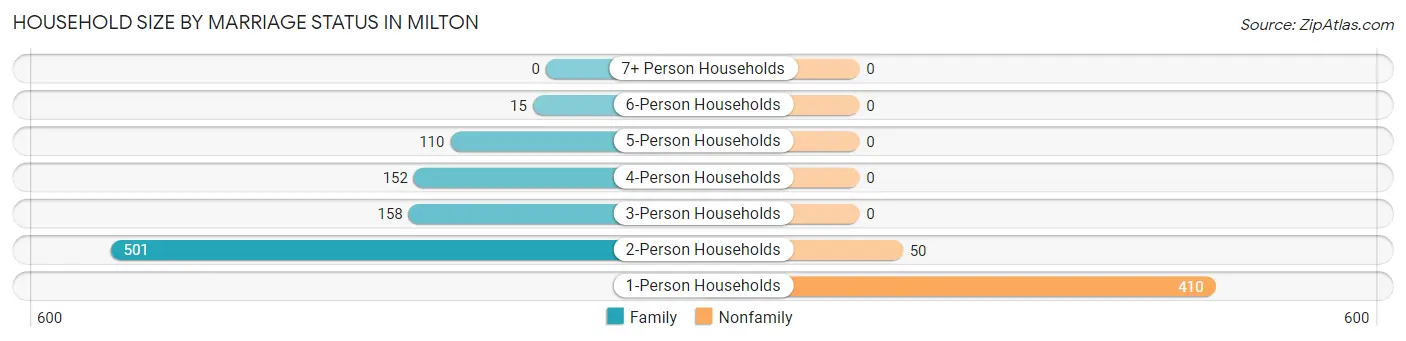
| Household Size | Family Households | Nonfamily Households |
| 1-Person Households | - | 410 (29.4%) |
| 2-Person Households | 501 (35.9%) | 50 (3.6%) |
| 3-Person Households | 158 (11.3%) | 0 (0.0%) |
| 4-Person Households | 152 (10.9%) | 0 (0.0%) |
| 5-Person Households | 110 (7.9%) | 0 (0.0%) |
| 6-Person Households | 15 (1.1%) | 0 (0.0%) |
| 7+ Person Households | 0 (0.0%) | 0 (0.0%) |
| Total | 936 (67.0%) | 460 (33.0%) |
Female Fertility in Milton
Fertility by Age in Milton
Average fertility rate in Milton is 243.0 births per 1,000 women. Women in the age bracket of 20 to 34 years have the highest fertility rate with 360.0 births per 1,000 women. Women in the age bracket of 20 to 34 years acount for 89.8% of all women with births.
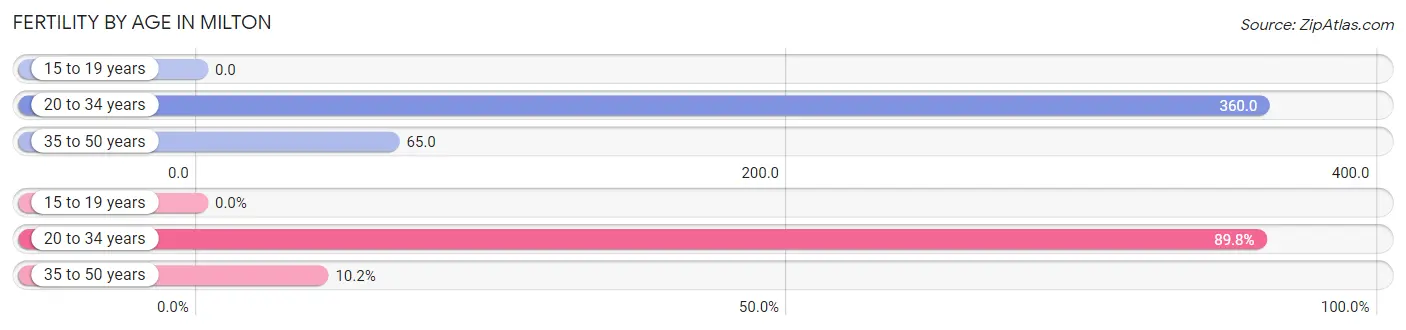
| Age Bracket | Women with Births | Births / 1,000 Women |
| 15 to 19 years | 0 (0.0%) | 0.0 |
| 20 to 34 years | 123 (89.8%) | 360.0 |
| 35 to 50 years | 14 (10.2%) | 65.0 |
| Total | 137 (100.0%) | 243.0 |
Fertility by Age by Marriage Status in Milton
53.3% of women with births (137) in Milton are married. The highest percentage of unmarried women with births falls into 20 to 34 years age bracket with 52.0% of them unmarried at the time of birth, while the lowest percentage of unmarried women with births belong to 35 to 50 years age bracket with 0.0% of them unmarried.
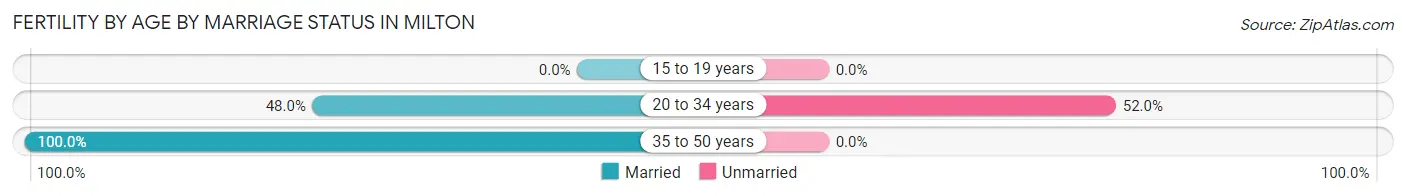
| Age Bracket | Married | Unmarried |
| 15 to 19 years | 0 (0.0%) | 0 (0.0%) |
| 20 to 34 years | 59 (48.0%) | 64 (52.0%) |
| 35 to 50 years | 14 (100.0%) | 0 (0.0%) |
| Total | 73 (53.3%) | 64 (46.7%) |
Fertility by Education in Milton
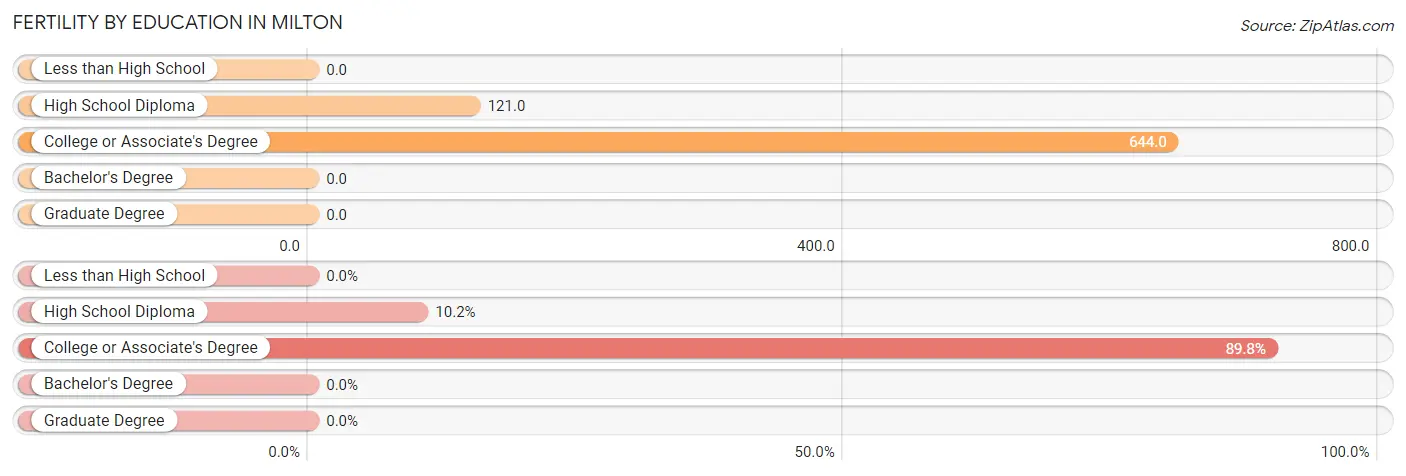
| Educational Attainment | Women with Births | Births / 1,000 Women |
| Less than High School | 0 (0.0%) | 0.0 |
| High School Diploma | 14 (10.2%) | 121.0 |
| College or Associate's Degree | 123 (89.8%) | 644.0 |
| Bachelor's Degree | 0 (0.0%) | 0.0 |
| Graduate Degree | 0 (0.0%) | 0.0 |
| Total | 137 (100.0%) | 243.0 |
Fertility by Education by Marriage Status in Milton
46.7% of women with births in Milton are unmarried. Women with the educational attainment of high school diploma are most likely to be married with 100.0% of them married at childbirth, while women with the educational attainment of college or associate's degree are least likely to be married with 52.0% of them unmarried at childbirth.
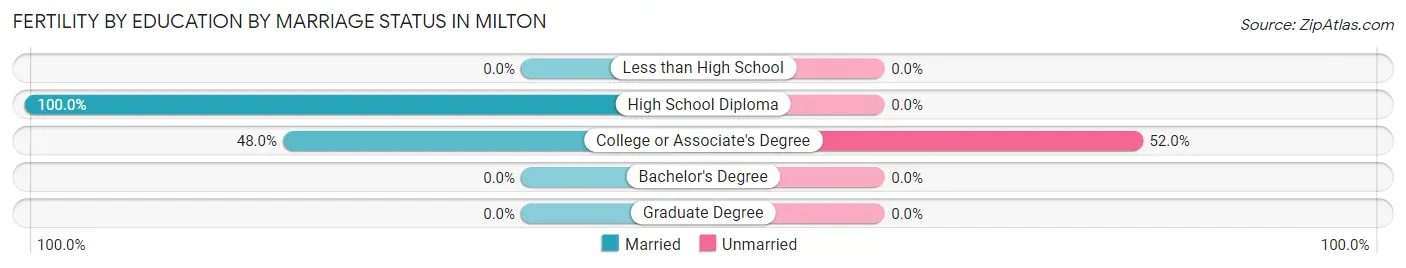
| Educational Attainment | Married | Unmarried |
| Less than High School | 0 (0.0%) | 0 (0.0%) |
| High School Diploma | 14 (100.0%) | 0 (0.0%) |
| College or Associate's Degree | 59 (48.0%) | 64 (52.0%) |
| Bachelor's Degree | 0 (0.0%) | 0 (0.0%) |
| Graduate Degree | 0 (0.0%) | 0 (0.0%) |
| Total | 73 (53.3%) | 64 (46.7%) |
Employment Characteristics in Milton
Employment by Class of Employer in Milton
Among the 1,590 employed individuals in Milton, private company employees (1,030 | 64.8%), not-for-profit organizations (146 | 9.2%), and self-employed (incorporated) (139 | 8.7%) make up the most common classes of employment.
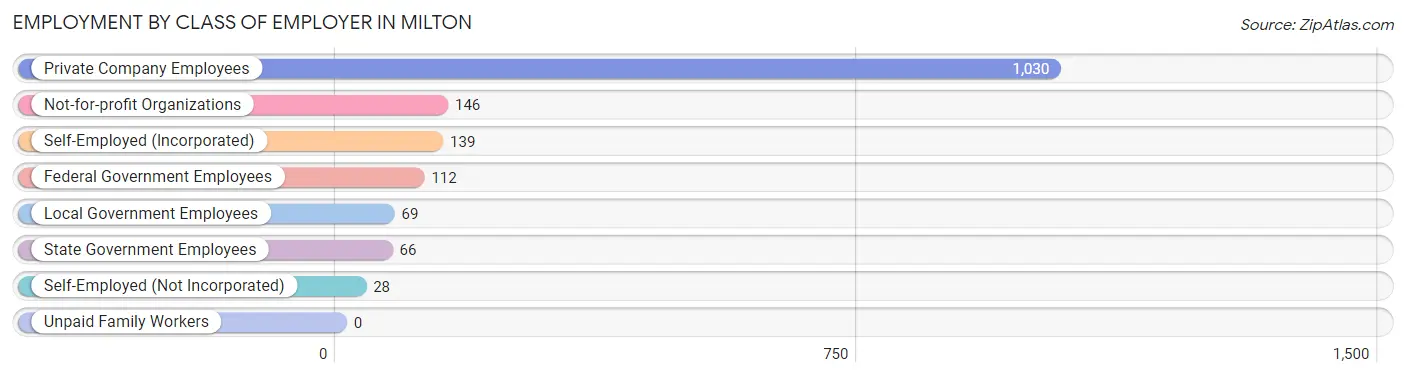
| Employer Class | # Employees | % Employees |
| Private Company Employees | 1,030 | 64.8% |
| Self-Employed (Incorporated) | 139 | 8.7% |
| Self-Employed (Not Incorporated) | 28 | 1.8% |
| Not-for-profit Organizations | 146 | 9.2% |
| Local Government Employees | 69 | 4.3% |
| State Government Employees | 66 | 4.2% |
| Federal Government Employees | 112 | 7.0% |
| Unpaid Family Workers | 0 | 0.0% |
| Total | 1,590 | 100.0% |
Employment Status by Age in Milton
According to the labor force statistics for Milton, out of the total population over 16 years of age (3,130), 69.5% or 2,175 individuals are in the labor force, with 16.0% or 348 of them unemployed. The age group with the highest labor force participation rate is 16 to 19 years, with 92.9% or 368 individuals in the labor force. Within the labor force, the 16 to 19 years age range has the highest percentage of unemployed individuals, with 58.2% or 214 of them being unemployed.
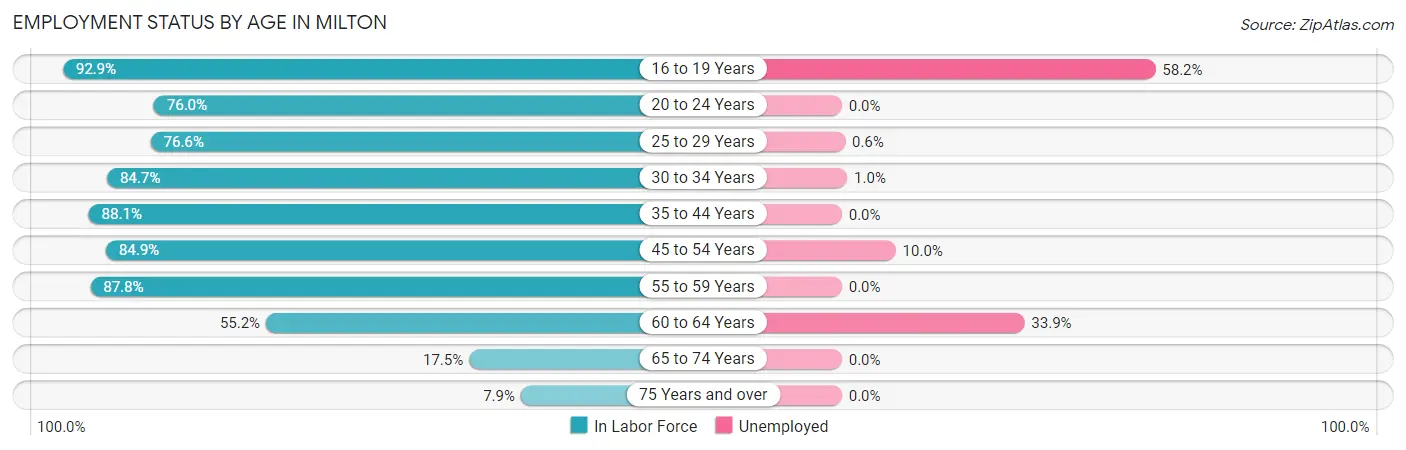
| Age Bracket | In Labor Force | Unemployed |
| 16 to 19 Years | 368 (92.9%) | 214 (58.2%) |
| 20 to 24 Years | 98 (76.0%) | 0 (0.0%) |
| 25 to 29 Years | 315 (76.6%) | 2 (0.6%) |
| 30 to 34 Years | 205 (84.7%) | 2 (1.0%) |
| 35 to 44 Years | 199 (88.1%) | 0 (0.0%) |
| 45 to 54 Years | 230 (84.9%) | 23 (10.0%) |
| 55 to 59 Years | 368 (87.8%) | 0 (0.0%) |
| 60 to 64 Years | 319 (55.2%) | 108 (33.9%) |
| 65 to 74 Years | 69 (17.5%) | 0 (0.0%) |
| 75 Years and over | 5 (7.9%) | 0 (0.0%) |
| Total | 2,175 (69.5%) | 348 (16.0%) |
Employment Status by Educational Attainment in Milton
According to labor force statistics for Milton, 76.2% of individuals (1,636) out of the total population between 25 and 64 years of age (2,147) are in the labor force, with 8.3% or 136 of them being unemployed. The group with the highest labor force participation rate are those with the educational attainment of bachelor's degree or higher, with 98.3% or 459 individuals in the labor force. Within the labor force, individuals with less than high school education have the highest percentage of unemployment, with 65.9% or 108 of them being unemployed.
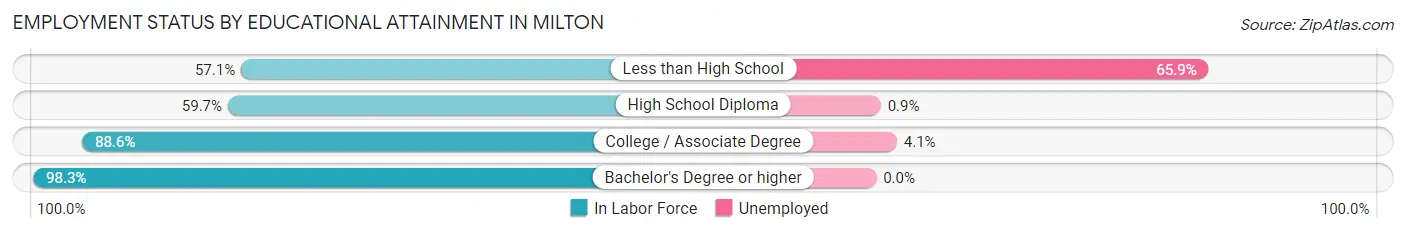
| Educational Attainment | In Labor Force | Unemployed |
| Less than High School | 164 (57.1%) | 189 (65.9%) |
| High School Diploma | 456 (59.7%) | 7 (0.9%) |
| College / Associate Degree | 557 (88.6%) | 26 (4.1%) |
| Bachelor's Degree or higher | 459 (98.3%) | 0 (0.0%) |
| Total | 1,636 (76.2%) | 178 (8.3%) |
Employment Occupations by Sex in Milton
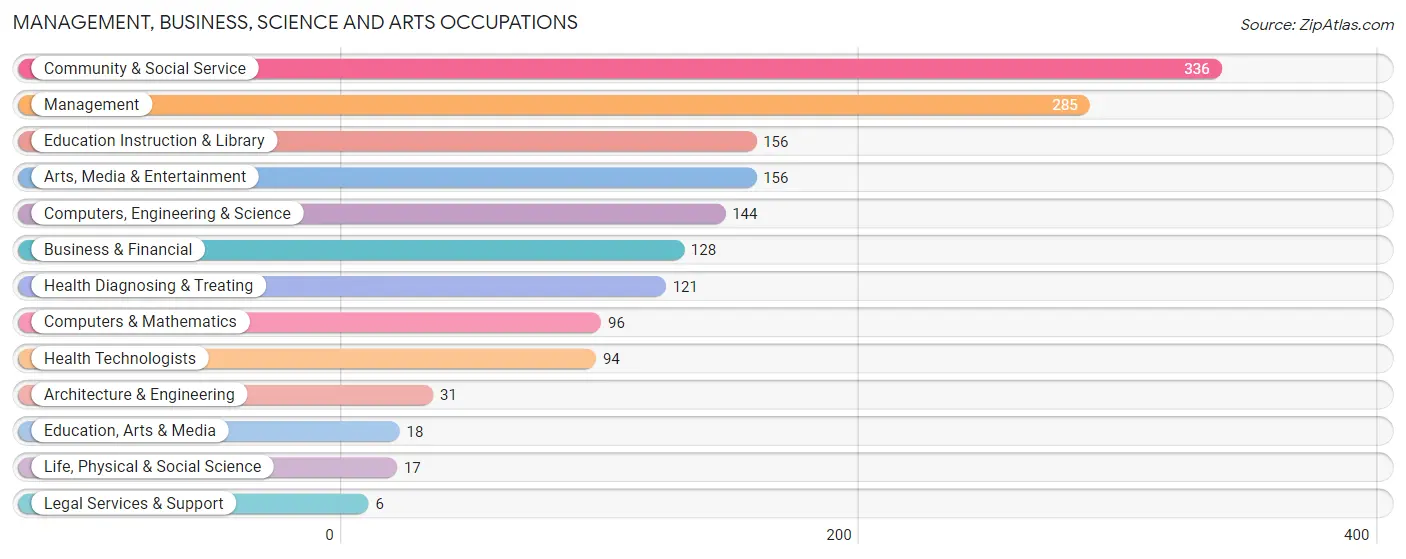
Management, Business, Science and Arts Occupations
The most common Management, Business, Science and Arts occupations in Milton are Community & Social Service (336 | 18.4%), Management (285 | 15.6%), Education Instruction & Library (156 | 8.5%), Arts, Media & Entertainment (156 | 8.5%), and Computers, Engineering & Science (144 | 7.9%).
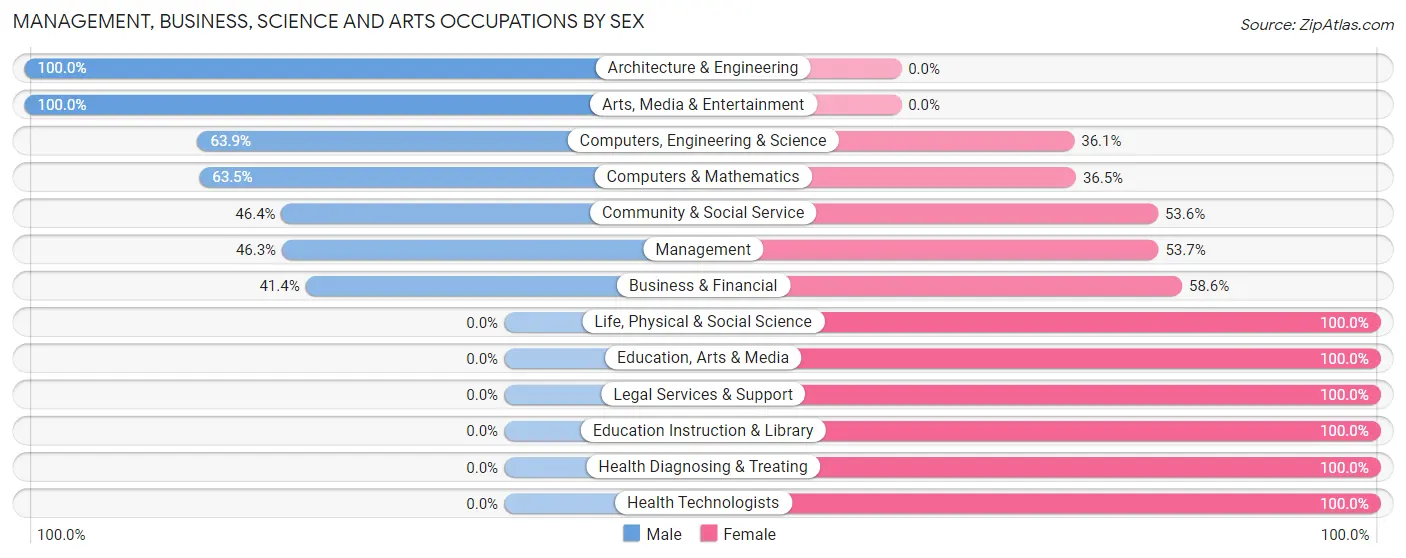
Management, Business, Science and Arts Occupations by Sex
Within the Management, Business, Science and Arts occupations in Milton, the most male-oriented occupations are Architecture & Engineering (100.0%), Arts, Media & Entertainment (100.0%), and Computers, Engineering & Science (63.9%), while the most female-oriented occupations are Life, Physical & Social Science (100.0%), Education, Arts & Media (100.0%), and Legal Services & Support (100.0%).
| Occupation | Male | Female |
| Management | 132 (46.3%) | 153 (53.7%) |
| Business & Financial | 53 (41.4%) | 75 (58.6%) |
| Computers, Engineering & Science | 92 (63.9%) | 52 (36.1%) |
| Computers & Mathematics | 61 (63.5%) | 35 (36.5%) |
| Architecture & Engineering | 31 (100.0%) | 0 (0.0%) |
| Life, Physical & Social Science | 0 (0.0%) | 17 (100.0%) |
| Community & Social Service | 156 (46.4%) | 180 (53.6%) |
| Education, Arts & Media | 0 (0.0%) | 18 (100.0%) |
| Legal Services & Support | 0 (0.0%) | 6 (100.0%) |
| Education Instruction & Library | 0 (0.0%) | 156 (100.0%) |
| Arts, Media & Entertainment | 156 (100.0%) | 0 (0.0%) |
| Health Diagnosing & Treating | 0 (0.0%) | 121 (100.0%) |
| Health Technologists | 0 (0.0%) | 94 (100.0%) |
| Total (Category) | 433 (42.7%) | 581 (57.3%) |
| Total (Overall) | 1,014 (55.5%) | 813 (44.5%) |
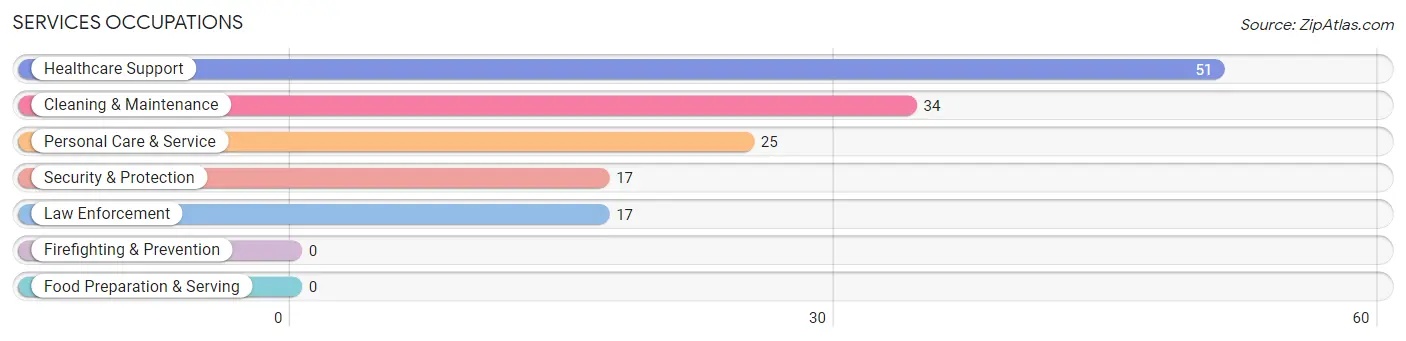
Services Occupations
The most common Services occupations in Milton are Healthcare Support (51 | 2.8%), Cleaning & Maintenance (34 | 1.9%), Personal Care & Service (25 | 1.4%), Security & Protection (17 | 0.9%), and Law Enforcement (17 | 0.9%).
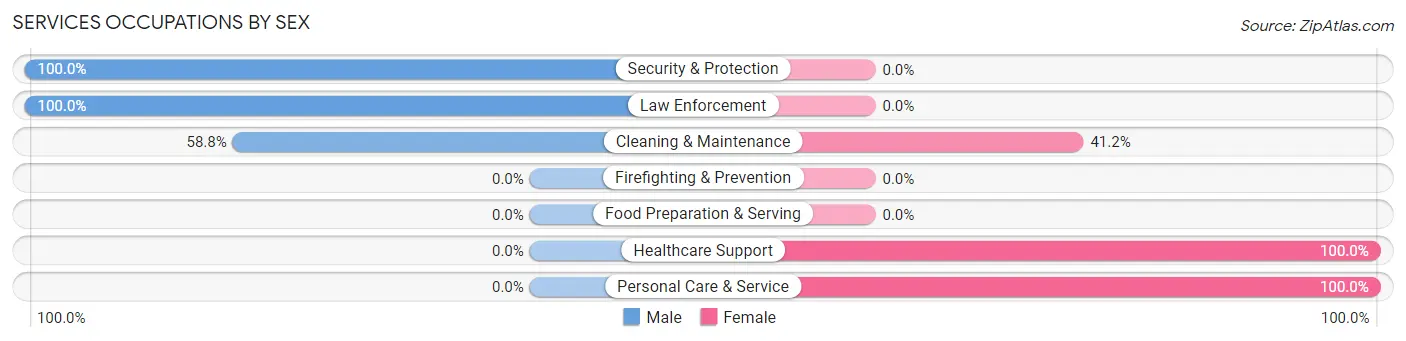
Services Occupations by Sex
Within the Services occupations in Milton, the most male-oriented occupations are Security & Protection (100.0%), Law Enforcement (100.0%), and Cleaning & Maintenance (58.8%), while the most female-oriented occupations are Healthcare Support (100.0%), Personal Care & Service (100.0%), and Cleaning & Maintenance (41.2%).
| Occupation | Male | Female |
| Healthcare Support | 0 (0.0%) | 51 (100.0%) |
| Security & Protection | 17 (100.0%) | 0 (0.0%) |
| Firefighting & Prevention | 0 (0.0%) | 0 (0.0%) |
| Law Enforcement | 17 (100.0%) | 0 (0.0%) |
| Food Preparation & Serving | 0 (0.0%) | 0 (0.0%) |
| Cleaning & Maintenance | 20 (58.8%) | 14 (41.2%) |
| Personal Care & Service | 0 (0.0%) | 25 (100.0%) |
| Total (Category) | 37 (29.1%) | 90 (70.9%) |
| Total (Overall) | 1,014 (55.5%) | 813 (44.5%) |
Sales and Office Occupations
The most common Sales and Office occupations in Milton are Office & Administration (128 | 7.0%), and Sales & Related (80 | 4.4%).
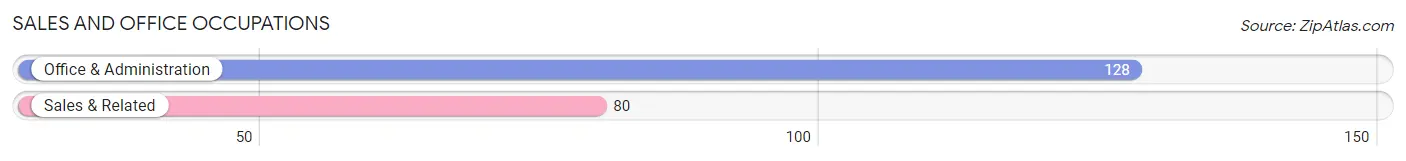
Sales and Office Occupations by Sex
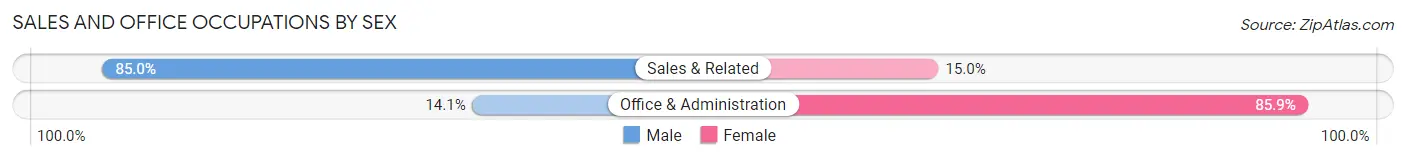
| Occupation | Male | Female |
| Sales & Related | 68 (85.0%) | 12 (15.0%) |
| Office & Administration | 18 (14.1%) | 110 (85.9%) |
| Total (Category) | 86 (41.3%) | 122 (58.7%) |
| Total (Overall) | 1,014 (55.5%) | 813 (44.5%) |
Natural Resources, Construction and Maintenance Occupations
The most common Natural Resources, Construction and Maintenance occupations in Milton are Construction & Extraction (85 | 4.6%), and Installation, Maintenance & Repair (76 | 4.2%).
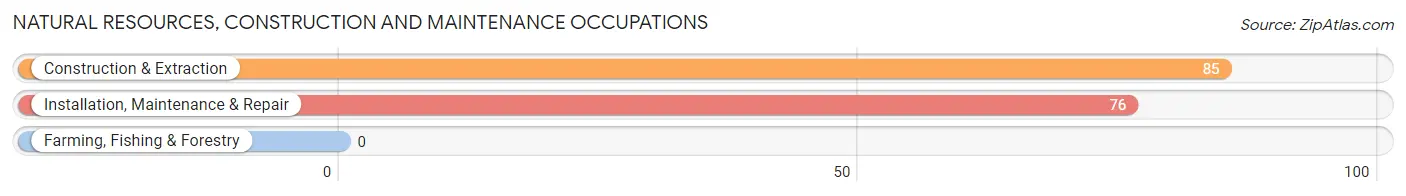
Natural Resources, Construction and Maintenance Occupations by Sex
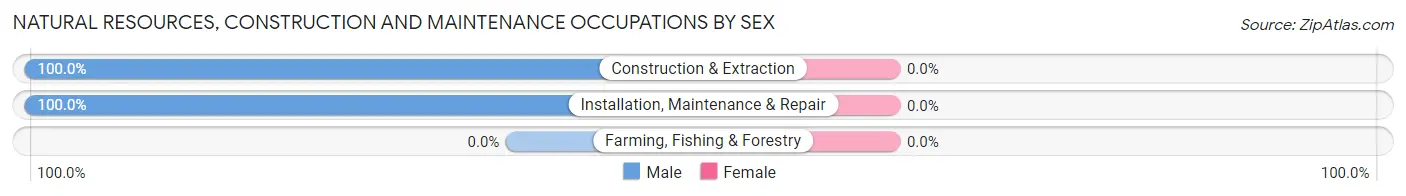
| Occupation | Male | Female |
| Farming, Fishing & Forestry | 0 (0.0%) | 0 (0.0%) |
| Construction & Extraction | 85 (100.0%) | 0 (0.0%) |
| Installation, Maintenance & Repair | 76 (100.0%) | 0 (0.0%) |
| Total (Category) | 161 (100.0%) | 0 (0.0%) |
| Total (Overall) | 1,014 (55.5%) | 813 (44.5%) |
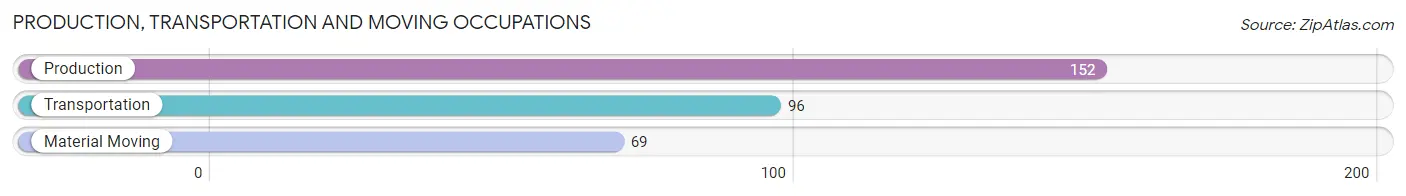
Production, Transportation and Moving Occupations
The most common Production, Transportation and Moving occupations in Milton are Production (152 | 8.3%), Transportation (96 | 5.2%), and Material Moving (69 | 3.8%).
Production, Transportation and Moving Occupations by Sex
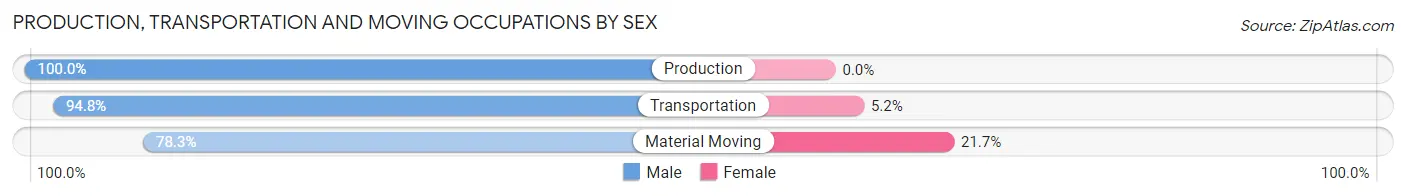
| Occupation | Male | Female |
| Production | 152 (100.0%) | 0 (0.0%) |
| Transportation | 91 (94.8%) | 5 (5.2%) |
| Material Moving | 54 (78.3%) | 15 (21.7%) |
| Total (Category) | 297 (93.7%) | 20 (6.3%) |
| Total (Overall) | 1,014 (55.5%) | 813 (44.5%) |
Employment Industries by Sex in Milton
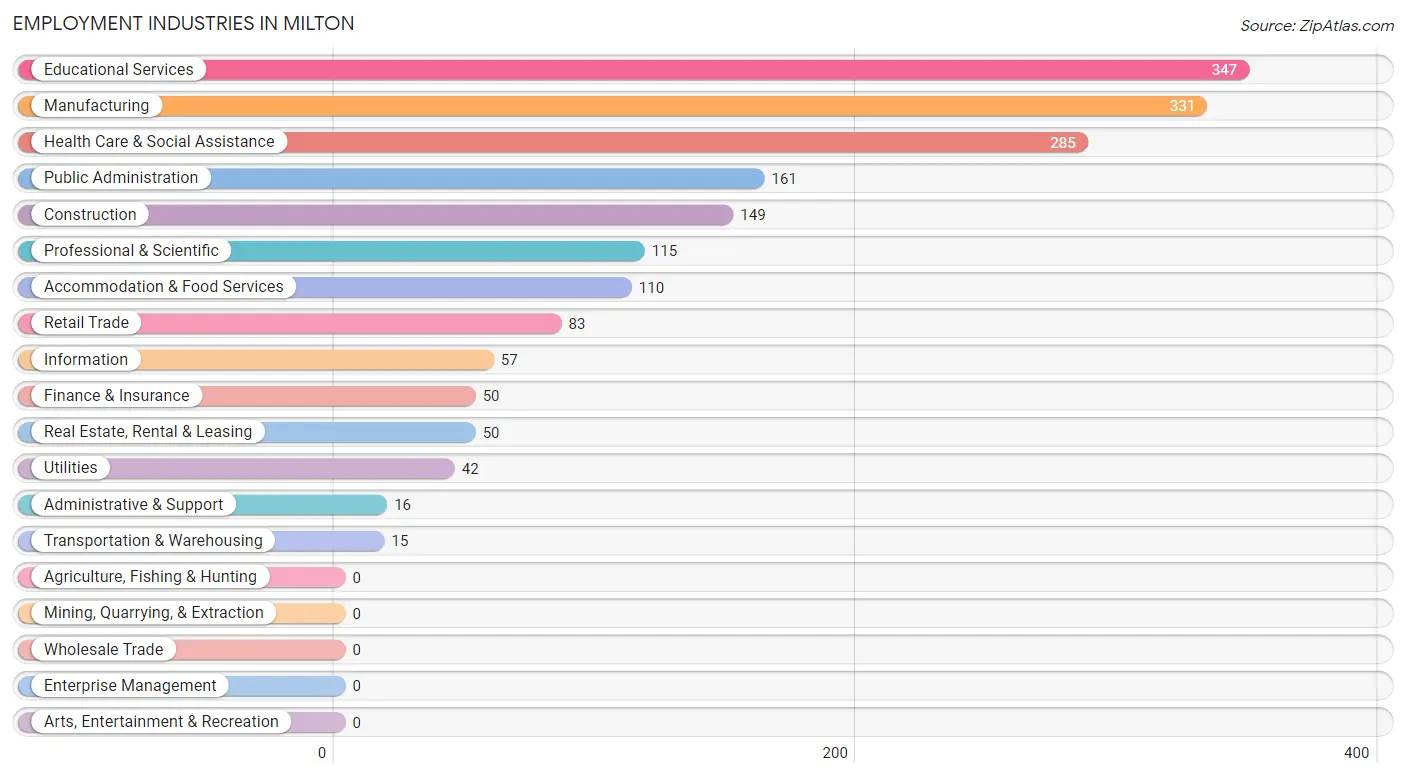
Employment Industries in Milton
The major employment industries in Milton include Educational Services (347 | 19.0%), Manufacturing (331 | 18.1%), Health Care & Social Assistance (285 | 15.6%), Public Administration (161 | 8.8%), and Construction (149 | 8.2%).
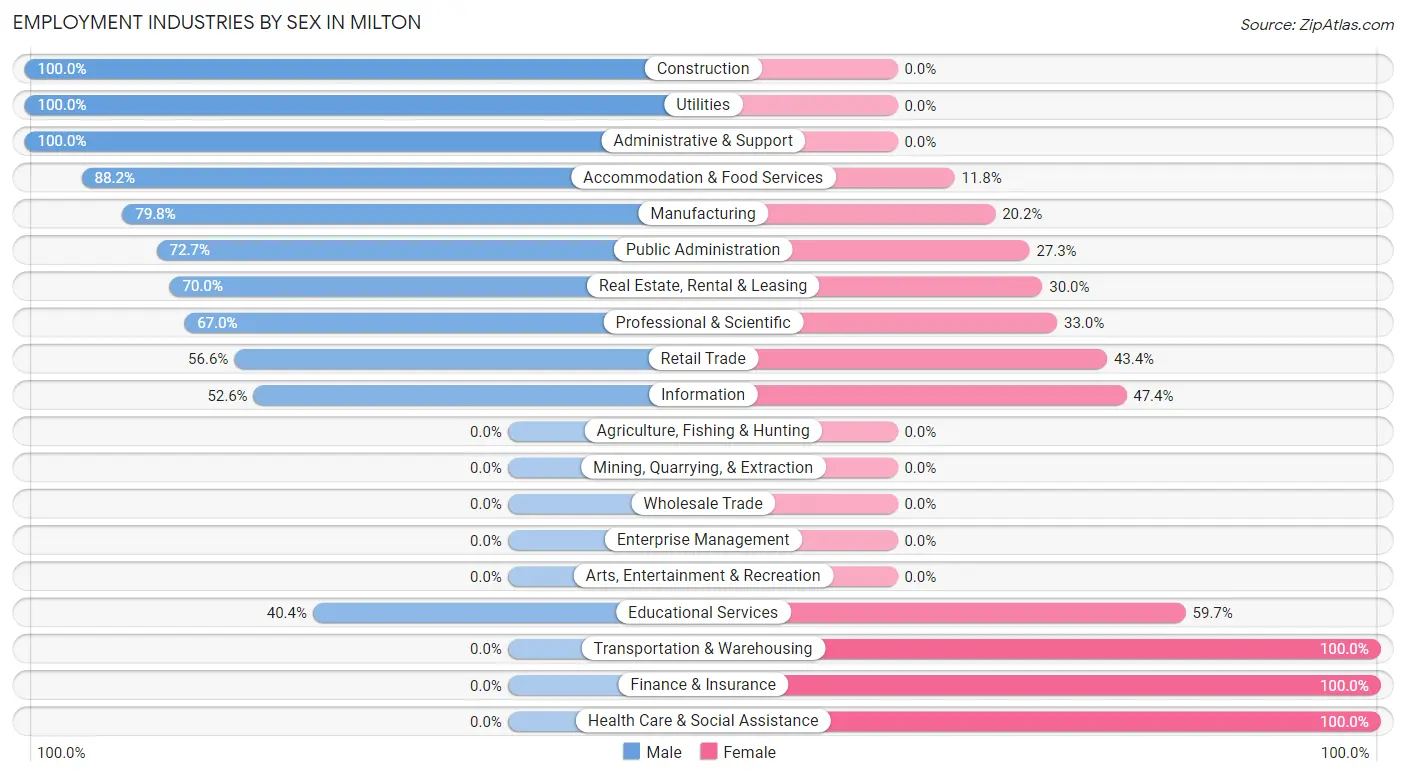
Employment Industries by Sex in Milton
The Milton industries that see more men than women are Construction (100.0%), Utilities (100.0%), and Administrative & Support (100.0%), whereas the industries that tend to have a higher number of women are Transportation & Warehousing (100.0%), Finance & Insurance (100.0%), and Health Care & Social Assistance (100.0%).
| Industry | Male | Female |
| Agriculture, Fishing & Hunting | 0 (0.0%) | 0 (0.0%) |
| Mining, Quarrying, & Extraction | 0 (0.0%) | 0 (0.0%) |
| Construction | 149 (100.0%) | 0 (0.0%) |
| Manufacturing | 264 (79.8%) | 67 (20.2%) |
| Wholesale Trade | 0 (0.0%) | 0 (0.0%) |
| Retail Trade | 47 (56.6%) | 36 (43.4%) |
| Transportation & Warehousing | 0 (0.0%) | 15 (100.0%) |
| Utilities | 42 (100.0%) | 0 (0.0%) |
| Information | 30 (52.6%) | 27 (47.4%) |
| Finance & Insurance | 0 (0.0%) | 50 (100.0%) |
| Real Estate, Rental & Leasing | 35 (70.0%) | 15 (30.0%) |
| Professional & Scientific | 77 (67.0%) | 38 (33.0%) |
| Enterprise Management | 0 (0.0%) | 0 (0.0%) |
| Administrative & Support | 16 (100.0%) | 0 (0.0%) |
| Educational Services | 140 (40.4%) | 207 (59.7%) |
| Health Care & Social Assistance | 0 (0.0%) | 285 (100.0%) |
| Arts, Entertainment & Recreation | 0 (0.0%) | 0 (0.0%) |
| Accommodation & Food Services | 97 (88.2%) | 13 (11.8%) |
| Public Administration | 117 (72.7%) | 44 (27.3%) |
| Total | 1,014 (55.5%) | 813 (44.5%) |
Education in Milton
School Enrollment in Milton
The most common levels of schooling among the 772 students in Milton are high school (255 | 33.0%), middle school (162 | 21.0%), and elementary school (157 | 20.3%).
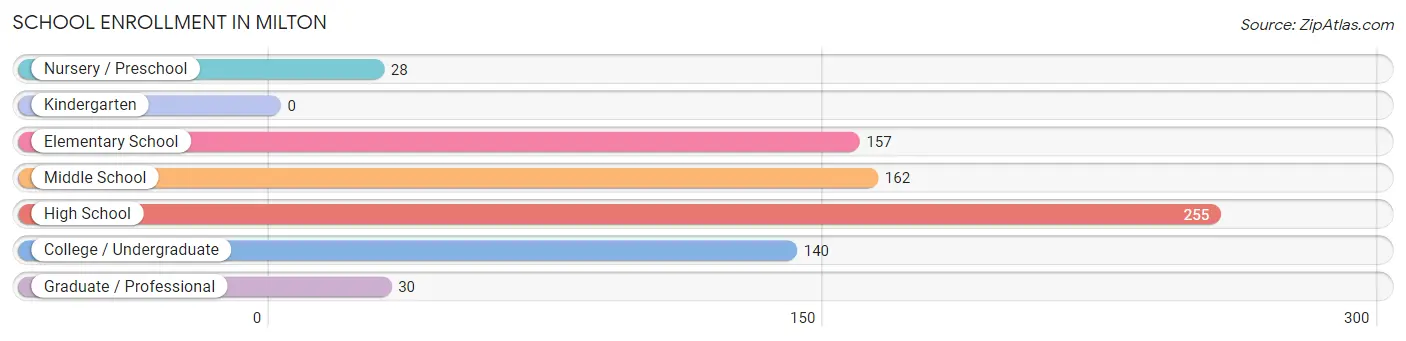
| School Level | # Students | % Students |
| Nursery / Preschool | 28 | 3.6% |
| Kindergarten | 0 | 0.0% |
| Elementary School | 157 | 20.3% |
| Middle School | 162 | 21.0% |
| High School | 255 | 33.0% |
| College / Undergraduate | 140 | 18.1% |
| Graduate / Professional | 30 | 3.9% |
| Total | 772 | 100.0% |
School Enrollment by Age by Funding Source in Milton
Out of a total of 772 students who are enrolled in schools in Milton, 61 (7.9%) attend a private institution, while the remaining 711 (92.1%) are enrolled in public schools. The age group of 20 to 24 year olds has the highest likelihood of being enrolled in private schools, with 61 (66.3% in the age bracket) enrolled. Conversely, the age group of 3 to 4 year olds has the lowest likelihood of being enrolled in a private school, with 28 (100.0% in the age bracket) attending a public institution.
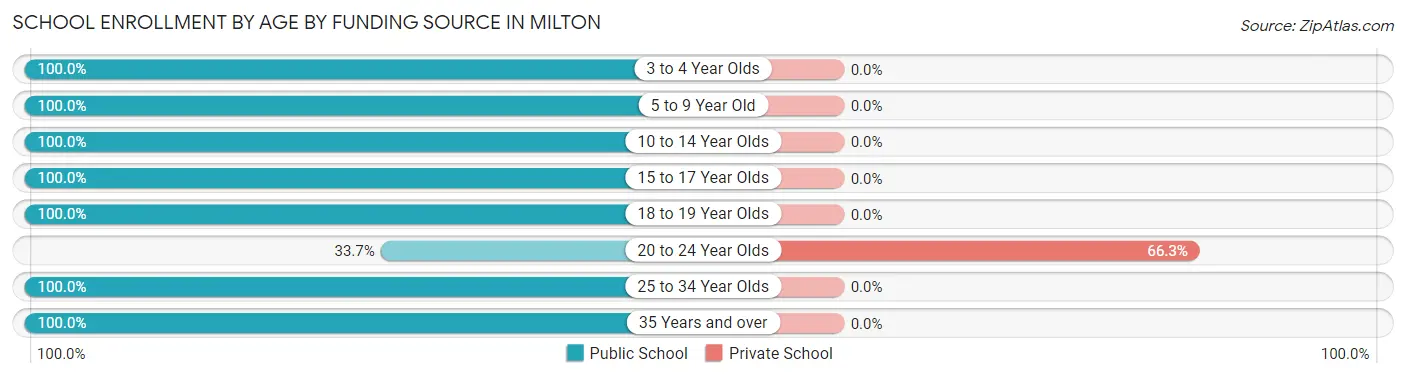
| Age Bracket | Public School | Private School |
| 3 to 4 Year Olds | 28 (100.0%) | 0 (0.0%) |
| 5 to 9 Year Old | 157 (100.0%) | 0 (0.0%) |
| 10 to 14 Year Olds | 163 (100.0%) | 0 (0.0%) |
| 15 to 17 Year Olds | 71 (100.0%) | 0 (0.0%) |
| 18 to 19 Year Olds | 198 (100.0%) | 0 (0.0%) |
| 20 to 24 Year Olds | 31 (33.7%) | 61 (66.3%) |
| 25 to 34 Year Olds | 46 (100.0%) | 0 (0.0%) |
| 35 Years and over | 17 (100.0%) | 0 (0.0%) |
| Total | 711 (92.1%) | 61 (7.9%) |
Educational Attainment by Field of Study in Milton
Visual & performing arts (117 | 17.9%), education (104 | 16.0%), psychology (100 | 15.3%), business (84 | 12.9%), and liberal arts & history (77 | 11.8%) are the most common fields of study among 652 individuals in Milton who have obtained a bachelor's degree or higher.
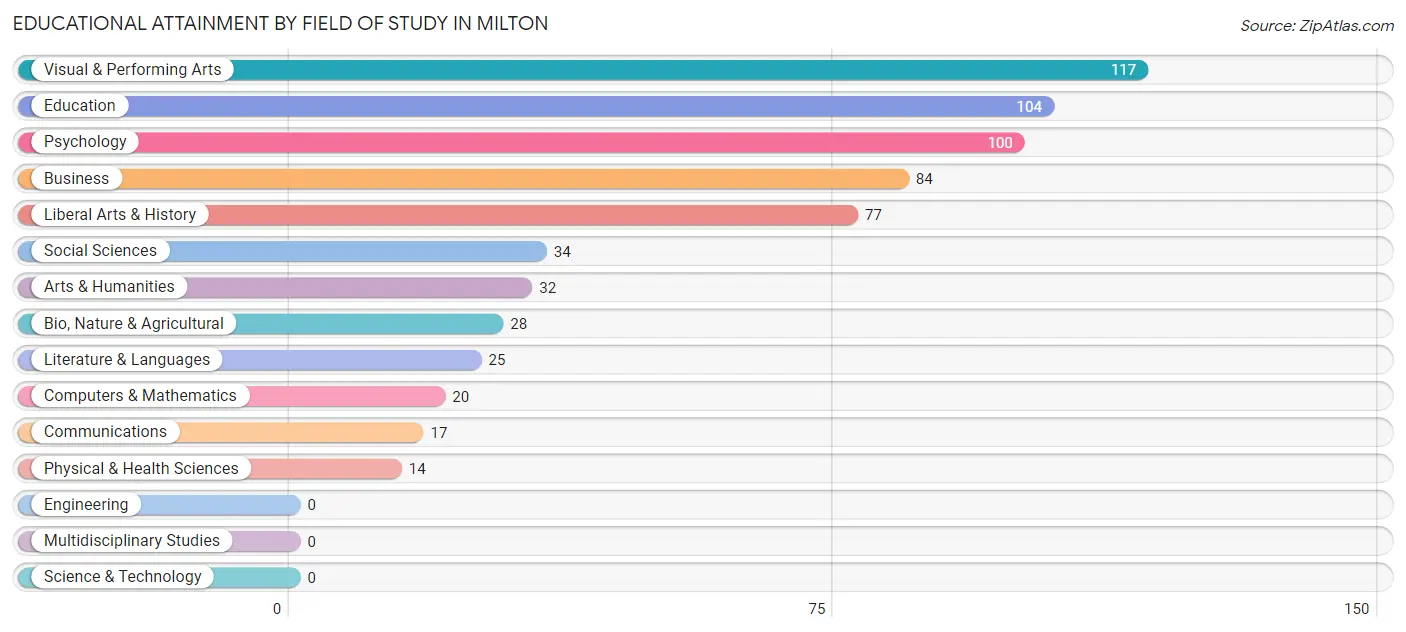
| Field of Study | # Graduates | % Graduates |
| Computers & Mathematics | 20 | 3.1% |
| Bio, Nature & Agricultural | 28 | 4.3% |
| Physical & Health Sciences | 14 | 2.1% |
| Psychology | 100 | 15.3% |
| Social Sciences | 34 | 5.2% |
| Engineering | 0 | 0.0% |
| Multidisciplinary Studies | 0 | 0.0% |
| Science & Technology | 0 | 0.0% |
| Business | 84 | 12.9% |
| Education | 104 | 16.0% |
| Literature & Languages | 25 | 3.8% |
| Liberal Arts & History | 77 | 11.8% |
| Visual & Performing Arts | 117 | 17.9% |
| Communications | 17 | 2.6% |
| Arts & Humanities | 32 | 4.9% |
| Total | 652 | 100.0% |
Transportation & Commute in Milton
Vehicle Availability by Sex in Milton
The most prevalent vehicle ownership categories in Milton are males with 2 vehicles (524, accounting for 63.4%) and females with 2 vehicles (522, making up 68.6%).
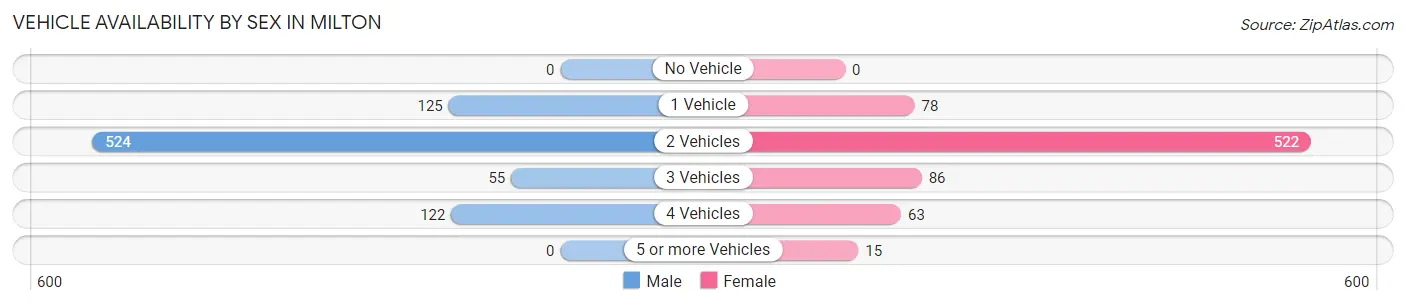
| Vehicles Available | Male | Female |
| No Vehicle | 0 (0.0%) | 0 (0.0%) |
| 1 Vehicle | 125 (15.1%) | 78 (10.2%) |
| 2 Vehicles | 524 (63.4%) | 522 (68.3%) |
| 3 Vehicles | 55 (6.7%) | 86 (11.3%) |
| 4 Vehicles | 122 (14.8%) | 63 (8.3%) |
| 5 or more Vehicles | 0 (0.0%) | 15 (2.0%) |
| Total | 826 (100.0%) | 764 (100.0%) |
Commute Time in Milton
The most frequently occuring commute durations in Milton are 30 to 34 minutes (356 commuters, 25.3%), 20 to 24 minutes (351 commuters, 24.9%), and 25 to 29 minutes (154 commuters, 11.0%).
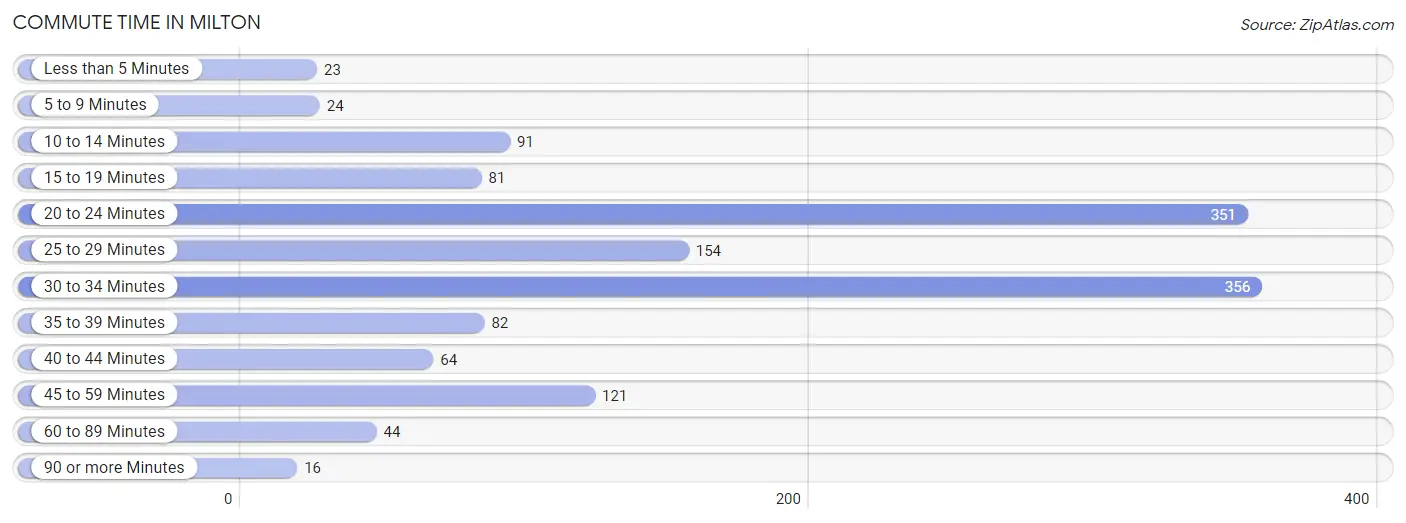
| Commute Time | # Commuters | % Commuters |
| Less than 5 Minutes | 23 | 1.6% |
| 5 to 9 Minutes | 24 | 1.7% |
| 10 to 14 Minutes | 91 | 6.5% |
| 15 to 19 Minutes | 81 | 5.8% |
| 20 to 24 Minutes | 351 | 24.9% |
| 25 to 29 Minutes | 154 | 11.0% |
| 30 to 34 Minutes | 356 | 25.3% |
| 35 to 39 Minutes | 82 | 5.8% |
| 40 to 44 Minutes | 64 | 4.5% |
| 45 to 59 Minutes | 121 | 8.6% |
| 60 to 89 Minutes | 44 | 3.1% |
| 90 or more Minutes | 16 | 1.1% |
Commute Time by Sex in Milton
The most common commute times in Milton are 20 to 24 minutes (193 commuters, 27.2%) for males and 30 to 34 minutes (214 commuters, 30.7%) for females.
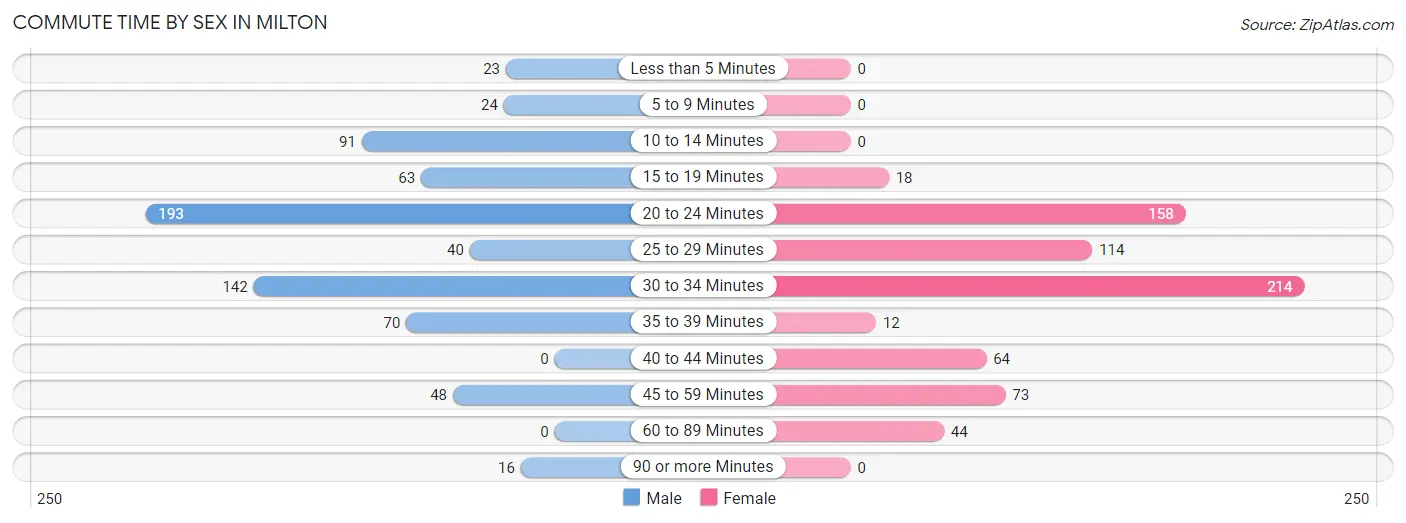
| Commute Time | Male | Female |
| Less than 5 Minutes | 23 (3.2%) | 0 (0.0%) |
| 5 to 9 Minutes | 24 (3.4%) | 0 (0.0%) |
| 10 to 14 Minutes | 91 (12.8%) | 0 (0.0%) |
| 15 to 19 Minutes | 63 (8.9%) | 18 (2.6%) |
| 20 to 24 Minutes | 193 (27.2%) | 158 (22.7%) |
| 25 to 29 Minutes | 40 (5.6%) | 114 (16.4%) |
| 30 to 34 Minutes | 142 (20.0%) | 214 (30.7%) |
| 35 to 39 Minutes | 70 (9.9%) | 12 (1.7%) |
| 40 to 44 Minutes | 0 (0.0%) | 64 (9.2%) |
| 45 to 59 Minutes | 48 (6.8%) | 73 (10.5%) |
| 60 to 89 Minutes | 0 (0.0%) | 44 (6.3%) |
| 90 or more Minutes | 16 (2.2%) | 0 (0.0%) |
Time of Departure to Work by Sex in Milton
The most frequent times of departure to work in Milton are 7:00 AM to 7:29 AM (179, 25.2%) for males and 7:00 AM to 7:29 AM (193, 27.7%) for females.
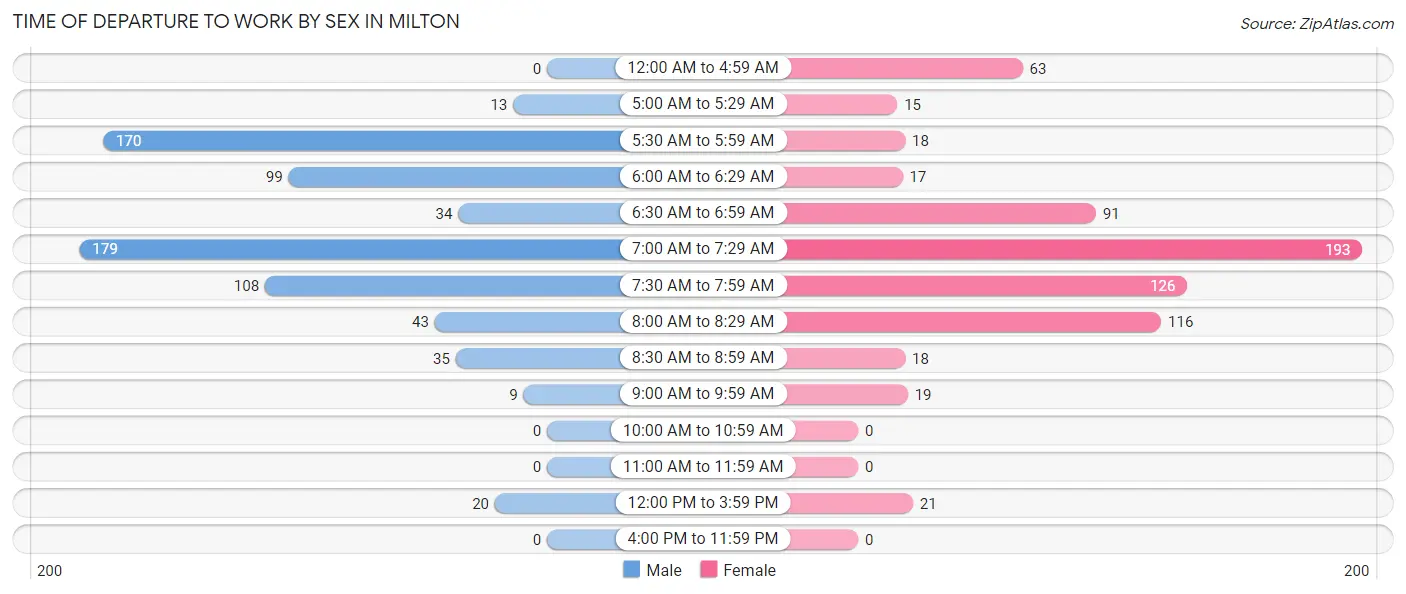
| Time of Departure | Male | Female |
| 12:00 AM to 4:59 AM | 0 (0.0%) | 63 (9.0%) |
| 5:00 AM to 5:29 AM | 13 (1.8%) | 15 (2.1%) |
| 5:30 AM to 5:59 AM | 170 (23.9%) | 18 (2.6%) |
| 6:00 AM to 6:29 AM | 99 (13.9%) | 17 (2.4%) |
| 6:30 AM to 6:59 AM | 34 (4.8%) | 91 (13.1%) |
| 7:00 AM to 7:29 AM | 179 (25.2%) | 193 (27.7%) |
| 7:30 AM to 7:59 AM | 108 (15.2%) | 126 (18.1%) |
| 8:00 AM to 8:29 AM | 43 (6.1%) | 116 (16.6%) |
| 8:30 AM to 8:59 AM | 35 (4.9%) | 18 (2.6%) |
| 9:00 AM to 9:59 AM | 9 (1.3%) | 19 (2.7%) |
| 10:00 AM to 10:59 AM | 0 (0.0%) | 0 (0.0%) |
| 11:00 AM to 11:59 AM | 0 (0.0%) | 0 (0.0%) |
| 12:00 PM to 3:59 PM | 20 (2.8%) | 21 (3.0%) |
| 4:00 PM to 11:59 PM | 0 (0.0%) | 0 (0.0%) |
| Total | 710 (100.0%) | 697 (100.0%) |
Housing Occupancy in Milton
Occupancy by Ownership in Milton
Of the total 1,396 dwellings in Milton, owner-occupied units account for 946 (67.8%), while renter-occupied units make up 450 (32.2%).
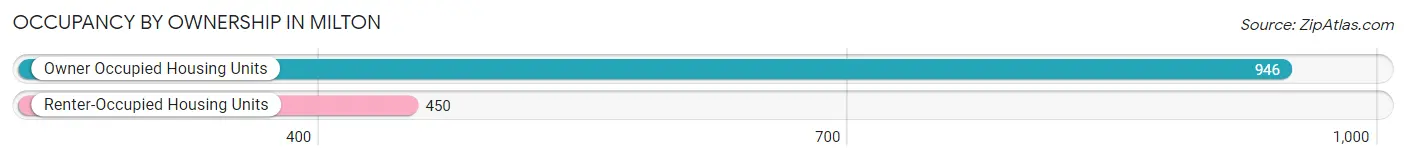
| Occupancy | # Housing Units | % Housing Units |
| Owner Occupied Housing Units | 946 | 67.8% |
| Renter-Occupied Housing Units | 450 | 32.2% |
| Total Occupied Housing Units | 1,396 | 100.0% |
Occupancy by Household Size in Milton
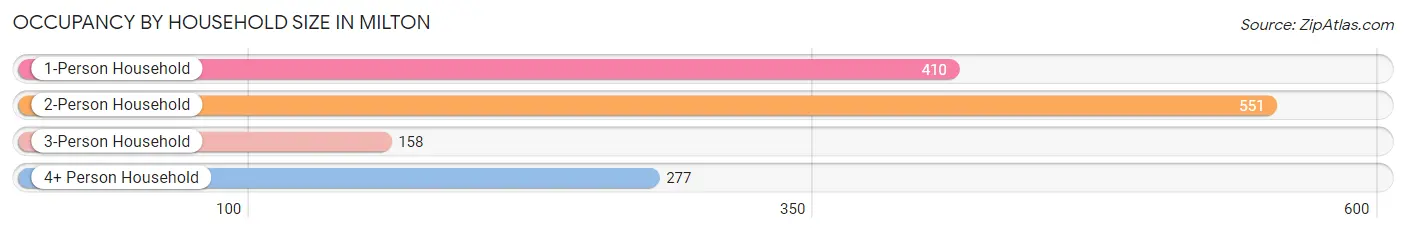
| Household Size | # Housing Units | % Housing Units |
| 1-Person Household | 410 | 29.4% |
| 2-Person Household | 551 | 39.5% |
| 3-Person Household | 158 | 11.3% |
| 4+ Person Household | 277 | 19.8% |
| Total Housing Units | 1,396 | 100.0% |
Occupancy by Ownership by Household Size in Milton
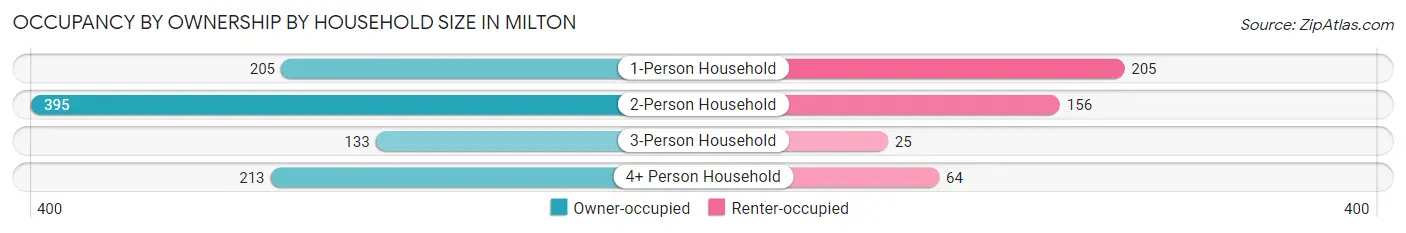
| Household Size | Owner-occupied | Renter-occupied |
| 1-Person Household | 205 (50.0%) | 205 (50.0%) |
| 2-Person Household | 395 (71.7%) | 156 (28.3%) |
| 3-Person Household | 133 (84.2%) | 25 (15.8%) |
| 4+ Person Household | 213 (76.9%) | 64 (23.1%) |
| Total Housing Units | 946 (67.8%) | 450 (32.2%) |
Occupancy by Educational Attainment in Milton
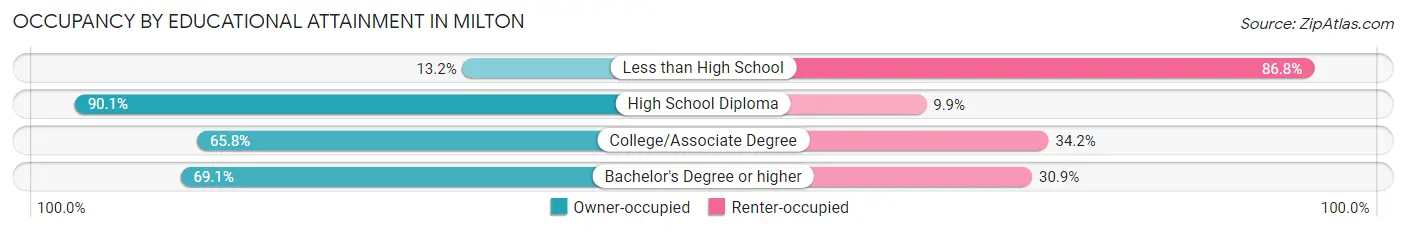
| Household Size | Owner-occupied | Renter-occupied |
| Less than High School | 17 (13.2%) | 112 (86.8%) |
| High School Diploma | 308 (90.1%) | 34 (9.9%) |
| College/Associate Degree | 364 (65.8%) | 189 (34.2%) |
| Bachelor's Degree or higher | 257 (69.1%) | 115 (30.9%) |
Occupancy by Age of Householder in Milton
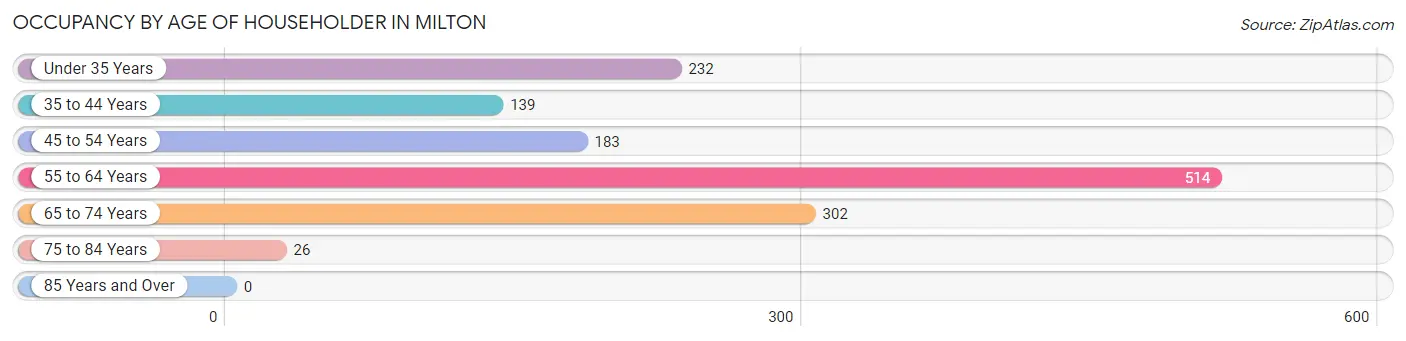
| Age Bracket | # Households | % Households |
| Under 35 Years | 232 | 16.6% |
| 35 to 44 Years | 139 | 10.0% |
| 45 to 54 Years | 183 | 13.1% |
| 55 to 64 Years | 514 | 36.8% |
| 65 to 74 Years | 302 | 21.6% |
| 75 to 84 Years | 26 | 1.9% |
| 85 Years and Over | 0 | 0.0% |
| Total | 1,396 | 100.0% |
Housing Finances in Milton
Median Income by Occupancy in Milton
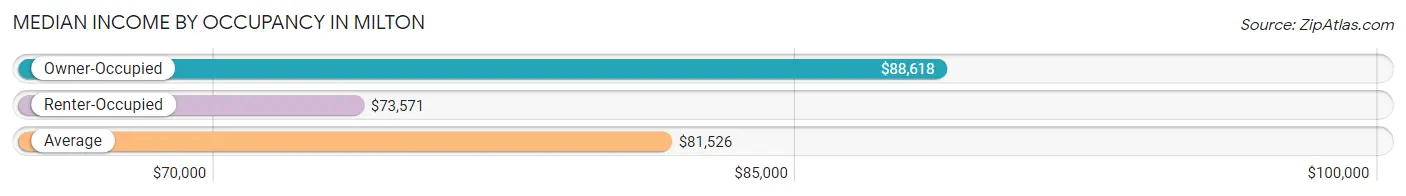
| Occupancy Type | # Households | Median Income |
| Owner-Occupied | 946 (67.8%) | $88,618 |
| Renter-Occupied | 450 (32.2%) | $73,571 |
| Average | 1,396 (100.0%) | $81,526 |
Occupancy by Householder Income Bracket in Milton
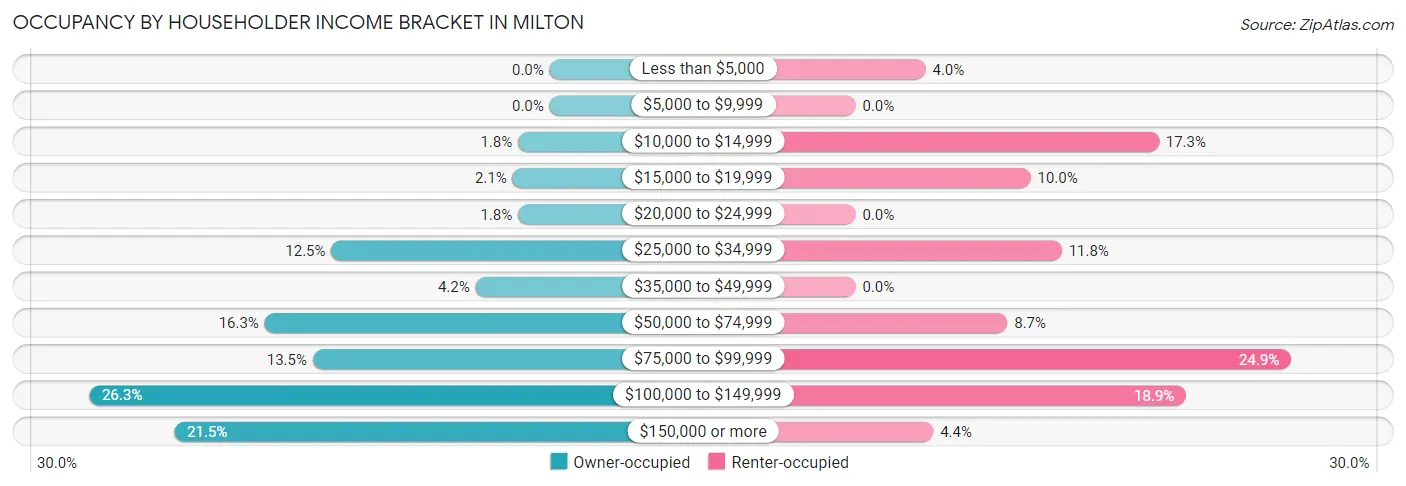
| Income Bracket | Owner-occupied | Renter-occupied |
| Less than $5,000 | 0 (0.0%) | 18 (4.0%) |
| $5,000 to $9,999 | 0 (0.0%) | 0 (0.0%) |
| $10,000 to $14,999 | 17 (1.8%) | 78 (17.3%) |
| $15,000 to $19,999 | 20 (2.1%) | 45 (10.0%) |
| $20,000 to $24,999 | 17 (1.8%) | 0 (0.0%) |
| $25,000 to $34,999 | 118 (12.5%) | 53 (11.8%) |
| $35,000 to $49,999 | 40 (4.2%) | 0 (0.0%) |
| $50,000 to $74,999 | 154 (16.3%) | 39 (8.7%) |
| $75,000 to $99,999 | 128 (13.5%) | 112 (24.9%) |
| $100,000 to $149,999 | 249 (26.3%) | 85 (18.9%) |
| $150,000 or more | 203 (21.5%) | 20 (4.4%) |
| Total | 946 (100.0%) | 450 (100.0%) |
Monthly Housing Cost Tiers in Milton
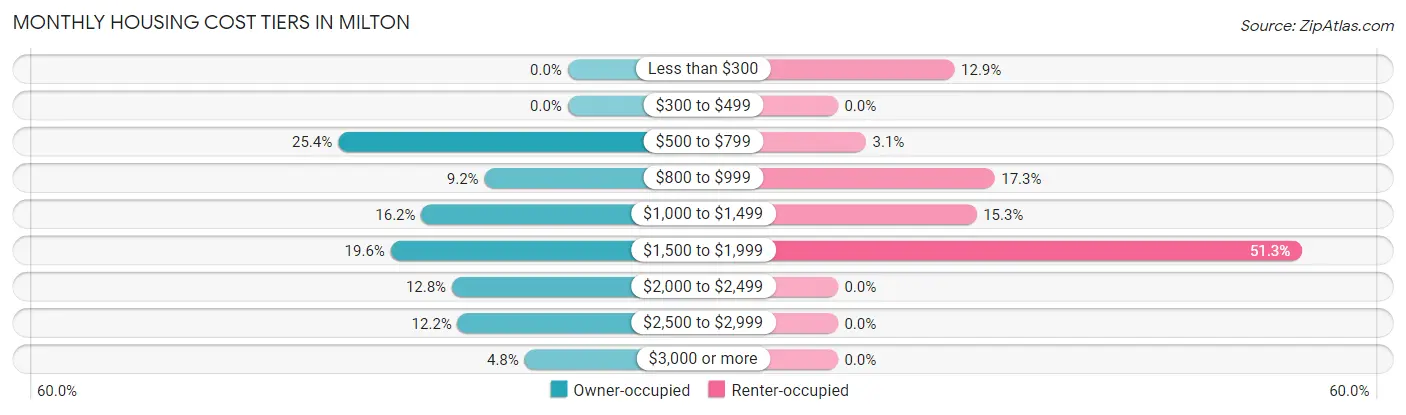
| Monthly Cost | Owner-occupied | Renter-occupied |
| Less than $300 | 0 (0.0%) | 58 (12.9%) |
| $300 to $499 | 0 (0.0%) | 0 (0.0%) |
| $500 to $799 | 240 (25.4%) | 14 (3.1%) |
| $800 to $999 | 87 (9.2%) | 78 (17.3%) |
| $1,000 to $1,499 | 153 (16.2%) | 69 (15.3%) |
| $1,500 to $1,999 | 185 (19.6%) | 231 (51.3%) |
| $2,000 to $2,499 | 121 (12.8%) | 0 (0.0%) |
| $2,500 to $2,999 | 115 (12.2%) | 0 (0.0%) |
| $3,000 or more | 45 (4.8%) | 0 (0.0%) |
| Total | 946 (100.0%) | 450 (100.0%) |
Physical Housing Characteristics in Milton
Housing Structures in Milton
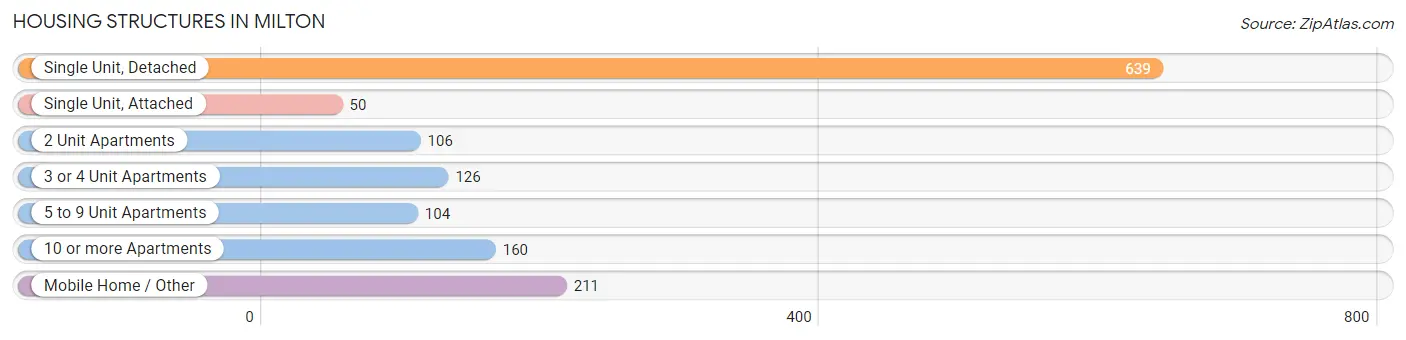
| Structure Type | # Housing Units | % Housing Units |
| Single Unit, Detached | 639 | 45.8% |
| Single Unit, Attached | 50 | 3.6% |
| 2 Unit Apartments | 106 | 7.6% |
| 3 or 4 Unit Apartments | 126 | 9.0% |
| 5 to 9 Unit Apartments | 104 | 7.4% |
| 10 or more Apartments | 160 | 11.5% |
| Mobile Home / Other | 211 | 15.1% |
| Total | 1,396 | 100.0% |
Housing Structures by Occupancy in Milton
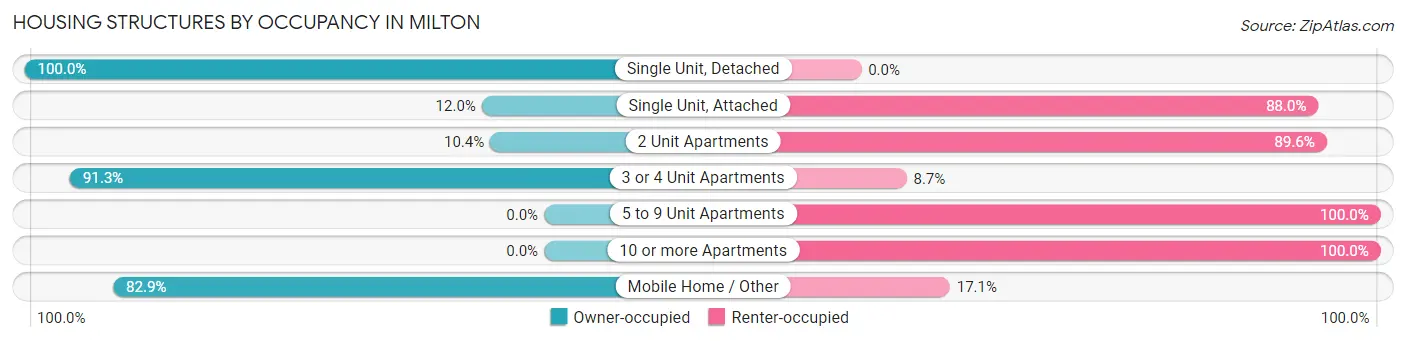
| Structure Type | Owner-occupied | Renter-occupied |
| Single Unit, Detached | 639 (100.0%) | 0 (0.0%) |
| Single Unit, Attached | 6 (12.0%) | 44 (88.0%) |
| 2 Unit Apartments | 11 (10.4%) | 95 (89.6%) |
| 3 or 4 Unit Apartments | 115 (91.3%) | 11 (8.7%) |
| 5 to 9 Unit Apartments | 0 (0.0%) | 104 (100.0%) |
| 10 or more Apartments | 0 (0.0%) | 160 (100.0%) |
| Mobile Home / Other | 175 (82.9%) | 36 (17.1%) |
| Total | 946 (67.8%) | 450 (32.2%) |
Housing Structures by Number of Rooms in Milton
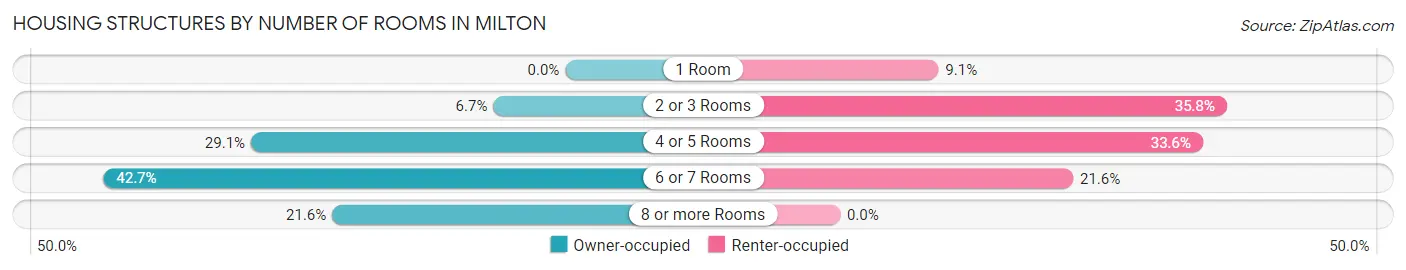
| Number of Rooms | Owner-occupied | Renter-occupied |
| 1 Room | 0 (0.0%) | 41 (9.1%) |
| 2 or 3 Rooms | 63 (6.7%) | 161 (35.8%) |
| 4 or 5 Rooms | 275 (29.1%) | 151 (33.6%) |
| 6 or 7 Rooms | 404 (42.7%) | 97 (21.6%) |
| 8 or more Rooms | 204 (21.6%) | 0 (0.0%) |
| Total | 946 (100.0%) | 450 (100.0%) |
Housing Structure by Heating Type in Milton
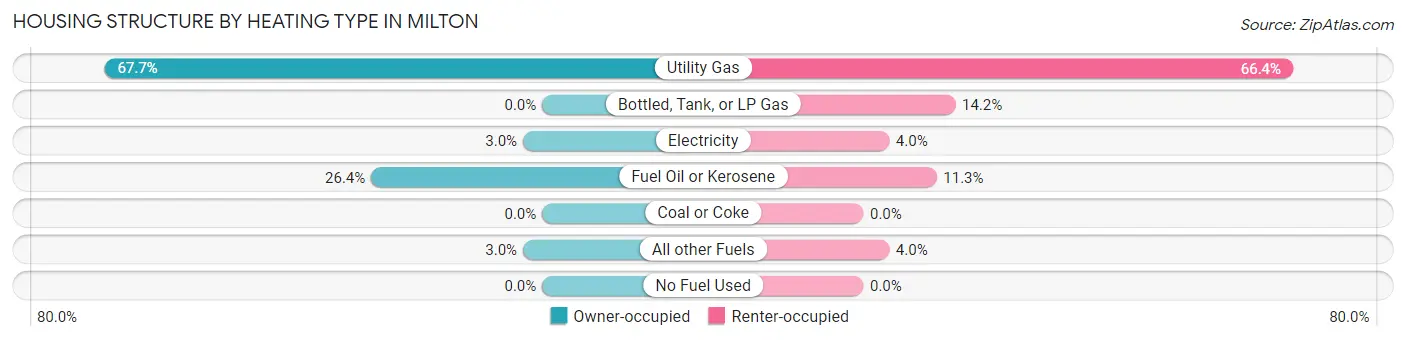
| Heating Type | Owner-occupied | Renter-occupied |
| Utility Gas | 640 (67.6%) | 299 (66.4%) |
| Bottled, Tank, or LP Gas | 0 (0.0%) | 64 (14.2%) |
| Electricity | 28 (3.0%) | 18 (4.0%) |
| Fuel Oil or Kerosene | 250 (26.4%) | 51 (11.3%) |
| Coal or Coke | 0 (0.0%) | 0 (0.0%) |
| All other Fuels | 28 (3.0%) | 18 (4.0%) |
| No Fuel Used | 0 (0.0%) | 0 (0.0%) |
| Total | 946 (100.0%) | 450 (100.0%) |
Household Vehicle Usage in Milton
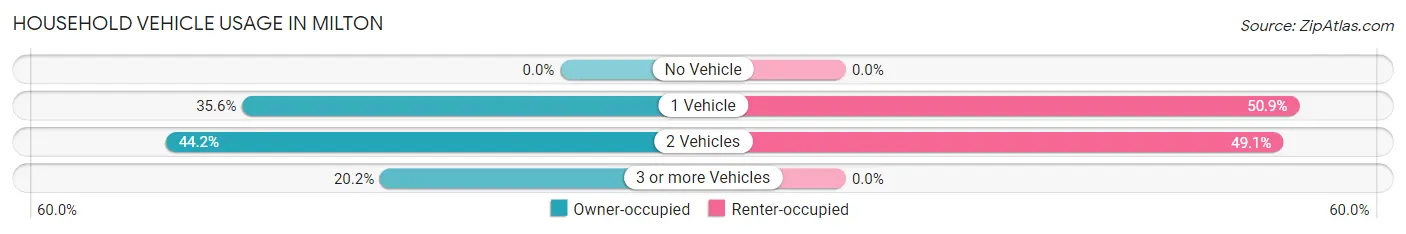
| Vehicles per Household | Owner-occupied | Renter-occupied |
| No Vehicle | 0 (0.0%) | 0 (0.0%) |
| 1 Vehicle | 337 (35.6%) | 229 (50.9%) |
| 2 Vehicles | 418 (44.2%) | 221 (49.1%) |
| 3 or more Vehicles | 191 (20.2%) | 0 (0.0%) |
| Total | 946 (100.0%) | 450 (100.0%) |
Real Estate & Mortgages in Milton
Real Estate and Mortgage Overview in Milton
| Characteristic | Without Mortgage | With Mortgage |
| Housing Units | 328 | 618 |
| Median Property Value | - | - |
| Median Household Income | $34,672 | $194 |
| Monthly Housing Costs | $759 | $45 |
| Real Estate Taxes | - | - |
Property Value by Mortgage Status in Milton
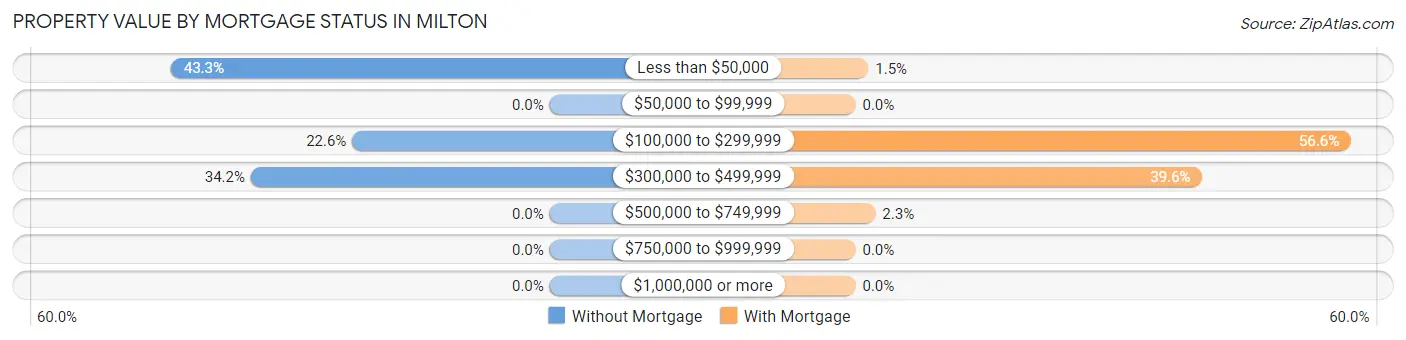
| Property Value | Without Mortgage | With Mortgage |
| Less than $50,000 | 142 (43.3%) | 9 (1.5%) |
| $50,000 to $99,999 | 0 (0.0%) | 0 (0.0%) |
| $100,000 to $299,999 | 74 (22.6%) | 350 (56.6%) |
| $300,000 to $499,999 | 112 (34.2%) | 245 (39.6%) |
| $500,000 to $749,999 | 0 (0.0%) | 14 (2.3%) |
| $750,000 to $999,999 | 0 (0.0%) | 0 (0.0%) |
| $1,000,000 or more | 0 (0.0%) | 0 (0.0%) |
| Total | 328 (100.0%) | 618 (100.0%) |
Household Income by Mortgage Status in Milton
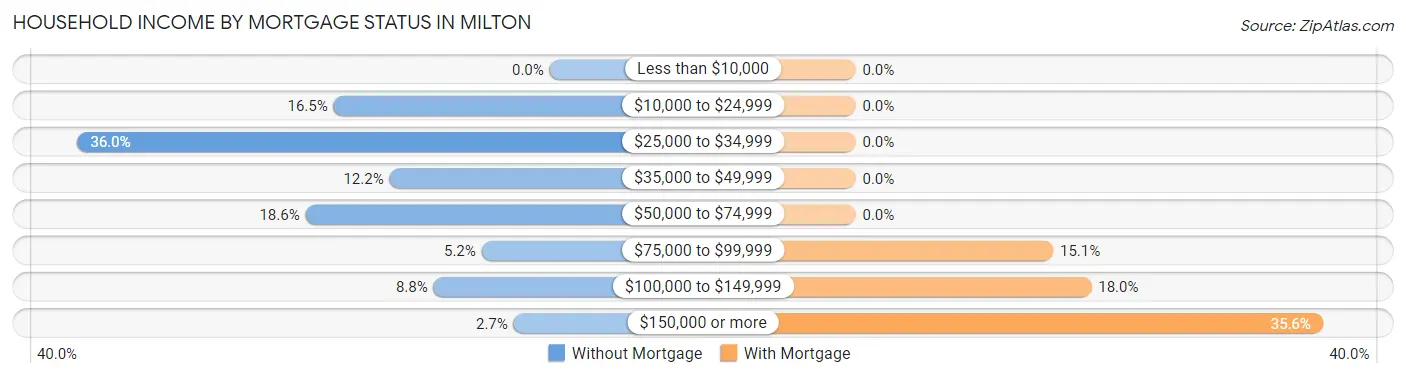
| Household Income | Without Mortgage | With Mortgage |
| Less than $10,000 | 0 (0.0%) | 0 (0.0%) |
| $10,000 to $24,999 | 54 (16.5%) | 0 (0.0%) |
| $25,000 to $34,999 | 118 (36.0%) | 0 (0.0%) |
| $35,000 to $49,999 | 40 (12.2%) | 0 (0.0%) |
| $50,000 to $74,999 | 61 (18.6%) | 0 (0.0%) |
| $75,000 to $99,999 | 17 (5.2%) | 93 (15.0%) |
| $100,000 to $149,999 | 29 (8.8%) | 111 (18.0%) |
| $150,000 or more | 9 (2.7%) | 220 (35.6%) |
| Total | 328 (100.0%) | 618 (100.0%) |
Property Value to Household Income Ratio in Milton
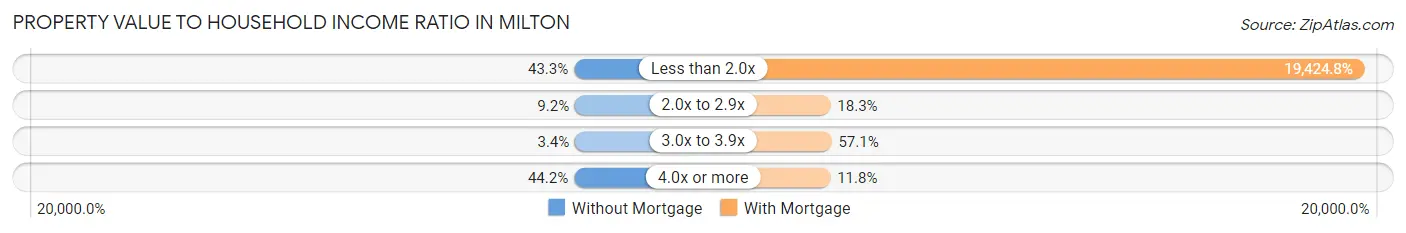
| Value-to-Income Ratio | Without Mortgage | With Mortgage |
| Less than 2.0x | 142 (43.3%) | 120,045 (19,424.8%) |
| 2.0x to 2.9x | 30 (9.1%) | 113 (18.3%) |
| 3.0x to 3.9x | 11 (3.4%) | 353 (57.1%) |
| 4.0x or more | 145 (44.2%) | 73 (11.8%) |
| Total | 328 (100.0%) | 618 (100.0%) |
Real Estate Taxes by Mortgage Status in Milton
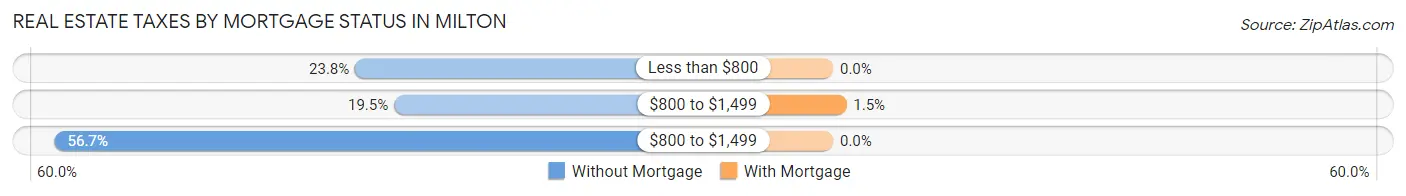
| Property Taxes | Without Mortgage | With Mortgage |
| Less than $800 | 78 (23.8%) | 0 (0.0%) |
| $800 to $1,499 | 64 (19.5%) | 9 (1.5%) |
| $800 to $1,499 | 186 (56.7%) | 0 (0.0%) |
| Total | 328 (100.0%) | 618 (100.0%) |
Health & Disability in Milton
Health Insurance Coverage by Age in Milton
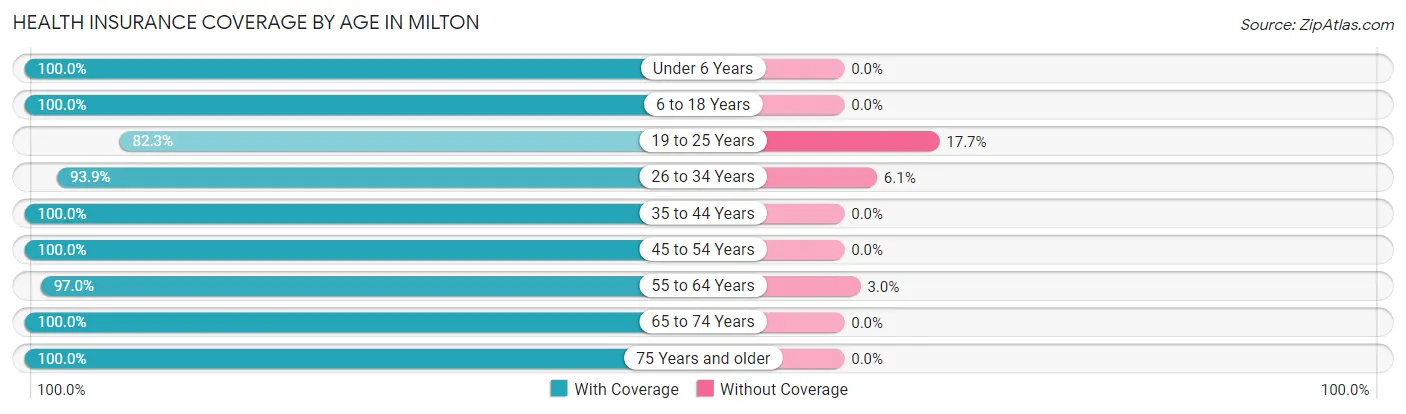
| Age Bracket | With Coverage | Without Coverage |
| Under 6 Years | 219 (100.0%) | 0 (0.0%) |
| 6 to 18 Years | 605 (100.0%) | 0 (0.0%) |
| 19 to 25 Years | 283 (82.3%) | 61 (17.7%) |
| 26 to 34 Years | 556 (93.9%) | 36 (6.1%) |
| 35 to 44 Years | 226 (100.0%) | 0 (0.0%) |
| 45 to 54 Years | 271 (100.0%) | 0 (0.0%) |
| 55 to 64 Years | 967 (97.0%) | 30 (3.0%) |
| 65 to 74 Years | 395 (100.0%) | 0 (0.0%) |
| 75 Years and older | 63 (100.0%) | 0 (0.0%) |
| Total | 3,585 (96.6%) | 127 (3.4%) |
Health Insurance Coverage by Citizenship Status in Milton
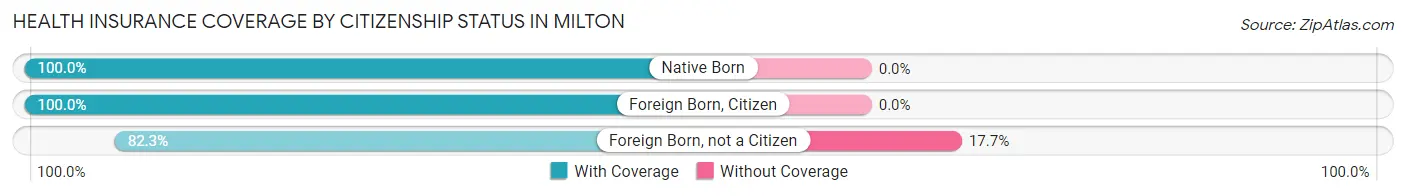
| Citizenship Status | With Coverage | Without Coverage |
| Native Born | 219 (100.0%) | 0 (0.0%) |
| Foreign Born, Citizen | 605 (100.0%) | 0 (0.0%) |
| Foreign Born, not a Citizen | 283 (82.3%) | 61 (17.7%) |
Health Insurance Coverage by Household Income in Milton
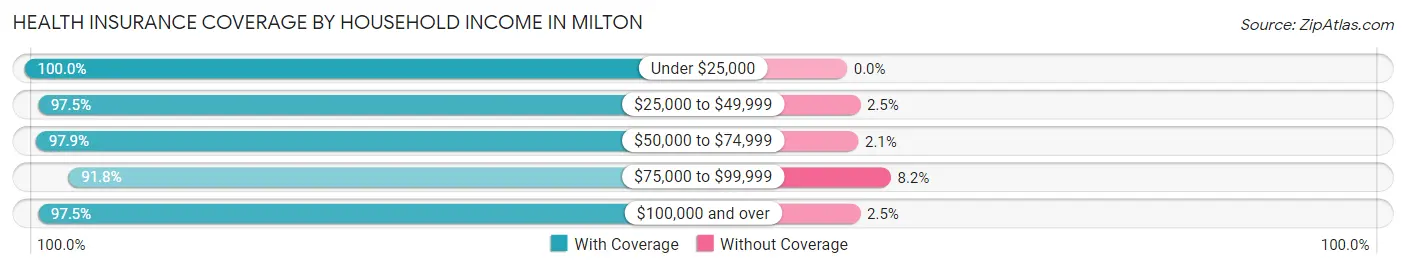
| Household Income | With Coverage | Without Coverage |
| Under $25,000 | 211 (100.0%) | 0 (0.0%) |
| $25,000 to $49,999 | 633 (97.5%) | 16 (2.5%) |
| $50,000 to $74,999 | 648 (97.9%) | 14 (2.1%) |
| $75,000 to $99,999 | 683 (91.8%) | 61 (8.2%) |
| $100,000 and over | 1,410 (97.5%) | 36 (2.5%) |
Public vs Private Health Insurance Coverage by Age in Milton
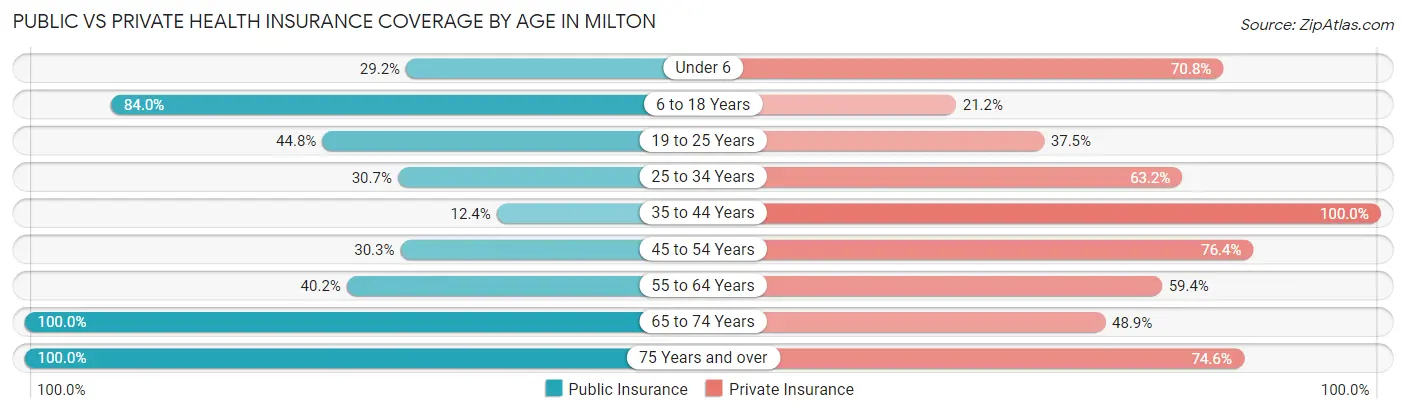
| Age Bracket | Public Insurance | Private Insurance |
| Under 6 | 64 (29.2%) | 155 (70.8%) |
| 6 to 18 Years | 508 (84.0%) | 128 (21.2%) |
| 19 to 25 Years | 154 (44.8%) | 129 (37.5%) |
| 25 to 34 Years | 182 (30.7%) | 374 (63.2%) |
| 35 to 44 Years | 28 (12.4%) | 226 (100.0%) |
| 45 to 54 Years | 82 (30.3%) | 207 (76.4%) |
| 55 to 64 Years | 401 (40.2%) | 592 (59.4%) |
| 65 to 74 Years | 395 (100.0%) | 193 (48.9%) |
| 75 Years and over | 63 (100.0%) | 47 (74.6%) |
| Total | 1,877 (50.6%) | 2,051 (55.2%) |
Disability Status by Sex by Age in Milton
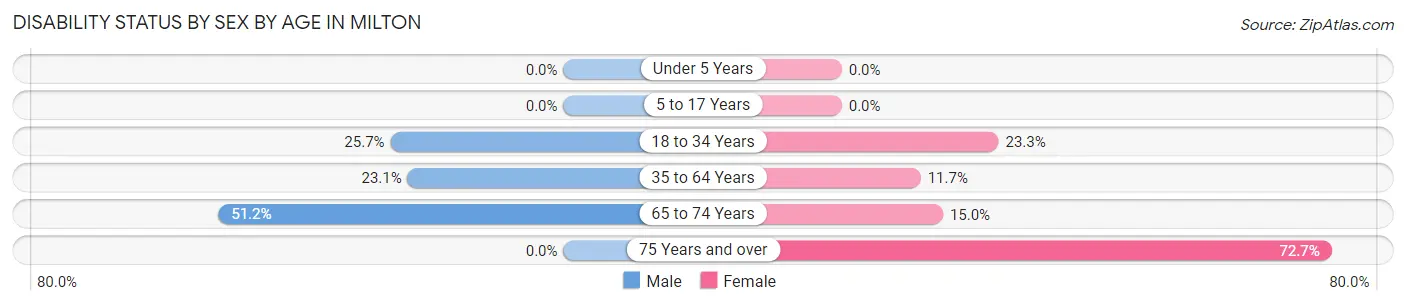
| Age Bracket | Male | Female |
| Under 5 Years | 0 (0.0%) | 0 (0.0%) |
| 5 to 17 Years | 0 (0.0%) | 0 (0.0%) |
| 18 to 34 Years | 198 (25.7%) | 81 (23.3%) |
| 35 to 64 Years | 164 (23.1%) | 92 (11.7%) |
| 65 to 74 Years | 83 (51.2%) | 35 (15.0%) |
| 75 Years and over | 0 (0.0%) | 40 (72.7%) |
Disability Class by Sex by Age in Milton
Disability Class: Hearing Difficulty
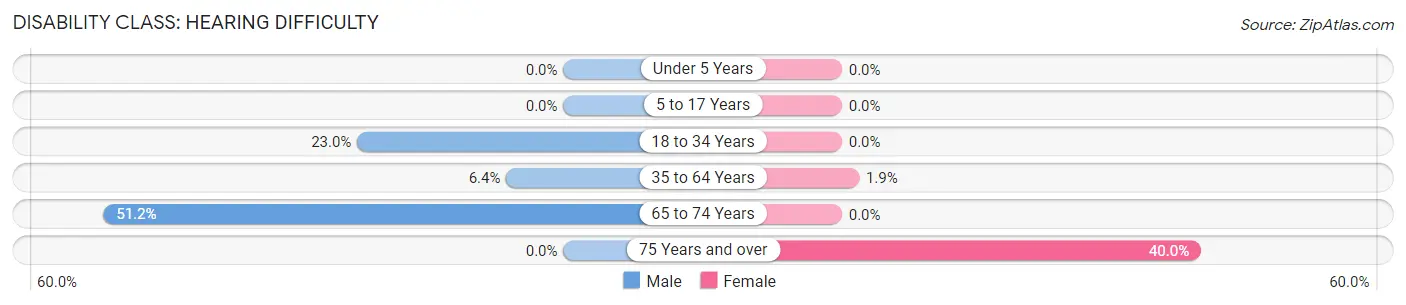
| Age Bracket | Male | Female |
| Under 5 Years | 0 (0.0%) | 0 (0.0%) |
| 5 to 17 Years | 0 (0.0%) | 0 (0.0%) |
| 18 to 34 Years | 177 (23.0%) | 0 (0.0%) |
| 35 to 64 Years | 45 (6.4%) | 15 (1.9%) |
| 65 to 74 Years | 83 (51.2%) | 0 (0.0%) |
| 75 Years and over | 0 (0.0%) | 22 (40.0%) |
Disability Class: Vision Difficulty
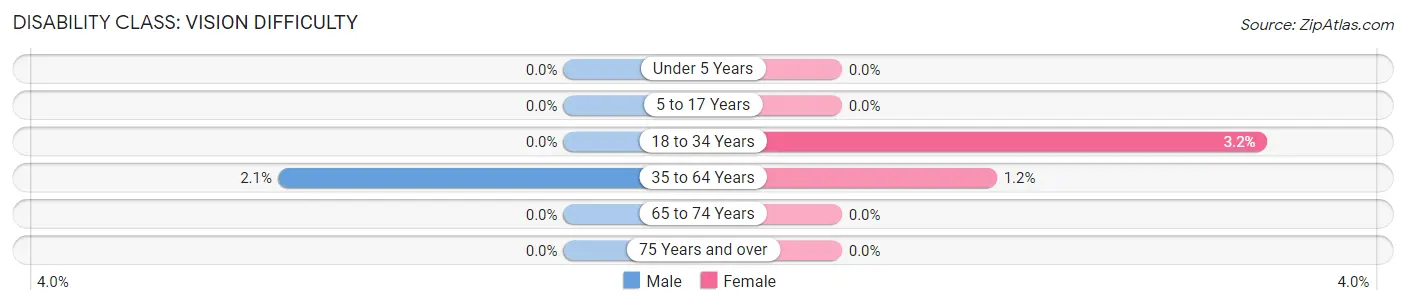
| Age Bracket | Male | Female |
| Under 5 Years | 0 (0.0%) | 0 (0.0%) |
| 5 to 17 Years | 0 (0.0%) | 0 (0.0%) |
| 18 to 34 Years | 0 (0.0%) | 11 (3.2%) |
| 35 to 64 Years | 15 (2.1%) | 9 (1.1%) |
| 65 to 74 Years | 0 (0.0%) | 0 (0.0%) |
| 75 Years and over | 0 (0.0%) | 0 (0.0%) |
Disability Class: Cognitive Difficulty
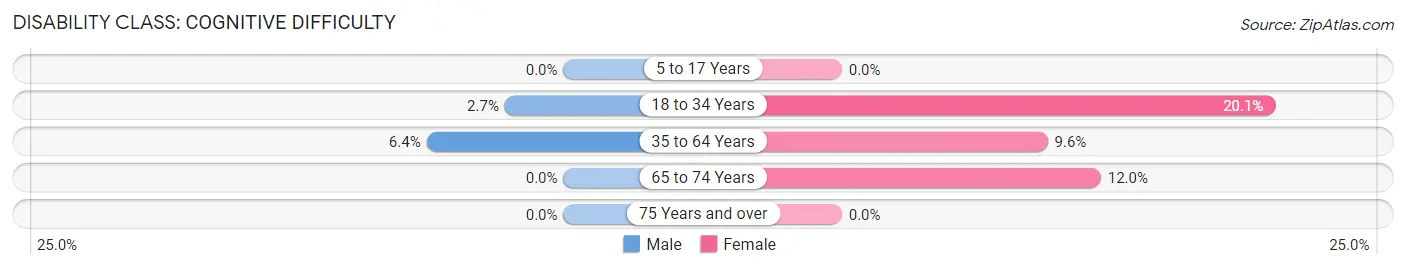
| Age Bracket | Male | Female |
| 5 to 17 Years | 0 (0.0%) | 0 (0.0%) |
| 18 to 34 Years | 21 (2.7%) | 70 (20.1%) |
| 35 to 64 Years | 45 (6.4%) | 75 (9.6%) |
| 65 to 74 Years | 0 (0.0%) | 28 (12.0%) |
| 75 Years and over | 0 (0.0%) | 0 (0.0%) |
Disability Class: Ambulatory Difficulty
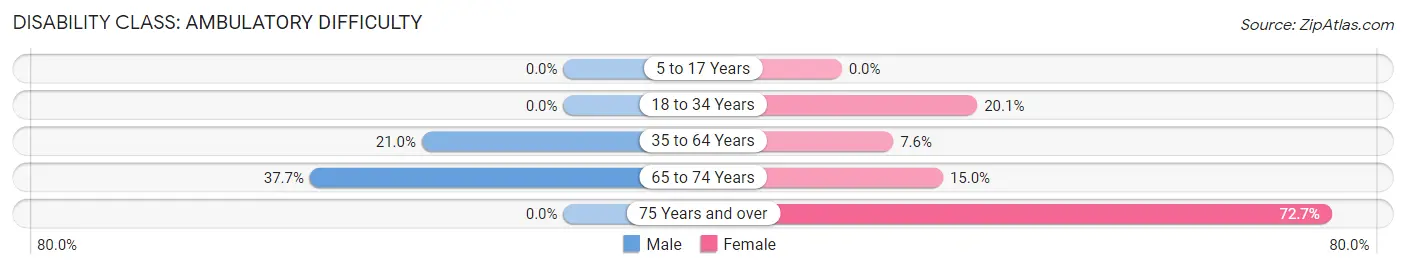
| Age Bracket | Male | Female |
| 5 to 17 Years | 0 (0.0%) | 0 (0.0%) |
| 18 to 34 Years | 0 (0.0%) | 70 (20.1%) |
| 35 to 64 Years | 149 (21.0%) | 60 (7.6%) |
| 65 to 74 Years | 61 (37.7%) | 35 (15.0%) |
| 75 Years and over | 0 (0.0%) | 40 (72.7%) |
Disability Class: Self-Care Difficulty
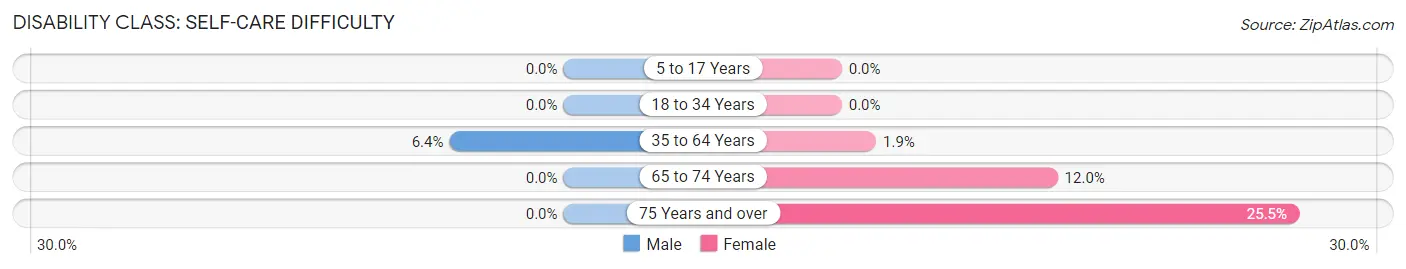
| Age Bracket | Male | Female |
| 5 to 17 Years | 0 (0.0%) | 0 (0.0%) |
| 18 to 34 Years | 0 (0.0%) | 0 (0.0%) |
| 35 to 64 Years | 45 (6.4%) | 15 (1.9%) |
| 65 to 74 Years | 0 (0.0%) | 28 (12.0%) |
| 75 Years and over | 0 (0.0%) | 14 (25.5%) |
Technology Access in Milton
Computing Device Access in Milton
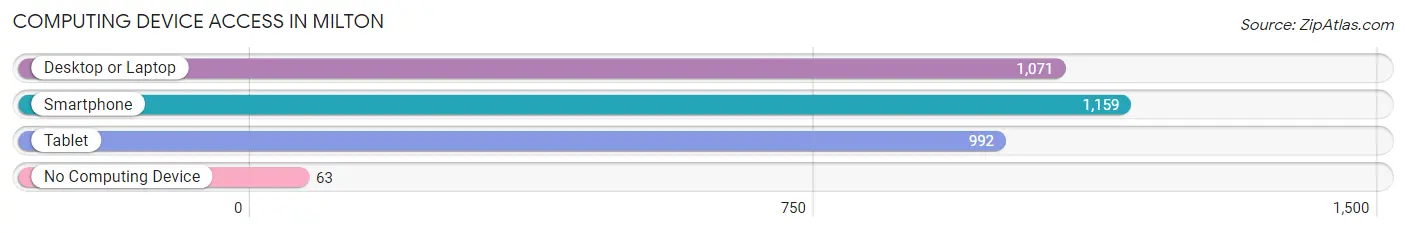
| Device Type | # Households | % Households |
| Desktop or Laptop | 1,071 | 76.7% |
| Smartphone | 1,159 | 83.0% |
| Tablet | 992 | 71.1% |
| No Computing Device | 63 | 4.5% |
| Total | 1,396 | 100.0% |
Internet Access in Milton
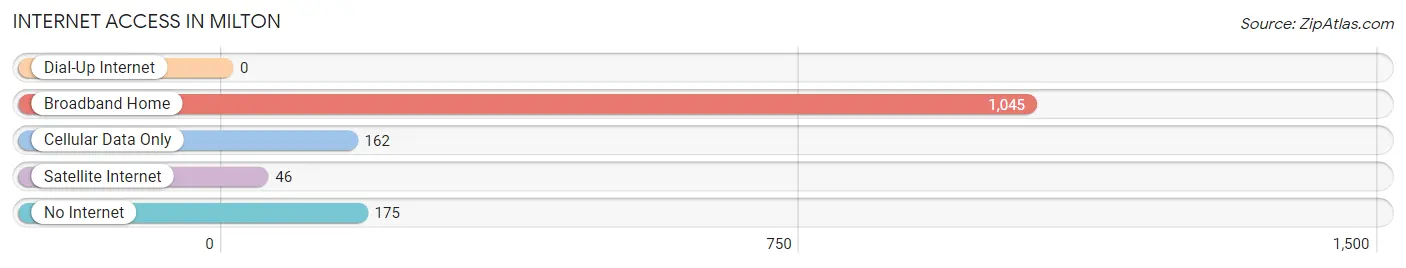
| Internet Type | # Households | % Households |
| Dial-Up Internet | 0 | 0.0% |
| Broadband Home | 1,045 | 74.9% |
| Cellular Data Only | 162 | 11.6% |
| Satellite Internet | 46 | 3.3% |
| No Internet | 175 | 12.5% |
| Total | 1,396 | 100.0% |
Milton Summary
Milton is a town located in Chittenden County, Vermont, United States. The population was 10,352 at the 2010 census. Milton is located on the western side of the Green Mountains, and is bordered by the towns of Georgia to the north, Colchester to the east, and South Burlington to the south.
History
Milton was first settled in 1763 by a group of settlers from Massachusetts. The town was named after the English poet John Milton. The town was incorporated in 1763, and the first town meeting was held in 1764.
In the early 19th century, Milton was a thriving agricultural community. The town was home to several mills, including a grist mill, a saw mill, and a carding mill. The town also had a blacksmith shop, a tannery, and a general store.
In the late 19th century, Milton began to experience a period of growth and development. The town was home to several factories, including a paper mill, a brickyard, and a furniture factory. The town also had a railroad station, which connected it to the rest of the state.
Geography
Milton is located in the western part of Chittenden County, Vermont. The town is bordered by the towns of Georgia to the north, Colchester to the east, and South Burlington to the south. The town is located on the western side of the Green Mountains, and is approximately 10 miles south of Burlington.
The town has a total area of 28.2 square miles, of which 28.1 square miles is land and 0.1 square miles is water. The town is located in the Lamoille River Valley, and is drained by the Lamoille River.
Economy
Milton's economy is largely based on agriculture and manufacturing. The town is home to several farms, which produce dairy products, vegetables, and fruits. The town also has several factories, which produce paper products, furniture, and other goods.
The town is also home to several businesses, including restaurants, retail stores, and service providers. The town is also home to several educational institutions, including Milton High School and Milton Middle School.
Demographics
As of the 2010 census, there were 10,352 people, 4,072 households, and 2,845 families residing in the town. The population density was 365.7 people per square mile. There were 4,307 housing units at an average density of 152.7 per square mile.
The racial makeup of the town was 94.2% White, 1.3% African American, 0.3% Native American, 1.7% Asian, 0.1% Pacific Islander, 0.7% from other races, and 1.9% from two or more races. Hispanic or Latino of any race were 2.2% of the population.
There were 4,072 households, out of which 33.2% had children under the age of 18 living with them, 54.2% were married couples living together, 10.3% had a female householder with no husband present, and 30.7% were non-families. 24.2% of all households were made up of individuals, and 8.3% had someone living alone who was 65 years of age or older. The average household size was 2.54 and the average family size was 3.03.
In the town, the population was spread out, with 25.2% under the age of 18, 7.2% from 18 to 24, 30.2% from 25 to 44, 25.2% from 45 to 64, and 12.2% who were 65 years of age or older. The median age was 38 years. For every 100 females, there were 97.2 males. For every 100 females age 18 and over, there were 94.2 males.
The median income for a household in the town was $50,945, and the median income for a family was $60,945. Males had a median income of $41,945 versus $30,945 for females. The per capita income for the town was $24,945. About 4.2% of families and 6.2% of the population were below the poverty line, including 8.2% of those under age 18 and 4.2% of those age 65 or over.
Common Questions
What is Per Capita Income in Milton?
Per Capita income in Milton is $35,095.
What is the Median Family Income in Milton?
Median Family Income in Milton is $105,938.
What is the Median Household income in Milton?
Median Household Income in Milton is $81,526.
What is Income or Wage Gap in Milton?
Income or Wage Gap in Milton is 8.3%.
Women in Milton earn 91.7 cents for every dollar earned by a man.
What is Inequality or Gini Index in Milton?
Inequality or Gini Index in Milton is 0.38.
What is the Total Population of Milton?
Total Population of Milton is 3,712.
What is the Total Male Population of Milton?
Total Male Population of Milton is 1,961.
What is the Total Female Population of Milton?
Total Female Population of Milton is 1,751.
What is the Ratio of Males per 100 Females in Milton?
There are 111.99 Males per 100 Females in Milton.
What is the Ratio of Females per 100 Males in Milton?
There are 89.29 Females per 100 Males in Milton.
What is the Median Population Age in Milton?
Median Population Age in Milton is 40.3 Years.
What is the Average Family Size in Milton
Average Family Size in Milton is 3.2 People.
What is the Average Household Size in Milton
Average Household Size in Milton is 2.7 People.
How Large is the Labor Force in Milton?
There are 2,175 People in the Labor Forcein in Milton.
What is the Percentage of People in the Labor Force in Milton?
69.5% of People are in the Labor Force in Milton.
What is the Unemployment Rate in Milton?
Unemployment Rate in Milton is 16.0%.