Windsor, VT Map & Demographics
Windsor Map
Windsor Overview
$34,143
PER CAPITA INCOME
$59,191
AVG FAMILY INCOME
$47,545
AVG HOUSEHOLD INCOME
11.8%
WAGE / INCOME GAP [ % ]
88.2¢/ $1
WAGE / INCOME GAP [ $ ]
0.49
INEQUALITY / GINI INDEX
2,138
TOTAL POPULATION
890
MALE POPULATION
1,248
FEMALE POPULATION
71.31
MALES / 100 FEMALES
140.22
FEMALES / 100 MALES
41.0
MEDIAN AGE
2.9
AVG FAMILY SIZE
2.0
AVG HOUSEHOLD SIZE
1,120
LABOR FORCE [ PEOPLE ]
63.2%
PERCENT IN LABOR FORCE
3.8%
UNEMPLOYMENT RATE
Windsor Zip Codes
Windsor Area Codes
Income in Windsor
Income Overview in Windsor
Per Capita Income in Windsor is $34,143, while median incomes of families and households are $59,191 and $47,545 respectively.
| Characteristic | Number | Measure |
| Per Capita Income | 2,138 | $34,143 |
| Median Family Income | 459 | $59,191 |
| Mean Family Income | 459 | $104,519 |
| Median Household Income | 1,047 | $47,545 |
| Mean Household Income | 1,047 | $70,384 |
| Income Deficit | 459 | $0 |
| Wage / Income Gap (%) | 2,138 | 11.84% |
| Wage / Income Gap ($) | 2,138 | 88.16¢ per $1 |
| Gini / Inequality Index | 2,138 | 0.49 |
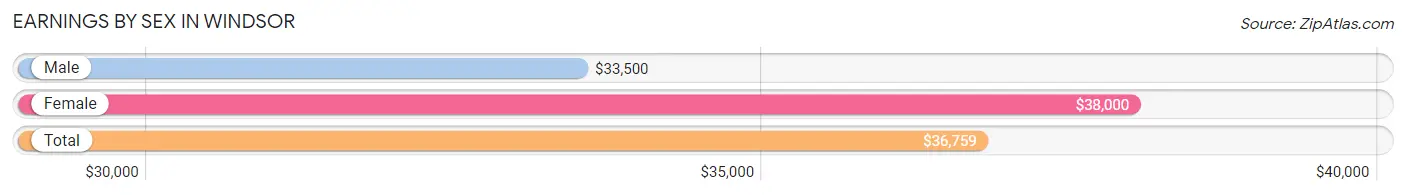
Earnings by Sex in Windsor
Average Earnings in Windsor are $36,759, $33,500 for men and $38,000 for women, a difference of 11.8%.
| Sex | Number | Average Earnings |
| Male | 516 (45.7%) | $33,500 |
| Female | 614 (54.3%) | $38,000 |
| Total | 1,130 (100.0%) | $36,759 |
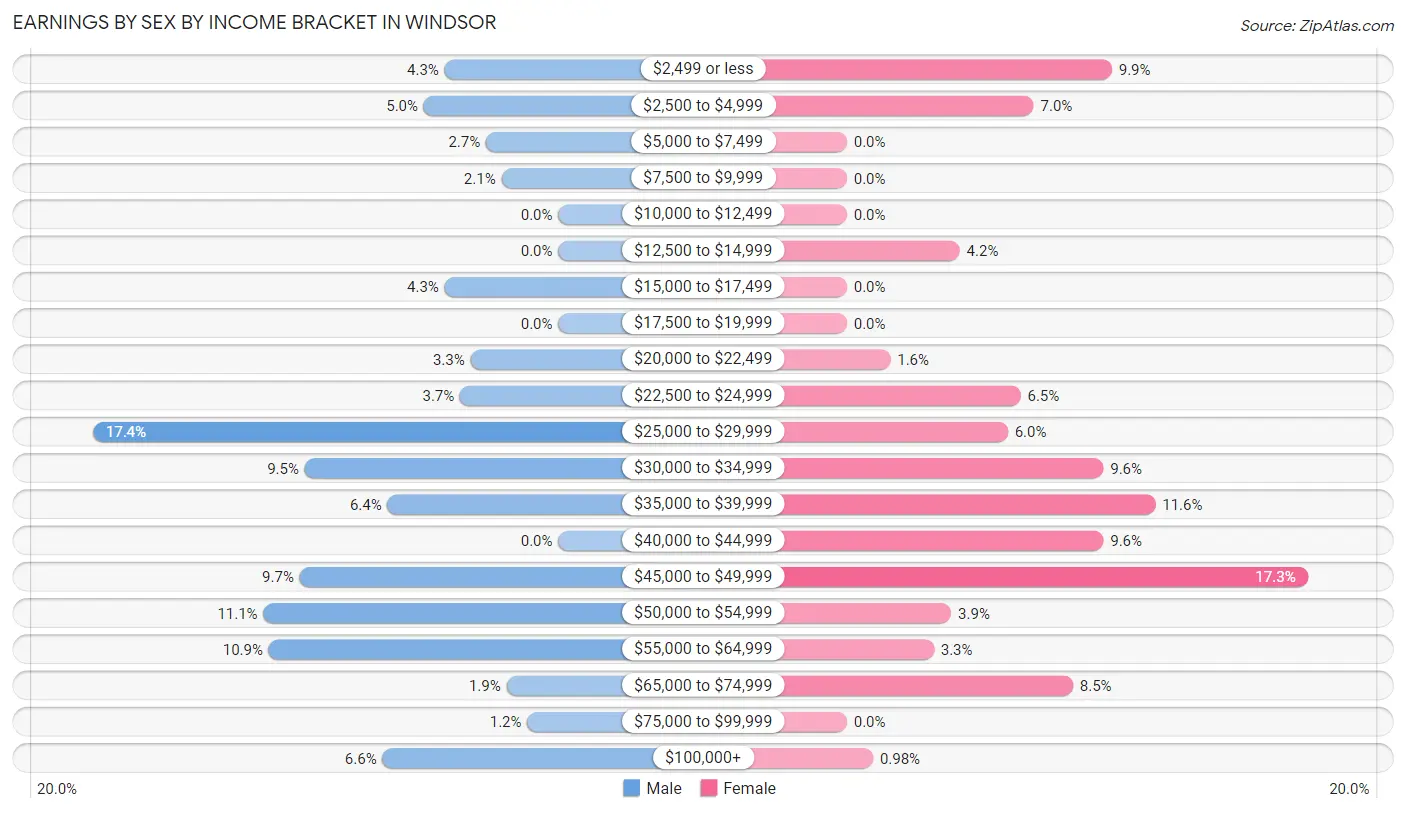
Earnings by Sex by Income Bracket in Windsor
The most common earnings brackets in Windsor are $25,000 to $29,999 for men (90 | 17.4%) and $45,000 to $49,999 for women (106 | 17.3%).
| Income | Male | Female |
| $2,499 or less | 22 (4.3%) | 61 (9.9%) |
| $2,500 to $4,999 | 26 (5.0%) | 43 (7.0%) |
| $5,000 to $7,499 | 14 (2.7%) | 0 (0.0%) |
| $7,500 to $9,999 | 11 (2.1%) | 0 (0.0%) |
| $10,000 to $12,499 | 0 (0.0%) | 0 (0.0%) |
| $12,500 to $14,999 | 0 (0.0%) | 26 (4.2%) |
| $15,000 to $17,499 | 22 (4.3%) | 0 (0.0%) |
| $17,500 to $19,999 | 0 (0.0%) | 0 (0.0%) |
| $20,000 to $22,499 | 17 (3.3%) | 10 (1.6%) |
| $22,500 to $24,999 | 19 (3.7%) | 40 (6.5%) |
| $25,000 to $29,999 | 90 (17.4%) | 37 (6.0%) |
| $30,000 to $34,999 | 49 (9.5%) | 59 (9.6%) |
| $35,000 to $39,999 | 33 (6.4%) | 71 (11.6%) |
| $40,000 to $44,999 | 0 (0.0%) | 59 (9.6%) |
| $45,000 to $49,999 | 50 (9.7%) | 106 (17.3%) |
| $50,000 to $54,999 | 57 (11.1%) | 24 (3.9%) |
| $55,000 to $64,999 | 56 (10.8%) | 20 (3.3%) |
| $65,000 to $74,999 | 10 (1.9%) | 52 (8.5%) |
| $75,000 to $99,999 | 6 (1.2%) | 0 (0.0%) |
| $100,000+ | 34 (6.6%) | 6 (1.0%) |
| Total | 516 (100.0%) | 614 (100.0%) |
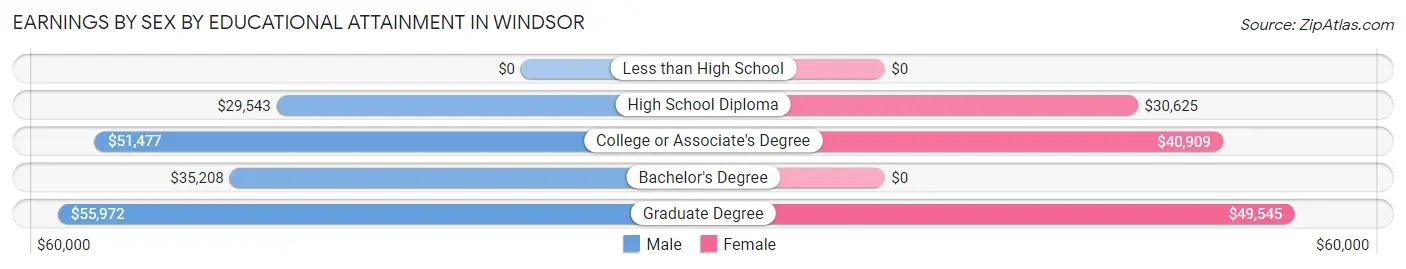
Earnings by Sex by Educational Attainment in Windsor
Average earnings in Windsor are $38,657 for men and $38,750 for women, a difference of 0.2%. Men with an educational attainment of graduate degree enjoy the highest average annual earnings of $55,972, while those with high school diploma education earn the least with $29,543. Women with an educational attainment of graduate degree earn the most with the average annual earnings of $49,545, while those with high school diploma education have the smallest earnings of $30,625.
| Educational Attainment | Male Income | Female Income |
| Less than High School | - | - |
| High School Diploma | $29,543 | $30,625 |
| College or Associate's Degree | $51,477 | $40,909 |
| Bachelor's Degree | $35,208 | $0 |
| Graduate Degree | $55,972 | $49,545 |
| Total | $38,657 | $38,750 |
Family Income in Windsor
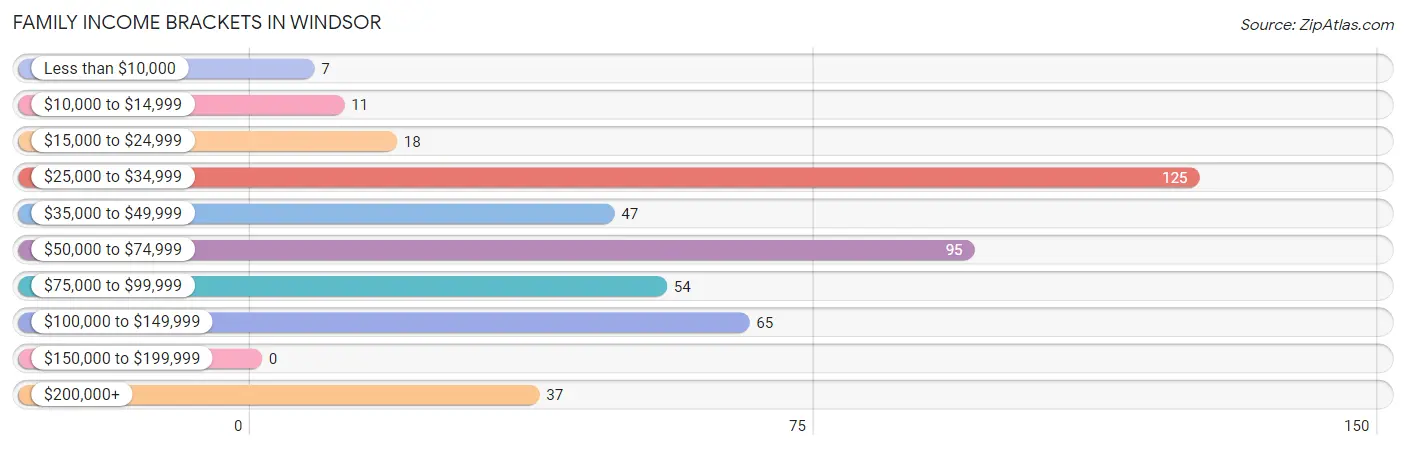
Family Income Brackets in Windsor
According to the Windsor family income data, there are 125 families falling into the $25,000 to $34,999 income range, which is the most common income bracket and makes up 27.2% of all families.
| Income Bracket | # Families | % Families |
| Less than $10,000 | 7 | 1.5% |
| $10,000 to $14,999 | 11 | 2.4% |
| $15,000 to $24,999 | 18 | 3.9% |
| $25,000 to $34,999 | 125 | 27.2% |
| $35,000 to $49,999 | 47 | 10.2% |
| $50,000 to $74,999 | 95 | 20.7% |
| $75,000 to $99,999 | 54 | 11.8% |
| $100,000 to $149,999 | 65 | 14.2% |
| $150,000 to $199,999 | 0 | 0.0% |
| $200,000+ | 37 | 8.1% |
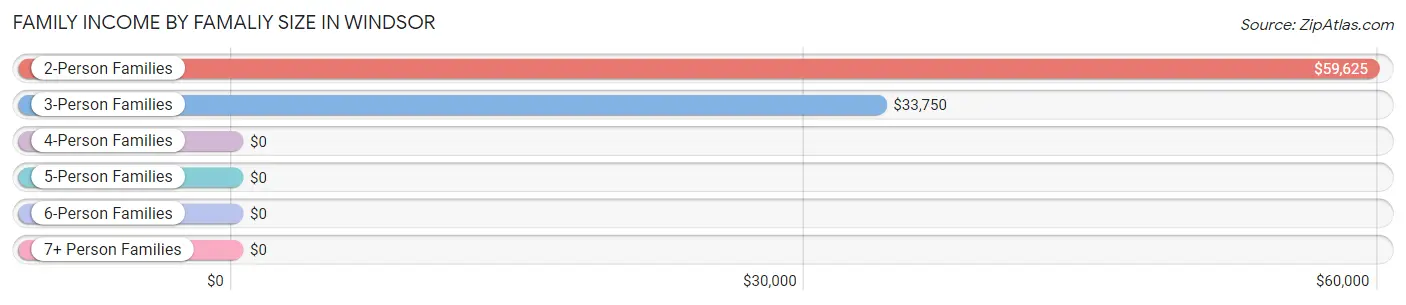
Family Income by Famaliy Size in Windsor
2-person families (297 | 64.7%) account for the highest median family income in Windsor with $59,625 per family, while 2-person families (297 | 64.7%) have the highest median income of $29,812 per family member.
| Income Bracket | # Families | Median Income |
| 2-Person Families | 297 (64.7%) | $59,625 |
| 3-Person Families | 102 (22.2%) | $33,750 |
| 4-Person Families | 25 (5.4%) | $0 |
| 5-Person Families | 18 (3.9%) | $0 |
| 6-Person Families | 17 (3.7%) | $0 |
| 7+ Person Families | 0 (0.0%) | $0 |
| Total | 459 (100.0%) | $59,191 |
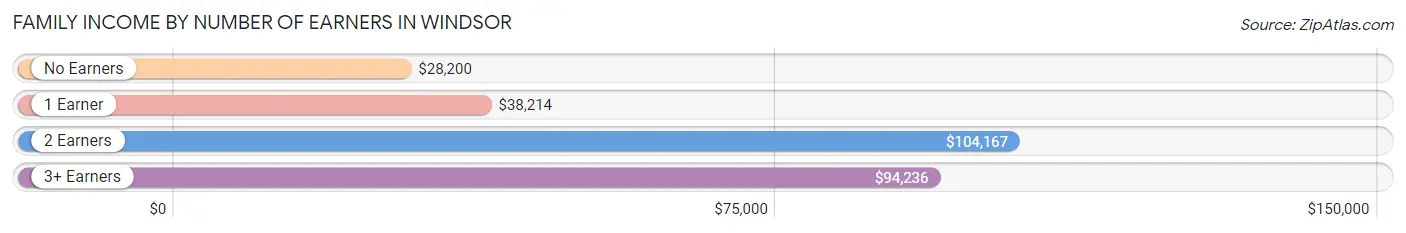
Family Income by Number of Earners in Windsor
The median family income in Windsor is $59,191, with families comprising 2 earners (132) having the highest median family income of $104,167, while families with no earners (50) have the lowest median family income of $28,200, accounting for 28.8% and 10.9% of families, respectively.
| Number of Earners | # Families | Median Income |
| No Earners | 50 (10.9%) | $28,200 |
| 1 Earner | 236 (51.4%) | $38,214 |
| 2 Earners | 132 (28.8%) | $104,167 |
| 3+ Earners | 41 (8.9%) | $94,236 |
| Total | 459 (100.0%) | $59,191 |
Household Income in Windsor
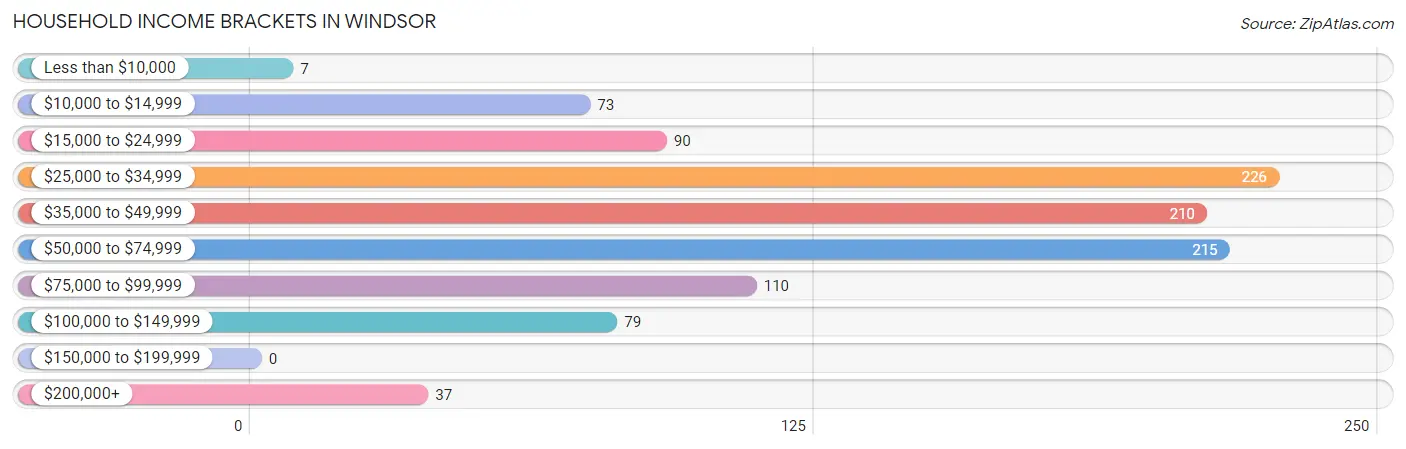
Household Income Brackets in Windsor
With 226 households falling in the category, the $25,000 to $34,999 income range is the most frequent in Windsor, accounting for 21.6% of all households.
| Income Bracket | # Households | % Households |
| Less than $10,000 | 7 | 0.7% |
| $10,000 to $14,999 | 73 | 7.0% |
| $15,000 to $24,999 | 90 | 8.6% |
| $25,000 to $34,999 | 226 | 21.6% |
| $35,000 to $49,999 | 210 | 20.1% |
| $50,000 to $74,999 | 215 | 20.5% |
| $75,000 to $99,999 | 110 | 10.5% |
| $100,000 to $149,999 | 79 | 7.5% |
| $150,000 to $199,999 | 0 | 0.0% |
| $200,000+ | 37 | 3.5% |
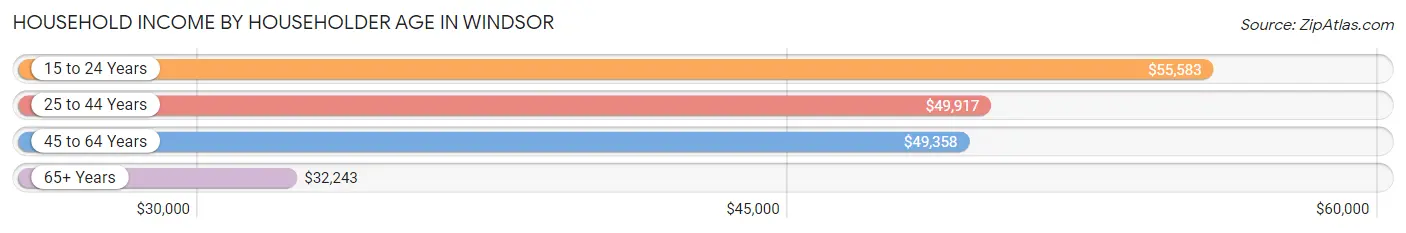
Household Income by Householder Age in Windsor
The median household income in Windsor is $47,545, with the highest median household income of $55,583 found in the 15 to 24 years age bracket for the primary householder. A total of 97 households (9.3%) fall into this category. Meanwhile, the 65+ years age bracket for the primary householder has the lowest median household income of $32,243, with 386 households (36.9%) in this group.
| Income Bracket | # Households | Median Income |
| 15 to 24 Years | 97 (9.3%) | $55,583 |
| 25 to 44 Years | 299 (28.6%) | $49,917 |
| 45 to 64 Years | 265 (25.3%) | $49,358 |
| 65+ Years | 386 (36.9%) | $32,243 |
| Total | 1,047 (100.0%) | $47,545 |
Poverty in Windsor
Income Below Poverty by Sex and Age in Windsor
With 9.0% poverty level for males and 4.6% for females among the residents of Windsor, 55 to 64 year old males and 25 to 34 year old females are the most vulnerable to poverty, with 51 males (73.9%) and 26 females (21.1%) in their respective age groups living below the poverty level.
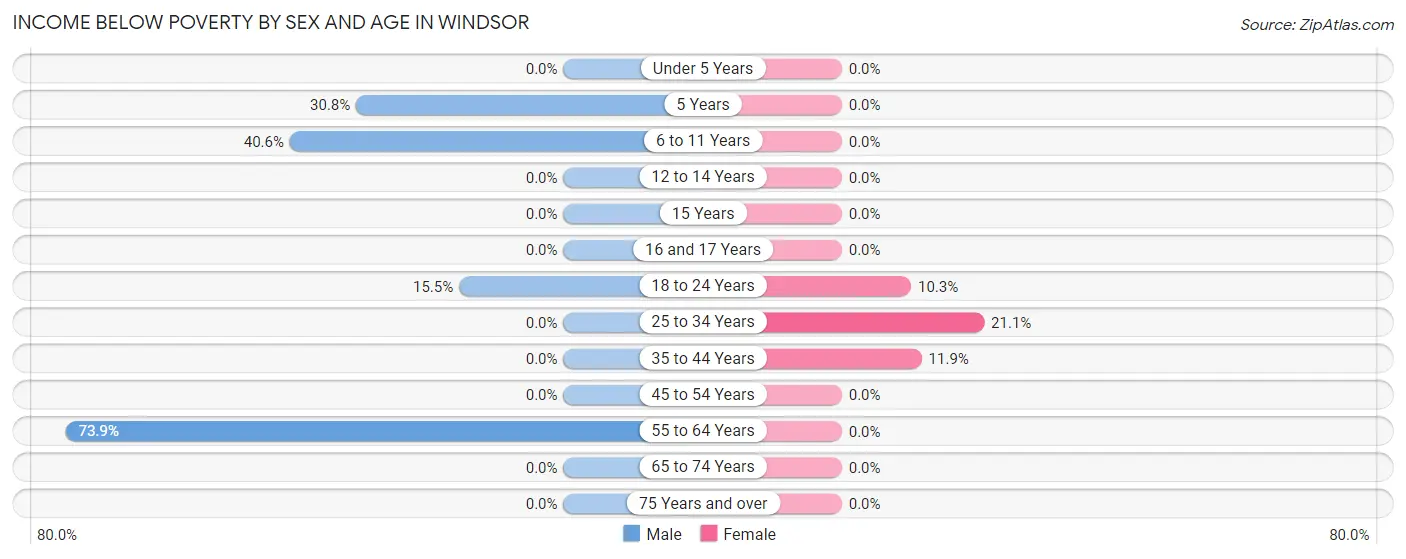
| Age Bracket | Male | Female |
| Under 5 Years | 0 (0.0%) | 0 (0.0%) |
| 5 Years | 4 (30.8%) | 0 (0.0%) |
| 6 to 11 Years | 13 (40.6%) | 0 (0.0%) |
| 12 to 14 Years | 0 (0.0%) | 0 (0.0%) |
| 15 Years | 0 (0.0%) | 0 (0.0%) |
| 16 and 17 Years | 0 (0.0%) | 0 (0.0%) |
| 18 to 24 Years | 11 (15.5%) | 14 (10.3%) |
| 25 to 34 Years | 0 (0.0%) | 26 (21.1%) |
| 35 to 44 Years | 0 (0.0%) | 14 (11.9%) |
| 45 to 54 Years | 0 (0.0%) | 0 (0.0%) |
| 55 to 64 Years | 51 (73.9%) | 0 (0.0%) |
| 65 to 74 Years | 0 (0.0%) | 0 (0.0%) |
| 75 Years and over | 0 (0.0%) | 0 (0.0%) |
| Total | 79 (9.0%) | 54 (4.6%) |
Income Above Poverty by Sex and Age in Windsor
According to the poverty statistics in Windsor, males aged under 5 years and females aged under 5 years are the age groups that are most secure financially, with 100.0% of males and 100.0% of females in these age groups living above the poverty line.
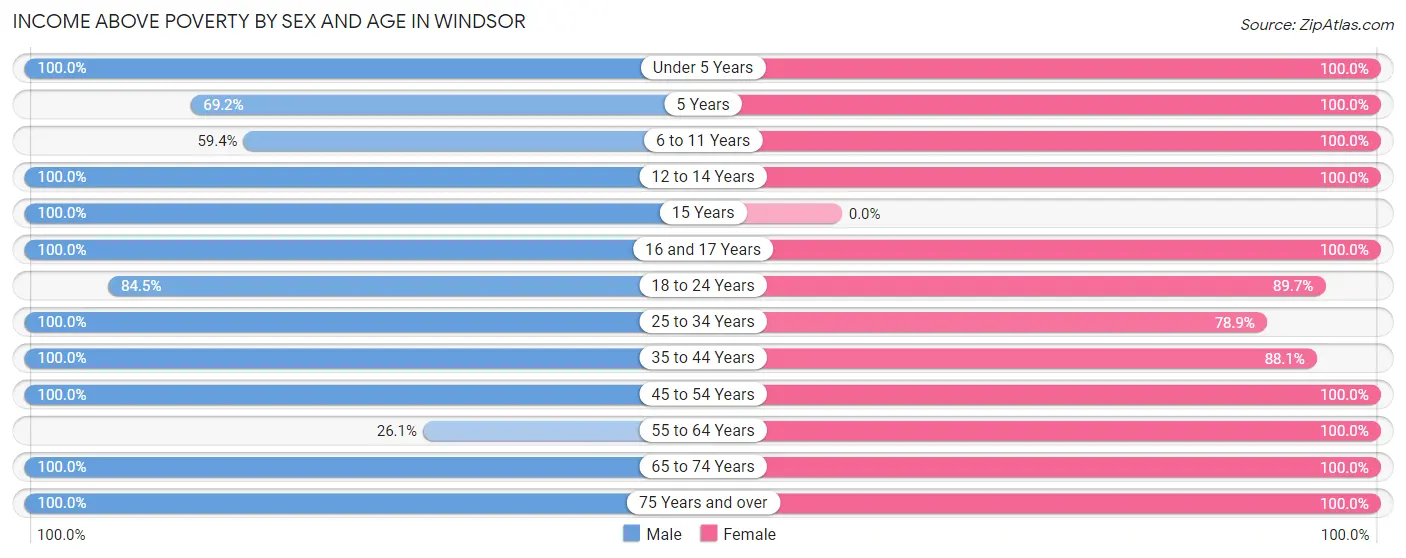
| Age Bracket | Male | Female |
| Under 5 Years | 46 (100.0%) | 70 (100.0%) |
| 5 Years | 9 (69.2%) | 10 (100.0%) |
| 6 to 11 Years | 19 (59.4%) | 126 (100.0%) |
| 12 to 14 Years | 32 (100.0%) | 32 (100.0%) |
| 15 Years | 5 (100.0%) | 0 (0.0%) |
| 16 and 17 Years | 37 (100.0%) | 40 (100.0%) |
| 18 to 24 Years | 60 (84.5%) | 122 (89.7%) |
| 25 to 34 Years | 138 (100.0%) | 97 (78.9%) |
| 35 to 44 Years | 160 (100.0%) | 104 (88.1%) |
| 45 to 54 Years | 101 (100.0%) | 68 (100.0%) |
| 55 to 64 Years | 18 (26.1%) | 157 (100.0%) |
| 65 to 74 Years | 92 (100.0%) | 191 (100.0%) |
| 75 Years and over | 82 (100.0%) | 107 (100.0%) |
| Total | 799 (91.0%) | 1,124 (95.4%) |
Income Below Poverty Among Married-Couple Families in Windsor
The poverty statistics for married-couple families in Windsor show that 2.9% or 7 of the total 246 families live below the poverty line. Families with 1 or 2 children have the highest poverty rate of 17.1%, comprising of 7 families. On the other hand, families with no children have the lowest poverty rate of 0.0%, which includes 0 families.
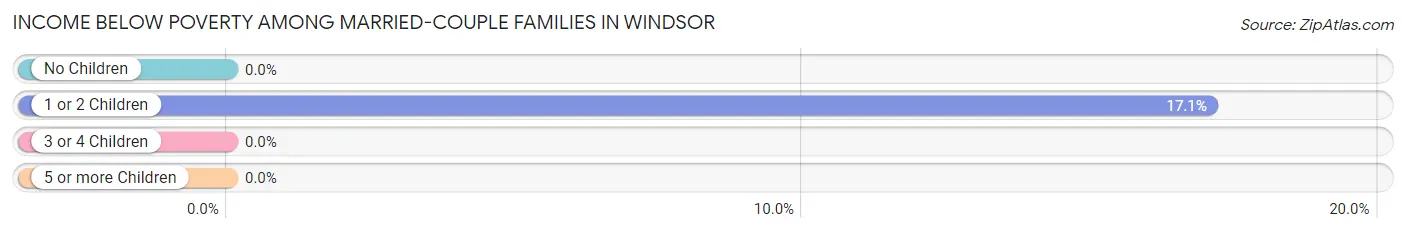
| Children | Above Poverty | Below Poverty |
| No Children | 178 (100.0%) | 0 (0.0%) |
| 1 or 2 Children | 34 (82.9%) | 7 (17.1%) |
| 3 or 4 Children | 27 (100.0%) | 0 (0.0%) |
| 5 or more Children | 0 (0.0%) | 0 (0.0%) |
| Total | 239 (97.2%) | 7 (2.9%) |
Income Below Poverty Among Single-Parent Households in Windsor
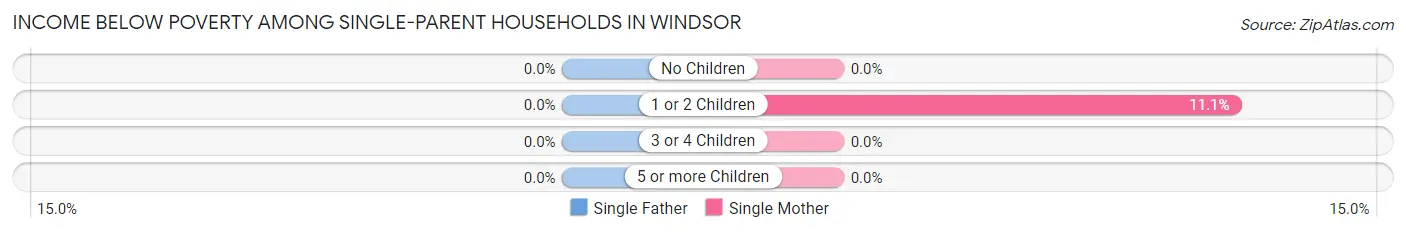
| Children | Single Father | Single Mother |
| No Children | 0 (0.0%) | 0 (0.0%) |
| 1 or 2 Children | 0 (0.0%) | 11 (11.1%) |
| 3 or 4 Children | 0 (0.0%) | 0 (0.0%) |
| 5 or more Children | 0 (0.0%) | 0 (0.0%) |
| Total | 0 (0.0%) | 11 (8.7%) |
Income Below Poverty Among Married-Couple vs Single-Parent Households in Windsor
The poverty data for Windsor shows that 7 of the married-couple family households (2.9%) and 11 of the single-parent households (5.2%) are living below the poverty level. Within the married-couple family households, those with 1 or 2 children have the highest poverty rate, with 7 households (17.1%) falling below the poverty line. Among the single-parent households, those with 1 or 2 children have the highest poverty rate, with 11 household (6.4%) living below poverty.
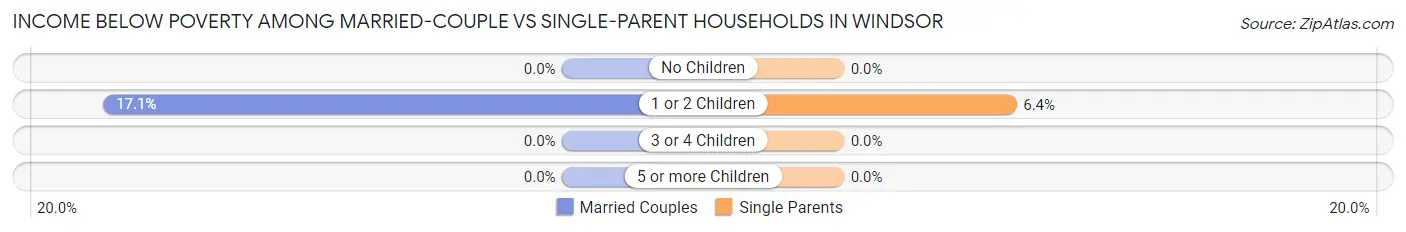
| Children | Married-Couple Families | Single-Parent Households |
| No Children | 0 (0.0%) | 0 (0.0%) |
| 1 or 2 Children | 7 (17.1%) | 11 (6.4%) |
| 3 or 4 Children | 0 (0.0%) | 0 (0.0%) |
| 5 or more Children | 0 (0.0%) | 0 (0.0%) |
| Total | 7 (2.9%) | 11 (5.2%) |
Race in Windsor
The most populous races in Windsor are White / Caucasian (1,958 | 91.6%), Two or more Races (135 | 6.3%), and Some other Race (31 | 1.5%).
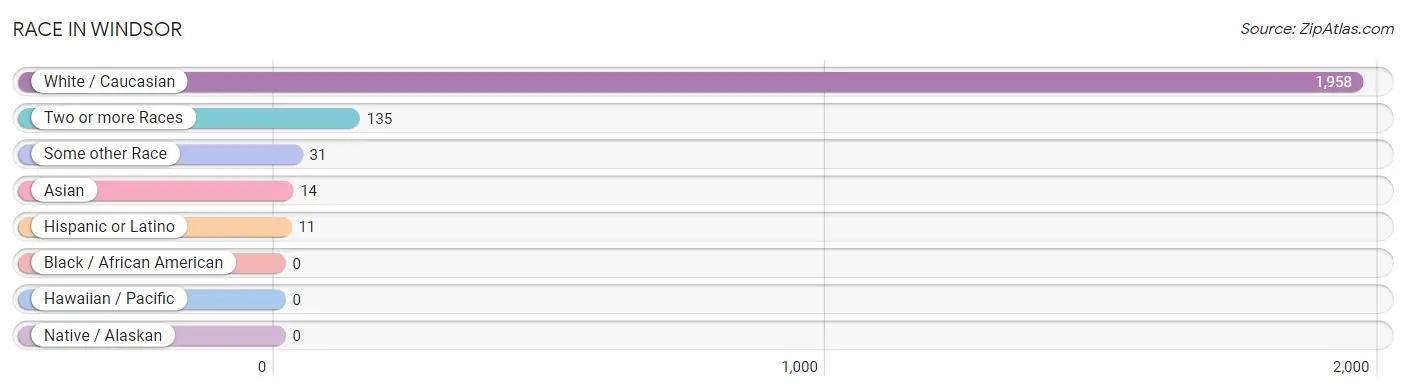
| Race | # Population | % Population |
| Asian | 14 | 0.6% |
| Black / African American | 0 | 0.0% |
| Hawaiian / Pacific | 0 | 0.0% |
| Hispanic or Latino | 11 | 0.5% |
| Native / Alaskan | 0 | 0.0% |
| White / Caucasian | 1,958 | 91.6% |
| Two or more Races | 135 | 6.3% |
| Some other Race | 31 | 1.5% |
| Total | 2,138 | 100.0% |
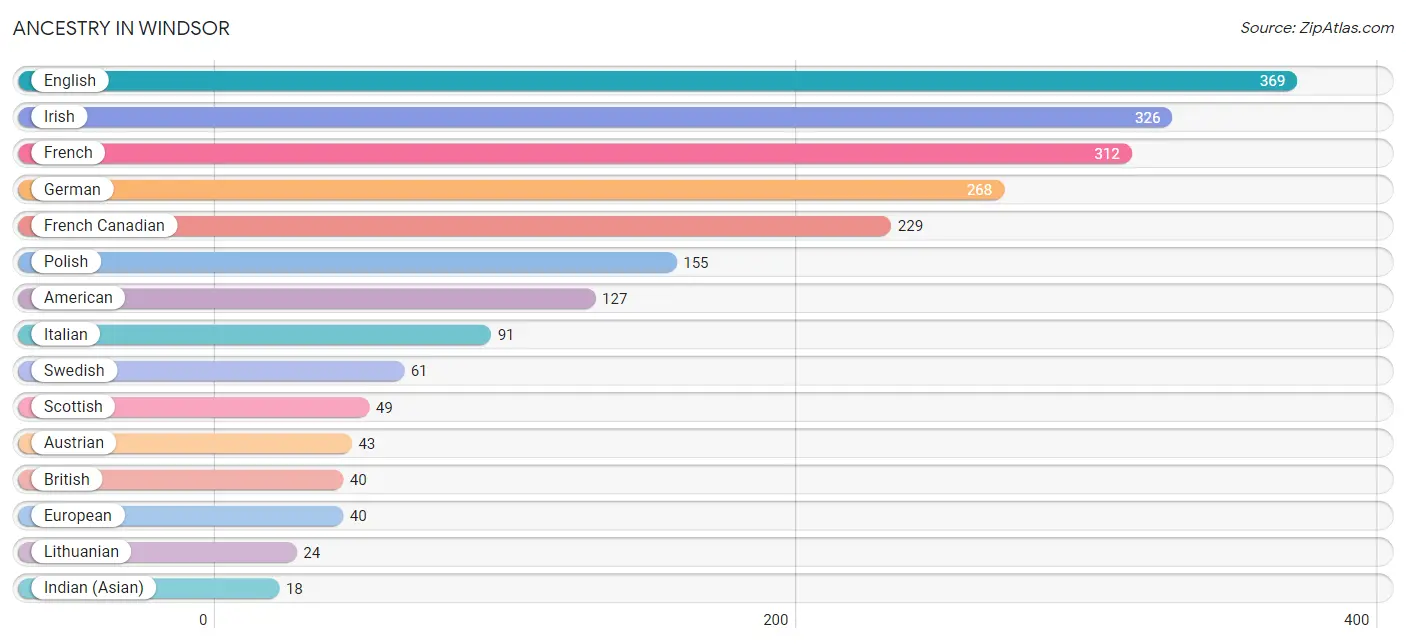
Ancestry in Windsor
The most populous ancestries reported in Windsor are English (369 | 17.3%), Irish (326 | 15.2%), French (312 | 14.6%), German (268 | 12.5%), and French Canadian (229 | 10.7%), together accounting for 70.4% of all Windsor residents.
| Ancestry | # Population | % Population |
| African | 9 | 0.4% |
| American | 127 | 5.9% |
| Austrian | 43 | 2.0% |
| Brazilian | 10 | 0.5% |
| British | 40 | 1.9% |
| Burmese | 8 | 0.4% |
| Canadian | 12 | 0.6% |
| Cherokee | 2 | 0.1% |
| Dutch | 3 | 0.1% |
| English | 369 | 17.3% |
| European | 40 | 1.9% |
| Finnish | 7 | 0.3% |
| French | 312 | 14.6% |
| French Canadian | 229 | 10.7% |
| German | 268 | 12.5% |
| Greek | 16 | 0.7% |
| Indian (Asian) | 18 | 0.8% |
| Irish | 326 | 15.2% |
| Italian | 91 | 4.3% |
| Lithuanian | 24 | 1.1% |
| Northern European | 12 | 0.6% |
| Norwegian | 6 | 0.3% |
| Polish | 155 | 7.2% |
| Puerto Rican | 11 | 0.5% |
| Scotch-Irish | 17 | 0.8% |
| Scottish | 49 | 2.3% |
| Slovene | 10 | 0.5% |
| Subsaharan African | 9 | 0.4% |
| Swedish | 61 | 2.9% |
| Swiss | 4 | 0.2% |
| Ukrainian | 11 | 0.5% | View All 31 Rows |
Immigrants in Windsor
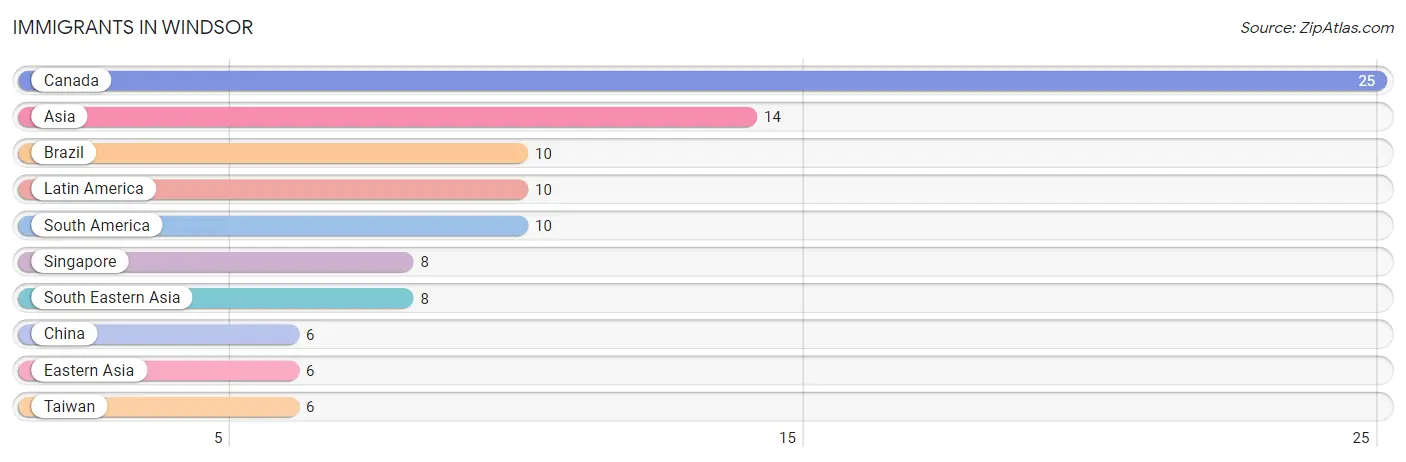
The most numerous immigrant groups reported in Windsor came from Canada (25 | 1.2%), Asia (14 | 0.6%), Brazil (10 | 0.5%), Latin America (10 | 0.5%), and South America (10 | 0.5%), together accounting for 3.2% of all Windsor residents.
| Immigration Origin | # Population | % Population |
| Asia | 14 | 0.6% |
| Brazil | 10 | 0.5% |
| Canada | 25 | 1.2% |
| China | 6 | 0.3% |
| Eastern Asia | 6 | 0.3% |
| Latin America | 10 | 0.5% |
| Singapore | 8 | 0.4% |
| South America | 10 | 0.5% |
| South Eastern Asia | 8 | 0.4% |
| Taiwan | 6 | 0.3% | View All 10 Rows |
Sex and Age in Windsor
Sex and Age in Windsor
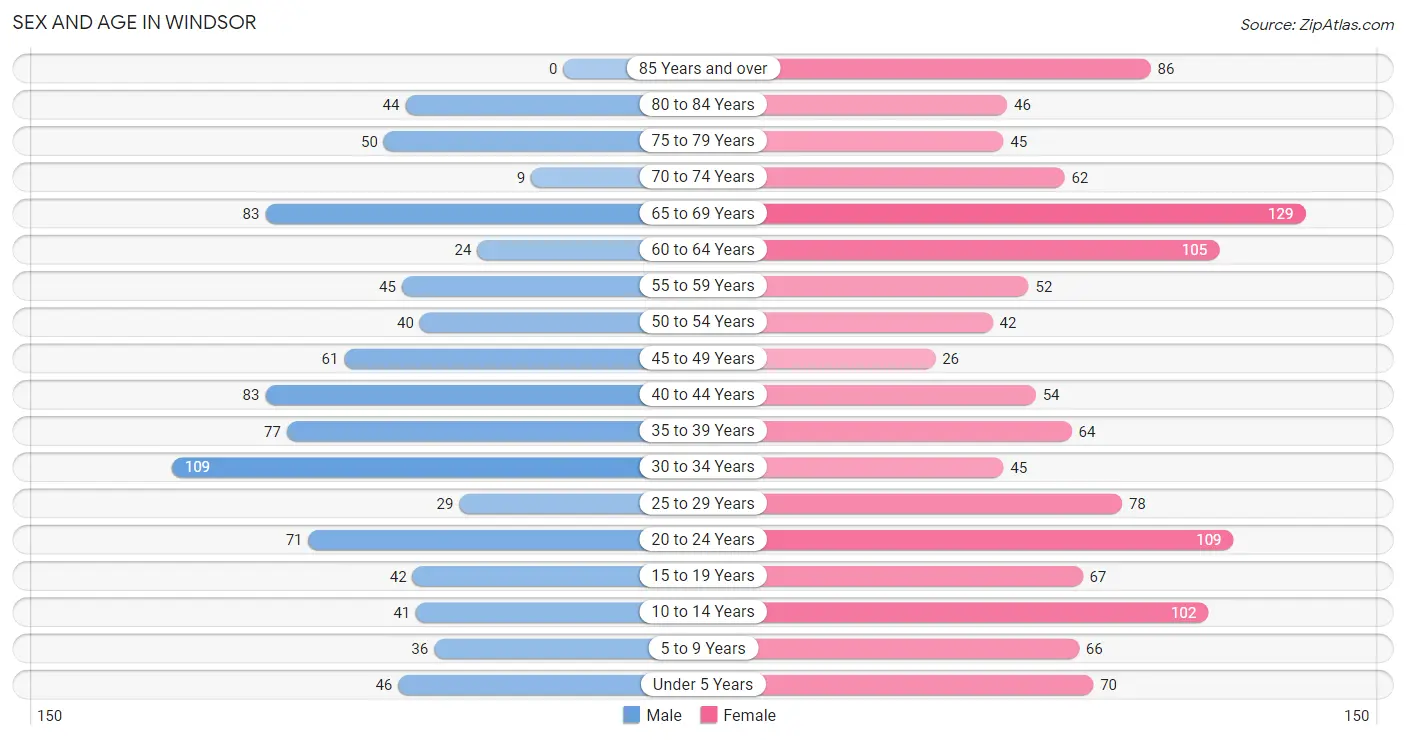
The most populous age groups in Windsor are 30 to 34 Years (109 | 12.2%) for men and 65 to 69 Years (129 | 10.3%) for women.
| Age Bracket | Male | Female |
| Under 5 Years | 46 (5.2%) | 70 (5.6%) |
| 5 to 9 Years | 36 (4.0%) | 66 (5.3%) |
| 10 to 14 Years | 41 (4.6%) | 102 (8.2%) |
| 15 to 19 Years | 42 (4.7%) | 67 (5.4%) |
| 20 to 24 Years | 71 (8.0%) | 109 (8.7%) |
| 25 to 29 Years | 29 (3.3%) | 78 (6.2%) |
| 30 to 34 Years | 109 (12.2%) | 45 (3.6%) |
| 35 to 39 Years | 77 (8.6%) | 64 (5.1%) |
| 40 to 44 Years | 83 (9.3%) | 54 (4.3%) |
| 45 to 49 Years | 61 (6.9%) | 26 (2.1%) |
| 50 to 54 Years | 40 (4.5%) | 42 (3.4%) |
| 55 to 59 Years | 45 (5.1%) | 52 (4.2%) |
| 60 to 64 Years | 24 (2.7%) | 105 (8.4%) |
| 65 to 69 Years | 83 (9.3%) | 129 (10.3%) |
| 70 to 74 Years | 9 (1.0%) | 62 (5.0%) |
| 75 to 79 Years | 50 (5.6%) | 45 (3.6%) |
| 80 to 84 Years | 44 (4.9%) | 46 (3.7%) |
| 85 Years and over | 0 (0.0%) | 86 (6.9%) |
| Total | 890 (100.0%) | 1,248 (100.0%) |
Families and Households in Windsor
Median Family Size in Windsor
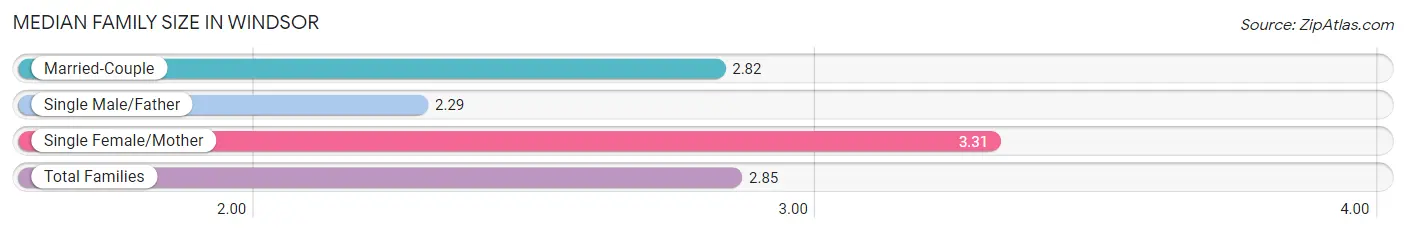
The median family size in Windsor is 2.85 persons per family, with single female/mother families (126 | 27.5%) accounting for the largest median family size of 3.31 persons per family. On the other hand, single male/father families (87 | 19.0%) represent the smallest median family size with 2.29 persons per family.
| Family Type | # Families | Family Size |
| Married-Couple | 246 (53.6%) | 2.82 |
| Single Male/Father | 87 (19.0%) | 2.29 |
| Single Female/Mother | 126 (27.5%) | 3.31 |
| Total Families | 459 (100.0%) | 2.85 |
Median Household Size in Windsor
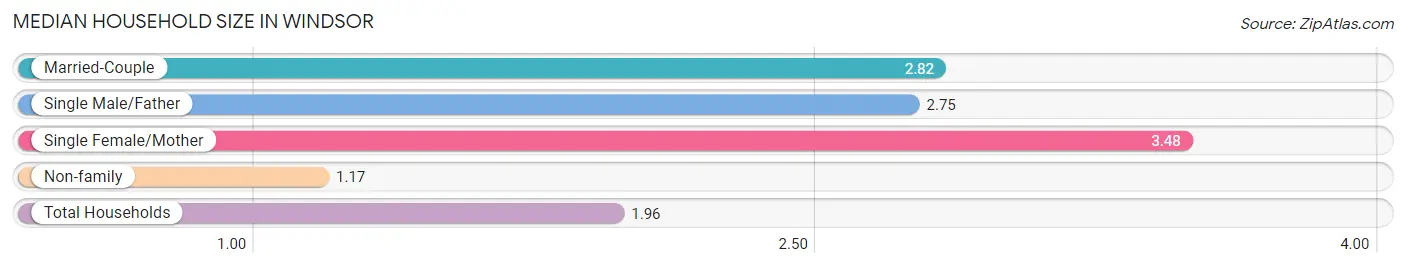
The median household size in Windsor is 1.96 persons per household, with single female/mother households (126 | 12.0%) accounting for the largest median household size of 3.48 persons per household. non-family households (588 | 56.2%) represent the smallest median household size with 1.17 persons per household.
| Household Type | # Households | Household Size |
| Married-Couple | 246 (23.5%) | 2.82 |
| Single Male/Father | 87 (8.3%) | 2.75 |
| Single Female/Mother | 126 (12.0%) | 3.48 |
| Non-family | 588 (56.2%) | 1.17 |
| Total Households | 1,047 (100.0%) | 1.96 |
Household Size by Marriage Status in Windsor
Out of a total of 1,047 households in Windsor, 459 (43.8%) are family households, while 588 (56.2%) are nonfamily households. The most numerous type of family households are 2-person households, comprising 276, and the most common type of nonfamily households are 1-person households, comprising 512.
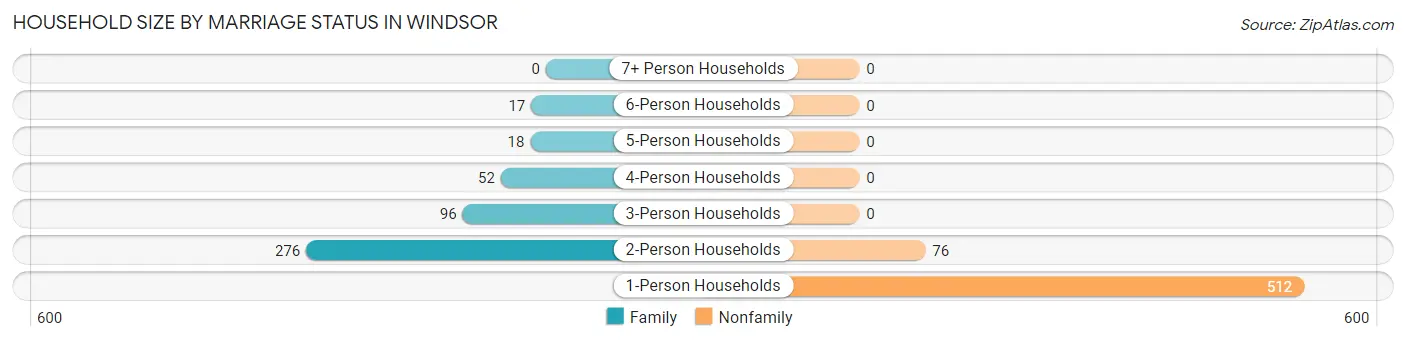
| Household Size | Family Households | Nonfamily Households |
| 1-Person Households | - | 512 (48.9%) |
| 2-Person Households | 276 (26.4%) | 76 (7.3%) |
| 3-Person Households | 96 (9.2%) | 0 (0.0%) |
| 4-Person Households | 52 (5.0%) | 0 (0.0%) |
| 5-Person Households | 18 (1.7%) | 0 (0.0%) |
| 6-Person Households | 17 (1.6%) | 0 (0.0%) |
| 7+ Person Households | 0 (0.0%) | 0 (0.0%) |
| Total | 459 (43.8%) | 588 (56.2%) |
Female Fertility in Windsor
Fertility by Age in Windsor
| Age Bracket | Women with Births | Births / 1,000 Women |
| 15 to 19 years | 0 (0.0%) | 0.0 |
| 20 to 34 years | 0 (0.0%) | 0.0 |
| 35 to 50 years | 0 (0.0%) | 0.0 |
| Total | 0 (0.0%) | 0.0 |
Fertility by Age by Marriage Status in Windsor
| Age Bracket | Married | Unmarried |
| 15 to 19 years | 0 (0.0%) | 0 (0.0%) |
| 20 to 34 years | 0 (0.0%) | 0 (0.0%) |
| 35 to 50 years | 0 (0.0%) | 0 (0.0%) |
| Total | 0 (0.0%) | 0 (0.0%) |
Fertility by Education in Windsor
| Educational Attainment | Women with Births | Births / 1,000 Women |
| Less than High School | 0 (0.0%) | 0.0 |
| High School Diploma | 0 (0.0%) | 0.0 |
| College or Associate's Degree | 0 (0.0%) | 0.0 |
| Bachelor's Degree | 0 (0.0%) | 0.0 |
| Graduate Degree | 0 (0.0%) | 0.0 |
| Total | 0 (0.0%) | 0.0 |
Fertility by Education by Marriage Status in Windsor
| Educational Attainment | Married | Unmarried |
| Less than High School | 0 (0.0%) | 0 (0.0%) |
| High School Diploma | 0 (0.0%) | 0 (0.0%) |
| College or Associate's Degree | 0 (0.0%) | 0 (0.0%) |
| Bachelor's Degree | 0 (0.0%) | 0 (0.0%) |
| Graduate Degree | 0 (0.0%) | 0 (0.0%) |
| Total | 0 (0.0%) | 0 (0.0%) |
Employment Characteristics in Windsor
Employment by Class of Employer in Windsor
Among the 1,050 employed individuals in Windsor, private company employees (678 | 64.6%), not-for-profit organizations (200 | 19.1%), and self-employed (not incorporated) (76 | 7.2%) make up the most common classes of employment.
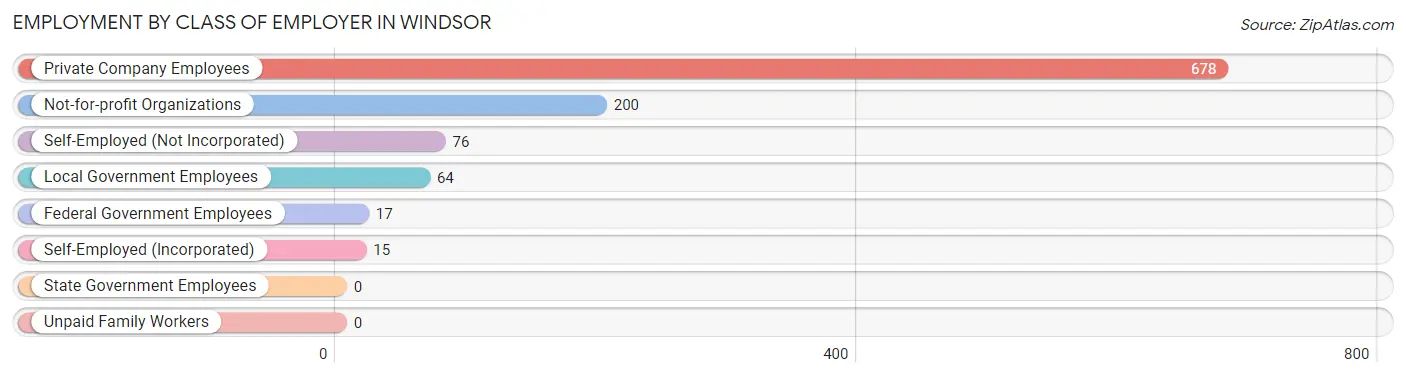
| Employer Class | # Employees | % Employees |
| Private Company Employees | 678 | 64.6% |
| Self-Employed (Incorporated) | 15 | 1.4% |
| Self-Employed (Not Incorporated) | 76 | 7.2% |
| Not-for-profit Organizations | 200 | 19.1% |
| Local Government Employees | 64 | 6.1% |
| State Government Employees | 0 | 0.0% |
| Federal Government Employees | 17 | 1.6% |
| Unpaid Family Workers | 0 | 0.0% |
| Total | 1,050 | 100.0% |
Employment Status by Age in Windsor
According to the labor force statistics for Windsor, out of the total population over 16 years of age (1,772), 63.2% or 1,120 individuals are in the labor force, with 3.8% or 43 of them unemployed. The age group with the highest labor force participation rate is 20 to 24 years, with 100.0% or 180 individuals in the labor force. Within the labor force, the 65 to 74 years age range has the highest percentage of unemployed individuals, with 18.1% or 15 of them being unemployed.
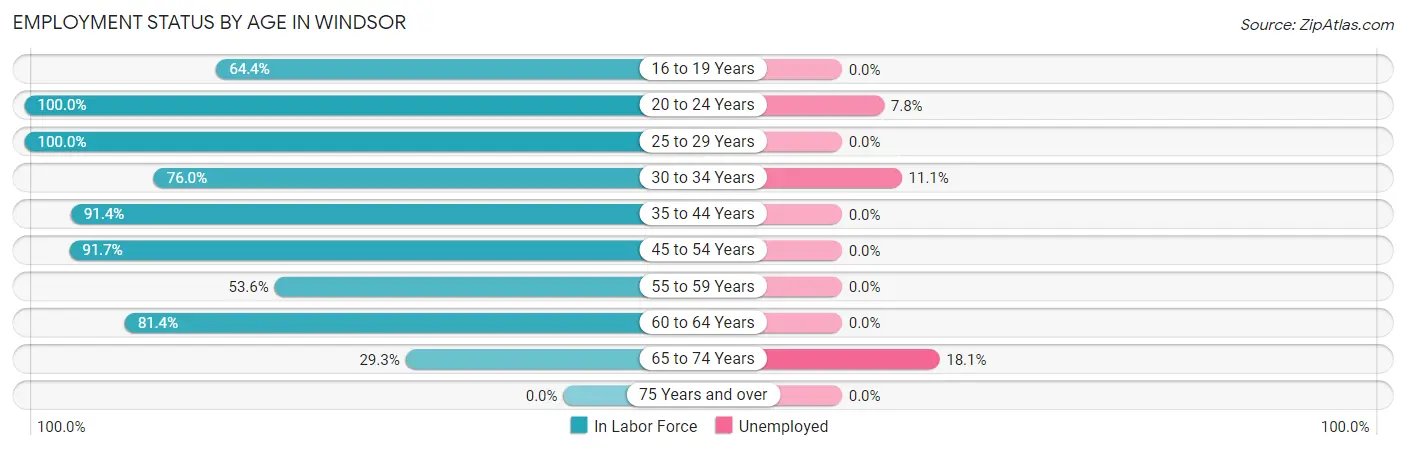
| Age Bracket | In Labor Force | Unemployed |
| 16 to 19 Years | 67 (64.4%) | 0 (0.0%) |
| 20 to 24 Years | 180 (100.0%) | 14 (7.8%) |
| 25 to 29 Years | 107 (100.0%) | 0 (0.0%) |
| 30 to 34 Years | 117 (76.0%) | 13 (11.1%) |
| 35 to 44 Years | 254 (91.4%) | 0 (0.0%) |
| 45 to 54 Years | 155 (91.7%) | 0 (0.0%) |
| 55 to 59 Years | 52 (53.6%) | 0 (0.0%) |
| 60 to 64 Years | 105 (81.4%) | 0 (0.0%) |
| 65 to 74 Years | 83 (29.3%) | 15 (18.1%) |
| 75 Years and over | 0 (0.0%) | 0 (0.0%) |
| Total | 1,120 (63.2%) | 43 (3.8%) |
Employment Status by Educational Attainment in Windsor
According to labor force statistics for Windsor, 84.6% of individuals (790) out of the total population between 25 and 64 years of age (934) are in the labor force, with 1.6% or 13 of them being unemployed. The group with the highest labor force participation rate are those with the educational attainment of bachelor's degree or higher, with 96.7% or 207 individuals in the labor force. Within the labor force, individuals with high school diploma education have the highest percentage of unemployment, with 4.6% or 13 of them being unemployed.
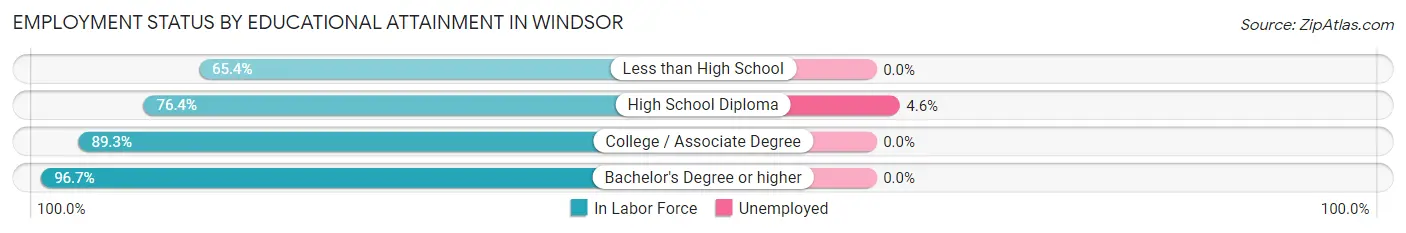
| Educational Attainment | In Labor Force | Unemployed |
| Less than High School | 34 (65.4%) | 0 (0.0%) |
| High School Diploma | 281 (76.4%) | 17 (4.6%) |
| College / Associate Degree | 268 (89.3%) | 0 (0.0%) |
| Bachelor's Degree or higher | 207 (96.7%) | 0 (0.0%) |
| Total | 790 (84.6%) | 15 (1.6%) |
Employment Occupations by Sex in Windsor
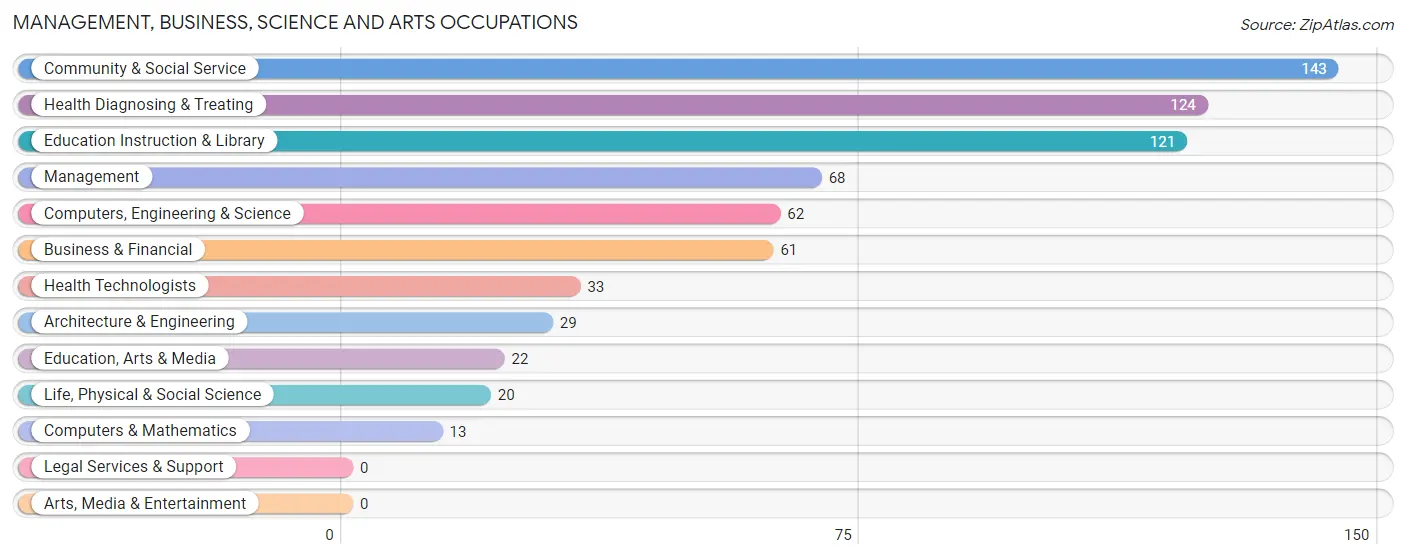
Management, Business, Science and Arts Occupations
The most common Management, Business, Science and Arts occupations in Windsor are Community & Social Service (143 | 13.3%), Health Diagnosing & Treating (124 | 11.5%), Education Instruction & Library (121 | 11.2%), Management (68 | 6.3%), and Computers, Engineering & Science (62 | 5.8%).
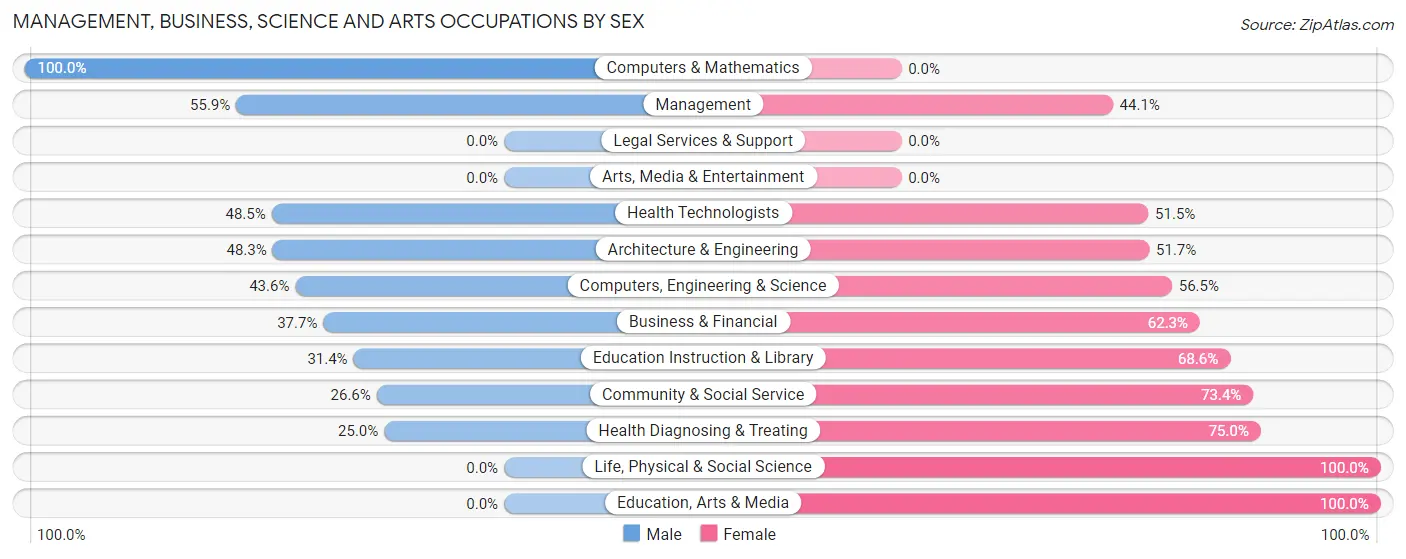
Management, Business, Science and Arts Occupations by Sex
Within the Management, Business, Science and Arts occupations in Windsor, the most male-oriented occupations are Computers & Mathematics (100.0%), Management (55.9%), and Health Technologists (48.5%), while the most female-oriented occupations are Life, Physical & Social Science (100.0%), Education, Arts & Media (100.0%), and Health Diagnosing & Treating (75.0%).
| Occupation | Male | Female |
| Management | 38 (55.9%) | 30 (44.1%) |
| Business & Financial | 23 (37.7%) | 38 (62.3%) |
| Computers, Engineering & Science | 27 (43.5%) | 35 (56.5%) |
| Computers & Mathematics | 13 (100.0%) | 0 (0.0%) |
| Architecture & Engineering | 14 (48.3%) | 15 (51.7%) |
| Life, Physical & Social Science | 0 (0.0%) | 20 (100.0%) |
| Community & Social Service | 38 (26.6%) | 105 (73.4%) |
| Education, Arts & Media | 0 (0.0%) | 22 (100.0%) |
| Legal Services & Support | 0 (0.0%) | 0 (0.0%) |
| Education Instruction & Library | 38 (31.4%) | 83 (68.6%) |
| Arts, Media & Entertainment | 0 (0.0%) | 0 (0.0%) |
| Health Diagnosing & Treating | 31 (25.0%) | 93 (75.0%) |
| Health Technologists | 16 (48.5%) | 17 (51.5%) |
| Total (Category) | 157 (34.3%) | 301 (65.7%) |
| Total (Overall) | 498 (46.2%) | 580 (53.8%) |
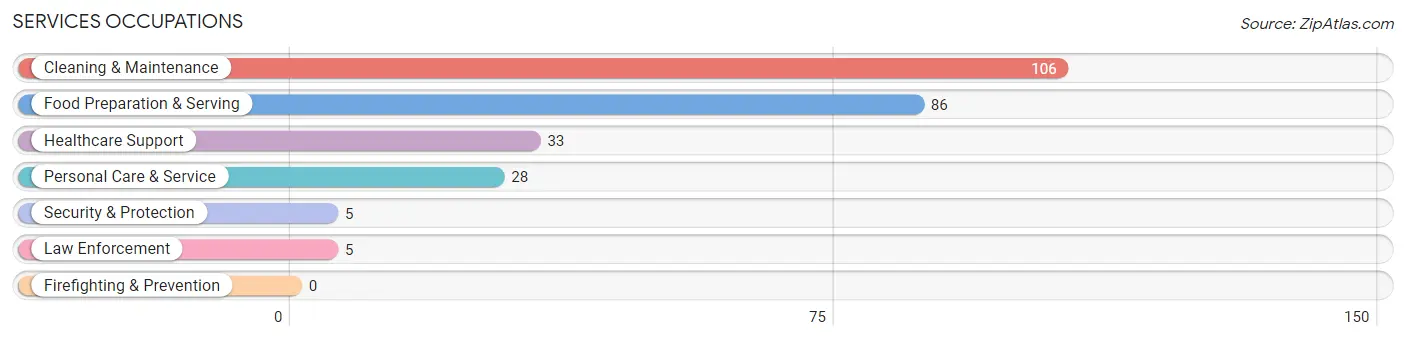
Services Occupations
The most common Services occupations in Windsor are Cleaning & Maintenance (106 | 9.8%), Food Preparation & Serving (86 | 8.0%), Healthcare Support (33 | 3.1%), Personal Care & Service (28 | 2.6%), and Security & Protection (5 | 0.5%).
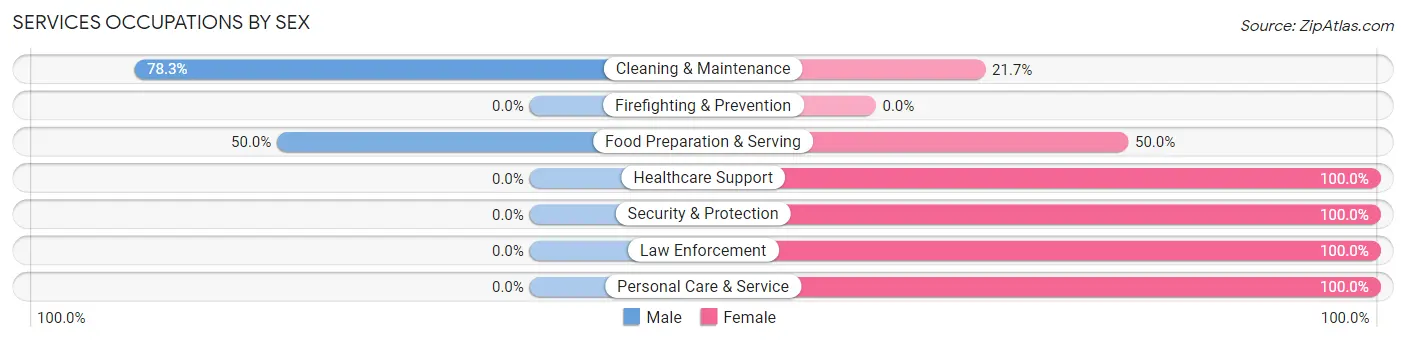
Services Occupations by Sex
Within the Services occupations in Windsor, the most male-oriented occupations are Cleaning & Maintenance (78.3%), and Food Preparation & Serving (50.0%), while the most female-oriented occupations are Healthcare Support (100.0%), Security & Protection (100.0%), and Law Enforcement (100.0%).
| Occupation | Male | Female |
| Healthcare Support | 0 (0.0%) | 33 (100.0%) |
| Security & Protection | 0 (0.0%) | 5 (100.0%) |
| Firefighting & Prevention | 0 (0.0%) | 0 (0.0%) |
| Law Enforcement | 0 (0.0%) | 5 (100.0%) |
| Food Preparation & Serving | 43 (50.0%) | 43 (50.0%) |
| Cleaning & Maintenance | 83 (78.3%) | 23 (21.7%) |
| Personal Care & Service | 0 (0.0%) | 28 (100.0%) |
| Total (Category) | 126 (48.8%) | 132 (51.2%) |
| Total (Overall) | 498 (46.2%) | 580 (53.8%) |
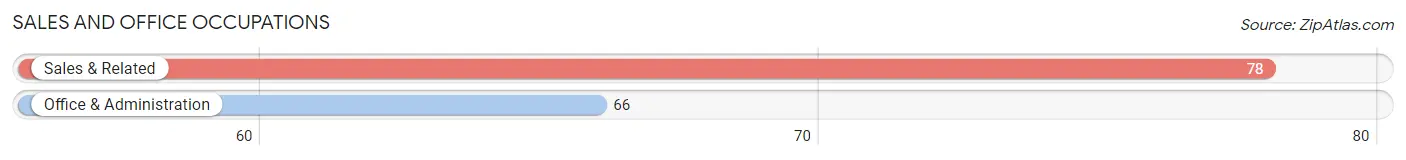
Sales and Office Occupations
The most common Sales and Office occupations in Windsor are Sales & Related (78 | 7.2%), and Office & Administration (66 | 6.1%).
Sales and Office Occupations by Sex
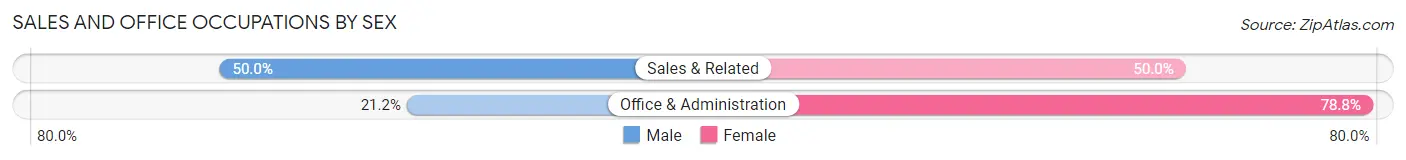
| Occupation | Male | Female |
| Sales & Related | 39 (50.0%) | 39 (50.0%) |
| Office & Administration | 14 (21.2%) | 52 (78.8%) |
| Total (Category) | 53 (36.8%) | 91 (63.2%) |
| Total (Overall) | 498 (46.2%) | 580 (53.8%) |
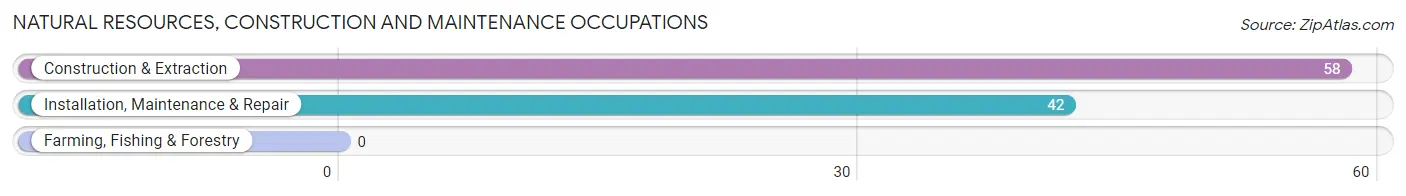
Natural Resources, Construction and Maintenance Occupations
The most common Natural Resources, Construction and Maintenance occupations in Windsor are Construction & Extraction (58 | 5.4%), and Installation, Maintenance & Repair (42 | 3.9%).
Natural Resources, Construction and Maintenance Occupations by Sex
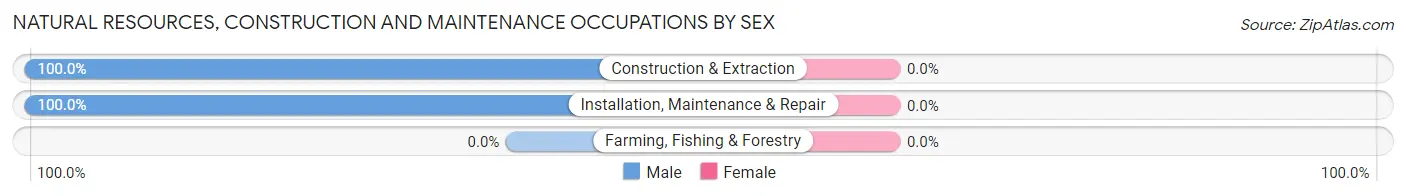
| Occupation | Male | Female |
| Farming, Fishing & Forestry | 0 (0.0%) | 0 (0.0%) |
| Construction & Extraction | 58 (100.0%) | 0 (0.0%) |
| Installation, Maintenance & Repair | 42 (100.0%) | 0 (0.0%) |
| Total (Category) | 100 (100.0%) | 0 (0.0%) |
| Total (Overall) | 498 (46.2%) | 580 (53.8%) |
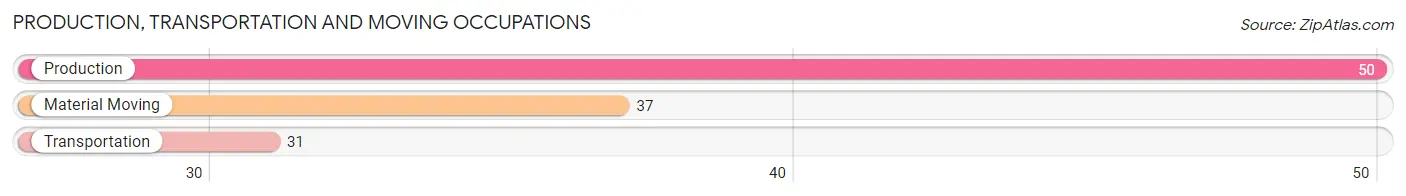
Production, Transportation and Moving Occupations
The most common Production, Transportation and Moving occupations in Windsor are Production (50 | 4.6%), Material Moving (37 | 3.4%), and Transportation (31 | 2.9%).
Production, Transportation and Moving Occupations by Sex
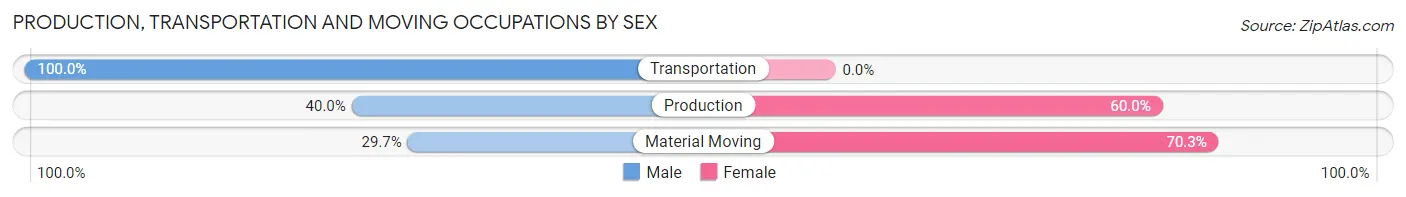
| Occupation | Male | Female |
| Production | 20 (40.0%) | 30 (60.0%) |
| Transportation | 31 (100.0%) | 0 (0.0%) |
| Material Moving | 11 (29.7%) | 26 (70.3%) |
| Total (Category) | 62 (52.5%) | 56 (47.5%) |
| Total (Overall) | 498 (46.2%) | 580 (53.8%) |
Employment Industries by Sex in Windsor
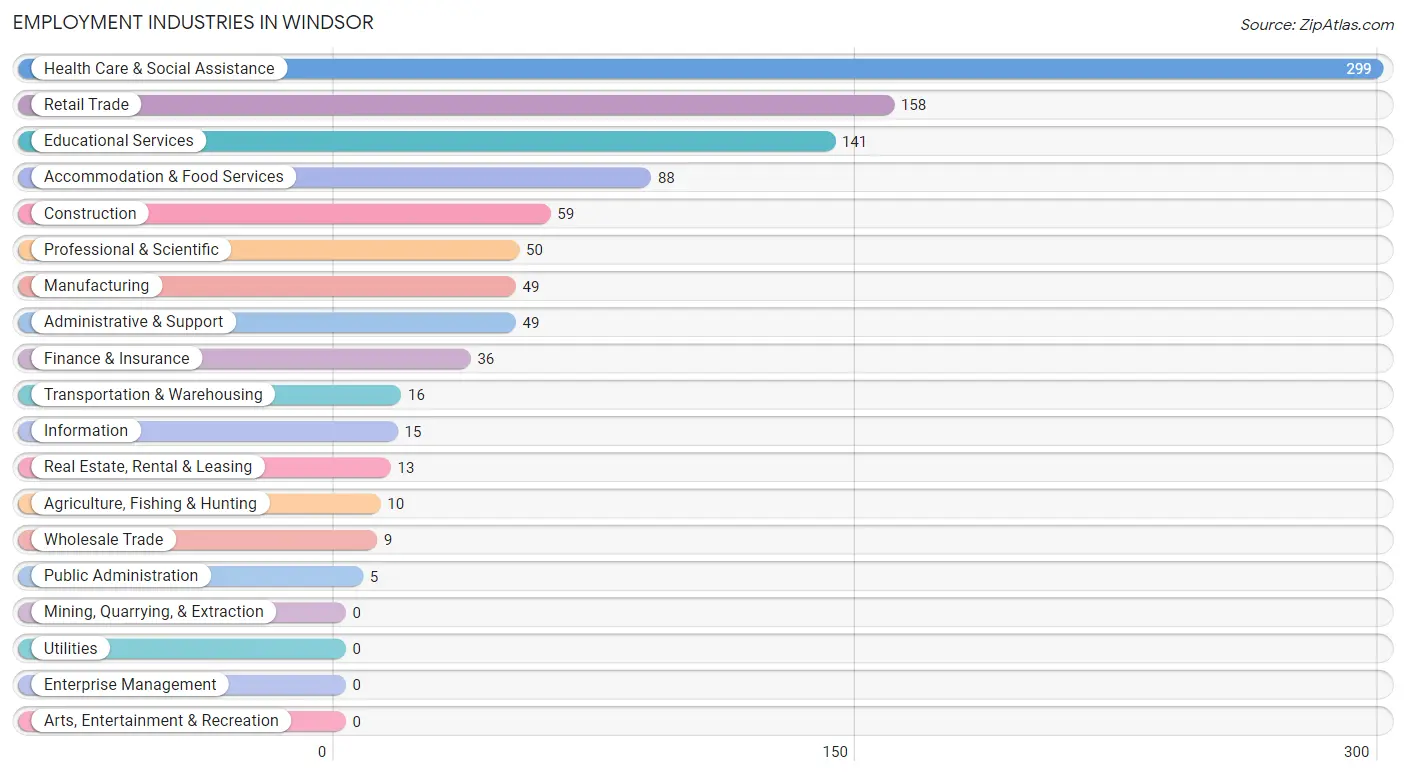
Employment Industries in Windsor
The major employment industries in Windsor include Health Care & Social Assistance (299 | 27.7%), Retail Trade (158 | 14.7%), Educational Services (141 | 13.1%), Accommodation & Food Services (88 | 8.2%), and Construction (59 | 5.5%).
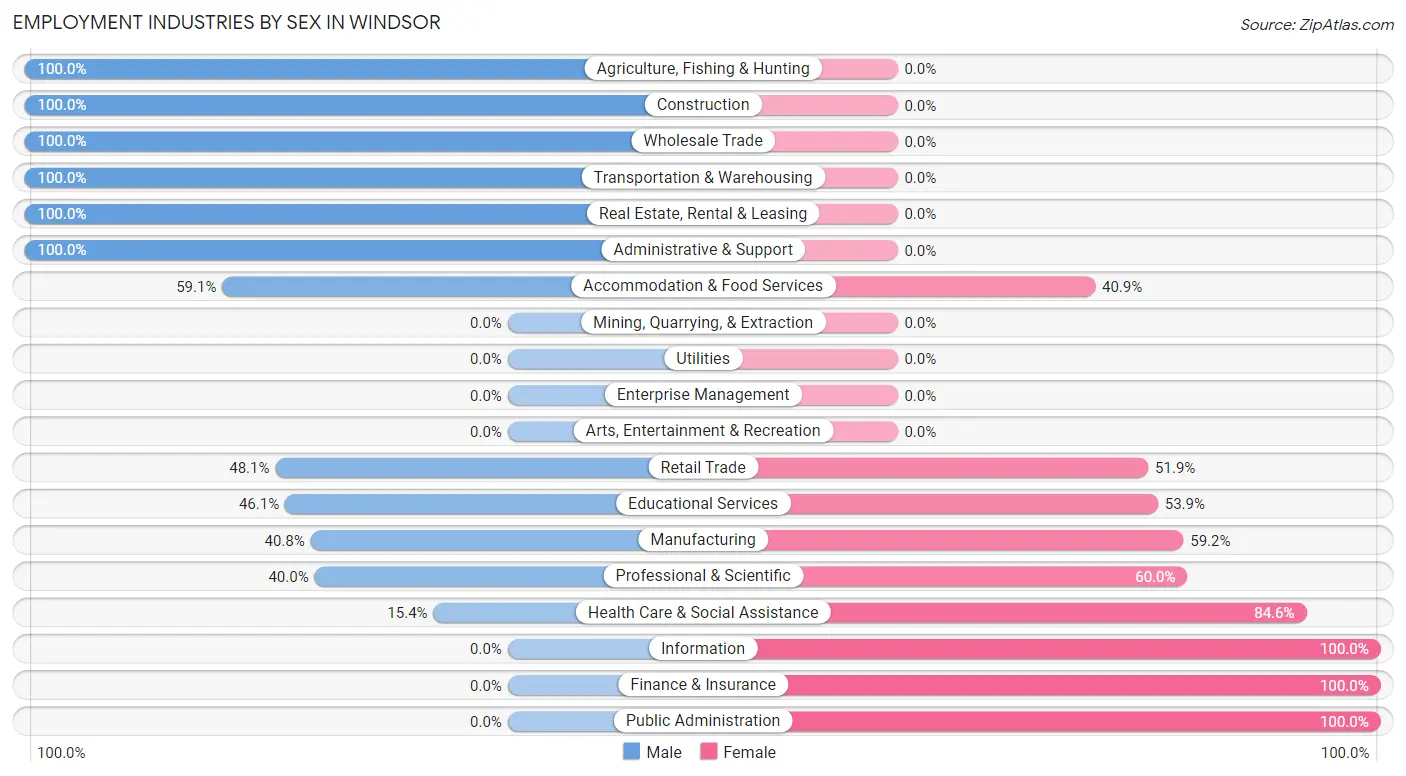
Employment Industries by Sex in Windsor
The Windsor industries that see more men than women are Agriculture, Fishing & Hunting (100.0%), Construction (100.0%), and Wholesale Trade (100.0%), whereas the industries that tend to have a higher number of women are Information (100.0%), Finance & Insurance (100.0%), and Public Administration (100.0%).
| Industry | Male | Female |
| Agriculture, Fishing & Hunting | 10 (100.0%) | 0 (0.0%) |
| Mining, Quarrying, & Extraction | 0 (0.0%) | 0 (0.0%) |
| Construction | 59 (100.0%) | 0 (0.0%) |
| Manufacturing | 20 (40.8%) | 29 (59.2%) |
| Wholesale Trade | 9 (100.0%) | 0 (0.0%) |
| Retail Trade | 76 (48.1%) | 82 (51.9%) |
| Transportation & Warehousing | 16 (100.0%) | 0 (0.0%) |
| Utilities | 0 (0.0%) | 0 (0.0%) |
| Information | 0 (0.0%) | 15 (100.0%) |
| Finance & Insurance | 0 (0.0%) | 36 (100.0%) |
| Real Estate, Rental & Leasing | 13 (100.0%) | 0 (0.0%) |
| Professional & Scientific | 20 (40.0%) | 30 (60.0%) |
| Enterprise Management | 0 (0.0%) | 0 (0.0%) |
| Administrative & Support | 49 (100.0%) | 0 (0.0%) |
| Educational Services | 65 (46.1%) | 76 (53.9%) |
| Health Care & Social Assistance | 46 (15.4%) | 253 (84.6%) |
| Arts, Entertainment & Recreation | 0 (0.0%) | 0 (0.0%) |
| Accommodation & Food Services | 52 (59.1%) | 36 (40.9%) |
| Public Administration | 0 (0.0%) | 5 (100.0%) |
| Total | 498 (46.2%) | 580 (53.8%) |
Education in Windsor
School Enrollment in Windsor
The most common levels of schooling among the 446 students in Windsor are middle school (121 | 27.1%), nursery / preschool (98 | 22.0%), and high school (95 | 21.3%).
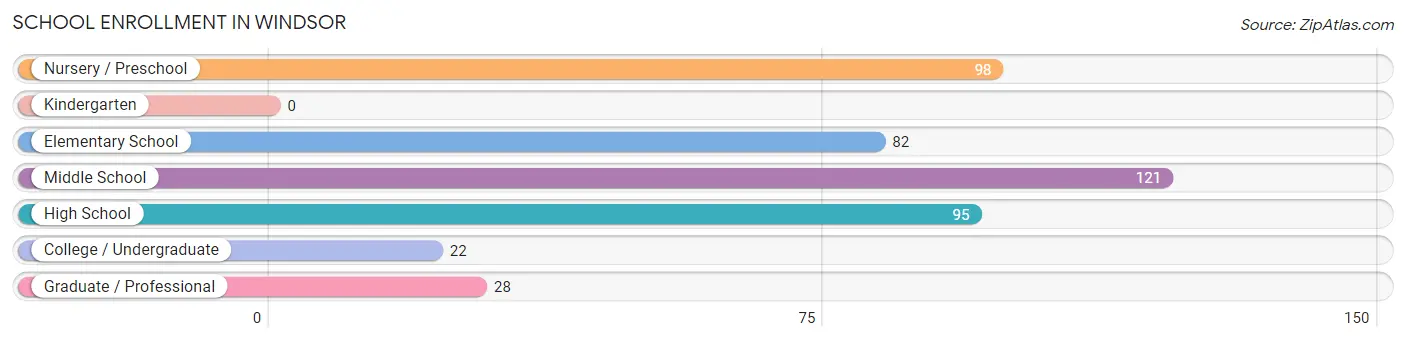
| School Level | # Students | % Students |
| Nursery / Preschool | 98 | 22.0% |
| Kindergarten | 0 | 0.0% |
| Elementary School | 82 | 18.4% |
| Middle School | 121 | 27.1% |
| High School | 95 | 21.3% |
| College / Undergraduate | 22 | 4.9% |
| Graduate / Professional | 28 | 6.3% |
| Total | 446 | 100.0% |
School Enrollment by Age by Funding Source in Windsor
Out of a total of 446 students who are enrolled in schools in Windsor, 19 (4.3%) attend a private institution, while the remaining 427 (95.7%) are enrolled in public schools. The age group of 25 to 34 year olds has the highest likelihood of being enrolled in private schools, with 7 (100.0% in the age bracket) enrolled. Conversely, the age group of 3 to 4 year olds has the lowest likelihood of being enrolled in a private school, with 85 (100.0% in the age bracket) attending a public institution.
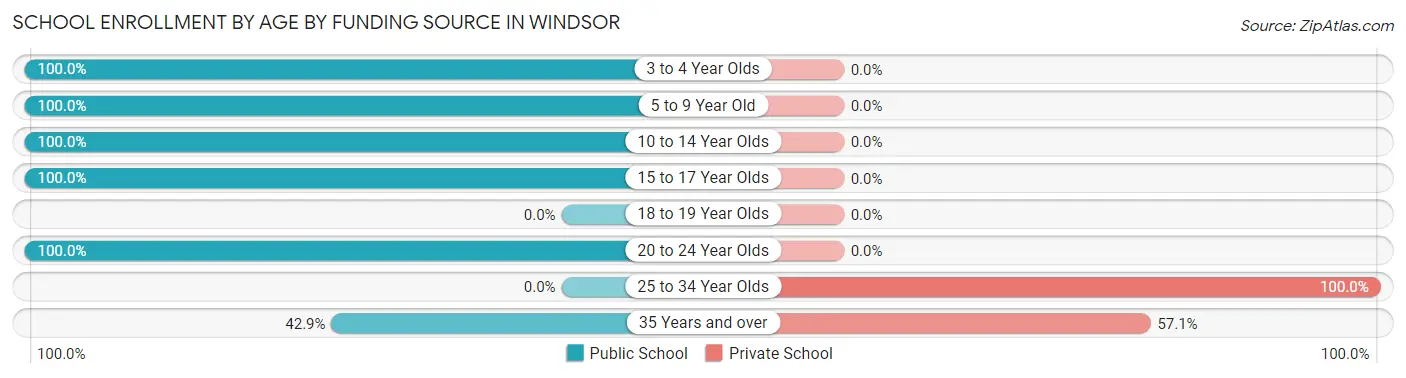
| Age Bracket | Public School | Private School |
| 3 to 4 Year Olds | 85 (100.0%) | 0 (0.0%) |
| 5 to 9 Year Old | 86 (100.0%) | 0 (0.0%) |
| 10 to 14 Year Olds | 143 (100.0%) | 0 (0.0%) |
| 15 to 17 Year Olds | 82 (100.0%) | 0 (0.0%) |
| 18 to 19 Year Olds | 0 (0.0%) | 0 (0.0%) |
| 20 to 24 Year Olds | 22 (100.0%) | 0 (0.0%) |
| 25 to 34 Year Olds | 0 (0.0%) | 7 (100.0%) |
| 35 Years and over | 9 (42.9%) | 12 (57.1%) |
| Total | 427 (95.7%) | 19 (4.3%) |
Educational Attainment by Field of Study in Windsor
Education (122 | 27.4%), business (63 | 14.1%), literature & languages (45 | 10.1%), liberal arts & history (41 | 9.2%), and bio, nature & agricultural (37 | 8.3%) are the most common fields of study among 446 individuals in Windsor who have obtained a bachelor's degree or higher.
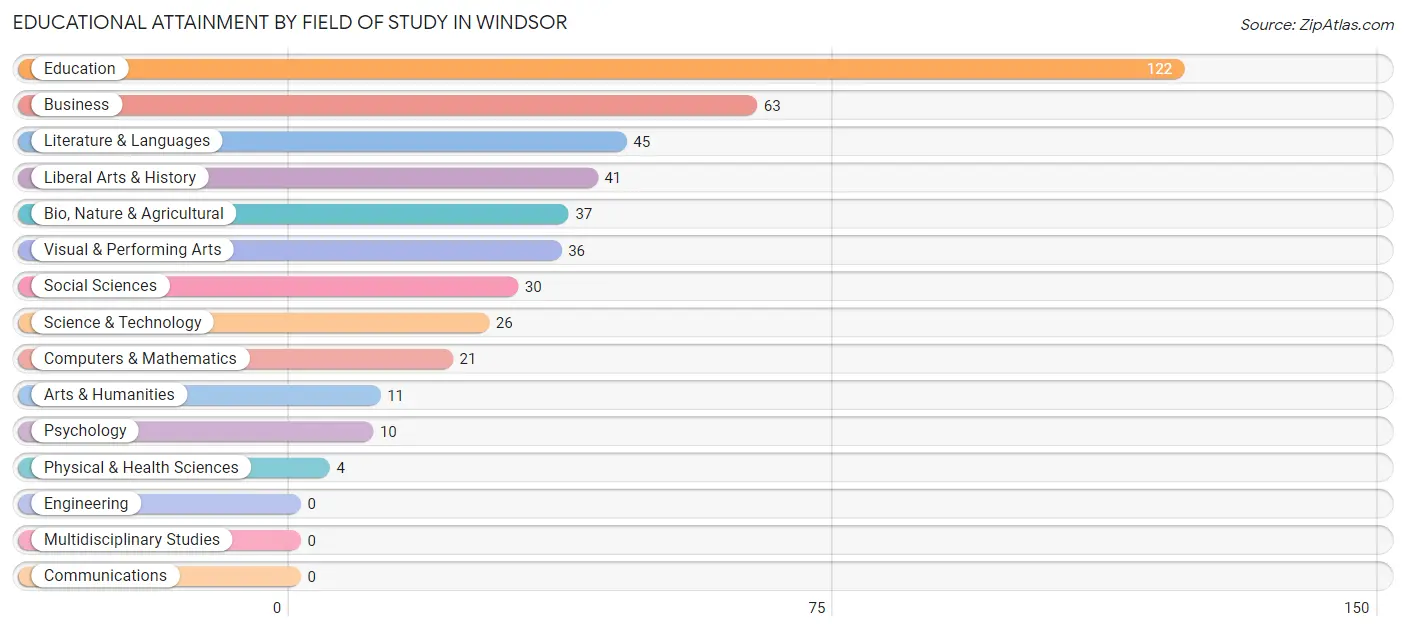
| Field of Study | # Graduates | % Graduates |
| Computers & Mathematics | 21 | 4.7% |
| Bio, Nature & Agricultural | 37 | 8.3% |
| Physical & Health Sciences | 4 | 0.9% |
| Psychology | 10 | 2.2% |
| Social Sciences | 30 | 6.7% |
| Engineering | 0 | 0.0% |
| Multidisciplinary Studies | 0 | 0.0% |
| Science & Technology | 26 | 5.8% |
| Business | 63 | 14.1% |
| Education | 122 | 27.4% |
| Literature & Languages | 45 | 10.1% |
| Liberal Arts & History | 41 | 9.2% |
| Visual & Performing Arts | 36 | 8.1% |
| Communications | 0 | 0.0% |
| Arts & Humanities | 11 | 2.5% |
| Total | 446 | 100.0% |
Transportation & Commute in Windsor
Vehicle Availability by Sex in Windsor
The most prevalent vehicle ownership categories in Windsor are males with 2 vehicles (201, accounting for 41.8%) and females with 2 vehicles (192, making up 35.3%).
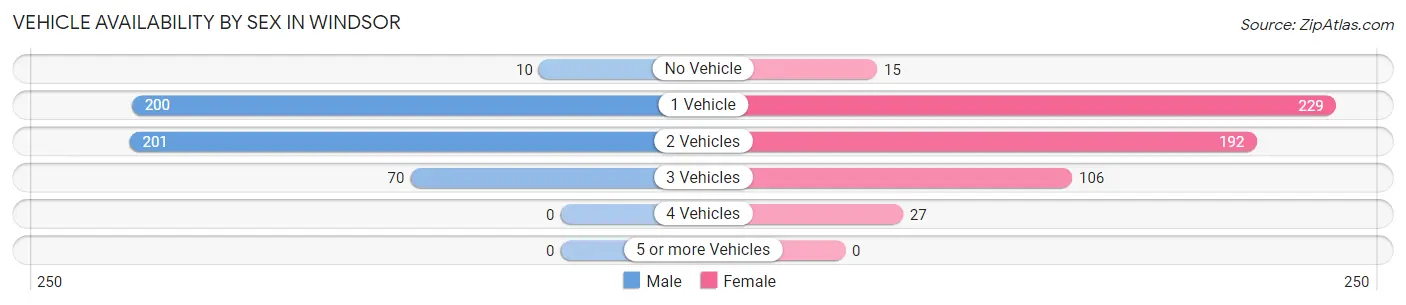
| Vehicles Available | Male | Female |
| No Vehicle | 10 (2.1%) | 15 (2.6%) |
| 1 Vehicle | 200 (41.6%) | 229 (40.3%) |
| 2 Vehicles | 201 (41.8%) | 192 (33.7%) |
| 3 Vehicles | 70 (14.5%) | 106 (18.6%) |
| 4 Vehicles | 0 (0.0%) | 27 (4.8%) |
| 5 or more Vehicles | 0 (0.0%) | 0 (0.0%) |
| Total | 481 (100.0%) | 569 (100.0%) |
Commute Time in Windsor
The most frequently occuring commute durations in Windsor are 25 to 29 minutes (286 commuters, 29.1%), less than 5 minutes (172 commuters, 17.5%), and 30 to 34 minutes (134 commuters, 13.6%).
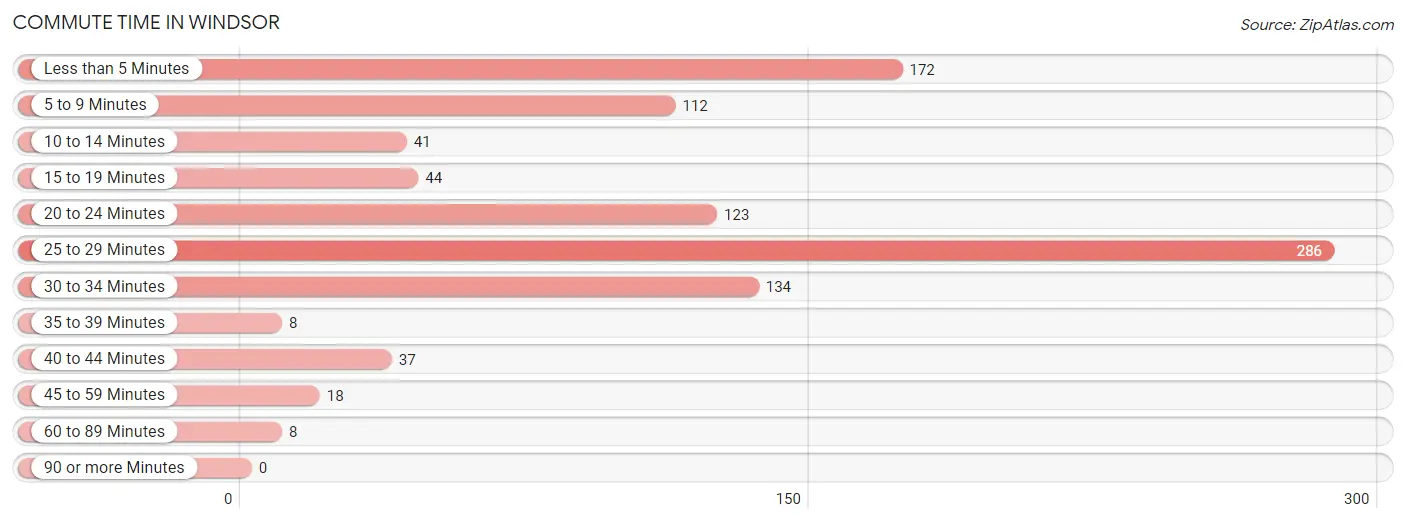
| Commute Time | # Commuters | % Commuters |
| Less than 5 Minutes | 172 | 17.5% |
| 5 to 9 Minutes | 112 | 11.4% |
| 10 to 14 Minutes | 41 | 4.2% |
| 15 to 19 Minutes | 44 | 4.5% |
| 20 to 24 Minutes | 123 | 12.5% |
| 25 to 29 Minutes | 286 | 29.1% |
| 30 to 34 Minutes | 134 | 13.6% |
| 35 to 39 Minutes | 8 | 0.8% |
| 40 to 44 Minutes | 37 | 3.8% |
| 45 to 59 Minutes | 18 | 1.8% |
| 60 to 89 Minutes | 8 | 0.8% |
| 90 or more Minutes | 0 | 0.0% |
Commute Time by Sex in Windsor
The most common commute times in Windsor are 25 to 29 minutes (107 commuters, 25.4%) for males and 25 to 29 minutes (179 commuters, 31.9%) for females.
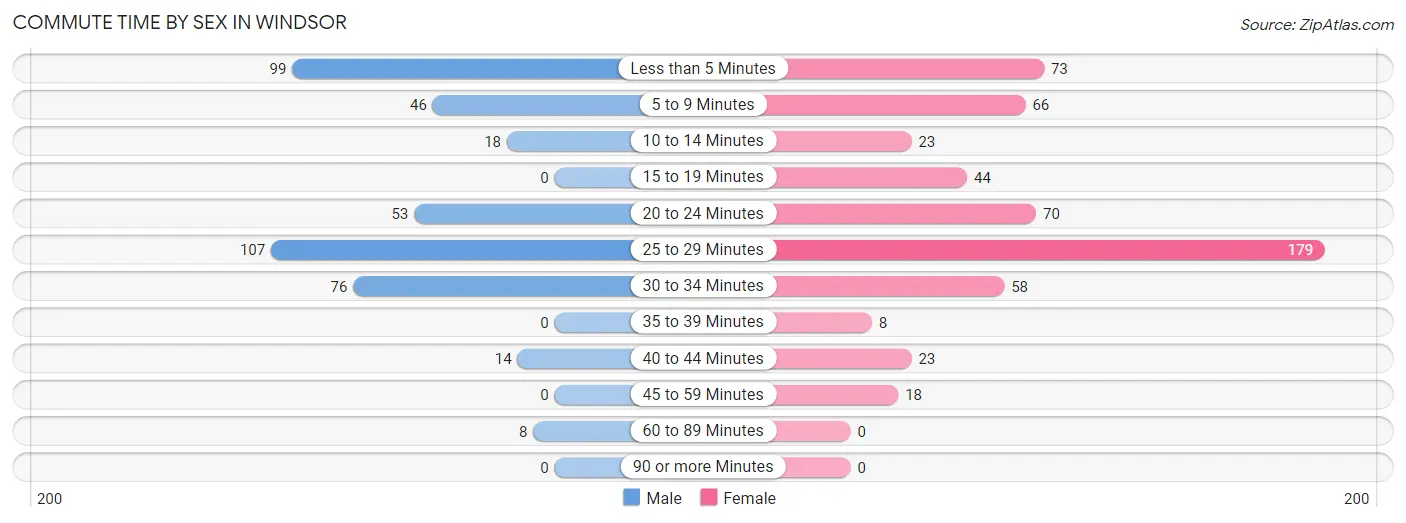
| Commute Time | Male | Female |
| Less than 5 Minutes | 99 (23.5%) | 73 (13.0%) |
| 5 to 9 Minutes | 46 (10.9%) | 66 (11.7%) |
| 10 to 14 Minutes | 18 (4.3%) | 23 (4.1%) |
| 15 to 19 Minutes | 0 (0.0%) | 44 (7.8%) |
| 20 to 24 Minutes | 53 (12.6%) | 70 (12.5%) |
| 25 to 29 Minutes | 107 (25.4%) | 179 (31.9%) |
| 30 to 34 Minutes | 76 (18.0%) | 58 (10.3%) |
| 35 to 39 Minutes | 0 (0.0%) | 8 (1.4%) |
| 40 to 44 Minutes | 14 (3.3%) | 23 (4.1%) |
| 45 to 59 Minutes | 0 (0.0%) | 18 (3.2%) |
| 60 to 89 Minutes | 8 (1.9%) | 0 (0.0%) |
| 90 or more Minutes | 0 (0.0%) | 0 (0.0%) |
Time of Departure to Work by Sex in Windsor
The most frequent times of departure to work in Windsor are 7:00 AM to 7:29 AM (87, 20.7%) for males and 7:00 AM to 7:29 AM (103, 18.3%) for females.
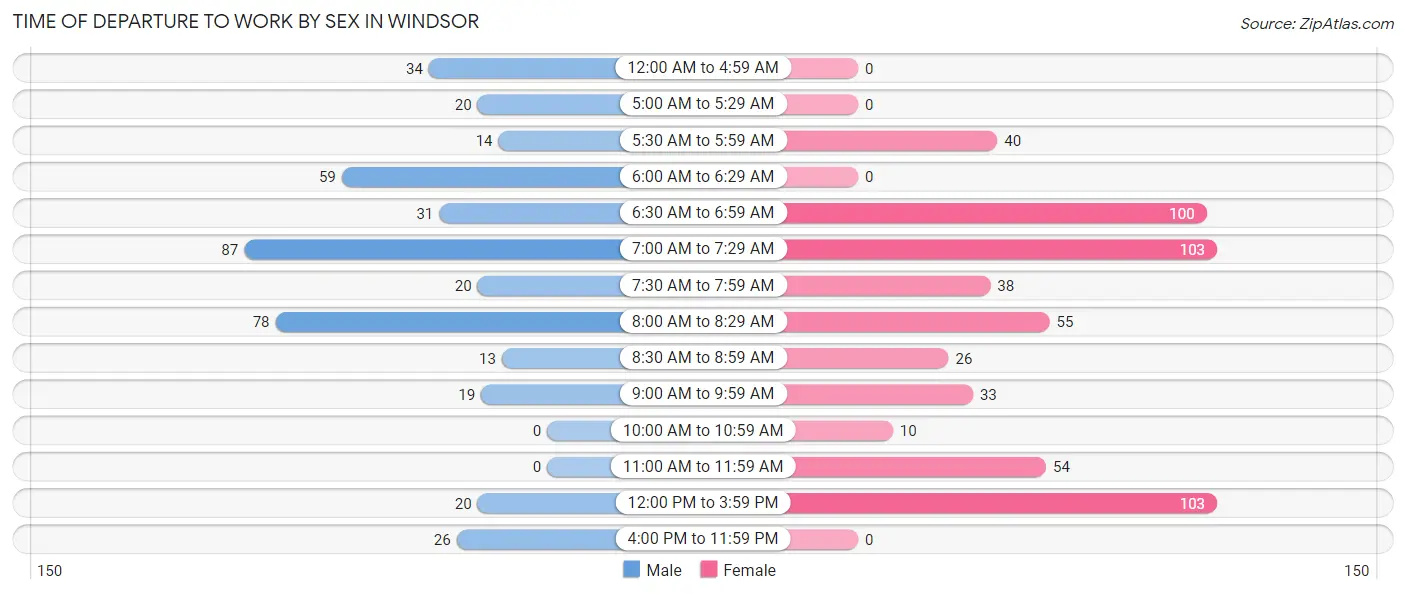
| Time of Departure | Male | Female |
| 12:00 AM to 4:59 AM | 34 (8.1%) | 0 (0.0%) |
| 5:00 AM to 5:29 AM | 20 (4.8%) | 0 (0.0%) |
| 5:30 AM to 5:59 AM | 14 (3.3%) | 40 (7.1%) |
| 6:00 AM to 6:29 AM | 59 (14.0%) | 0 (0.0%) |
| 6:30 AM to 6:59 AM | 31 (7.4%) | 100 (17.8%) |
| 7:00 AM to 7:29 AM | 87 (20.7%) | 103 (18.3%) |
| 7:30 AM to 7:59 AM | 20 (4.8%) | 38 (6.8%) |
| 8:00 AM to 8:29 AM | 78 (18.5%) | 55 (9.8%) |
| 8:30 AM to 8:59 AM | 13 (3.1%) | 26 (4.6%) |
| 9:00 AM to 9:59 AM | 19 (4.5%) | 33 (5.9%) |
| 10:00 AM to 10:59 AM | 0 (0.0%) | 10 (1.8%) |
| 11:00 AM to 11:59 AM | 0 (0.0%) | 54 (9.6%) |
| 12:00 PM to 3:59 PM | 20 (4.8%) | 103 (18.3%) |
| 4:00 PM to 11:59 PM | 26 (6.2%) | 0 (0.0%) |
| Total | 421 (100.0%) | 562 (100.0%) |
Housing Occupancy in Windsor
Occupancy by Ownership in Windsor
Of the total 1,047 dwellings in Windsor, owner-occupied units account for 498 (47.6%), while renter-occupied units make up 549 (52.4%).
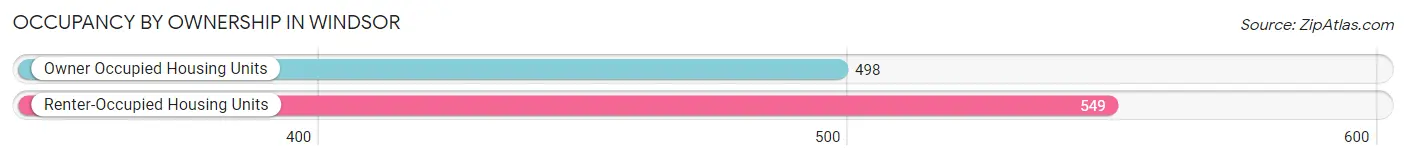
| Occupancy | # Housing Units | % Housing Units |
| Owner Occupied Housing Units | 498 | 47.6% |
| Renter-Occupied Housing Units | 549 | 52.4% |
| Total Occupied Housing Units | 1,047 | 100.0% |
Occupancy by Household Size in Windsor
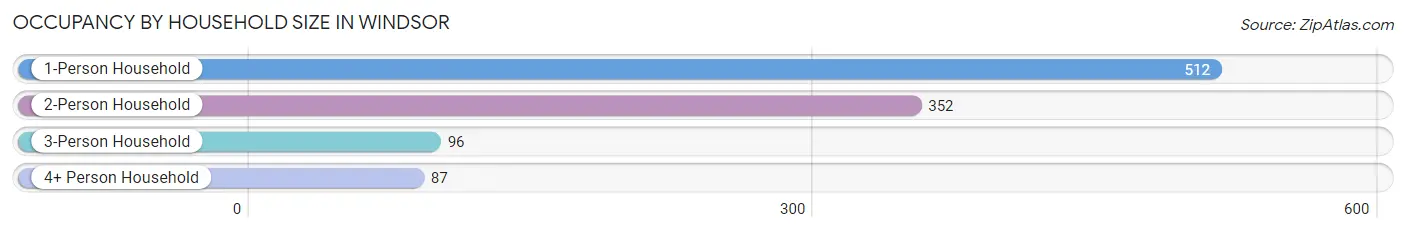
| Household Size | # Housing Units | % Housing Units |
| 1-Person Household | 512 | 48.9% |
| 2-Person Household | 352 | 33.6% |
| 3-Person Household | 96 | 9.2% |
| 4+ Person Household | 87 | 8.3% |
| Total Housing Units | 1,047 | 100.0% |
Occupancy by Ownership by Household Size in Windsor
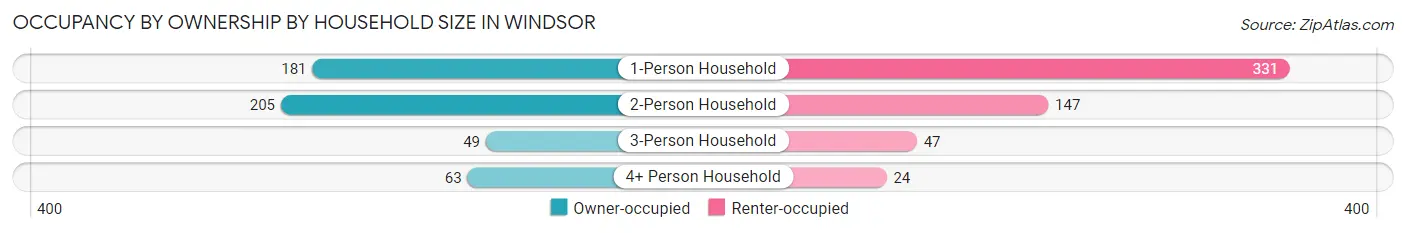
| Household Size | Owner-occupied | Renter-occupied |
| 1-Person Household | 181 (35.3%) | 331 (64.6%) |
| 2-Person Household | 205 (58.2%) | 147 (41.8%) |
| 3-Person Household | 49 (51.0%) | 47 (49.0%) |
| 4+ Person Household | 63 (72.4%) | 24 (27.6%) |
| Total Housing Units | 498 (47.6%) | 549 (52.4%) |
Occupancy by Educational Attainment in Windsor
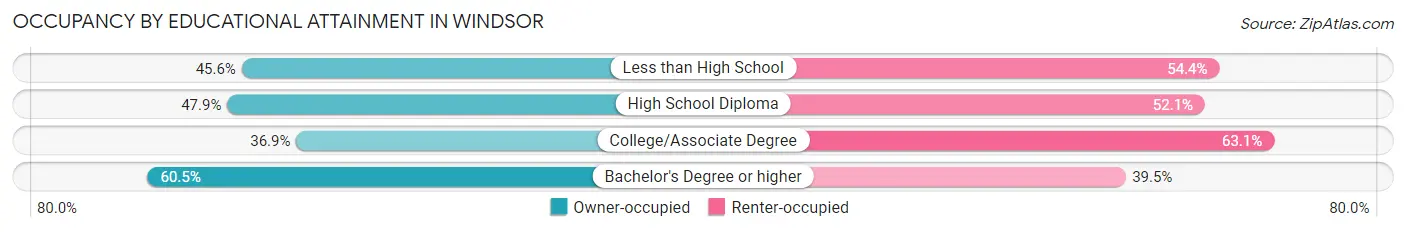
| Household Size | Owner-occupied | Renter-occupied |
| Less than High School | 36 (45.6%) | 43 (54.4%) |
| High School Diploma | 168 (47.9%) | 183 (52.1%) |
| College/Associate Degree | 124 (36.9%) | 212 (63.1%) |
| Bachelor's Degree or higher | 170 (60.5%) | 111 (39.5%) |
Occupancy by Age of Householder in Windsor
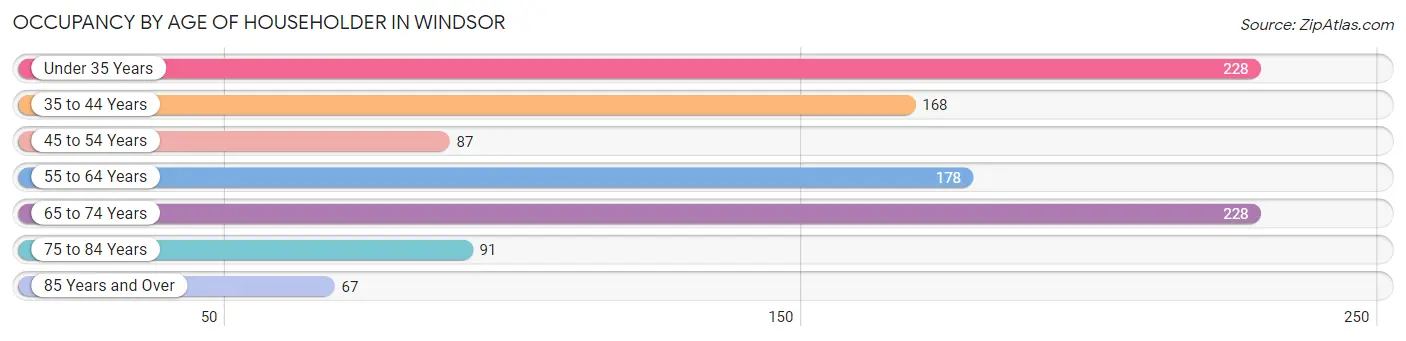
| Age Bracket | # Households | % Households |
| Under 35 Years | 228 | 21.8% |
| 35 to 44 Years | 168 | 16.1% |
| 45 to 54 Years | 87 | 8.3% |
| 55 to 64 Years | 178 | 17.0% |
| 65 to 74 Years | 228 | 21.8% |
| 75 to 84 Years | 91 | 8.7% |
| 85 Years and Over | 67 | 6.4% |
| Total | 1,047 | 100.0% |
Housing Finances in Windsor
Median Income by Occupancy in Windsor
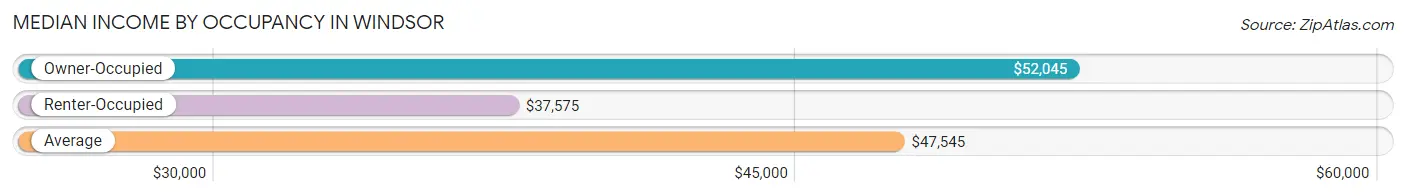
| Occupancy Type | # Households | Median Income |
| Owner-Occupied | 498 (47.6%) | $52,045 |
| Renter-Occupied | 549 (52.4%) | $37,575 |
| Average | 1,047 (100.0%) | $47,545 |
Occupancy by Householder Income Bracket in Windsor
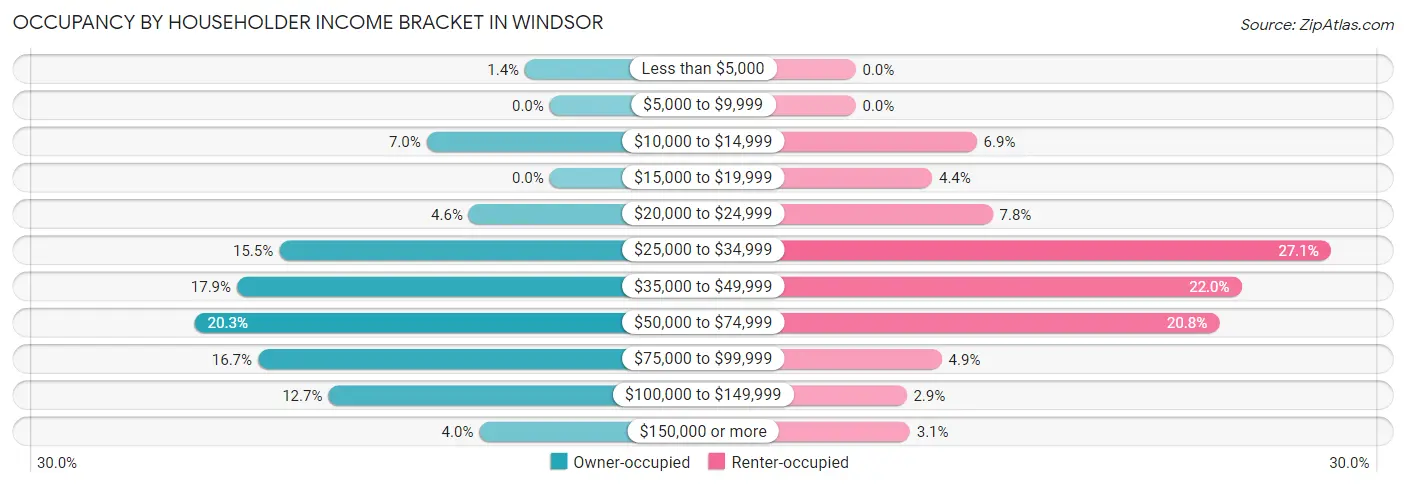
| Income Bracket | Owner-occupied | Renter-occupied |
| Less than $5,000 | 7 (1.4%) | 0 (0.0%) |
| $5,000 to $9,999 | 0 (0.0%) | 0 (0.0%) |
| $10,000 to $14,999 | 35 (7.0%) | 38 (6.9%) |
| $15,000 to $19,999 | 0 (0.0%) | 24 (4.4%) |
| $20,000 to $24,999 | 23 (4.6%) | 43 (7.8%) |
| $25,000 to $34,999 | 77 (15.5%) | 149 (27.1%) |
| $35,000 to $49,999 | 89 (17.9%) | 121 (22.0%) |
| $50,000 to $74,999 | 101 (20.3%) | 114 (20.8%) |
| $75,000 to $99,999 | 83 (16.7%) | 27 (4.9%) |
| $100,000 to $149,999 | 63 (12.7%) | 16 (2.9%) |
| $150,000 or more | 20 (4.0%) | 17 (3.1%) |
| Total | 498 (100.0%) | 549 (100.0%) |
Monthly Housing Cost Tiers in Windsor
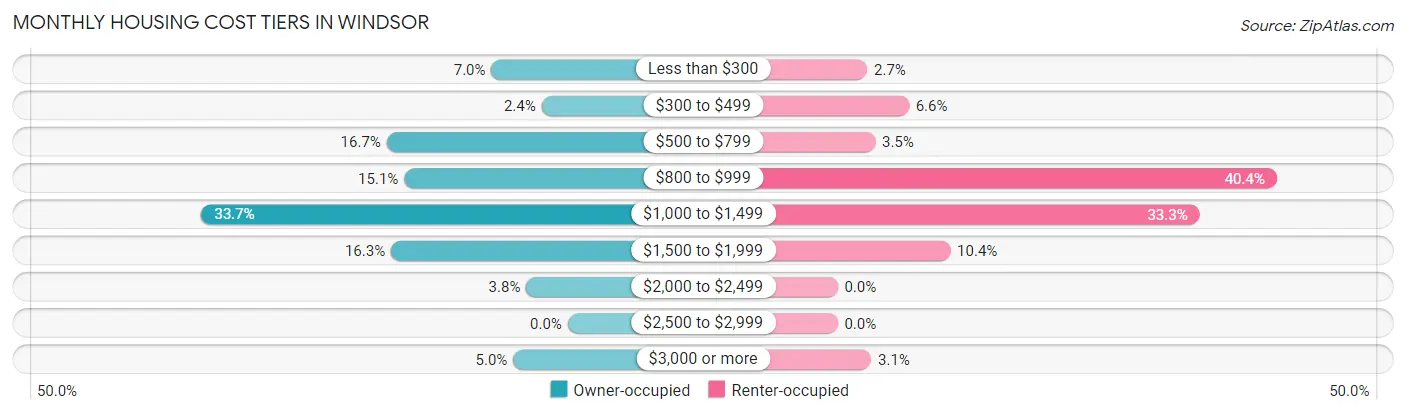
| Monthly Cost | Owner-occupied | Renter-occupied |
| Less than $300 | 35 (7.0%) | 15 (2.7%) |
| $300 to $499 | 12 (2.4%) | 36 (6.6%) |
| $500 to $799 | 83 (16.7%) | 19 (3.5%) |
| $800 to $999 | 75 (15.1%) | 222 (40.4%) |
| $1,000 to $1,499 | 168 (33.7%) | 183 (33.3%) |
| $1,500 to $1,999 | 81 (16.3%) | 57 (10.4%) |
| $2,000 to $2,499 | 19 (3.8%) | 0 (0.0%) |
| $2,500 to $2,999 | 0 (0.0%) | 0 (0.0%) |
| $3,000 or more | 25 (5.0%) | 17 (3.1%) |
| Total | 498 (100.0%) | 549 (100.0%) |
Physical Housing Characteristics in Windsor
Housing Structures in Windsor
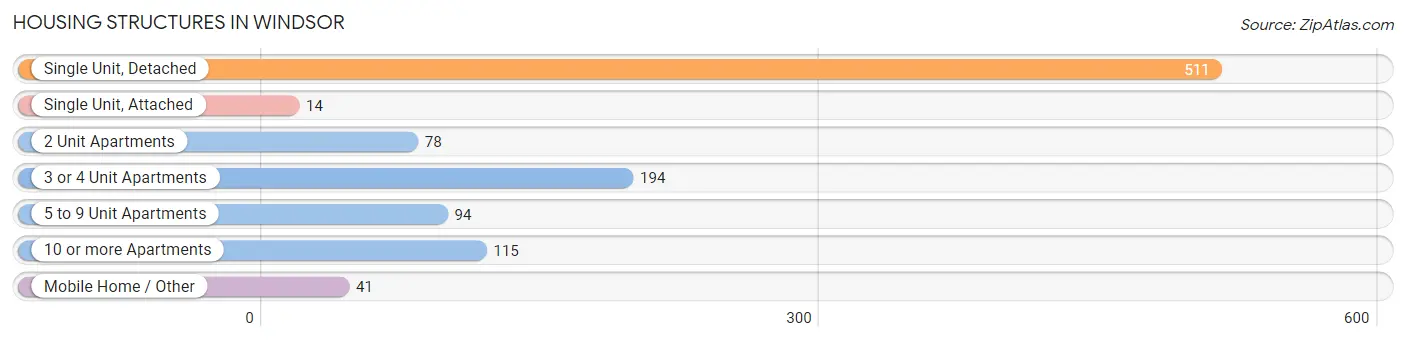
| Structure Type | # Housing Units | % Housing Units |
| Single Unit, Detached | 511 | 48.8% |
| Single Unit, Attached | 14 | 1.3% |
| 2 Unit Apartments | 78 | 7.4% |
| 3 or 4 Unit Apartments | 194 | 18.5% |
| 5 to 9 Unit Apartments | 94 | 9.0% |
| 10 or more Apartments | 115 | 11.0% |
| Mobile Home / Other | 41 | 3.9% |
| Total | 1,047 | 100.0% |
Housing Structures by Occupancy in Windsor
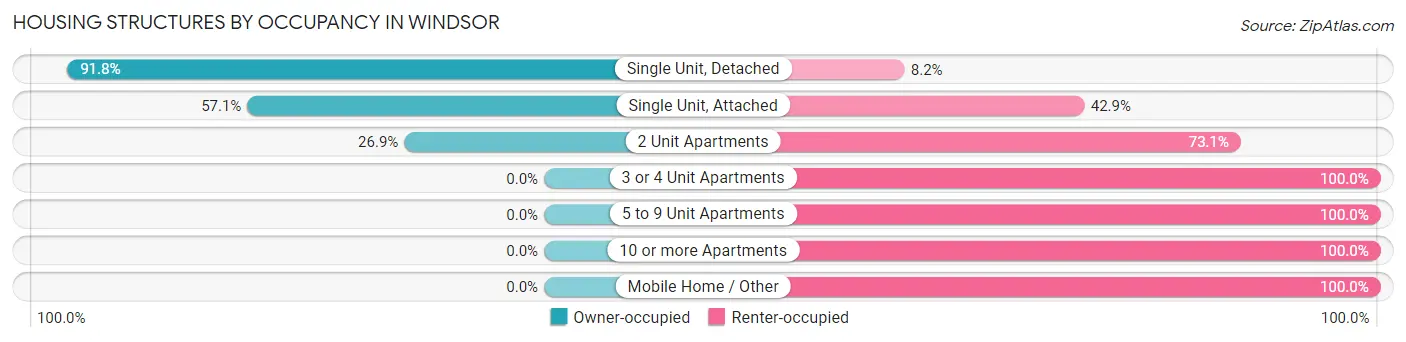
| Structure Type | Owner-occupied | Renter-occupied |
| Single Unit, Detached | 469 (91.8%) | 42 (8.2%) |
| Single Unit, Attached | 8 (57.1%) | 6 (42.9%) |
| 2 Unit Apartments | 21 (26.9%) | 57 (73.1%) |
| 3 or 4 Unit Apartments | 0 (0.0%) | 194 (100.0%) |
| 5 to 9 Unit Apartments | 0 (0.0%) | 94 (100.0%) |
| 10 or more Apartments | 0 (0.0%) | 115 (100.0%) |
| Mobile Home / Other | 0 (0.0%) | 41 (100.0%) |
| Total | 498 (47.6%) | 549 (52.4%) |
Housing Structures by Number of Rooms in Windsor
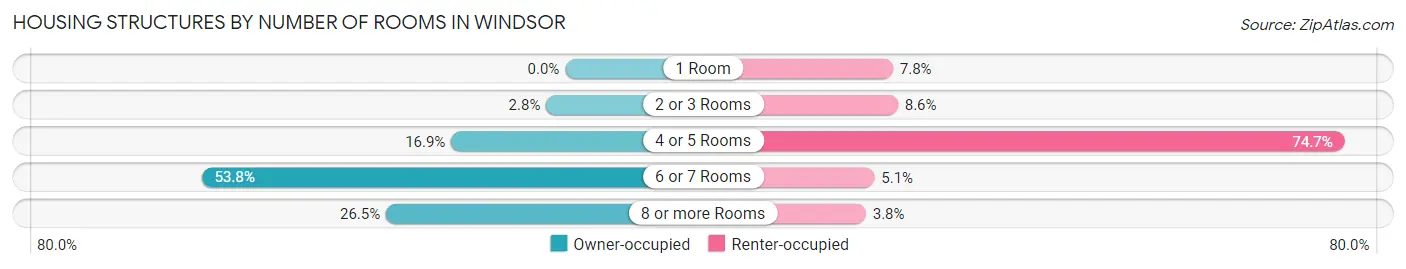
| Number of Rooms | Owner-occupied | Renter-occupied |
| 1 Room | 0 (0.0%) | 43 (7.8%) |
| 2 or 3 Rooms | 14 (2.8%) | 47 (8.6%) |
| 4 or 5 Rooms | 84 (16.9%) | 410 (74.7%) |
| 6 or 7 Rooms | 268 (53.8%) | 28 (5.1%) |
| 8 or more Rooms | 132 (26.5%) | 21 (3.8%) |
| Total | 498 (100.0%) | 549 (100.0%) |
Housing Structure by Heating Type in Windsor
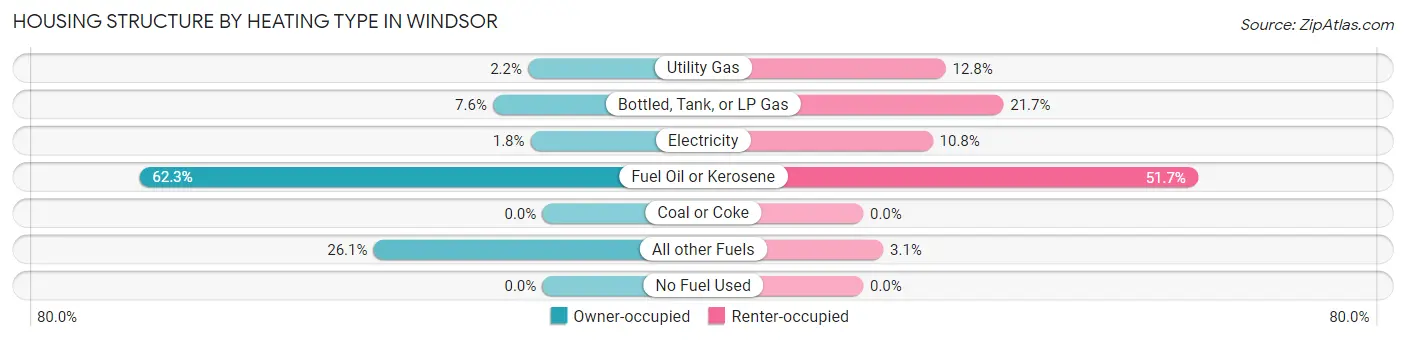
| Heating Type | Owner-occupied | Renter-occupied |
| Utility Gas | 11 (2.2%) | 70 (12.8%) |
| Bottled, Tank, or LP Gas | 38 (7.6%) | 119 (21.7%) |
| Electricity | 9 (1.8%) | 59 (10.7%) |
| Fuel Oil or Kerosene | 310 (62.3%) | 284 (51.7%) |
| Coal or Coke | 0 (0.0%) | 0 (0.0%) |
| All other Fuels | 130 (26.1%) | 17 (3.1%) |
| No Fuel Used | 0 (0.0%) | 0 (0.0%) |
| Total | 498 (100.0%) | 549 (100.0%) |
Household Vehicle Usage in Windsor
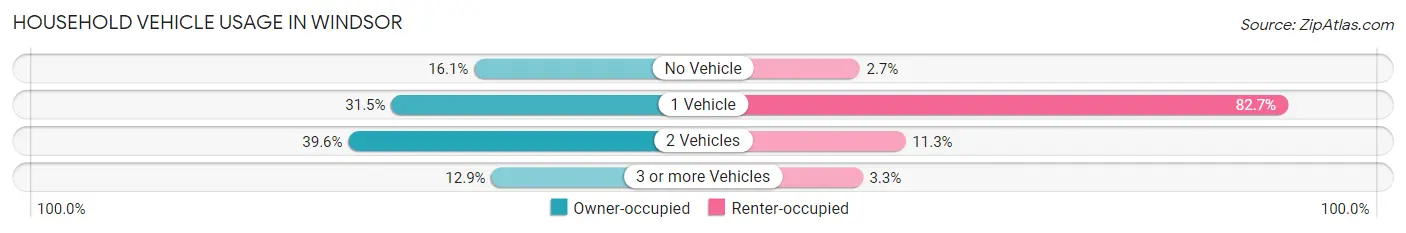
| Vehicles per Household | Owner-occupied | Renter-occupied |
| No Vehicle | 80 (16.1%) | 15 (2.7%) |
| 1 Vehicle | 157 (31.5%) | 454 (82.7%) |
| 2 Vehicles | 197 (39.6%) | 62 (11.3%) |
| 3 or more Vehicles | 64 (12.9%) | 18 (3.3%) |
| Total | 498 (100.0%) | 549 (100.0%) |
Real Estate & Mortgages in Windsor
Real Estate and Mortgage Overview in Windsor
| Characteristic | Without Mortgage | With Mortgage |
| Housing Units | 249 | 249 |
| Median Property Value | $154,300 | $167,800 |
| Median Household Income | $43,304 | $20 |
| Monthly Housing Costs | $814 | $25 |
| Real Estate Taxes | $4,427 | $0 |
Property Value by Mortgage Status in Windsor
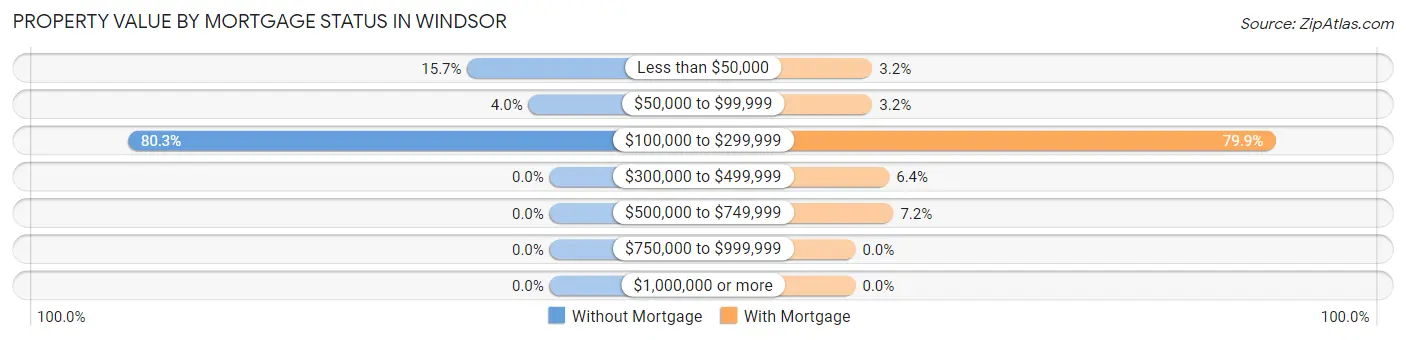
| Property Value | Without Mortgage | With Mortgage |
| Less than $50,000 | 39 (15.7%) | 8 (3.2%) |
| $50,000 to $99,999 | 10 (4.0%) | 8 (3.2%) |
| $100,000 to $299,999 | 200 (80.3%) | 199 (79.9%) |
| $300,000 to $499,999 | 0 (0.0%) | 16 (6.4%) |
| $500,000 to $749,999 | 0 (0.0%) | 18 (7.2%) |
| $750,000 to $999,999 | 0 (0.0%) | 0 (0.0%) |
| $1,000,000 or more | 0 (0.0%) | 0 (0.0%) |
| Total | 249 (100.0%) | 249 (100.0%) |
Household Income by Mortgage Status in Windsor
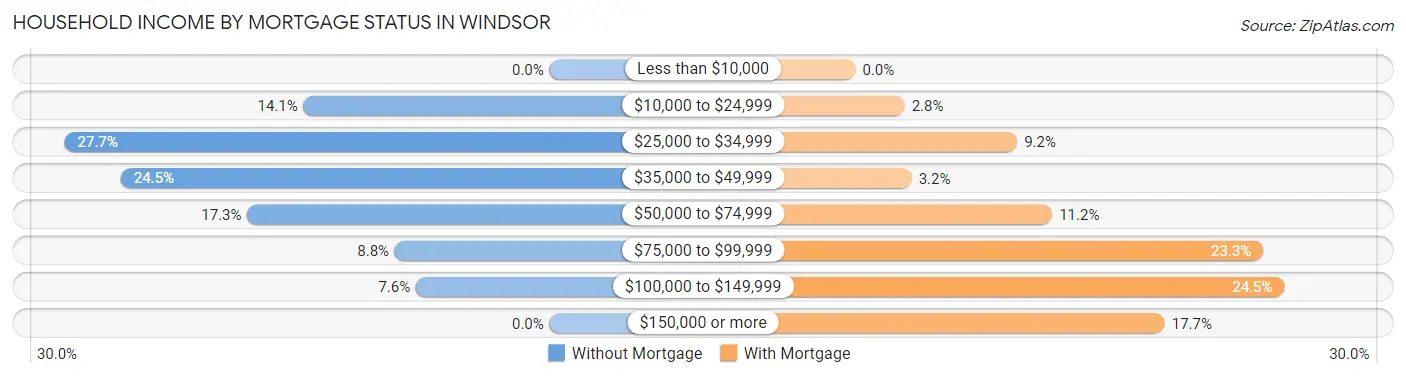
| Household Income | Without Mortgage | With Mortgage |
| Less than $10,000 | 0 (0.0%) | 0 (0.0%) |
| $10,000 to $24,999 | 35 (14.1%) | 7 (2.8%) |
| $25,000 to $34,999 | 69 (27.7%) | 23 (9.2%) |
| $35,000 to $49,999 | 61 (24.5%) | 8 (3.2%) |
| $50,000 to $74,999 | 43 (17.3%) | 28 (11.2%) |
| $75,000 to $99,999 | 22 (8.8%) | 58 (23.3%) |
| $100,000 to $149,999 | 19 (7.6%) | 61 (24.5%) |
| $150,000 or more | 0 (0.0%) | 44 (17.7%) |
| Total | 249 (100.0%) | 249 (100.0%) |
Property Value to Household Income Ratio in Windsor
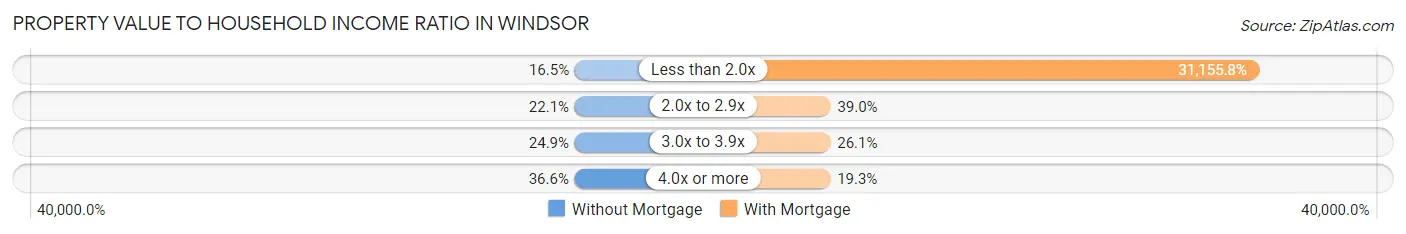
| Value-to-Income Ratio | Without Mortgage | With Mortgage |
| Less than 2.0x | 41 (16.5%) | 77,578 (31,155.8%) |
| 2.0x to 2.9x | 55 (22.1%) | 97 (39.0%) |
| 3.0x to 3.9x | 62 (24.9%) | 65 (26.1%) |
| 4.0x or more | 91 (36.5%) | 48 (19.3%) |
| Total | 249 (100.0%) | 249 (100.0%) |
Real Estate Taxes by Mortgage Status in Windsor
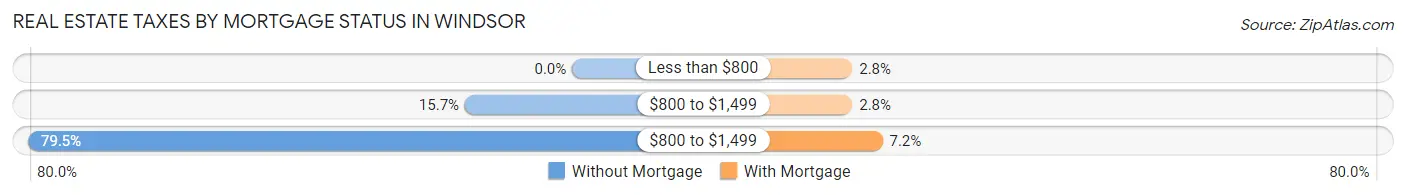
| Property Taxes | Without Mortgage | With Mortgage |
| Less than $800 | 0 (0.0%) | 7 (2.8%) |
| $800 to $1,499 | 39 (15.7%) | 7 (2.8%) |
| $800 to $1,499 | 198 (79.5%) | 18 (7.2%) |
| Total | 249 (100.0%) | 249 (100.0%) |
Health & Disability in Windsor
Health Insurance Coverage by Age in Windsor
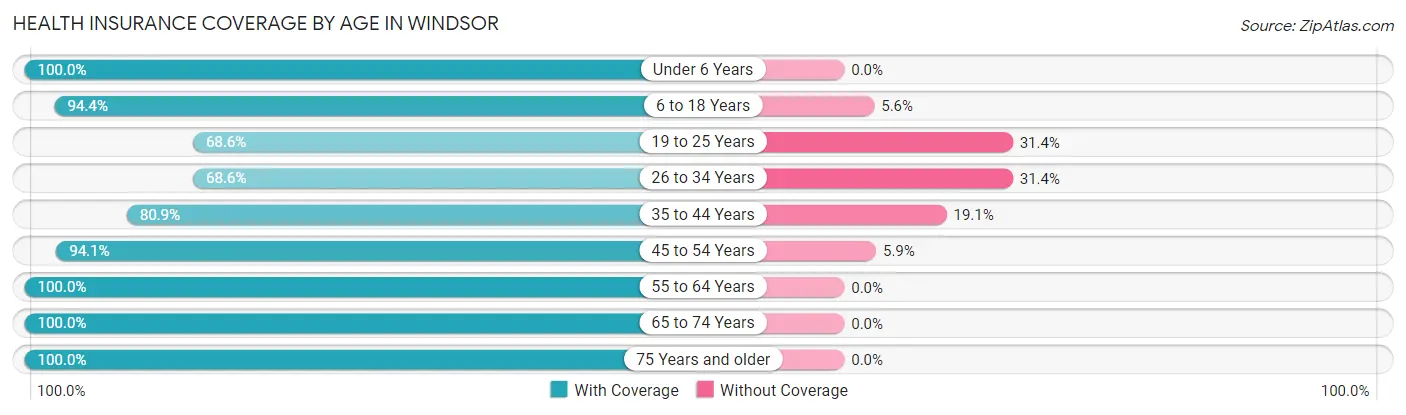
| Age Bracket | With Coverage | Without Coverage |
| Under 6 Years | 139 (100.0%) | 0 (0.0%) |
| 6 to 18 Years | 287 (94.4%) | 17 (5.6%) |
| 19 to 25 Years | 142 (68.6%) | 65 (31.4%) |
| 26 to 34 Years | 179 (68.6%) | 82 (31.4%) |
| 35 to 44 Years | 225 (80.9%) | 53 (19.1%) |
| 45 to 54 Years | 159 (94.1%) | 10 (5.9%) |
| 55 to 64 Years | 226 (100.0%) | 0 (0.0%) |
| 65 to 74 Years | 283 (100.0%) | 0 (0.0%) |
| 75 Years and older | 189 (100.0%) | 0 (0.0%) |
| Total | 1,829 (89.0%) | 227 (11.0%) |
Health Insurance Coverage by Citizenship Status in Windsor
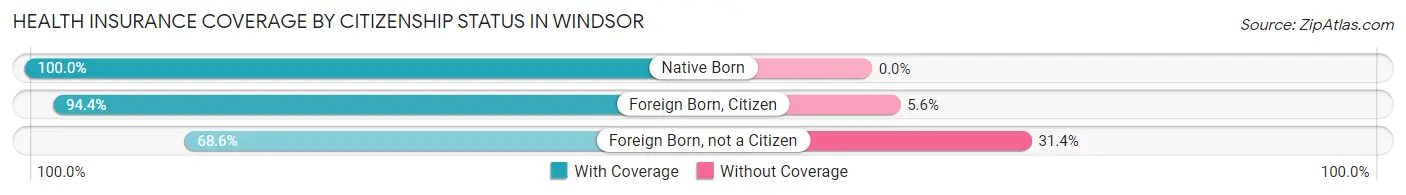
| Citizenship Status | With Coverage | Without Coverage |
| Native Born | 139 (100.0%) | 0 (0.0%) |
| Foreign Born, Citizen | 287 (94.4%) | 17 (5.6%) |
| Foreign Born, not a Citizen | 142 (68.6%) | 65 (31.4%) |
Health Insurance Coverage by Household Income in Windsor
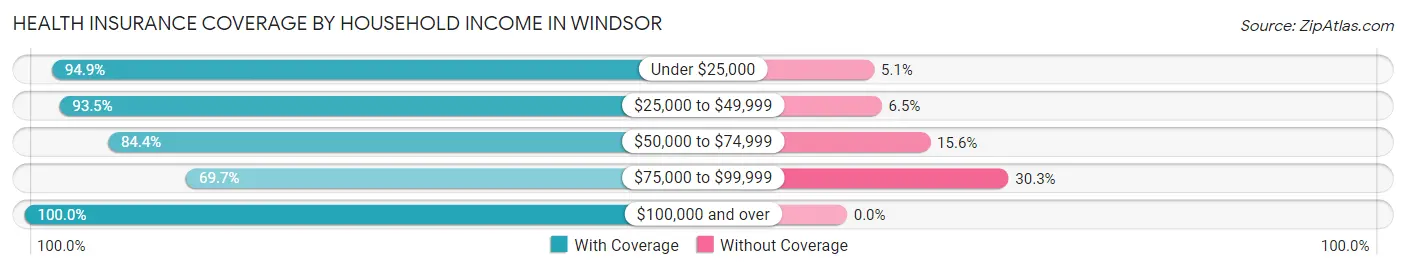
| Household Income | With Coverage | Without Coverage |
| Under $25,000 | 204 (94.9%) | 11 (5.1%) |
| $25,000 to $49,999 | 674 (93.5%) | 47 (6.5%) |
| $50,000 to $74,999 | 378 (84.4%) | 70 (15.6%) |
| $75,000 to $99,999 | 228 (69.7%) | 99 (30.3%) |
| $100,000 and over | 345 (100.0%) | 0 (0.0%) |
Public vs Private Health Insurance Coverage by Age in Windsor
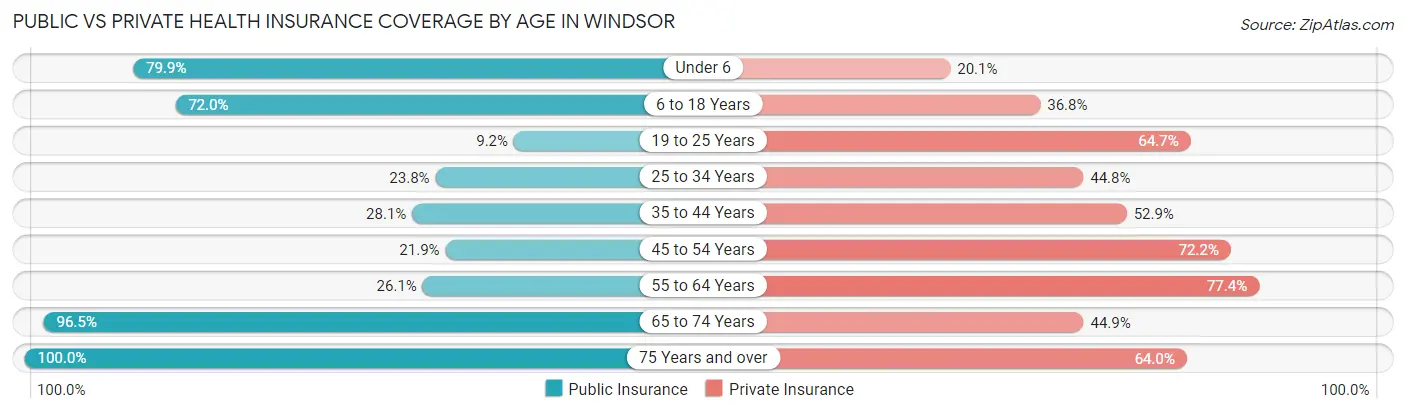
| Age Bracket | Public Insurance | Private Insurance |
| Under 6 | 111 (79.9%) | 28 (20.1%) |
| 6 to 18 Years | 219 (72.0%) | 112 (36.8%) |
| 19 to 25 Years | 19 (9.2%) | 134 (64.7%) |
| 25 to 34 Years | 62 (23.7%) | 117 (44.8%) |
| 35 to 44 Years | 78 (28.1%) | 147 (52.9%) |
| 45 to 54 Years | 37 (21.9%) | 122 (72.2%) |
| 55 to 64 Years | 59 (26.1%) | 175 (77.4%) |
| 65 to 74 Years | 273 (96.5%) | 127 (44.9%) |
| 75 Years and over | 189 (100.0%) | 121 (64.0%) |
| Total | 1,047 (50.9%) | 1,083 (52.7%) |
Disability Status by Sex by Age in Windsor
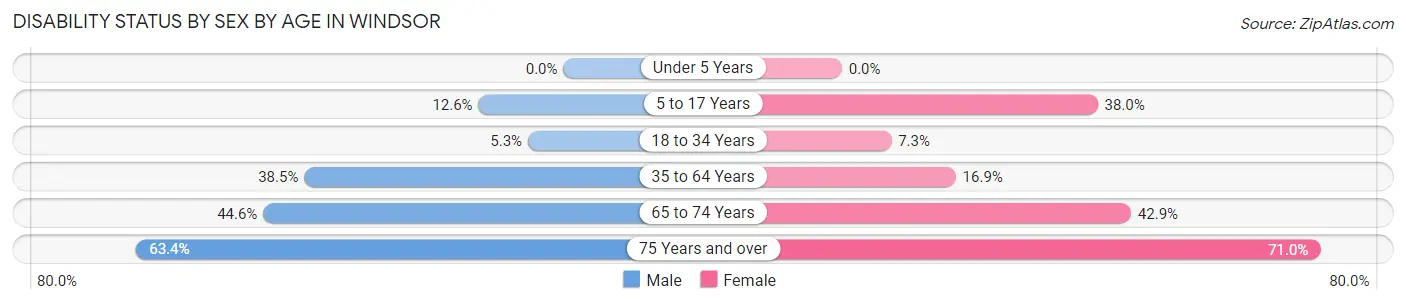
| Age Bracket | Male | Female |
| Under 5 Years | 0 (0.0%) | 0 (0.0%) |
| 5 to 17 Years | 15 (12.6%) | 79 (38.0%) |
| 18 to 34 Years | 11 (5.3%) | 19 (7.3%) |
| 35 to 64 Years | 127 (38.5%) | 58 (16.9%) |
| 65 to 74 Years | 41 (44.6%) | 82 (42.9%) |
| 75 Years and over | 52 (63.4%) | 76 (71.0%) |
Disability Class by Sex by Age in Windsor
Disability Class: Hearing Difficulty
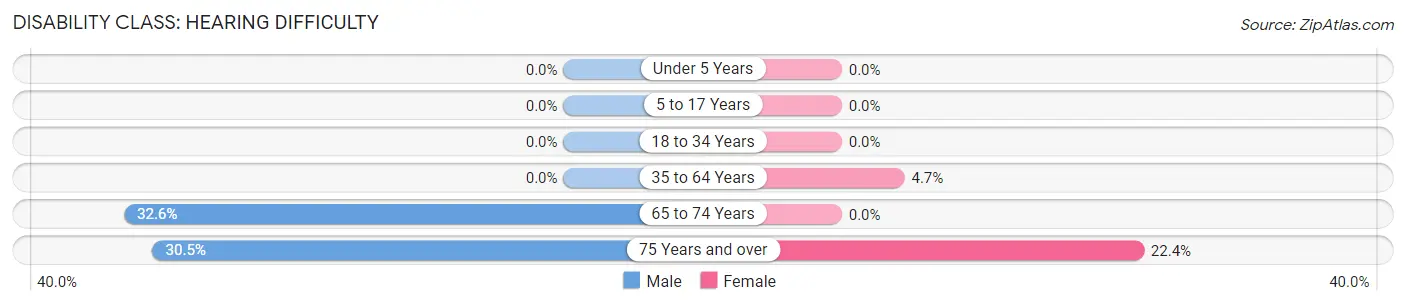
| Age Bracket | Male | Female |
| Under 5 Years | 0 (0.0%) | 0 (0.0%) |
| 5 to 17 Years | 0 (0.0%) | 0 (0.0%) |
| 18 to 34 Years | 0 (0.0%) | 0 (0.0%) |
| 35 to 64 Years | 0 (0.0%) | 16 (4.7%) |
| 65 to 74 Years | 30 (32.6%) | 0 (0.0%) |
| 75 Years and over | 25 (30.5%) | 24 (22.4%) |
Disability Class: Vision Difficulty
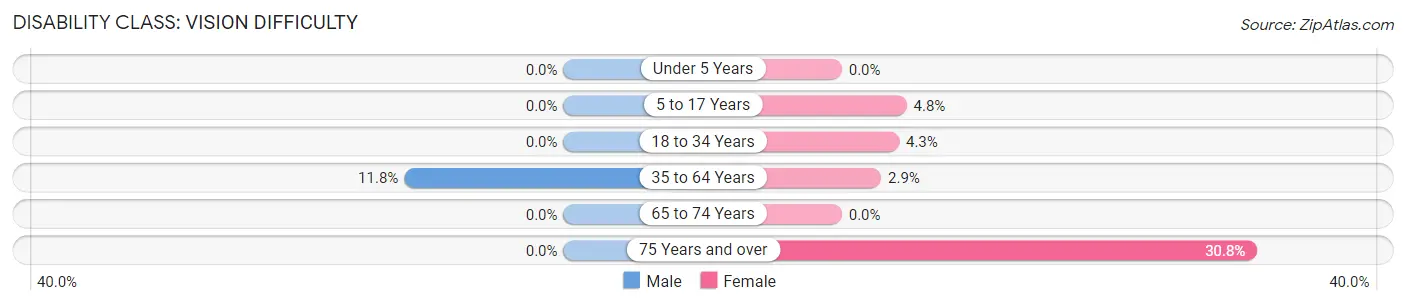
| Age Bracket | Male | Female |
| Under 5 Years | 0 (0.0%) | 0 (0.0%) |
| 5 to 17 Years | 0 (0.0%) | 10 (4.8%) |
| 18 to 34 Years | 0 (0.0%) | 11 (4.3%) |
| 35 to 64 Years | 39 (11.8%) | 10 (2.9%) |
| 65 to 74 Years | 0 (0.0%) | 0 (0.0%) |
| 75 Years and over | 0 (0.0%) | 33 (30.8%) |
Disability Class: Cognitive Difficulty
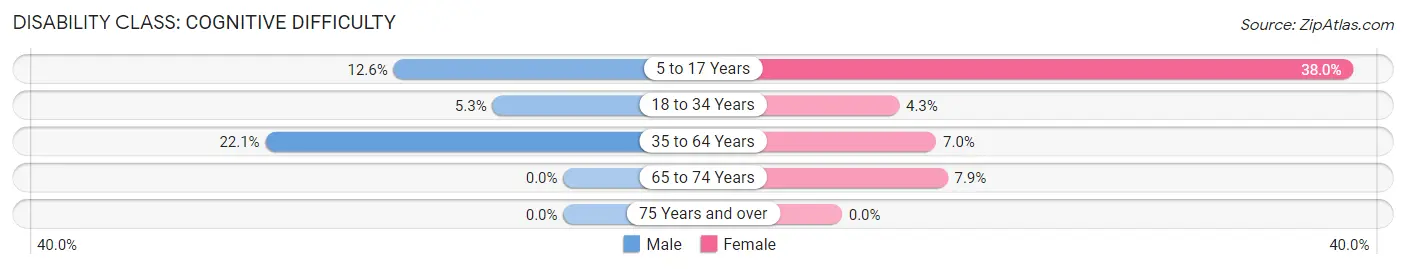
| Age Bracket | Male | Female |
| 5 to 17 Years | 15 (12.6%) | 79 (38.0%) |
| 18 to 34 Years | 11 (5.3%) | 11 (4.3%) |
| 35 to 64 Years | 73 (22.1%) | 24 (7.0%) |
| 65 to 74 Years | 0 (0.0%) | 15 (7.9%) |
| 75 Years and over | 0 (0.0%) | 0 (0.0%) |
Disability Class: Ambulatory Difficulty
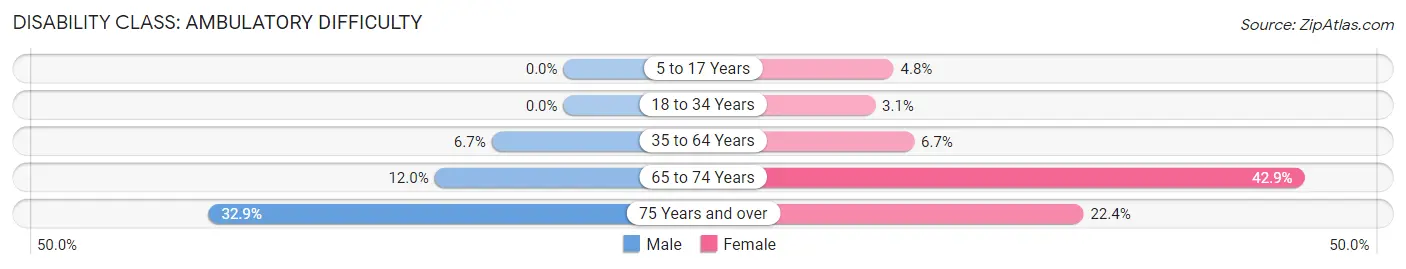
| Age Bracket | Male | Female |
| 5 to 17 Years | 0 (0.0%) | 10 (4.8%) |
| 18 to 34 Years | 0 (0.0%) | 8 (3.1%) |
| 35 to 64 Years | 22 (6.7%) | 23 (6.7%) |
| 65 to 74 Years | 11 (12.0%) | 82 (42.9%) |
| 75 Years and over | 27 (32.9%) | 24 (22.4%) |
Disability Class: Self-Care Difficulty
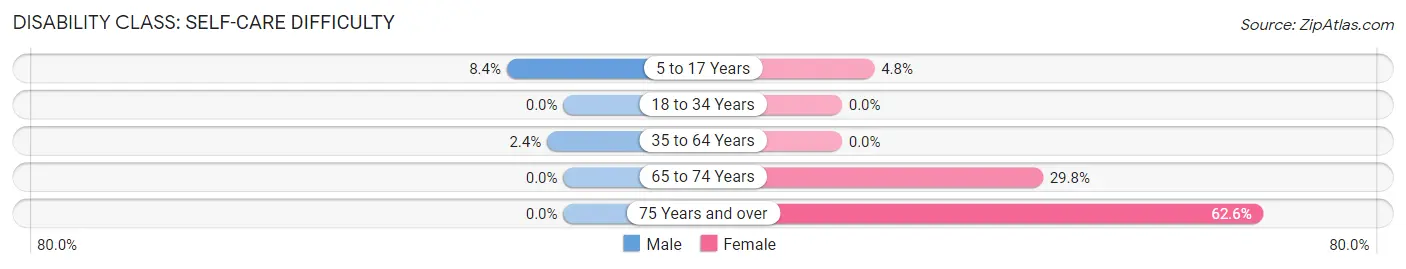
| Age Bracket | Male | Female |
| 5 to 17 Years | 10 (8.4%) | 10 (4.8%) |
| 18 to 34 Years | 0 (0.0%) | 0 (0.0%) |
| 35 to 64 Years | 8 (2.4%) | 0 (0.0%) |
| 65 to 74 Years | 0 (0.0%) | 57 (29.8%) |
| 75 Years and over | 0 (0.0%) | 67 (62.6%) |
Technology Access in Windsor
Computing Device Access in Windsor
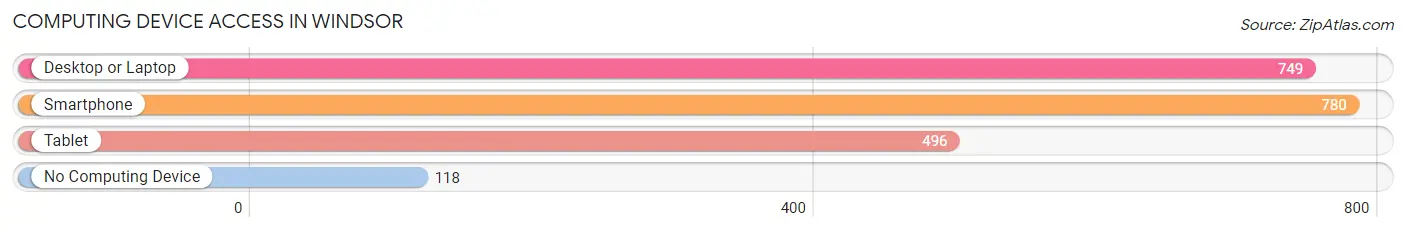
| Device Type | # Households | % Households |
| Desktop or Laptop | 749 | 71.5% |
| Smartphone | 780 | 74.5% |
| Tablet | 496 | 47.4% |
| No Computing Device | 118 | 11.3% |
| Total | 1,047 | 100.0% |
Internet Access in Windsor
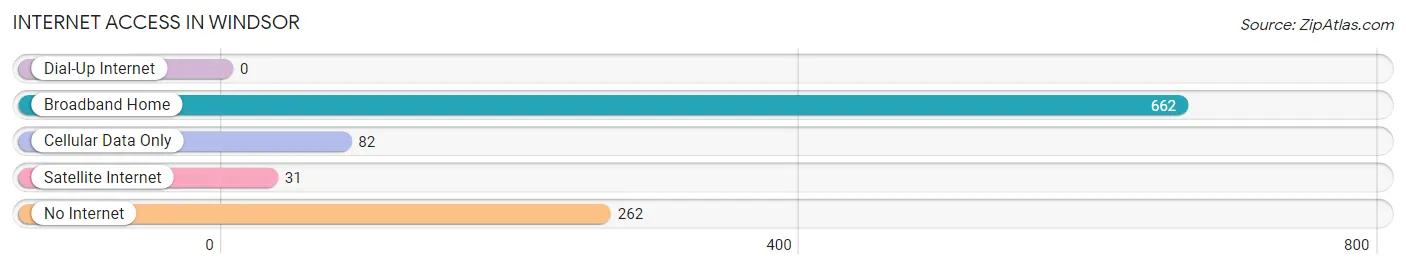
| Internet Type | # Households | % Households |
| Dial-Up Internet | 0 | 0.0% |
| Broadband Home | 662 | 63.2% |
| Cellular Data Only | 82 | 7.8% |
| Satellite Internet | 31 | 3.0% |
| No Internet | 262 | 25.0% |
| Total | 1,047 | 100.0% |
Windsor Summary
Windsor, Vermont is a small town located in Windsor County in the southeastern part of the state. It is situated on the banks of the Connecticut River, which forms the border between Vermont and New Hampshire. The town has a population of approximately 3,000 people and covers an area of about 25 square miles.
History
The area that is now Windsor was first settled in 1761 by a group of settlers from Connecticut. The town was originally known as "New Connecticut" and was part of the Connecticut River Valley. The town was officially incorporated in 1781 and was named after Windsor, Connecticut.
The town was an important center of industry in the 19th century, with several mills and factories located in the area. The Windsor Woolen Mill, which was established in 1820, was one of the largest and most successful mills in the region. The mill was destroyed by fire in 1871, but was rebuilt and continued to operate until the early 20th century.
The town was also home to several other industries, including a paper mill, a sawmill, a gristmill, and a tannery. The Windsor Railroad was built in 1848 and connected the town to the rest of the state.
Geography
Windsor is located in the Connecticut River Valley, which is a major agricultural region. The town is situated on the banks of the Connecticut River, which forms the border between Vermont and New Hampshire. The town is surrounded by rolling hills and forests, and is home to several small lakes and ponds.
The town is located in the Green Mountains, which are part of the Appalachian Mountains. The highest point in the town is Mount Ascutney, which has an elevation of 3,144 feet.
Economy
The economy of Windsor is largely based on agriculture and tourism. The town is home to several farms, which produce a variety of crops, including corn, hay, and apples. The town is also home to several wineries, which produce a variety of wines.
Tourism is an important part of the local economy, with many visitors coming to the area to enjoy the natural beauty of the region. The town is home to several historic sites, including the Windsor Woolen Mill, the Windsor Railroad, and the Windsor Town Hall.
Demographics
As of the 2010 census, the population of Windsor was 3,018. The racial makeup of the town was 97.3% White, 0.7% African American, 0.3% Native American, 0.3% Asian, 0.1% Pacific Islander, 0.3% from other races, and 1.0% from two or more races. Hispanic or Latino of any race were 1.2% of the population.
The median household income in Windsor was $45,938, and the median family income was $51,938. The per capita income for the town was $21,938. About 8.3% of families and 10.3% of the population were below the poverty line, including 14.3% of those under age 18 and 5.3% of those age 65 or over.
Common Questions
What is Per Capita Income in Windsor?
Per Capita income in Windsor is $34,143.
What is the Median Family Income in Windsor?
Median Family Income in Windsor is $59,191.
What is the Median Household income in Windsor?
Median Household Income in Windsor is $47,545.
What is Income or Wage Gap in Windsor?
Income or Wage Gap in Windsor is 11.8%.
Women in Windsor earn 88.2 cents for every dollar earned by a man.
What is Inequality or Gini Index in Windsor?
Inequality or Gini Index in Windsor is 0.49.
What is the Total Population of Windsor?
Total Population of Windsor is 2,138.
What is the Total Male Population of Windsor?
Total Male Population of Windsor is 890.
What is the Total Female Population of Windsor?
Total Female Population of Windsor is 1,248.
What is the Ratio of Males per 100 Females in Windsor?
There are 71.31 Males per 100 Females in Windsor.
What is the Ratio of Females per 100 Males in Windsor?
There are 140.22 Females per 100 Males in Windsor.
What is the Median Population Age in Windsor?
Median Population Age in Windsor is 41.0 Years.
What is the Average Family Size in Windsor
Average Family Size in Windsor is 2.9 People.
What is the Average Household Size in Windsor
Average Household Size in Windsor is 2.0 People.
How Large is the Labor Force in Windsor?
There are 1,120 People in the Labor Forcein in Windsor.
What is the Percentage of People in the Labor Force in Windsor?
63.2% of People are in the Labor Force in Windsor.
What is the Unemployment Rate in Windsor?
Unemployment Rate in Windsor is 3.8%.