Cabot, VT Map & Demographics
Cabot Map
Cabot Overview
$43,559
PER CAPITA INCOME
$64,773
AVG FAMILY INCOME
$53,958
AVG HOUSEHOLD INCOME
35.1%
WAGE / INCOME GAP [ % ]
64.9¢/ $1
WAGE / INCOME GAP [ $ ]
0.56
INEQUALITY / GINI INDEX
272
TOTAL POPULATION
116
MALE POPULATION
156
FEMALE POPULATION
74.36
MALES / 100 FEMALES
134.48
FEMALES / 100 MALES
25.7
MEDIAN AGE
3.3
AVG FAMILY SIZE
2.4
AVG HOUSEHOLD SIZE
120
LABOR FORCE [ PEOPLE ]
57.4%
PERCENT IN LABOR FORCE
9.2%
UNEMPLOYMENT RATE
Cabot Zip Codes
Cabot Area Codes
Income in Cabot
Income Overview in Cabot
Per Capita Income in Cabot is $43,559, while median incomes of families and households are $64,773 and $53,958 respectively.
| Characteristic | Number | Measure |
| Per Capita Income | 272 | $43,559 |
| Median Family Income | 52 | $64,773 |
| Mean Family Income | 52 | $79,231 |
| Median Household Income | 115 | $53,958 |
| Mean Household Income | 115 | $102,799 |
| Income Deficit | 52 | $0 |
| Wage / Income Gap (%) | 272 | 35.10% |
| Wage / Income Gap ($) | 272 | 64.90¢ per $1 |
| Gini / Inequality Index | 272 | 0.56 |
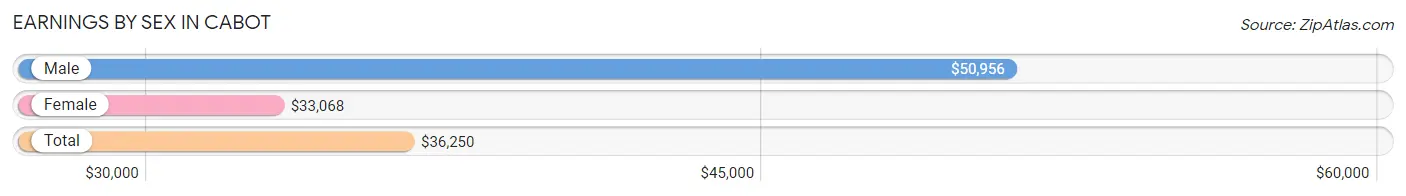
Earnings by Sex in Cabot
Average Earnings in Cabot are $36,250, $50,956 for men and $33,068 for women, a difference of 35.1%.
| Sex | Number | Average Earnings |
| Male | 89 (54.3%) | $50,956 |
| Female | 75 (45.7%) | $33,068 |
| Total | 164 (100.0%) | $36,250 |
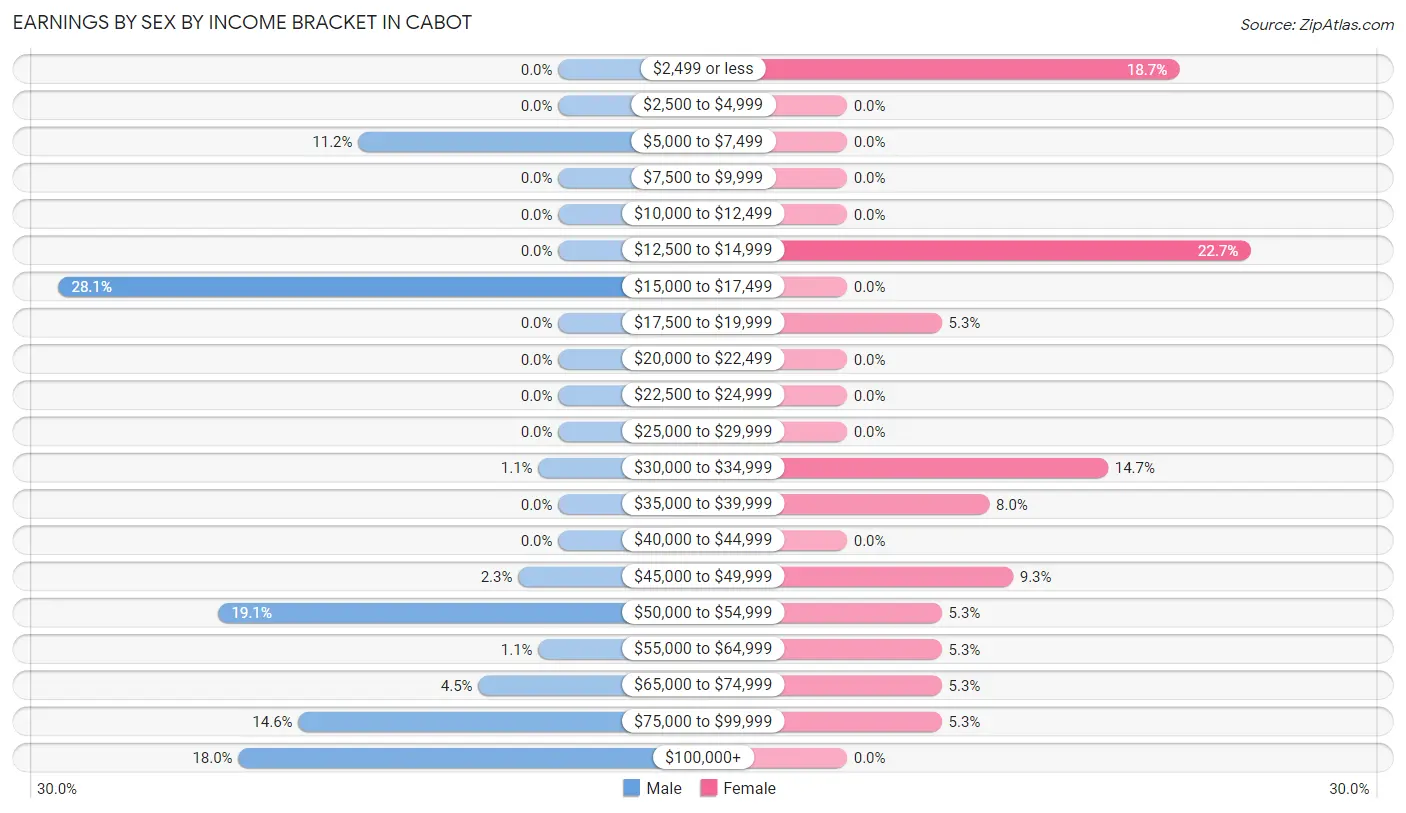
Earnings by Sex by Income Bracket in Cabot
The most common earnings brackets in Cabot are $15,000 to $17,499 for men (25 | 28.1%) and $12,500 to $14,999 for women (17 | 22.7%).
| Income | Male | Female |
| $2,499 or less | 0 (0.0%) | 14 (18.7%) |
| $2,500 to $4,999 | 0 (0.0%) | 0 (0.0%) |
| $5,000 to $7,499 | 10 (11.2%) | 0 (0.0%) |
| $7,500 to $9,999 | 0 (0.0%) | 0 (0.0%) |
| $10,000 to $12,499 | 0 (0.0%) | 0 (0.0%) |
| $12,500 to $14,999 | 0 (0.0%) | 17 (22.7%) |
| $15,000 to $17,499 | 25 (28.1%) | 0 (0.0%) |
| $17,500 to $19,999 | 0 (0.0%) | 4 (5.3%) |
| $20,000 to $22,499 | 0 (0.0%) | 0 (0.0%) |
| $22,500 to $24,999 | 0 (0.0%) | 0 (0.0%) |
| $25,000 to $29,999 | 0 (0.0%) | 0 (0.0%) |
| $30,000 to $34,999 | 1 (1.1%) | 11 (14.7%) |
| $35,000 to $39,999 | 0 (0.0%) | 6 (8.0%) |
| $40,000 to $44,999 | 0 (0.0%) | 0 (0.0%) |
| $45,000 to $49,999 | 2 (2.2%) | 7 (9.3%) |
| $50,000 to $54,999 | 17 (19.1%) | 4 (5.3%) |
| $55,000 to $64,999 | 1 (1.1%) | 4 (5.3%) |
| $65,000 to $74,999 | 4 (4.5%) | 4 (5.3%) |
| $75,000 to $99,999 | 13 (14.6%) | 4 (5.3%) |
| $100,000+ | 16 (18.0%) | 0 (0.0%) |
| Total | 89 (100.0%) | 75 (100.0%) |
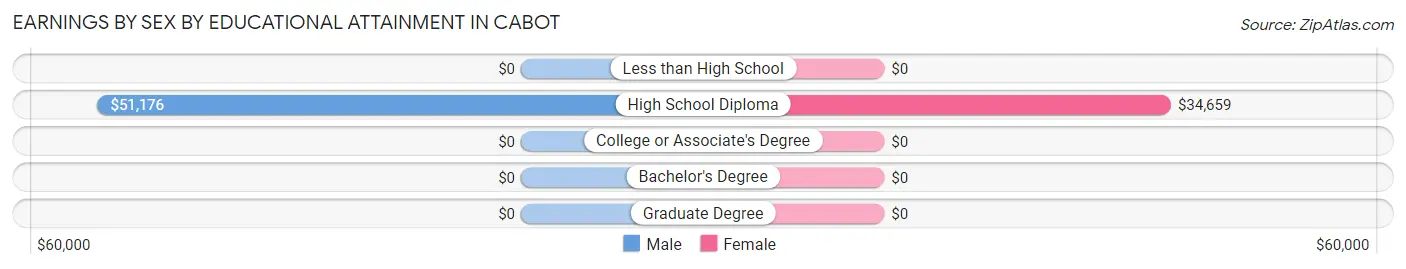
Earnings by Sex by Educational Attainment in Cabot
Average earnings in Cabot are $73,125 for men and $47,679 for women, a difference of 34.8%. Men with an educational attainment of high school diploma enjoy the highest average annual earnings of $51,176, while those with high school diploma education earn the least with $51,176. Women with an educational attainment of high school diploma earn the most with the average annual earnings of $34,659, while those with high school diploma education have the smallest earnings of $34,659.
| Educational Attainment | Male Income | Female Income |
| Less than High School | - | - |
| High School Diploma | $51,176 | $34,659 |
| College or Associate's Degree | - | - |
| Bachelor's Degree | - | - |
| Graduate Degree | - | - |
| Total | $73,125 | $47,679 |
Family Income in Cabot
Family Income Brackets in Cabot
According to the Cabot family income data, there are 19 families falling into the $50,000 to $74,999 income range, which is the most common income bracket and makes up 36.5% of all families.
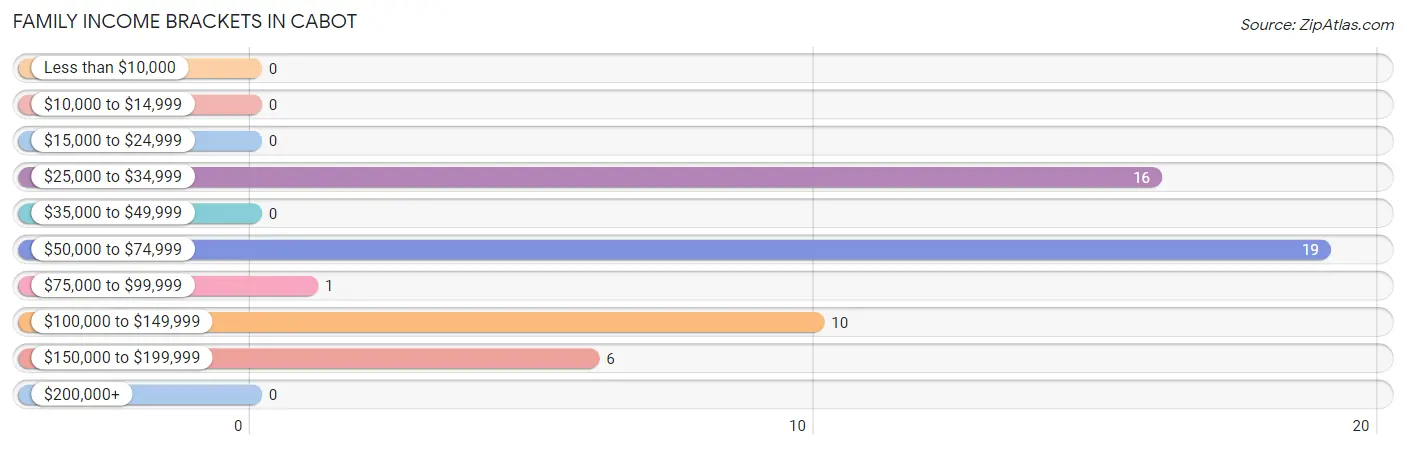
| Income Bracket | # Families | % Families |
| Less than $10,000 | 0 | 0.0% |
| $10,000 to $14,999 | 0 | 0.0% |
| $15,000 to $24,999 | 0 | 0.0% |
| $25,000 to $34,999 | 16 | 30.8% |
| $35,000 to $49,999 | 0 | 0.0% |
| $50,000 to $74,999 | 19 | 36.5% |
| $75,000 to $99,999 | 1 | 1.9% |
| $100,000 to $149,999 | 10 | 19.2% |
| $150,000 to $199,999 | 6 | 11.5% |
| $200,000+ | 0 | 0.0% |
Family Income by Famaliy Size in Cabot
2-person families (14 | 26.9%) account for the highest median family income in Cabot with $144,375 per family, while 2-person families (14 | 26.9%) have the highest median income of $72,188 per family member.
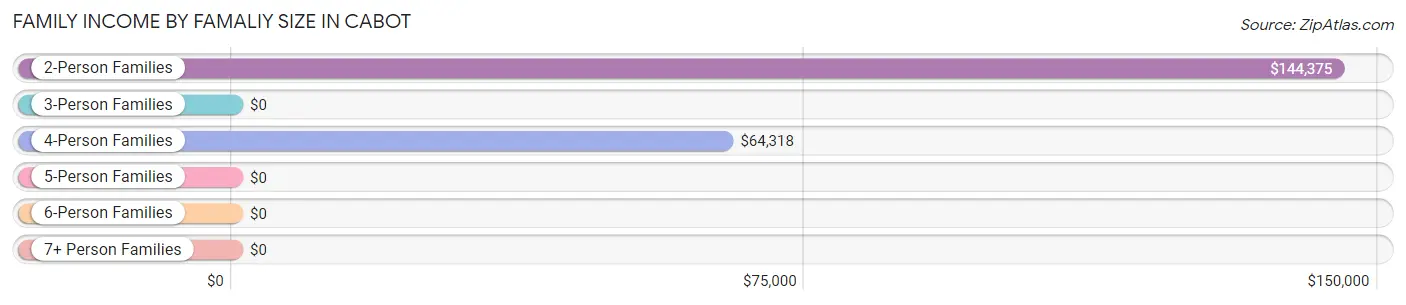
| Income Bracket | # Families | Median Income |
| 2-Person Families | 14 (26.9%) | $144,375 |
| 3-Person Families | 22 (42.3%) | $0 |
| 4-Person Families | 16 (30.8%) | $64,318 |
| 5-Person Families | 0 (0.0%) | $0 |
| 6-Person Families | 0 (0.0%) | $0 |
| 7+ Person Families | 0 (0.0%) | $0 |
| Total | 52 (100.0%) | $64,773 |
Family Income by Number of Earners in Cabot
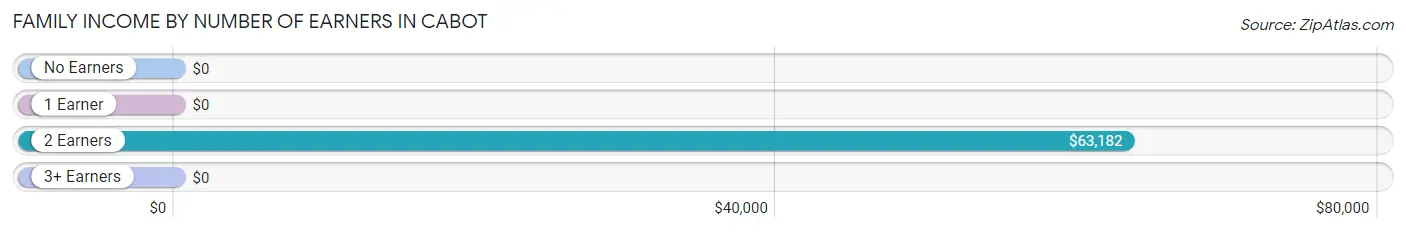
| Number of Earners | # Families | Median Income |
| No Earners | 3 (5.8%) | $0 |
| 1 Earner | 5 (9.6%) | $0 |
| 2 Earners | 38 (73.1%) | $63,182 |
| 3+ Earners | 6 (11.5%) | $0 |
| Total | 52 (100.0%) | $64,773 |
Household Income in Cabot
Household Income Brackets in Cabot
With 42 households falling in the category, the $50,000 to $74,999 income range is the most frequent in Cabot, accounting for 36.5% of all households.
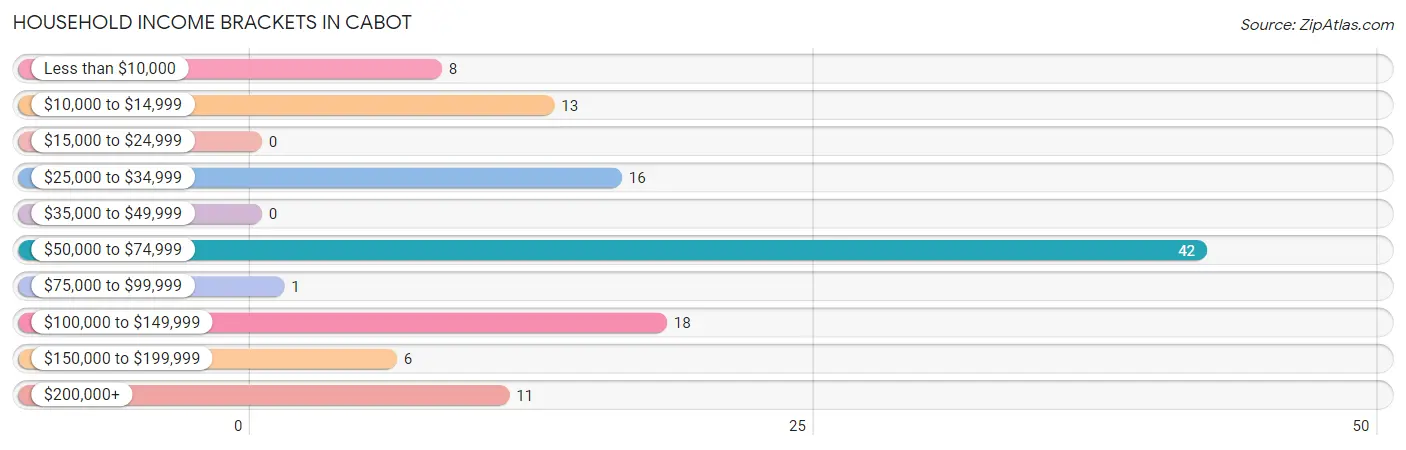
| Income Bracket | # Households | % Households |
| Less than $10,000 | 8 | 7.0% |
| $10,000 to $14,999 | 13 | 11.3% |
| $15,000 to $24,999 | 0 | 0.0% |
| $25,000 to $34,999 | 16 | 13.9% |
| $35,000 to $49,999 | 0 | 0.0% |
| $50,000 to $74,999 | 42 | 36.5% |
| $75,000 to $99,999 | 1 | 0.9% |
| $100,000 to $149,999 | 18 | 15.7% |
| $150,000 to $199,999 | 6 | 5.2% |
| $200,000+ | 11 | 9.6% |
Household Income by Householder Age in Cabot
The median household income in Cabot is $53,958, with the highest median household income of $63,977 found in the 25 to 44 years age bracket for the primary householder. A total of 25 households (21.7%) fall into this category. Meanwhile, the 15 to 24 years age bracket for the primary householder has the lowest median household income of $0, with 16 households (13.9%) in this group.
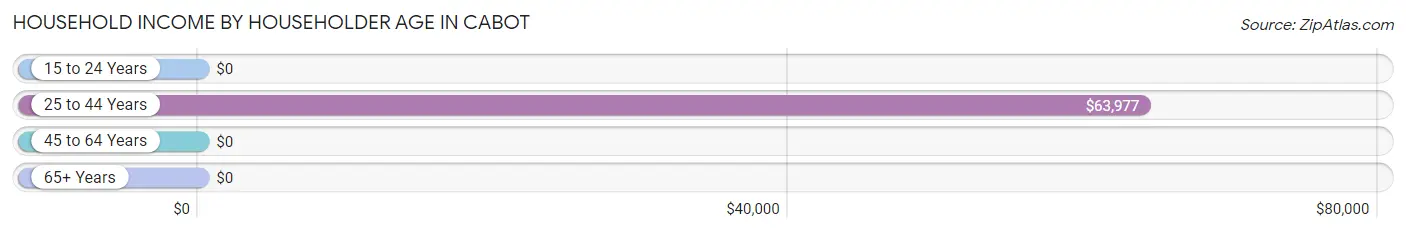
| Income Bracket | # Households | Median Income |
| 15 to 24 Years | 16 (13.9%) | $0 |
| 25 to 44 Years | 25 (21.7%) | $63,977 |
| 45 to 64 Years | 38 (33.0%) | $0 |
| 65+ Years | 36 (31.3%) | $0 |
| Total | 115 (100.0%) | $53,958 |
Poverty in Cabot
Income Below Poverty by Sex and Age in Cabot
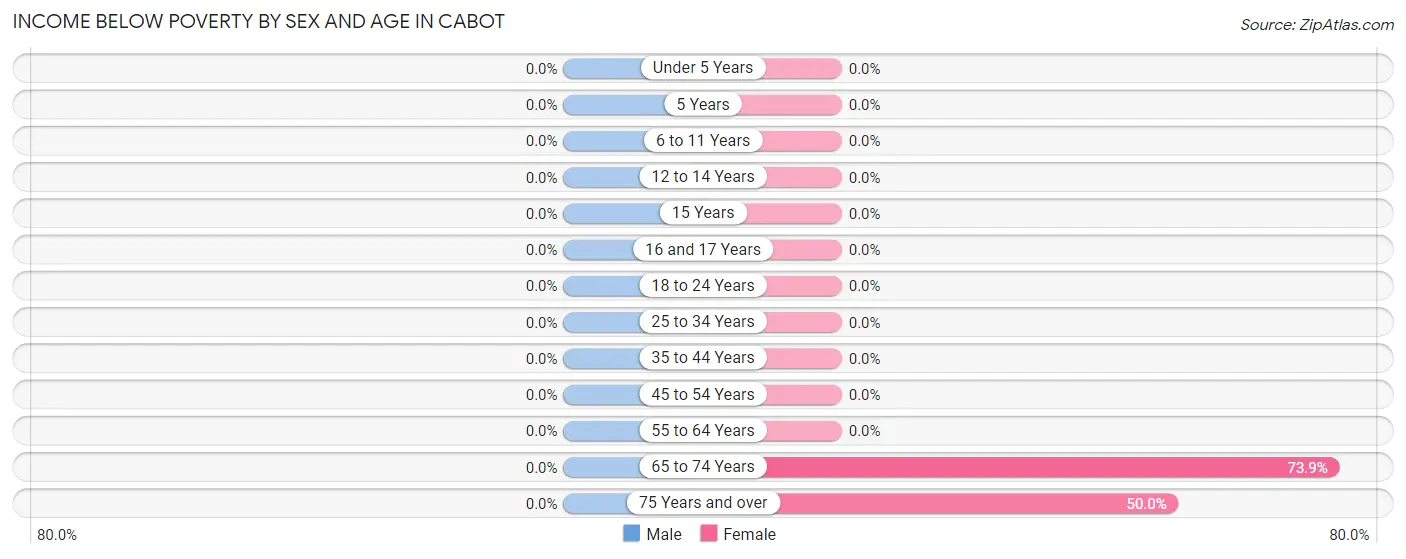
| Age Bracket | Male | Female |
| Under 5 Years | 0 (0.0%) | 0 (0.0%) |
| 5 Years | 0 (0.0%) | 0 (0.0%) |
| 6 to 11 Years | 0 (0.0%) | 0 (0.0%) |
| 12 to 14 Years | 0 (0.0%) | 0 (0.0%) |
| 15 Years | 0 (0.0%) | 0 (0.0%) |
| 16 and 17 Years | 0 (0.0%) | 0 (0.0%) |
| 18 to 24 Years | 0 (0.0%) | 0 (0.0%) |
| 25 to 34 Years | 0 (0.0%) | 0 (0.0%) |
| 35 to 44 Years | 0 (0.0%) | 0 (0.0%) |
| 45 to 54 Years | 0 (0.0%) | 0 (0.0%) |
| 55 to 64 Years | 0 (0.0%) | 0 (0.0%) |
| 65 to 74 Years | 0 (0.0%) | 17 (73.9%) |
| 75 Years and over | 0 (0.0%) | 4 (50.0%) |
| Total | 0 (0.0%) | 21 (14.4%) |
Income Above Poverty by Sex and Age in Cabot
According to the poverty statistics in Cabot, males aged 12 to 14 years and females aged under 5 years are the age groups that are most secure financially, with 100.0% of males and 100.0% of females in these age groups living above the poverty line.
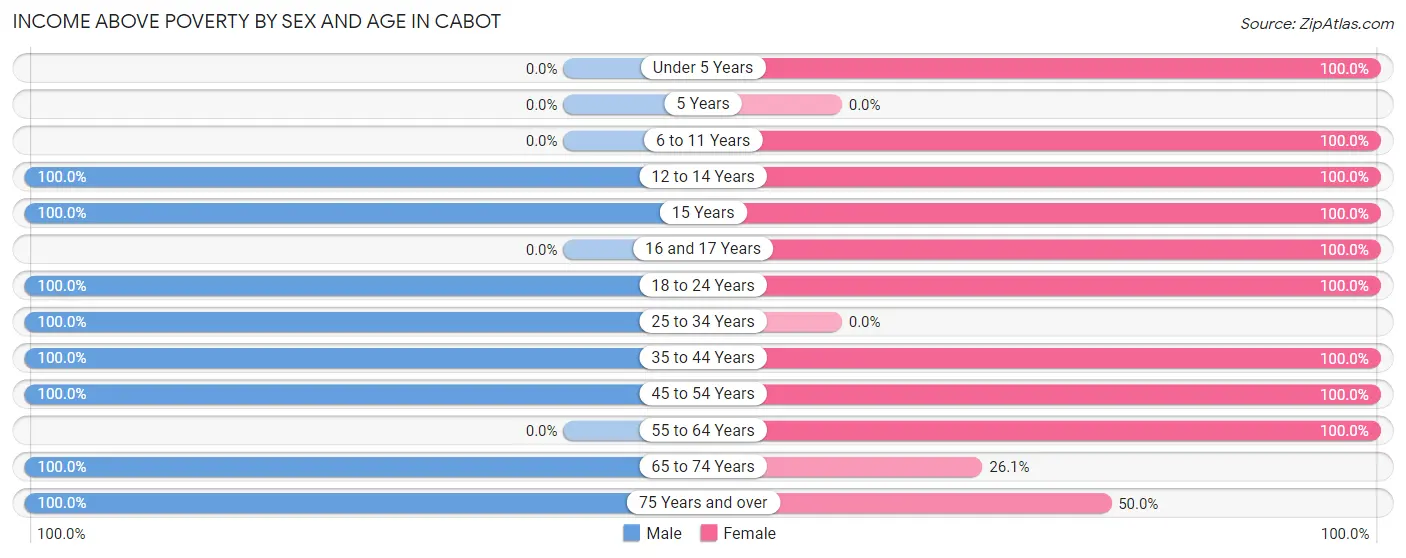
| Age Bracket | Male | Female |
| Under 5 Years | 0 (0.0%) | 4 (100.0%) |
| 5 Years | 0 (0.0%) | 0 (0.0%) |
| 6 to 11 Years | 0 (0.0%) | 11 (100.0%) |
| 12 to 14 Years | 4 (100.0%) | 12 (100.0%) |
| 15 Years | 2 (100.0%) | 2 (100.0%) |
| 16 and 17 Years | 0 (0.0%) | 11 (100.0%) |
| 18 to 24 Years | 25 (100.0%) | 30 (100.0%) |
| 25 to 34 Years | 12 (100.0%) | 0 (0.0%) |
| 35 to 44 Years | 2 (100.0%) | 23 (100.0%) |
| 45 to 54 Years | 38 (100.0%) | 18 (100.0%) |
| 55 to 64 Years | 0 (0.0%) | 4 (100.0%) |
| 65 to 74 Years | 12 (100.0%) | 6 (26.1%) |
| 75 Years and over | 3 (100.0%) | 4 (50.0%) |
| Total | 98 (100.0%) | 125 (85.6%) |
Income Below Poverty Among Married-Couple Families in Cabot
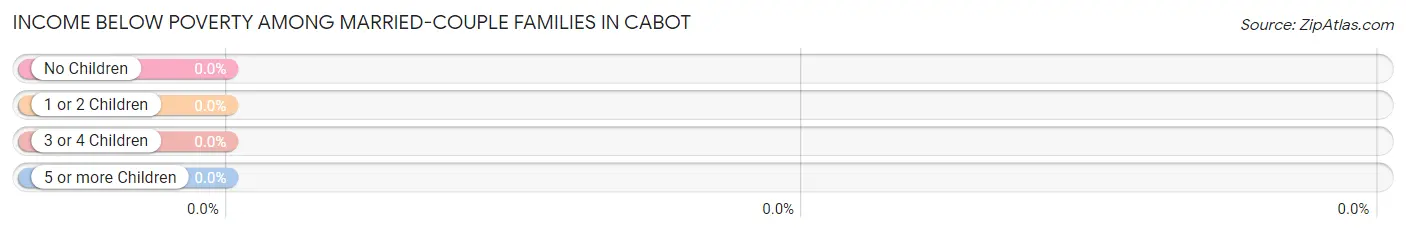
| Children | Above Poverty | Below Poverty |
| No Children | 20 (100.0%) | 0 (0.0%) |
| 1 or 2 Children | 17 (100.0%) | 0 (0.0%) |
| 3 or 4 Children | 0 (0.0%) | 0 (0.0%) |
| 5 or more Children | 0 (0.0%) | 0 (0.0%) |
| Total | 37 (100.0%) | 0 (0.0%) |
Income Below Poverty Among Single-Parent Households in Cabot
| Children | Single Father | Single Mother |
| No Children | 0 (0.0%) | 0 (0.0%) |
| 1 or 2 Children | 0 (0.0%) | 0 (0.0%) |
| 3 or 4 Children | 0 (0.0%) | 0 (0.0%) |
| 5 or more Children | 0 (0.0%) | 0 (0.0%) |
| Total | 0 (0.0%) | 0 (0.0%) |
Income Below Poverty Among Married-Couple vs Single-Parent Households in Cabot
| Children | Married-Couple Families | Single-Parent Households |
| No Children | 0 (0.0%) | 0 (0.0%) |
| 1 or 2 Children | 0 (0.0%) | 0 (0.0%) |
| 3 or 4 Children | 0 (0.0%) | 0 (0.0%) |
| 5 or more Children | 0 (0.0%) | 0 (0.0%) |
| Total | 0 (0.0%) | 0 (0.0%) |
Race in Cabot
The most populous races in Cabot are White / Caucasian (265 | 97.4%), and Some other Race (7 | 2.6%).
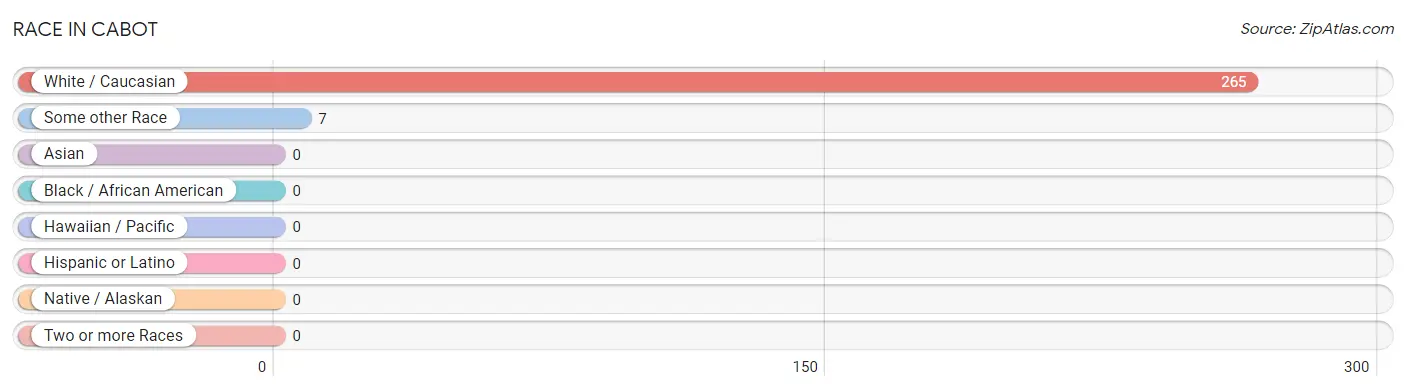
| Race | # Population | % Population |
| Asian | 0 | 0.0% |
| Black / African American | 0 | 0.0% |
| Hawaiian / Pacific | 0 | 0.0% |
| Hispanic or Latino | 0 | 0.0% |
| Native / Alaskan | 0 | 0.0% |
| White / Caucasian | 265 | 97.4% |
| Two or more Races | 0 | 0.0% |
| Some other Race | 7 | 2.6% |
| Total | 272 | 100.0% |
Ancestry in Cabot
The most populous ancestries reported in Cabot are American (54 | 19.9%), French (45 | 16.5%), German (23 | 8.5%), English (22 | 8.1%), and Russian (20 | 7.3%), together accounting for 60.3% of all Cabot residents.
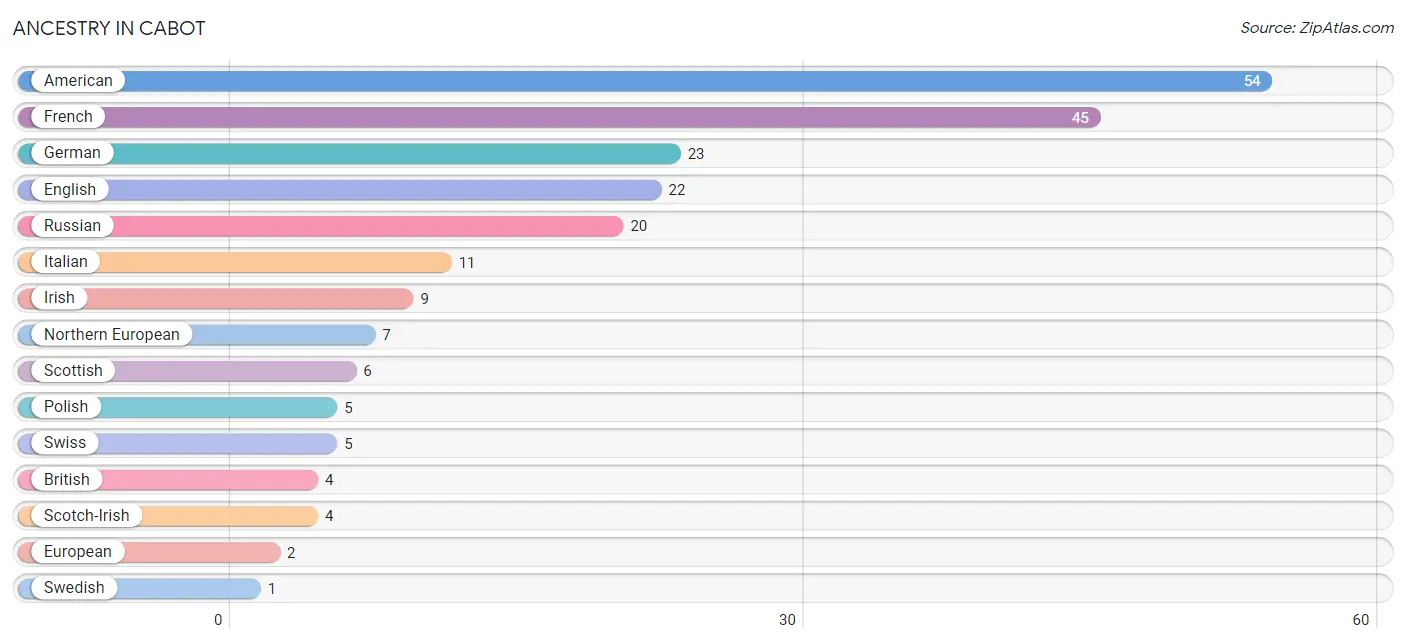
| Ancestry | # Population | % Population |
| American | 54 | 19.9% |
| British | 4 | 1.5% |
| English | 22 | 8.1% |
| European | 2 | 0.7% |
| French | 45 | 16.5% |
| German | 23 | 8.5% |
| Irish | 9 | 3.3% |
| Italian | 11 | 4.0% |
| Northern European | 7 | 2.6% |
| Polish | 5 | 1.8% |
| Russian | 20 | 7.3% |
| Scotch-Irish | 4 | 1.5% |
| Scottish | 6 | 2.2% |
| Swedish | 1 | 0.4% |
| Swiss | 5 | 1.8% | View All 15 Rows |
Immigrants in Cabot

| Immigration Origin | # Population | % Population | View All 0 Rows |
Sex and Age in Cabot
Sex and Age in Cabot
The most populous age groups in Cabot are 15 to 19 Years (27 | 23.3%) for men and 20 to 24 Years (30 | 19.2%) for women.
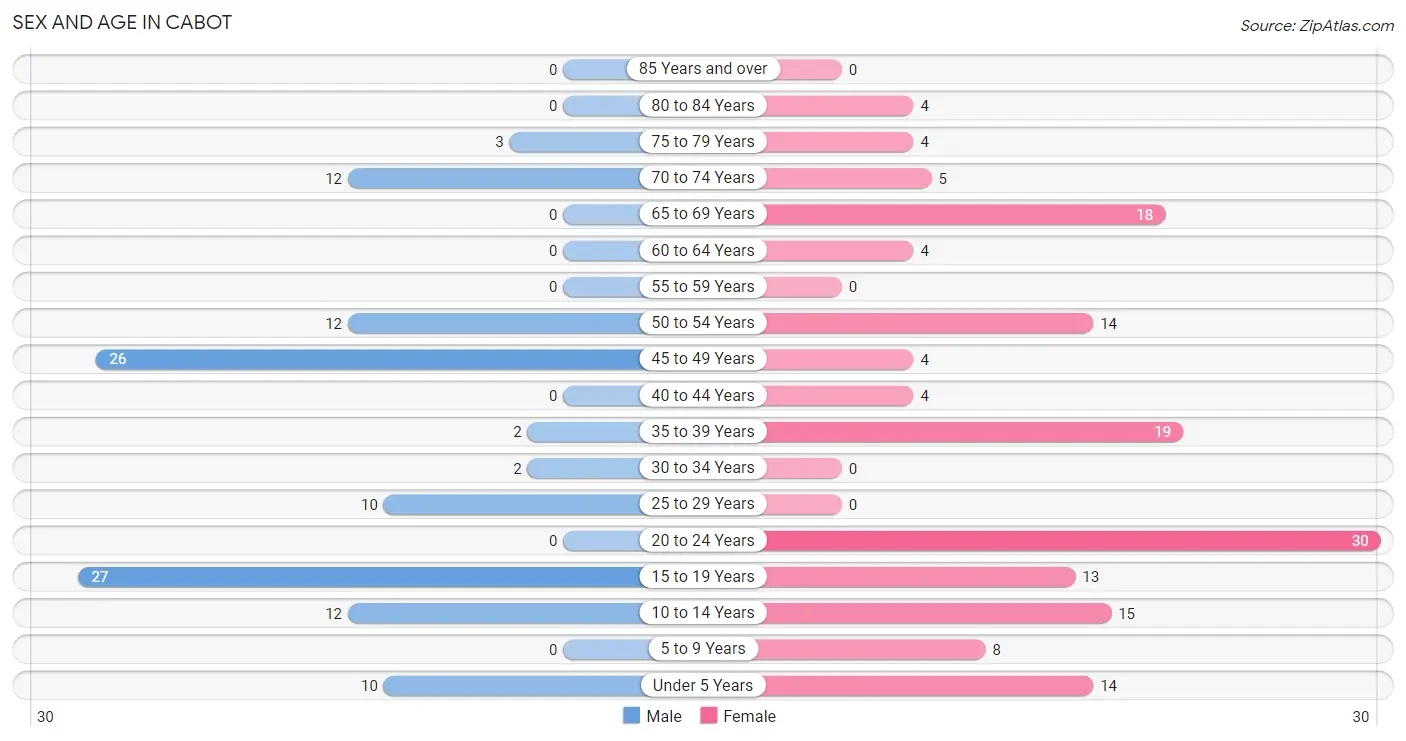
| Age Bracket | Male | Female |
| Under 5 Years | 10 (8.6%) | 14 (9.0%) |
| 5 to 9 Years | 0 (0.0%) | 8 (5.1%) |
| 10 to 14 Years | 12 (10.3%) | 15 (9.6%) |
| 15 to 19 Years | 27 (23.3%) | 13 (8.3%) |
| 20 to 24 Years | 0 (0.0%) | 30 (19.2%) |
| 25 to 29 Years | 10 (8.6%) | 0 (0.0%) |
| 30 to 34 Years | 2 (1.7%) | 0 (0.0%) |
| 35 to 39 Years | 2 (1.7%) | 19 (12.2%) |
| 40 to 44 Years | 0 (0.0%) | 4 (2.6%) |
| 45 to 49 Years | 26 (22.4%) | 4 (2.6%) |
| 50 to 54 Years | 12 (10.3%) | 14 (9.0%) |
| 55 to 59 Years | 0 (0.0%) | 0 (0.0%) |
| 60 to 64 Years | 0 (0.0%) | 4 (2.6%) |
| 65 to 69 Years | 0 (0.0%) | 18 (11.5%) |
| 70 to 74 Years | 12 (10.3%) | 5 (3.2%) |
| 75 to 79 Years | 3 (2.6%) | 4 (2.6%) |
| 80 to 84 Years | 0 (0.0%) | 4 (2.6%) |
| 85 Years and over | 0 (0.0%) | 0 (0.0%) |
| Total | 116 (100.0%) | 156 (100.0%) |
Families and Households in Cabot
Median Family Size in Cabot
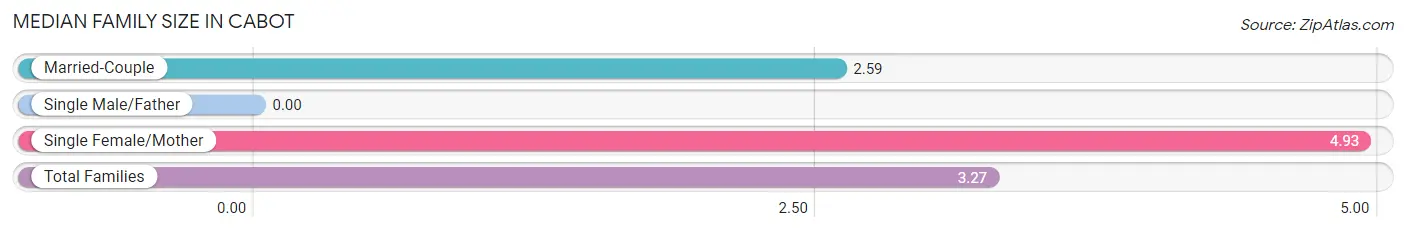
| Family Type | # Families | Family Size |
| Married-Couple | 37 (71.2%) | 2.59 |
| Single Male/Father | 0 (0.0%) | - |
| Single Female/Mother | 15 (28.8%) | 4.93 |
| Total Families | 52 (100.0%) | 3.27 |
Median Household Size in Cabot
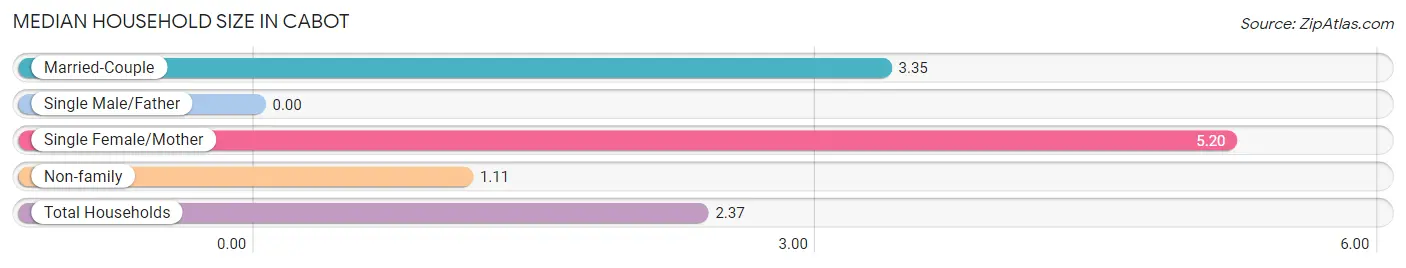
| Household Type | # Households | Household Size |
| Married-Couple | 37 (32.2%) | 3.35 |
| Single Male/Father | 0 (0.0%) | - |
| Single Female/Mother | 15 (13.0%) | 5.20 |
| Non-family | 63 (54.8%) | 1.11 |
| Total Households | 115 (100.0%) | 2.37 |
Household Size by Marriage Status in Cabot
Out of a total of 115 households in Cabot, 52 (45.2%) are family households, while 63 (54.8%) are nonfamily households. The most numerous type of family households are 6-person households, comprising 16, and the most common type of nonfamily households are 1-person households, comprising 55.
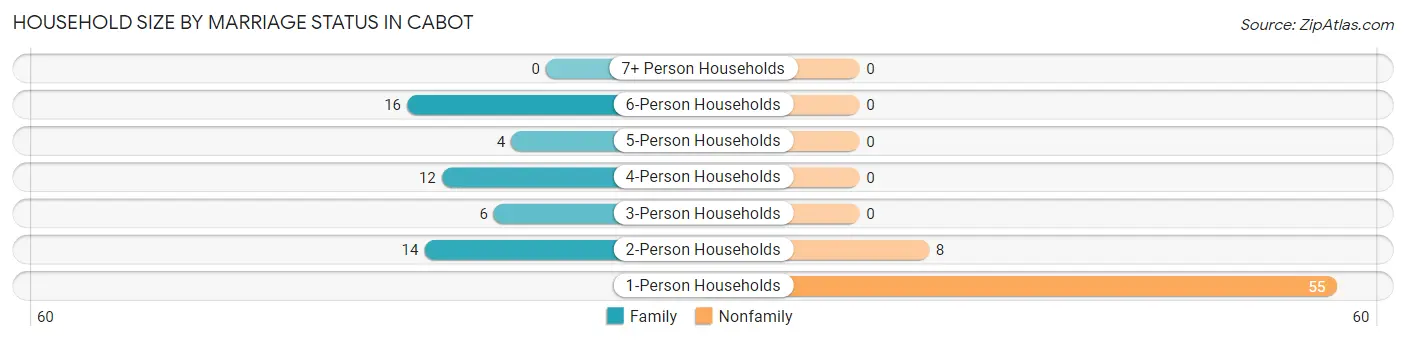
| Household Size | Family Households | Nonfamily Households |
| 1-Person Households | - | 55 (47.8%) |
| 2-Person Households | 14 (12.2%) | 8 (7.0%) |
| 3-Person Households | 6 (5.2%) | 0 (0.0%) |
| 4-Person Households | 12 (10.4%) | 0 (0.0%) |
| 5-Person Households | 4 (3.5%) | 0 (0.0%) |
| 6-Person Households | 16 (13.9%) | 0 (0.0%) |
| 7+ Person Households | 0 (0.0%) | 0 (0.0%) |
| Total | 52 (45.2%) | 63 (54.8%) |
Female Fertility in Cabot
Fertility by Age in Cabot
| Age Bracket | Women with Births | Births / 1,000 Women |
| 15 to 19 years | 0 (0.0%) | 0.0 |
| 20 to 34 years | 0 (0.0%) | 0.0 |
| 35 to 50 years | 0 (0.0%) | 0.0 |
| Total | 0 (0.0%) | 0.0 |
Fertility by Age by Marriage Status in Cabot
| Age Bracket | Married | Unmarried |
| 15 to 19 years | 0 (0.0%) | 0 (0.0%) |
| 20 to 34 years | 0 (0.0%) | 0 (0.0%) |
| 35 to 50 years | 0 (0.0%) | 0 (0.0%) |
| Total | 0 (0.0%) | 0 (0.0%) |
Fertility by Education in Cabot
| Educational Attainment | Women with Births | Births / 1,000 Women |
| Less than High School | 0 (0.0%) | 0.0 |
| High School Diploma | 0 (0.0%) | 0.0 |
| College or Associate's Degree | 0 (0.0%) | 0.0 |
| Bachelor's Degree | 0 (0.0%) | 0.0 |
| Graduate Degree | 0 (0.0%) | 0.0 |
| Total | 0 (0.0%) | 0.0 |
Fertility by Education by Marriage Status in Cabot
| Educational Attainment | Married | Unmarried |
| Less than High School | 0 (0.0%) | 0 (0.0%) |
| High School Diploma | 0 (0.0%) | 0 (0.0%) |
| College or Associate's Degree | 0 (0.0%) | 0 (0.0%) |
| Bachelor's Degree | 0 (0.0%) | 0 (0.0%) |
| Graduate Degree | 0 (0.0%) | 0 (0.0%) |
| Total | 0 (0.0%) | 0 (0.0%) |
Employment Characteristics in Cabot
Employment by Class of Employer in Cabot
Among the 109 employed individuals in Cabot, private company employees (69 | 63.3%), not-for-profit organizations (17 | 15.6%), and self-employed (not incorporated) (11 | 10.1%) make up the most common classes of employment.
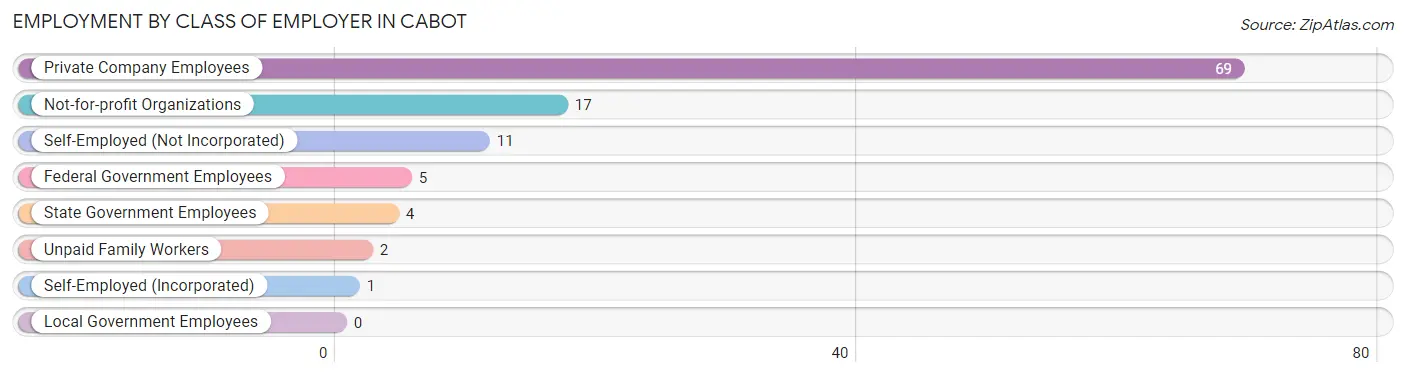
| Employer Class | # Employees | % Employees |
| Private Company Employees | 69 | 63.3% |
| Self-Employed (Incorporated) | 1 | 0.9% |
| Self-Employed (Not Incorporated) | 11 | 10.1% |
| Not-for-profit Organizations | 17 | 15.6% |
| Local Government Employees | 0 | 0.0% |
| State Government Employees | 4 | 3.7% |
| Federal Government Employees | 5 | 4.6% |
| Unpaid Family Workers | 2 | 1.8% |
| Total | 109 | 100.0% |
Employment Status by Age in Cabot
According to the labor force statistics for Cabot, out of the total population over 16 years of age (209), 57.4% or 120 individuals are in the labor force, with 9.2% or 11 of them unemployed. The age group with the highest labor force participation rate is 30 to 34 years, with 100.0% or 2 individuals in the labor force. Within the labor force, the 35 to 44 years age range has the highest percentage of unemployed individuals, with 44.0% or 11 of them being unemployed.
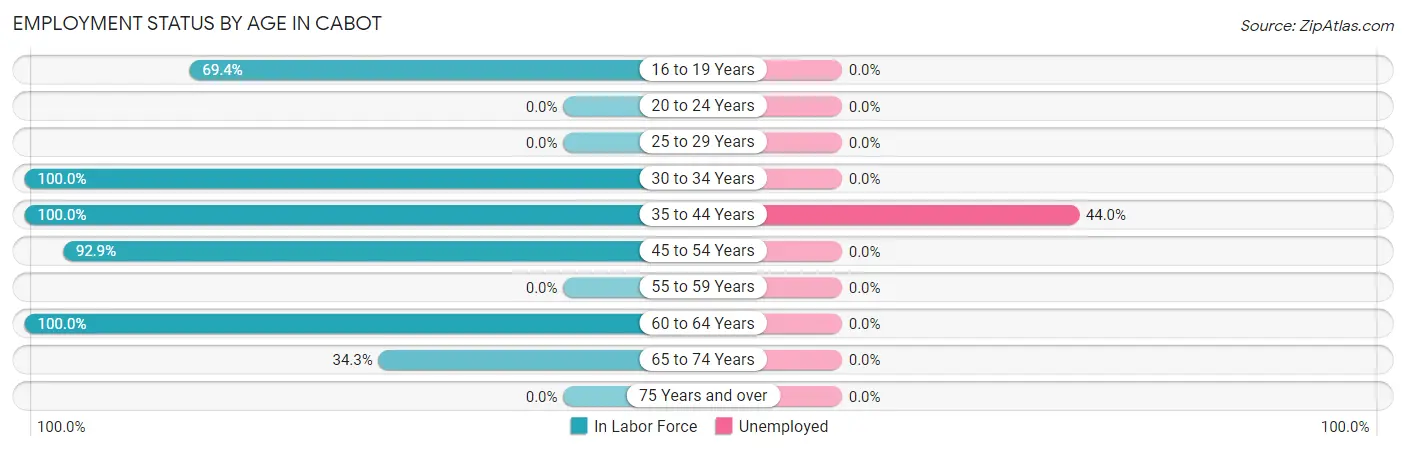
| Age Bracket | In Labor Force | Unemployed |
| 16 to 19 Years | 25 (69.4%) | 0 (0.0%) |
| 20 to 24 Years | 0 (0.0%) | 0 (0.0%) |
| 25 to 29 Years | 0 (0.0%) | 0 (0.0%) |
| 30 to 34 Years | 2 (100.0%) | 0 (0.0%) |
| 35 to 44 Years | 25 (100.0%) | 11 (44.0%) |
| 45 to 54 Years | 52 (92.9%) | 0 (0.0%) |
| 55 to 59 Years | 0 (0.0%) | 0 (0.0%) |
| 60 to 64 Years | 4 (100.0%) | 0 (0.0%) |
| 65 to 74 Years | 12 (34.3%) | 0 (0.0%) |
| 75 Years and over | 0 (0.0%) | 0 (0.0%) |
| Total | 120 (57.4%) | 11 (9.2%) |
Employment Status by Educational Attainment in Cabot
According to labor force statistics for Cabot, 85.6% of individuals (83) out of the total population between 25 and 64 years of age (97) are in the labor force, with 13.3% or 11 of them being unemployed. The group with the highest labor force participation rate are those with the educational attainment of college / associate degree, with 100.0% or 13 individuals in the labor force. Within the labor force, individuals with high school diploma education have the highest percentage of unemployment, with 22.0% or 11 of them being unemployed.
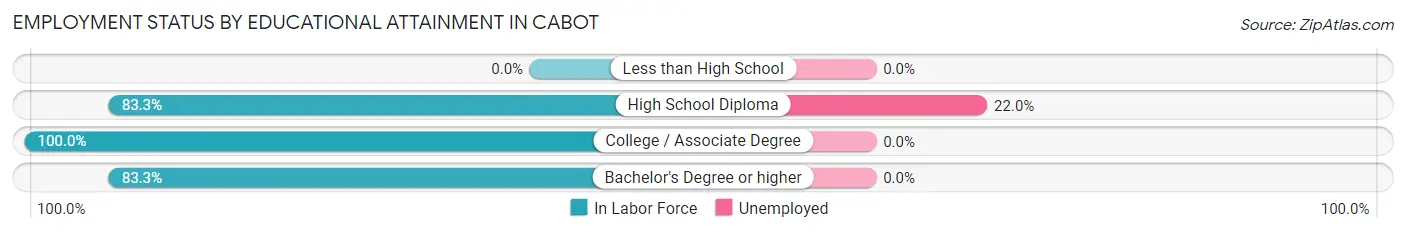
| Educational Attainment | In Labor Force | Unemployed |
| Less than High School | 0 (0.0%) | 0 (0.0%) |
| High School Diploma | 50 (83.3%) | 13 (22.0%) |
| College / Associate Degree | 13 (100.0%) | 0 (0.0%) |
| Bachelor's Degree or higher | 20 (83.3%) | 0 (0.0%) |
| Total | 83 (85.6%) | 13 (13.3%) |
Employment Occupations by Sex in Cabot
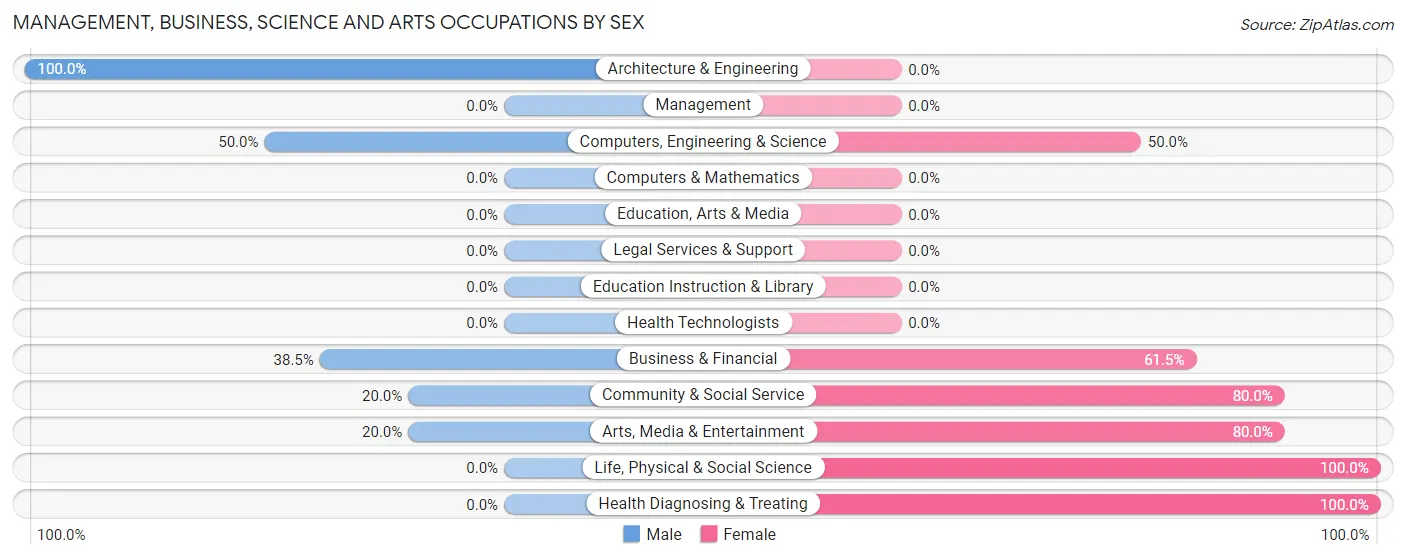
Management, Business, Science and Arts Occupations
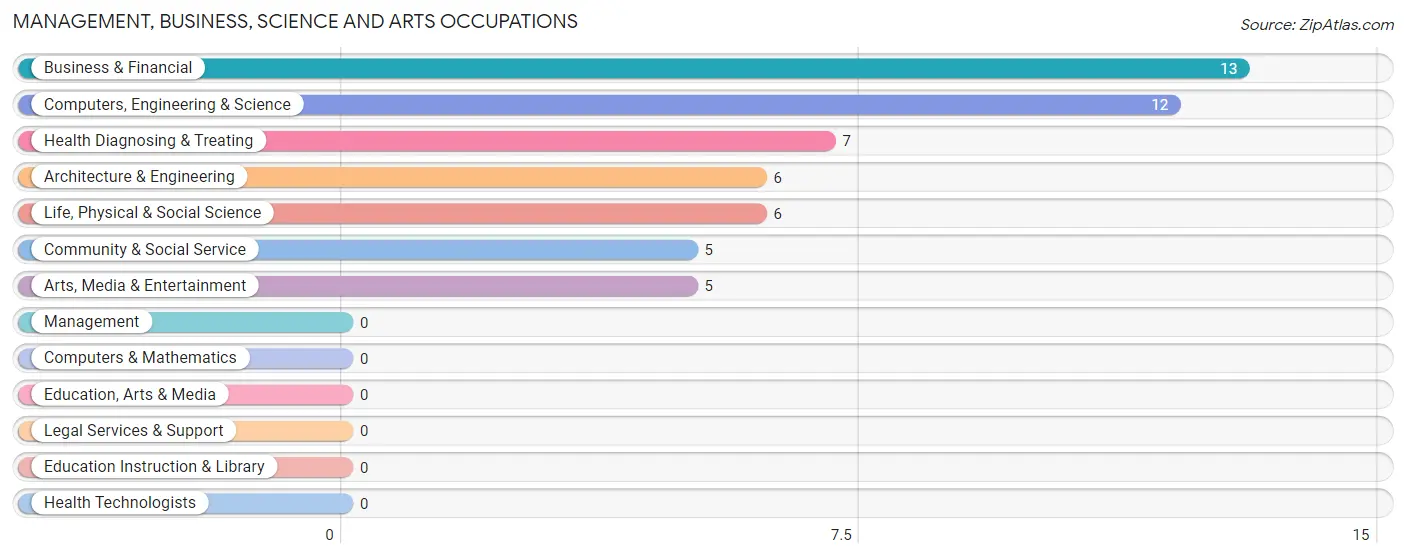
The most common Management, Business, Science and Arts occupations in Cabot are Business & Financial (13 | 11.9%), Computers, Engineering & Science (12 | 11.0%), Health Diagnosing & Treating (7 | 6.4%), Architecture & Engineering (6 | 5.5%), and Life, Physical & Social Science (6 | 5.5%).
Management, Business, Science and Arts Occupations by Sex
Within the Management, Business, Science and Arts occupations in Cabot, the most male-oriented occupations are Architecture & Engineering (100.0%), Computers, Engineering & Science (50.0%), and Business & Financial (38.5%), while the most female-oriented occupations are Life, Physical & Social Science (100.0%), Health Diagnosing & Treating (100.0%), and Community & Social Service (80.0%).
| Occupation | Male | Female |
| Management | 0 (0.0%) | 0 (0.0%) |
| Business & Financial | 5 (38.5%) | 8 (61.5%) |
| Computers, Engineering & Science | 6 (50.0%) | 6 (50.0%) |
| Computers & Mathematics | 0 (0.0%) | 0 (0.0%) |
| Architecture & Engineering | 6 (100.0%) | 0 (0.0%) |
| Life, Physical & Social Science | 0 (0.0%) | 6 (100.0%) |
| Community & Social Service | 1 (20.0%) | 4 (80.0%) |
| Education, Arts & Media | 0 (0.0%) | 0 (0.0%) |
| Legal Services & Support | 0 (0.0%) | 0 (0.0%) |
| Education Instruction & Library | 0 (0.0%) | 0 (0.0%) |
| Arts, Media & Entertainment | 1 (20.0%) | 4 (80.0%) |
| Health Diagnosing & Treating | 0 (0.0%) | 7 (100.0%) |
| Health Technologists | 0 (0.0%) | 0 (0.0%) |
| Total (Category) | 12 (32.4%) | 25 (67.6%) |
| Total (Overall) | 75 (68.8%) | 34 (31.2%) |
Services Occupations
Services Occupations by Sex
| Occupation | Male | Female |
| Healthcare Support | 0 (0.0%) | 0 (0.0%) |
| Security & Protection | 0 (0.0%) | 0 (0.0%) |
| Firefighting & Prevention | 0 (0.0%) | 0 (0.0%) |
| Law Enforcement | 0 (0.0%) | 0 (0.0%) |
| Food Preparation & Serving | 0 (0.0%) | 0 (0.0%) |
| Cleaning & Maintenance | 0 (0.0%) | 0 (0.0%) |
| Personal Care & Service | 0 (0.0%) | 0 (0.0%) |
| Total (Category) | 0 (0.0%) | 0 (0.0%) |
| Total (Overall) | 75 (68.8%) | 34 (31.2%) |
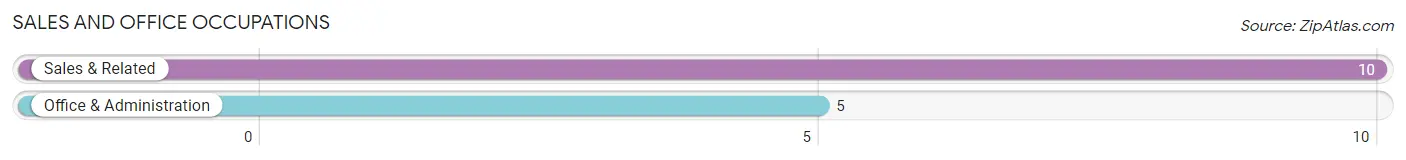
Sales and Office Occupations
The most common Sales and Office occupations in Cabot are Sales & Related (10 | 9.2%), and Office & Administration (5 | 4.6%).
Sales and Office Occupations by Sex
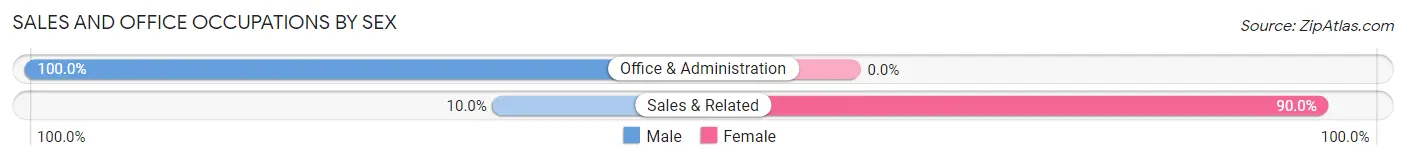
| Occupation | Male | Female |
| Sales & Related | 1 (10.0%) | 9 (90.0%) |
| Office & Administration | 5 (100.0%) | 0 (0.0%) |
| Total (Category) | 6 (40.0%) | 9 (60.0%) |
| Total (Overall) | 75 (68.8%) | 34 (31.2%) |
Natural Resources, Construction and Maintenance Occupations
The most common Natural Resources, Construction and Maintenance occupations in Cabot are Construction & Extraction (28 | 25.7%), and Installation, Maintenance & Repair (4 | 3.7%).
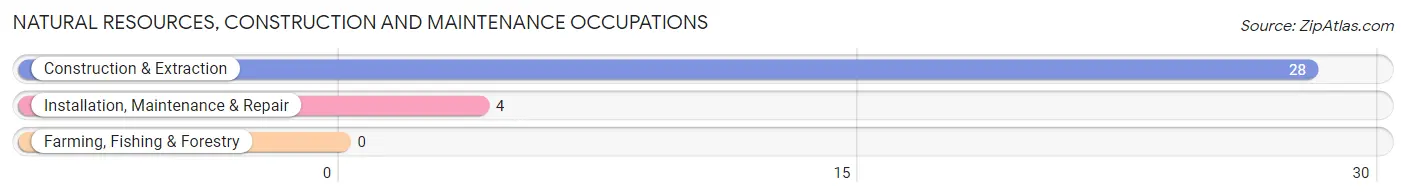
Natural Resources, Construction and Maintenance Occupations by Sex
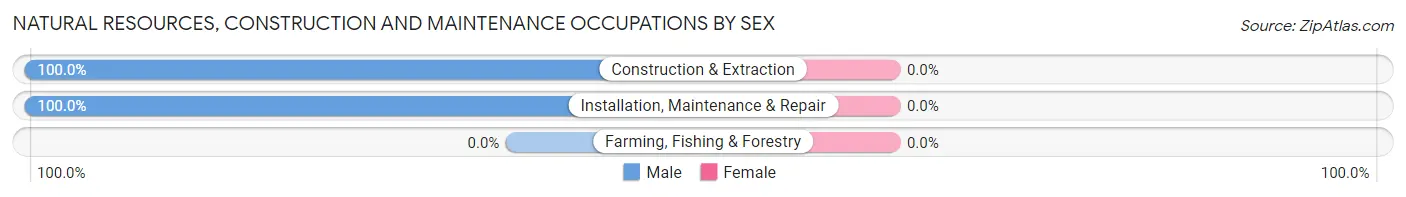
| Occupation | Male | Female |
| Farming, Fishing & Forestry | 0 (0.0%) | 0 (0.0%) |
| Construction & Extraction | 28 (100.0%) | 0 (0.0%) |
| Installation, Maintenance & Repair | 4 (100.0%) | 0 (0.0%) |
| Total (Category) | 32 (100.0%) | 0 (0.0%) |
| Total (Overall) | 75 (68.8%) | 34 (31.2%) |
Production, Transportation and Moving Occupations
The most common Production, Transportation and Moving occupations in Cabot are , and Production (25 | 22.9%).
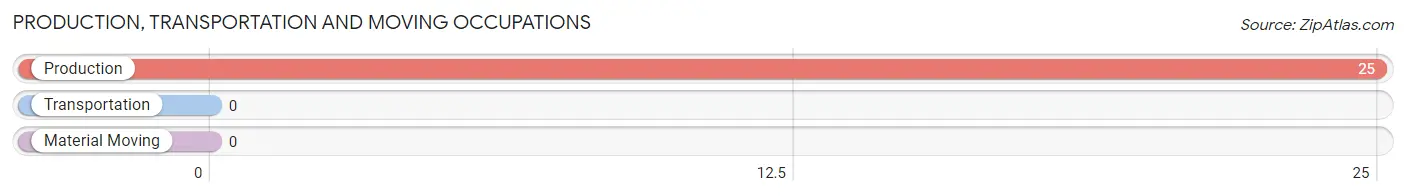
Production, Transportation and Moving Occupations by Sex
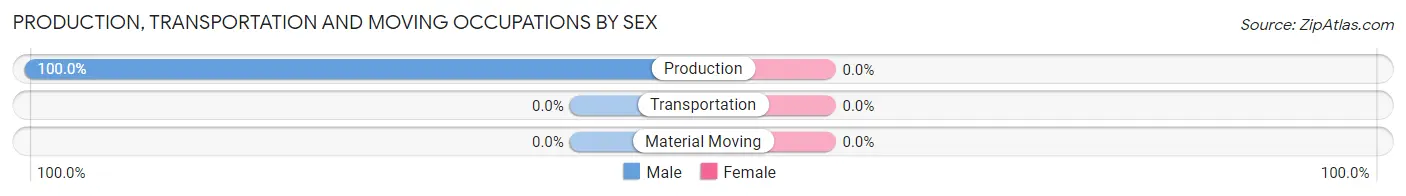
| Occupation | Male | Female |
| Production | 25 (100.0%) | 0 (0.0%) |
| Transportation | 0 (0.0%) | 0 (0.0%) |
| Material Moving | 0 (0.0%) | 0 (0.0%) |
| Total (Category) | 25 (100.0%) | 0 (0.0%) |
| Total (Overall) | 75 (68.8%) | 34 (31.2%) |
Employment Industries by Sex in Cabot
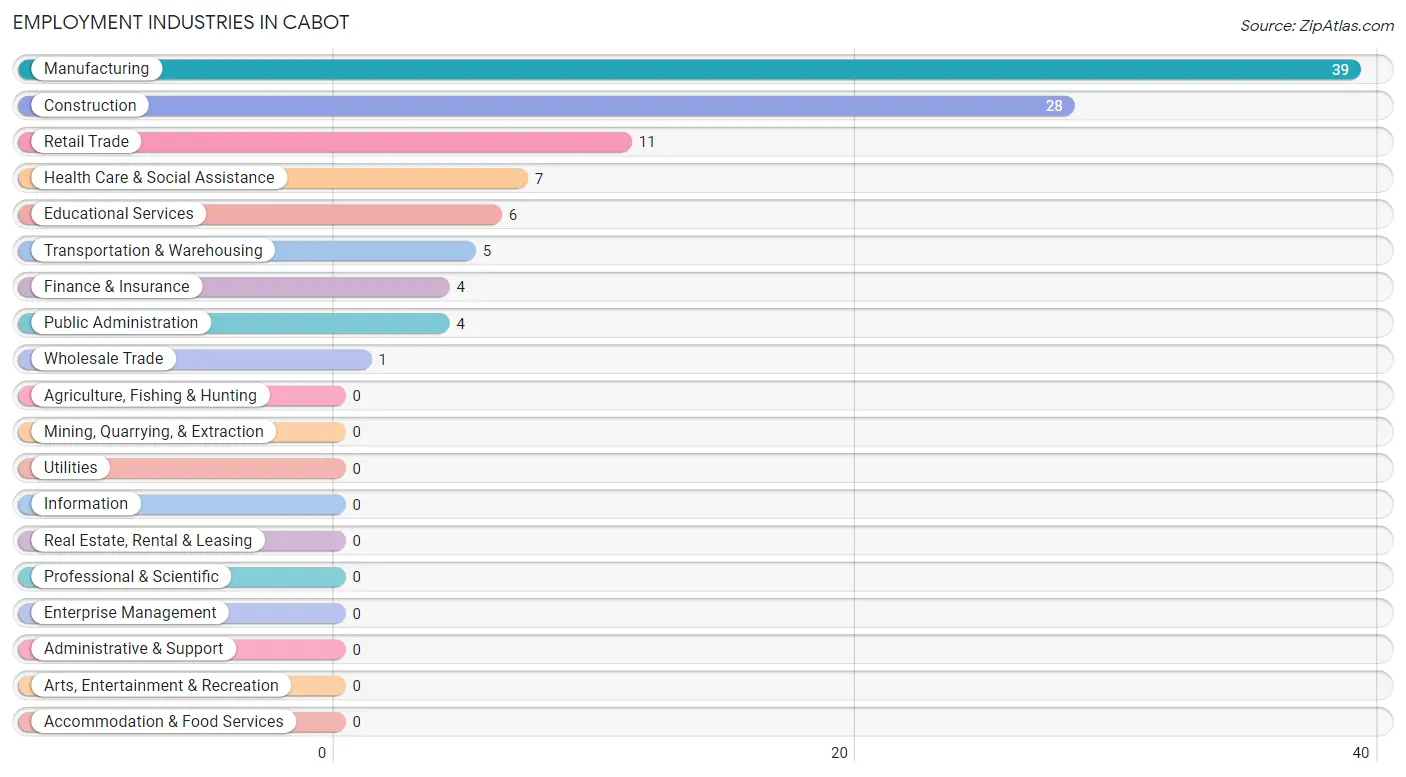
Employment Industries in Cabot
The major employment industries in Cabot include Manufacturing (39 | 35.8%), Construction (28 | 25.7%), Retail Trade (11 | 10.1%), Health Care & Social Assistance (7 | 6.4%), and Educational Services (6 | 5.5%).
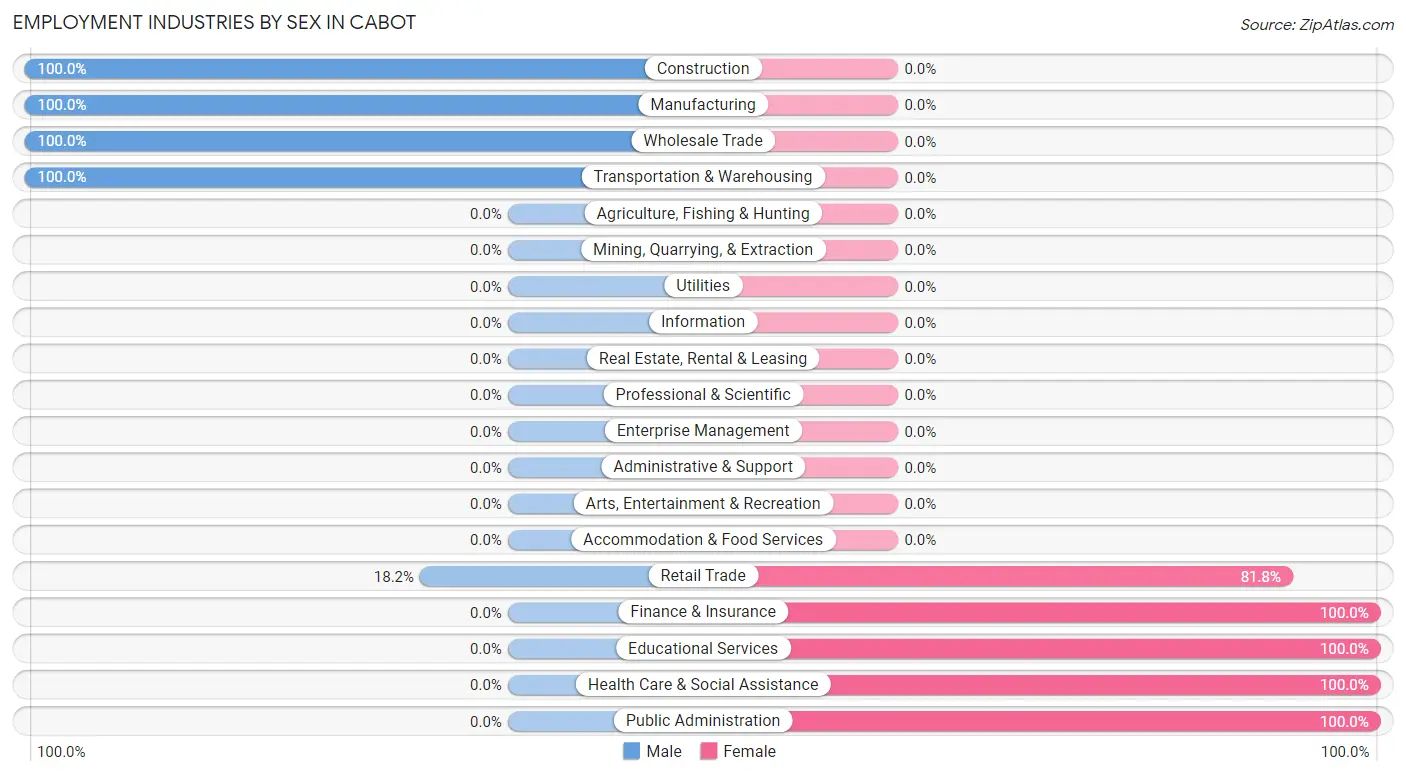
Employment Industries by Sex in Cabot
The Cabot industries that see more men than women are Construction (100.0%), Manufacturing (100.0%), and Wholesale Trade (100.0%), whereas the industries that tend to have a higher number of women are Finance & Insurance (100.0%), Educational Services (100.0%), and Health Care & Social Assistance (100.0%).
| Industry | Male | Female |
| Agriculture, Fishing & Hunting | 0 (0.0%) | 0 (0.0%) |
| Mining, Quarrying, & Extraction | 0 (0.0%) | 0 (0.0%) |
| Construction | 28 (100.0%) | 0 (0.0%) |
| Manufacturing | 39 (100.0%) | 0 (0.0%) |
| Wholesale Trade | 1 (100.0%) | 0 (0.0%) |
| Retail Trade | 2 (18.2%) | 9 (81.8%) |
| Transportation & Warehousing | 5 (100.0%) | 0 (0.0%) |
| Utilities | 0 (0.0%) | 0 (0.0%) |
| Information | 0 (0.0%) | 0 (0.0%) |
| Finance & Insurance | 0 (0.0%) | 4 (100.0%) |
| Real Estate, Rental & Leasing | 0 (0.0%) | 0 (0.0%) |
| Professional & Scientific | 0 (0.0%) | 0 (0.0%) |
| Enterprise Management | 0 (0.0%) | 0 (0.0%) |
| Administrative & Support | 0 (0.0%) | 0 (0.0%) |
| Educational Services | 0 (0.0%) | 6 (100.0%) |
| Health Care & Social Assistance | 0 (0.0%) | 7 (100.0%) |
| Arts, Entertainment & Recreation | 0 (0.0%) | 0 (0.0%) |
| Accommodation & Food Services | 0 (0.0%) | 0 (0.0%) |
| Public Administration | 0 (0.0%) | 4 (100.0%) |
| Total | 75 (68.8%) | 34 (31.2%) |
Education in Cabot
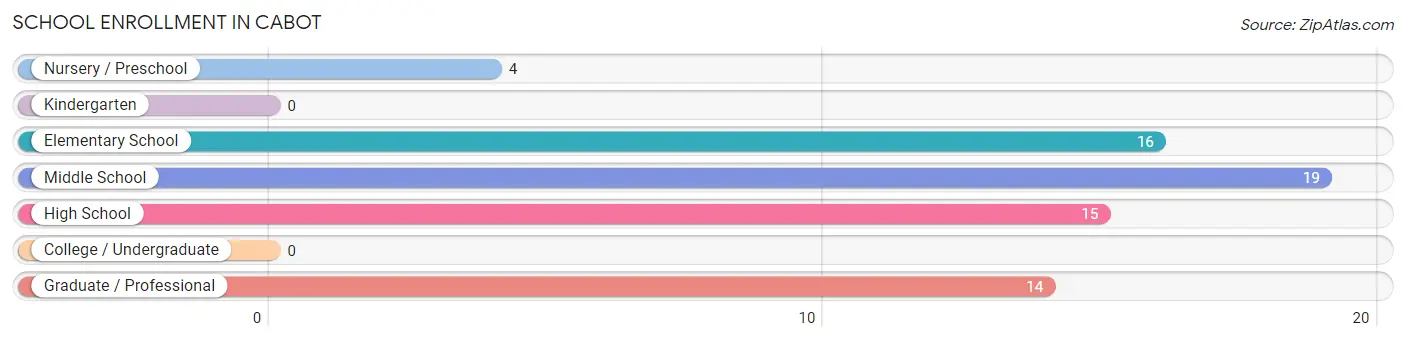
School Enrollment in Cabot
The most common levels of schooling among the 68 students in Cabot are middle school (19 | 27.9%), elementary school (16 | 23.5%), and high school (15 | 22.1%).
| School Level | # Students | % Students |
| Nursery / Preschool | 4 | 5.9% |
| Kindergarten | 0 | 0.0% |
| Elementary School | 16 | 23.5% |
| Middle School | 19 | 27.9% |
| High School | 15 | 22.1% |
| College / Undergraduate | 0 | 0.0% |
| Graduate / Professional | 14 | 20.6% |
| Total | 68 | 100.0% |
School Enrollment by Age by Funding Source in Cabot
Out of a total of 68 students who are enrolled in schools in Cabot, 18 (26.5%) attend a private institution, while the remaining 50 (73.5%) are enrolled in public schools. The age group of 20 to 24 year olds has the highest likelihood of being enrolled in private schools, with 14 (100.0% in the age bracket) enrolled. Conversely, the age group of 3 to 4 year olds has the lowest likelihood of being enrolled in a private school, with 4 (100.0% in the age bracket) attending a public institution.
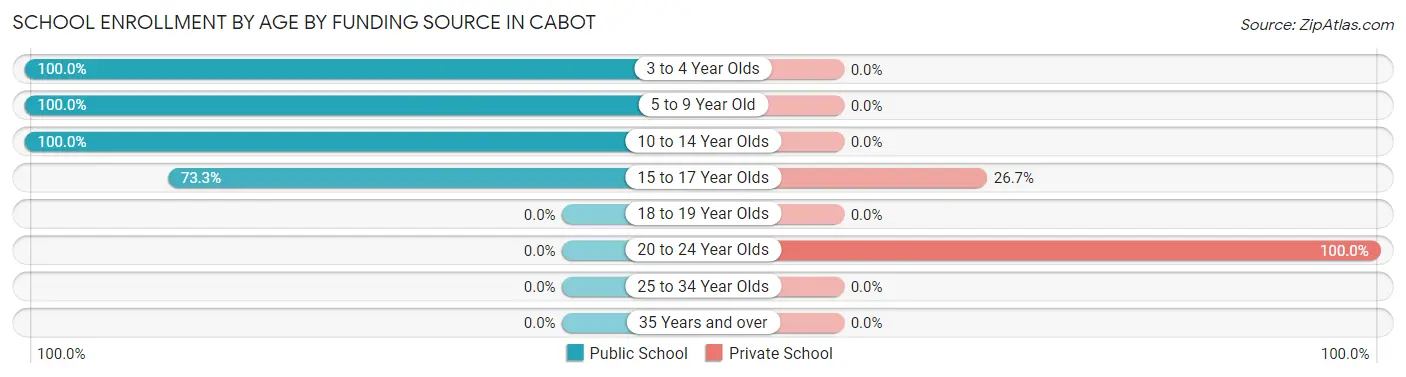
| Age Bracket | Public School | Private School |
| 3 to 4 Year Olds | 4 (100.0%) | 0 (0.0%) |
| 5 to 9 Year Old | 8 (100.0%) | 0 (0.0%) |
| 10 to 14 Year Olds | 27 (100.0%) | 0 (0.0%) |
| 15 to 17 Year Olds | 11 (73.3%) | 4 (26.7%) |
| 18 to 19 Year Olds | 0 (0.0%) | 0 (0.0%) |
| 20 to 24 Year Olds | 0 (0.0%) | 14 (100.0%) |
| 25 to 34 Year Olds | 0 (0.0%) | 0 (0.0%) |
| 35 Years and over | 0 (0.0%) | 0 (0.0%) |
| Total | 50 (73.5%) | 18 (26.5%) |
Educational Attainment by Field of Study in Cabot
Social sciences (13 | 27.7%), education (8 | 17.0%), liberal arts & history (7 | 14.9%), science & technology (5 | 10.6%), and bio, nature & agricultural (4 | 8.5%) are the most common fields of study among 47 individuals in Cabot who have obtained a bachelor's degree or higher.
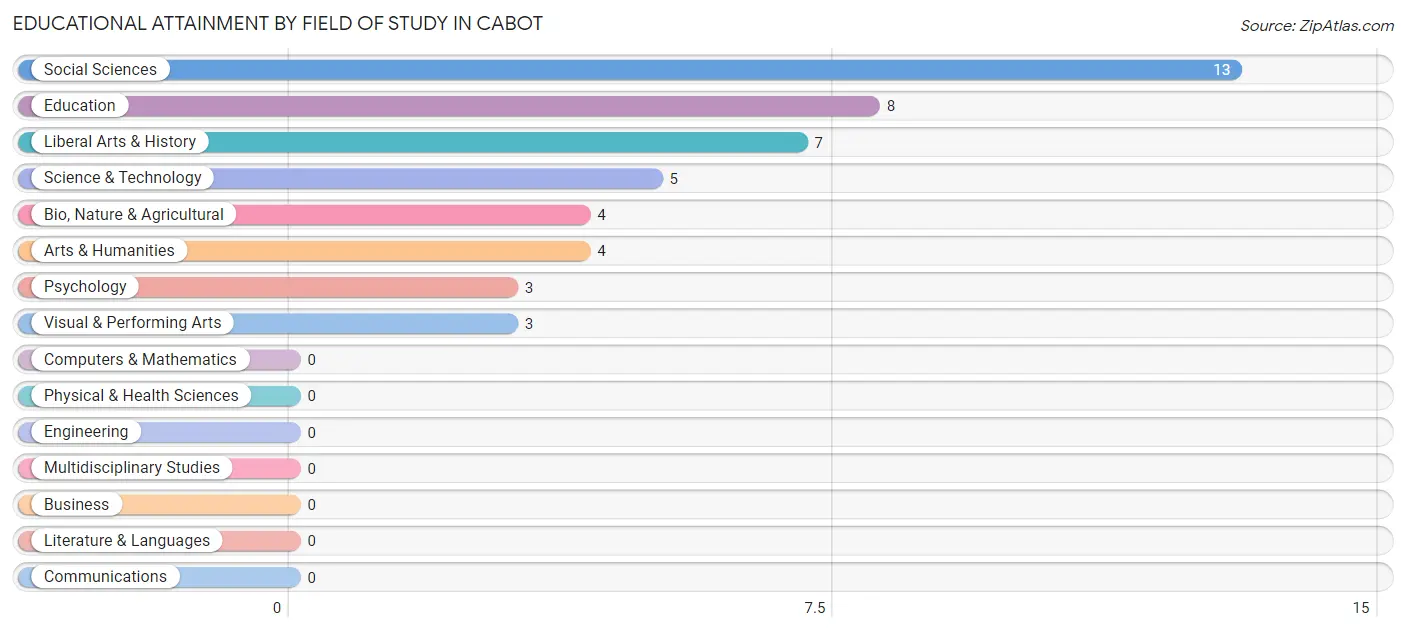
| Field of Study | # Graduates | % Graduates |
| Computers & Mathematics | 0 | 0.0% |
| Bio, Nature & Agricultural | 4 | 8.5% |
| Physical & Health Sciences | 0 | 0.0% |
| Psychology | 3 | 6.4% |
| Social Sciences | 13 | 27.7% |
| Engineering | 0 | 0.0% |
| Multidisciplinary Studies | 0 | 0.0% |
| Science & Technology | 5 | 10.6% |
| Business | 0 | 0.0% |
| Education | 8 | 17.0% |
| Literature & Languages | 0 | 0.0% |
| Liberal Arts & History | 7 | 14.9% |
| Visual & Performing Arts | 3 | 6.4% |
| Communications | 0 | 0.0% |
| Arts & Humanities | 4 | 8.5% |
| Total | 47 | 100.0% |
Transportation & Commute in Cabot
Vehicle Availability by Sex in Cabot
The most prevalent vehicle ownership categories in Cabot are males with 1 vehicle (38, accounting for 50.7%) and females with 1 vehicle (18, making up 111.8%).
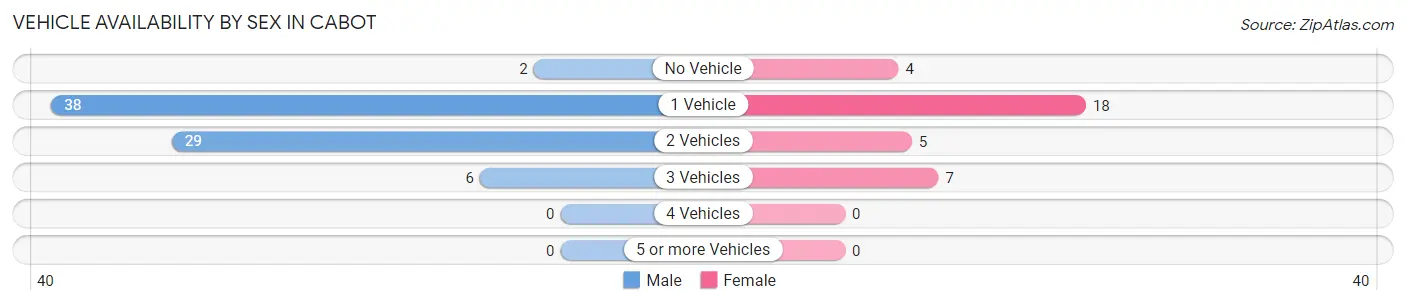
| Vehicles Available | Male | Female |
| No Vehicle | 2 (2.7%) | 4 (11.8%) |
| 1 Vehicle | 38 (50.7%) | 18 (52.9%) |
| 2 Vehicles | 29 (38.7%) | 5 (14.7%) |
| 3 Vehicles | 6 (8.0%) | 7 (20.6%) |
| 4 Vehicles | 0 (0.0%) | 0 (0.0%) |
| 5 or more Vehicles | 0 (0.0%) | 0 (0.0%) |
| Total | 75 (100.0%) | 34 (100.0%) |
Commute Time in Cabot
The most frequently occuring commute durations in Cabot are less than 5 minutes (27 commuters, 36.0%), 60 to 89 minutes (17 commuters, 22.7%), and 40 to 44 minutes (10 commuters, 13.3%).
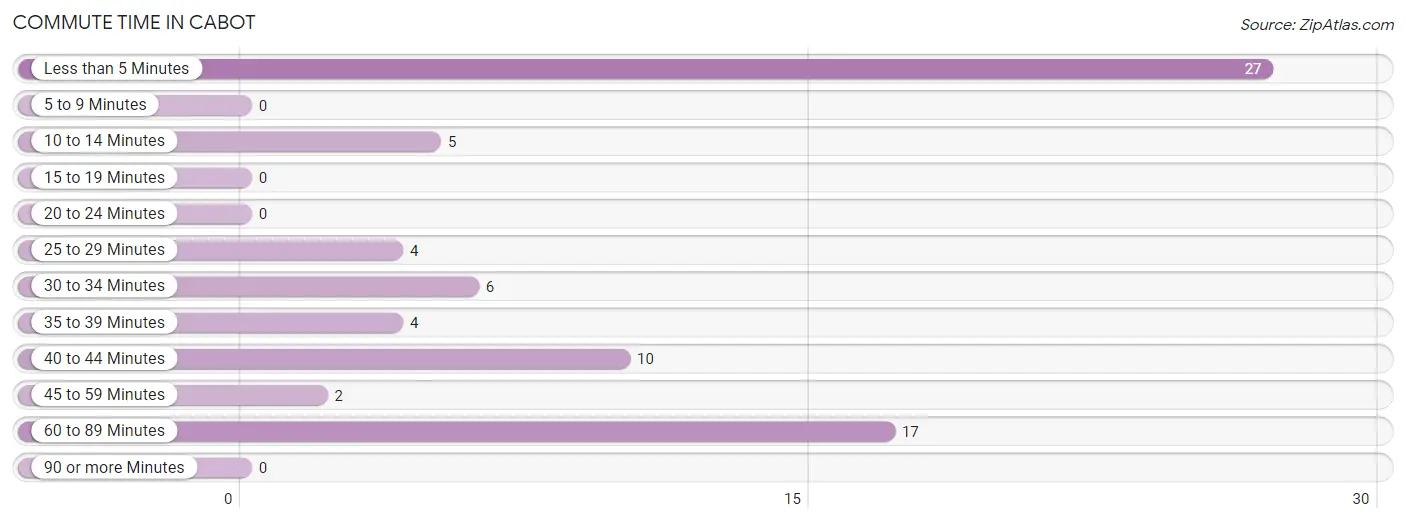
| Commute Time | # Commuters | % Commuters |
| Less than 5 Minutes | 27 | 36.0% |
| 5 to 9 Minutes | 0 | 0.0% |
| 10 to 14 Minutes | 5 | 6.7% |
| 15 to 19 Minutes | 0 | 0.0% |
| 20 to 24 Minutes | 0 | 0.0% |
| 25 to 29 Minutes | 4 | 5.3% |
| 30 to 34 Minutes | 6 | 8.0% |
| 35 to 39 Minutes | 4 | 5.3% |
| 40 to 44 Minutes | 10 | 13.3% |
| 45 to 59 Minutes | 2 | 2.7% |
| 60 to 89 Minutes | 17 | 22.7% |
| 90 or more Minutes | 0 | 0.0% |
Commute Time by Sex in Cabot
The most common commute times in Cabot are less than 5 minutes (27 commuters, 46.6%) for males and 25 to 29 minutes (4 commuters, 23.5%) for females.
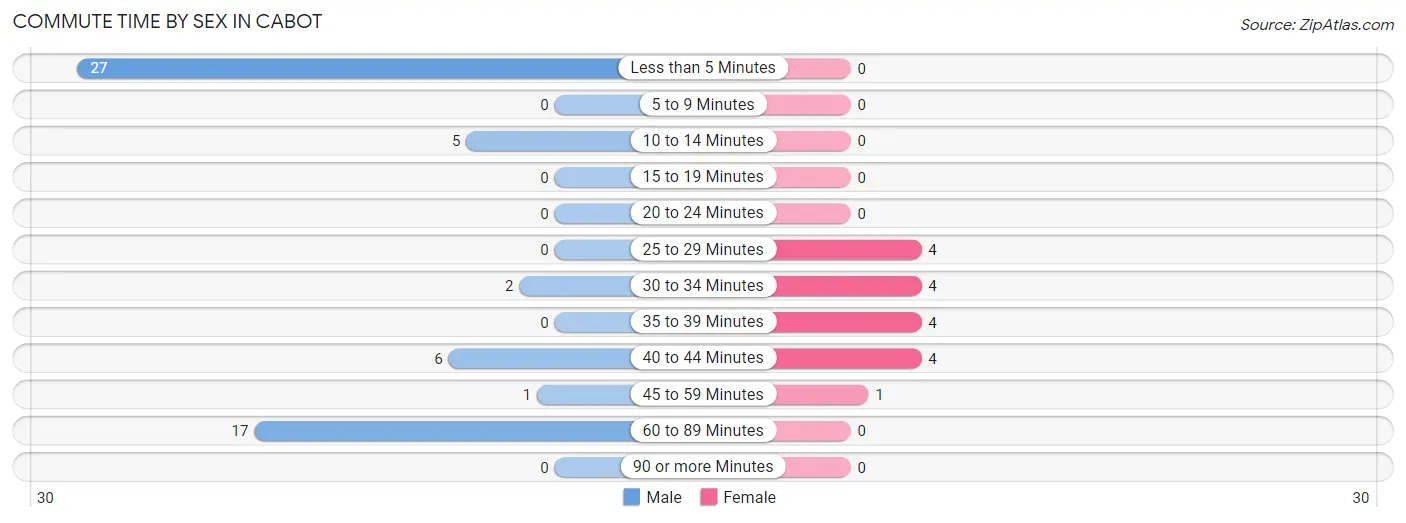
| Commute Time | Male | Female |
| Less than 5 Minutes | 27 (46.6%) | 0 (0.0%) |
| 5 to 9 Minutes | 0 (0.0%) | 0 (0.0%) |
| 10 to 14 Minutes | 5 (8.6%) | 0 (0.0%) |
| 15 to 19 Minutes | 0 (0.0%) | 0 (0.0%) |
| 20 to 24 Minutes | 0 (0.0%) | 0 (0.0%) |
| 25 to 29 Minutes | 0 (0.0%) | 4 (23.5%) |
| 30 to 34 Minutes | 2 (3.5%) | 4 (23.5%) |
| 35 to 39 Minutes | 0 (0.0%) | 4 (23.5%) |
| 40 to 44 Minutes | 6 (10.3%) | 4 (23.5%) |
| 45 to 59 Minutes | 1 (1.7%) | 1 (5.9%) |
| 60 to 89 Minutes | 17 (29.3%) | 0 (0.0%) |
| 90 or more Minutes | 0 (0.0%) | 0 (0.0%) |
Time of Departure to Work by Sex in Cabot
The most frequent times of departure to work in Cabot are 4:00 PM to 11:59 PM (25, 43.1%) for males and 8:00 AM to 8:29 AM (5, 29.4%) for females.
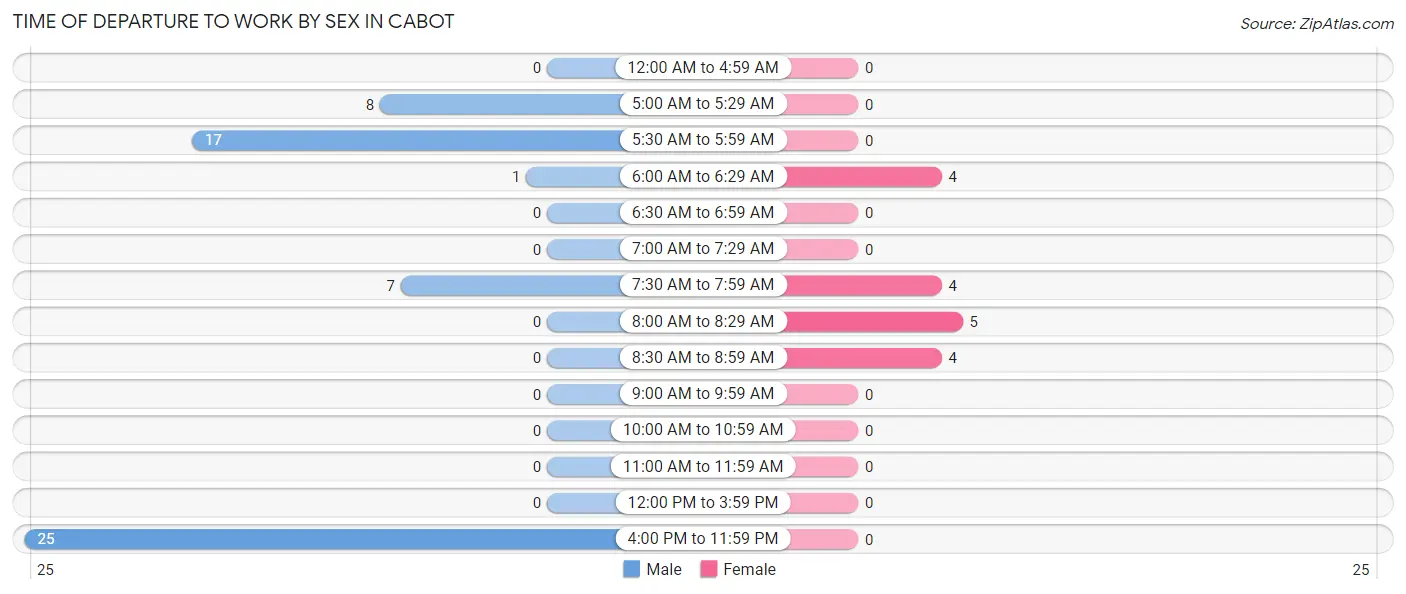
| Time of Departure | Male | Female |
| 12:00 AM to 4:59 AM | 0 (0.0%) | 0 (0.0%) |
| 5:00 AM to 5:29 AM | 8 (13.8%) | 0 (0.0%) |
| 5:30 AM to 5:59 AM | 17 (29.3%) | 0 (0.0%) |
| 6:00 AM to 6:29 AM | 1 (1.7%) | 4 (23.5%) |
| 6:30 AM to 6:59 AM | 0 (0.0%) | 0 (0.0%) |
| 7:00 AM to 7:29 AM | 0 (0.0%) | 0 (0.0%) |
| 7:30 AM to 7:59 AM | 7 (12.1%) | 4 (23.5%) |
| 8:00 AM to 8:29 AM | 0 (0.0%) | 5 (29.4%) |
| 8:30 AM to 8:59 AM | 0 (0.0%) | 4 (23.5%) |
| 9:00 AM to 9:59 AM | 0 (0.0%) | 0 (0.0%) |
| 10:00 AM to 10:59 AM | 0 (0.0%) | 0 (0.0%) |
| 11:00 AM to 11:59 AM | 0 (0.0%) | 0 (0.0%) |
| 12:00 PM to 3:59 PM | 0 (0.0%) | 0 (0.0%) |
| 4:00 PM to 11:59 PM | 25 (43.1%) | 0 (0.0%) |
| Total | 58 (100.0%) | 17 (100.0%) |
Housing Occupancy in Cabot
Occupancy by Ownership in Cabot
Of the total 115 dwellings in Cabot, owner-occupied units account for 82 (71.3%), while renter-occupied units make up 33 (28.7%).
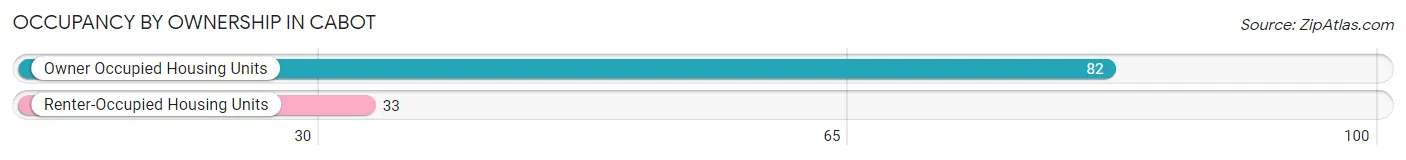
| Occupancy | # Housing Units | % Housing Units |
| Owner Occupied Housing Units | 82 | 71.3% |
| Renter-Occupied Housing Units | 33 | 28.7% |
| Total Occupied Housing Units | 115 | 100.0% |
Occupancy by Household Size in Cabot
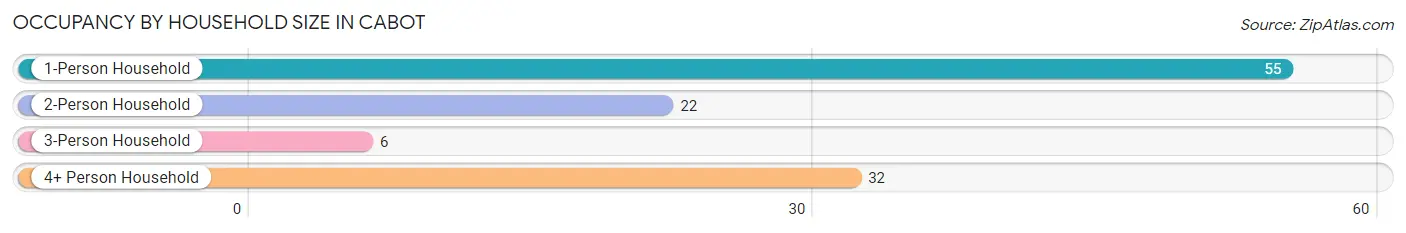
| Household Size | # Housing Units | % Housing Units |
| 1-Person Household | 55 | 47.8% |
| 2-Person Household | 22 | 19.1% |
| 3-Person Household | 6 | 5.2% |
| 4+ Person Household | 32 | 27.8% |
| Total Housing Units | 115 | 100.0% |
Occupancy by Ownership by Household Size in Cabot
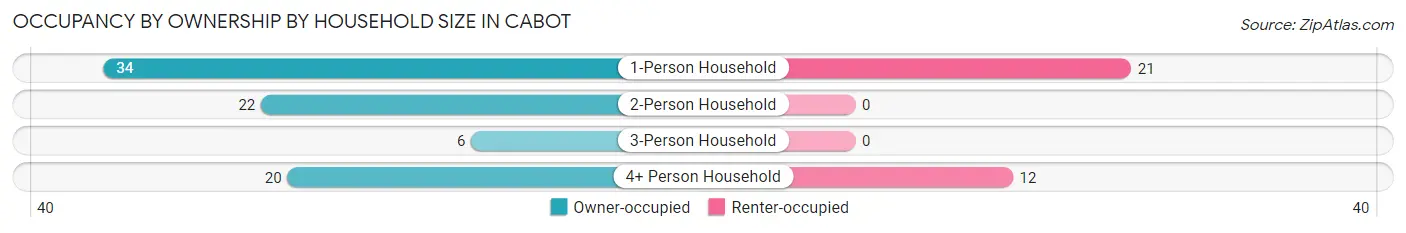
| Household Size | Owner-occupied | Renter-occupied |
| 1-Person Household | 34 (61.8%) | 21 (38.2%) |
| 2-Person Household | 22 (100.0%) | 0 (0.0%) |
| 3-Person Household | 6 (100.0%) | 0 (0.0%) |
| 4+ Person Household | 20 (62.5%) | 12 (37.5%) |
| Total Housing Units | 82 (71.3%) | 33 (28.7%) |
Occupancy by Educational Attainment in Cabot
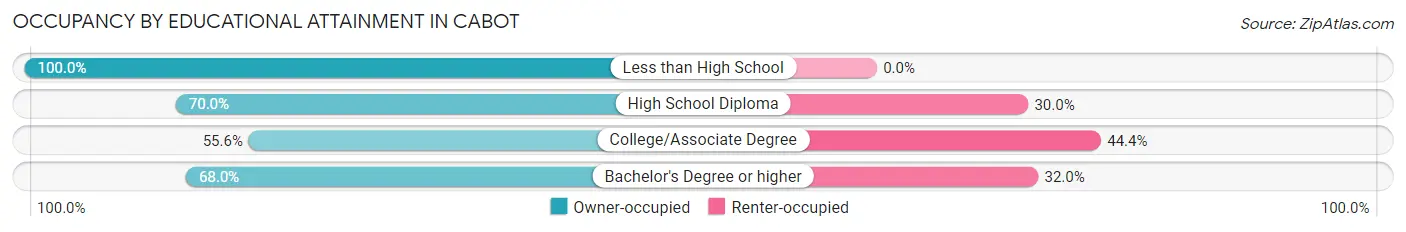
| Household Size | Owner-occupied | Renter-occupied |
| Less than High School | 11 (100.0%) | 0 (0.0%) |
| High School Diploma | 49 (70.0%) | 21 (30.0%) |
| College/Associate Degree | 5 (55.6%) | 4 (44.4%) |
| Bachelor's Degree or higher | 17 (68.0%) | 8 (32.0%) |
Occupancy by Age of Householder in Cabot
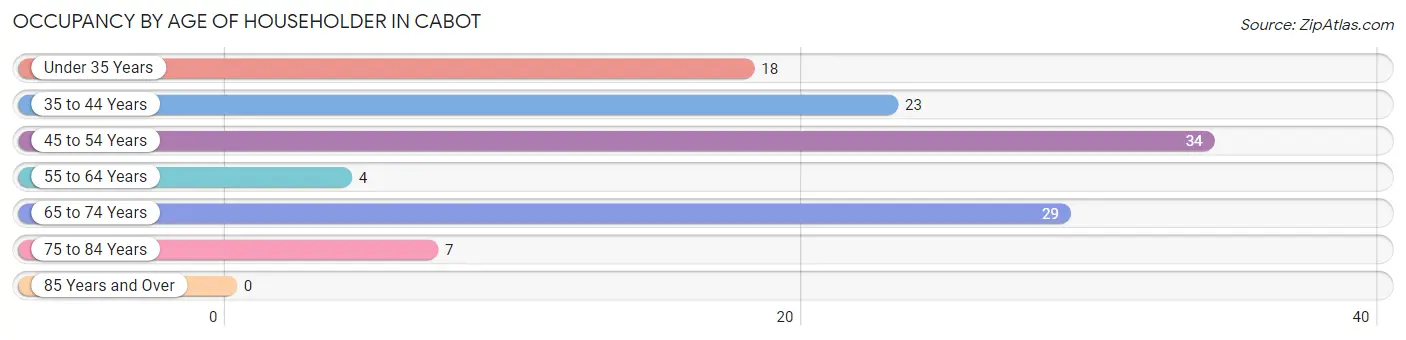
| Age Bracket | # Households | % Households |
| Under 35 Years | 18 | 15.7% |
| 35 to 44 Years | 23 | 20.0% |
| 45 to 54 Years | 34 | 29.6% |
| 55 to 64 Years | 4 | 3.5% |
| 65 to 74 Years | 29 | 25.2% |
| 75 to 84 Years | 7 | 6.1% |
| 85 Years and Over | 0 | 0.0% |
| Total | 115 | 100.0% |
Housing Finances in Cabot
Median Income by Occupancy in Cabot
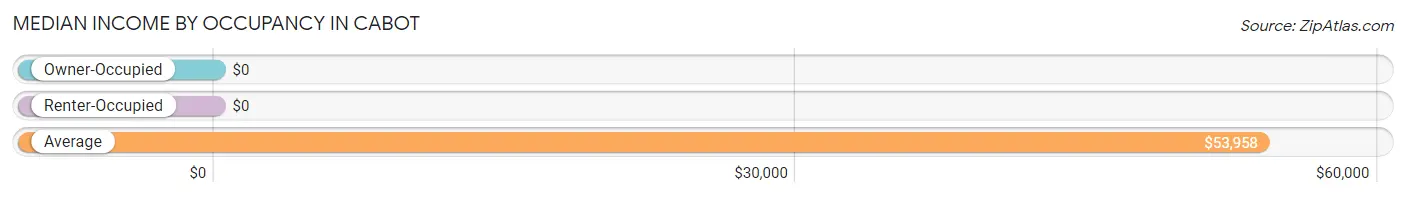
| Occupancy Type | # Households | Median Income |
| Owner-Occupied | 82 (71.3%) | $0 |
| Renter-Occupied | 33 (28.7%) | $0 |
| Average | 115 (100.0%) | $53,958 |
Occupancy by Householder Income Bracket in Cabot
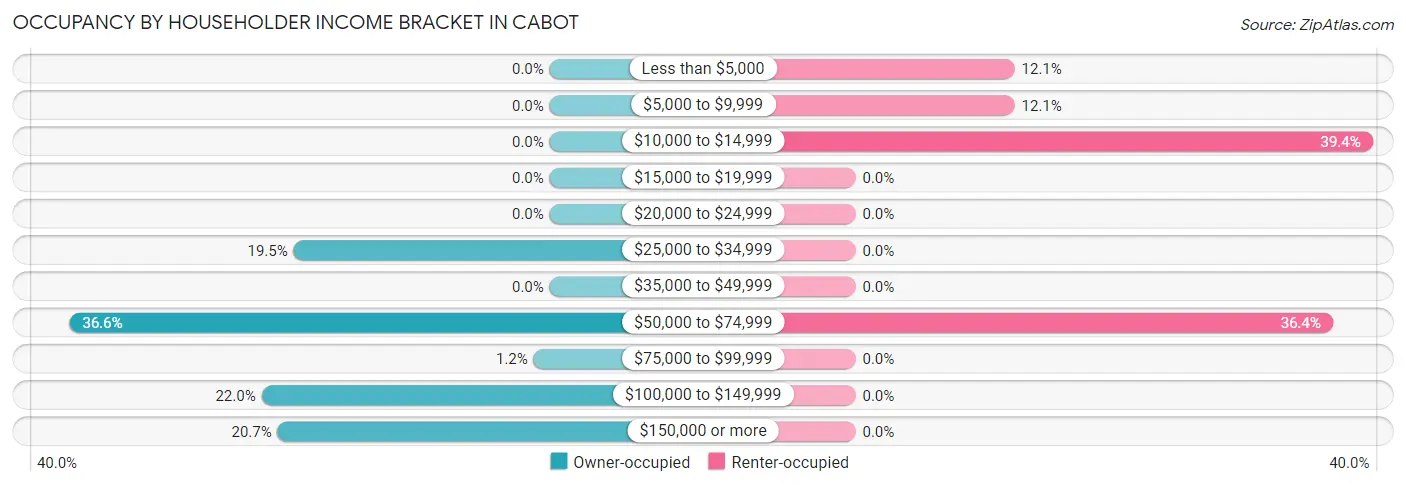
| Income Bracket | Owner-occupied | Renter-occupied |
| Less than $5,000 | 0 (0.0%) | 4 (12.1%) |
| $5,000 to $9,999 | 0 (0.0%) | 4 (12.1%) |
| $10,000 to $14,999 | 0 (0.0%) | 13 (39.4%) |
| $15,000 to $19,999 | 0 (0.0%) | 0 (0.0%) |
| $20,000 to $24,999 | 0 (0.0%) | 0 (0.0%) |
| $25,000 to $34,999 | 16 (19.5%) | 0 (0.0%) |
| $35,000 to $49,999 | 0 (0.0%) | 0 (0.0%) |
| $50,000 to $74,999 | 30 (36.6%) | 12 (36.4%) |
| $75,000 to $99,999 | 1 (1.2%) | 0 (0.0%) |
| $100,000 to $149,999 | 18 (22.0%) | 0 (0.0%) |
| $150,000 or more | 17 (20.7%) | 0 (0.0%) |
| Total | 82 (100.0%) | 33 (100.0%) |
Monthly Housing Cost Tiers in Cabot
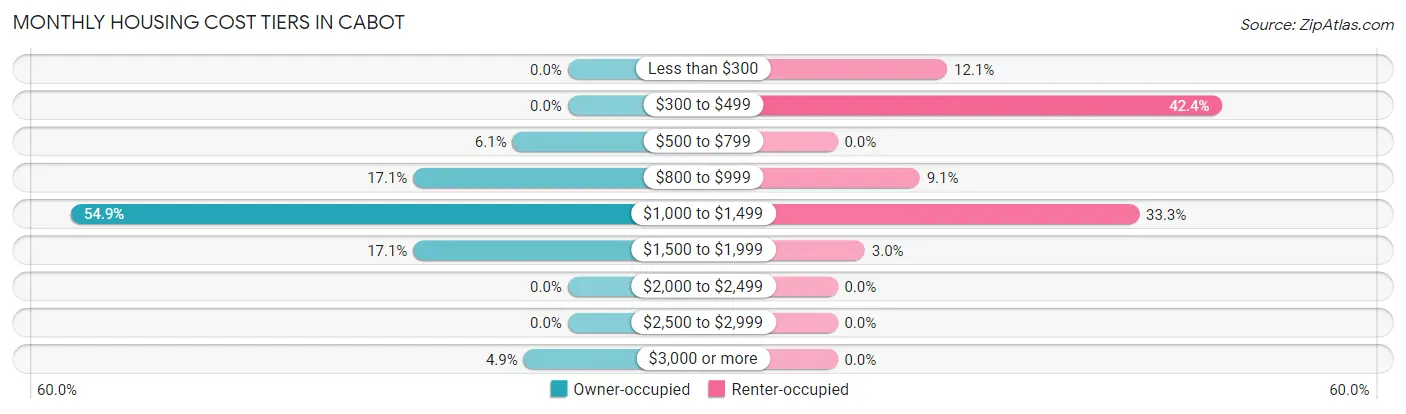
| Monthly Cost | Owner-occupied | Renter-occupied |
| Less than $300 | 0 (0.0%) | 4 (12.1%) |
| $300 to $499 | 0 (0.0%) | 14 (42.4%) |
| $500 to $799 | 5 (6.1%) | 0 (0.0%) |
| $800 to $999 | 14 (17.1%) | 3 (9.1%) |
| $1,000 to $1,499 | 45 (54.9%) | 11 (33.3%) |
| $1,500 to $1,999 | 14 (17.1%) | 1 (3.0%) |
| $2,000 to $2,499 | 0 (0.0%) | 0 (0.0%) |
| $2,500 to $2,999 | 0 (0.0%) | 0 (0.0%) |
| $3,000 or more | 4 (4.9%) | 0 (0.0%) |
| Total | 82 (100.0%) | 33 (100.0%) |
Physical Housing Characteristics in Cabot
Housing Structures in Cabot
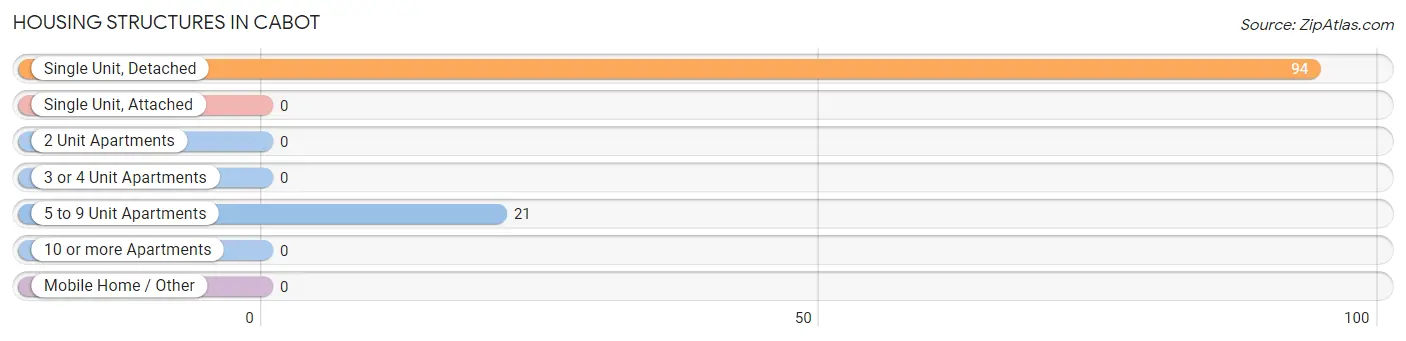
| Structure Type | # Housing Units | % Housing Units |
| Single Unit, Detached | 94 | 81.7% |
| Single Unit, Attached | 0 | 0.0% |
| 2 Unit Apartments | 0 | 0.0% |
| 3 or 4 Unit Apartments | 0 | 0.0% |
| 5 to 9 Unit Apartments | 21 | 18.3% |
| 10 or more Apartments | 0 | 0.0% |
| Mobile Home / Other | 0 | 0.0% |
| Total | 115 | 100.0% |
Housing Structures by Occupancy in Cabot
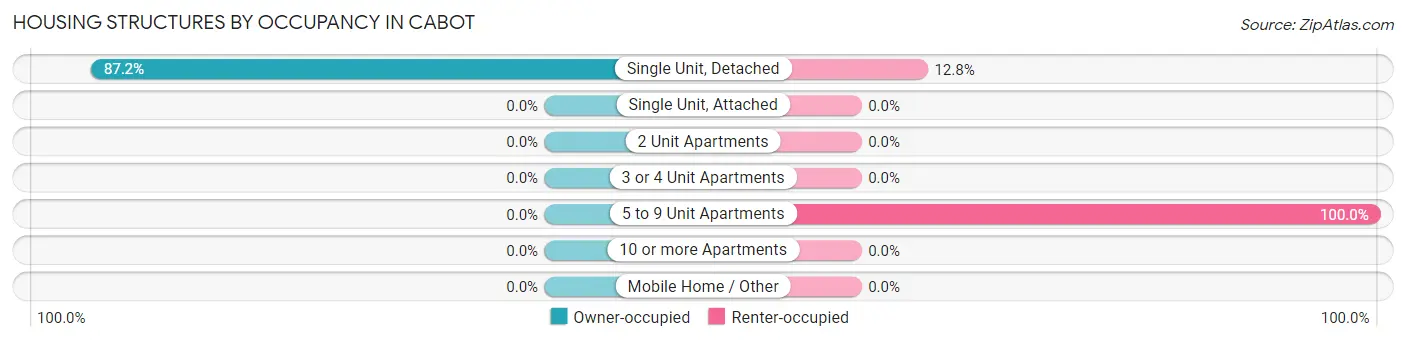
| Structure Type | Owner-occupied | Renter-occupied |
| Single Unit, Detached | 82 (87.2%) | 12 (12.8%) |
| Single Unit, Attached | 0 (0.0%) | 0 (0.0%) |
| 2 Unit Apartments | 0 (0.0%) | 0 (0.0%) |
| 3 or 4 Unit Apartments | 0 (0.0%) | 0 (0.0%) |
| 5 to 9 Unit Apartments | 0 (0.0%) | 21 (100.0%) |
| 10 or more Apartments | 0 (0.0%) | 0 (0.0%) |
| Mobile Home / Other | 0 (0.0%) | 0 (0.0%) |
| Total | 82 (71.3%) | 33 (28.7%) |
Housing Structures by Number of Rooms in Cabot
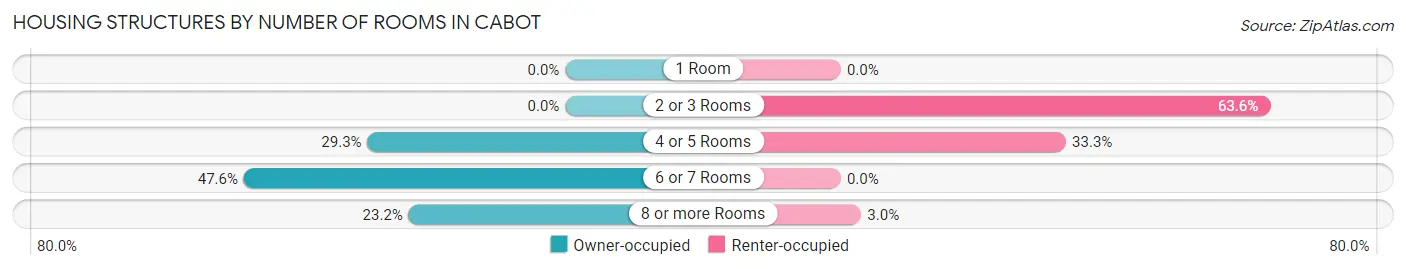
| Number of Rooms | Owner-occupied | Renter-occupied |
| 1 Room | 0 (0.0%) | 0 (0.0%) |
| 2 or 3 Rooms | 0 (0.0%) | 21 (63.6%) |
| 4 or 5 Rooms | 24 (29.3%) | 11 (33.3%) |
| 6 or 7 Rooms | 39 (47.6%) | 0 (0.0%) |
| 8 or more Rooms | 19 (23.2%) | 1 (3.0%) |
| Total | 82 (100.0%) | 33 (100.0%) |
Housing Structure by Heating Type in Cabot
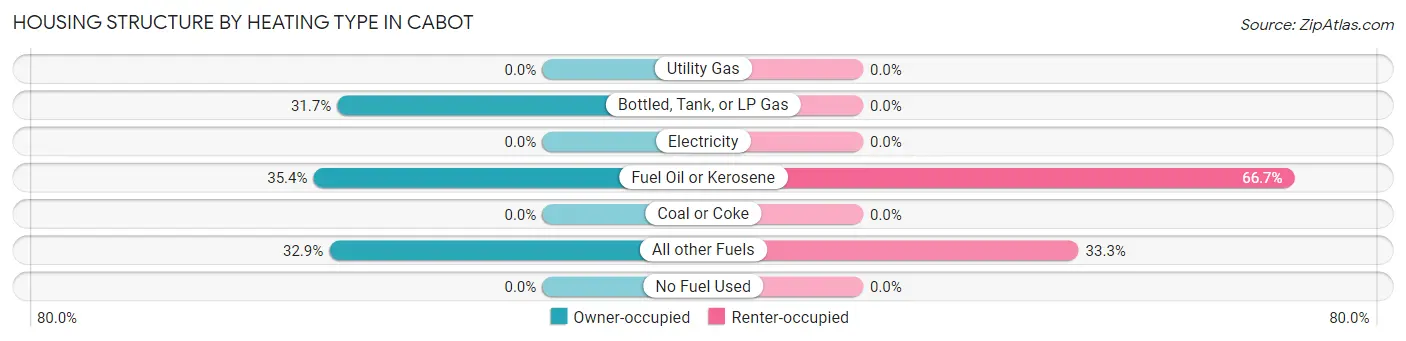
| Heating Type | Owner-occupied | Renter-occupied |
| Utility Gas | 0 (0.0%) | 0 (0.0%) |
| Bottled, Tank, or LP Gas | 26 (31.7%) | 0 (0.0%) |
| Electricity | 0 (0.0%) | 0 (0.0%) |
| Fuel Oil or Kerosene | 29 (35.4%) | 22 (66.7%) |
| Coal or Coke | 0 (0.0%) | 0 (0.0%) |
| All other Fuels | 27 (32.9%) | 11 (33.3%) |
| No Fuel Used | 0 (0.0%) | 0 (0.0%) |
| Total | 82 (100.0%) | 33 (100.0%) |
Household Vehicle Usage in Cabot
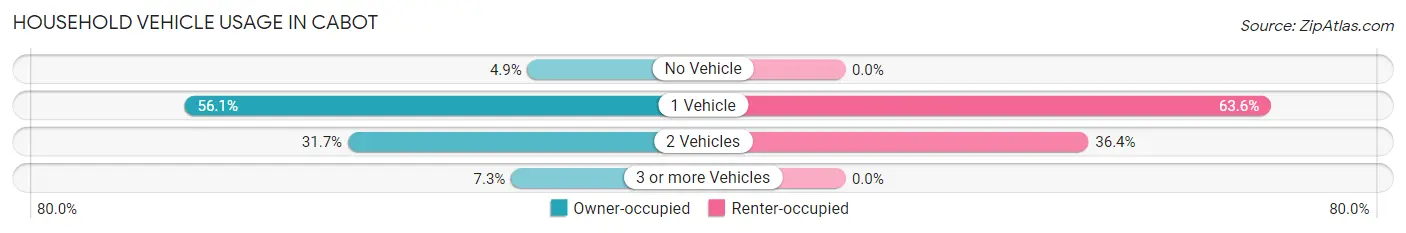
| Vehicles per Household | Owner-occupied | Renter-occupied |
| No Vehicle | 4 (4.9%) | 0 (0.0%) |
| 1 Vehicle | 46 (56.1%) | 21 (63.6%) |
| 2 Vehicles | 26 (31.7%) | 12 (36.4%) |
| 3 or more Vehicles | 6 (7.3%) | 0 (0.0%) |
| Total | 82 (100.0%) | 33 (100.0%) |
Real Estate & Mortgages in Cabot
Real Estate and Mortgage Overview in Cabot
| Characteristic | Without Mortgage | With Mortgage |
| Housing Units | 21 | 61 |
| Median Property Value | $237,500 | $120,100 |
| Median Household Income | $128,125 | $11 |
| Monthly Housing Costs | $1,329 | $4 |
| Real Estate Taxes | $5,750 | $0 |
Property Value by Mortgage Status in Cabot
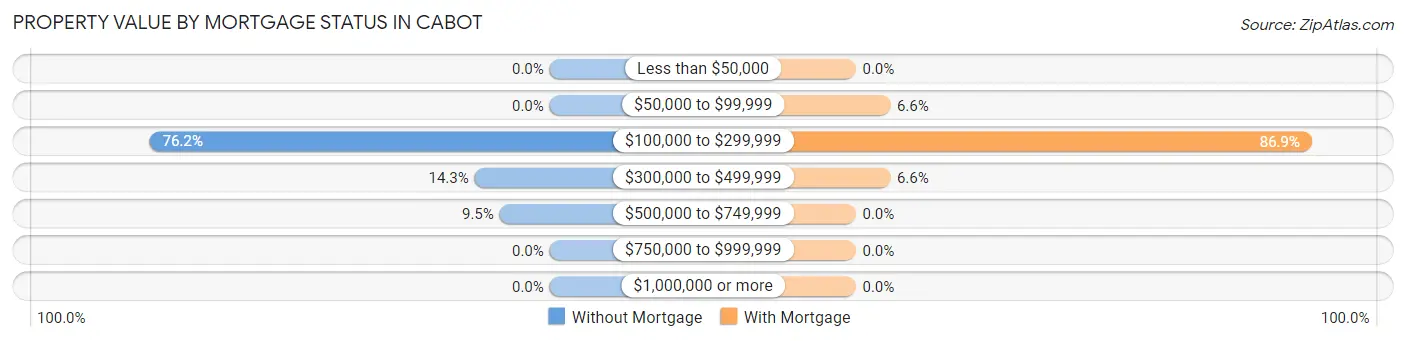
| Property Value | Without Mortgage | With Mortgage |
| Less than $50,000 | 0 (0.0%) | 0 (0.0%) |
| $50,000 to $99,999 | 0 (0.0%) | 4 (6.6%) |
| $100,000 to $299,999 | 16 (76.2%) | 53 (86.9%) |
| $300,000 to $499,999 | 3 (14.3%) | 4 (6.6%) |
| $500,000 to $749,999 | 2 (9.5%) | 0 (0.0%) |
| $750,000 to $999,999 | 0 (0.0%) | 0 (0.0%) |
| $1,000,000 or more | 0 (0.0%) | 0 (0.0%) |
| Total | 21 (100.0%) | 61 (100.0%) |
Household Income by Mortgage Status in Cabot
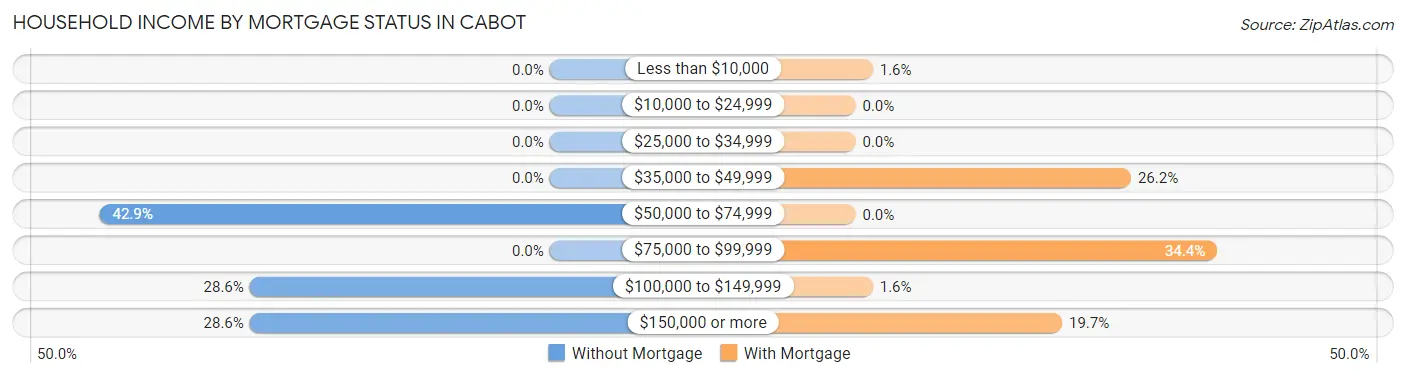
| Household Income | Without Mortgage | With Mortgage |
| Less than $10,000 | 0 (0.0%) | 1 (1.6%) |
| $10,000 to $24,999 | 0 (0.0%) | 0 (0.0%) |
| $25,000 to $34,999 | 0 (0.0%) | 0 (0.0%) |
| $35,000 to $49,999 | 0 (0.0%) | 16 (26.2%) |
| $50,000 to $74,999 | 9 (42.9%) | 0 (0.0%) |
| $75,000 to $99,999 | 0 (0.0%) | 21 (34.4%) |
| $100,000 to $149,999 | 6 (28.6%) | 1 (1.6%) |
| $150,000 or more | 6 (28.6%) | 12 (19.7%) |
| Total | 21 (100.0%) | 61 (100.0%) |
Property Value to Household Income Ratio in Cabot
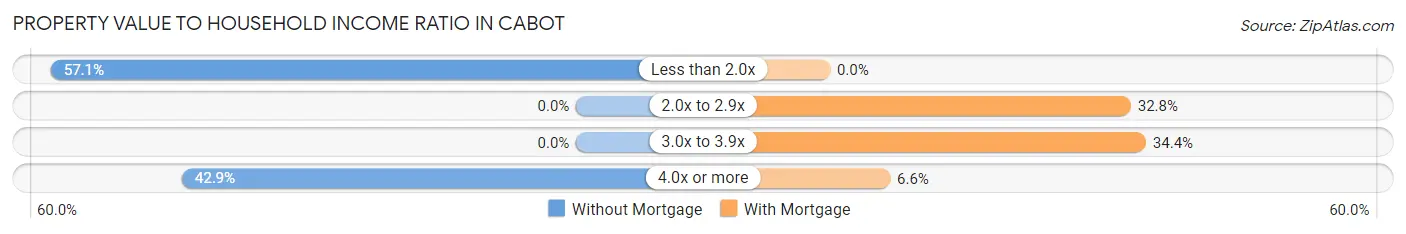
| Value-to-Income Ratio | Without Mortgage | With Mortgage |
| Less than 2.0x | 12 (57.1%) | 0 (0.0%) |
| 2.0x to 2.9x | 0 (0.0%) | 20 (32.8%) |
| 3.0x to 3.9x | 0 (0.0%) | 21 (34.4%) |
| 4.0x or more | 9 (42.9%) | 4 (6.6%) |
| Total | 21 (100.0%) | 61 (100.0%) |
Real Estate Taxes by Mortgage Status in Cabot
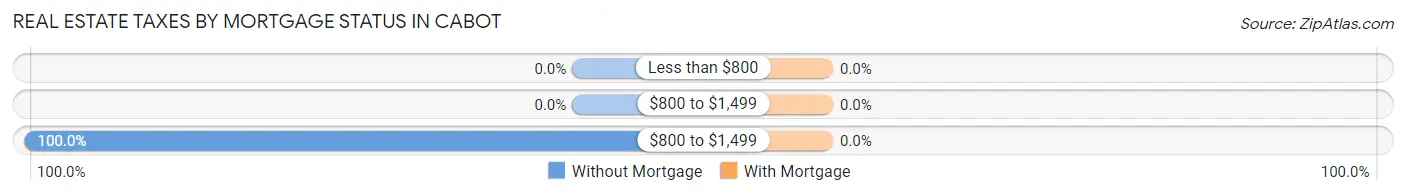
| Property Taxes | Without Mortgage | With Mortgage |
| Less than $800 | 0 (0.0%) | 0 (0.0%) |
| $800 to $1,499 | 0 (0.0%) | 0 (0.0%) |
| $800 to $1,499 | 21 (100.0%) | 0 (0.0%) |
| Total | 21 (100.0%) | 61 (100.0%) |
Health & Disability in Cabot
Health Insurance Coverage by Age in Cabot
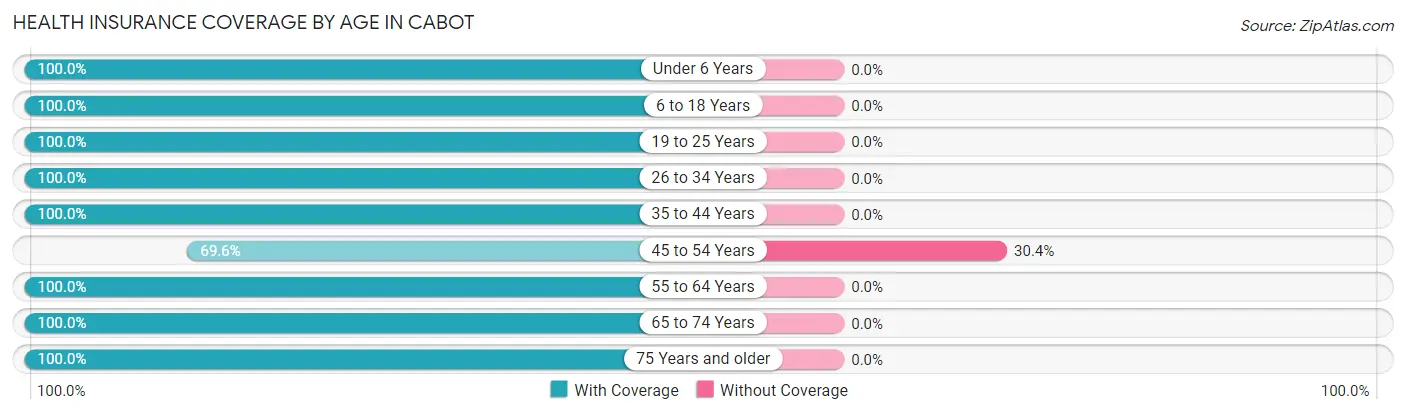
| Age Bracket | With Coverage | Without Coverage |
| Under 6 Years | 24 (100.0%) | 0 (0.0%) |
| 6 to 18 Years | 75 (100.0%) | 0 (0.0%) |
| 19 to 25 Years | 40 (100.0%) | 0 (0.0%) |
| 26 to 34 Years | 2 (100.0%) | 0 (0.0%) |
| 35 to 44 Years | 25 (100.0%) | 0 (0.0%) |
| 45 to 54 Years | 39 (69.6%) | 17 (30.4%) |
| 55 to 64 Years | 4 (100.0%) | 0 (0.0%) |
| 65 to 74 Years | 35 (100.0%) | 0 (0.0%) |
| 75 Years and older | 11 (100.0%) | 0 (0.0%) |
| Total | 255 (93.8%) | 17 (6.2%) |
Health Insurance Coverage by Citizenship Status in Cabot
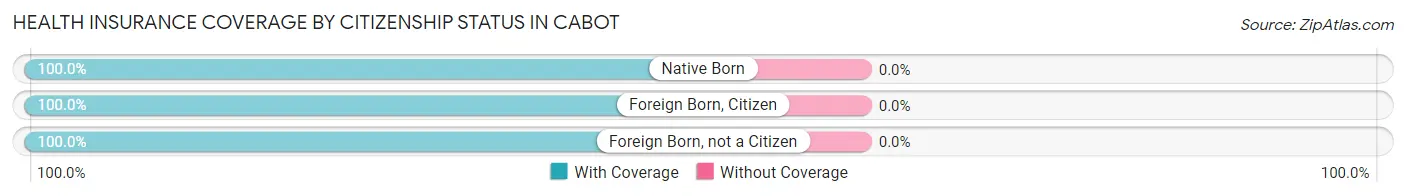
| Citizenship Status | With Coverage | Without Coverage |
| Native Born | 24 (100.0%) | 0 (0.0%) |
| Foreign Born, Citizen | 75 (100.0%) | 0 (0.0%) |
| Foreign Born, not a Citizen | 40 (100.0%) | 0 (0.0%) |
Health Insurance Coverage by Household Income in Cabot
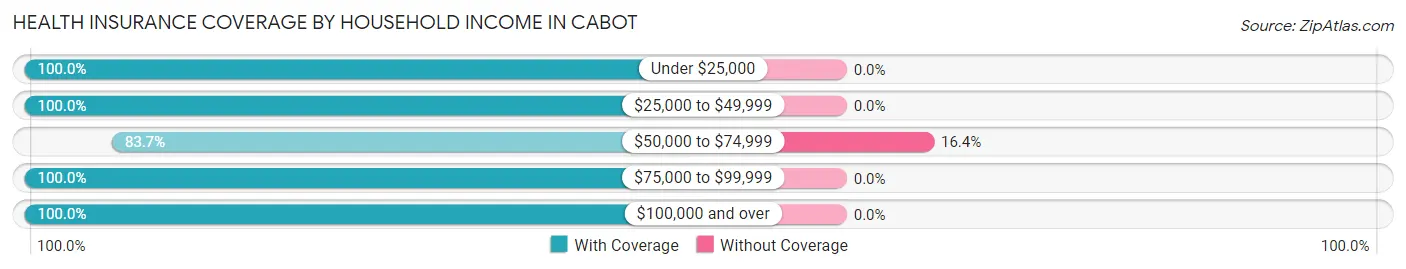
| Household Income | With Coverage | Without Coverage |
| Under $25,000 | 21 (100.0%) | 0 (0.0%) |
| $25,000 to $49,999 | 62 (100.0%) | 0 (0.0%) |
| $50,000 to $74,999 | 87 (83.7%) | 17 (16.4%) |
| $75,000 to $99,999 | 2 (100.0%) | 0 (0.0%) |
| $100,000 and over | 83 (100.0%) | 0 (0.0%) |
Public vs Private Health Insurance Coverage by Age in Cabot
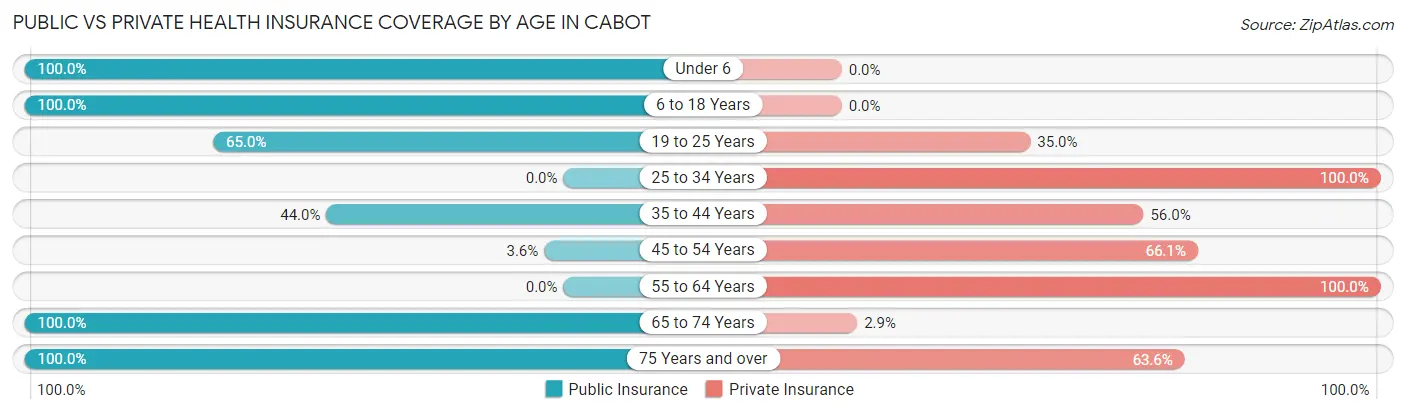
| Age Bracket | Public Insurance | Private Insurance |
| Under 6 | 24 (100.0%) | 0 (0.0%) |
| 6 to 18 Years | 75 (100.0%) | 0 (0.0%) |
| 19 to 25 Years | 26 (65.0%) | 14 (35.0%) |
| 25 to 34 Years | 0 (0.0%) | 2 (100.0%) |
| 35 to 44 Years | 11 (44.0%) | 14 (56.0%) |
| 45 to 54 Years | 2 (3.6%) | 37 (66.1%) |
| 55 to 64 Years | 0 (0.0%) | 4 (100.0%) |
| 65 to 74 Years | 35 (100.0%) | 1 (2.9%) |
| 75 Years and over | 11 (100.0%) | 7 (63.6%) |
| Total | 184 (67.6%) | 79 (29.0%) |
Disability Status by Sex by Age in Cabot
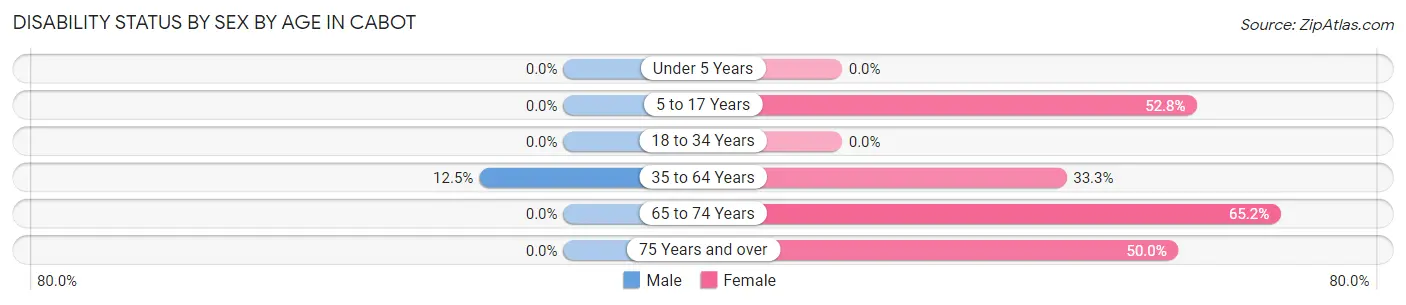
| Age Bracket | Male | Female |
| Under 5 Years | 0 (0.0%) | 0 (0.0%) |
| 5 to 17 Years | 0 (0.0%) | 19 (52.8%) |
| 18 to 34 Years | 0 (0.0%) | 0 (0.0%) |
| 35 to 64 Years | 5 (12.5%) | 15 (33.3%) |
| 65 to 74 Years | 0 (0.0%) | 15 (65.2%) |
| 75 Years and over | 0 (0.0%) | 4 (50.0%) |
Disability Class by Sex by Age in Cabot
Disability Class: Hearing Difficulty
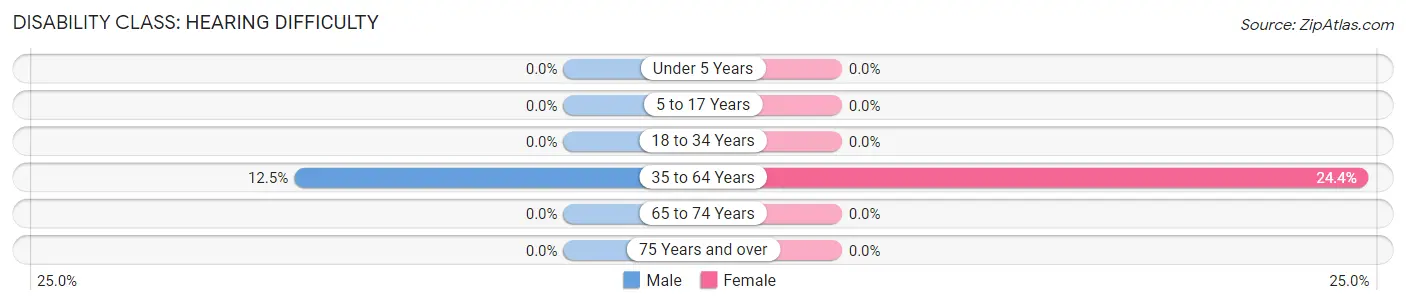
| Age Bracket | Male | Female |
| Under 5 Years | 0 (0.0%) | 0 (0.0%) |
| 5 to 17 Years | 0 (0.0%) | 0 (0.0%) |
| 18 to 34 Years | 0 (0.0%) | 0 (0.0%) |
| 35 to 64 Years | 5 (12.5%) | 11 (24.4%) |
| 65 to 74 Years | 0 (0.0%) | 0 (0.0%) |
| 75 Years and over | 0 (0.0%) | 0 (0.0%) |
Disability Class: Vision Difficulty
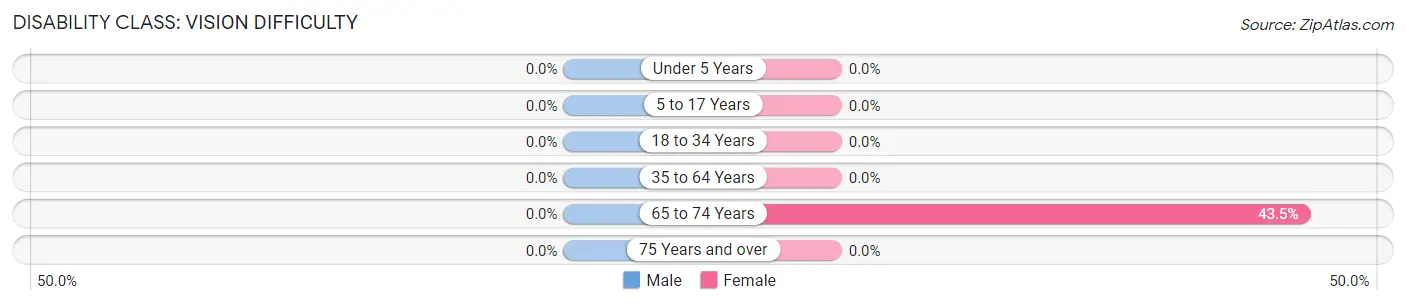
| Age Bracket | Male | Female |
| Under 5 Years | 0 (0.0%) | 0 (0.0%) |
| 5 to 17 Years | 0 (0.0%) | 0 (0.0%) |
| 18 to 34 Years | 0 (0.0%) | 0 (0.0%) |
| 35 to 64 Years | 0 (0.0%) | 0 (0.0%) |
| 65 to 74 Years | 0 (0.0%) | 10 (43.5%) |
| 75 Years and over | 0 (0.0%) | 0 (0.0%) |
Disability Class: Cognitive Difficulty
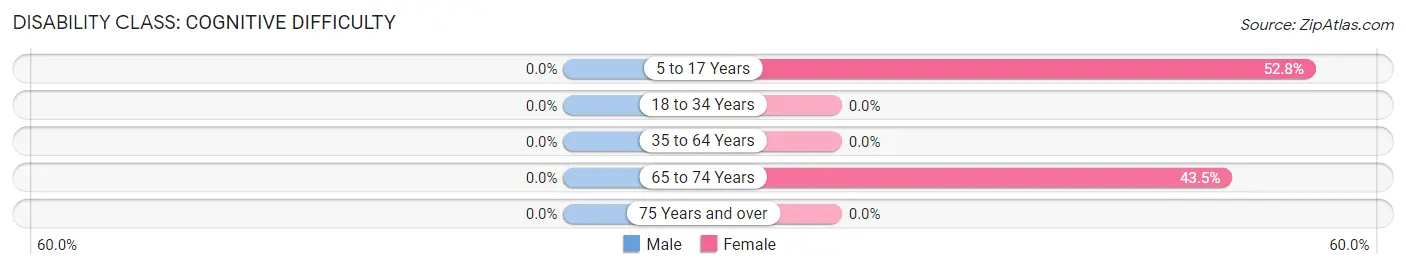
| Age Bracket | Male | Female |
| 5 to 17 Years | 0 (0.0%) | 19 (52.8%) |
| 18 to 34 Years | 0 (0.0%) | 0 (0.0%) |
| 35 to 64 Years | 0 (0.0%) | 0 (0.0%) |
| 65 to 74 Years | 0 (0.0%) | 10 (43.5%) |
| 75 Years and over | 0 (0.0%) | 0 (0.0%) |
Disability Class: Ambulatory Difficulty
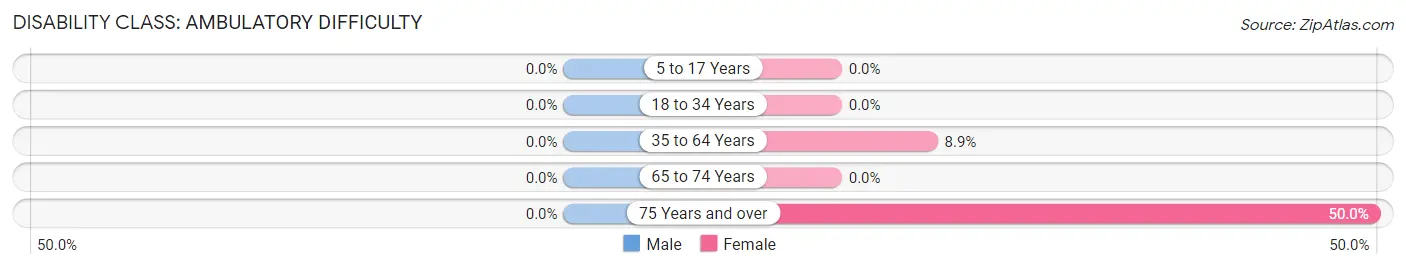
| Age Bracket | Male | Female |
| 5 to 17 Years | 0 (0.0%) | 0 (0.0%) |
| 18 to 34 Years | 0 (0.0%) | 0 (0.0%) |
| 35 to 64 Years | 0 (0.0%) | 4 (8.9%) |
| 65 to 74 Years | 0 (0.0%) | 0 (0.0%) |
| 75 Years and over | 0 (0.0%) | 4 (50.0%) |
Disability Class: Self-Care Difficulty
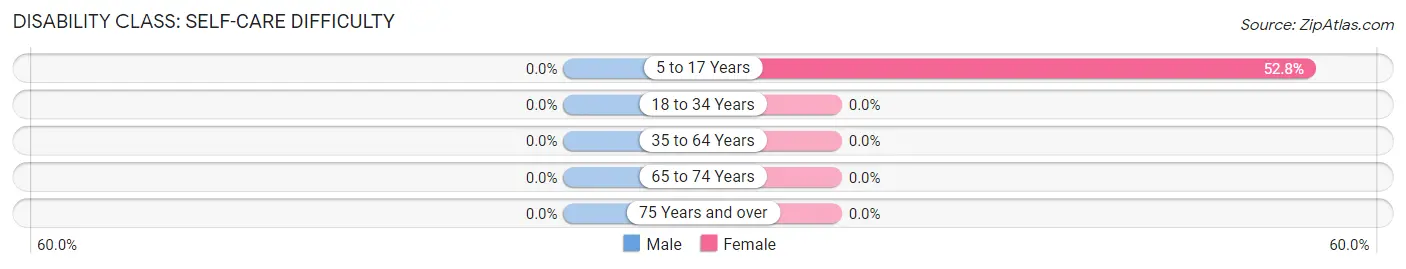
| Age Bracket | Male | Female |
| 5 to 17 Years | 0 (0.0%) | 19 (52.8%) |
| 18 to 34 Years | 0 (0.0%) | 0 (0.0%) |
| 35 to 64 Years | 0 (0.0%) | 0 (0.0%) |
| 65 to 74 Years | 0 (0.0%) | 0 (0.0%) |
| 75 Years and over | 0 (0.0%) | 0 (0.0%) |
Technology Access in Cabot
Computing Device Access in Cabot
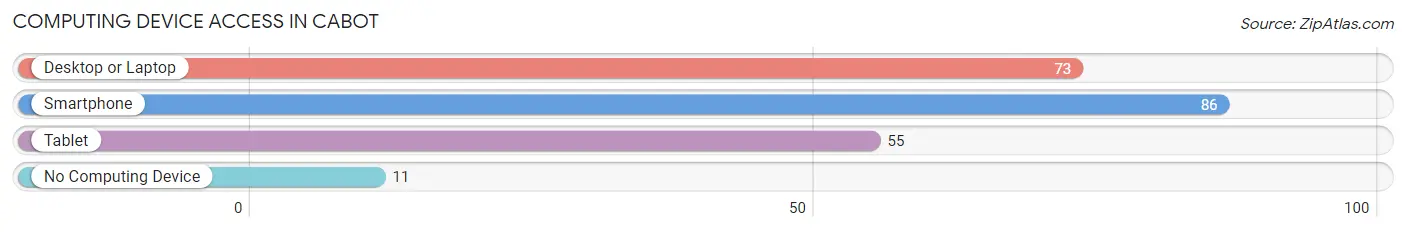
| Device Type | # Households | % Households |
| Desktop or Laptop | 73 | 63.5% |
| Smartphone | 86 | 74.8% |
| Tablet | 55 | 47.8% |
| No Computing Device | 11 | 9.6% |
| Total | 115 | 100.0% |
Internet Access in Cabot
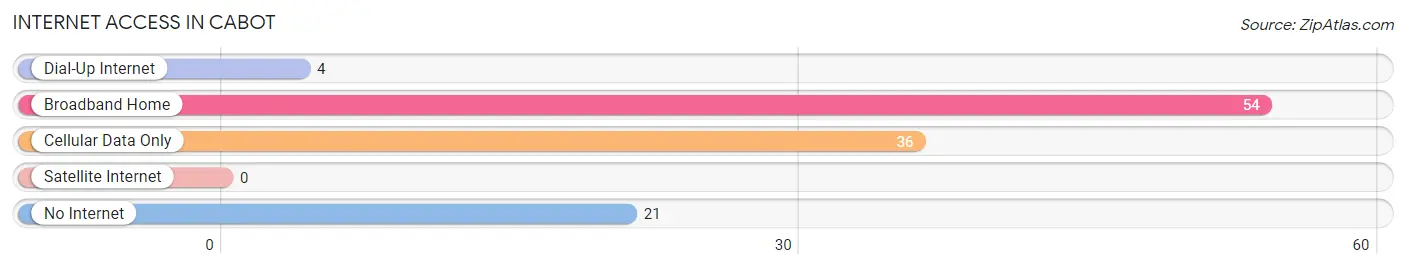
| Internet Type | # Households | % Households |
| Dial-Up Internet | 4 | 3.5% |
| Broadband Home | 54 | 47.0% |
| Cellular Data Only | 36 | 31.3% |
| Satellite Internet | 0 | 0.0% |
| No Internet | 21 | 18.3% |
| Total | 115 | 100.0% |
Cabot Summary
Cabot is a small town located in Washington County, Vermont. It is situated in the Green Mountains, and is home to a population of 1,037 people as of the 2010 census. The town was first settled in 1780 by a group of settlers from Massachusetts, and was incorporated in 1781.
Geography
Cabot is located in the Green Mountains of Vermont, and is situated in the northern part of the state. The town is bordered by the towns of Marshfield to the north, Walden to the east, Peacham to the south, and Plainfield to the west. The town is located at an elevation of 1,400 feet, and is situated on the banks of the Winooski River. The town covers an area of approximately 33.2 square miles, and is home to several small lakes, including Cabot Pond, Lake Elmore, and Lake Eden.
Economy
Cabot is a rural town, and the economy is largely based on agriculture and forestry. The town is home to several small farms, and the surrounding area is home to a number of timber companies. The town is also home to a number of small businesses, including a general store, a hardware store, and a few restaurants.
Demographics
As of the 2010 census, the population of Cabot was 1,037. The racial makeup of the town was 97.3% White, 0.3% African American, 0.3% Native American, 0.3% Asian, 0.2% from other races, and 1.5% from two or more races. The median household income was $45,000, and the median family income was $50,000. The per capita income was $20,000.
History
Cabot was first settled in 1780 by a group of settlers from Massachusetts. The town was incorporated in 1781, and was named after the French explorer Samuel de Champlain, who explored the area in 1609. The town was originally a farming community, and the surrounding area was heavily forested. In the late 19th century, the town began to develop a timber industry, and the town's economy was largely based on the lumber industry until the mid-20th century. In the late 20th century, the town began to diversify its economy, and the town is now home to a number of small businesses.
Common Questions
What is Per Capita Income in Cabot?
Per Capita income in Cabot is $43,559.
What is the Median Family Income in Cabot?
Median Family Income in Cabot is $64,773.
What is the Median Household income in Cabot?
Median Household Income in Cabot is $53,958.
What is Income or Wage Gap in Cabot?
Income or Wage Gap in Cabot is 35.1%.
Women in Cabot earn 64.9 cents for every dollar earned by a man.
What is Inequality or Gini Index in Cabot?
Inequality or Gini Index in Cabot is 0.56.
What is the Total Population of Cabot?
Total Population of Cabot is 272.
What is the Total Male Population of Cabot?
Total Male Population of Cabot is 116.
What is the Total Female Population of Cabot?
Total Female Population of Cabot is 156.
What is the Ratio of Males per 100 Females in Cabot?
There are 74.36 Males per 100 Females in Cabot.
What is the Ratio of Females per 100 Males in Cabot?
There are 134.48 Females per 100 Males in Cabot.
What is the Median Population Age in Cabot?
Median Population Age in Cabot is 25.7 Years.
What is the Average Family Size in Cabot
Average Family Size in Cabot is 3.3 People.
What is the Average Household Size in Cabot
Average Household Size in Cabot is 2.4 People.
How Large is the Labor Force in Cabot?
There are 120 People in the Labor Forcein in Cabot.
What is the Percentage of People in the Labor Force in Cabot?
57.4% of People are in the Labor Force in Cabot.
What is the Unemployment Rate in Cabot?
Unemployment Rate in Cabot is 9.2%.