Cities with the Oldest Male Population in Vermont
RELATED REPORTS & OPTIONS
Oldest Population | Male
Vermont
Compare Cities
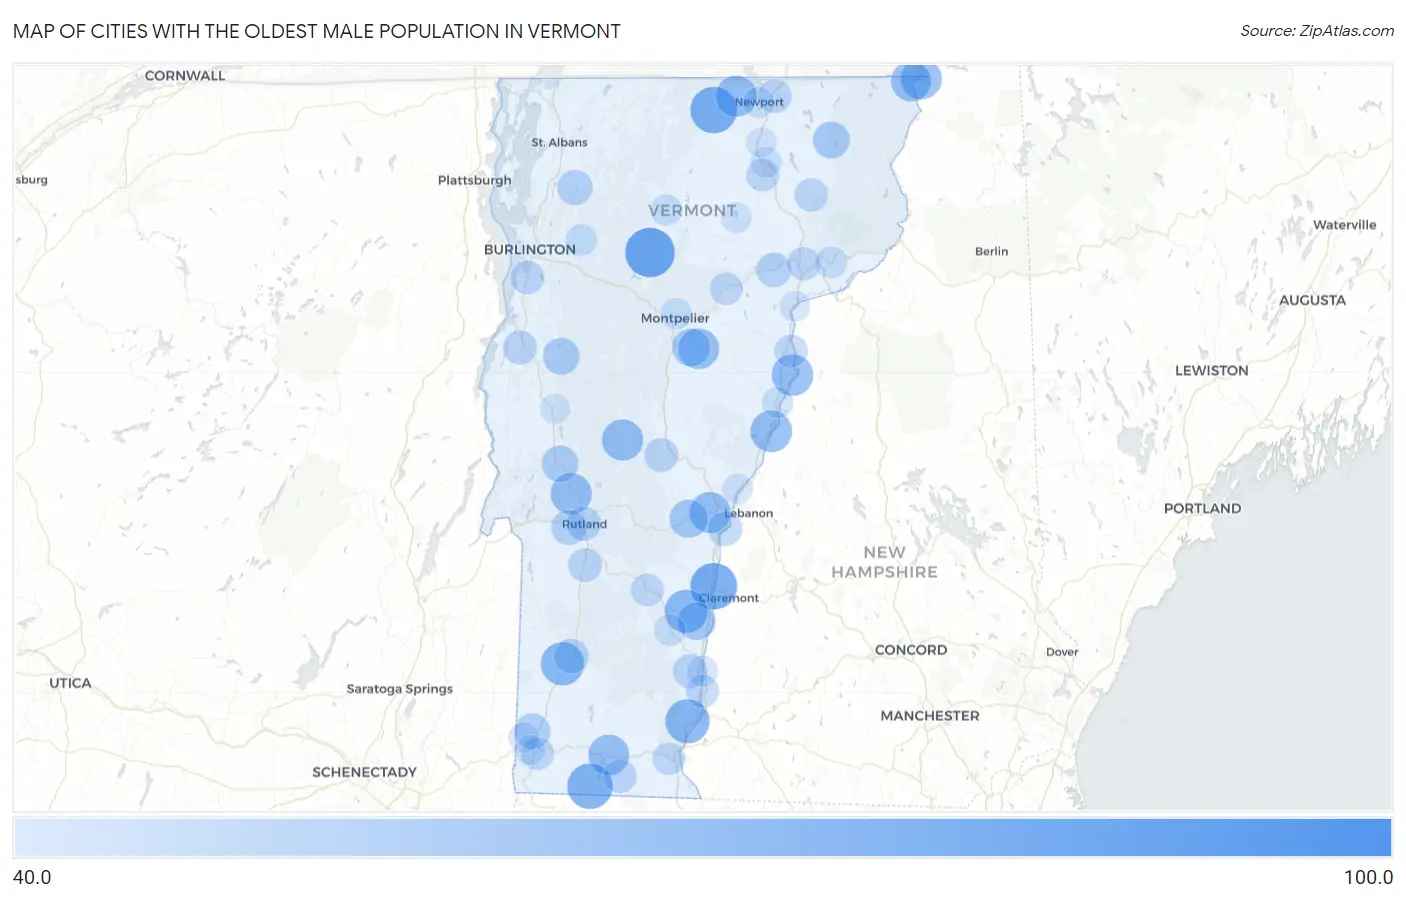
Map of Cities with the Oldest Male Population in Vermont
0.0
100.0
Cities with the Oldest Male Population in Vermont
| City | Median Age | vs State | vs National | |
| 1. | Townshend | 80.7 | 41.6(+39.1)#1 | 37.4(+43.3)#45 |
| 2. | Stowe | 71.5 | 41.6(+29.9)#2 | 37.4(+34.1)#278 |
| 3. | Wardsboro | 69.5 | 41.6(+27.9)#3 | 37.4(+32.1)#429 |
| 4. | Ascutney | 66.8 | 41.6(+25.2)#4 | 37.4(+29.4)#699 |
| 5. | Troy | 66.5 | 41.6(+24.9)#5 | 37.4(+29.1)#729 |
| 6. | South Lincoln | 65.4 | 41.6(+23.8)#6 | 37.4(+28.0)#889 |
| 7. | Readsboro | 64.7 | 41.6(+23.1)#7 | 37.4(+27.3)#984 |
| 8. | North Pownal | 63.2 | 41.6(+21.6)#8 | 37.4(+25.8)#1,295 |
| 9. | Putney | 62.6 | 41.6(+21.0)#9 | 37.4(+25.2)#1,399 |
| 10. | Londonderry | 62.2 | 41.6(+20.6)#10 | 37.4(+24.8)#1,504 |
| 11. | Manchester | 61.3 | 41.6(+19.7)#11 | 37.4(+23.9)#1,695 |
| 12. | North Springfield | 60.7 | 41.6(+19.1)#12 | 37.4(+23.3)#1,828 |
| 13. | Fairlee | 58.5 | 41.6(+16.9)#13 | 37.4(+21.1)#2,428 |
| 14. | Newbury | 58.3 | 41.6(+16.7)#14 | 37.4(+20.9)#2,476 |
| 15. | Lunenburg | 57.9 | 41.6(+16.3)#15 | 37.4(+20.5)#2,611 |
| 16. | Rochester | 57.9 | 41.6(+16.3)#16 | 37.4(+20.5)#2,612 |
| 17. | Pittsford | 57.8 | 41.6(+16.2)#17 | 37.4(+20.4)#2,631 |
| 18. | Newport Center | 57.8 | 41.6(+16.2)#18 | 37.4(+20.4)#2,641 |
| 19. | Beecher Falls | 57.8 | 41.6(+16.2)#19 | 37.4(+20.4)#2,647 |
| 20. | Quechee | 57.5 | 41.6(+15.9)#20 | 37.4(+20.1)#2,726 |
| 21. | Wilmington | 57.2 | 41.6(+15.6)#21 | 37.4(+19.8)#2,868 |
| 22. | Websterville | 56.9 | 41.6(+15.3)#22 | 37.4(+19.5)#2,981 |
| 23. | Canaan | 56.5 | 41.6(+14.9)#23 | 37.4(+19.1)#3,091 |
| 24. | East Dorset | 56.5 | 41.6(+14.9)#24 | 37.4(+19.1)#3,093 |
| 25. | Weston | 55.8 | 41.6(+14.2)#25 | 37.4(+18.4)#3,379 |
| 26. | Gilman | 55.3 | 41.6(+13.7)#26 | 37.4(+17.9)#3,552 |
| 27. | Castleton Four Corners | 55.1 | 41.6(+13.5)#27 | 37.4(+17.7)#3,623 |
| 28. | Bakersfield | 54.6 | 41.6(+13.0)#28 | 37.4(+17.2)#3,772 |
| 29. | Stamford | 54.5 | 41.6(+12.9)#29 | 37.4(+17.1)#3,814 |
| 30. | Grafton | 54.0 | 41.6(+12.4)#30 | 37.4(+16.6)#4,077 |
| 31. | East Poultney | 53.6 | 41.6(+12.0)#31 | 37.4(+16.2)#4,216 |
| 32. | Danby | 53.4 | 41.6(+11.8)#32 | 37.4(+16.0)#4,283 |
| 33. | Woodstock | 53.2 | 41.6(+11.6)#33 | 37.4(+15.8)#4,359 |
| 34. | Hanksville | 52.7 | 41.6(+11.1)#34 | 37.4(+15.3)#4,572 |
| 35. | South Barre | 52.5 | 41.6(+10.9)#35 | 37.4(+15.1)#4,618 |
| 36. | Springfield | 52.0 | 41.6(+10.4)#36 | 37.4(+14.6)#4,910 |
| 37. | St. George | 52.0 | 41.6(+10.4)#37 | 37.4(+14.6)#4,935 |
| 38. | Jamaica | 51.4 | 41.6(+9.80)#38 | 37.4(+14.0)#5,212 |
| 39. | West Woodstock | 50.9 | 41.6(+9.30)#39 | 37.4(+13.5)#5,436 |
| 40. | Island Pond | 50.6 | 41.6(+9.00)#40 | 37.4(+13.2)#5,564 |
| 41. | West Charlotte | 50.6 | 41.6(+9.00)#41 | 37.4(+13.2)#5,577 |
| 42. | Harmonyville | 50.6 | 41.6(+9.00)#42 | 37.4(+13.2)#5,578 |
| 43. | Bristol | 50.5 | 41.6(+8.90)#43 | 37.4(+13.1)#5,603 |
| 44. | Brandon | 50.3 | 41.6(+8.70)#44 | 37.4(+12.9)#5,748 |
| 45. | Huntington | 49.2 | 41.6(+7.60)#45 | 37.4(+11.8)#6,372 |
| 46. | North Hyde Park | 49.0 | 41.6(+7.40)#46 | 37.4(+11.6)#6,477 |
| 47. | Chittenden | 48.8 | 41.6(+7.20)#47 | 37.4(+11.4)#6,607 |
| 48. | South Shaftsbury | 48.7 | 41.6(+7.10)#48 | 37.4(+11.3)#6,660 |
| 49. | New Haven | 48.5 | 41.6(+6.90)#49 | 37.4(+11.1)#6,791 |
| 50. | Fairfax | 48.3 | 41.6(+6.70)#50 | 37.4(+10.9)#6,902 |
| 51. | East Charlotte | 48.3 | 41.6(+6.70)#51 | 37.4(+10.9)#6,934 |
| 52. | Stratton Mountain | 48.0 | 41.6(+6.40)#52 | 37.4(+10.6)#7,128 |
| 53. | West Rutland | 47.9 | 41.6(+6.30)#53 | 37.4(+10.5)#7,149 |
| 54. | Underhill Flats | 47.6 | 41.6(+6.00)#54 | 37.4(+10.2)#7,358 |
| 55. | Manchester Center | 47.4 | 41.6(+5.80)#55 | 37.4(+10.00)#7,479 |
| 56. | Lincoln | 47.4 | 41.6(+5.80)#56 | 37.4(+10.00)#7,518 |
| 57. | Danville | 47.3 | 41.6(+5.70)#57 | 37.4(+9.90)#7,591 |
| 58. | Pownal Center | 47.2 | 41.6(+5.60)#58 | 37.4(+9.80)#7,663 |
| 59. | Killington | 47.1 | 41.6(+5.50)#59 | 37.4(+9.70)#7,733 |
| 60. | North Hartland | 46.8 | 41.6(+5.20)#60 | 37.4(+9.40)#7,952 |
| 61. | Rutland | 46.7 | 41.6(+5.10)#61 | 37.4(+9.30)#7,976 |
| 62. | Saxtons River | 46.3 | 41.6(+4.70)#62 | 37.4(+8.90)#8,283 |
| 63. | Vergennes | 46.2 | 41.6(+4.60)#63 | 37.4(+8.80)#8,324 |
| 64. | Wallingford | 46.1 | 41.6(+4.50)#64 | 37.4(+8.70)#8,414 |
| 65. | Bethel | 46.1 | 41.6(+4.50)#65 | 37.4(+8.70)#8,419 |
| 66. | Shelburne | 45.6 | 41.6(+4.00)#66 | 37.4(+8.20)#8,731 |
| 67. | Derby Center | 45.6 | 41.6(+4.00)#67 | 37.4(+8.20)#8,774 |
| 68. | Westford | 45.4 | 41.6(+3.80)#68 | 37.4(+8.00)#8,997 |
| 69. | Jacksonville | 45.2 | 41.6(+3.60)#69 | 37.4(+7.80)#9,174 |
| 70. | West Burke | 45.2 | 41.6(+3.60)#70 | 37.4(+7.80)#9,179 |
| 71. | St Johnsbury | 45.0 | 41.6(+3.40)#71 | 37.4(+7.60)#9,283 |
| 72. | Wells River | 45.0 | 41.6(+3.40)#72 | 37.4(+7.60)#9,331 |
| 73. | Bolton | 45.0 | 41.6(+3.40)#73 | 37.4(+7.60)#9,352 |
| 74. | Westminster | 44.6 | 41.6(+3.00)#74 | 37.4(+7.20)#9,606 |
| 75. | Bennington | 44.5 | 41.6(+2.90)#75 | 37.4(+7.10)#9,638 |
| 76. | Glover | 44.4 | 41.6(+2.80)#76 | 37.4(+7.00)#9,822 |
| 77. | Ludlow | 44.3 | 41.6(+2.70)#77 | 37.4(+6.90)#9,882 |
| 78. | Proctor | 44.0 | 41.6(+2.40)#78 | 37.4(+6.60)#10,120 |
| 79. | Marshfield | 44.0 | 41.6(+2.40)#79 | 37.4(+6.60)#10,144 |
| 80. | West Brattleboro | 43.8 | 41.6(+2.20)#80 | 37.4(+6.40)#10,291 |
| 81. | North Clarendon | 43.1 | 41.6(+1.50)#81 | 37.4(+5.70)#11,043 |
| 82. | Concord | 42.5 | 41.6(+0.900)#82 | 37.4(+5.10)#11,668 |
| 83. | Jericho | 42.4 | 41.6(+0.800)#83 | 37.4(+5.00)#11,746 |
| 84. | Chester | 42.3 | 41.6(+0.700)#84 | 37.4(+4.90)#11,853 |
| 85. | Hyde Park | 42.3 | 41.6(+0.700)#85 | 37.4(+4.90)#11,885 |
| 86. | South Londonderry | 42.1 | 41.6(+0.500)#86 | 37.4(+4.70)#12,125 |
| 87. | Montpelier | 41.9 | 41.6(+0.300)#87 | 37.4(+4.50)#12,281 |
| 88. | Newport | 41.8 | 41.6(+0.200)#88 | 37.4(+4.40)#12,389 |
| 89. | Bradford | 41.8 | 41.6(+0.200)#89 | 37.4(+4.40)#12,424 |
| 90. | Bellows Falls | 41.4 | 41.6(-0.200)#90 | 37.4(+4.00)#12,907 |
| 91. | Barton | 41.4 | 41.6(-0.200)#91 | 37.4(+4.00)#12,937 |
| 92. | Norwich | 40.8 | 41.6(-0.800)#92 | 37.4(+3.40)#13,629 |
| 93. | Barnet | 40.8 | 41.6(-0.800)#93 | 37.4(+3.40)#13,672 |
| 94. | Greensboro | 40.8 | 41.6(-0.800)#94 | 37.4(+3.40)#13,675 |
| 95. | North Bennington | 40.6 | 41.6(-1.000)#95 | 37.4(+3.20)#13,879 |
| 96. | Whitingham | 40.6 | 41.6(-1.000)#96 | 37.4(+3.20)#13,926 |
| 97. | West Pawlet | 40.3 | 41.6(-1.30)#97 | 37.4(+2.90)#14,322 |
| 98. | Old Bennington | 40.2 | 41.6(-1.40)#98 | 37.4(+2.80)#14,479 |
| 99. | Orleans | 40.1 | 41.6(-1.50)#99 | 37.4(+2.70)#14,589 |
| 100. | East Middlebury | 40.0 | 41.6(-1.60)#100 | 37.4(+2.60)#14,734 |
1
2Common Questions
What are the Top 10 Cities with the Oldest Male Population in Vermont?
Top 10 Cities with the Oldest Male Population in Vermont are:
#1
71.5
#2
66.8
#3
66.5
#4
64.7
#5
62.6
#6
61.3
#7
60.7
#8
58.5
#9
58.3
#10
57.9
What city has the Oldest Male Population in Vermont?
Stowe has the Oldest Male Population in Vermont with 71.5.
What is the Median Male Age in the State of Vermont?
Median Male Age in Vermont is 41.6.
What is the Median Male Age in the United States?
Median Male Age in the United States is 37.4.