Middlebury, VT Map & Demographics
Middlebury Map
Middlebury Overview
$33,686
PER CAPITA INCOME
$113,266
AVG FAMILY INCOME
$76,420
AVG HOUSEHOLD INCOME
43.2%
WAGE / INCOME GAP [ % ]
56.8¢/ $1
WAGE / INCOME GAP [ $ ]
0.46
INEQUALITY / GINI INDEX
6,913
TOTAL POPULATION
3,199
MALE POPULATION
3,714
FEMALE POPULATION
86.13
MALES / 100 FEMALES
116.10
FEMALES / 100 MALES
22.8
MEDIAN AGE
2.8
AVG FAMILY SIZE
2.0
AVG HOUSEHOLD SIZE
2,844
LABOR FORCE [ PEOPLE ]
44.5%
PERCENT IN LABOR FORCE
5.8%
UNEMPLOYMENT RATE
Middlebury Zip Codes
Middlebury Area Codes
Income in Middlebury
Income Overview in Middlebury
Per Capita Income in Middlebury is $33,686, while median incomes of families and households are $113,266 and $76,420 respectively.
| Characteristic | Number | Measure |
| Per Capita Income | 6,913 | $33,686 |
| Median Family Income | 999 | $113,266 |
| Mean Family Income | 999 | $135,039 |
| Median Household Income | 1,965 | $76,420 |
| Mean Household Income | 1,965 | $98,392 |
| Income Deficit | 999 | $0 |
| Wage / Income Gap (%) | 6,913 | 43.18% |
| Wage / Income Gap ($) | 6,913 | 56.82¢ per $1 |
| Gini / Inequality Index | 6,913 | 0.46 |
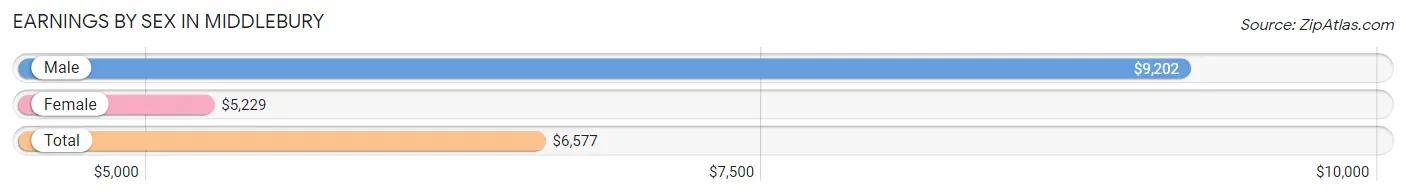
Earnings by Sex in Middlebury
Average Earnings in Middlebury are $6,577, $9,202 for men and $5,229 for women, a difference of 43.2%.
| Sex | Number | Average Earnings |
| Male | 2,024 (46.3%) | $9,202 |
| Female | 2,350 (53.7%) | $5,229 |
| Total | 4,374 (100.0%) | $6,577 |
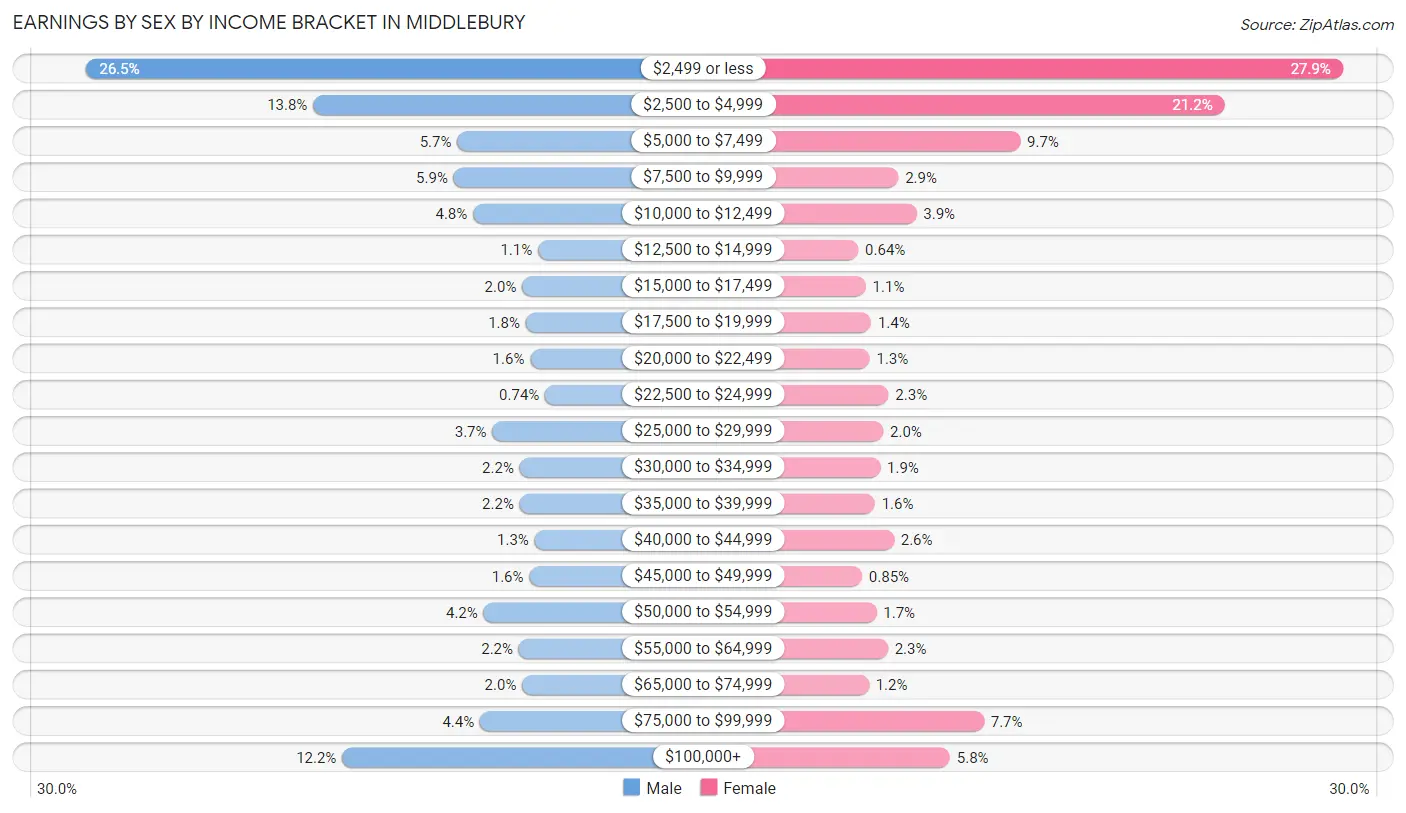
Earnings by Sex by Income Bracket in Middlebury
The most common earnings brackets in Middlebury are $2,499 or less for men (537 | 26.5%) and $2,499 or less for women (655 | 27.9%).
| Income | Male | Female |
| $2,499 or less | 537 (26.5%) | 655 (27.9%) |
| $2,500 to $4,999 | 279 (13.8%) | 499 (21.2%) |
| $5,000 to $7,499 | 115 (5.7%) | 229 (9.7%) |
| $7,500 to $9,999 | 119 (5.9%) | 68 (2.9%) |
| $10,000 to $12,499 | 97 (4.8%) | 92 (3.9%) |
| $12,500 to $14,999 | 23 (1.1%) | 15 (0.6%) |
| $15,000 to $17,499 | 41 (2.0%) | 25 (1.1%) |
| $17,500 to $19,999 | 37 (1.8%) | 32 (1.4%) |
| $20,000 to $22,499 | 32 (1.6%) | 30 (1.3%) |
| $22,500 to $24,999 | 15 (0.7%) | 55 (2.3%) |
| $25,000 to $29,999 | 75 (3.7%) | 48 (2.0%) |
| $30,000 to $34,999 | 44 (2.2%) | 44 (1.9%) |
| $35,000 to $39,999 | 44 (2.2%) | 37 (1.6%) |
| $40,000 to $44,999 | 27 (1.3%) | 62 (2.6%) |
| $45,000 to $49,999 | 33 (1.6%) | 20 (0.9%) |
| $50,000 to $54,999 | 85 (4.2%) | 39 (1.7%) |
| $55,000 to $64,999 | 45 (2.2%) | 54 (2.3%) |
| $65,000 to $74,999 | 41 (2.0%) | 29 (1.2%) |
| $75,000 to $99,999 | 89 (4.4%) | 181 (7.7%) |
| $100,000+ | 246 (12.1%) | 136 (5.8%) |
| Total | 2,024 (100.0%) | 2,350 (100.0%) |
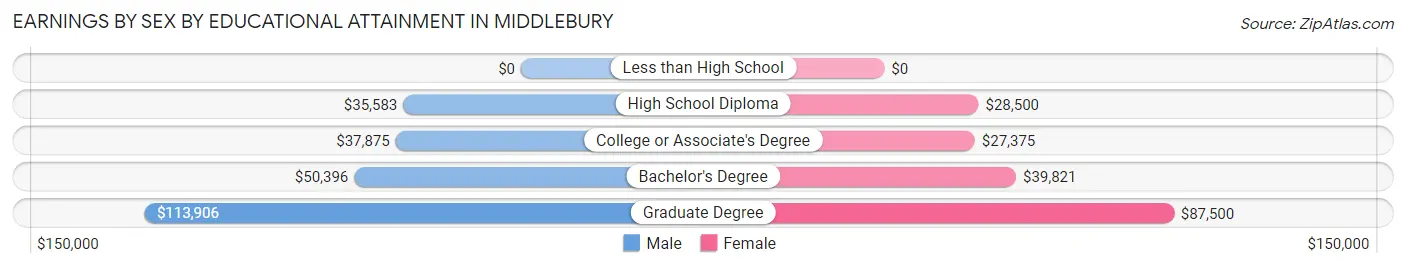
Earnings by Sex by Educational Attainment in Middlebury
Average earnings in Middlebury are $50,574 for men and $47,875 for women, a difference of 5.3%. Men with an educational attainment of graduate degree enjoy the highest average annual earnings of $113,906, while those with high school diploma education earn the least with $35,583. Women with an educational attainment of graduate degree earn the most with the average annual earnings of $87,500, while those with college or associate's degree education have the smallest earnings of $27,375.
| Educational Attainment | Male Income | Female Income |
| Less than High School | - | - |
| High School Diploma | $35,583 | $28,500 |
| College or Associate's Degree | $37,875 | $27,375 |
| Bachelor's Degree | $50,396 | $39,821 |
| Graduate Degree | $113,906 | $87,500 |
| Total | $50,574 | $47,875 |
Family Income in Middlebury
Family Income Brackets in Middlebury
According to the Middlebury family income data, there are 247 families falling into the $100,000 to $149,999 income range, which is the most common income bracket and makes up 24.7% of all families. Conversely, the $15,000 to $24,999 income bracket is the least frequent group with only 24 families (2.4%) belonging to this category.
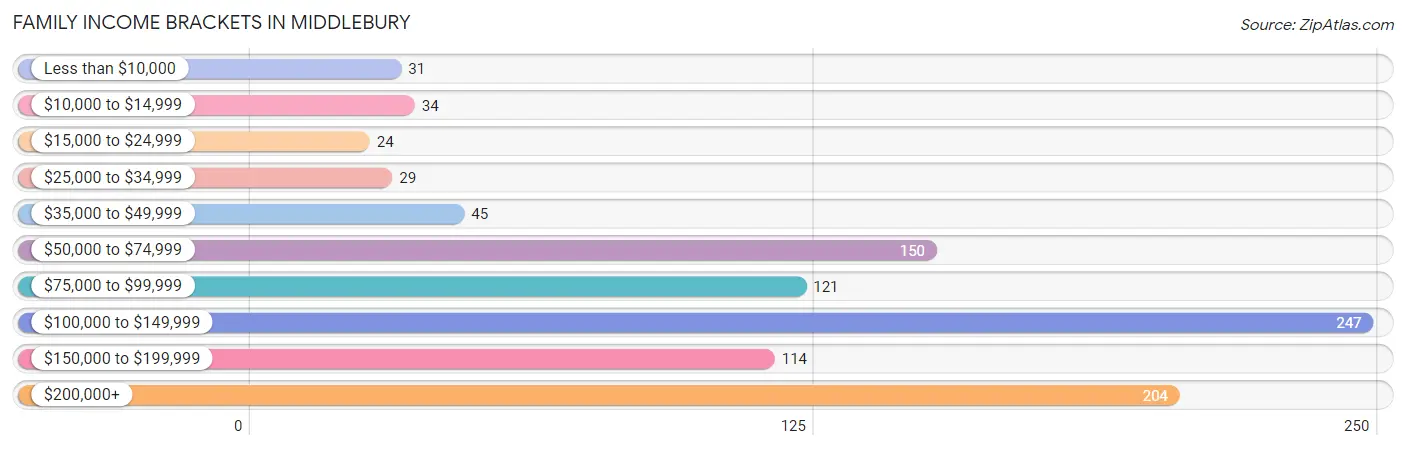
| Income Bracket | # Families | % Families |
| Less than $10,000 | 31 | 3.1% |
| $10,000 to $14,999 | 34 | 3.4% |
| $15,000 to $24,999 | 24 | 2.4% |
| $25,000 to $34,999 | 29 | 2.9% |
| $35,000 to $49,999 | 45 | 4.5% |
| $50,000 to $74,999 | 150 | 15.0% |
| $75,000 to $99,999 | 121 | 12.1% |
| $100,000 to $149,999 | 247 | 24.7% |
| $150,000 to $199,999 | 114 | 11.4% |
| $200,000+ | 204 | 20.4% |
Family Income by Famaliy Size in Middlebury
3-person families (151 | 15.1%) account for the highest median family income in Middlebury with $176,513 per family, while 3-person families (151 | 15.1%) have the highest median income of $58,838 per family member.
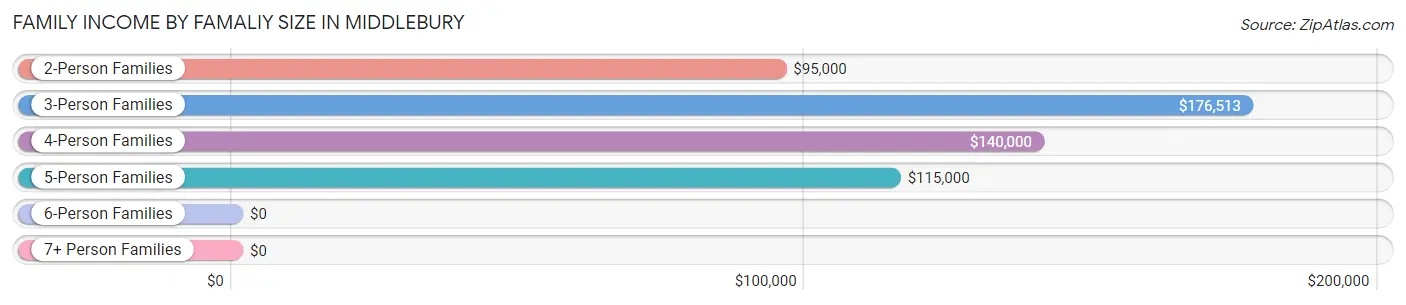
| Income Bracket | # Families | Median Income |
| 2-Person Families | 684 (68.5%) | $95,000 |
| 3-Person Families | 151 (15.1%) | $176,513 |
| 4-Person Families | 114 (11.4%) | $140,000 |
| 5-Person Families | 30 (3.0%) | $115,000 |
| 6-Person Families | 17 (1.7%) | $0 |
| 7+ Person Families | 3 (0.3%) | $0 |
| Total | 999 (100.0%) | $113,266 |
Family Income by Number of Earners in Middlebury
The median family income in Middlebury is $113,266, with families comprising 2 earners (356) having the highest median family income of $146,500, while families with no earners (219) have the lowest median family income of $61,454, accounting for 35.6% and 21.9% of families, respectively.
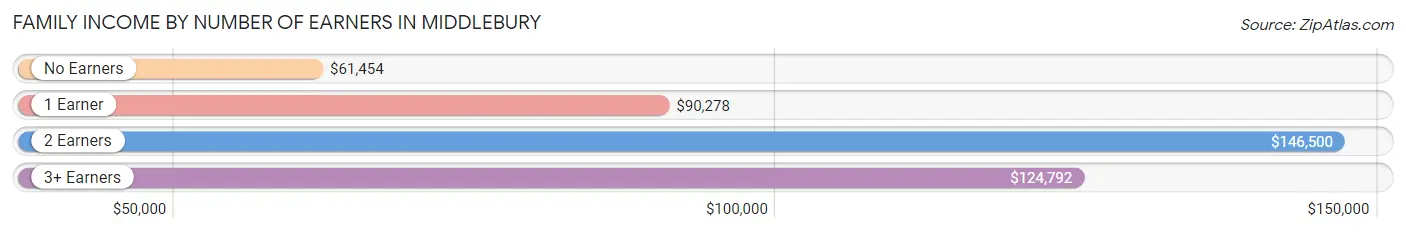
| Number of Earners | # Families | Median Income |
| No Earners | 219 (21.9%) | $61,454 |
| 1 Earner | 356 (35.6%) | $90,278 |
| 2 Earners | 356 (35.6%) | $146,500 |
| 3+ Earners | 68 (6.8%) | $124,792 |
| Total | 999 (100.0%) | $113,266 |
Household Income in Middlebury
Household Income Brackets in Middlebury
With 299 households falling in the category, the $75,000 to $99,999 income range is the most frequent in Middlebury, accounting for 15.2% of all households. In contrast, only 84 households (4.3%) fall into the less than $10,000 income bracket, making it the least populous group.
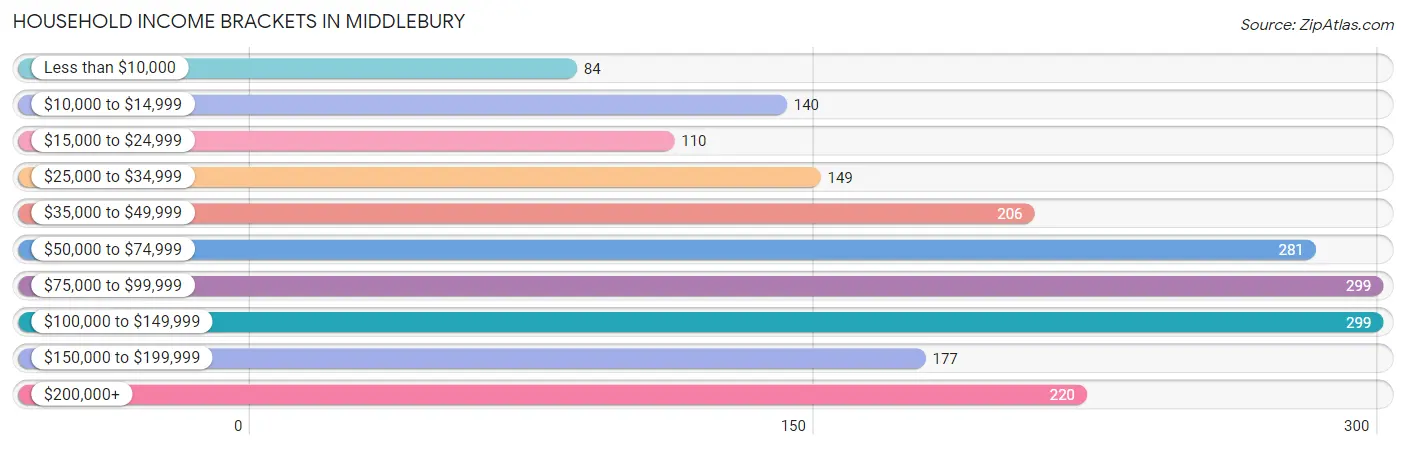
| Income Bracket | # Households | % Households |
| Less than $10,000 | 84 | 4.3% |
| $10,000 to $14,999 | 140 | 7.1% |
| $15,000 to $24,999 | 110 | 5.6% |
| $25,000 to $34,999 | 149 | 7.6% |
| $35,000 to $49,999 | 206 | 10.5% |
| $50,000 to $74,999 | 281 | 14.3% |
| $75,000 to $99,999 | 299 | 15.2% |
| $100,000 to $149,999 | 299 | 15.2% |
| $150,000 to $199,999 | 177 | 9.0% |
| $200,000+ | 220 | 11.2% |
Household Income by Householder Age in Middlebury
The median household income in Middlebury is $76,420, with the highest median household income of $93,523 found in the 25 to 44 years age bracket for the primary householder. A total of 431 households (21.9%) fall into this category. Meanwhile, the 15 to 24 years age bracket for the primary householder has the lowest median household income of $0, with 45 households (2.3%) in this group.
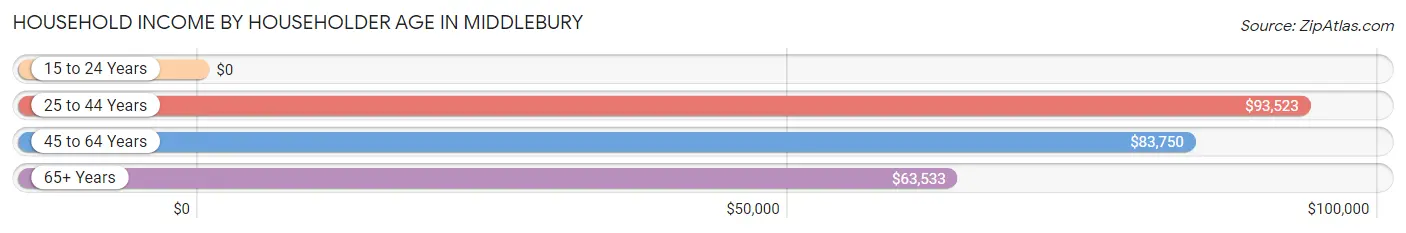
| Income Bracket | # Households | Median Income |
| 15 to 24 Years | 45 (2.3%) | $0 |
| 25 to 44 Years | 431 (21.9%) | $93,523 |
| 45 to 64 Years | 596 (30.3%) | $83,750 |
| 65+ Years | 893 (45.5%) | $63,533 |
| Total | 1,965 (100.0%) | $76,420 |
Poverty in Middlebury
Income Below Poverty by Sex and Age in Middlebury
With 13.4% poverty level for males and 14.4% for females among the residents of Middlebury, 16 and 17 year old males and 18 to 24 year old females are the most vulnerable to poverty, with 25 males (50.0%) and 142 females (66.7%) in their respective age groups living below the poverty level.
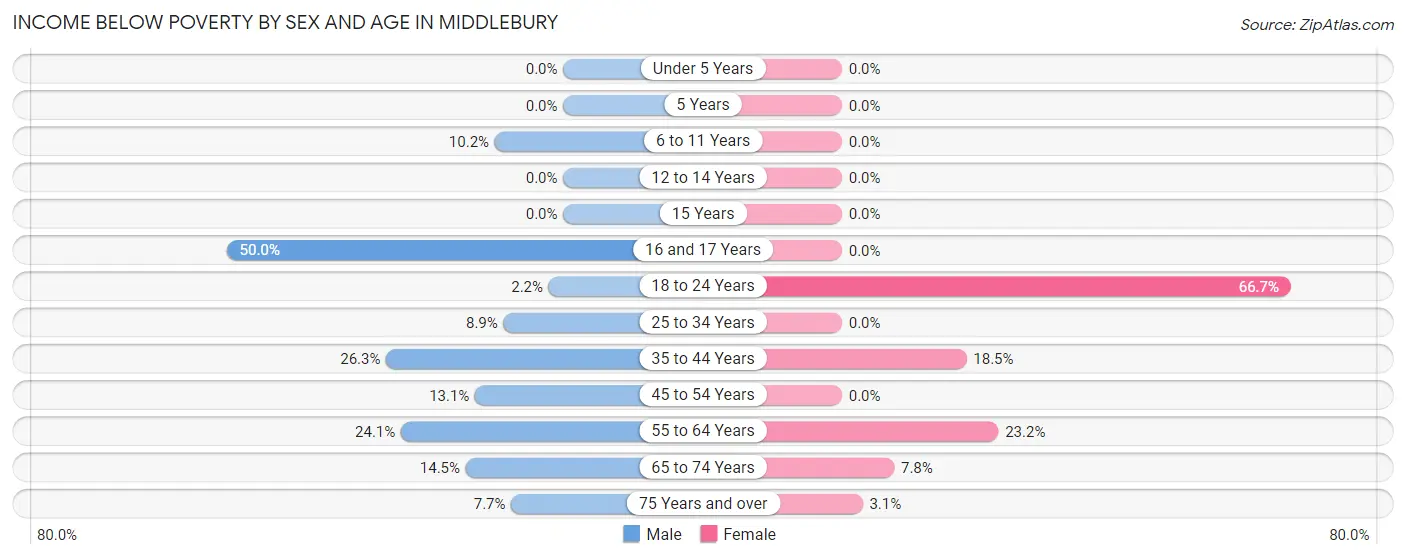
| Age Bracket | Male | Female |
| Under 5 Years | 0 (0.0%) | 0 (0.0%) |
| 5 Years | 0 (0.0%) | 0 (0.0%) |
| 6 to 11 Years | 13 (10.2%) | 0 (0.0%) |
| 12 to 14 Years | 0 (0.0%) | 0 (0.0%) |
| 15 Years | 0 (0.0%) | 0 (0.0%) |
| 16 and 17 Years | 25 (50.0%) | 0 (0.0%) |
| 18 to 24 Years | 2 (2.1%) | 142 (66.7%) |
| 25 to 34 Years | 26 (8.9%) | 0 (0.0%) |
| 35 to 44 Years | 51 (26.3%) | 47 (18.5%) |
| 45 to 54 Years | 25 (13.1%) | 0 (0.0%) |
| 55 to 64 Years | 53 (24.1%) | 82 (23.2%) |
| 65 to 74 Years | 43 (14.5%) | 25 (7.8%) |
| 75 Years and over | 24 (7.7%) | 12 (3.1%) |
| Total | 262 (13.4%) | 308 (14.4%) |
Income Above Poverty by Sex and Age in Middlebury
According to the poverty statistics in Middlebury, males aged under 5 years and females aged under 5 years are the age groups that are most secure financially, with 100.0% of males and 100.0% of females in these age groups living above the poverty line.
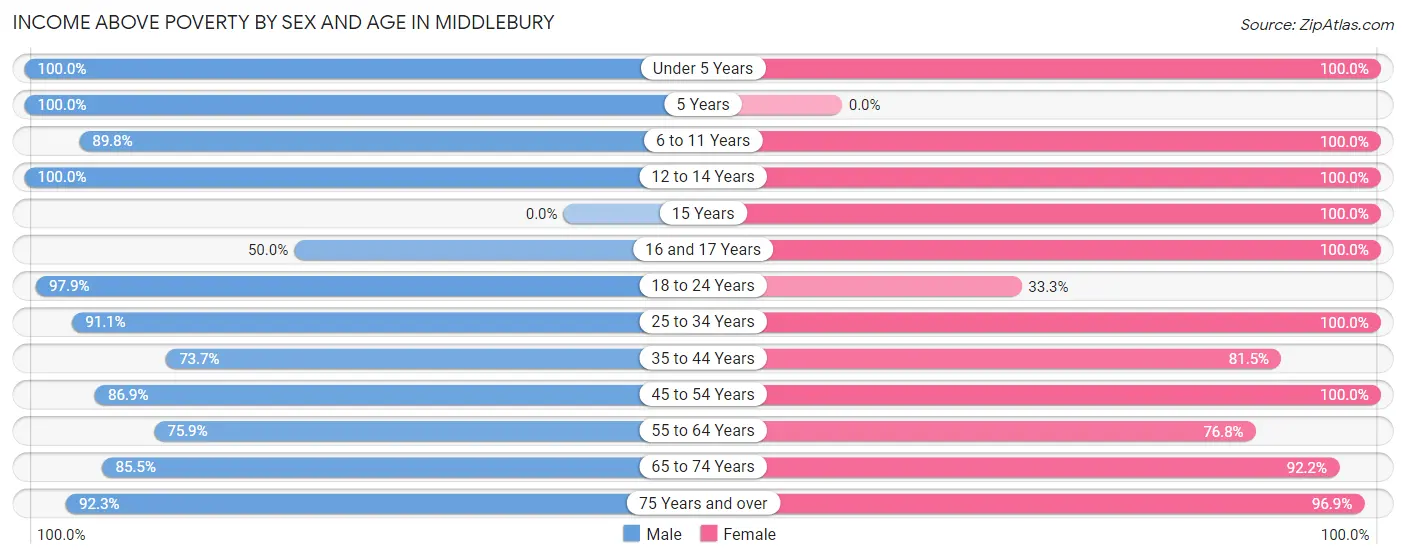
| Age Bracket | Male | Female |
| Under 5 Years | 113 (100.0%) | 102 (100.0%) |
| 5 Years | 29 (100.0%) | 0 (0.0%) |
| 6 to 11 Years | 115 (89.8%) | 21 (100.0%) |
| 12 to 14 Years | 35 (100.0%) | 63 (100.0%) |
| 15 Years | 0 (0.0%) | 30 (100.0%) |
| 16 and 17 Years | 25 (50.0%) | 47 (100.0%) |
| 18 to 24 Years | 91 (97.9%) | 71 (33.3%) |
| 25 to 34 Years | 267 (91.1%) | 175 (100.0%) |
| 35 to 44 Years | 143 (73.7%) | 207 (81.5%) |
| 45 to 54 Years | 166 (86.9%) | 173 (100.0%) |
| 55 to 64 Years | 167 (75.9%) | 271 (76.8%) |
| 65 to 74 Years | 254 (85.5%) | 297 (92.2%) |
| 75 Years and over | 287 (92.3%) | 379 (96.9%) |
| Total | 1,692 (86.6%) | 1,836 (85.6%) |
Income Below Poverty Among Married-Couple Families in Middlebury
The poverty statistics for married-couple families in Middlebury show that 4.2% or 34 of the total 802 families live below the poverty line. Families with no children have the highest poverty rate of 6.0%, comprising of 34 families. On the other hand, families with 1 or 2 children have the lowest poverty rate of 0.0%, which includes 0 families.
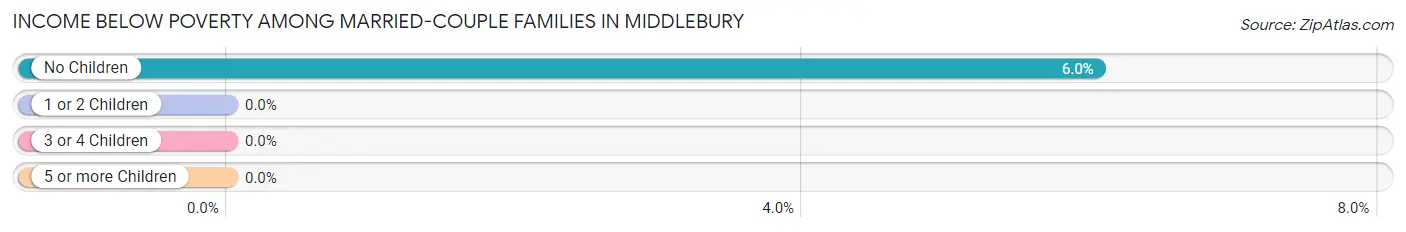
| Children | Above Poverty | Below Poverty |
| No Children | 529 (94.0%) | 34 (6.0%) |
| 1 or 2 Children | 210 (100.0%) | 0 (0.0%) |
| 3 or 4 Children | 29 (100.0%) | 0 (0.0%) |
| 5 or more Children | 0 (0.0%) | 0 (0.0%) |
| Total | 768 (95.8%) | 34 (4.2%) |
Income Below Poverty Among Single-Parent Households in Middlebury
According to the poverty data in Middlebury, 20.9% or 14 single-father households and 23.8% or 31 single-mother households are living below the poverty line. Among single-father households, those with 1 or 2 children have the highest poverty rate, with 14 households (40.0%) experiencing poverty. Likewise, among single-mother households, those with 1 or 2 children have the highest poverty rate, with 31 households (37.8%) falling below the poverty line.
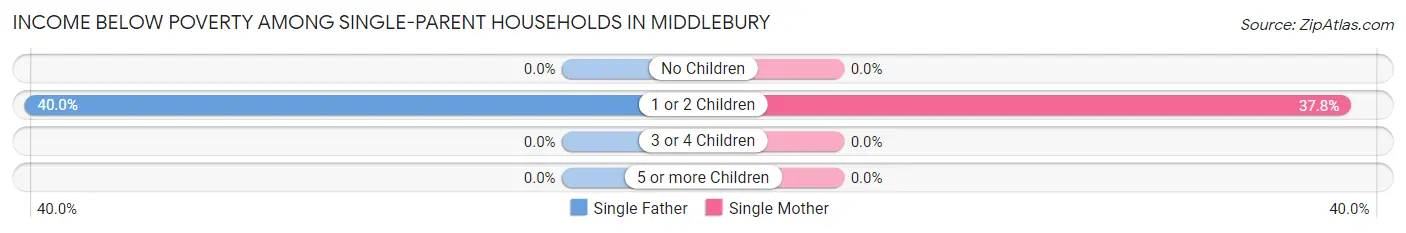
| Children | Single Father | Single Mother |
| No Children | 0 (0.0%) | 0 (0.0%) |
| 1 or 2 Children | 14 (40.0%) | 31 (37.8%) |
| 3 or 4 Children | 0 (0.0%) | 0 (0.0%) |
| 5 or more Children | 0 (0.0%) | 0 (0.0%) |
| Total | 14 (20.9%) | 31 (23.8%) |
Income Below Poverty Among Married-Couple vs Single-Parent Households in Middlebury
The poverty data for Middlebury shows that 34 of the married-couple family households (4.2%) and 45 of the single-parent households (22.8%) are living below the poverty level. Within the married-couple family households, those with no children have the highest poverty rate, with 34 households (6.0%) falling below the poverty line. Among the single-parent households, those with 1 or 2 children have the highest poverty rate, with 45 household (38.5%) living below poverty.
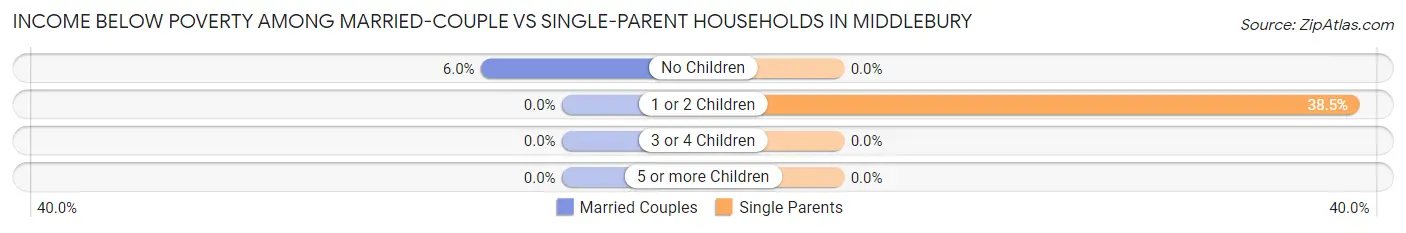
| Children | Married-Couple Families | Single-Parent Households |
| No Children | 34 (6.0%) | 0 (0.0%) |
| 1 or 2 Children | 0 (0.0%) | 45 (38.5%) |
| 3 or 4 Children | 0 (0.0%) | 0 (0.0%) |
| 5 or more Children | 0 (0.0%) | 0 (0.0%) |
| Total | 34 (4.2%) | 45 (22.8%) |
Race in Middlebury
The most populous races in Middlebury are White / Caucasian (5,578 | 80.7%), Asian (616 | 8.9%), and Two or more Races (459 | 6.6%).
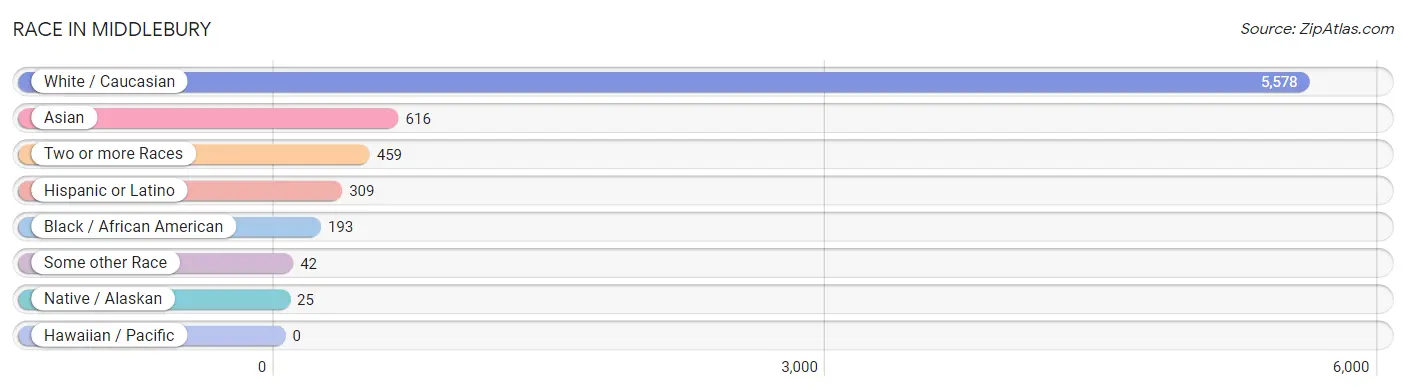
| Race | # Population | % Population |
| Asian | 616 | 8.9% |
| Black / African American | 193 | 2.8% |
| Hawaiian / Pacific | 0 | 0.0% |
| Hispanic or Latino | 309 | 4.5% |
| Native / Alaskan | 25 | 0.4% |
| White / Caucasian | 5,578 | 80.7% |
| Two or more Races | 459 | 6.6% |
| Some other Race | 42 | 0.6% |
| Total | 6,913 | 100.0% |
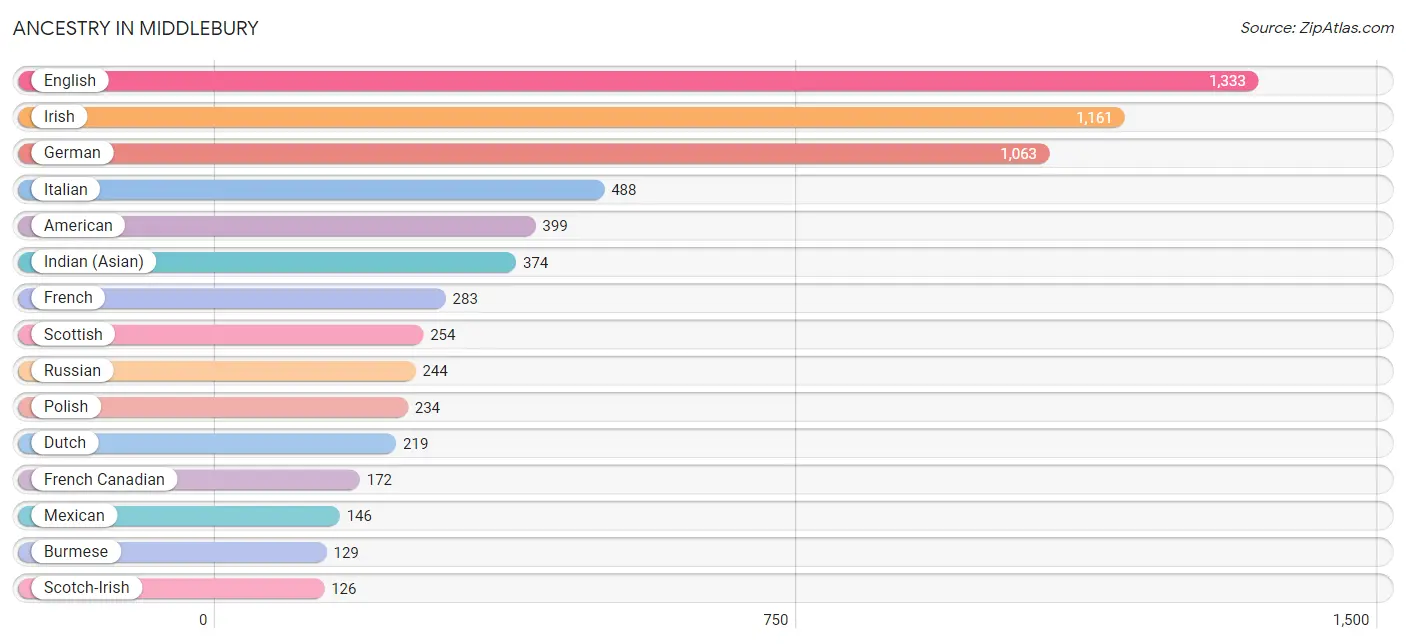
Ancestry in Middlebury
The most populous ancestries reported in Middlebury are English (1,333 | 19.3%), Irish (1,161 | 16.8%), German (1,063 | 15.4%), Italian (488 | 7.1%), and American (399 | 5.8%), together accounting for 64.3% of all Middlebury residents.
| Ancestry | # Population | % Population |
| African | 9 | 0.1% |
| Albanian | 12 | 0.2% |
| American | 399 | 5.8% |
| Arab | 21 | 0.3% |
| Argentinean | 5 | 0.1% |
| Armenian | 10 | 0.1% |
| Austrian | 54 | 0.8% |
| Belgian | 3 | 0.0% |
| Bhutanese | 75 | 1.1% |
| Blackfeet | 16 | 0.2% |
| Brazilian | 25 | 0.4% |
| British | 90 | 1.3% |
| Burmese | 129 | 1.9% |
| Canadian | 117 | 1.7% |
| Central American | 24 | 0.4% |
| Central American Indian | 26 | 0.4% |
| Cherokee | 11 | 0.2% |
| Chilean | 5 | 0.1% |
| Colombian | 11 | 0.2% |
| Cuban | 20 | 0.3% |
| Czech | 7 | 0.1% |
| Czechoslovakian | 12 | 0.2% |
| Danish | 54 | 0.8% |
| Dominican | 12 | 0.2% |
| Dutch | 219 | 3.2% |
| Eastern European | 101 | 1.5% |
| English | 1,333 | 19.3% |
| Ethiopian | 18 | 0.3% |
| European | 124 | 1.8% |
| Filipino | 12 | 0.2% |
| French | 283 | 4.1% |
| French Canadian | 172 | 2.5% |
| German | 1,063 | 15.4% |
| Greek | 63 | 0.9% |
| Guatemalan | 5 | 0.1% |
| Guyanese | 13 | 0.2% |
| Hungarian | 41 | 0.6% |
| Icelander | 10 | 0.1% |
| Indian (Asian) | 374 | 5.4% |
| Iranian | 14 | 0.2% |
| Irish | 1,161 | 16.8% |
| Italian | 488 | 7.1% |
| Jamaican | 84 | 1.2% |
| Kenyan | 9 | 0.1% |
| Korean | 53 | 0.8% |
| Lebanese | 14 | 0.2% |
| Lithuanian | 46 | 0.7% |
| Luxembourger | 26 | 0.4% |
| Mexican | 146 | 2.1% |
| Mexican American Indian | 9 | 0.1% |
| Nigerian | 21 | 0.3% |
| Northern European | 3 | 0.0% |
| Norwegian | 72 | 1.0% |
| Peruvian | 9 | 0.1% |
| Polish | 234 | 3.4% |
| Portuguese | 19 | 0.3% |
| Puerto Rican | 18 | 0.3% |
| Romanian | 6 | 0.1% |
| Russian | 244 | 3.5% |
| Salvadoran | 19 | 0.3% |
| Scandinavian | 40 | 0.6% |
| Scotch-Irish | 126 | 1.8% |
| Scottish | 254 | 3.7% |
| Senegalese | 1 | 0.0% |
| Serbian | 17 | 0.3% |
| Slovak | 9 | 0.1% |
| South American | 43 | 0.6% |
| Spaniard | 14 | 0.2% |
| Spanish | 4 | 0.1% |
| Sri Lankan | 125 | 1.8% |
| Subsaharan African | 68 | 1.0% |
| Swedish | 121 | 1.8% |
| Swiss | 97 | 1.4% |
| Thai | 98 | 1.4% |
| Turkish | 14 | 0.2% |
| Ukrainian | 43 | 0.6% |
| Venezuelan | 13 | 0.2% |
| Welsh | 51 | 0.7% |
| West Indian | 13 | 0.2% | View All 79 Rows |
Immigrants in Middlebury
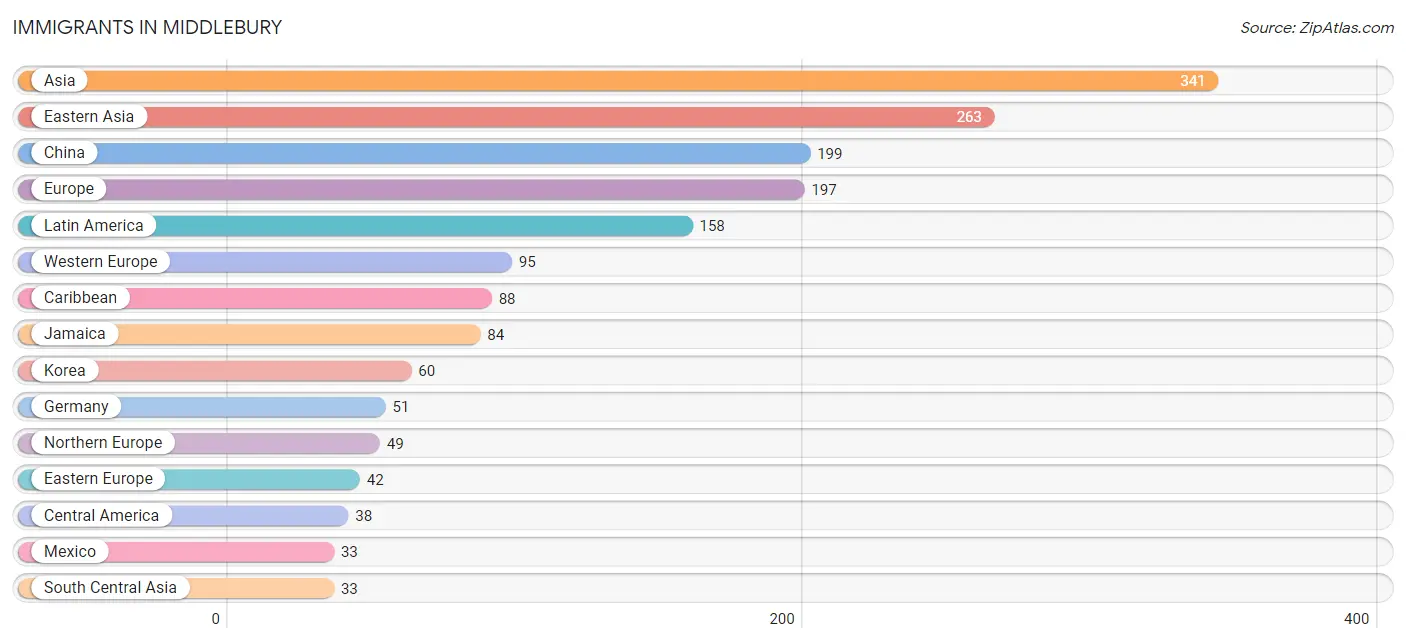
The most numerous immigrant groups reported in Middlebury came from Asia (341 | 4.9%), Eastern Asia (263 | 3.8%), China (199 | 2.9%), Europe (197 | 2.9%), and Latin America (158 | 2.3%), together accounting for 16.7% of all Middlebury residents.
| Immigration Origin | # Population | % Population |
| Africa | 24 | 0.4% |
| Albania | 12 | 0.2% |
| Asia | 341 | 4.9% |
| Austria | 12 | 0.2% |
| Bosnia and Herzegovina | 14 | 0.2% |
| Brazil | 15 | 0.2% |
| Canada | 20 | 0.3% |
| Caribbean | 88 | 1.3% |
| Central America | 38 | 0.5% |
| China | 199 | 2.9% |
| Dominican Republic | 4 | 0.1% |
| Eastern Africa | 15 | 0.2% |
| Eastern Asia | 263 | 3.8% |
| Eastern Europe | 42 | 0.6% |
| England | 31 | 0.4% |
| Europe | 197 | 2.9% |
| France | 13 | 0.2% |
| Germany | 51 | 0.7% |
| Guatemala | 5 | 0.1% |
| Hong Kong | 9 | 0.1% |
| India | 8 | 0.1% |
| Iran | 8 | 0.1% |
| Jamaica | 84 | 1.2% |
| Japan | 4 | 0.1% |
| Kenya | 9 | 0.1% |
| Korea | 60 | 0.9% |
| Latin America | 158 | 2.3% |
| Mexico | 33 | 0.5% |
| Nepal | 3 | 0.0% |
| Nigeria | 6 | 0.1% |
| Northern Europe | 49 | 0.7% |
| Pakistan | 14 | 0.2% |
| Peru | 4 | 0.1% |
| Philippines | 15 | 0.2% |
| Romania | 6 | 0.1% |
| Senegal | 1 | 0.0% |
| Serbia | 5 | 0.1% |
| Singapore | 3 | 0.0% |
| South Africa | 2 | 0.0% |
| South America | 32 | 0.5% |
| South Central Asia | 33 | 0.5% |
| South Eastern Asia | 31 | 0.4% |
| Southern Europe | 11 | 0.2% |
| Spain | 11 | 0.2% |
| Switzerland | 19 | 0.3% |
| Taiwan | 11 | 0.2% |
| Turkey | 14 | 0.2% |
| Ukraine | 5 | 0.1% |
| Venezuela | 13 | 0.2% |
| Vietnam | 13 | 0.2% |
| Western Africa | 7 | 0.1% |
| Western Asia | 14 | 0.2% |
| Western Europe | 95 | 1.4% | View All 53 Rows |
Sex and Age in Middlebury
Sex and Age in Middlebury
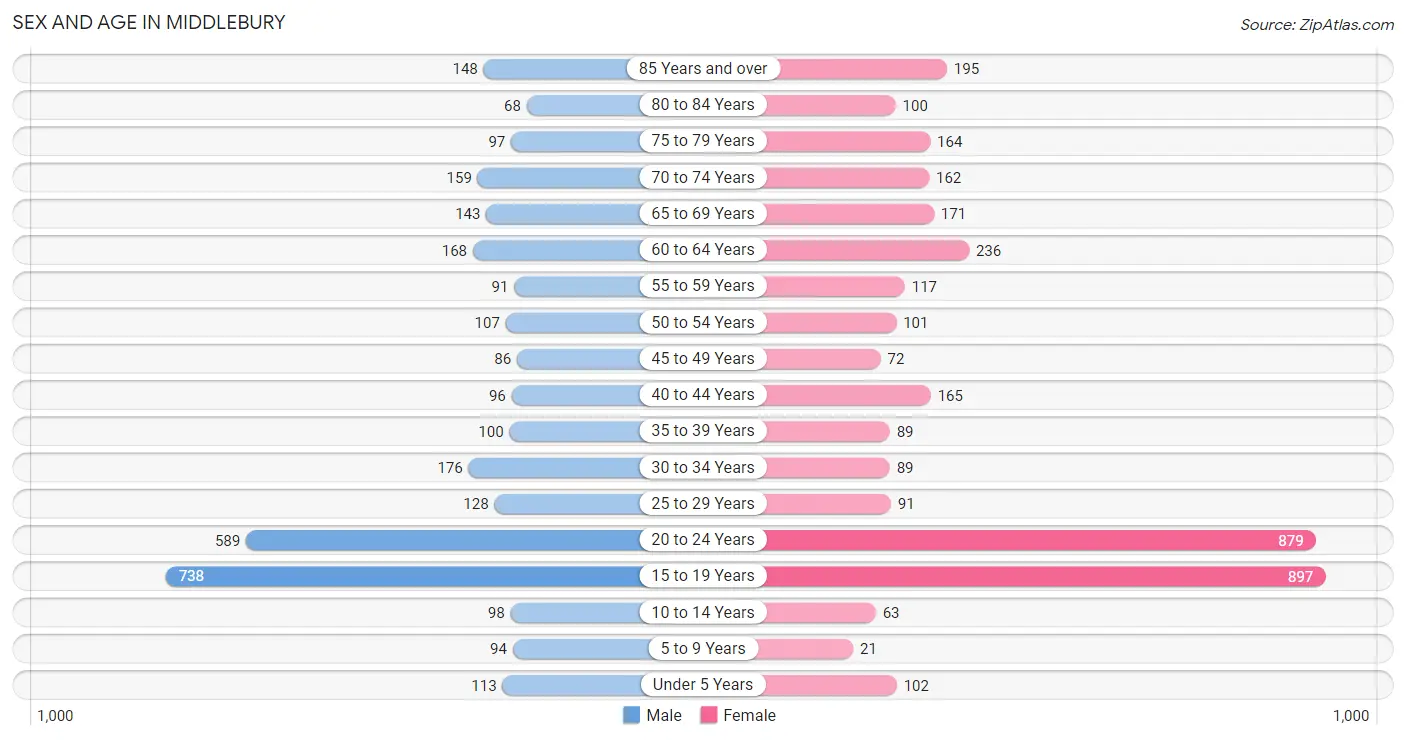
The most populous age groups in Middlebury are 15 to 19 Years (738 | 23.1%) for men and 15 to 19 Years (897 | 24.1%) for women.
| Age Bracket | Male | Female |
| Under 5 Years | 113 (3.5%) | 102 (2.8%) |
| 5 to 9 Years | 94 (2.9%) | 21 (0.6%) |
| 10 to 14 Years | 98 (3.1%) | 63 (1.7%) |
| 15 to 19 Years | 738 (23.1%) | 897 (24.1%) |
| 20 to 24 Years | 589 (18.4%) | 879 (23.7%) |
| 25 to 29 Years | 128 (4.0%) | 91 (2.5%) |
| 30 to 34 Years | 176 (5.5%) | 89 (2.4%) |
| 35 to 39 Years | 100 (3.1%) | 89 (2.4%) |
| 40 to 44 Years | 96 (3.0%) | 165 (4.4%) |
| 45 to 49 Years | 86 (2.7%) | 72 (1.9%) |
| 50 to 54 Years | 107 (3.3%) | 101 (2.7%) |
| 55 to 59 Years | 91 (2.8%) | 117 (3.2%) |
| 60 to 64 Years | 168 (5.2%) | 236 (6.4%) |
| 65 to 69 Years | 143 (4.5%) | 171 (4.6%) |
| 70 to 74 Years | 159 (5.0%) | 162 (4.4%) |
| 75 to 79 Years | 97 (3.0%) | 164 (4.4%) |
| 80 to 84 Years | 68 (2.1%) | 100 (2.7%) |
| 85 Years and over | 148 (4.6%) | 195 (5.2%) |
| Total | 3,199 (100.0%) | 3,714 (100.0%) |
Families and Households in Middlebury
Median Family Size in Middlebury
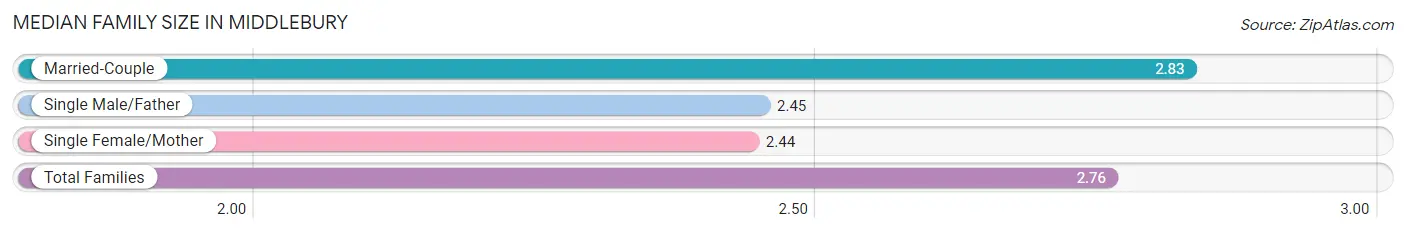
The median family size in Middlebury is 2.76 persons per family, with married-couple families (802 | 80.3%) accounting for the largest median family size of 2.83 persons per family. On the other hand, single female/mother families (130 | 13.0%) represent the smallest median family size with 2.44 persons per family.
| Family Type | # Families | Family Size |
| Married-Couple | 802 (80.3%) | 2.83 |
| Single Male/Father | 67 (6.7%) | 2.45 |
| Single Female/Mother | 130 (13.0%) | 2.44 |
| Total Families | 999 (100.0%) | 2.76 |
Median Household Size in Middlebury
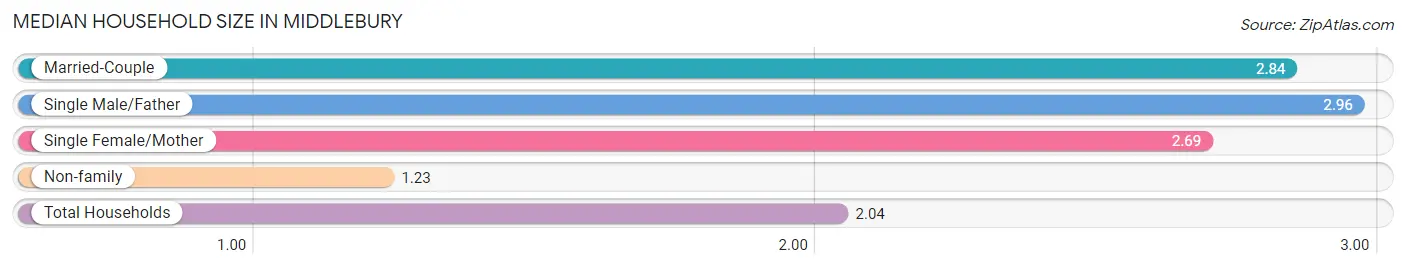
The median household size in Middlebury is 2.04 persons per household, with single male/father households (67 | 3.4%) accounting for the largest median household size of 2.96 persons per household. non-family households (966 | 49.2%) represent the smallest median household size with 1.23 persons per household.
| Household Type | # Households | Household Size |
| Married-Couple | 802 (40.8%) | 2.84 |
| Single Male/Father | 67 (3.4%) | 2.96 |
| Single Female/Mother | 130 (6.6%) | 2.69 |
| Non-family | 966 (49.2%) | 1.23 |
| Total Households | 1,965 (100.0%) | 2.04 |
Household Size by Marriage Status in Middlebury
Out of a total of 1,965 households in Middlebury, 999 (50.8%) are family households, while 966 (49.2%) are nonfamily households. The most numerous type of family households are 2-person households, comprising 633, and the most common type of nonfamily households are 1-person households, comprising 807.
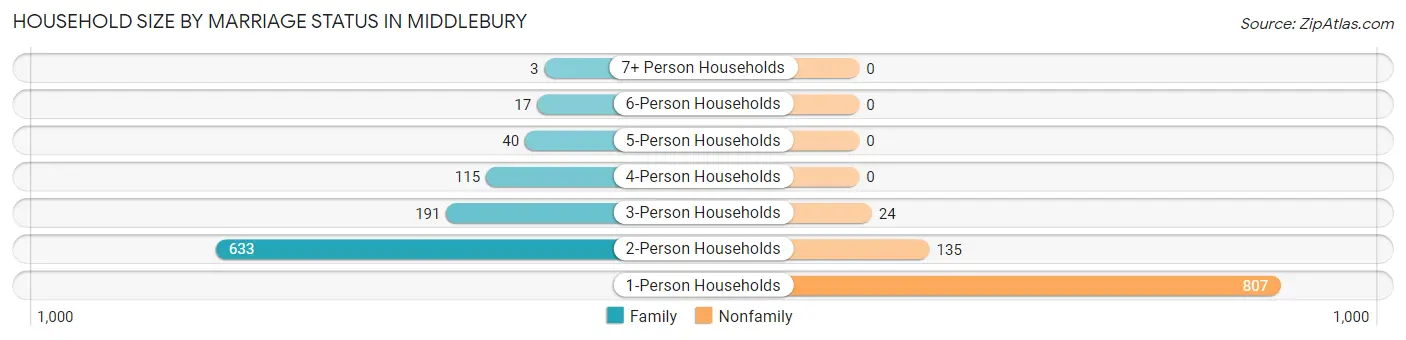
| Household Size | Family Households | Nonfamily Households |
| 1-Person Households | - | 807 (41.1%) |
| 2-Person Households | 633 (32.2%) | 135 (6.9%) |
| 3-Person Households | 191 (9.7%) | 24 (1.2%) |
| 4-Person Households | 115 (5.9%) | 0 (0.0%) |
| 5-Person Households | 40 (2.0%) | 0 (0.0%) |
| 6-Person Households | 17 (0.9%) | 0 (0.0%) |
| 7+ Person Households | 3 (0.2%) | 0 (0.0%) |
| Total | 999 (50.8%) | 966 (49.2%) |
Female Fertility in Middlebury
Fertility by Age in Middlebury
Average fertility rate in Middlebury is 13.0 births per 1,000 women. Women in the age bracket of 35 to 50 years have the highest fertility rate with 53.0 births per 1,000 women. Women in the age bracket of 35 to 50 years acount for 62.1% of all women with births.
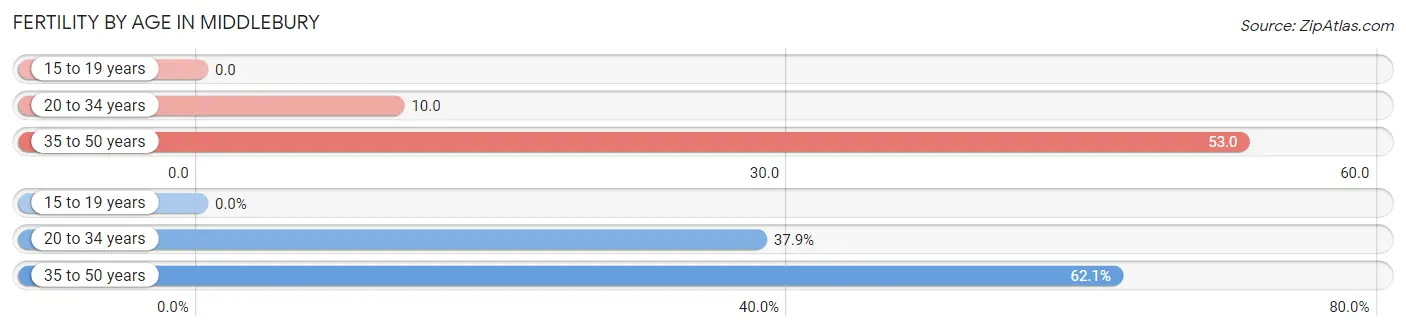
| Age Bracket | Women with Births | Births / 1,000 Women |
| 15 to 19 years | 0 (0.0%) | 0.0 |
| 20 to 34 years | 11 (37.9%) | 10.0 |
| 35 to 50 years | 18 (62.1%) | 53.0 |
| Total | 29 (100.0%) | 13.0 |
Fertility by Age by Marriage Status in Middlebury
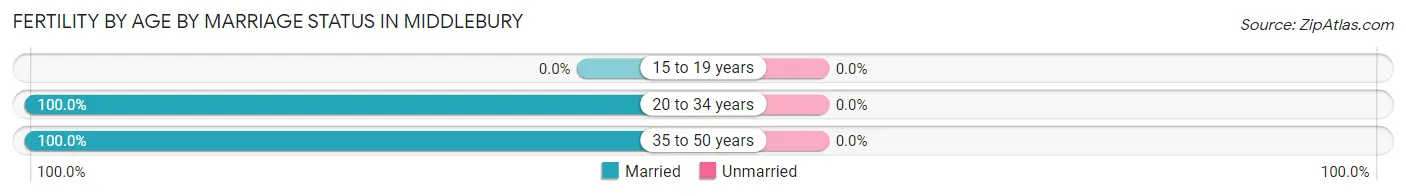
| Age Bracket | Married | Unmarried |
| 15 to 19 years | 0 (0.0%) | 0 (0.0%) |
| 20 to 34 years | 11 (100.0%) | 0 (0.0%) |
| 35 to 50 years | 18 (100.0%) | 0 (0.0%) |
| Total | 29 (100.0%) | 0 (0.0%) |
Fertility by Education in Middlebury
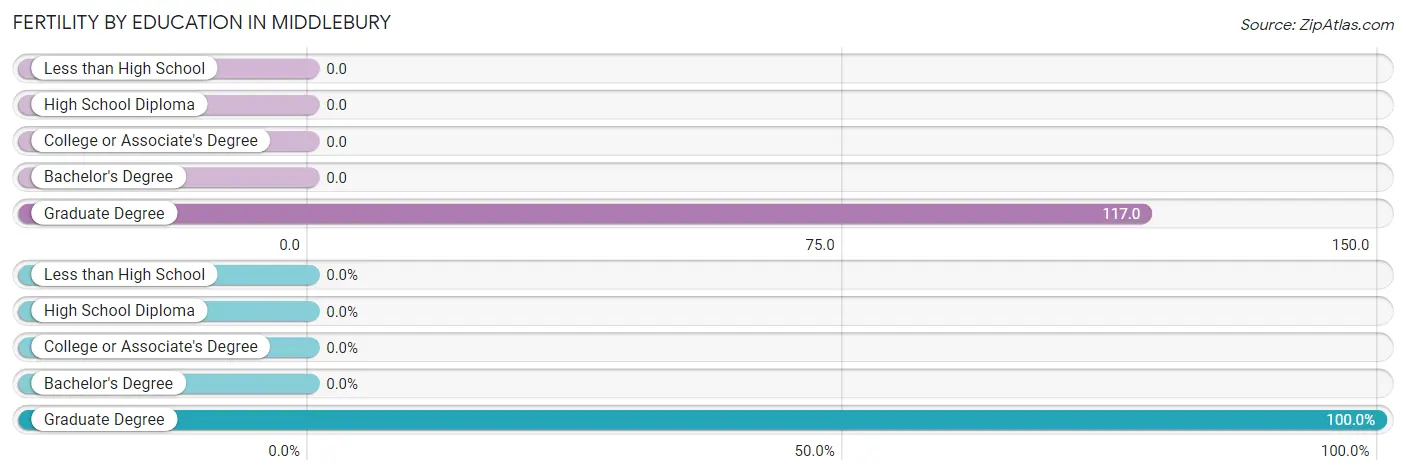
| Educational Attainment | Women with Births | Births / 1,000 Women |
| Less than High School | 0 (0.0%) | 0.0 |
| High School Diploma | 0 (0.0%) | 0.0 |
| College or Associate's Degree | 0 (0.0%) | 0.0 |
| Bachelor's Degree | 0 (0.0%) | 0.0 |
| Graduate Degree | 29 (100.0%) | 117.0 |
| Total | 29 (100.0%) | 13.0 |
Fertility by Education by Marriage Status in Middlebury
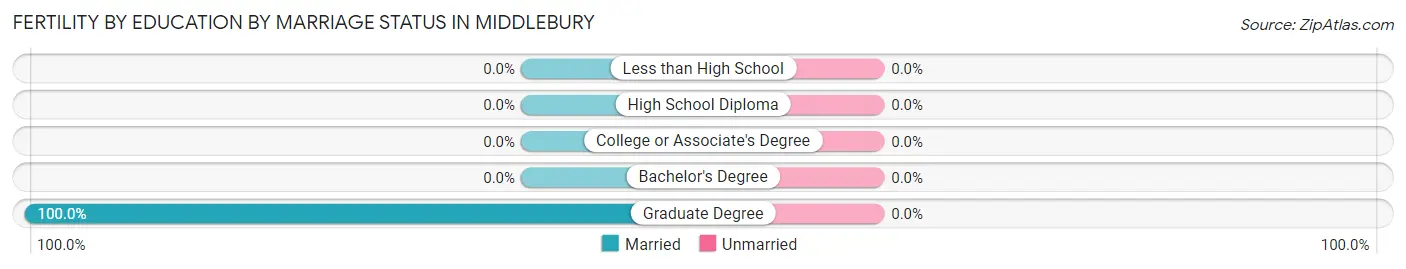
| Educational Attainment | Married | Unmarried |
| Less than High School | 0 (0.0%) | 0 (0.0%) |
| High School Diploma | 0 (0.0%) | 0 (0.0%) |
| College or Associate's Degree | 0 (0.0%) | 0 (0.0%) |
| Bachelor's Degree | 0 (0.0%) | 0 (0.0%) |
| Graduate Degree | 29 (100.0%) | 0 (0.0%) |
| Total | 29 (100.0%) | 0 (0.0%) |
Employment Characteristics in Middlebury
Employment by Class of Employer in Middlebury
Among the 2,579 employed individuals in Middlebury, not-for-profit organizations (1,127 | 43.7%), private company employees (1,024 | 39.7%), and local government employees (132 | 5.1%) make up the most common classes of employment.
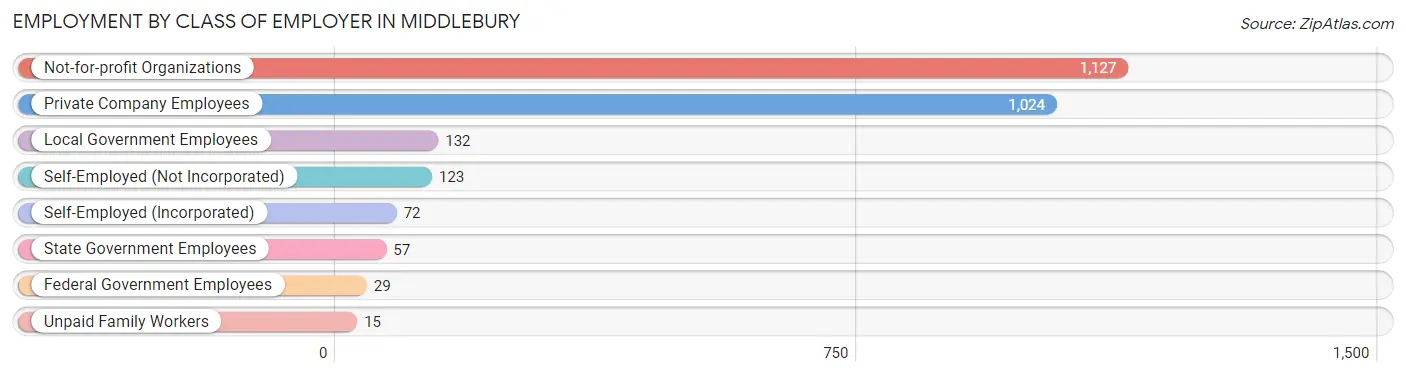
| Employer Class | # Employees | % Employees |
| Private Company Employees | 1,024 | 39.7% |
| Self-Employed (Incorporated) | 72 | 2.8% |
| Self-Employed (Not Incorporated) | 123 | 4.8% |
| Not-for-profit Organizations | 1,127 | 43.7% |
| Local Government Employees | 132 | 5.1% |
| State Government Employees | 57 | 2.2% |
| Federal Government Employees | 29 | 1.1% |
| Unpaid Family Workers | 15 | 0.6% |
| Total | 2,579 | 100.0% |
Employment Status by Age in Middlebury
According to the labor force statistics for Middlebury, out of the total population over 16 years of age (6,392), 44.5% or 2,844 individuals are in the labor force, with 5.8% or 165 of them unemployed. The age group with the highest labor force participation rate is 30 to 34 years, with 81.1% or 215 individuals in the labor force. Within the labor force, the 16 to 19 years age range has the highest percentage of unemployed individuals, with 13.7% or 60 of them being unemployed.
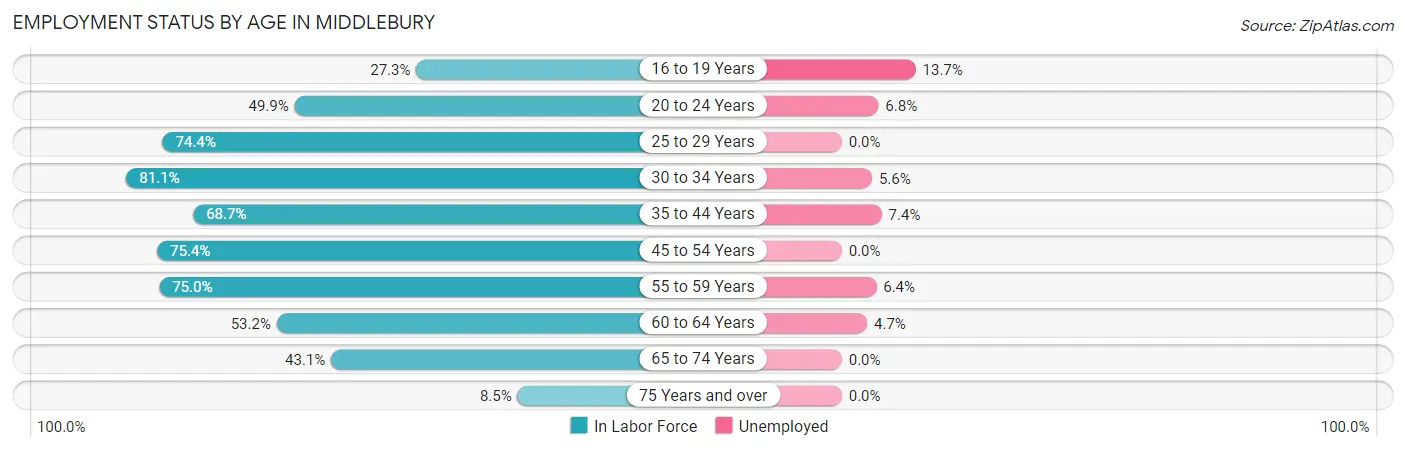
| Age Bracket | In Labor Force | Unemployed |
| 16 to 19 Years | 438 (27.3%) | 60 (13.7%) |
| 20 to 24 Years | 733 (49.9%) | 50 (6.8%) |
| 25 to 29 Years | 163 (74.4%) | 0 (0.0%) |
| 30 to 34 Years | 215 (81.1%) | 12 (5.6%) |
| 35 to 44 Years | 309 (68.7%) | 23 (7.4%) |
| 45 to 54 Years | 276 (75.4%) | 0 (0.0%) |
| 55 to 59 Years | 156 (75.0%) | 10 (6.4%) |
| 60 to 64 Years | 215 (53.2%) | 10 (4.7%) |
| 65 to 74 Years | 274 (43.1%) | 0 (0.0%) |
| 75 Years and over | 66 (8.5%) | 0 (0.0%) |
| Total | 2,844 (44.5%) | 165 (5.8%) |
Employment Status by Educational Attainment in Middlebury
According to labor force statistics for Middlebury, 69.8% of individuals (1,335) out of the total population between 25 and 64 years of age (1,912) are in the labor force, with 4.2% or 56 of them being unemployed. The group with the highest labor force participation rate are those with the educational attainment of college / associate degree, with 77.1% or 226 individuals in the labor force. Within the labor force, individuals with high school diploma education have the highest percentage of unemployment, with 6.1% or 12 of them being unemployed.
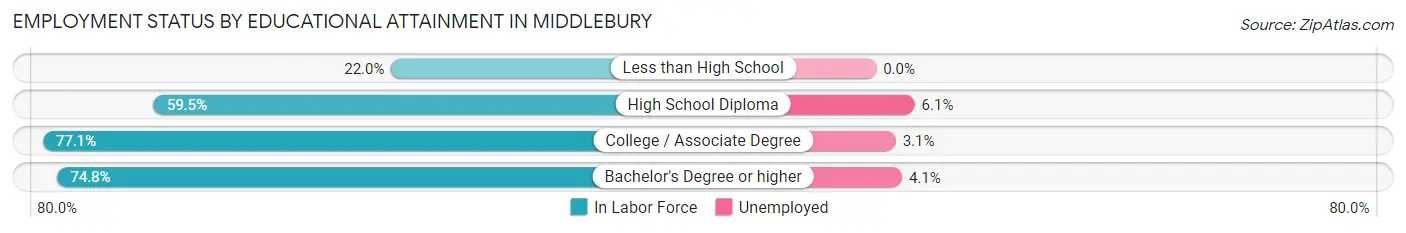
| Educational Attainment | In Labor Force | Unemployed |
| Less than High School | 22 (22.0%) | 0 (0.0%) |
| High School Diploma | 197 (59.5%) | 20 (6.1%) |
| College / Associate Degree | 226 (77.1%) | 9 (3.1%) |
| Bachelor's Degree or higher | 889 (74.8%) | 49 (4.1%) |
| Total | 1,335 (69.8%) | 80 (4.2%) |
Employment Occupations by Sex in Middlebury
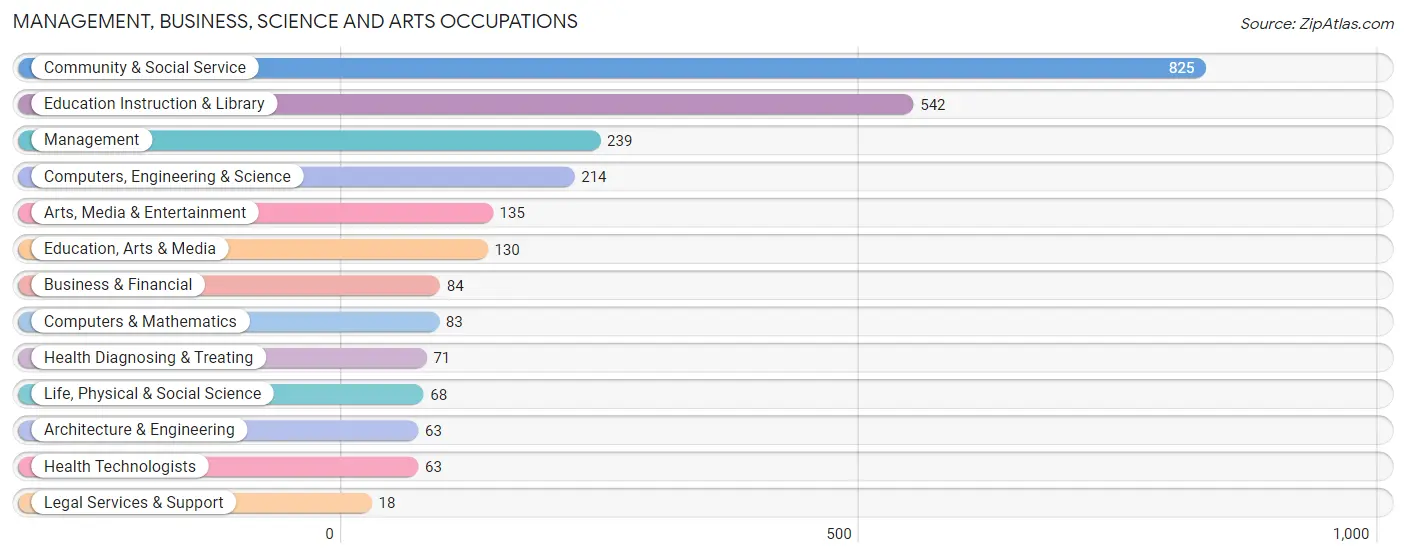
Management, Business, Science and Arts Occupations
The most common Management, Business, Science and Arts occupations in Middlebury are Community & Social Service (825 | 30.9%), Education Instruction & Library (542 | 20.3%), Management (239 | 8.9%), Computers, Engineering & Science (214 | 8.0%), and Arts, Media & Entertainment (135 | 5.1%).
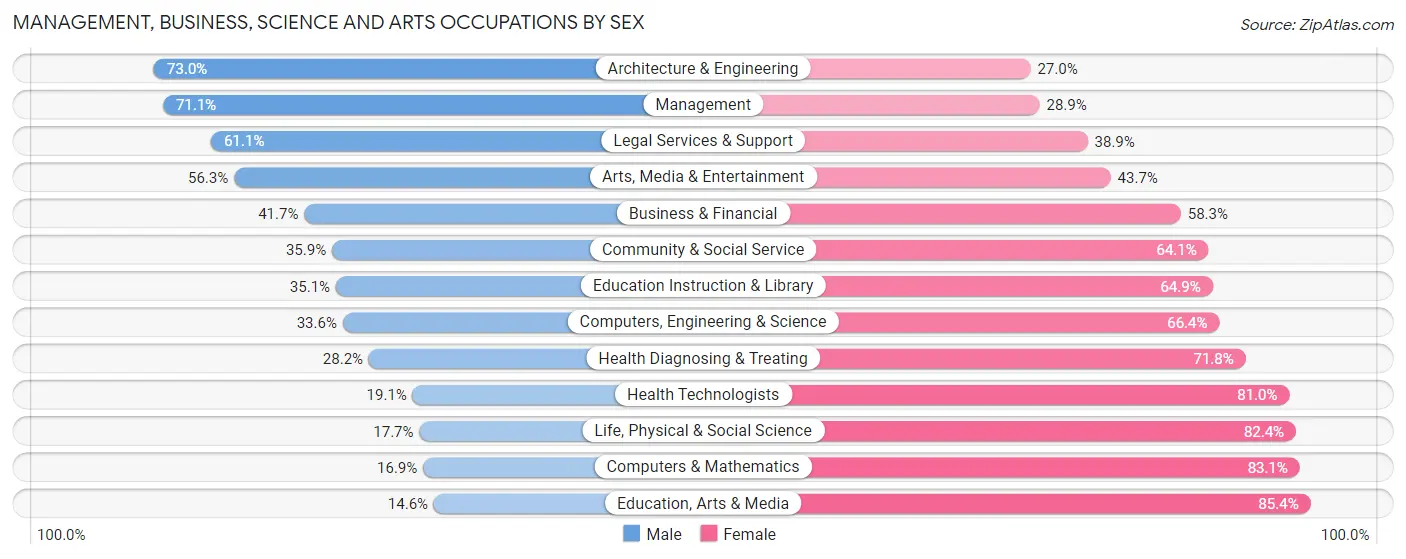
Management, Business, Science and Arts Occupations by Sex
Within the Management, Business, Science and Arts occupations in Middlebury, the most male-oriented occupations are Architecture & Engineering (73.0%), Management (71.1%), and Legal Services & Support (61.1%), while the most female-oriented occupations are Education, Arts & Media (85.4%), Computers & Mathematics (83.1%), and Life, Physical & Social Science (82.4%).
| Occupation | Male | Female |
| Management | 170 (71.1%) | 69 (28.9%) |
| Business & Financial | 35 (41.7%) | 49 (58.3%) |
| Computers, Engineering & Science | 72 (33.6%) | 142 (66.4%) |
| Computers & Mathematics | 14 (16.9%) | 69 (83.1%) |
| Architecture & Engineering | 46 (73.0%) | 17 (27.0%) |
| Life, Physical & Social Science | 12 (17.6%) | 56 (82.4%) |
| Community & Social Service | 296 (35.9%) | 529 (64.1%) |
| Education, Arts & Media | 19 (14.6%) | 111 (85.4%) |
| Legal Services & Support | 11 (61.1%) | 7 (38.9%) |
| Education Instruction & Library | 190 (35.1%) | 352 (64.9%) |
| Arts, Media & Entertainment | 76 (56.3%) | 59 (43.7%) |
| Health Diagnosing & Treating | 20 (28.2%) | 51 (71.8%) |
| Health Technologists | 12 (19.1%) | 51 (80.9%) |
| Total (Category) | 593 (41.4%) | 840 (58.6%) |
| Total (Overall) | 1,157 (43.3%) | 1,513 (56.7%) |
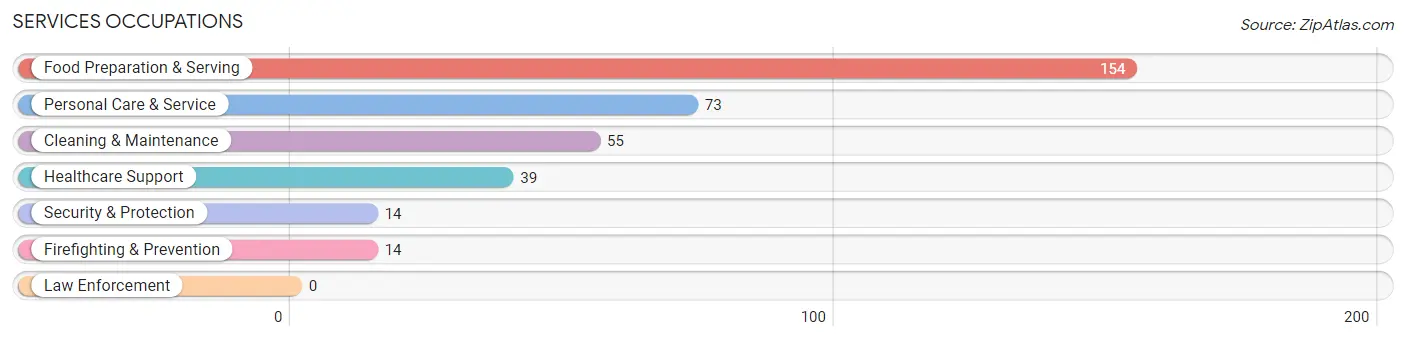
Services Occupations
The most common Services occupations in Middlebury are Food Preparation & Serving (154 | 5.8%), Personal Care & Service (73 | 2.7%), Cleaning & Maintenance (55 | 2.1%), Healthcare Support (39 | 1.5%), and Security & Protection (14 | 0.5%).
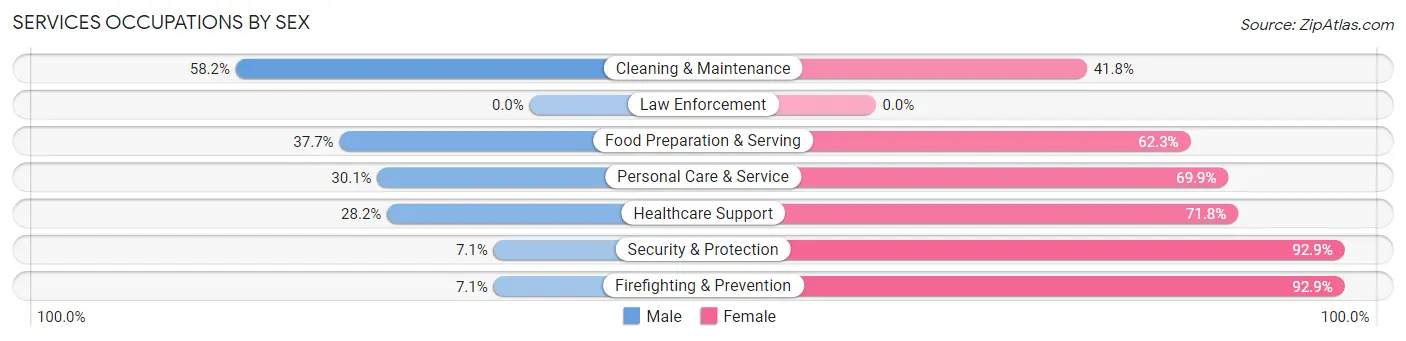
Services Occupations by Sex
Within the Services occupations in Middlebury, the most male-oriented occupations are Cleaning & Maintenance (58.2%), Food Preparation & Serving (37.7%), and Personal Care & Service (30.1%), while the most female-oriented occupations are Security & Protection (92.9%), Firefighting & Prevention (92.9%), and Healthcare Support (71.8%).
| Occupation | Male | Female |
| Healthcare Support | 11 (28.2%) | 28 (71.8%) |
| Security & Protection | 1 (7.1%) | 13 (92.9%) |
| Firefighting & Prevention | 1 (7.1%) | 13 (92.9%) |
| Law Enforcement | 0 (0.0%) | 0 (0.0%) |
| Food Preparation & Serving | 58 (37.7%) | 96 (62.3%) |
| Cleaning & Maintenance | 32 (58.2%) | 23 (41.8%) |
| Personal Care & Service | 22 (30.1%) | 51 (69.9%) |
| Total (Category) | 124 (37.0%) | 211 (63.0%) |
| Total (Overall) | 1,157 (43.3%) | 1,513 (56.7%) |
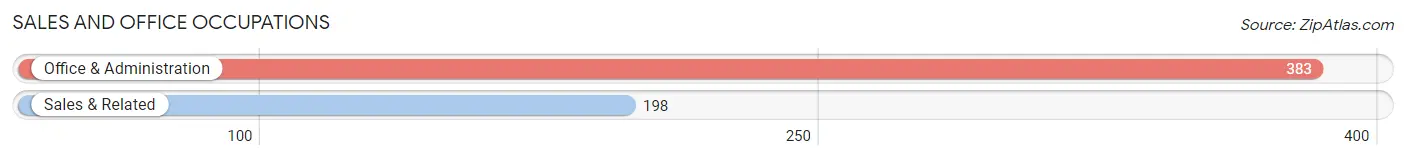
Sales and Office Occupations
The most common Sales and Office occupations in Middlebury are Office & Administration (383 | 14.3%), and Sales & Related (198 | 7.4%).
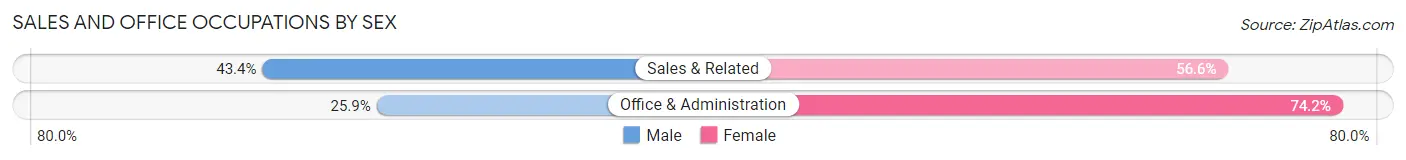
Sales and Office Occupations by Sex
| Occupation | Male | Female |
| Sales & Related | 86 (43.4%) | 112 (56.6%) |
| Office & Administration | 99 (25.9%) | 284 (74.2%) |
| Total (Category) | 185 (31.8%) | 396 (68.2%) |
| Total (Overall) | 1,157 (43.3%) | 1,513 (56.7%) |
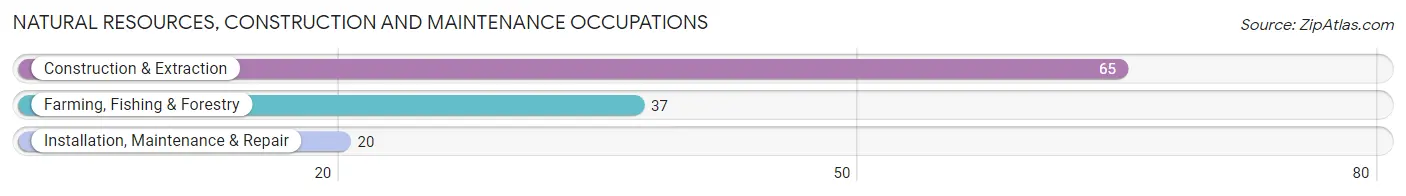
Natural Resources, Construction and Maintenance Occupations
The most common Natural Resources, Construction and Maintenance occupations in Middlebury are Construction & Extraction (65 | 2.4%), Farming, Fishing & Forestry (37 | 1.4%), and Installation, Maintenance & Repair (20 | 0.7%).
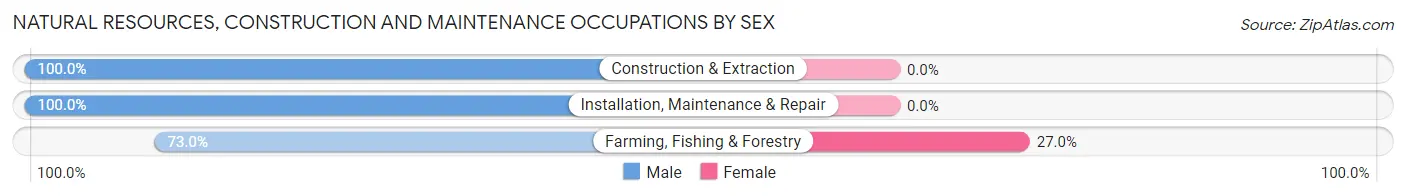
Natural Resources, Construction and Maintenance Occupations by Sex
| Occupation | Male | Female |
| Farming, Fishing & Forestry | 27 (73.0%) | 10 (27.0%) |
| Construction & Extraction | 65 (100.0%) | 0 (0.0%) |
| Installation, Maintenance & Repair | 20 (100.0%) | 0 (0.0%) |
| Total (Category) | 112 (91.8%) | 10 (8.2%) |
| Total (Overall) | 1,157 (43.3%) | 1,513 (56.7%) |
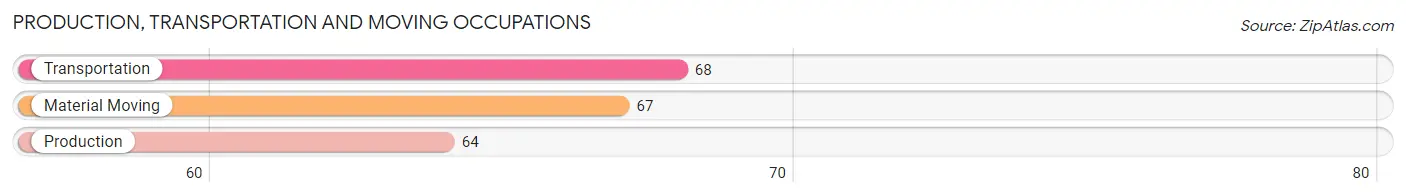
Production, Transportation and Moving Occupations
The most common Production, Transportation and Moving occupations in Middlebury are Transportation (68 | 2.5%), Material Moving (67 | 2.5%), and Production (64 | 2.4%).
Production, Transportation and Moving Occupations by Sex
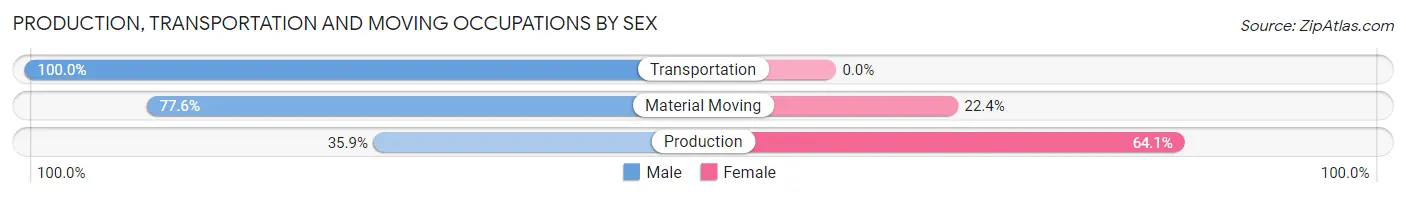
| Occupation | Male | Female |
| Production | 23 (35.9%) | 41 (64.1%) |
| Transportation | 68 (100.0%) | 0 (0.0%) |
| Material Moving | 52 (77.6%) | 15 (22.4%) |
| Total (Category) | 143 (71.9%) | 56 (28.1%) |
| Total (Overall) | 1,157 (43.3%) | 1,513 (56.7%) |
Employment Industries by Sex in Middlebury
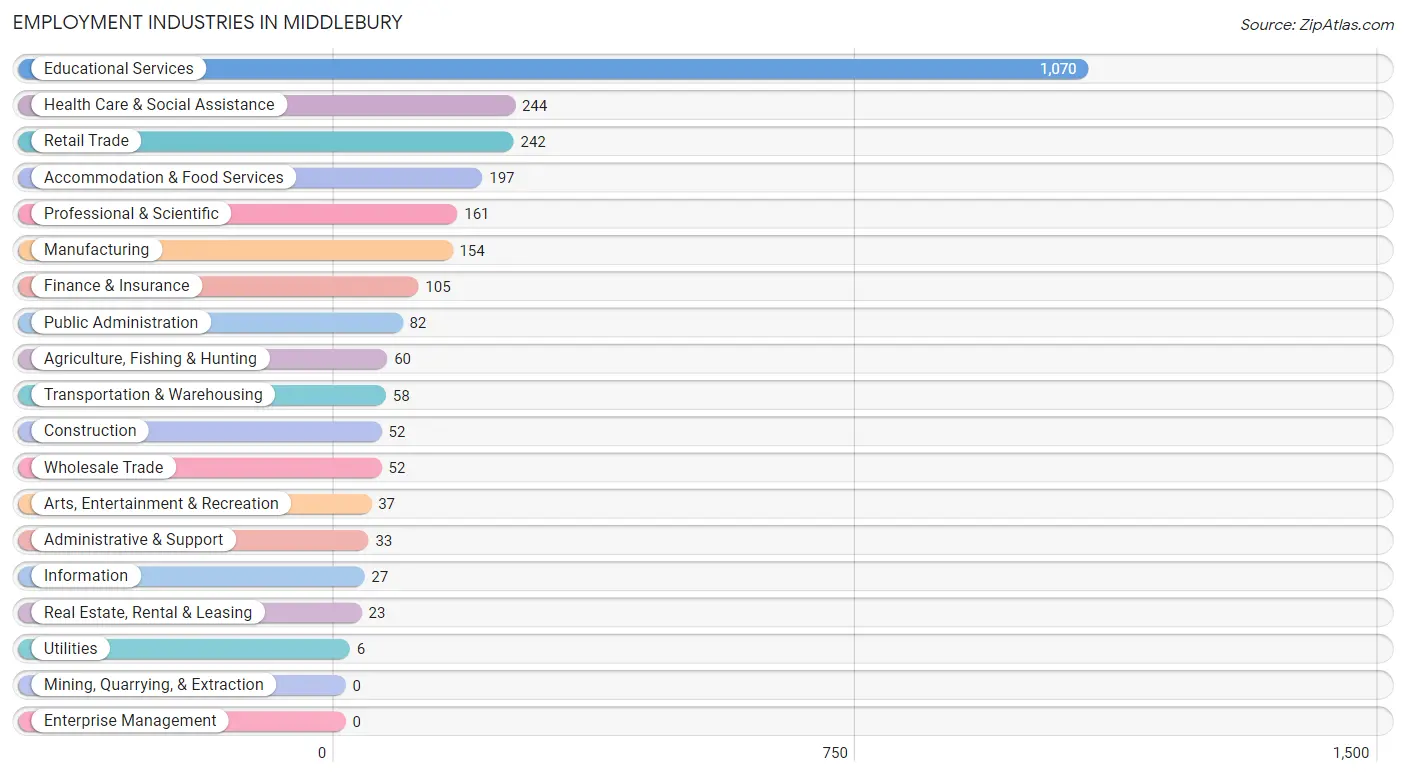
Employment Industries in Middlebury
The major employment industries in Middlebury include Educational Services (1,070 | 40.1%), Health Care & Social Assistance (244 | 9.1%), Retail Trade (242 | 9.1%), Accommodation & Food Services (197 | 7.4%), and Professional & Scientific (161 | 6.0%).
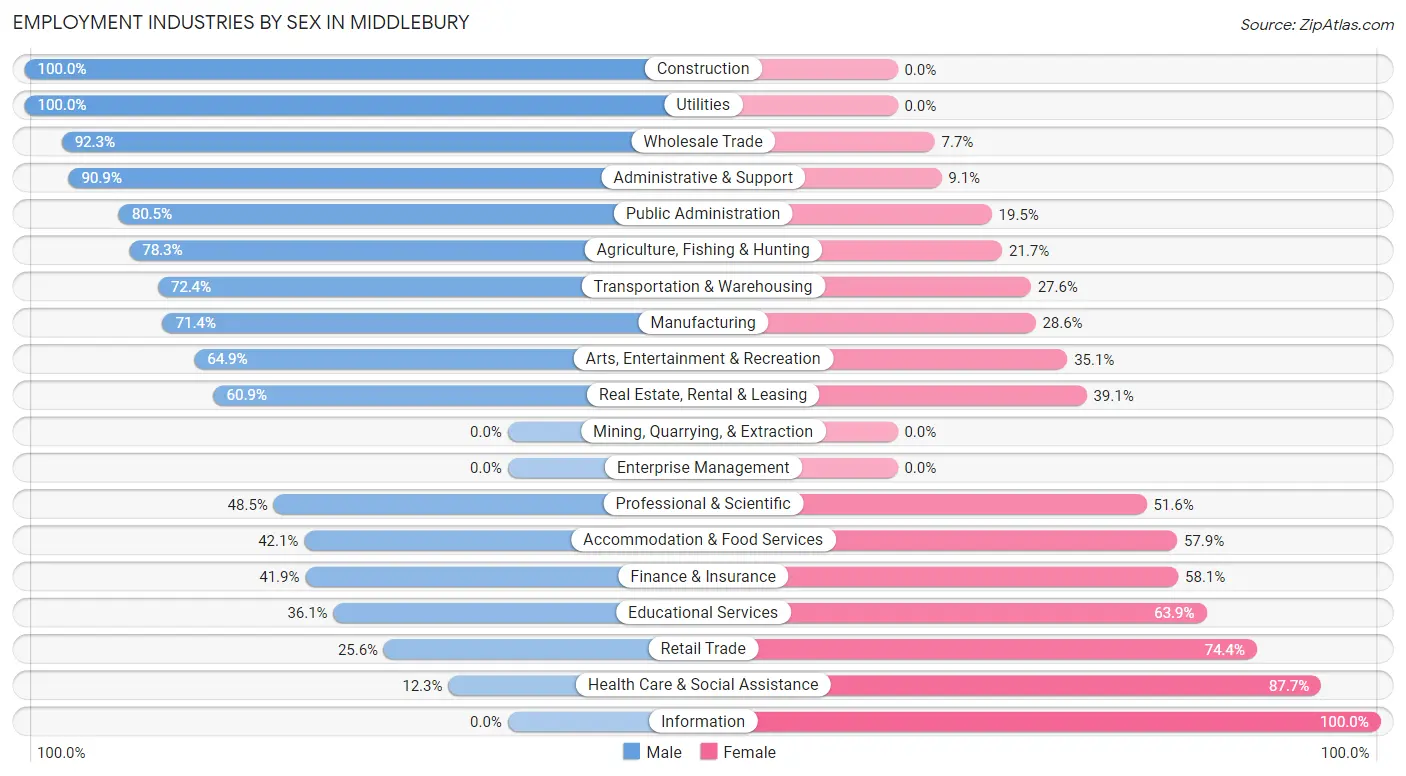
Employment Industries by Sex in Middlebury
The Middlebury industries that see more men than women are Construction (100.0%), Utilities (100.0%), and Wholesale Trade (92.3%), whereas the industries that tend to have a higher number of women are Information (100.0%), Health Care & Social Assistance (87.7%), and Retail Trade (74.4%).
| Industry | Male | Female |
| Agriculture, Fishing & Hunting | 47 (78.3%) | 13 (21.7%) |
| Mining, Quarrying, & Extraction | 0 (0.0%) | 0 (0.0%) |
| Construction | 52 (100.0%) | 0 (0.0%) |
| Manufacturing | 110 (71.4%) | 44 (28.6%) |
| Wholesale Trade | 48 (92.3%) | 4 (7.7%) |
| Retail Trade | 62 (25.6%) | 180 (74.4%) |
| Transportation & Warehousing | 42 (72.4%) | 16 (27.6%) |
| Utilities | 6 (100.0%) | 0 (0.0%) |
| Information | 0 (0.0%) | 27 (100.0%) |
| Finance & Insurance | 44 (41.9%) | 61 (58.1%) |
| Real Estate, Rental & Leasing | 14 (60.9%) | 9 (39.1%) |
| Professional & Scientific | 78 (48.4%) | 83 (51.5%) |
| Enterprise Management | 0 (0.0%) | 0 (0.0%) |
| Administrative & Support | 30 (90.9%) | 3 (9.1%) |
| Educational Services | 386 (36.1%) | 684 (63.9%) |
| Health Care & Social Assistance | 30 (12.3%) | 214 (87.7%) |
| Arts, Entertainment & Recreation | 24 (64.9%) | 13 (35.1%) |
| Accommodation & Food Services | 83 (42.1%) | 114 (57.9%) |
| Public Administration | 66 (80.5%) | 16 (19.5%) |
| Total | 1,157 (43.3%) | 1,513 (56.7%) |
Education in Middlebury
School Enrollment in Middlebury
The most common levels of schooling among the 3,436 students in Middlebury are college / undergraduate (2,862 | 83.3%), high school (185 | 5.4%), and elementary school (121 | 3.5%).
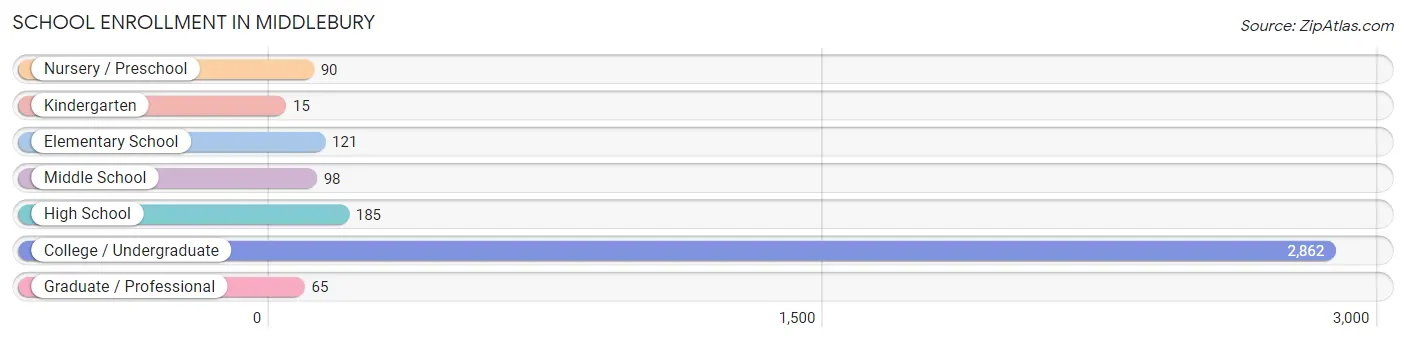
| School Level | # Students | % Students |
| Nursery / Preschool | 90 | 2.6% |
| Kindergarten | 15 | 0.4% |
| Elementary School | 121 | 3.5% |
| Middle School | 98 | 2.9% |
| High School | 185 | 5.4% |
| College / Undergraduate | 2,862 | 83.3% |
| Graduate / Professional | 65 | 1.9% |
| Total | 3,436 | 100.0% |
School Enrollment by Age by Funding Source in Middlebury
Out of a total of 3,436 students who are enrolled in schools in Middlebury, 2,910 (84.7%) attend a private institution, while the remaining 526 (15.3%) are enrolled in public schools. The age group of 20 to 24 year olds has the highest likelihood of being enrolled in private schools, with 1,385 (99.0% in the age bracket) enrolled. Conversely, the age group of 10 to 14 year olds has the lowest likelihood of being enrolled in a private school, with 155 (96.3% in the age bracket) attending a public institution.
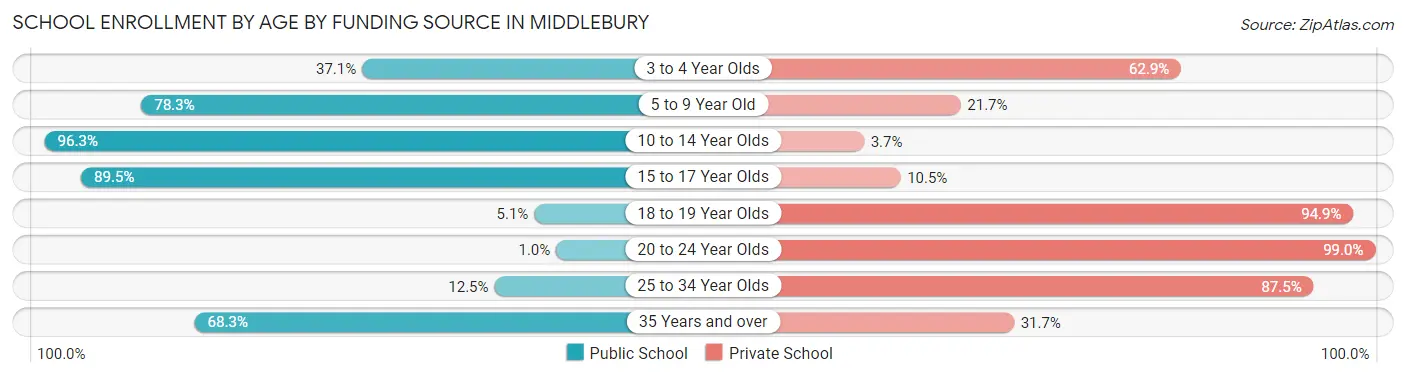
| Age Bracket | Public School | Private School |
| 3 to 4 Year Olds | 26 (37.1%) | 44 (62.9%) |
| 5 to 9 Year Old | 90 (78.3%) | 25 (21.7%) |
| 10 to 14 Year Olds | 155 (96.3%) | 6 (3.7%) |
| 15 to 17 Year Olds | 119 (89.5%) | 14 (10.5%) |
| 18 to 19 Year Olds | 74 (5.1%) | 1,384 (94.9%) |
| 20 to 24 Year Olds | 14 (1.0%) | 1,385 (99.0%) |
| 25 to 34 Year Olds | 5 (12.5%) | 35 (87.5%) |
| 35 Years and over | 41 (68.3%) | 19 (31.7%) |
| Total | 526 (15.3%) | 2,910 (84.7%) |
Educational Attainment by Field of Study in Middlebury
Literature & languages (328 | 14.1%), liberal arts & history (323 | 13.9%), visual & performing arts (253 | 10.9%), education (180 | 7.7%), and engineering (179 | 7.7%) are the most common fields of study among 2,325 individuals in Middlebury who have obtained a bachelor's degree or higher.
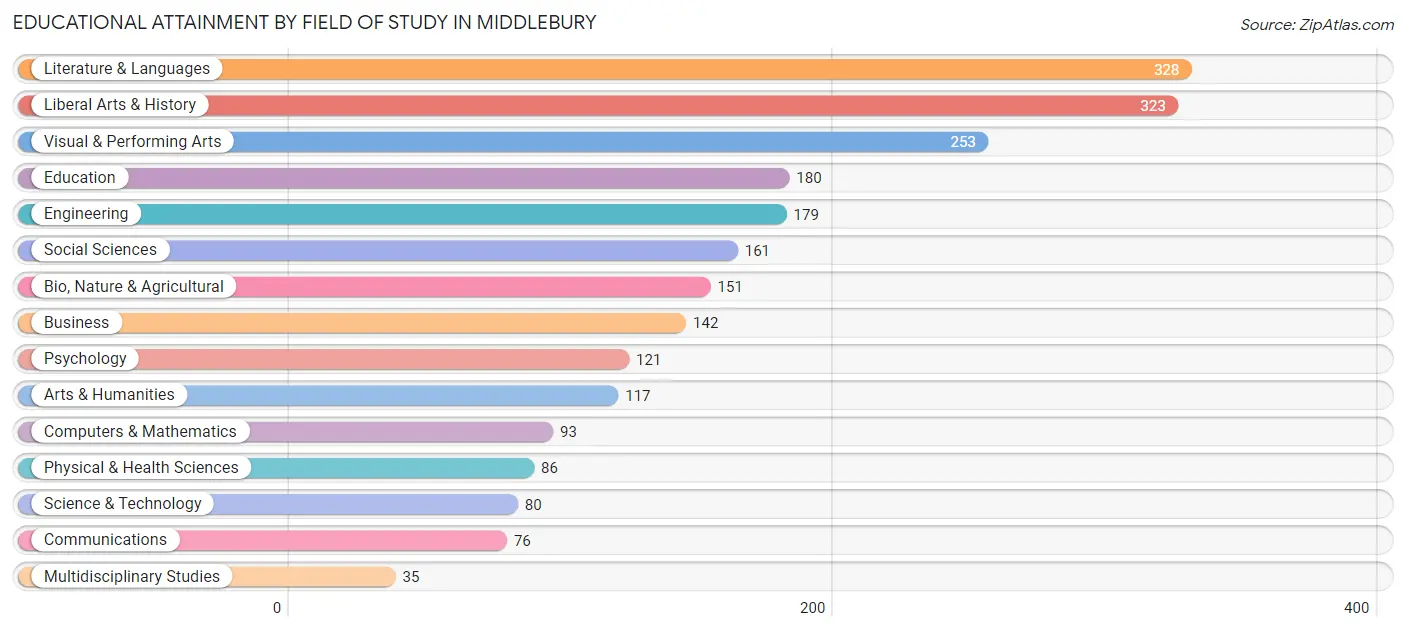
| Field of Study | # Graduates | % Graduates |
| Computers & Mathematics | 93 | 4.0% |
| Bio, Nature & Agricultural | 151 | 6.5% |
| Physical & Health Sciences | 86 | 3.7% |
| Psychology | 121 | 5.2% |
| Social Sciences | 161 | 6.9% |
| Engineering | 179 | 7.7% |
| Multidisciplinary Studies | 35 | 1.5% |
| Science & Technology | 80 | 3.4% |
| Business | 142 | 6.1% |
| Education | 180 | 7.7% |
| Literature & Languages | 328 | 14.1% |
| Liberal Arts & History | 323 | 13.9% |
| Visual & Performing Arts | 253 | 10.9% |
| Communications | 76 | 3.3% |
| Arts & Humanities | 117 | 5.0% |
| Total | 2,325 | 100.0% |
Transportation & Commute in Middlebury
Vehicle Availability by Sex in Middlebury
The most prevalent vehicle ownership categories in Middlebury are males with 2 vehicles (487, accounting for 57.0%) and females with 2 vehicles (432, making up 57.0%).
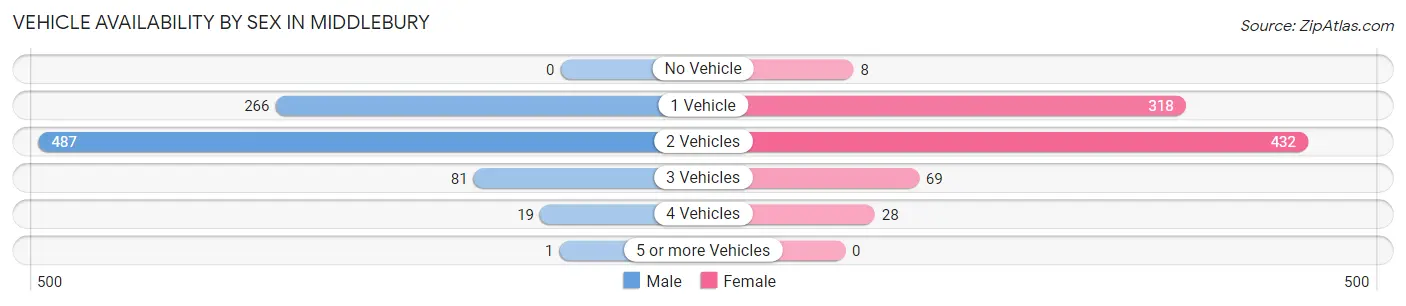
| Vehicles Available | Male | Female |
| No Vehicle | 0 (0.0%) | 8 (0.9%) |
| 1 Vehicle | 266 (31.1%) | 318 (37.2%) |
| 2 Vehicles | 487 (57.0%) | 432 (50.5%) |
| 3 Vehicles | 81 (9.5%) | 69 (8.1%) |
| 4 Vehicles | 19 (2.2%) | 28 (3.3%) |
| 5 or more Vehicles | 1 (0.1%) | 0 (0.0%) |
| Total | 854 (100.0%) | 855 (100.0%) |
Commute Time in Middlebury
The most frequently occuring commute durations in Middlebury are 5 to 9 minutes (702 commuters, 34.2%), 10 to 14 minutes (424 commuters, 20.6%), and 15 to 19 minutes (196 commuters, 9.5%).
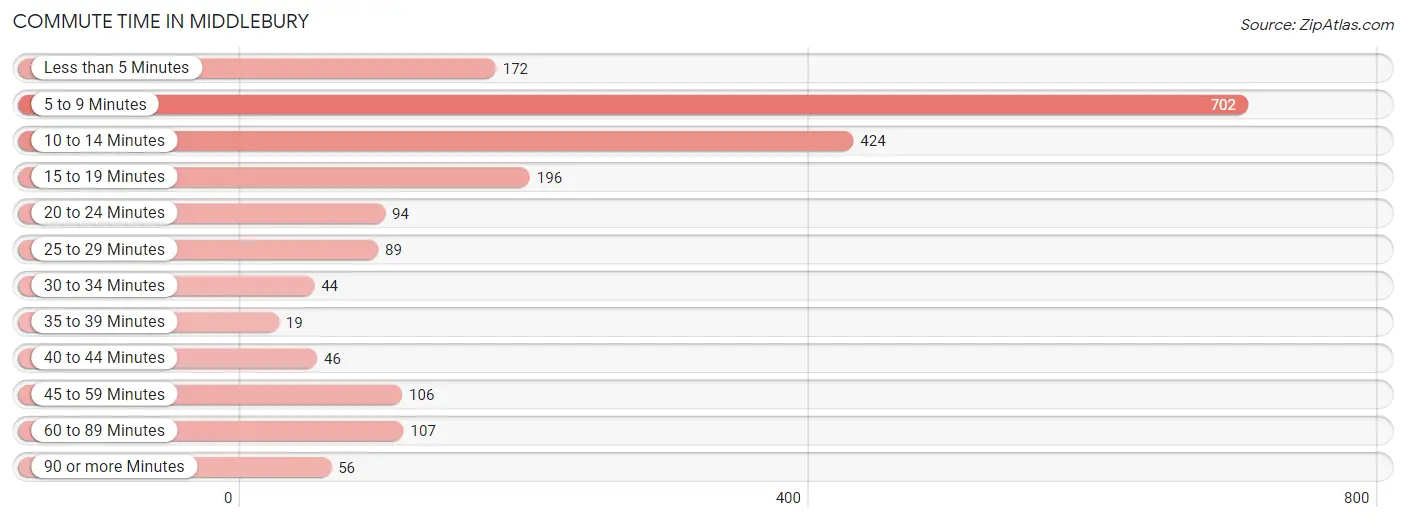
| Commute Time | # Commuters | % Commuters |
| Less than 5 Minutes | 172 | 8.4% |
| 5 to 9 Minutes | 702 | 34.2% |
| 10 to 14 Minutes | 424 | 20.6% |
| 15 to 19 Minutes | 196 | 9.5% |
| 20 to 24 Minutes | 94 | 4.6% |
| 25 to 29 Minutes | 89 | 4.3% |
| 30 to 34 Minutes | 44 | 2.1% |
| 35 to 39 Minutes | 19 | 0.9% |
| 40 to 44 Minutes | 46 | 2.2% |
| 45 to 59 Minutes | 106 | 5.2% |
| 60 to 89 Minutes | 107 | 5.2% |
| 90 or more Minutes | 56 | 2.7% |
Commute Time by Sex in Middlebury
The most common commute times in Middlebury are 5 to 9 minutes (286 commuters, 30.3%) for males and 5 to 9 minutes (416 commuters, 37.4%) for females.
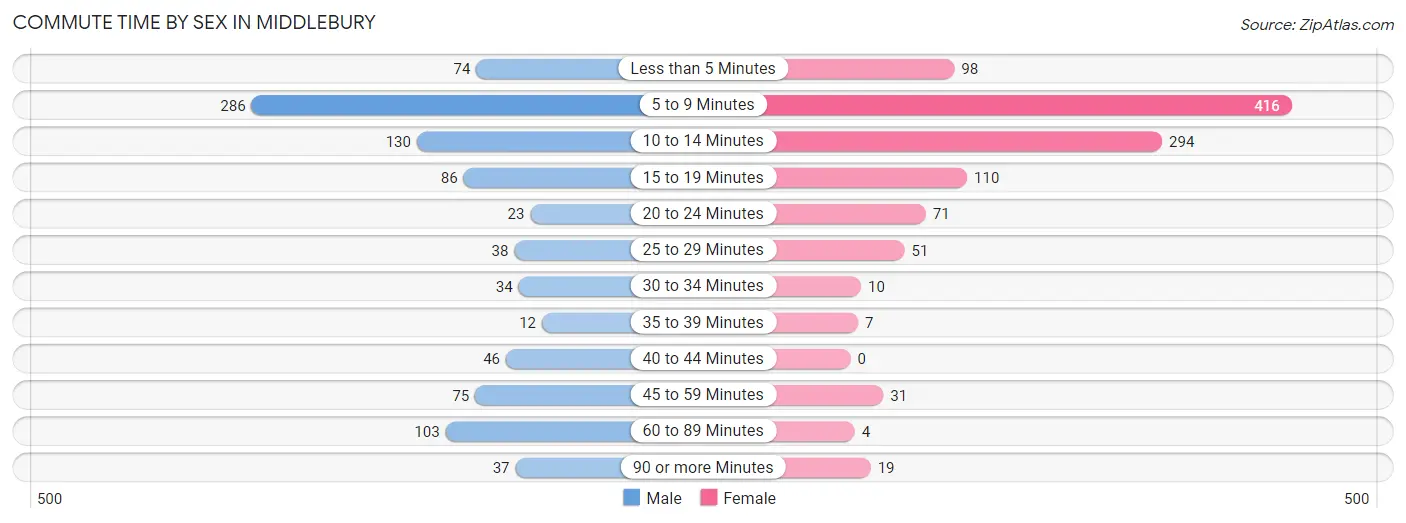
| Commute Time | Male | Female |
| Less than 5 Minutes | 74 (7.8%) | 98 (8.8%) |
| 5 to 9 Minutes | 286 (30.3%) | 416 (37.4%) |
| 10 to 14 Minutes | 130 (13.8%) | 294 (26.5%) |
| 15 to 19 Minutes | 86 (9.1%) | 110 (9.9%) |
| 20 to 24 Minutes | 23 (2.4%) | 71 (6.4%) |
| 25 to 29 Minutes | 38 (4.0%) | 51 (4.6%) |
| 30 to 34 Minutes | 34 (3.6%) | 10 (0.9%) |
| 35 to 39 Minutes | 12 (1.3%) | 7 (0.6%) |
| 40 to 44 Minutes | 46 (4.9%) | 0 (0.0%) |
| 45 to 59 Minutes | 75 (7.9%) | 31 (2.8%) |
| 60 to 89 Minutes | 103 (10.9%) | 4 (0.4%) |
| 90 or more Minutes | 37 (3.9%) | 19 (1.7%) |
Time of Departure to Work by Sex in Middlebury
The most frequent times of departure to work in Middlebury are 8:00 AM to 8:29 AM (128, 13.6%) for males and 12:00 PM to 3:59 PM (159, 14.3%) for females.
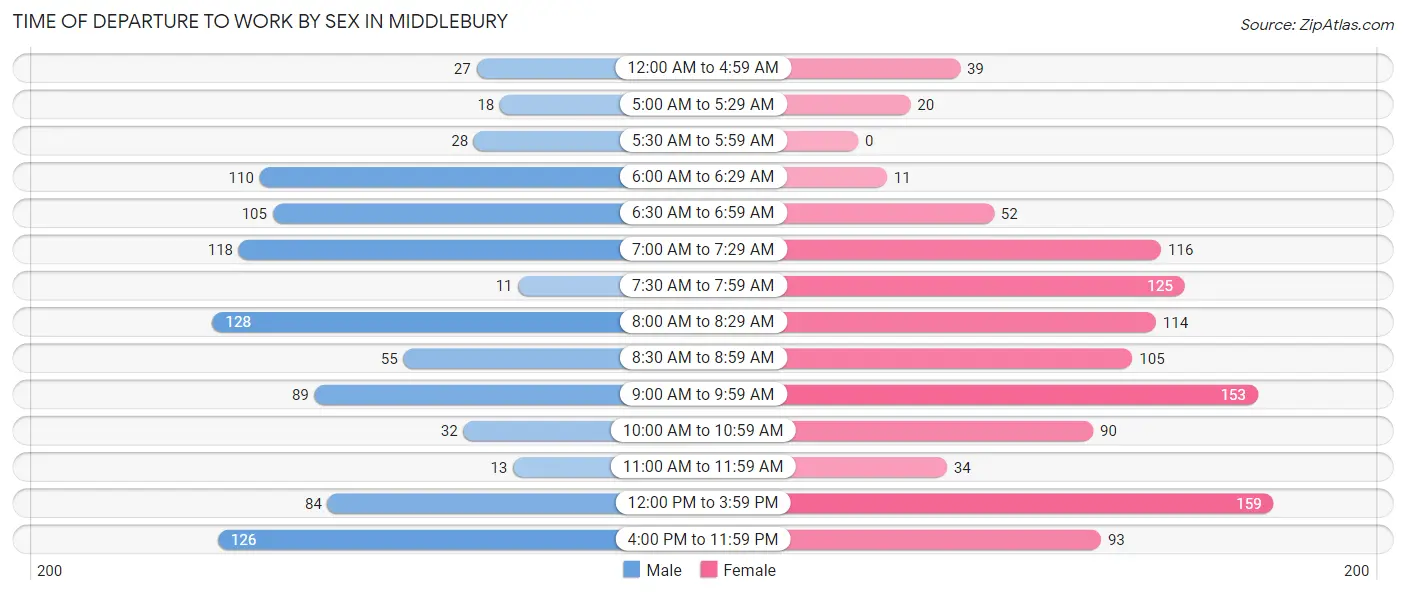
| Time of Departure | Male | Female |
| 12:00 AM to 4:59 AM | 27 (2.9%) | 39 (3.5%) |
| 5:00 AM to 5:29 AM | 18 (1.9%) | 20 (1.8%) |
| 5:30 AM to 5:59 AM | 28 (3.0%) | 0 (0.0%) |
| 6:00 AM to 6:29 AM | 110 (11.7%) | 11 (1.0%) |
| 6:30 AM to 6:59 AM | 105 (11.1%) | 52 (4.7%) |
| 7:00 AM to 7:29 AM | 118 (12.5%) | 116 (10.4%) |
| 7:30 AM to 7:59 AM | 11 (1.2%) | 125 (11.3%) |
| 8:00 AM to 8:29 AM | 128 (13.6%) | 114 (10.3%) |
| 8:30 AM to 8:59 AM | 55 (5.8%) | 105 (9.5%) |
| 9:00 AM to 9:59 AM | 89 (9.4%) | 153 (13.8%) |
| 10:00 AM to 10:59 AM | 32 (3.4%) | 90 (8.1%) |
| 11:00 AM to 11:59 AM | 13 (1.4%) | 34 (3.1%) |
| 12:00 PM to 3:59 PM | 84 (8.9%) | 159 (14.3%) |
| 4:00 PM to 11:59 PM | 126 (13.4%) | 93 (8.4%) |
| Total | 944 (100.0%) | 1,111 (100.0%) |
Housing Occupancy in Middlebury
Occupancy by Ownership in Middlebury
Of the total 1,965 dwellings in Middlebury, owner-occupied units account for 1,167 (59.4%), while renter-occupied units make up 798 (40.6%).
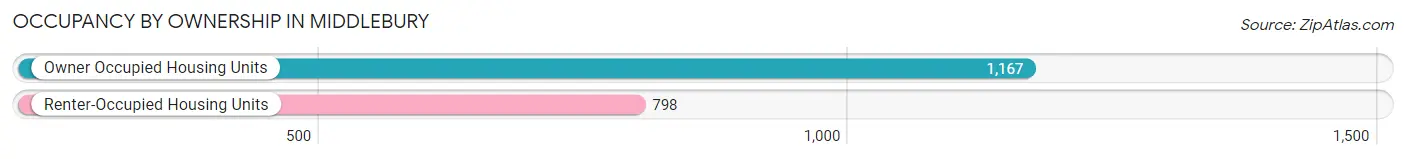
| Occupancy | # Housing Units | % Housing Units |
| Owner Occupied Housing Units | 1,167 | 59.4% |
| Renter-Occupied Housing Units | 798 | 40.6% |
| Total Occupied Housing Units | 1,965 | 100.0% |
Occupancy by Household Size in Middlebury
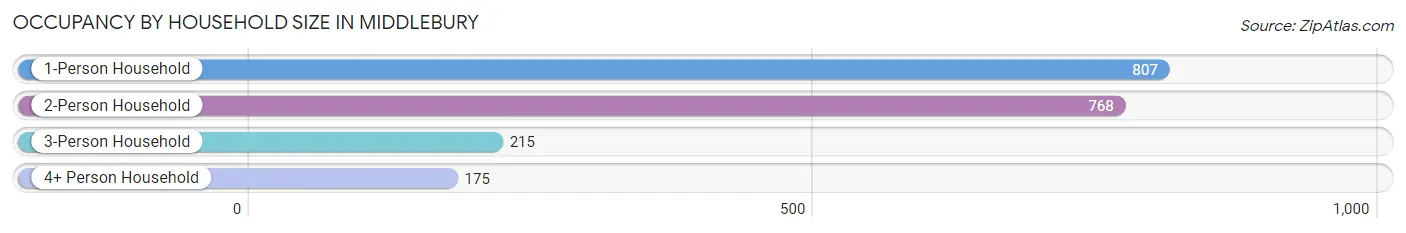
| Household Size | # Housing Units | % Housing Units |
| 1-Person Household | 807 | 41.1% |
| 2-Person Household | 768 | 39.1% |
| 3-Person Household | 215 | 10.9% |
| 4+ Person Household | 175 | 8.9% |
| Total Housing Units | 1,965 | 100.0% |
Occupancy by Ownership by Household Size in Middlebury
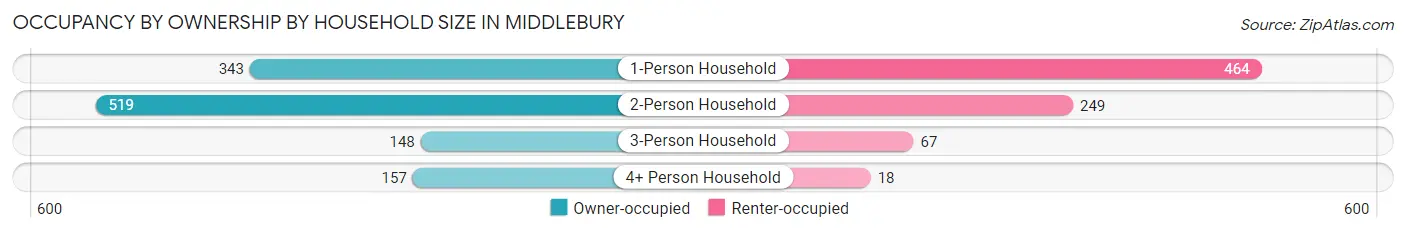
| Household Size | Owner-occupied | Renter-occupied |
| 1-Person Household | 343 (42.5%) | 464 (57.5%) |
| 2-Person Household | 519 (67.6%) | 249 (32.4%) |
| 3-Person Household | 148 (68.8%) | 67 (31.2%) |
| 4+ Person Household | 157 (89.7%) | 18 (10.3%) |
| Total Housing Units | 1,167 (59.4%) | 798 (40.6%) |
Occupancy by Educational Attainment in Middlebury
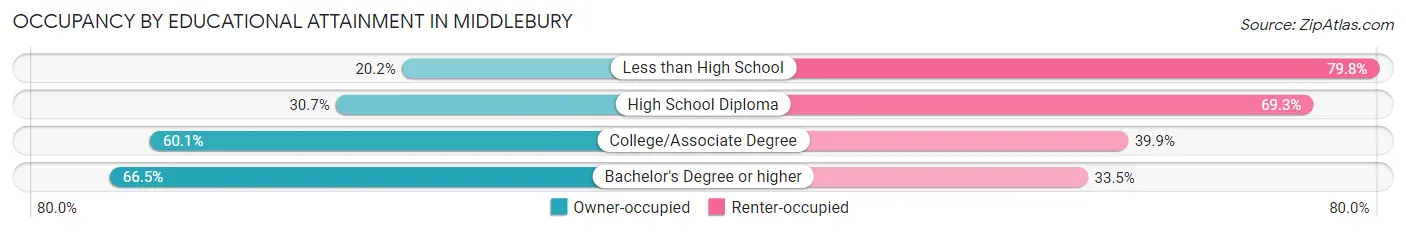
| Household Size | Owner-occupied | Renter-occupied |
| Less than High School | 18 (20.2%) | 71 (79.8%) |
| High School Diploma | 62 (30.7%) | 140 (69.3%) |
| College/Associate Degree | 241 (60.1%) | 160 (39.9%) |
| Bachelor's Degree or higher | 846 (66.5%) | 427 (33.5%) |
Occupancy by Age of Householder in Middlebury
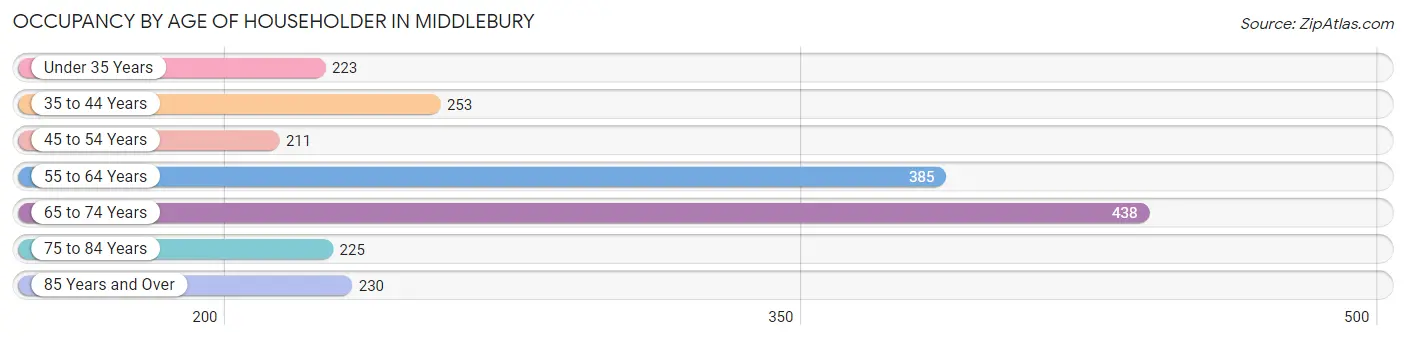
| Age Bracket | # Households | % Households |
| Under 35 Years | 223 | 11.4% |
| 35 to 44 Years | 253 | 12.9% |
| 45 to 54 Years | 211 | 10.7% |
| 55 to 64 Years | 385 | 19.6% |
| 65 to 74 Years | 438 | 22.3% |
| 75 to 84 Years | 225 | 11.5% |
| 85 Years and Over | 230 | 11.7% |
| Total | 1,965 | 100.0% |
Housing Finances in Middlebury
Median Income by Occupancy in Middlebury
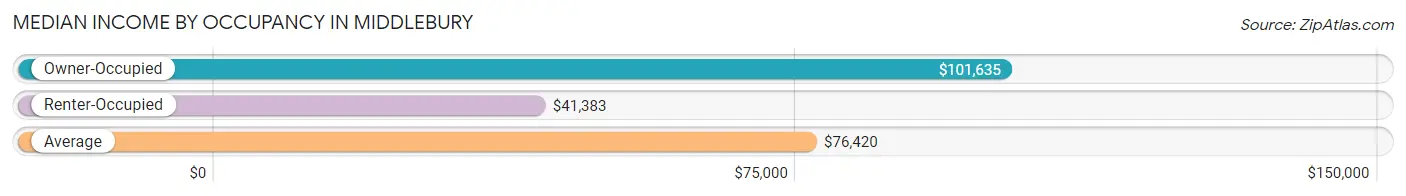
| Occupancy Type | # Households | Median Income |
| Owner-Occupied | 1,167 (59.4%) | $101,635 |
| Renter-Occupied | 798 (40.6%) | $41,383 |
| Average | 1,965 (100.0%) | $76,420 |
Occupancy by Householder Income Bracket in Middlebury
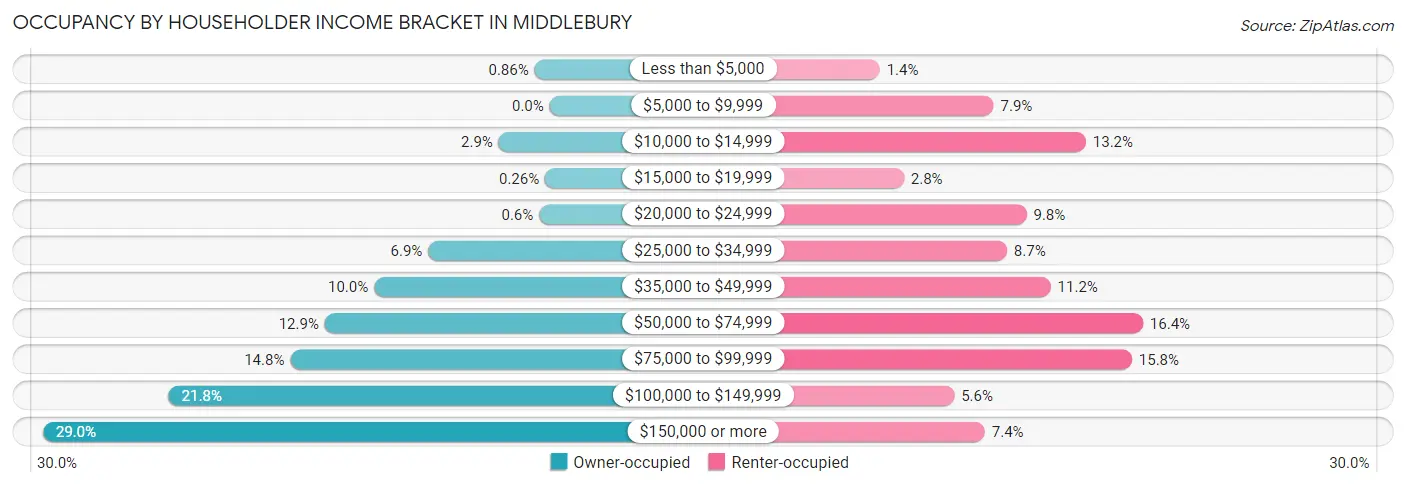
| Income Bracket | Owner-occupied | Renter-occupied |
| Less than $5,000 | 10 (0.9%) | 11 (1.4%) |
| $5,000 to $9,999 | 0 (0.0%) | 63 (7.9%) |
| $10,000 to $14,999 | 34 (2.9%) | 105 (13.2%) |
| $15,000 to $19,999 | 3 (0.3%) | 22 (2.8%) |
| $20,000 to $24,999 | 7 (0.6%) | 78 (9.8%) |
| $25,000 to $34,999 | 81 (6.9%) | 69 (8.6%) |
| $35,000 to $49,999 | 117 (10.0%) | 89 (11.2%) |
| $50,000 to $74,999 | 150 (12.9%) | 131 (16.4%) |
| $75,000 to $99,999 | 173 (14.8%) | 126 (15.8%) |
| $100,000 to $149,999 | 254 (21.8%) | 45 (5.6%) |
| $150,000 or more | 338 (29.0%) | 59 (7.4%) |
| Total | 1,167 (100.0%) | 798 (100.0%) |
Monthly Housing Cost Tiers in Middlebury
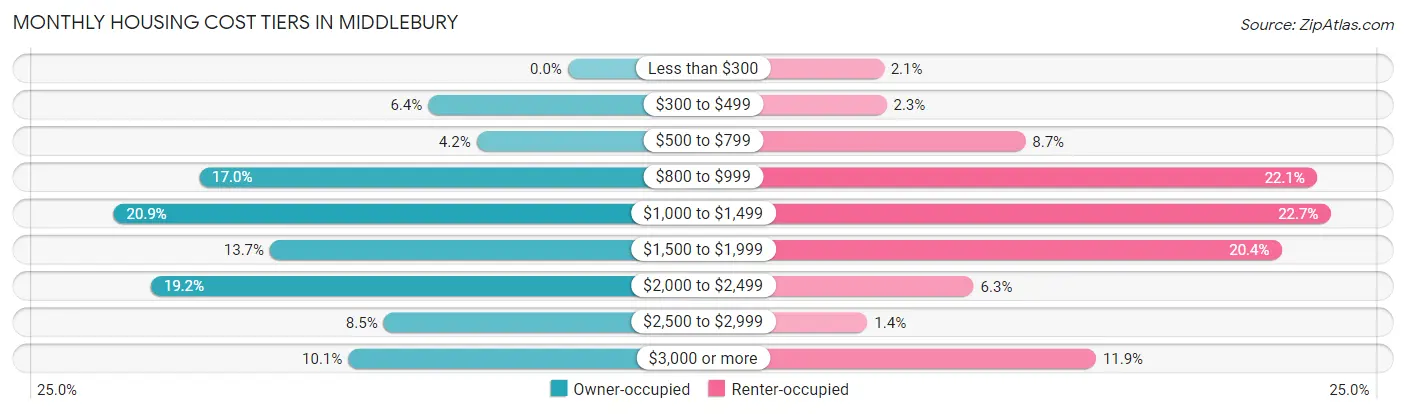
| Monthly Cost | Owner-occupied | Renter-occupied |
| Less than $300 | 0 (0.0%) | 17 (2.1%) |
| $300 to $499 | 75 (6.4%) | 18 (2.3%) |
| $500 to $799 | 49 (4.2%) | 69 (8.6%) |
| $800 to $999 | 198 (17.0%) | 176 (22.1%) |
| $1,000 to $1,499 | 244 (20.9%) | 181 (22.7%) |
| $1,500 to $1,999 | 160 (13.7%) | 163 (20.4%) |
| $2,000 to $2,499 | 224 (19.2%) | 50 (6.3%) |
| $2,500 to $2,999 | 99 (8.5%) | 11 (1.4%) |
| $3,000 or more | 118 (10.1%) | 95 (11.9%) |
| Total | 1,167 (100.0%) | 798 (100.0%) |
Physical Housing Characteristics in Middlebury
Housing Structures in Middlebury
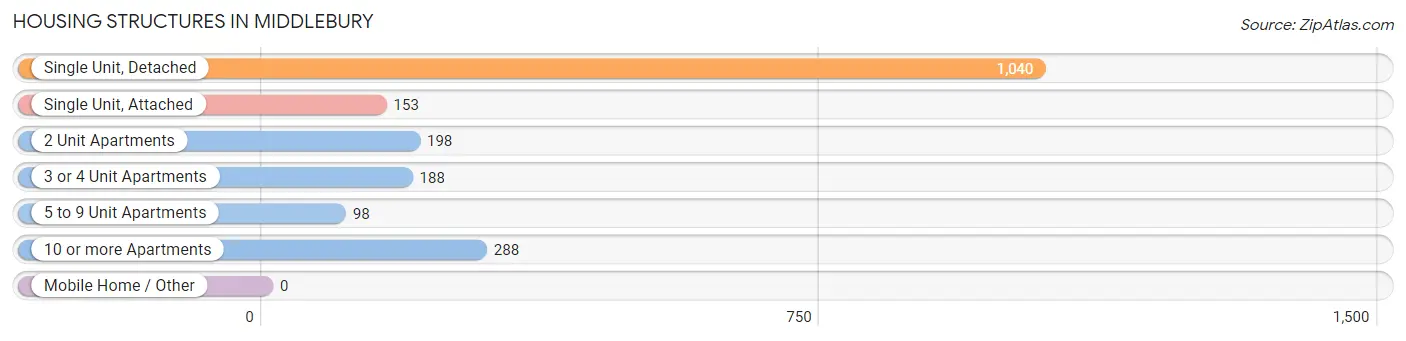
| Structure Type | # Housing Units | % Housing Units |
| Single Unit, Detached | 1,040 | 52.9% |
| Single Unit, Attached | 153 | 7.8% |
| 2 Unit Apartments | 198 | 10.1% |
| 3 or 4 Unit Apartments | 188 | 9.6% |
| 5 to 9 Unit Apartments | 98 | 5.0% |
| 10 or more Apartments | 288 | 14.7% |
| Mobile Home / Other | 0 | 0.0% |
| Total | 1,965 | 100.0% |
Housing Structures by Occupancy in Middlebury
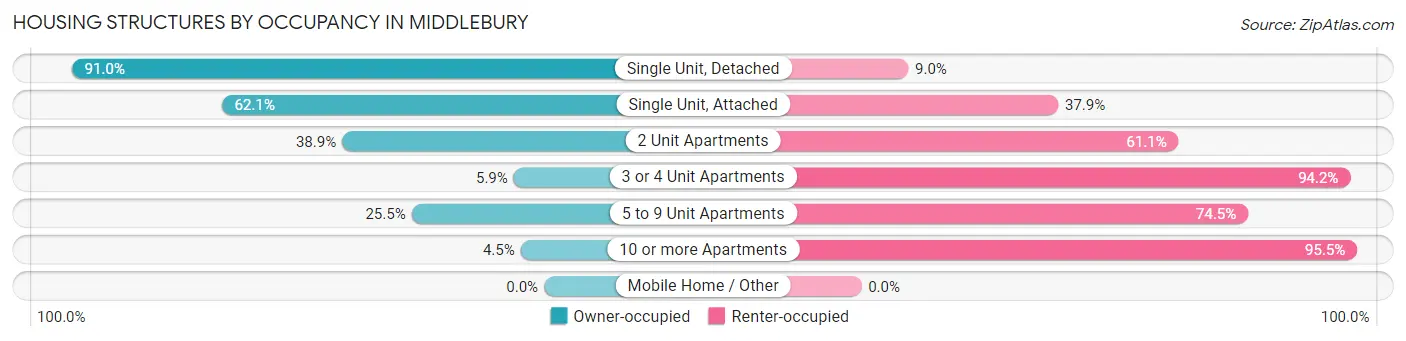
| Structure Type | Owner-occupied | Renter-occupied |
| Single Unit, Detached | 946 (91.0%) | 94 (9.0%) |
| Single Unit, Attached | 95 (62.1%) | 58 (37.9%) |
| 2 Unit Apartments | 77 (38.9%) | 121 (61.1%) |
| 3 or 4 Unit Apartments | 11 (5.9%) | 177 (94.2%) |
| 5 to 9 Unit Apartments | 25 (25.5%) | 73 (74.5%) |
| 10 or more Apartments | 13 (4.5%) | 275 (95.5%) |
| Mobile Home / Other | 0 (0.0%) | 0 (0.0%) |
| Total | 1,167 (59.4%) | 798 (40.6%) |
Housing Structures by Number of Rooms in Middlebury
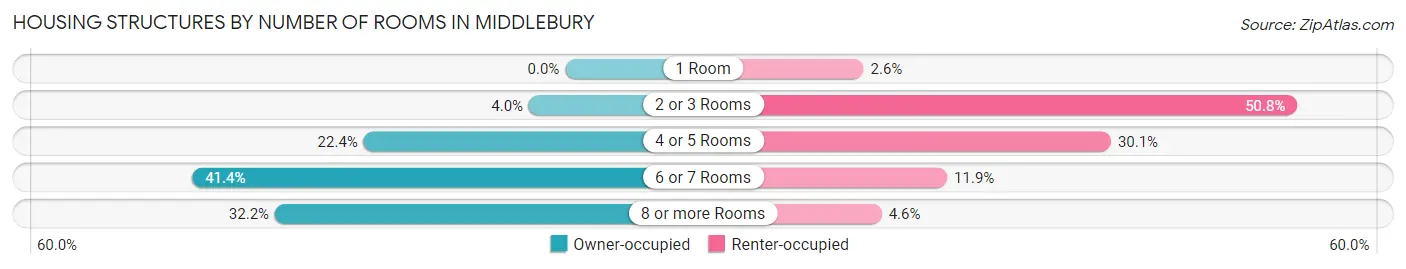
| Number of Rooms | Owner-occupied | Renter-occupied |
| 1 Room | 0 (0.0%) | 21 (2.6%) |
| 2 or 3 Rooms | 47 (4.0%) | 405 (50.7%) |
| 4 or 5 Rooms | 261 (22.4%) | 240 (30.1%) |
| 6 or 7 Rooms | 483 (41.4%) | 95 (11.9%) |
| 8 or more Rooms | 376 (32.2%) | 37 (4.6%) |
| Total | 1,167 (100.0%) | 798 (100.0%) |
Housing Structure by Heating Type in Middlebury
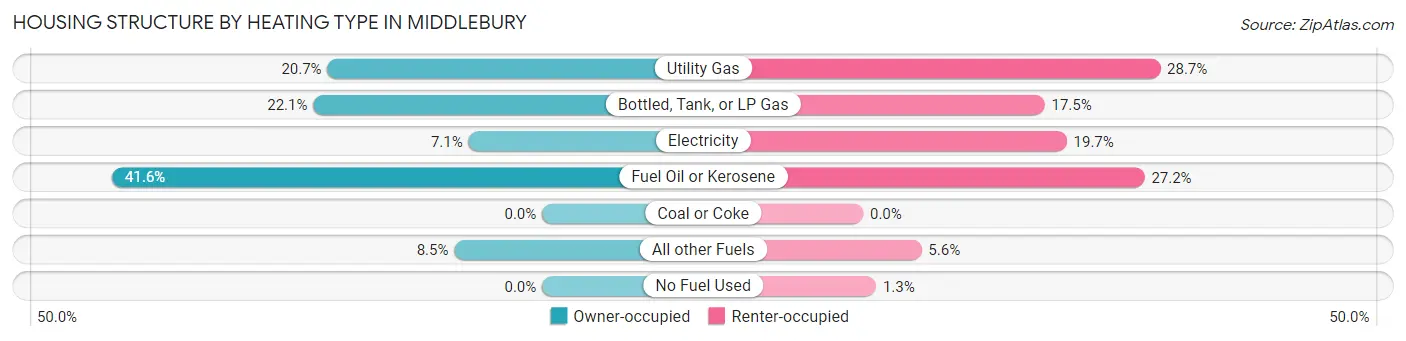
| Heating Type | Owner-occupied | Renter-occupied |
| Utility Gas | 242 (20.7%) | 229 (28.7%) |
| Bottled, Tank, or LP Gas | 258 (22.1%) | 140 (17.5%) |
| Electricity | 83 (7.1%) | 157 (19.7%) |
| Fuel Oil or Kerosene | 485 (41.6%) | 217 (27.2%) |
| Coal or Coke | 0 (0.0%) | 0 (0.0%) |
| All other Fuels | 99 (8.5%) | 45 (5.6%) |
| No Fuel Used | 0 (0.0%) | 10 (1.3%) |
| Total | 1,167 (100.0%) | 798 (100.0%) |
Household Vehicle Usage in Middlebury
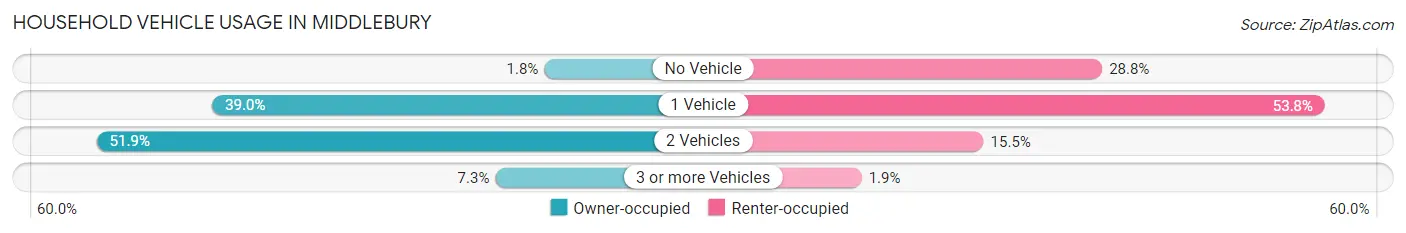
| Vehicles per Household | Owner-occupied | Renter-occupied |
| No Vehicle | 21 (1.8%) | 230 (28.8%) |
| 1 Vehicle | 455 (39.0%) | 429 (53.8%) |
| 2 Vehicles | 606 (51.9%) | 124 (15.5%) |
| 3 or more Vehicles | 85 (7.3%) | 15 (1.9%) |
| Total | 1,167 (100.0%) | 798 (100.0%) |
Real Estate & Mortgages in Middlebury
Real Estate and Mortgage Overview in Middlebury
| Characteristic | Without Mortgage | With Mortgage |
| Housing Units | 503 | 664 |
| Median Property Value | $406,500 | $367,100 |
| Median Household Income | $87,625 | $238 |
| Monthly Housing Costs | $918 | $118 |
| Real Estate Taxes | $6,504 | $0 |
Property Value by Mortgage Status in Middlebury
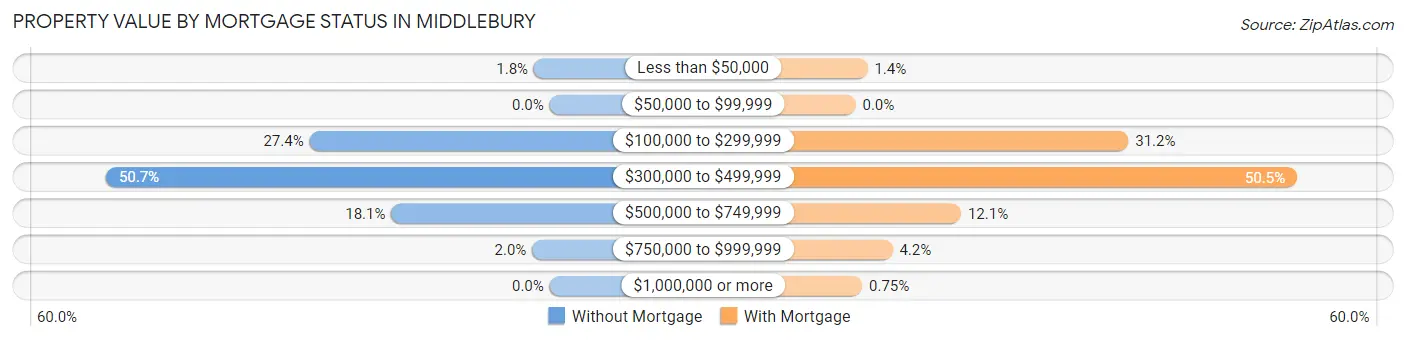
| Property Value | Without Mortgage | With Mortgage |
| Less than $50,000 | 9 (1.8%) | 9 (1.4%) |
| $50,000 to $99,999 | 0 (0.0%) | 0 (0.0%) |
| $100,000 to $299,999 | 138 (27.4%) | 207 (31.2%) |
| $300,000 to $499,999 | 255 (50.7%) | 335 (50.4%) |
| $500,000 to $749,999 | 91 (18.1%) | 80 (12.0%) |
| $750,000 to $999,999 | 10 (2.0%) | 28 (4.2%) |
| $1,000,000 or more | 0 (0.0%) | 5 (0.7%) |
| Total | 503 (100.0%) | 664 (100.0%) |
Household Income by Mortgage Status in Middlebury
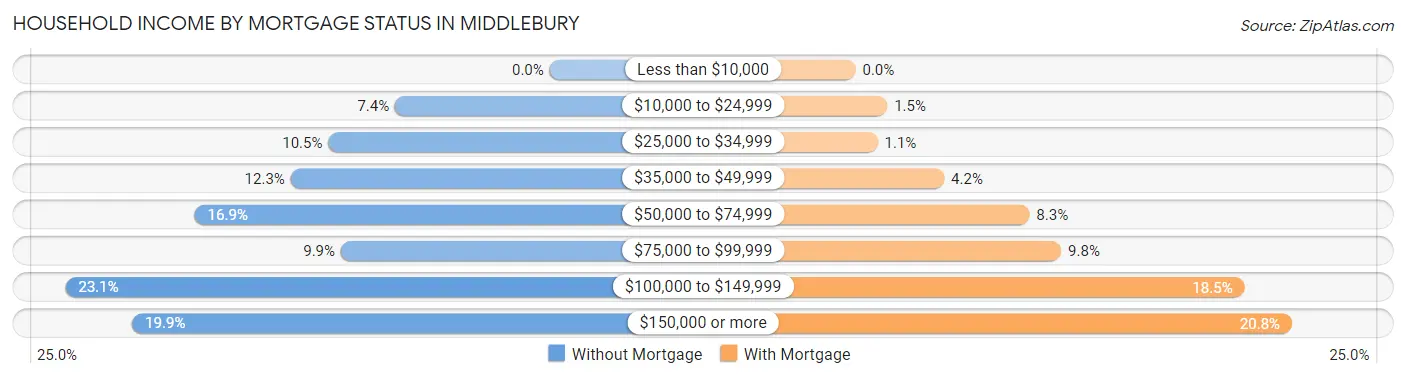
| Household Income | Without Mortgage | With Mortgage |
| Less than $10,000 | 0 (0.0%) | 0 (0.0%) |
| $10,000 to $24,999 | 37 (7.4%) | 10 (1.5%) |
| $25,000 to $34,999 | 53 (10.5%) | 7 (1.1%) |
| $35,000 to $49,999 | 62 (12.3%) | 28 (4.2%) |
| $50,000 to $74,999 | 85 (16.9%) | 55 (8.3%) |
| $75,000 to $99,999 | 50 (9.9%) | 65 (9.8%) |
| $100,000 to $149,999 | 116 (23.1%) | 123 (18.5%) |
| $150,000 or more | 100 (19.9%) | 138 (20.8%) |
| Total | 503 (100.0%) | 664 (100.0%) |
Property Value to Household Income Ratio in Middlebury
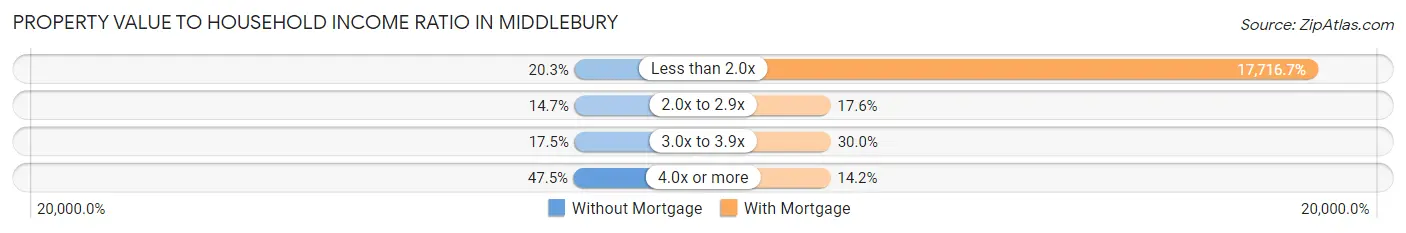
| Value-to-Income Ratio | Without Mortgage | With Mortgage |
| Less than 2.0x | 102 (20.3%) | 117,639 (17,716.7%) |
| 2.0x to 2.9x | 74 (14.7%) | 117 (17.6%) |
| 3.0x to 3.9x | 88 (17.5%) | 199 (30.0%) |
| 4.0x or more | 239 (47.5%) | 94 (14.2%) |
| Total | 503 (100.0%) | 664 (100.0%) |
Real Estate Taxes by Mortgage Status in Middlebury
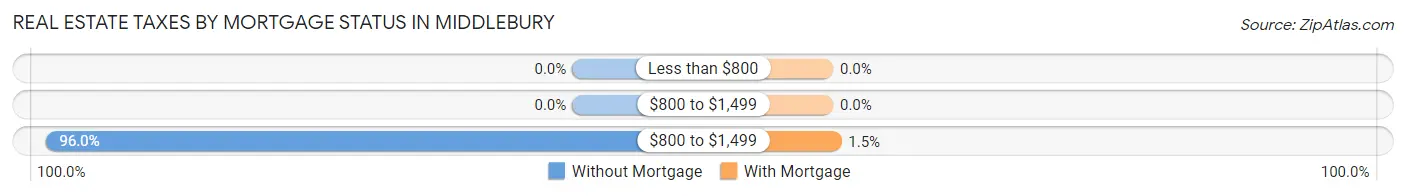
| Property Taxes | Without Mortgage | With Mortgage |
| Less than $800 | 0 (0.0%) | 0 (0.0%) |
| $800 to $1,499 | 0 (0.0%) | 0 (0.0%) |
| $800 to $1,499 | 483 (96.0%) | 10 (1.5%) |
| Total | 503 (100.0%) | 664 (100.0%) |
Health & Disability in Middlebury
Health Insurance Coverage by Age in Middlebury
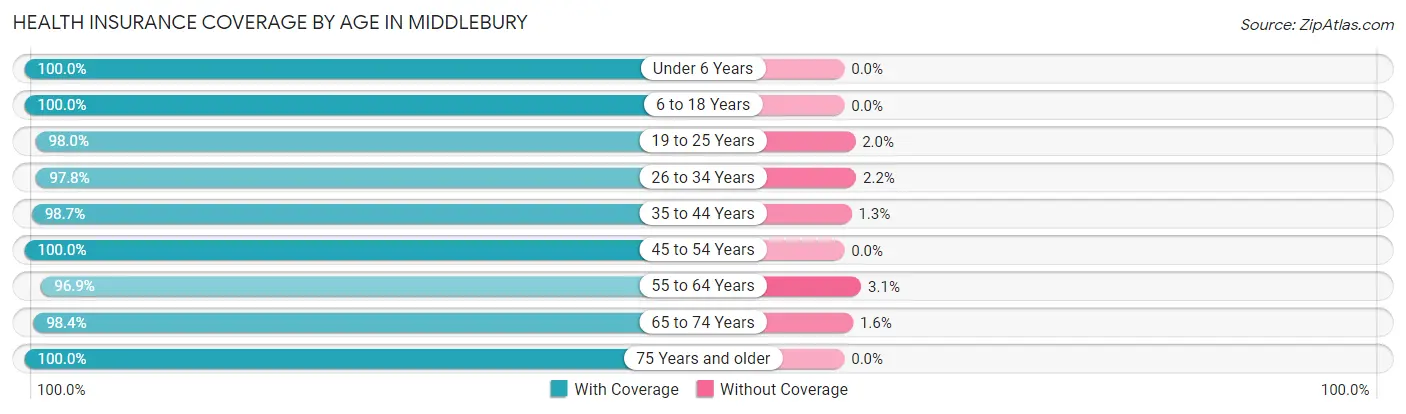
| Age Bracket | With Coverage | Without Coverage |
| Under 6 Years | 244 (100.0%) | 0 (0.0%) |
| 6 to 18 Years | 1,059 (100.0%) | 0 (0.0%) |
| 19 to 25 Years | 2,310 (98.0%) | 48 (2.0%) |
| 26 to 34 Years | 400 (97.8%) | 9 (2.2%) |
| 35 to 44 Years | 442 (98.7%) | 6 (1.3%) |
| 45 to 54 Years | 355 (100.0%) | 0 (0.0%) |
| 55 to 64 Years | 555 (96.9%) | 18 (3.1%) |
| 65 to 74 Years | 609 (98.4%) | 10 (1.6%) |
| 75 Years and older | 702 (100.0%) | 0 (0.0%) |
| Total | 6,676 (98.7%) | 91 (1.3%) |
Health Insurance Coverage by Citizenship Status in Middlebury
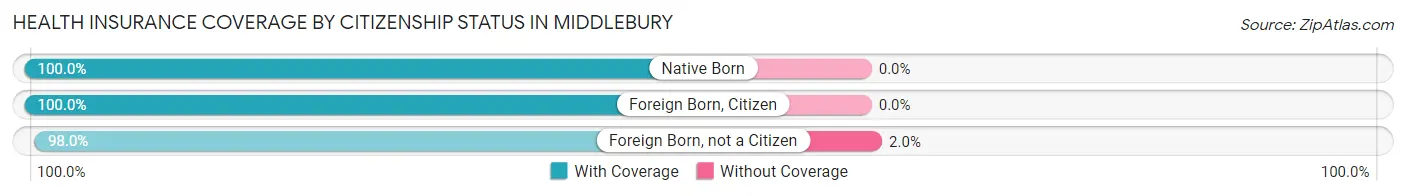
| Citizenship Status | With Coverage | Without Coverage |
| Native Born | 244 (100.0%) | 0 (0.0%) |
| Foreign Born, Citizen | 1,059 (100.0%) | 0 (0.0%) |
| Foreign Born, not a Citizen | 2,310 (98.0%) | 48 (2.0%) |
Health Insurance Coverage by Household Income in Middlebury
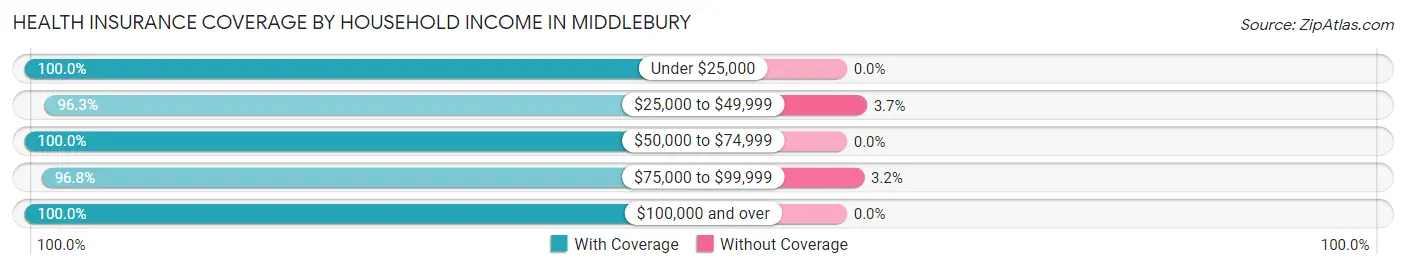
| Household Income | With Coverage | Without Coverage |
| Under $25,000 | 486 (100.0%) | 0 (0.0%) |
| $25,000 to $49,999 | 491 (96.3%) | 19 (3.7%) |
| $50,000 to $74,999 | 556 (100.0%) | 0 (0.0%) |
| $75,000 to $99,999 | 541 (96.8%) | 18 (3.2%) |
| $100,000 and over | 1,892 (100.0%) | 0 (0.0%) |
Public vs Private Health Insurance Coverage by Age in Middlebury
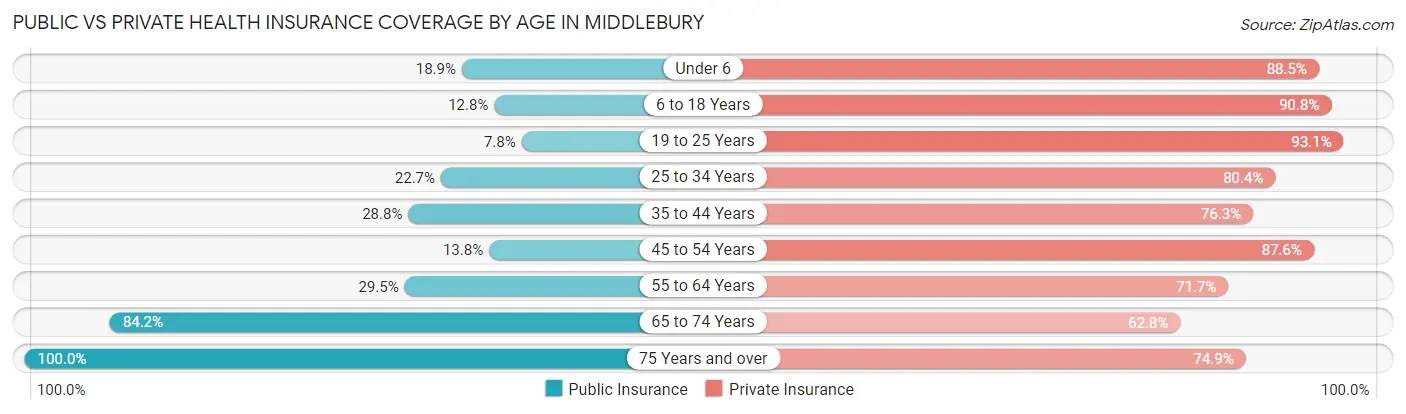
| Age Bracket | Public Insurance | Private Insurance |
| Under 6 | 46 (18.9%) | 216 (88.5%) |
| 6 to 18 Years | 136 (12.8%) | 962 (90.8%) |
| 19 to 25 Years | 183 (7.8%) | 2,196 (93.1%) |
| 25 to 34 Years | 93 (22.7%) | 329 (80.4%) |
| 35 to 44 Years | 129 (28.8%) | 342 (76.3%) |
| 45 to 54 Years | 49 (13.8%) | 311 (87.6%) |
| 55 to 64 Years | 169 (29.5%) | 411 (71.7%) |
| 65 to 74 Years | 521 (84.2%) | 389 (62.8%) |
| 75 Years and over | 702 (100.0%) | 526 (74.9%) |
| Total | 2,028 (30.0%) | 5,682 (84.0%) |
Disability Status by Sex by Age in Middlebury
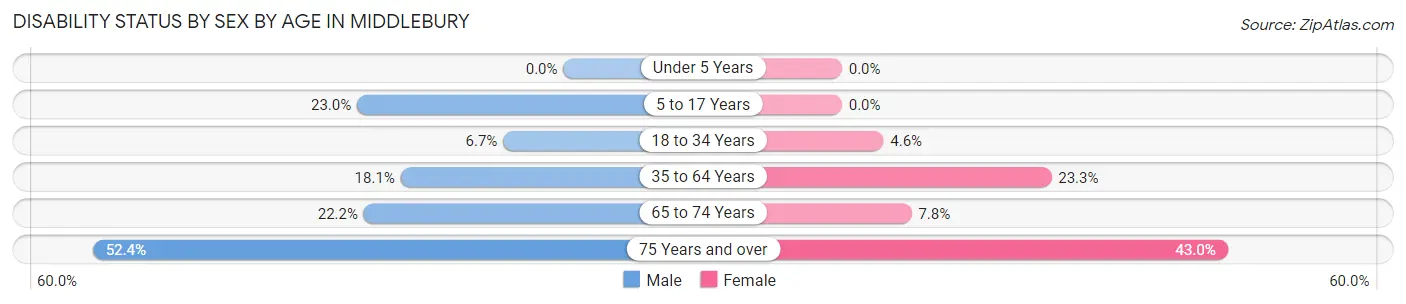
| Age Bracket | Male | Female |
| Under 5 Years | 0 (0.0%) | 0 (0.0%) |
| 5 to 17 Years | 57 (23.0%) | 0 (0.0%) |
| 18 to 34 Years | 105 (6.7%) | 87 (4.6%) |
| 35 to 64 Years | 108 (18.1%) | 182 (23.3%) |
| 65 to 74 Years | 66 (22.2%) | 25 (7.8%) |
| 75 Years and over | 163 (52.4%) | 168 (43.0%) |
Disability Class by Sex by Age in Middlebury
Disability Class: Hearing Difficulty
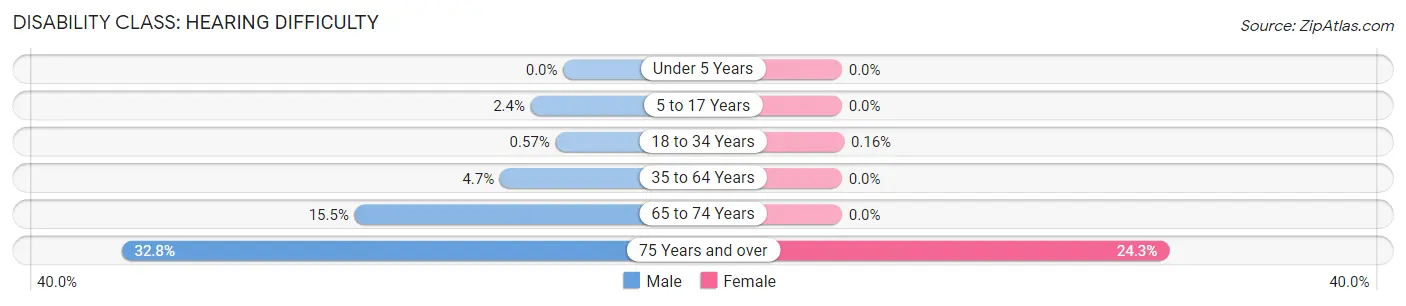
| Age Bracket | Male | Female |
| Under 5 Years | 0 (0.0%) | 0 (0.0%) |
| 5 to 17 Years | 6 (2.4%) | 0 (0.0%) |
| 18 to 34 Years | 9 (0.6%) | 3 (0.2%) |
| 35 to 64 Years | 28 (4.7%) | 0 (0.0%) |
| 65 to 74 Years | 46 (15.5%) | 0 (0.0%) |
| 75 Years and over | 102 (32.8%) | 95 (24.3%) |
Disability Class: Vision Difficulty
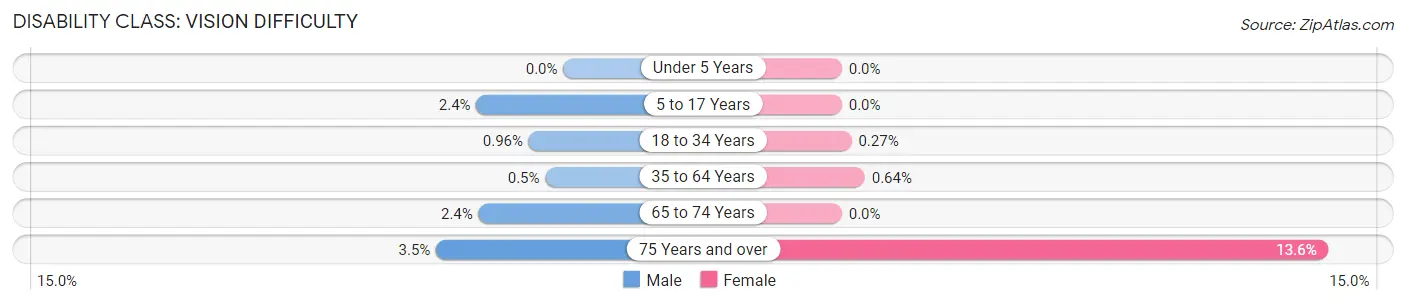
| Age Bracket | Male | Female |
| Under 5 Years | 0 (0.0%) | 0 (0.0%) |
| 5 to 17 Years | 6 (2.4%) | 0 (0.0%) |
| 18 to 34 Years | 15 (1.0%) | 5 (0.3%) |
| 35 to 64 Years | 3 (0.5%) | 5 (0.6%) |
| 65 to 74 Years | 7 (2.4%) | 0 (0.0%) |
| 75 Years and over | 11 (3.5%) | 53 (13.6%) |
Disability Class: Cognitive Difficulty
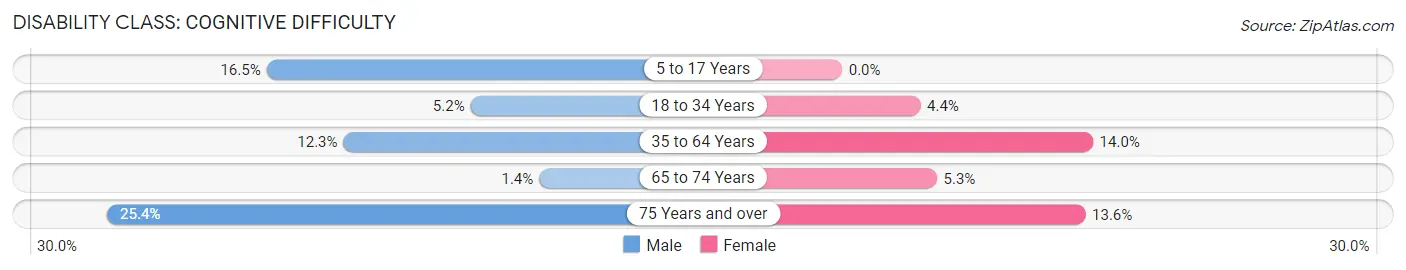
| Age Bracket | Male | Female |
| 5 to 17 Years | 41 (16.5%) | 0 (0.0%) |
| 18 to 34 Years | 81 (5.2%) | 82 (4.4%) |
| 35 to 64 Years | 73 (12.2%) | 109 (14.0%) |
| 65 to 74 Years | 4 (1.3%) | 17 (5.3%) |
| 75 Years and over | 79 (25.4%) | 53 (13.6%) |
Disability Class: Ambulatory Difficulty
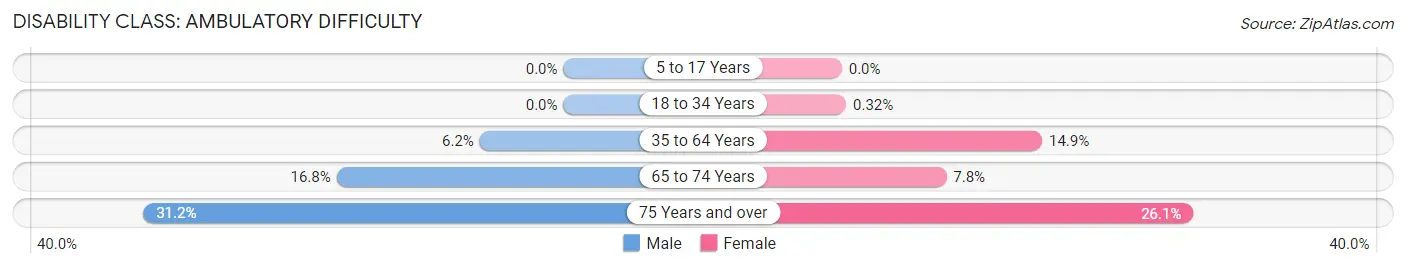
| Age Bracket | Male | Female |
| 5 to 17 Years | 0 (0.0%) | 0 (0.0%) |
| 18 to 34 Years | 0 (0.0%) | 6 (0.3%) |
| 35 to 64 Years | 37 (6.2%) | 116 (14.9%) |
| 65 to 74 Years | 50 (16.8%) | 25 (7.8%) |
| 75 Years and over | 97 (31.2%) | 102 (26.1%) |
Disability Class: Self-Care Difficulty
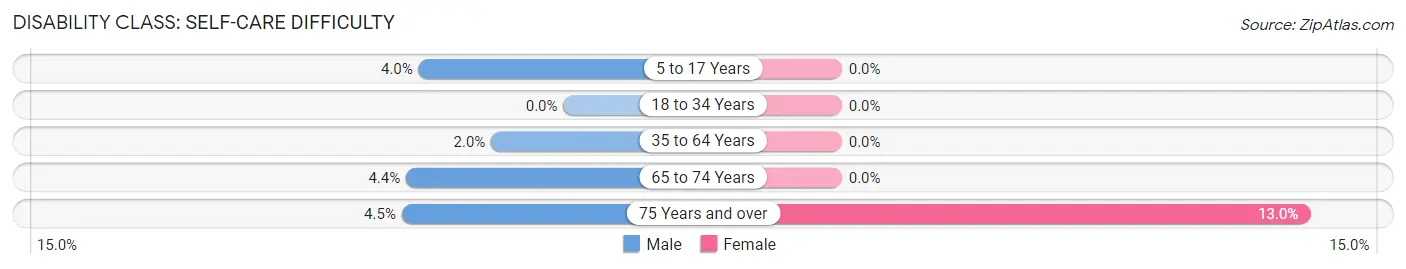
| Age Bracket | Male | Female |
| 5 to 17 Years | 10 (4.0%) | 0 (0.0%) |
| 18 to 34 Years | 0 (0.0%) | 0 (0.0%) |
| 35 to 64 Years | 12 (2.0%) | 0 (0.0%) |
| 65 to 74 Years | 13 (4.4%) | 0 (0.0%) |
| 75 Years and over | 14 (4.5%) | 51 (13.0%) |
Technology Access in Middlebury
Computing Device Access in Middlebury
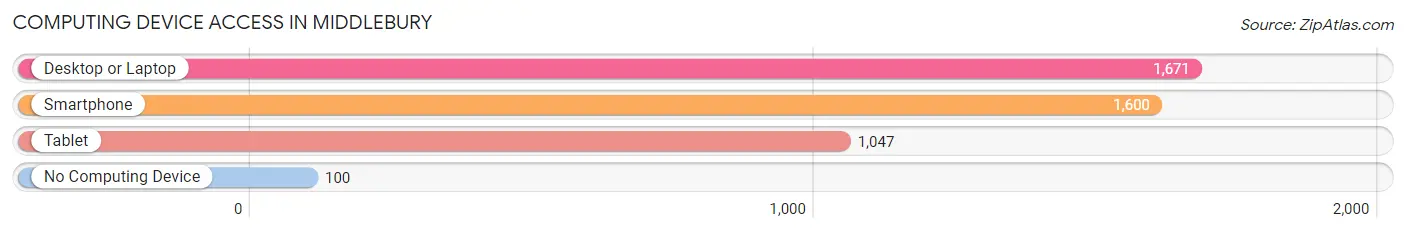
| Device Type | # Households | % Households |
| Desktop or Laptop | 1,671 | 85.0% |
| Smartphone | 1,600 | 81.4% |
| Tablet | 1,047 | 53.3% |
| No Computing Device | 100 | 5.1% |
| Total | 1,965 | 100.0% |
Internet Access in Middlebury
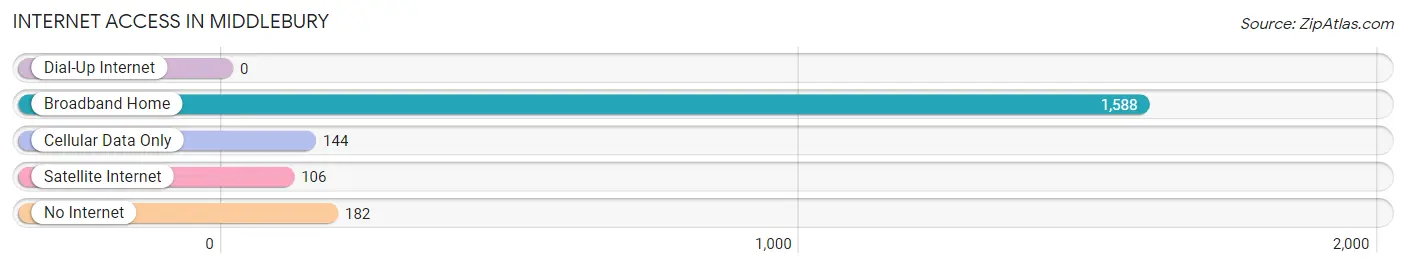
| Internet Type | # Households | % Households |
| Dial-Up Internet | 0 | 0.0% |
| Broadband Home | 1,588 | 80.8% |
| Cellular Data Only | 144 | 7.3% |
| Satellite Internet | 106 | 5.4% |
| No Internet | 182 | 9.3% |
| Total | 1,965 | 100.0% |
Middlebury Summary
History
The town of Middlebury, Vermont is located in the Champlain Valley of Addison County, and is the shire town of the county. It is situated on the Otter Creek, and is the home of Middlebury College. The town was first settled in 1766, and was chartered in 1761. The town was named after the Middlebury Congregational Church, which was founded in 1740.
The town was an important stop on the Underground Railroad, and was the site of the first Vermont State Fair in 1809. During the Civil War, Middlebury was the site of a major battle between Union and Confederate forces. The town was also the site of the first public library in Vermont, which was established in 1811.
The town has a long history of industry, including the manufacture of furniture, paper, and textiles. In the late 19th century, the town was home to several large factories, including the Middlebury Manufacturing Company, which produced furniture, and the Middlebury Paper Company, which produced paper.
Geography
Middlebury is located in the Champlain Valley of Addison County, and is situated on the Otter Creek. The town is bordered by the towns of Cornwall, Weybridge, and Ripton to the north; Salisbury to the east; and New Haven to the south. The town is located approximately 30 miles south of Burlington, and is about a two-hour drive from Montreal, Canada.
The town has a total area of 8.3 square miles, of which 8.2 square miles is land and 0.1 square miles is water. The town is located at an elevation of 645 feet above sea level. The town is located in a temperate climate, with average temperatures ranging from the low 30s in the winter to the mid-70s in the summer.
Economy
The economy of Middlebury is largely based on education, tourism, and manufacturing. Middlebury College is the largest employer in the town, and is a major contributor to the local economy. The college employs over 1,000 people, and has an annual economic impact of over $200 million.
Tourism is also an important part of the local economy. The town is home to several popular attractions, including the Middlebury College Museum of Art, the Henry Sheldon Museum of Vermont History, and the Vermont State Fair.
Manufacturing is also an important part of the local economy. The town is home to several large factories, including the Middlebury Manufacturing Company, which produces furniture, and the Middlebury Paper Company, which produces paper.
Demographics
As of the 2010 census, the town of Middlebury had a population of 8,496. The racial makeup of the town was 95.2% White, 1.2% African American, 0.3% Native American, 1.3% Asian, 0.1% Pacific Islander, 0.7% from other races, and 1.2% from two or more races. Hispanic or Latino of any race were 2.2% of the population.
The median household income in Middlebury was $50,945, and the median family income was $68,906. The per capita income for the town was $30,945. About 8.2% of families and 14.2% of the population were below the poverty line, including 15.2% of those under age 18 and 8.2% of those age 65 or over.
Common Questions
What is Per Capita Income in Middlebury?
Per Capita income in Middlebury is $33,686.
What is the Median Family Income in Middlebury?
Median Family Income in Middlebury is $113,266.
What is the Median Household income in Middlebury?
Median Household Income in Middlebury is $76,420.
What is Income or Wage Gap in Middlebury?
Income or Wage Gap in Middlebury is 43.2%.
Women in Middlebury earn 56.8 cents for every dollar earned by a man.
What is Inequality or Gini Index in Middlebury?
Inequality or Gini Index in Middlebury is 0.46.
What is the Total Population of Middlebury?
Total Population of Middlebury is 6,913.
What is the Total Male Population of Middlebury?
Total Male Population of Middlebury is 3,199.
What is the Total Female Population of Middlebury?
Total Female Population of Middlebury is 3,714.
What is the Ratio of Males per 100 Females in Middlebury?
There are 86.13 Males per 100 Females in Middlebury.
What is the Ratio of Females per 100 Males in Middlebury?
There are 116.10 Females per 100 Males in Middlebury.
What is the Median Population Age in Middlebury?
Median Population Age in Middlebury is 22.8 Years.
What is the Average Family Size in Middlebury
Average Family Size in Middlebury is 2.8 People.
What is the Average Household Size in Middlebury
Average Household Size in Middlebury is 2.0 People.
How Large is the Labor Force in Middlebury?
There are 2,844 People in the Labor Forcein in Middlebury.
What is the Percentage of People in the Labor Force in Middlebury?
44.5% of People are in the Labor Force in Middlebury.
What is the Unemployment Rate in Middlebury?
Unemployment Rate in Middlebury is 5.8%.