South Barre, VT Map & Demographics
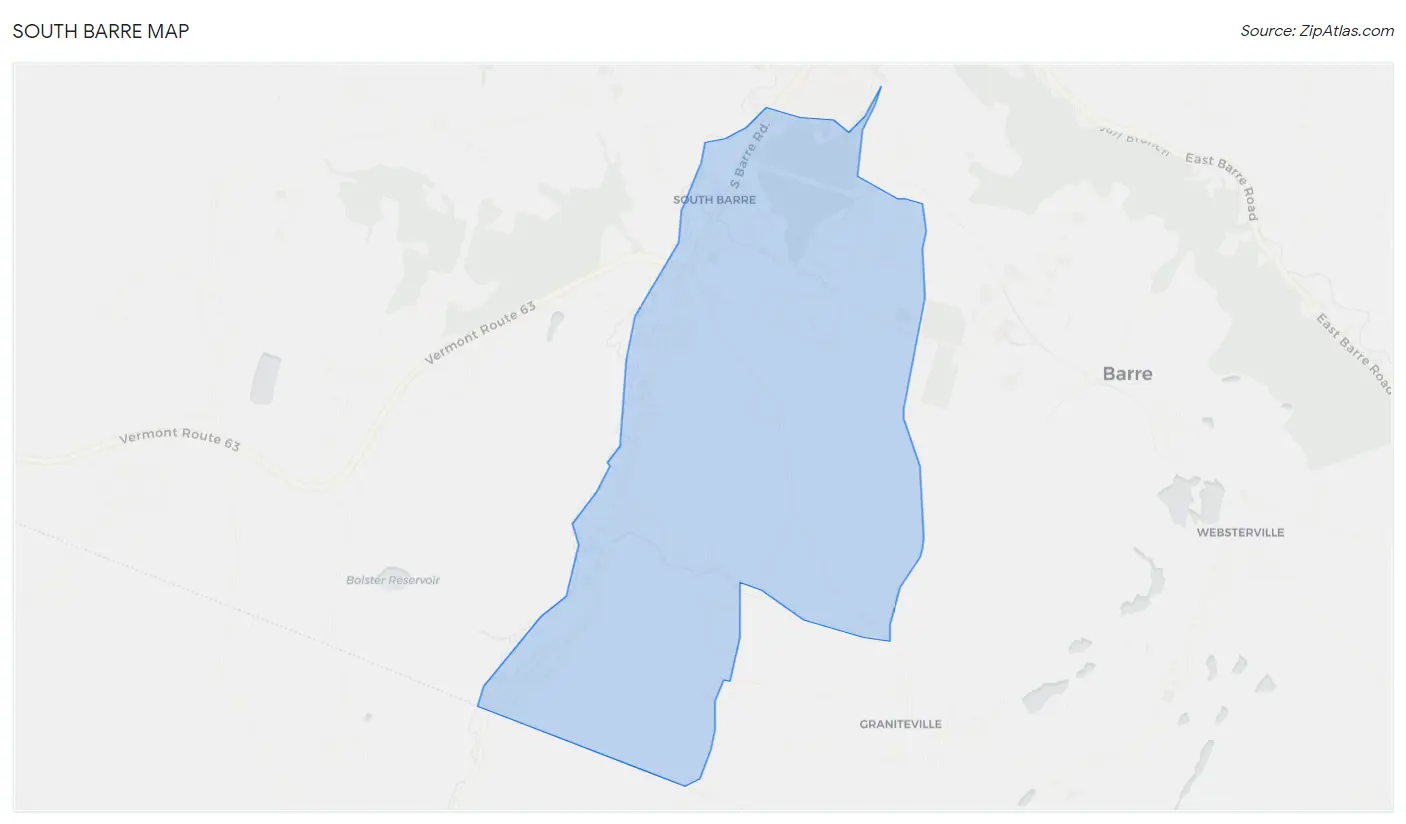
South Barre Map
South Barre Overview
$50,134
PER CAPITA INCOME
$109,313
AVG FAMILY INCOME
$75,042
AVG HOUSEHOLD INCOME
6.0%
WAGE / INCOME GAP [ % ]
94.0¢/ $1
WAGE / INCOME GAP [ $ ]
0.39
INEQUALITY / GINI INDEX
1,362
TOTAL POPULATION
754
MALE POPULATION
608
FEMALE POPULATION
124.01
MALES / 100 FEMALES
80.64
FEMALES / 100 MALES
52.2
MEDIAN AGE
2.6
AVG FAMILY SIZE
1.9
AVG HOUSEHOLD SIZE
1,001
LABOR FORCE [ PEOPLE ]
79.4%
PERCENT IN LABOR FORCE
South Barre Zip Codes
South Barre Area Codes
Income in South Barre
Income Overview in South Barre
Per Capita Income in South Barre is $50,134, while median incomes of families and households are $109,313 and $75,042 respectively.
| Characteristic | Number | Measure |
| Per Capita Income | 1,362 | $50,134 |
| Median Family Income | 381 | $109,313 |
| Mean Family Income | 381 | $116,949 |
| Median Household Income | 711 | $75,042 |
| Mean Household Income | 711 | $91,230 |
| Income Deficit | 381 | $0 |
| Wage / Income Gap (%) | 1,362 | 6.00% |
| Wage / Income Gap ($) | 1,362 | 94.00¢ per $1 |
| Gini / Inequality Index | 1,362 | 0.39 |
Earnings by Sex in South Barre
Average Earnings in South Barre are $51,920, $51,519 for men and $54,808 for women, a difference of 6.0%.
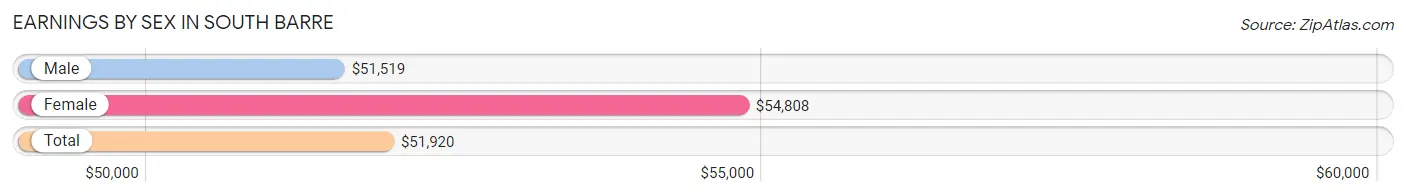
| Sex | Number | Average Earnings |
| Male | 560 (55.2%) | $51,519 |
| Female | 454 (44.8%) | $54,808 |
| Total | 1,014 (100.0%) | $51,920 |
Earnings by Sex by Income Bracket in South Barre
The most common earnings brackets in South Barre are $50,000 to $54,999 for men (130 | 23.2%) and $40,000 to $44,999 for women (69 | 15.2%).
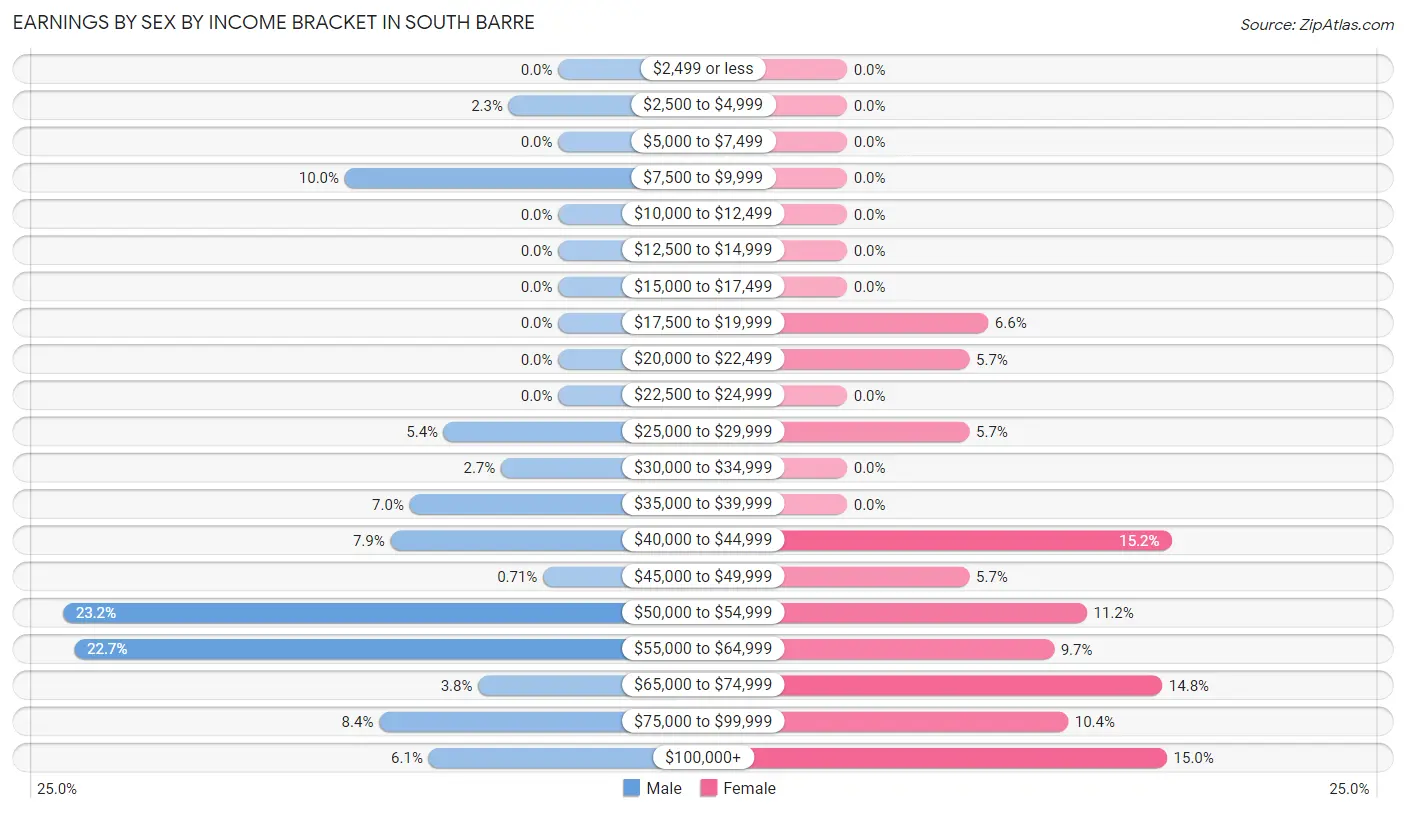
| Income | Male | Female |
| $2,499 or less | 0 (0.0%) | 0 (0.0%) |
| $2,500 to $4,999 | 13 (2.3%) | 0 (0.0%) |
| $5,000 to $7,499 | 0 (0.0%) | 0 (0.0%) |
| $7,500 to $9,999 | 56 (10.0%) | 0 (0.0%) |
| $10,000 to $12,499 | 0 (0.0%) | 0 (0.0%) |
| $12,500 to $14,999 | 0 (0.0%) | 0 (0.0%) |
| $15,000 to $17,499 | 0 (0.0%) | 0 (0.0%) |
| $17,500 to $19,999 | 0 (0.0%) | 30 (6.6%) |
| $20,000 to $22,499 | 0 (0.0%) | 26 (5.7%) |
| $22,500 to $24,999 | 0 (0.0%) | 0 (0.0%) |
| $25,000 to $29,999 | 30 (5.4%) | 26 (5.7%) |
| $30,000 to $34,999 | 15 (2.7%) | 0 (0.0%) |
| $35,000 to $39,999 | 39 (7.0%) | 0 (0.0%) |
| $40,000 to $44,999 | 44 (7.9%) | 69 (15.2%) |
| $45,000 to $49,999 | 4 (0.7%) | 26 (5.7%) |
| $50,000 to $54,999 | 130 (23.2%) | 51 (11.2%) |
| $55,000 to $64,999 | 127 (22.7%) | 44 (9.7%) |
| $65,000 to $74,999 | 21 (3.7%) | 67 (14.8%) |
| $75,000 to $99,999 | 47 (8.4%) | 47 (10.3%) |
| $100,000+ | 34 (6.1%) | 68 (15.0%) |
| Total | 560 (100.0%) | 454 (100.0%) |
Earnings by Sex by Educational Attainment in South Barre
Average earnings in South Barre are $52,106 for men and $59,146 for women, a difference of 11.9%. Men with an educational attainment of graduate degree enjoy the highest average annual earnings of $87,727, while those with high school diploma education earn the least with $55,259. Women with an educational attainment of graduate degree earn the most with the average annual earnings of $102,750, while those with college or associate's degree education have the smallest earnings of $48,333.
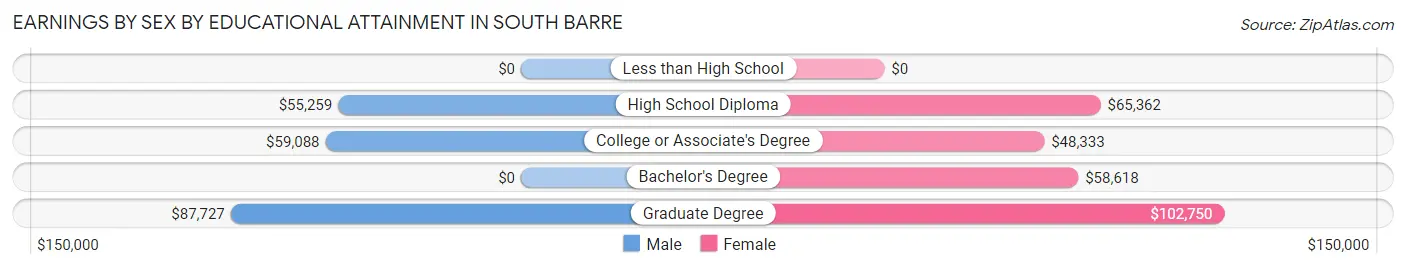
| Educational Attainment | Male Income | Female Income |
| Less than High School | - | - |
| High School Diploma | $55,259 | $65,362 |
| College or Associate's Degree | $59,088 | $48,333 |
| Bachelor's Degree | - | - |
| Graduate Degree | $87,727 | $102,750 |
| Total | $52,106 | $59,146 |
Family Income in South Barre
Family Income Brackets in South Barre
According to the South Barre family income data, there are 149 families falling into the $100,000 to $149,999 income range, which is the most common income bracket and makes up 39.1% of all families.
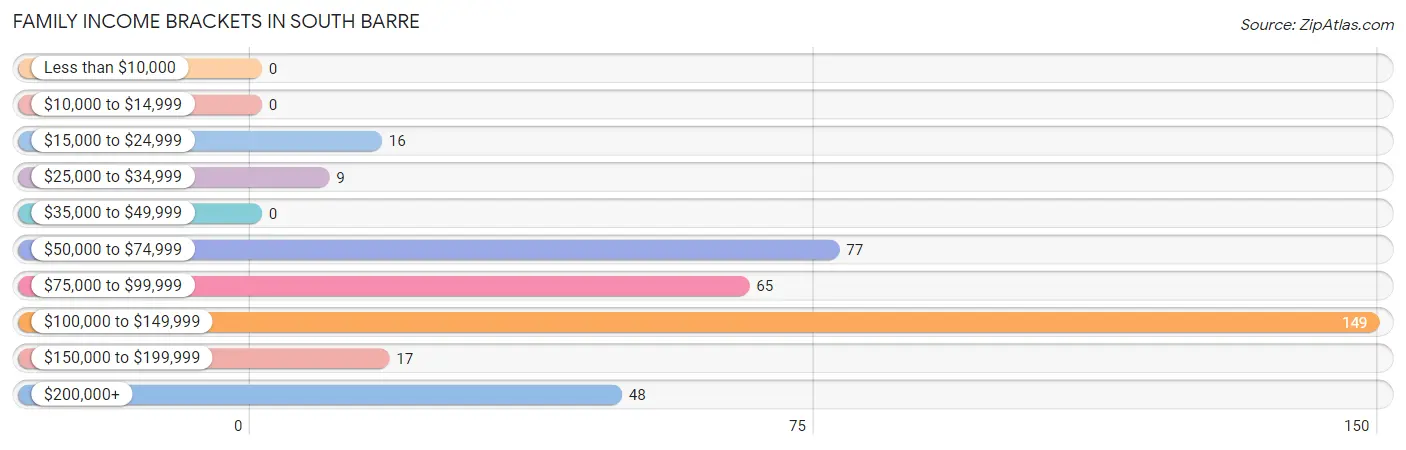
| Income Bracket | # Families | % Families |
| Less than $10,000 | 0 | 0.0% |
| $10,000 to $14,999 | 0 | 0.0% |
| $15,000 to $24,999 | 16 | 4.2% |
| $25,000 to $34,999 | 9 | 2.4% |
| $35,000 to $49,999 | 0 | 0.0% |
| $50,000 to $74,999 | 77 | 20.2% |
| $75,000 to $99,999 | 65 | 17.1% |
| $100,000 to $149,999 | 149 | 39.1% |
| $150,000 to $199,999 | 17 | 4.5% |
| $200,000+ | 48 | 12.6% |
Family Income by Famaliy Size in South Barre
3-person families (170 | 44.6%) account for the highest median family income in South Barre with $118,026 per family, while 2-person families (211 | 55.4%) have the highest median income of $54,156 per family member.
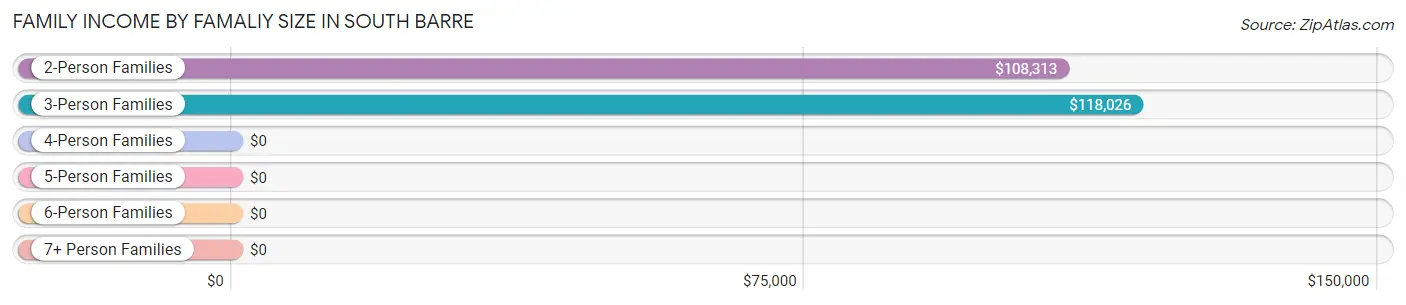
| Income Bracket | # Families | Median Income |
| 2-Person Families | 211 (55.4%) | $108,313 |
| 3-Person Families | 170 (44.6%) | $118,026 |
| 4-Person Families | 0 (0.0%) | $0 |
| 5-Person Families | 0 (0.0%) | $0 |
| 6-Person Families | 0 (0.0%) | $0 |
| 7+ Person Families | 0 (0.0%) | $0 |
| Total | 381 (100.0%) | $109,313 |
Family Income by Number of Earners in South Barre
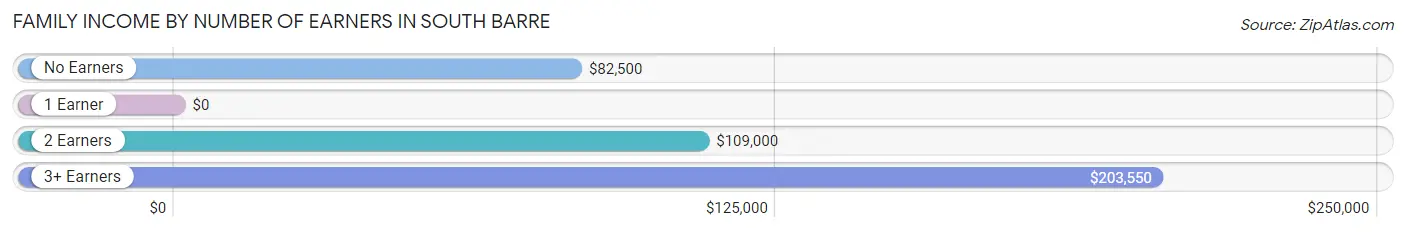
| Number of Earners | # Families | Median Income |
| No Earners | 42 (11.0%) | $82,500 |
| 1 Earner | 24 (6.3%) | $0 |
| 2 Earners | 260 (68.2%) | $109,000 |
| 3+ Earners | 55 (14.4%) | $203,550 |
| Total | 381 (100.0%) | $109,313 |
Household Income in South Barre
Household Income Brackets in South Barre
With 220 households falling in the category, the $50,000 to $74,999 income range is the most frequent in South Barre, accounting for 30.9% of all households.
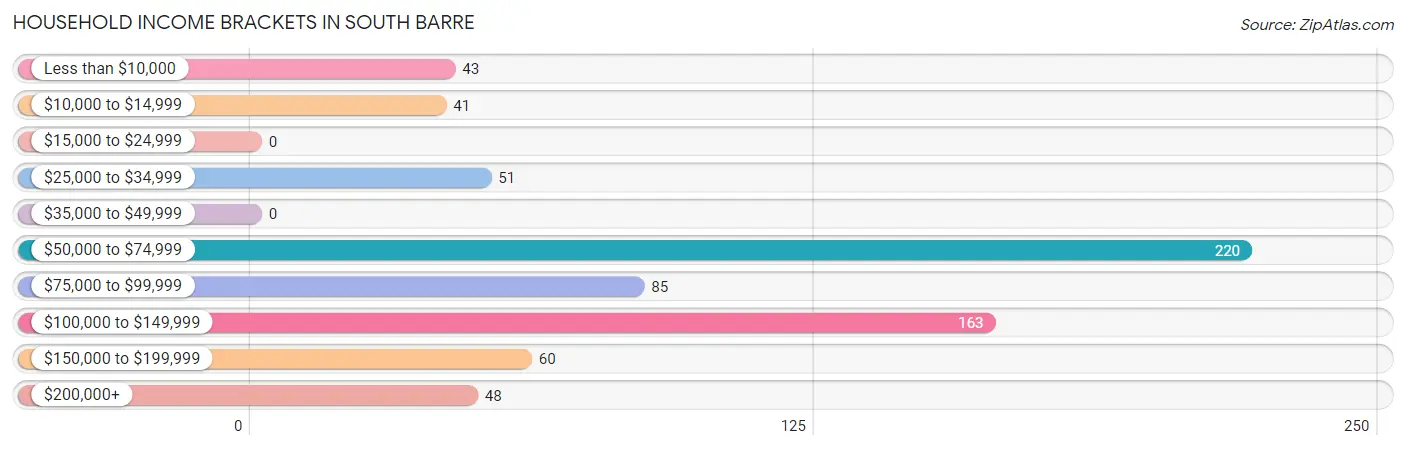
| Income Bracket | # Households | % Households |
| Less than $10,000 | 43 | 6.0% |
| $10,000 to $14,999 | 41 | 5.8% |
| $15,000 to $24,999 | 0 | 0.0% |
| $25,000 to $34,999 | 51 | 7.2% |
| $35,000 to $49,999 | 0 | 0.0% |
| $50,000 to $74,999 | 220 | 30.9% |
| $75,000 to $99,999 | 85 | 12.0% |
| $100,000 to $149,999 | 163 | 22.9% |
| $150,000 to $199,999 | 60 | 8.4% |
| $200,000+ | 48 | 6.8% |
Household Income by Householder Age in South Barre
The median household income in South Barre is $75,042, with the highest median household income of $90,565 found in the 25 to 44 years age bracket for the primary householder. A total of 218 households (30.7%) fall into this category.
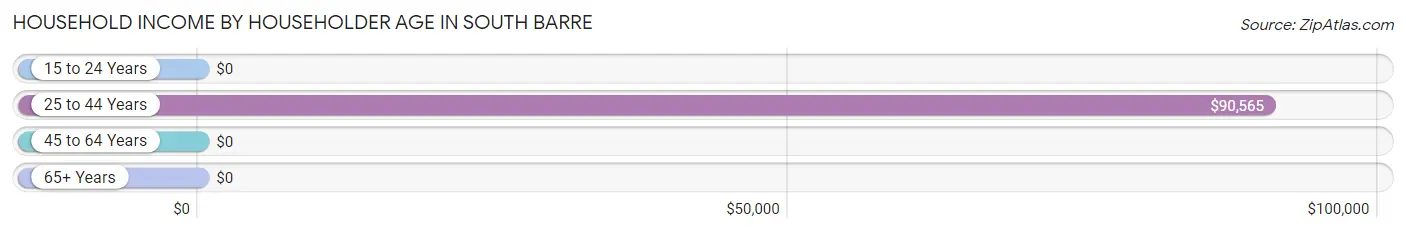
| Income Bracket | # Households | Median Income |
| 15 to 24 Years | 0 (0.0%) | $0 |
| 25 to 44 Years | 218 (30.7%) | $90,565 |
| 45 to 64 Years | 391 (55.0%) | $0 |
| 65+ Years | 102 (14.3%) | $0 |
| Total | 711 (100.0%) | $75,042 |
Poverty in South Barre
Income Below Poverty by Sex and Age in South Barre
With 3.5% poverty level for males and 7.1% for females among the residents of South Barre, 35 to 44 year old males and 35 to 44 year old females are the most vulnerable to poverty, with 23 males (48.9%) and 43 females (36.4%) in their respective age groups living below the poverty level.
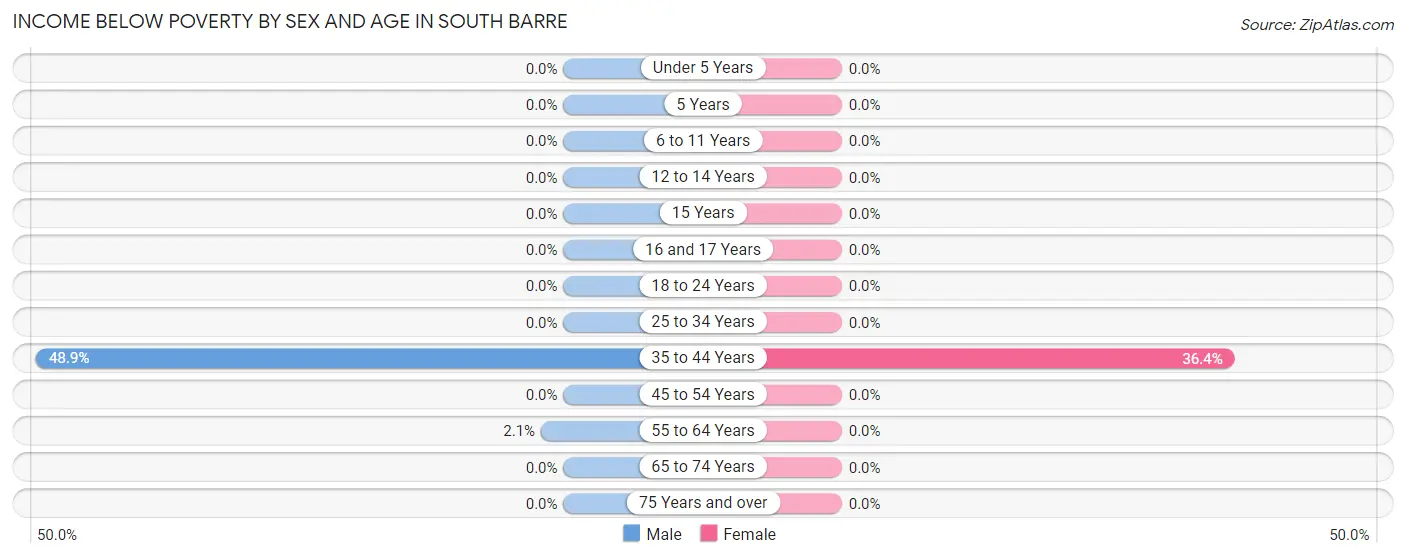
| Age Bracket | Male | Female |
| Under 5 Years | 0 (0.0%) | 0 (0.0%) |
| 5 Years | 0 (0.0%) | 0 (0.0%) |
| 6 to 11 Years | 0 (0.0%) | 0 (0.0%) |
| 12 to 14 Years | 0 (0.0%) | 0 (0.0%) |
| 15 Years | 0 (0.0%) | 0 (0.0%) |
| 16 and 17 Years | 0 (0.0%) | 0 (0.0%) |
| 18 to 24 Years | 0 (0.0%) | 0 (0.0%) |
| 25 to 34 Years | 0 (0.0%) | 0 (0.0%) |
| 35 to 44 Years | 23 (48.9%) | 43 (36.4%) |
| 45 to 54 Years | 0 (0.0%) | 0 (0.0%) |
| 55 to 64 Years | 3 (2.1%) | 0 (0.0%) |
| 65 to 74 Years | 0 (0.0%) | 0 (0.0%) |
| 75 Years and over | 0 (0.0%) | 0 (0.0%) |
| Total | 26 (3.5%) | 43 (7.1%) |
Income Above Poverty by Sex and Age in South Barre
According to the poverty statistics in South Barre, males aged under 5 years and females aged under 5 years are the age groups that are most secure financially, with 100.0% of males and 100.0% of females in these age groups living above the poverty line.
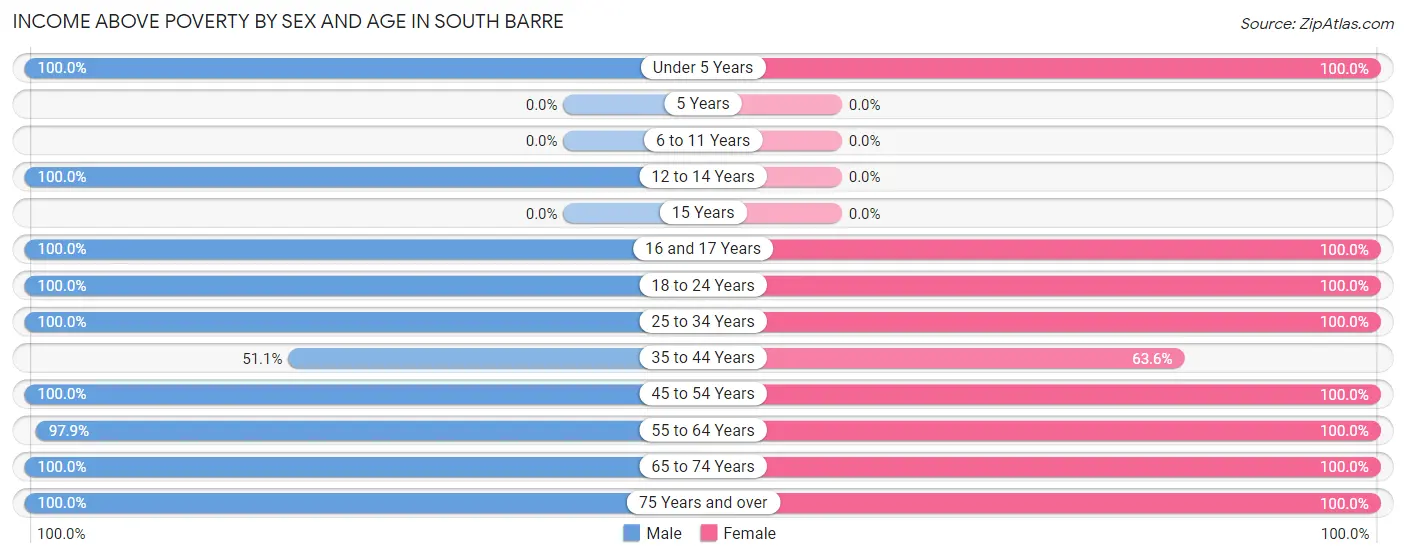
| Age Bracket | Male | Female |
| Under 5 Years | 37 (100.0%) | 17 (100.0%) |
| 5 Years | 0 (0.0%) | 0 (0.0%) |
| 6 to 11 Years | 0 (0.0%) | 0 (0.0%) |
| 12 to 14 Years | 47 (100.0%) | 0 (0.0%) |
| 15 Years | 0 (0.0%) | 0 (0.0%) |
| 16 and 17 Years | 33 (100.0%) | 37 (100.0%) |
| 18 to 24 Years | 28 (100.0%) | 62 (100.0%) |
| 25 to 34 Years | 82 (100.0%) | 88 (100.0%) |
| 35 to 44 Years | 24 (51.1%) | 75 (63.6%) |
| 45 to 54 Years | 253 (100.0%) | 72 (100.0%) |
| 55 to 64 Years | 141 (97.9%) | 166 (100.0%) |
| 65 to 74 Years | 66 (100.0%) | 20 (100.0%) |
| 75 Years and over | 17 (100.0%) | 28 (100.0%) |
| Total | 728 (96.6%) | 565 (92.9%) |
Income Below Poverty Among Married-Couple Families in South Barre
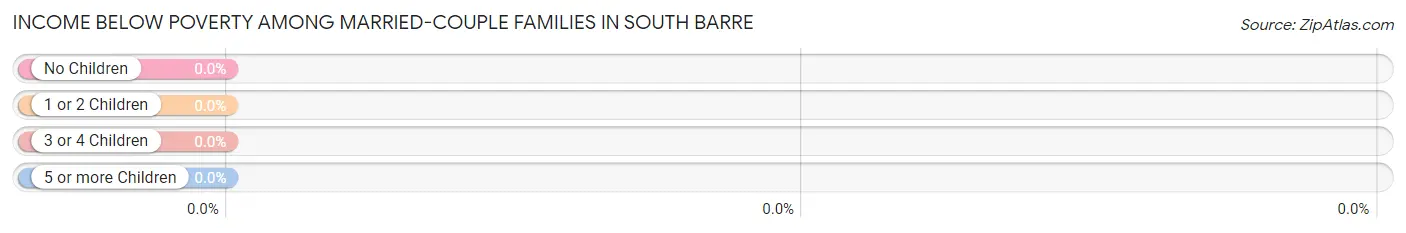
| Children | Above Poverty | Below Poverty |
| No Children | 209 (100.0%) | 0 (0.0%) |
| 1 or 2 Children | 77 (100.0%) | 0 (0.0%) |
| 3 or 4 Children | 0 (0.0%) | 0 (0.0%) |
| 5 or more Children | 0 (0.0%) | 0 (0.0%) |
| Total | 286 (100.0%) | 0 (0.0%) |
Income Below Poverty Among Single-Parent Households in South Barre
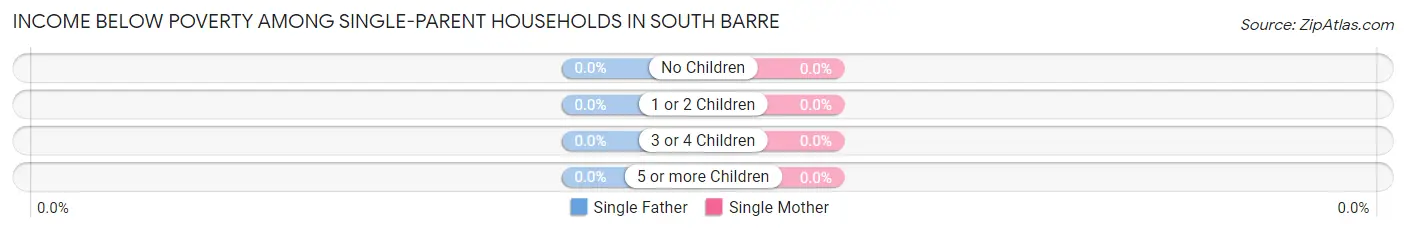
| Children | Single Father | Single Mother |
| No Children | 0 (0.0%) | 0 (0.0%) |
| 1 or 2 Children | 0 (0.0%) | 0 (0.0%) |
| 3 or 4 Children | 0 (0.0%) | 0 (0.0%) |
| 5 or more Children | 0 (0.0%) | 0 (0.0%) |
| Total | 0 (0.0%) | 0 (0.0%) |
Income Below Poverty Among Married-Couple vs Single-Parent Households in South Barre
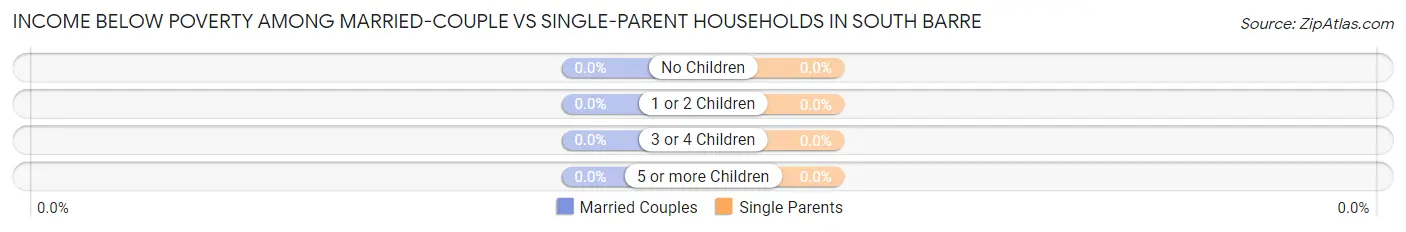
| Children | Married-Couple Families | Single-Parent Households |
| No Children | 0 (0.0%) | 0 (0.0%) |
| 1 or 2 Children | 0 (0.0%) | 0 (0.0%) |
| 3 or 4 Children | 0 (0.0%) | 0 (0.0%) |
| 5 or more Children | 0 (0.0%) | 0 (0.0%) |
| Total | 0 (0.0%) | 0 (0.0%) |
Race in South Barre
The most populous races in South Barre are White / Caucasian (1,260 | 92.5%), and Black / African American (102 | 7.5%).
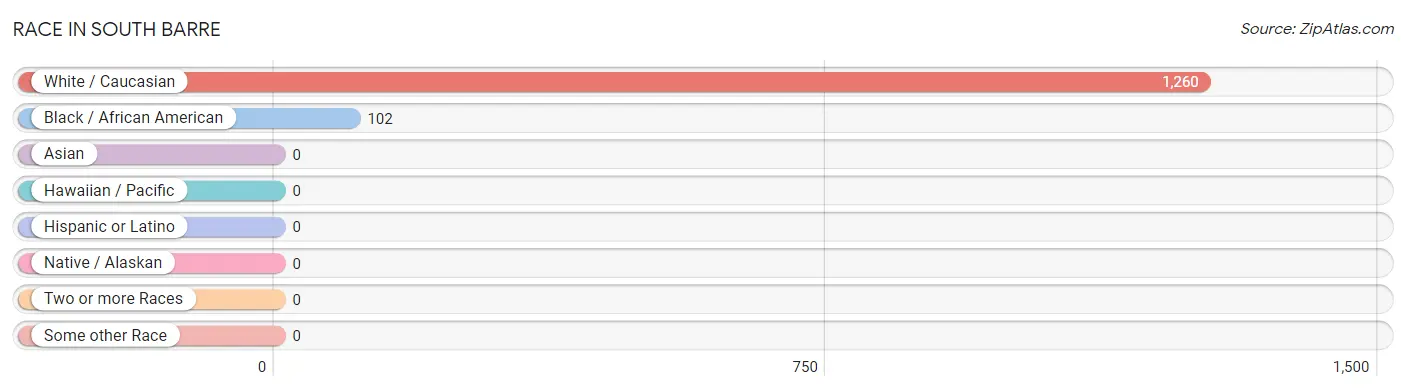
| Race | # Population | % Population |
| Asian | 0 | 0.0% |
| Black / African American | 102 | 7.5% |
| Hawaiian / Pacific | 0 | 0.0% |
| Hispanic or Latino | 0 | 0.0% |
| Native / Alaskan | 0 | 0.0% |
| White / Caucasian | 1,260 | 92.5% |
| Two or more Races | 0 | 0.0% |
| Some other Race | 0 | 0.0% |
| Total | 1,362 | 100.0% |
Ancestry in South Barre
The most populous ancestries reported in South Barre are Scottish (243 | 17.8%), French (154 | 11.3%), French Canadian (142 | 10.4%), Irish (120 | 8.8%), and English (107 | 7.9%), together accounting for 56.2% of all South Barre residents.
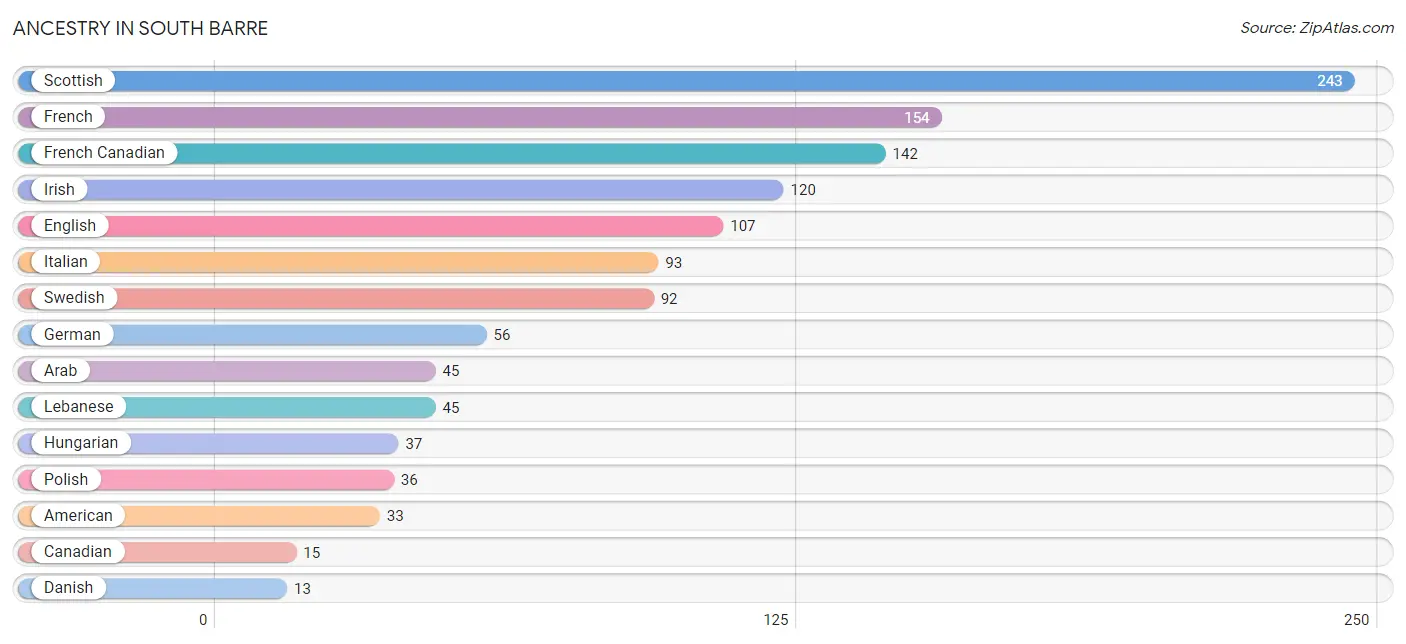
| Ancestry | # Population | % Population |
| American | 33 | 2.4% |
| Arab | 45 | 3.3% |
| Canadian | 15 | 1.1% |
| Danish | 13 | 0.9% |
| English | 107 | 7.9% |
| French | 154 | 11.3% |
| French Canadian | 142 | 10.4% |
| German | 56 | 4.1% |
| Hungarian | 37 | 2.7% |
| Irish | 120 | 8.8% |
| Italian | 93 | 6.8% |
| Lebanese | 45 | 3.3% |
| Norwegian | 3 | 0.2% |
| Polish | 36 | 2.6% |
| Scottish | 243 | 17.8% |
| Swedish | 92 | 6.8% |
| Welsh | 9 | 0.7% | View All 17 Rows |
Immigrants in South Barre

| Immigration Origin | # Population | % Population | View All 0 Rows |
Sex and Age in South Barre
Sex and Age in South Barre
The most populous age groups in South Barre are 50 to 54 Years (214 | 28.4%) for men and 60 to 64 Years (112 | 18.4%) for women.
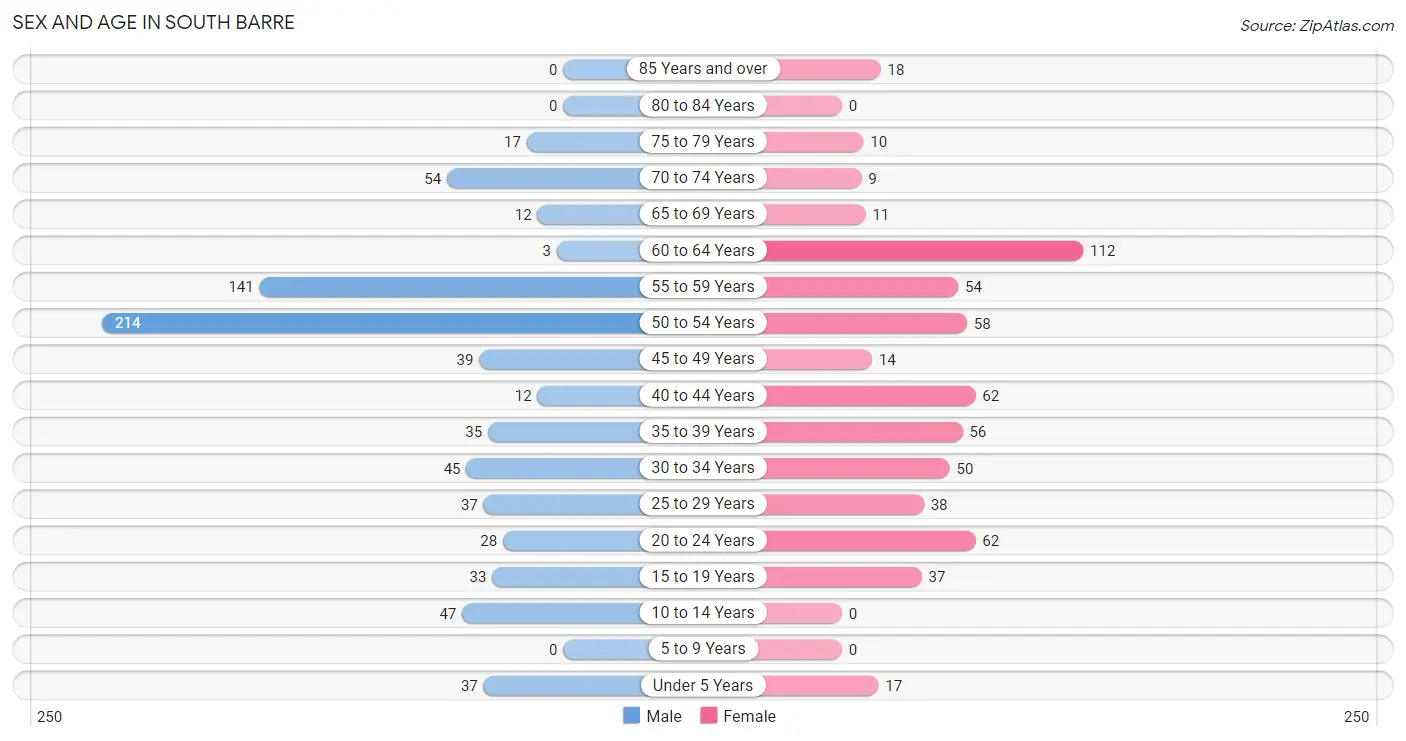
| Age Bracket | Male | Female |
| Under 5 Years | 37 (4.9%) | 17 (2.8%) |
| 5 to 9 Years | 0 (0.0%) | 0 (0.0%) |
| 10 to 14 Years | 47 (6.2%) | 0 (0.0%) |
| 15 to 19 Years | 33 (4.4%) | 37 (6.1%) |
| 20 to 24 Years | 28 (3.7%) | 62 (10.2%) |
| 25 to 29 Years | 37 (4.9%) | 38 (6.2%) |
| 30 to 34 Years | 45 (6.0%) | 50 (8.2%) |
| 35 to 39 Years | 35 (4.6%) | 56 (9.2%) |
| 40 to 44 Years | 12 (1.6%) | 62 (10.2%) |
| 45 to 49 Years | 39 (5.2%) | 14 (2.3%) |
| 50 to 54 Years | 214 (28.4%) | 58 (9.5%) |
| 55 to 59 Years | 141 (18.7%) | 54 (8.9%) |
| 60 to 64 Years | 3 (0.4%) | 112 (18.4%) |
| 65 to 69 Years | 12 (1.6%) | 11 (1.8%) |
| 70 to 74 Years | 54 (7.2%) | 9 (1.5%) |
| 75 to 79 Years | 17 (2.2%) | 10 (1.6%) |
| 80 to 84 Years | 0 (0.0%) | 0 (0.0%) |
| 85 Years and over | 0 (0.0%) | 18 (3.0%) |
| Total | 754 (100.0%) | 608 (100.0%) |
Families and Households in South Barre
Median Family Size in South Barre
The median family size in South Barre is 2.63 persons per family, with single female/mother families (29 | 7.6%) accounting for the largest median family size of 3.21 persons per family. On the other hand, married-couple families (286 | 75.1%) represent the smallest median family size with 2.58 persons per family.
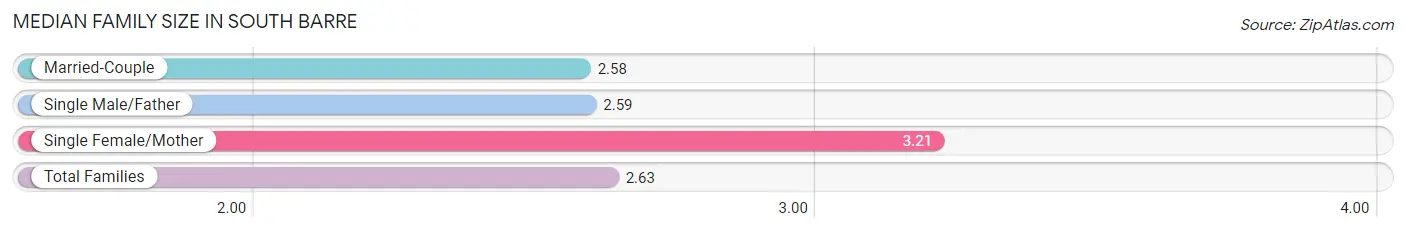
| Family Type | # Families | Family Size |
| Married-Couple | 286 (75.1%) | 2.58 |
| Single Male/Father | 66 (17.3%) | 2.59 |
| Single Female/Mother | 29 (7.6%) | 3.21 |
| Total Families | 381 (100.0%) | 2.63 |
Median Household Size in South Barre
The median household size in South Barre is 1.91 persons per household, with single female/mother households (29 | 4.1%) accounting for the largest median household size of 3.72 persons per household. non-family households (330 | 46.4%) represent the smallest median household size with 1.01 persons per household.
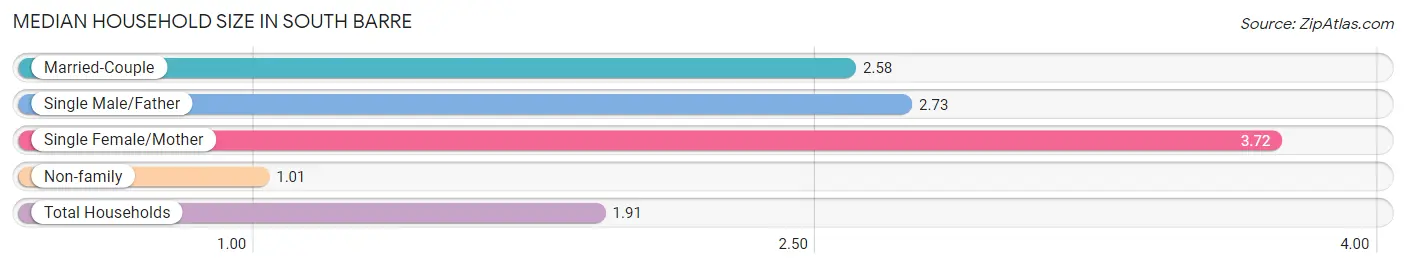
| Household Type | # Households | Household Size |
| Married-Couple | 286 (40.2%) | 2.58 |
| Single Male/Father | 66 (9.3%) | 2.73 |
| Single Female/Mother | 29 (4.1%) | 3.72 |
| Non-family | 330 (46.4%) | 1.01 |
| Total Households | 711 (100.0%) | 1.91 |
Household Size by Marriage Status in South Barre
Out of a total of 711 households in South Barre, 381 (53.6%) are family households, while 330 (46.4%) are nonfamily households. The most numerous type of family households are 3-person households, comprising 197, and the most common type of nonfamily households are 1-person households, comprising 327.
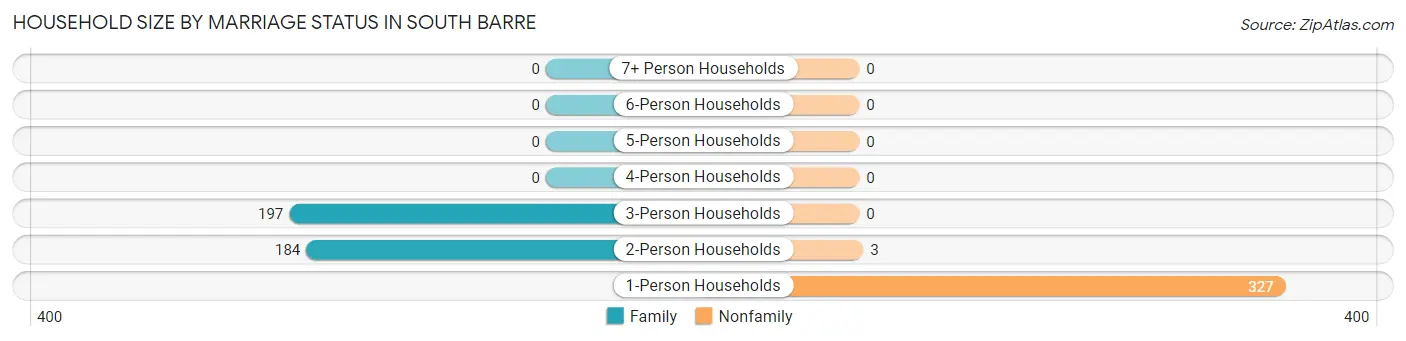
| Household Size | Family Households | Nonfamily Households |
| 1-Person Households | - | 327 (46.0%) |
| 2-Person Households | 184 (25.9%) | 3 (0.4%) |
| 3-Person Households | 197 (27.7%) | 0 (0.0%) |
| 4-Person Households | 0 (0.0%) | 0 (0.0%) |
| 5-Person Households | 0 (0.0%) | 0 (0.0%) |
| 6-Person Households | 0 (0.0%) | 0 (0.0%) |
| 7+ Person Households | 0 (0.0%) | 0 (0.0%) |
| Total | 381 (53.6%) | 330 (46.4%) |
Female Fertility in South Barre
Fertility by Age in South Barre
Average fertility rate in South Barre is 50.0 births per 1,000 women. Women in the age bracket of 20 to 34 years have the highest fertility rate with 107.0 births per 1,000 women. Women in the age bracket of 20 to 34 years acount for 100.0% of all women with births.
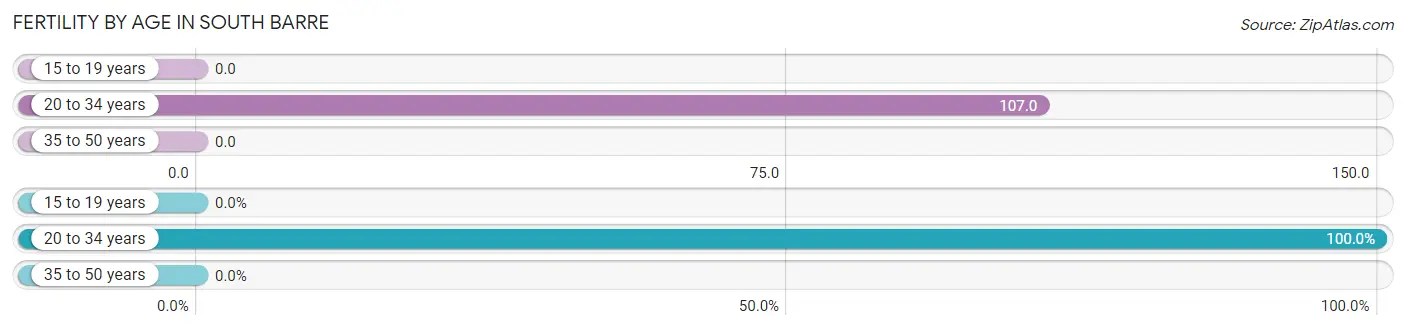
| Age Bracket | Women with Births | Births / 1,000 Women |
| 15 to 19 years | 0 (0.0%) | 0.0 |
| 20 to 34 years | 16 (100.0%) | 107.0 |
| 35 to 50 years | 0 (0.0%) | 0.0 |
| Total | 16 (100.0%) | 50.0 |
Fertility by Age by Marriage Status in South Barre
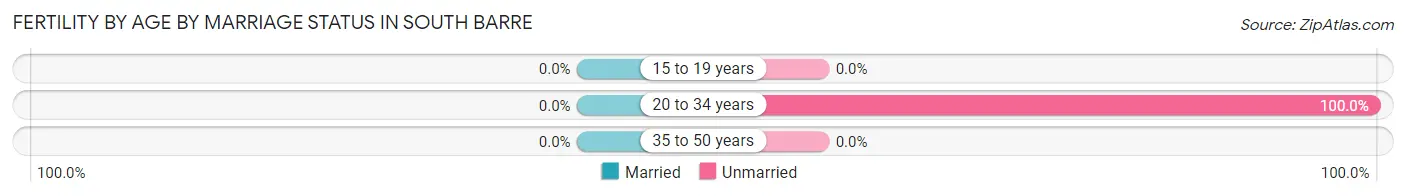
| Age Bracket | Married | Unmarried |
| 15 to 19 years | 0 (0.0%) | 0 (0.0%) |
| 20 to 34 years | 0 (0.0%) | 16 (100.0%) |
| 35 to 50 years | 0 (0.0%) | 0 (0.0%) |
| Total | 0 (0.0%) | 16 (100.0%) |
Fertility by Education in South Barre
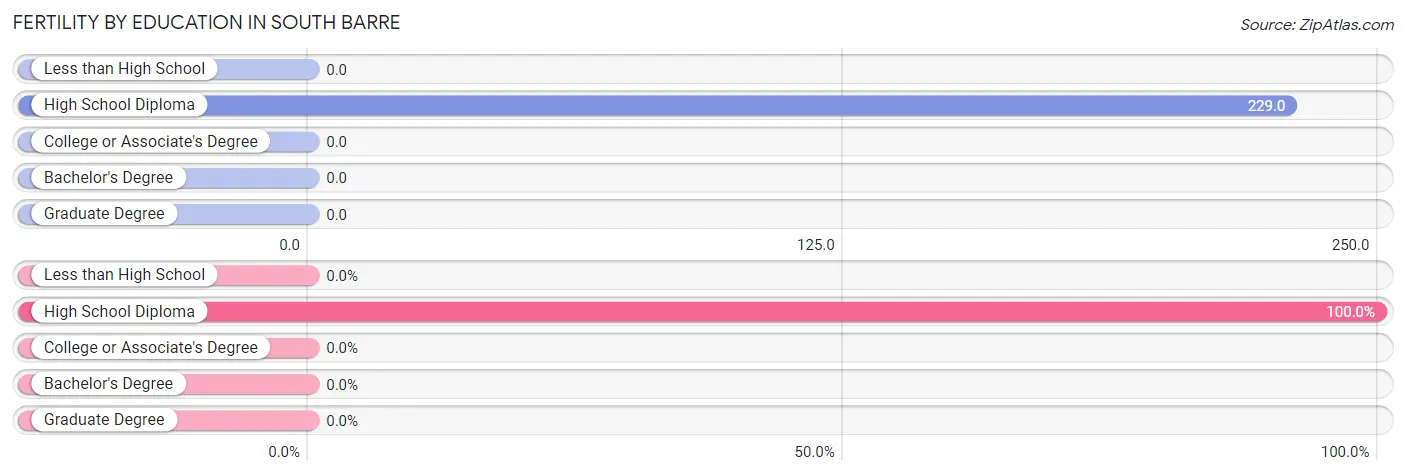
| Educational Attainment | Women with Births | Births / 1,000 Women |
| Less than High School | 0 (0.0%) | 0.0 |
| High School Diploma | 16 (100.0%) | 229.0 |
| College or Associate's Degree | 0 (0.0%) | 0.0 |
| Bachelor's Degree | 0 (0.0%) | 0.0 |
| Graduate Degree | 0 (0.0%) | 0.0 |
| Total | 16 (100.0%) | 50.0 |
Fertility by Education by Marriage Status in South Barre
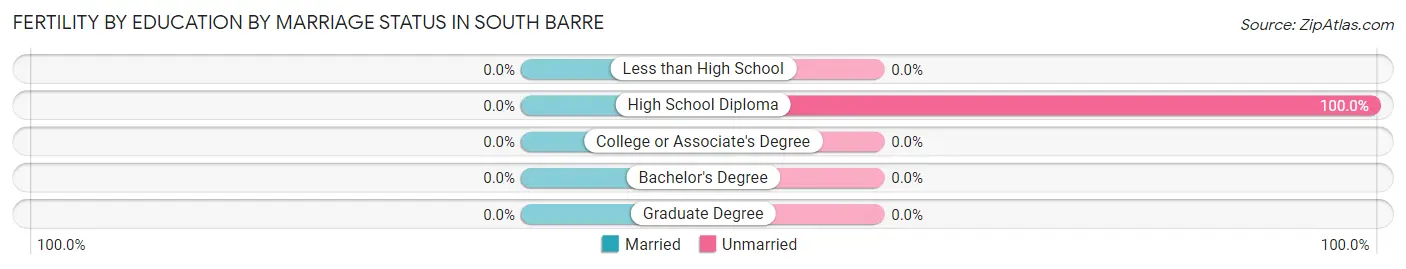
| Educational Attainment | Married | Unmarried |
| Less than High School | 0 (0.0%) | 0 (0.0%) |
| High School Diploma | 0 (0.0%) | 16 (100.0%) |
| College or Associate's Degree | 0 (0.0%) | 0 (0.0%) |
| Bachelor's Degree | 0 (0.0%) | 0 (0.0%) |
| Graduate Degree | 0 (0.0%) | 0 (0.0%) |
| Total | 0 (0.0%) | 16 (100.0%) |
Employment Characteristics in South Barre
Employment by Class of Employer in South Barre
Among the 1,001 employed individuals in South Barre, private company employees (616 | 61.5%), state government employees (166 | 16.6%), and local government employees (123 | 12.3%) make up the most common classes of employment.
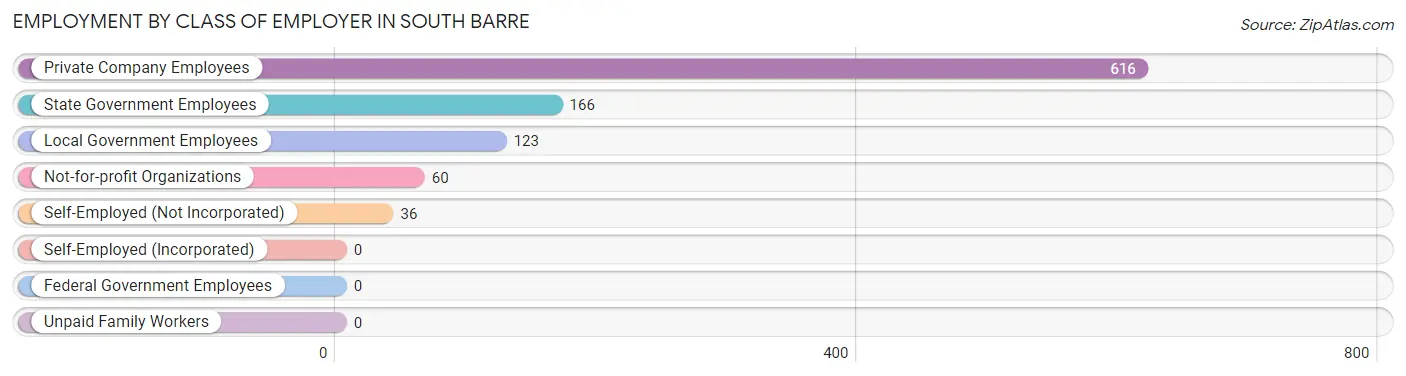
| Employer Class | # Employees | % Employees |
| Private Company Employees | 616 | 61.5% |
| Self-Employed (Incorporated) | 0 | 0.0% |
| Self-Employed (Not Incorporated) | 36 | 3.6% |
| Not-for-profit Organizations | 60 | 6.0% |
| Local Government Employees | 123 | 12.3% |
| State Government Employees | 166 | 16.6% |
| Federal Government Employees | 0 | 0.0% |
| Unpaid Family Workers | 0 | 0.0% |
| Total | 1,001 | 100.0% |
Employment Status by Age in South Barre
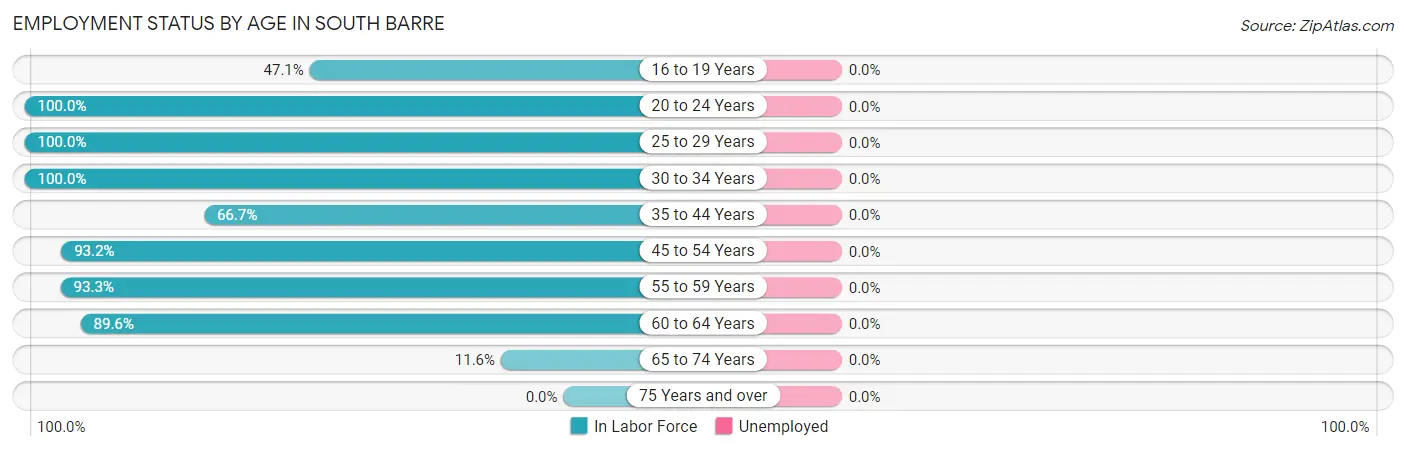
| Age Bracket | In Labor Force | Unemployed |
| 16 to 19 Years | 33 (47.1%) | 0 (0.0%) |
| 20 to 24 Years | 90 (100.0%) | 0 (0.0%) |
| 25 to 29 Years | 75 (100.0%) | 0 (0.0%) |
| 30 to 34 Years | 95 (100.0%) | 0 (0.0%) |
| 35 to 44 Years | 110 (66.7%) | 0 (0.0%) |
| 45 to 54 Years | 303 (93.2%) | 0 (0.0%) |
| 55 to 59 Years | 182 (93.3%) | 0 (0.0%) |
| 60 to 64 Years | 103 (89.6%) | 0 (0.0%) |
| 65 to 74 Years | 10 (11.6%) | 0 (0.0%) |
| 75 Years and over | 0 (0.0%) | 0 (0.0%) |
| Total | 1,001 (79.4%) | 0 (0.0%) |
Employment Status by Educational Attainment in South Barre
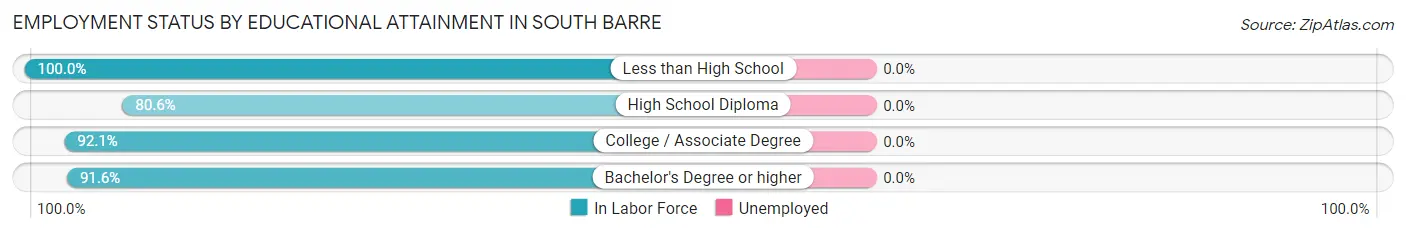
| Educational Attainment | In Labor Force | Unemployed |
| Less than High School | 44 (100.0%) | 0 (0.0%) |
| High School Diploma | 191 (80.6%) | 0 (0.0%) |
| College / Associate Degree | 304 (92.1%) | 0 (0.0%) |
| Bachelor's Degree or higher | 329 (91.6%) | 0 (0.0%) |
| Total | 868 (89.5%) | 0 (0.0%) |
Employment Occupations by Sex in South Barre
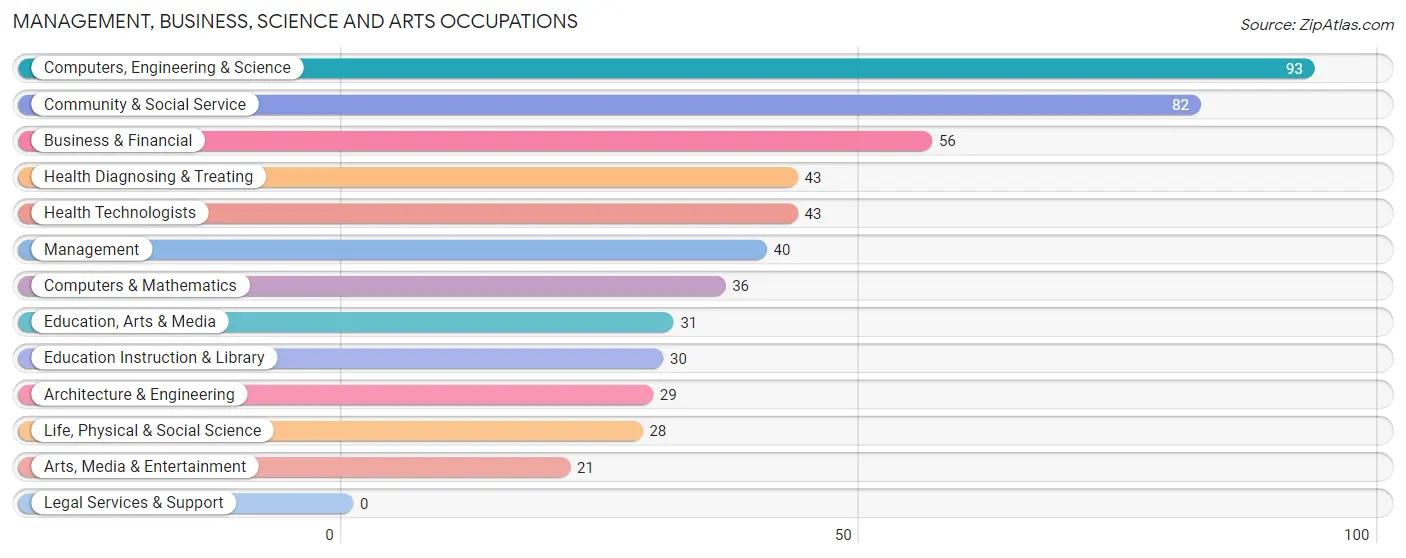
Management, Business, Science and Arts Occupations
The most common Management, Business, Science and Arts occupations in South Barre are Computers, Engineering & Science (93 | 9.3%), Community & Social Service (82 | 8.2%), Business & Financial (56 | 5.6%), Health Diagnosing & Treating (43 | 4.3%), and Health Technologists (43 | 4.3%).
Management, Business, Science and Arts Occupations by Sex
Within the Management, Business, Science and Arts occupations in South Barre, the most male-oriented occupations are Computers & Mathematics (100.0%), Computers, Engineering & Science (52.7%), and Architecture & Engineering (44.8%), while the most female-oriented occupations are Life, Physical & Social Science (100.0%), Community & Social Service (100.0%), and Education, Arts & Media (100.0%).
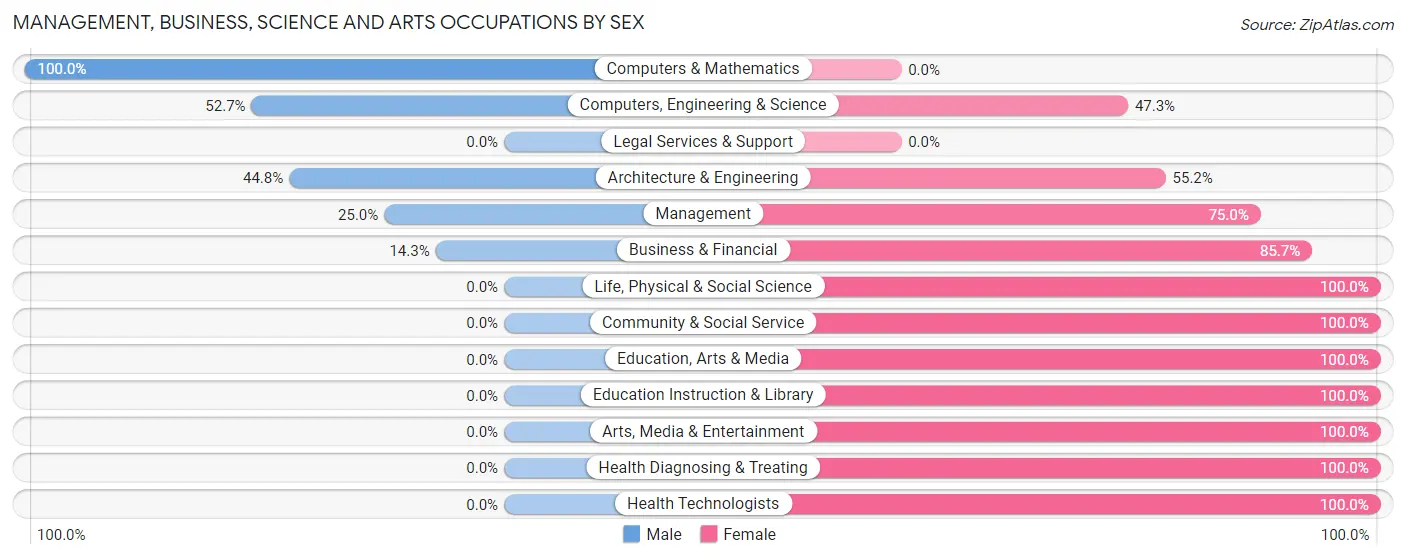
| Occupation | Male | Female |
| Management | 10 (25.0%) | 30 (75.0%) |
| Business & Financial | 8 (14.3%) | 48 (85.7%) |
| Computers, Engineering & Science | 49 (52.7%) | 44 (47.3%) |
| Computers & Mathematics | 36 (100.0%) | 0 (0.0%) |
| Architecture & Engineering | 13 (44.8%) | 16 (55.2%) |
| Life, Physical & Social Science | 0 (0.0%) | 28 (100.0%) |
| Community & Social Service | 0 (0.0%) | 82 (100.0%) |
| Education, Arts & Media | 0 (0.0%) | 31 (100.0%) |
| Legal Services & Support | 0 (0.0%) | 0 (0.0%) |
| Education Instruction & Library | 0 (0.0%) | 30 (100.0%) |
| Arts, Media & Entertainment | 0 (0.0%) | 21 (100.0%) |
| Health Diagnosing & Treating | 0 (0.0%) | 43 (100.0%) |
| Health Technologists | 0 (0.0%) | 43 (100.0%) |
| Total (Category) | 67 (21.3%) | 247 (78.7%) |
| Total (Overall) | 547 (54.6%) | 454 (45.4%) |
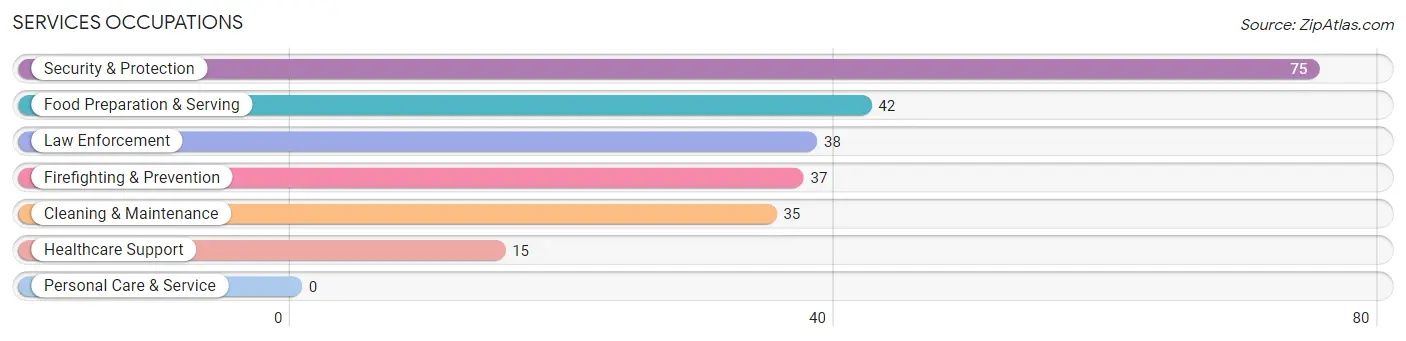
Services Occupations
The most common Services occupations in South Barre are Security & Protection (75 | 7.5%), Food Preparation & Serving (42 | 4.2%), Law Enforcement (38 | 3.8%), Firefighting & Prevention (37 | 3.7%), and Cleaning & Maintenance (35 | 3.5%).
Services Occupations by Sex
Within the Services occupations in South Barre, the most male-oriented occupations are Healthcare Support (100.0%), Firefighting & Prevention (100.0%), and Cleaning & Maintenance (100.0%), while the most female-oriented occupations are Law Enforcement (100.0%), Food Preparation & Serving (100.0%), and Security & Protection (50.7%).
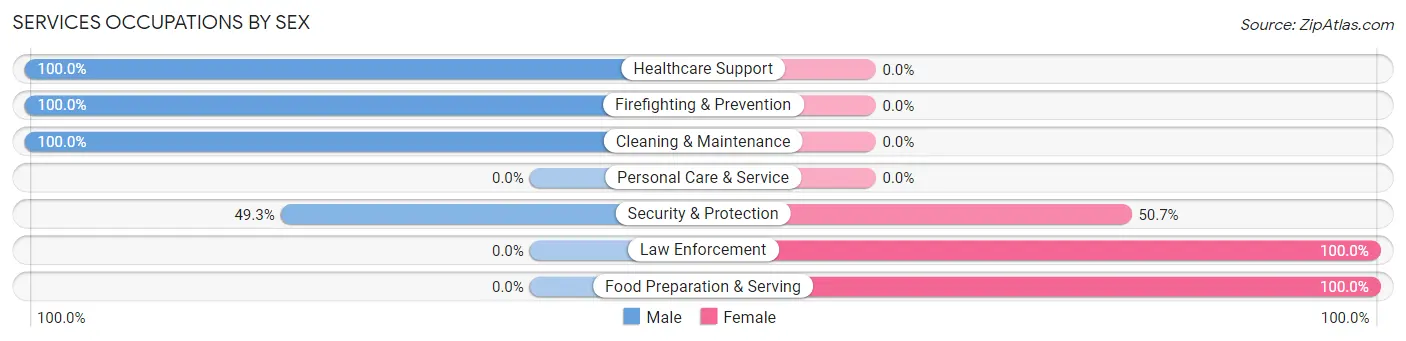
| Occupation | Male | Female |
| Healthcare Support | 15 (100.0%) | 0 (0.0%) |
| Security & Protection | 37 (49.3%) | 38 (50.7%) |
| Firefighting & Prevention | 37 (100.0%) | 0 (0.0%) |
| Law Enforcement | 0 (0.0%) | 38 (100.0%) |
| Food Preparation & Serving | 0 (0.0%) | 42 (100.0%) |
| Cleaning & Maintenance | 35 (100.0%) | 0 (0.0%) |
| Personal Care & Service | 0 (0.0%) | 0 (0.0%) |
| Total (Category) | 87 (52.1%) | 80 (47.9%) |
| Total (Overall) | 547 (54.6%) | 454 (45.4%) |
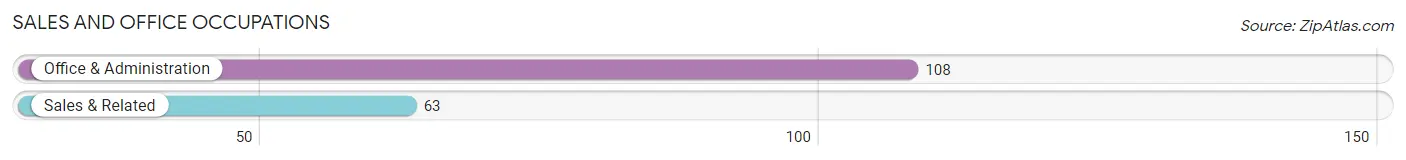
Sales and Office Occupations
The most common Sales and Office occupations in South Barre are Office & Administration (108 | 10.8%), and Sales & Related (63 | 6.3%).
Sales and Office Occupations by Sex
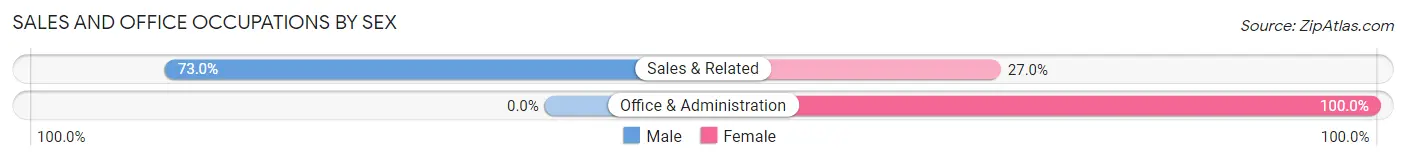
| Occupation | Male | Female |
| Sales & Related | 46 (73.0%) | 17 (27.0%) |
| Office & Administration | 0 (0.0%) | 108 (100.0%) |
| Total (Category) | 46 (26.9%) | 125 (73.1%) |
| Total (Overall) | 547 (54.6%) | 454 (45.4%) |
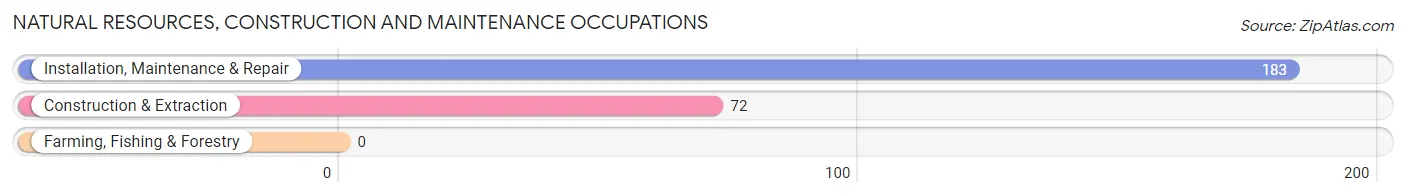
Natural Resources, Construction and Maintenance Occupations
The most common Natural Resources, Construction and Maintenance occupations in South Barre are Installation, Maintenance & Repair (183 | 18.3%), and Construction & Extraction (72 | 7.2%).
Natural Resources, Construction and Maintenance Occupations by Sex
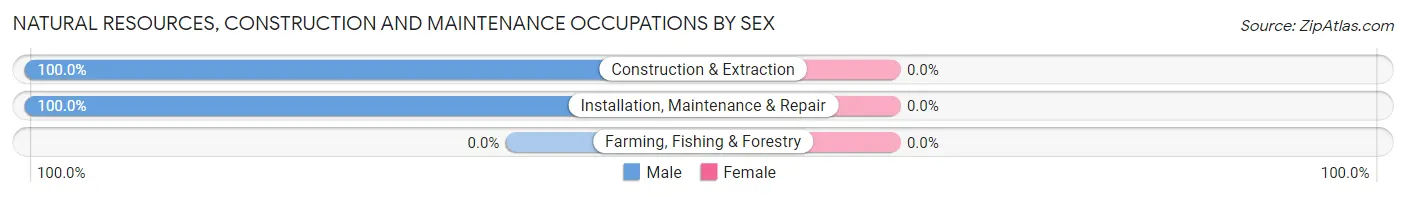
| Occupation | Male | Female |
| Farming, Fishing & Forestry | 0 (0.0%) | 0 (0.0%) |
| Construction & Extraction | 72 (100.0%) | 0 (0.0%) |
| Installation, Maintenance & Repair | 183 (100.0%) | 0 (0.0%) |
| Total (Category) | 255 (100.0%) | 0 (0.0%) |
| Total (Overall) | 547 (54.6%) | 454 (45.4%) |
Production, Transportation and Moving Occupations
The most common Production, Transportation and Moving occupations in South Barre are Material Moving (38 | 3.8%), Production (36 | 3.6%), and Transportation (20 | 2.0%).
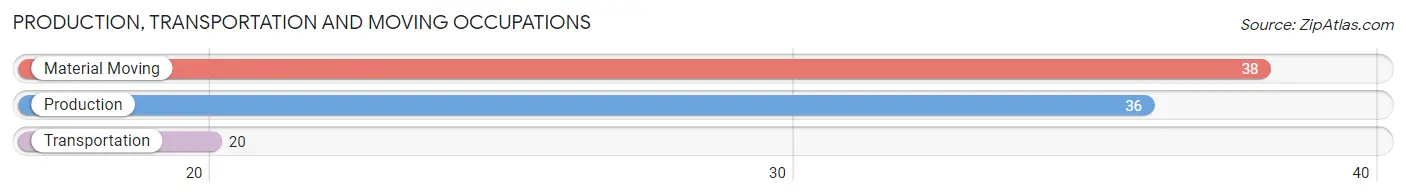
Production, Transportation and Moving Occupations by Sex
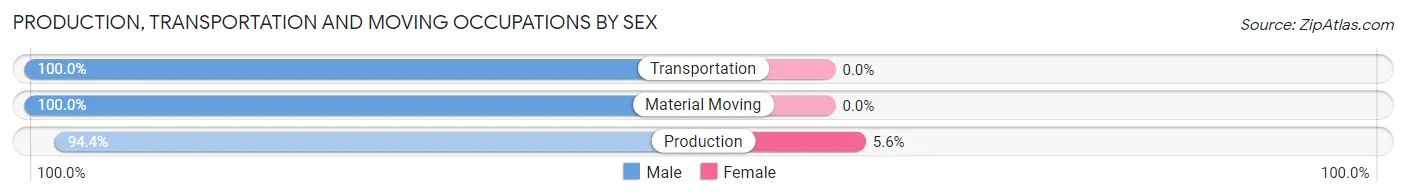
| Occupation | Male | Female |
| Production | 34 (94.4%) | 2 (5.6%) |
| Transportation | 20 (100.0%) | 0 (0.0%) |
| Material Moving | 38 (100.0%) | 0 (0.0%) |
| Total (Category) | 92 (97.9%) | 2 (2.1%) |
| Total (Overall) | 547 (54.6%) | 454 (45.4%) |
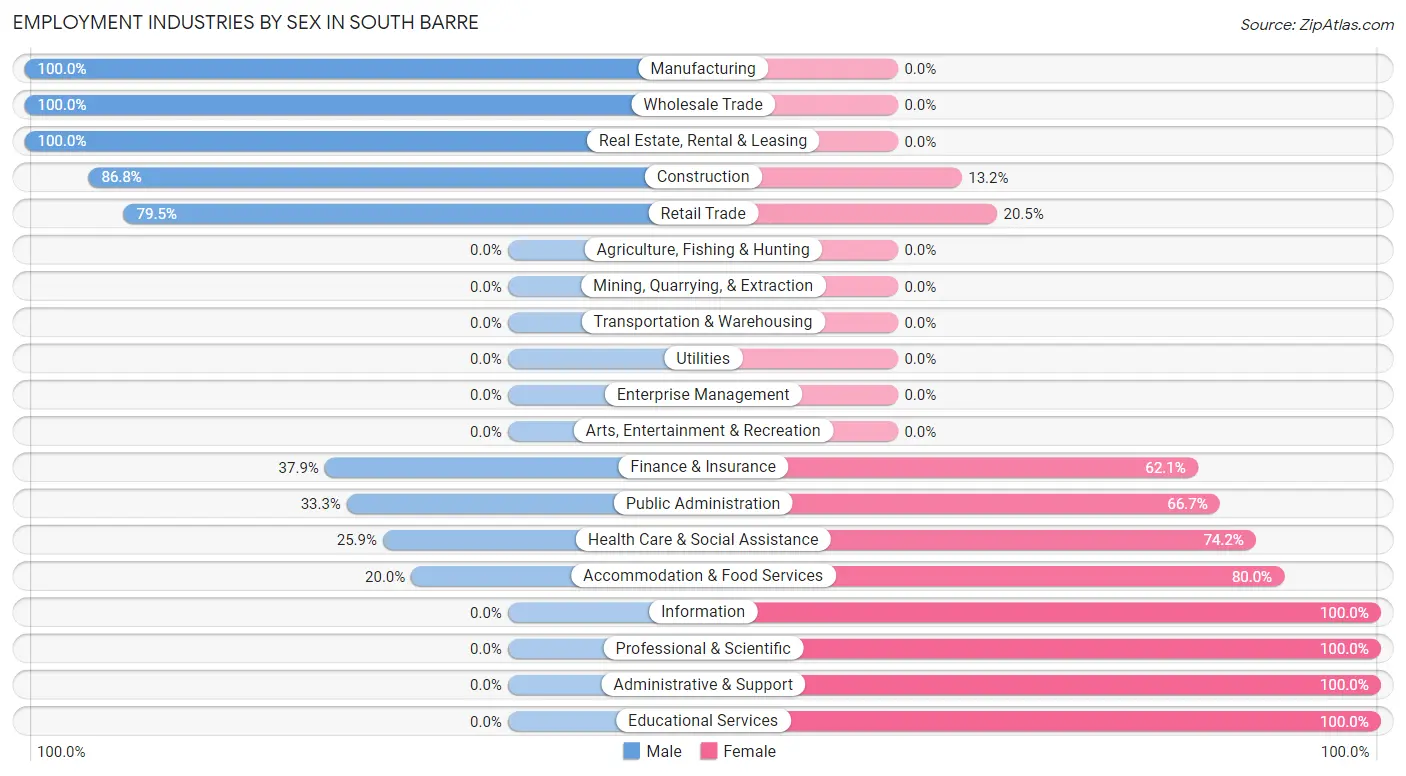
Employment Industries by Sex in South Barre
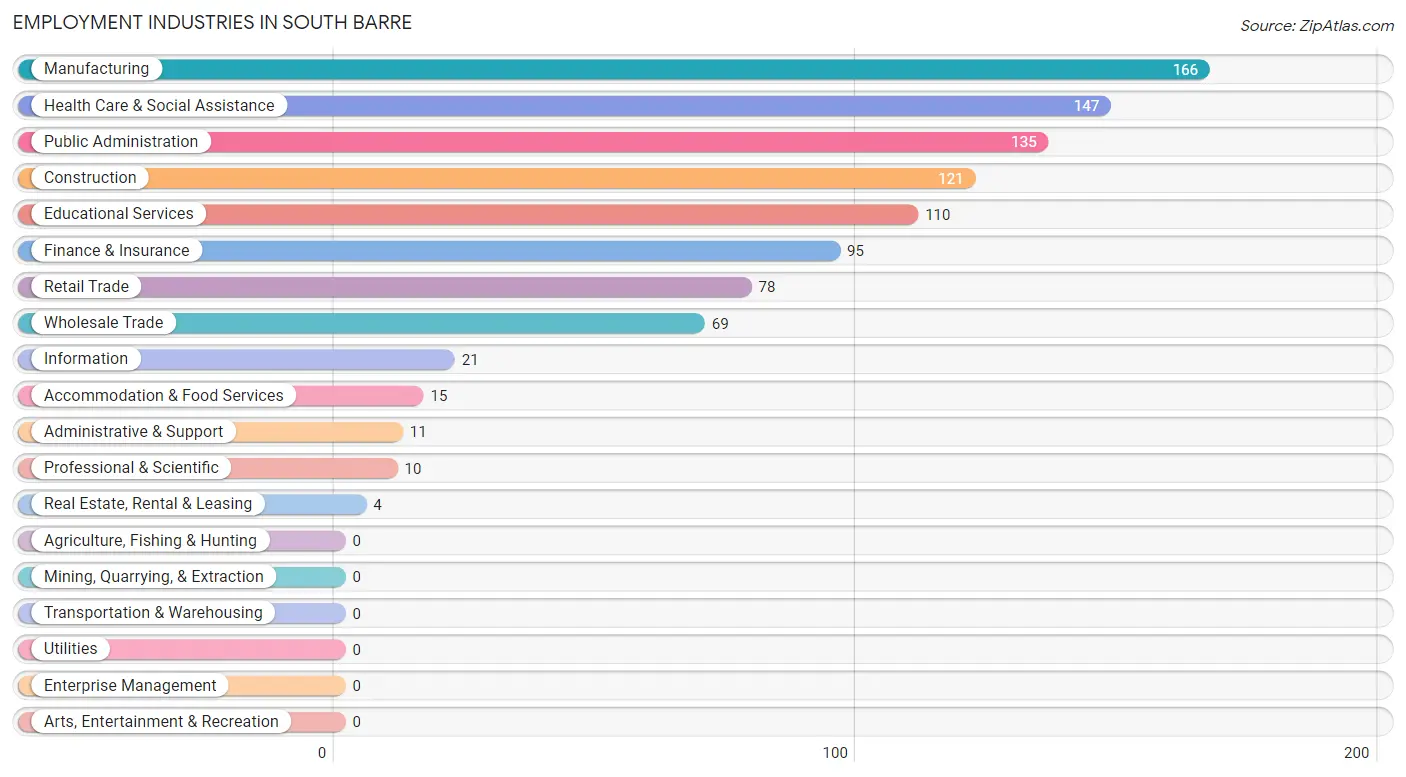
Employment Industries in South Barre
The major employment industries in South Barre include Manufacturing (166 | 16.6%), Health Care & Social Assistance (147 | 14.7%), Public Administration (135 | 13.5%), Construction (121 | 12.1%), and Educational Services (110 | 11.0%).
Employment Industries by Sex in South Barre
The South Barre industries that see more men than women are Manufacturing (100.0%), Wholesale Trade (100.0%), and Real Estate, Rental & Leasing (100.0%), whereas the industries that tend to have a higher number of women are Information (100.0%), Professional & Scientific (100.0%), and Administrative & Support (100.0%).
| Industry | Male | Female |
| Agriculture, Fishing & Hunting | 0 (0.0%) | 0 (0.0%) |
| Mining, Quarrying, & Extraction | 0 (0.0%) | 0 (0.0%) |
| Construction | 105 (86.8%) | 16 (13.2%) |
| Manufacturing | 166 (100.0%) | 0 (0.0%) |
| Wholesale Trade | 69 (100.0%) | 0 (0.0%) |
| Retail Trade | 62 (79.5%) | 16 (20.5%) |
| Transportation & Warehousing | 0 (0.0%) | 0 (0.0%) |
| Utilities | 0 (0.0%) | 0 (0.0%) |
| Information | 0 (0.0%) | 21 (100.0%) |
| Finance & Insurance | 36 (37.9%) | 59 (62.1%) |
| Real Estate, Rental & Leasing | 4 (100.0%) | 0 (0.0%) |
| Professional & Scientific | 0 (0.0%) | 10 (100.0%) |
| Enterprise Management | 0 (0.0%) | 0 (0.0%) |
| Administrative & Support | 0 (0.0%) | 11 (100.0%) |
| Educational Services | 0 (0.0%) | 110 (100.0%) |
| Health Care & Social Assistance | 38 (25.9%) | 109 (74.2%) |
| Arts, Entertainment & Recreation | 0 (0.0%) | 0 (0.0%) |
| Accommodation & Food Services | 3 (20.0%) | 12 (80.0%) |
| Public Administration | 45 (33.3%) | 90 (66.7%) |
| Total | 547 (54.6%) | 454 (45.4%) |
Education in South Barre
School Enrollment in South Barre
The most common levels of schooling among the 157 students in South Barre are high school (106 | 67.5%), graduate / professional (24 | 15.3%), and college / undergraduate (16 | 10.2%).
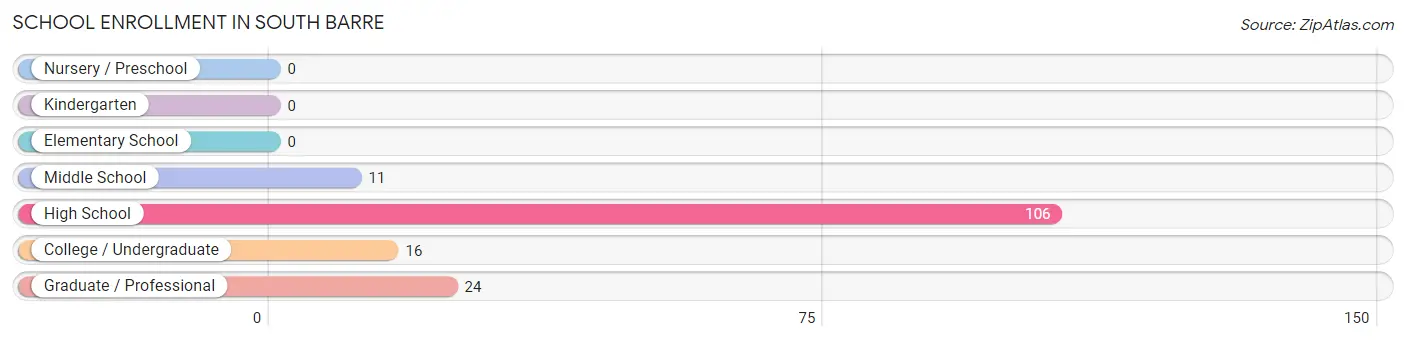
| School Level | # Students | % Students |
| Nursery / Preschool | 0 | 0.0% |
| Kindergarten | 0 | 0.0% |
| Elementary School | 0 | 0.0% |
| Middle School | 11 | 7.0% |
| High School | 106 | 67.5% |
| College / Undergraduate | 16 | 10.2% |
| Graduate / Professional | 24 | 15.3% |
| Total | 157 | 100.0% |
School Enrollment by Age by Funding Source in South Barre
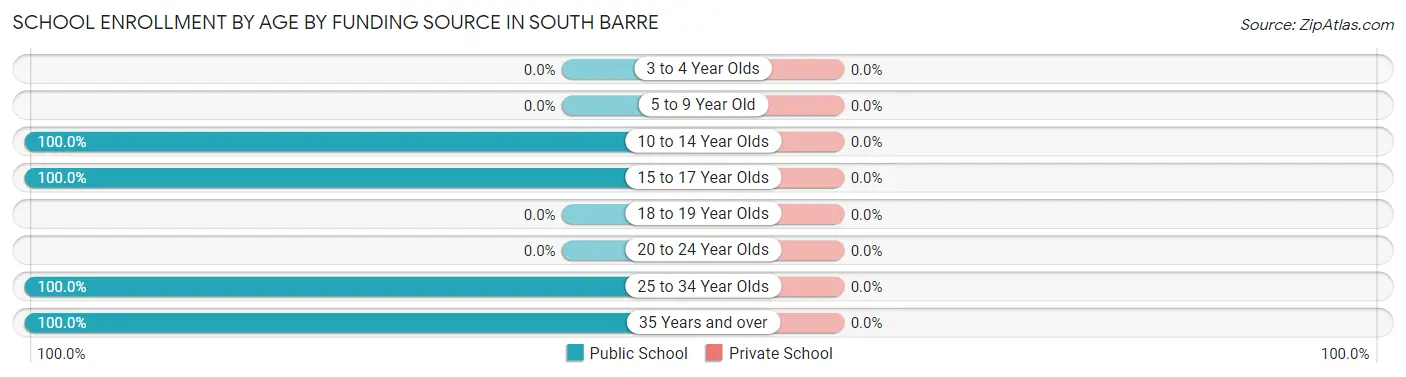
| Age Bracket | Public School | Private School |
| 3 to 4 Year Olds | 0 (0.0%) | 0 (0.0%) |
| 5 to 9 Year Old | 0 (0.0%) | 0 (0.0%) |
| 10 to 14 Year Olds | 47 (100.0%) | 0 (0.0%) |
| 15 to 17 Year Olds | 70 (100.0%) | 0 (0.0%) |
| 18 to 19 Year Olds | 0 (0.0%) | 0 (0.0%) |
| 20 to 24 Year Olds | 0 (0.0%) | 0 (0.0%) |
| 25 to 34 Year Olds | 3 (100.0%) | 0 (0.0%) |
| 35 Years and over | 37 (100.0%) | 0 (0.0%) |
| Total | 157 (100.0%) | 0 (0.0%) |
Educational Attainment by Field of Study in South Barre
Business (190 | 45.8%), arts & humanities (58 | 14.0%), social sciences (51 | 12.3%), liberal arts & history (41 | 9.9%), and psychology (32 | 7.7%) are the most common fields of study among 415 individuals in South Barre who have obtained a bachelor's degree or higher.
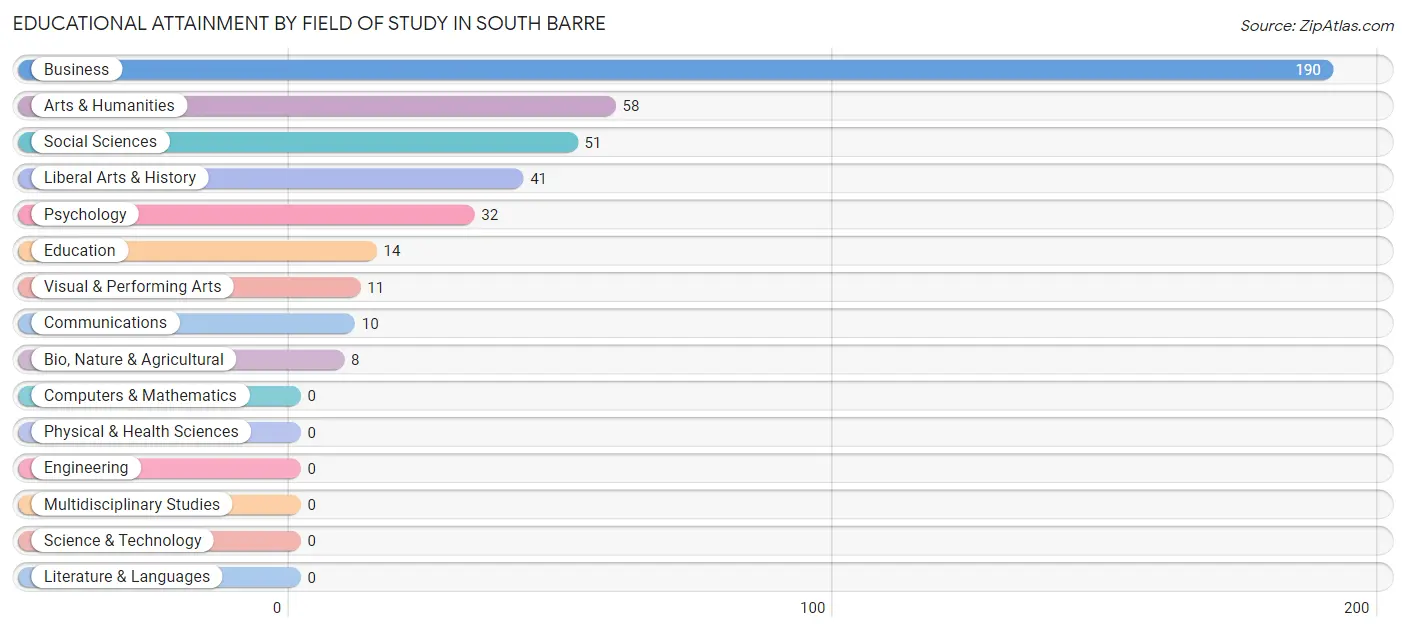
| Field of Study | # Graduates | % Graduates |
| Computers & Mathematics | 0 | 0.0% |
| Bio, Nature & Agricultural | 8 | 1.9% |
| Physical & Health Sciences | 0 | 0.0% |
| Psychology | 32 | 7.7% |
| Social Sciences | 51 | 12.3% |
| Engineering | 0 | 0.0% |
| Multidisciplinary Studies | 0 | 0.0% |
| Science & Technology | 0 | 0.0% |
| Business | 190 | 45.8% |
| Education | 14 | 3.4% |
| Literature & Languages | 0 | 0.0% |
| Liberal Arts & History | 41 | 9.9% |
| Visual & Performing Arts | 11 | 2.6% |
| Communications | 10 | 2.4% |
| Arts & Humanities | 58 | 14.0% |
| Total | 415 | 100.0% |
Transportation & Commute in South Barre
Vehicle Availability by Sex in South Barre
The most prevalent vehicle ownership categories in South Barre are males with 2 vehicles (286, accounting for 52.3%) and females with 2 vehicles (174, making up 63.0%).
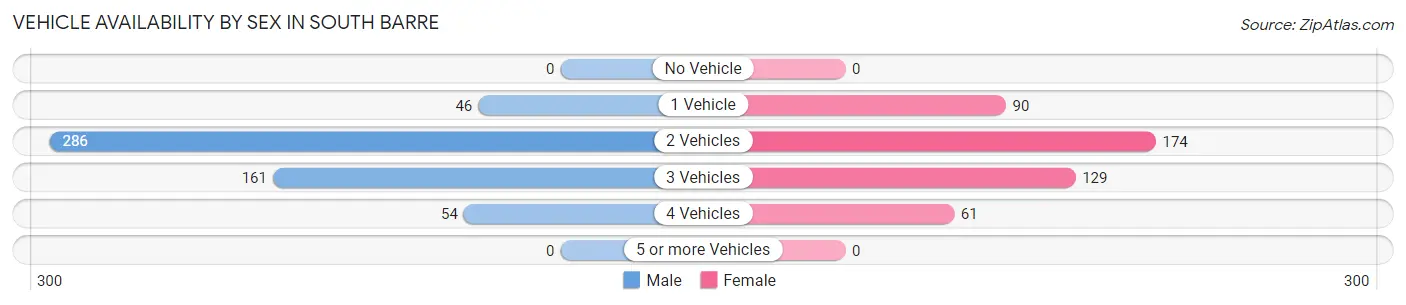
| Vehicles Available | Male | Female |
| No Vehicle | 0 (0.0%) | 0 (0.0%) |
| 1 Vehicle | 46 (8.4%) | 90 (19.8%) |
| 2 Vehicles | 286 (52.3%) | 174 (38.3%) |
| 3 Vehicles | 161 (29.4%) | 129 (28.4%) |
| 4 Vehicles | 54 (9.9%) | 61 (13.4%) |
| 5 or more Vehicles | 0 (0.0%) | 0 (0.0%) |
| Total | 547 (100.0%) | 454 (100.0%) |
Commute Time in South Barre
The most frequently occuring commute durations in South Barre are 10 to 14 minutes (305 commuters, 35.1%), 5 to 9 minutes (224 commuters, 25.8%), and 45 to 59 minutes (120 commuters, 13.8%).
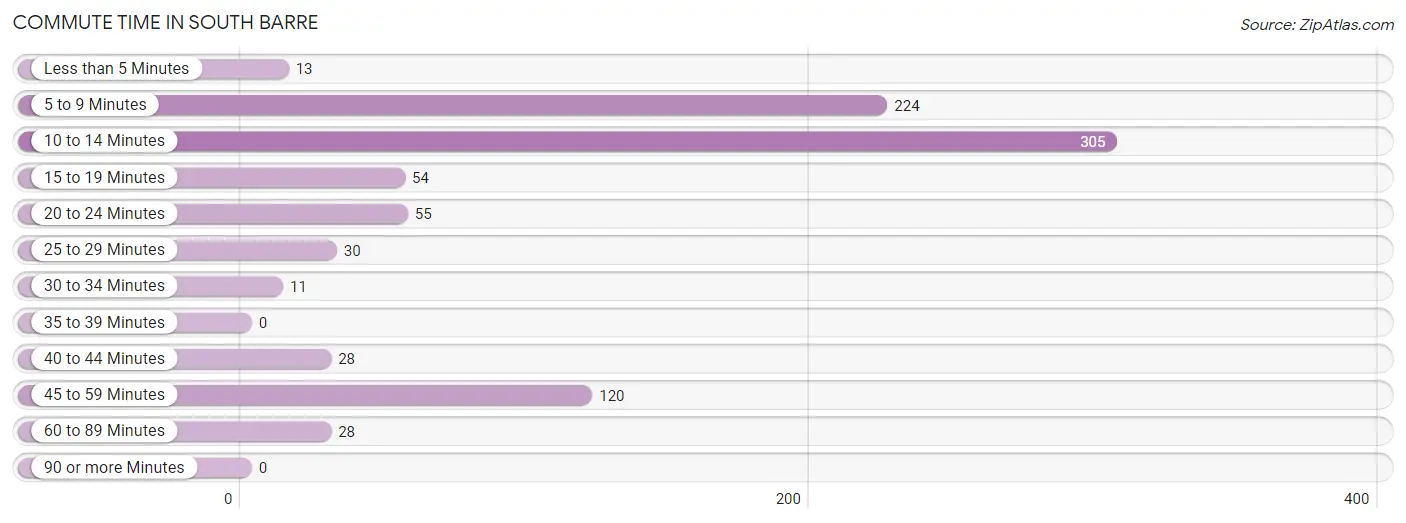
| Commute Time | # Commuters | % Commuters |
| Less than 5 Minutes | 13 | 1.5% |
| 5 to 9 Minutes | 224 | 25.8% |
| 10 to 14 Minutes | 305 | 35.1% |
| 15 to 19 Minutes | 54 | 6.2% |
| 20 to 24 Minutes | 55 | 6.3% |
| 25 to 29 Minutes | 30 | 3.5% |
| 30 to 34 Minutes | 11 | 1.3% |
| 35 to 39 Minutes | 0 | 0.0% |
| 40 to 44 Minutes | 28 | 3.2% |
| 45 to 59 Minutes | 120 | 13.8% |
| 60 to 89 Minutes | 28 | 3.2% |
| 90 or more Minutes | 0 | 0.0% |
Commute Time by Sex in South Barre
The most common commute times in South Barre are 10 to 14 minutes (231 commuters, 45.8%) for males and 5 to 9 minutes (86 commuters, 23.6%) for females.
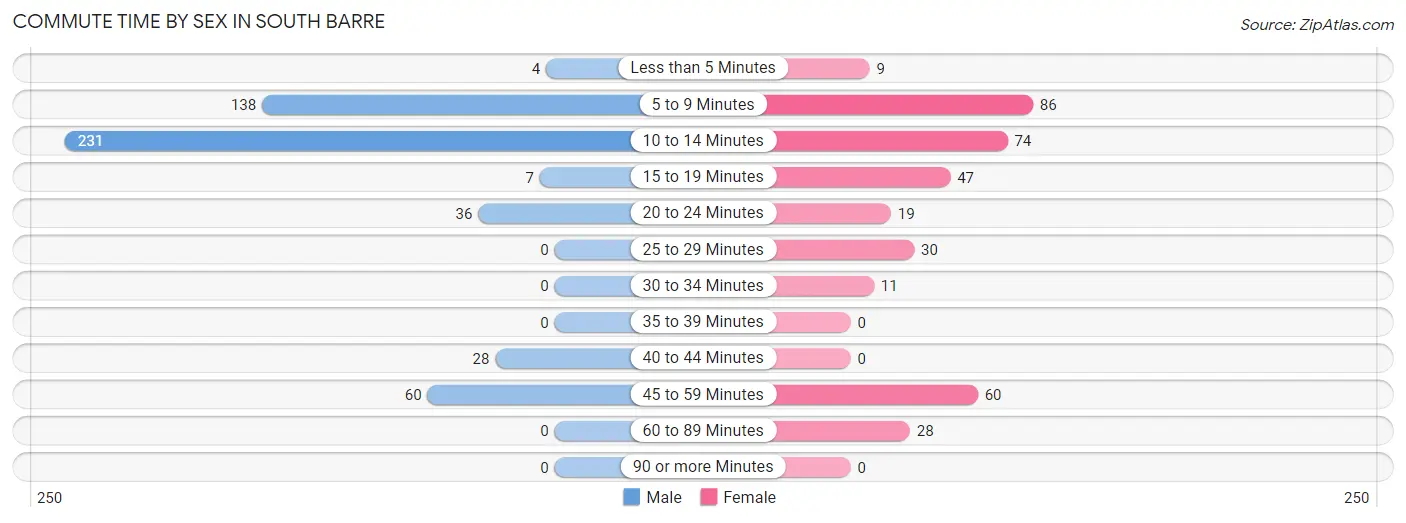
| Commute Time | Male | Female |
| Less than 5 Minutes | 4 (0.8%) | 9 (2.5%) |
| 5 to 9 Minutes | 138 (27.4%) | 86 (23.6%) |
| 10 to 14 Minutes | 231 (45.8%) | 74 (20.3%) |
| 15 to 19 Minutes | 7 (1.4%) | 47 (12.9%) |
| 20 to 24 Minutes | 36 (7.1%) | 19 (5.2%) |
| 25 to 29 Minutes | 0 (0.0%) | 30 (8.2%) |
| 30 to 34 Minutes | 0 (0.0%) | 11 (3.0%) |
| 35 to 39 Minutes | 0 (0.0%) | 0 (0.0%) |
| 40 to 44 Minutes | 28 (5.6%) | 0 (0.0%) |
| 45 to 59 Minutes | 60 (11.9%) | 60 (16.5%) |
| 60 to 89 Minutes | 0 (0.0%) | 28 (7.7%) |
| 90 or more Minutes | 0 (0.0%) | 0 (0.0%) |
Time of Departure to Work by Sex in South Barre
The most frequent times of departure to work in South Barre are 6:30 AM to 6:59 AM (168, 33.3%) for males and 7:00 AM to 7:29 AM (116, 31.9%) for females.
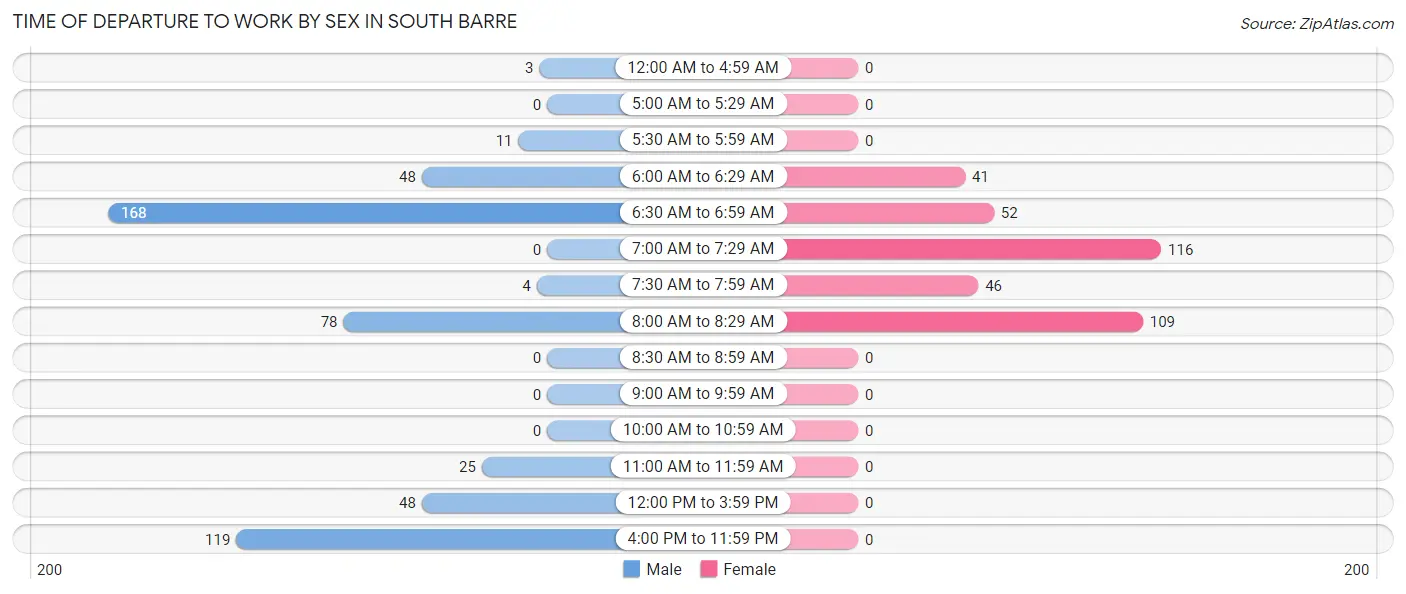
| Time of Departure | Male | Female |
| 12:00 AM to 4:59 AM | 3 (0.6%) | 0 (0.0%) |
| 5:00 AM to 5:29 AM | 0 (0.0%) | 0 (0.0%) |
| 5:30 AM to 5:59 AM | 11 (2.2%) | 0 (0.0%) |
| 6:00 AM to 6:29 AM | 48 (9.5%) | 41 (11.3%) |
| 6:30 AM to 6:59 AM | 168 (33.3%) | 52 (14.3%) |
| 7:00 AM to 7:29 AM | 0 (0.0%) | 116 (31.9%) |
| 7:30 AM to 7:59 AM | 4 (0.8%) | 46 (12.6%) |
| 8:00 AM to 8:29 AM | 78 (15.5%) | 109 (29.9%) |
| 8:30 AM to 8:59 AM | 0 (0.0%) | 0 (0.0%) |
| 9:00 AM to 9:59 AM | 0 (0.0%) | 0 (0.0%) |
| 10:00 AM to 10:59 AM | 0 (0.0%) | 0 (0.0%) |
| 11:00 AM to 11:59 AM | 25 (5.0%) | 0 (0.0%) |
| 12:00 PM to 3:59 PM | 48 (9.5%) | 0 (0.0%) |
| 4:00 PM to 11:59 PM | 119 (23.6%) | 0 (0.0%) |
| Total | 504 (100.0%) | 364 (100.0%) |
Housing Occupancy in South Barre
Occupancy by Ownership in South Barre
Of the total 711 dwellings in South Barre, owner-occupied units account for 549 (77.2%), while renter-occupied units make up 162 (22.8%).
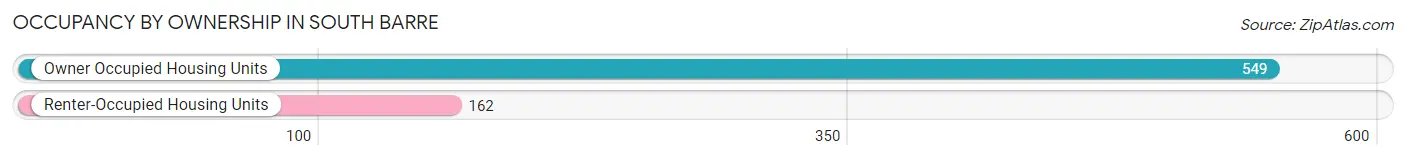
| Occupancy | # Housing Units | % Housing Units |
| Owner Occupied Housing Units | 549 | 77.2% |
| Renter-Occupied Housing Units | 162 | 22.8% |
| Total Occupied Housing Units | 711 | 100.0% |
Occupancy by Household Size in South Barre
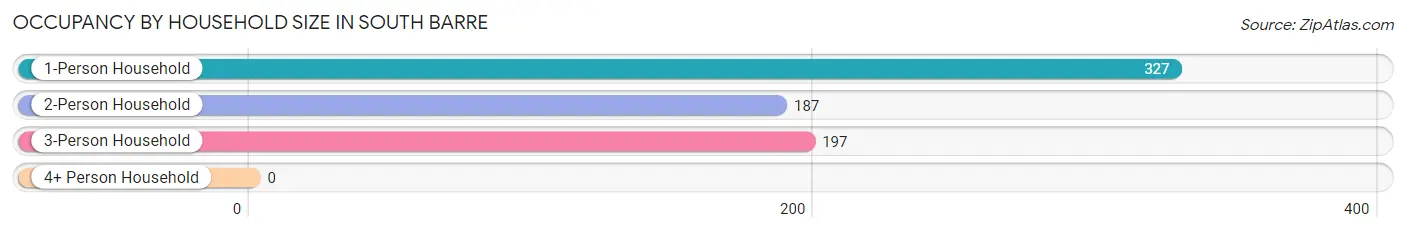
| Household Size | # Housing Units | % Housing Units |
| 1-Person Household | 327 | 46.0% |
| 2-Person Household | 187 | 26.3% |
| 3-Person Household | 197 | 27.7% |
| 4+ Person Household | 0 | 0.0% |
| Total Housing Units | 711 | 100.0% |
Occupancy by Ownership by Household Size in South Barre
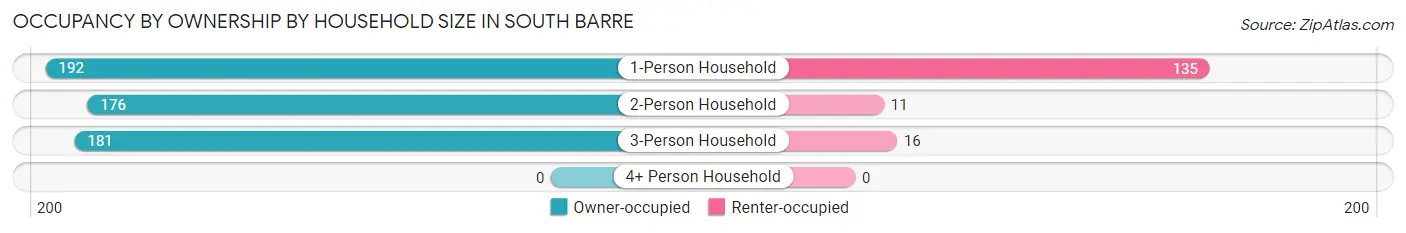
| Household Size | Owner-occupied | Renter-occupied |
| 1-Person Household | 192 (58.7%) | 135 (41.3%) |
| 2-Person Household | 176 (94.1%) | 11 (5.9%) |
| 3-Person Household | 181 (91.9%) | 16 (8.1%) |
| 4+ Person Household | 0 (0.0%) | 0 (0.0%) |
| Total Housing Units | 549 (77.2%) | 162 (22.8%) |
Occupancy by Educational Attainment in South Barre
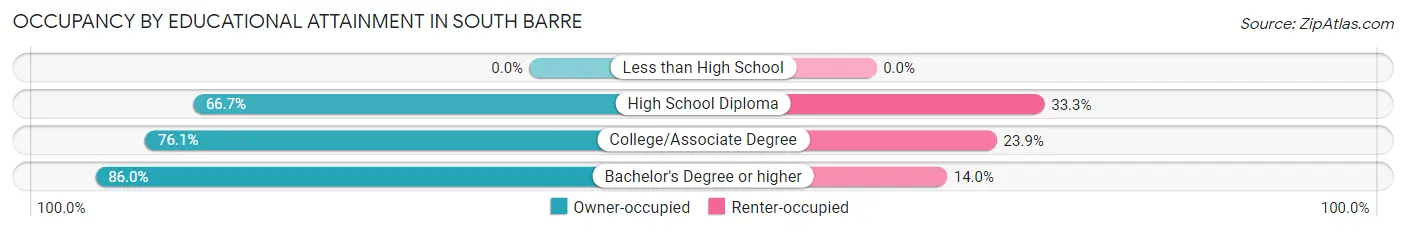
| Household Size | Owner-occupied | Renter-occupied |
| Less than High School | 0 (0.0%) | 0 (0.0%) |
| High School Diploma | 154 (66.7%) | 77 (33.3%) |
| College/Associate Degree | 137 (76.1%) | 43 (23.9%) |
| Bachelor's Degree or higher | 258 (86.0%) | 42 (14.0%) |
Occupancy by Age of Householder in South Barre
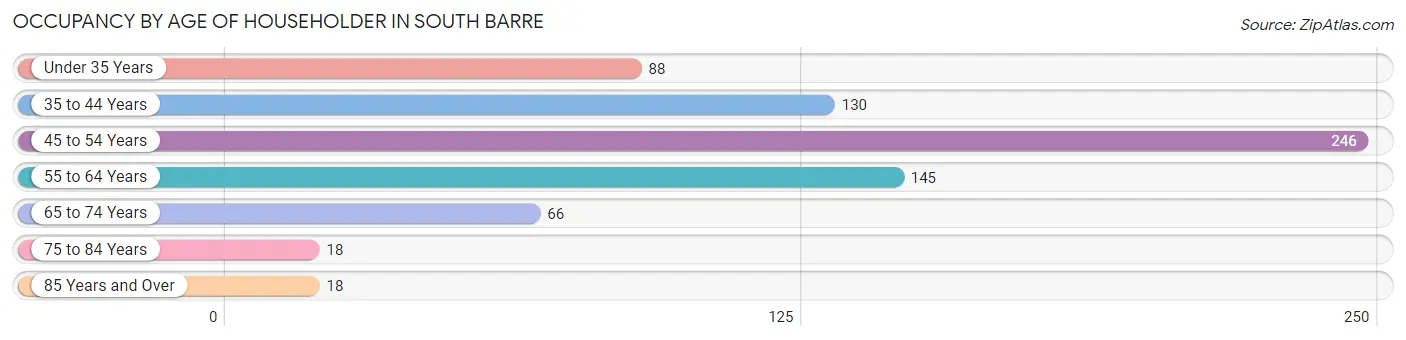
| Age Bracket | # Households | % Households |
| Under 35 Years | 88 | 12.4% |
| 35 to 44 Years | 130 | 18.3% |
| 45 to 54 Years | 246 | 34.6% |
| 55 to 64 Years | 145 | 20.4% |
| 65 to 74 Years | 66 | 9.3% |
| 75 to 84 Years | 18 | 2.5% |
| 85 Years and Over | 18 | 2.5% |
| Total | 711 | 100.0% |
Housing Finances in South Barre
Median Income by Occupancy in South Barre
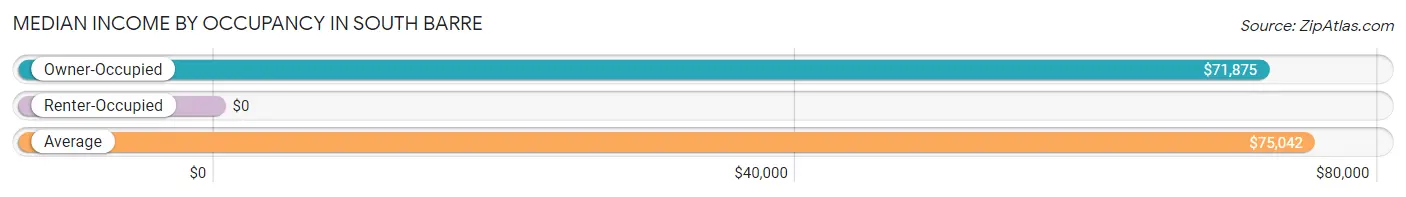
| Occupancy Type | # Households | Median Income |
| Owner-Occupied | 549 (77.2%) | $71,875 |
| Renter-Occupied | 162 (22.8%) | $0 |
| Average | 711 (100.0%) | $75,042 |
Occupancy by Householder Income Bracket in South Barre
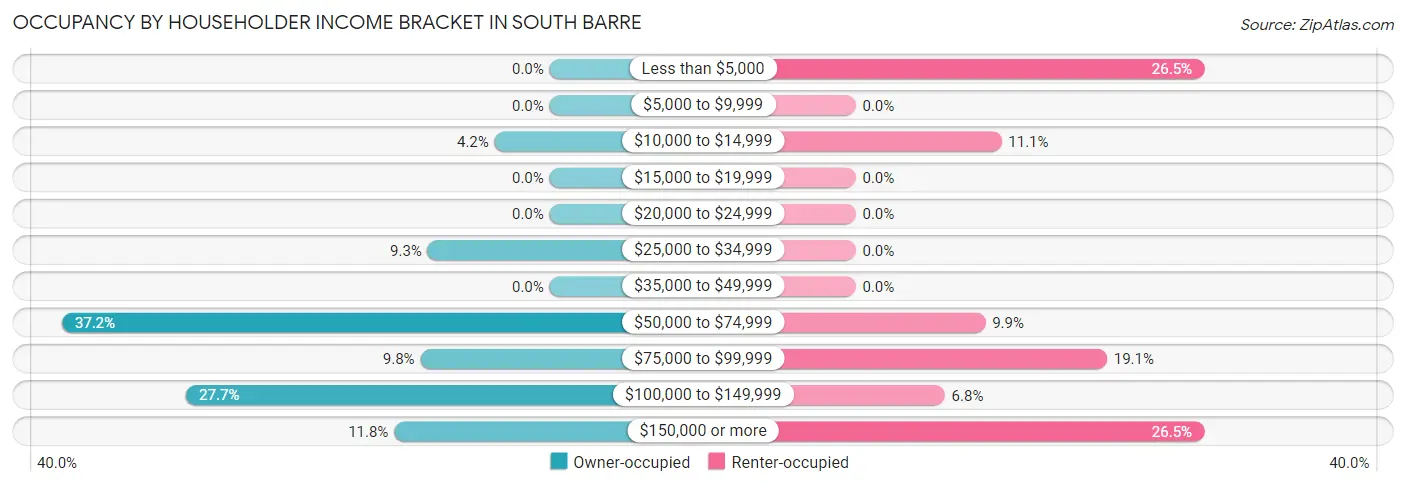
| Income Bracket | Owner-occupied | Renter-occupied |
| Less than $5,000 | 0 (0.0%) | 43 (26.5%) |
| $5,000 to $9,999 | 0 (0.0%) | 0 (0.0%) |
| $10,000 to $14,999 | 23 (4.2%) | 18 (11.1%) |
| $15,000 to $19,999 | 0 (0.0%) | 0 (0.0%) |
| $20,000 to $24,999 | 0 (0.0%) | 0 (0.0%) |
| $25,000 to $34,999 | 51 (9.3%) | 0 (0.0%) |
| $35,000 to $49,999 | 0 (0.0%) | 0 (0.0%) |
| $50,000 to $74,999 | 204 (37.2%) | 16 (9.9%) |
| $75,000 to $99,999 | 54 (9.8%) | 31 (19.1%) |
| $100,000 to $149,999 | 152 (27.7%) | 11 (6.8%) |
| $150,000 or more | 65 (11.8%) | 43 (26.5%) |
| Total | 549 (100.0%) | 162 (100.0%) |
Monthly Housing Cost Tiers in South Barre
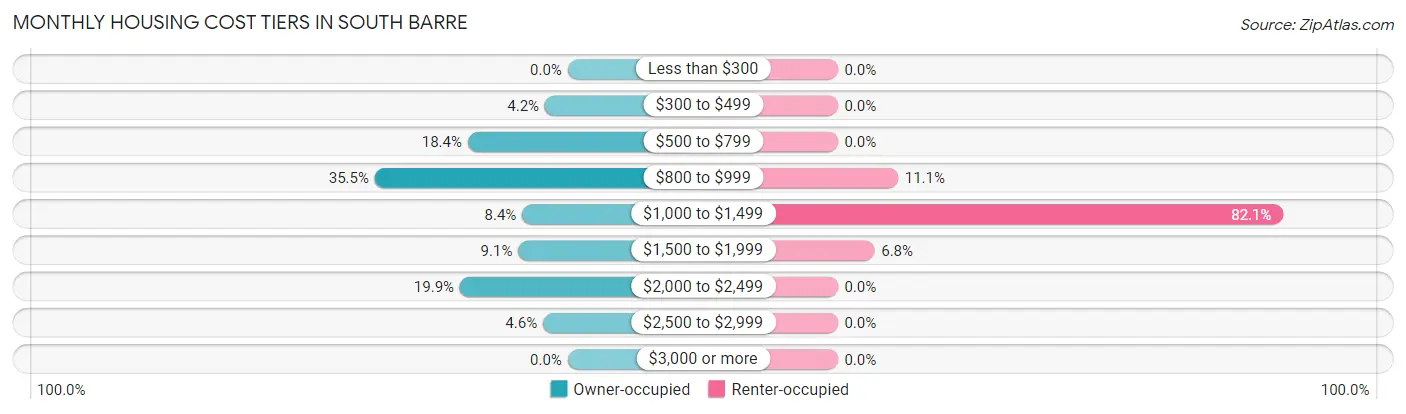
| Monthly Cost | Owner-occupied | Renter-occupied |
| Less than $300 | 0 (0.0%) | 0 (0.0%) |
| $300 to $499 | 23 (4.2%) | 0 (0.0%) |
| $500 to $799 | 101 (18.4%) | 0 (0.0%) |
| $800 to $999 | 195 (35.5%) | 18 (11.1%) |
| $1,000 to $1,499 | 46 (8.4%) | 133 (82.1%) |
| $1,500 to $1,999 | 50 (9.1%) | 11 (6.8%) |
| $2,000 to $2,499 | 109 (19.9%) | 0 (0.0%) |
| $2,500 to $2,999 | 25 (4.5%) | 0 (0.0%) |
| $3,000 or more | 0 (0.0%) | 0 (0.0%) |
| Total | 549 (100.0%) | 162 (100.0%) |
Physical Housing Characteristics in South Barre
Housing Structures in South Barre
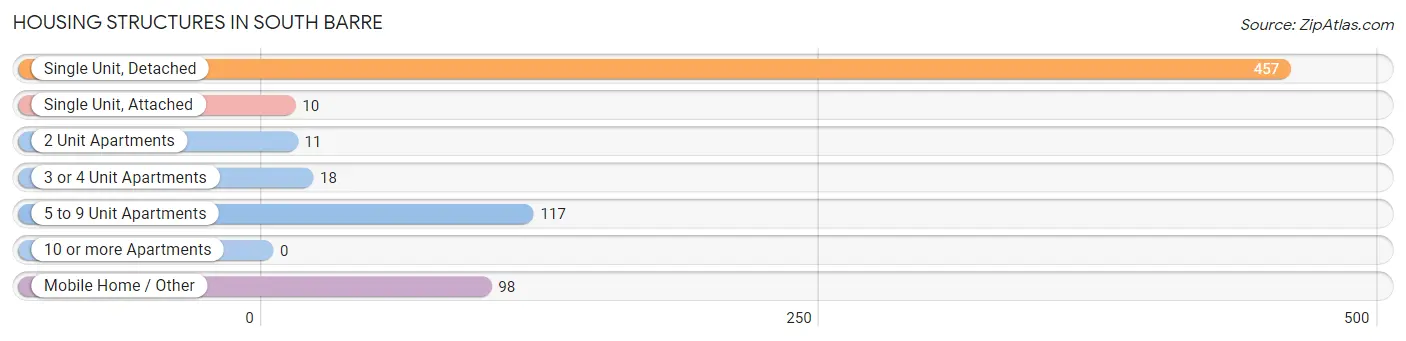
| Structure Type | # Housing Units | % Housing Units |
| Single Unit, Detached | 457 | 64.3% |
| Single Unit, Attached | 10 | 1.4% |
| 2 Unit Apartments | 11 | 1.5% |
| 3 or 4 Unit Apartments | 18 | 2.5% |
| 5 to 9 Unit Apartments | 117 | 16.5% |
| 10 or more Apartments | 0 | 0.0% |
| Mobile Home / Other | 98 | 13.8% |
| Total | 711 | 100.0% |
Housing Structures by Occupancy in South Barre
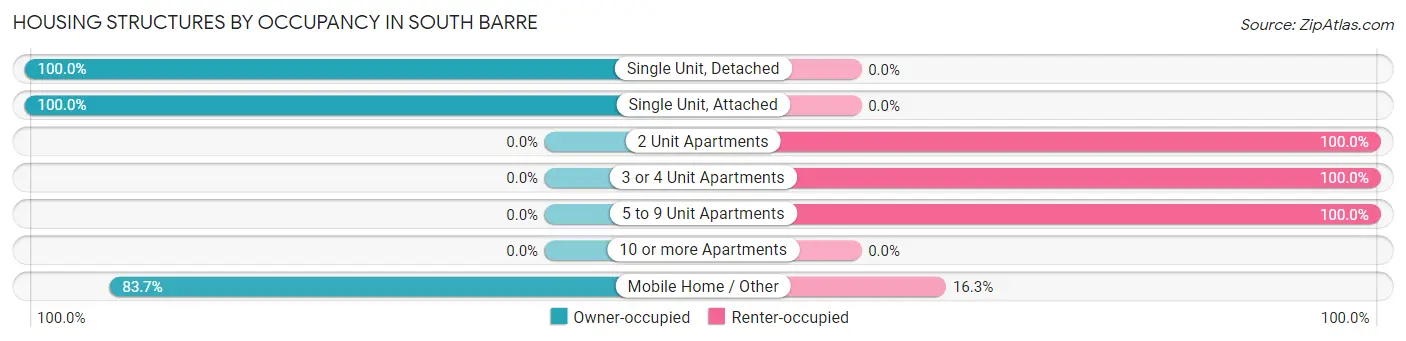
| Structure Type | Owner-occupied | Renter-occupied |
| Single Unit, Detached | 457 (100.0%) | 0 (0.0%) |
| Single Unit, Attached | 10 (100.0%) | 0 (0.0%) |
| 2 Unit Apartments | 0 (0.0%) | 11 (100.0%) |
| 3 or 4 Unit Apartments | 0 (0.0%) | 18 (100.0%) |
| 5 to 9 Unit Apartments | 0 (0.0%) | 117 (100.0%) |
| 10 or more Apartments | 0 (0.0%) | 0 (0.0%) |
| Mobile Home / Other | 82 (83.7%) | 16 (16.3%) |
| Total | 549 (77.2%) | 162 (22.8%) |
Housing Structures by Number of Rooms in South Barre
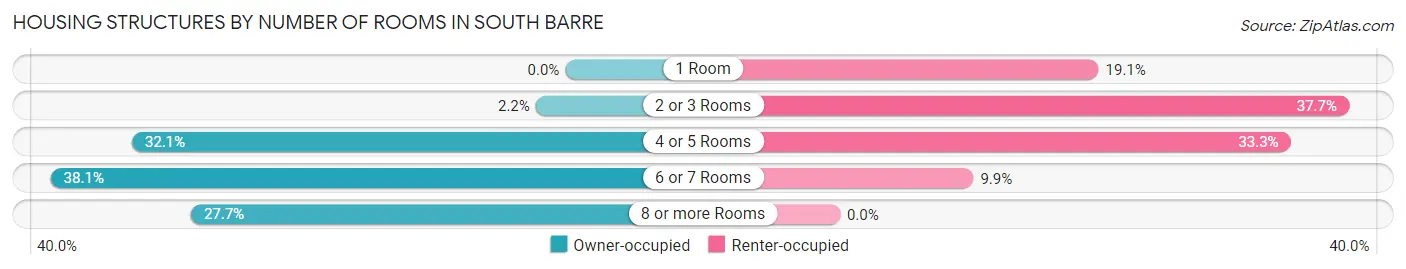
| Number of Rooms | Owner-occupied | Renter-occupied |
| 1 Room | 0 (0.0%) | 31 (19.1%) |
| 2 or 3 Rooms | 12 (2.2%) | 61 (37.7%) |
| 4 or 5 Rooms | 176 (32.1%) | 54 (33.3%) |
| 6 or 7 Rooms | 209 (38.1%) | 16 (9.9%) |
| 8 or more Rooms | 152 (27.7%) | 0 (0.0%) |
| Total | 549 (100.0%) | 162 (100.0%) |
Housing Structure by Heating Type in South Barre
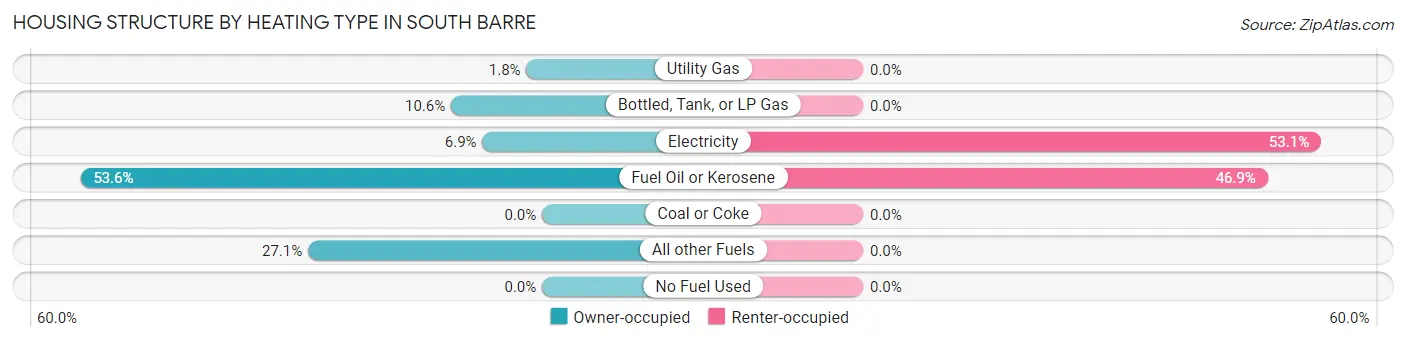
| Heating Type | Owner-occupied | Renter-occupied |
| Utility Gas | 10 (1.8%) | 0 (0.0%) |
| Bottled, Tank, or LP Gas | 58 (10.6%) | 0 (0.0%) |
| Electricity | 38 (6.9%) | 86 (53.1%) |
| Fuel Oil or Kerosene | 294 (53.5%) | 76 (46.9%) |
| Coal or Coke | 0 (0.0%) | 0 (0.0%) |
| All other Fuels | 149 (27.1%) | 0 (0.0%) |
| No Fuel Used | 0 (0.0%) | 0 (0.0%) |
| Total | 549 (100.0%) | 162 (100.0%) |
Household Vehicle Usage in South Barre
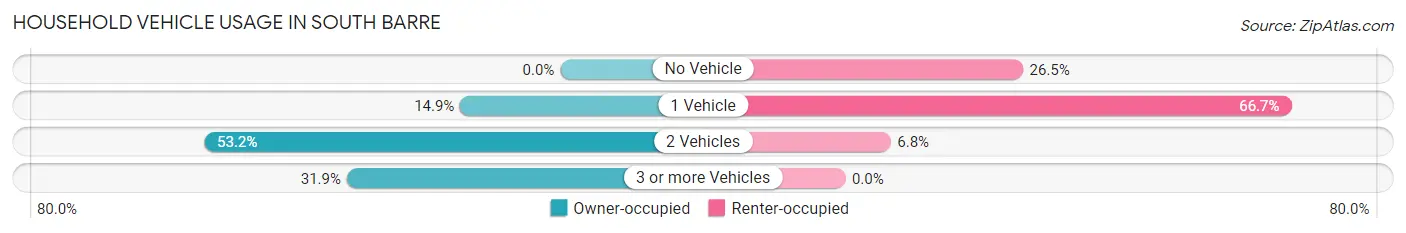
| Vehicles per Household | Owner-occupied | Renter-occupied |
| No Vehicle | 0 (0.0%) | 43 (26.5%) |
| 1 Vehicle | 82 (14.9%) | 108 (66.7%) |
| 2 Vehicles | 292 (53.2%) | 11 (6.8%) |
| 3 or more Vehicles | 175 (31.9%) | 0 (0.0%) |
| Total | 549 (100.0%) | 162 (100.0%) |
Real Estate & Mortgages in South Barre
Real Estate and Mortgage Overview in South Barre
| Characteristic | Without Mortgage | With Mortgage |
| Housing Units | 317 | 232 |
| Median Property Value | $218,800 | $261,000 |
| Median Household Income | $51,964 | $48 |
| Monthly Housing Costs | $822 | $0 |
| Real Estate Taxes | $4,433 | $0 |
Property Value by Mortgage Status in South Barre
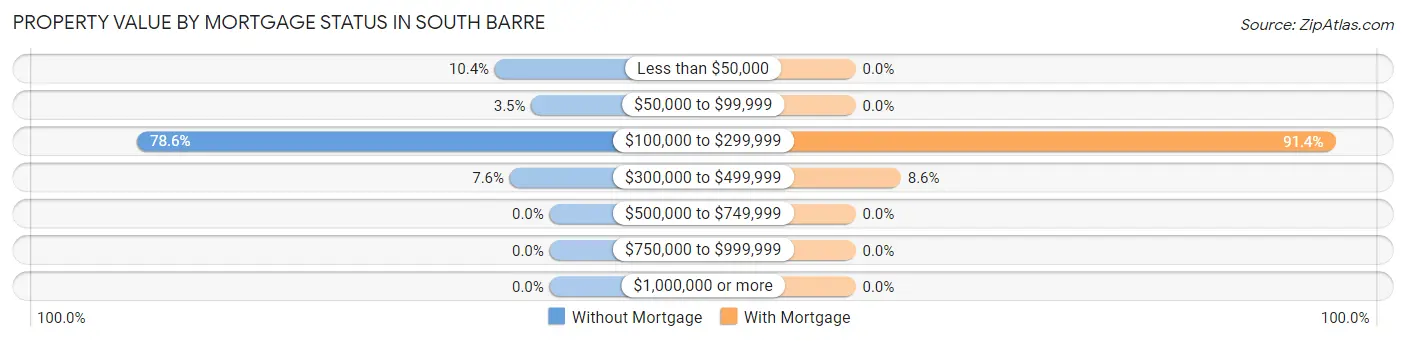
| Property Value | Without Mortgage | With Mortgage |
| Less than $50,000 | 33 (10.4%) | 0 (0.0%) |
| $50,000 to $99,999 | 11 (3.5%) | 0 (0.0%) |
| $100,000 to $299,999 | 249 (78.5%) | 212 (91.4%) |
| $300,000 to $499,999 | 24 (7.6%) | 20 (8.6%) |
| $500,000 to $749,999 | 0 (0.0%) | 0 (0.0%) |
| $750,000 to $999,999 | 0 (0.0%) | 0 (0.0%) |
| $1,000,000 or more | 0 (0.0%) | 0 (0.0%) |
| Total | 317 (100.0%) | 232 (100.0%) |
Household Income by Mortgage Status in South Barre
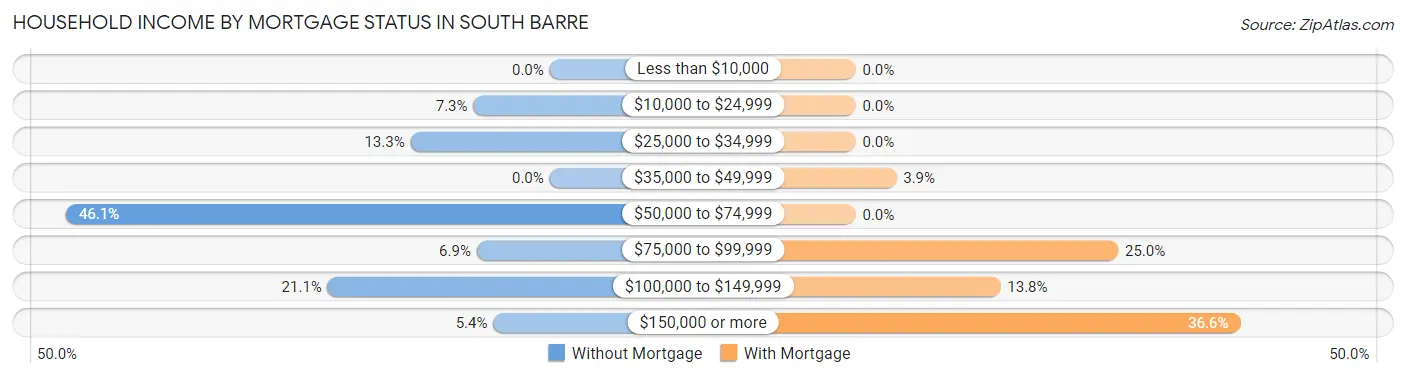
| Household Income | Without Mortgage | With Mortgage |
| Less than $10,000 | 0 (0.0%) | 0 (0.0%) |
| $10,000 to $24,999 | 23 (7.3%) | 0 (0.0%) |
| $25,000 to $34,999 | 42 (13.3%) | 0 (0.0%) |
| $35,000 to $49,999 | 0 (0.0%) | 9 (3.9%) |
| $50,000 to $74,999 | 146 (46.1%) | 0 (0.0%) |
| $75,000 to $99,999 | 22 (6.9%) | 58 (25.0%) |
| $100,000 to $149,999 | 67 (21.1%) | 32 (13.8%) |
| $150,000 or more | 17 (5.4%) | 85 (36.6%) |
| Total | 317 (100.0%) | 232 (100.0%) |
Property Value to Household Income Ratio in South Barre
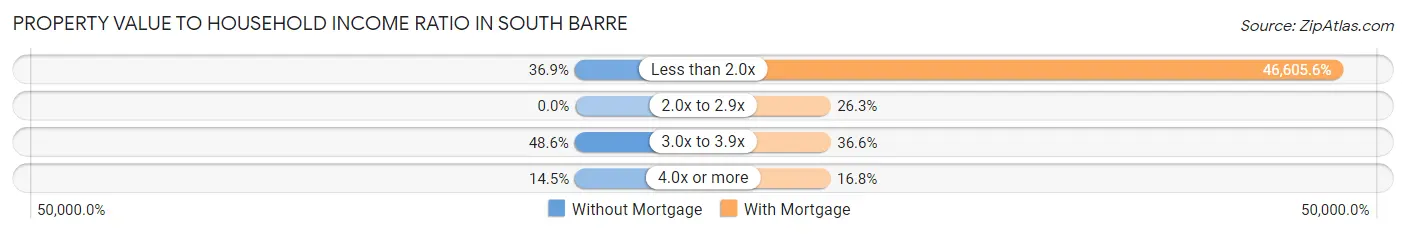
| Value-to-Income Ratio | Without Mortgage | With Mortgage |
| Less than 2.0x | 117 (36.9%) | 108,125 (46,605.6%) |
| 2.0x to 2.9x | 0 (0.0%) | 61 (26.3%) |
| 3.0x to 3.9x | 154 (48.6%) | 85 (36.6%) |
| 4.0x or more | 46 (14.5%) | 39 (16.8%) |
| Total | 317 (100.0%) | 232 (100.0%) |
Real Estate Taxes by Mortgage Status in South Barre
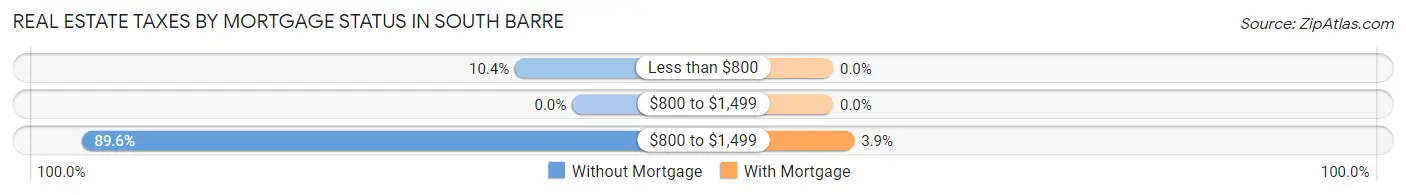
| Property Taxes | Without Mortgage | With Mortgage |
| Less than $800 | 33 (10.4%) | 0 (0.0%) |
| $800 to $1,499 | 0 (0.0%) | 0 (0.0%) |
| $800 to $1,499 | 284 (89.6%) | 9 (3.9%) |
| Total | 317 (100.0%) | 232 (100.0%) |
Health & Disability in South Barre
Health Insurance Coverage by Age in South Barre
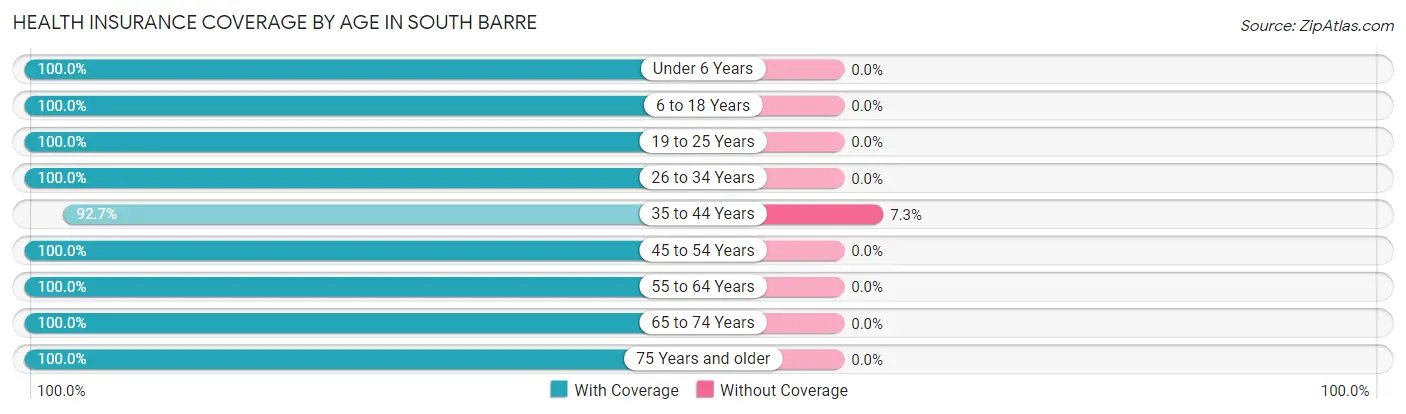
| Age Bracket | With Coverage | Without Coverage |
| Under 6 Years | 54 (100.0%) | 0 (0.0%) |
| 6 to 18 Years | 117 (100.0%) | 0 (0.0%) |
| 19 to 25 Years | 90 (100.0%) | 0 (0.0%) |
| 26 to 34 Years | 170 (100.0%) | 0 (0.0%) |
| 35 to 44 Years | 153 (92.7%) | 12 (7.3%) |
| 45 to 54 Years | 325 (100.0%) | 0 (0.0%) |
| 55 to 64 Years | 310 (100.0%) | 0 (0.0%) |
| 65 to 74 Years | 86 (100.0%) | 0 (0.0%) |
| 75 Years and older | 45 (100.0%) | 0 (0.0%) |
| Total | 1,350 (99.1%) | 12 (0.9%) |
Health Insurance Coverage by Citizenship Status in South Barre
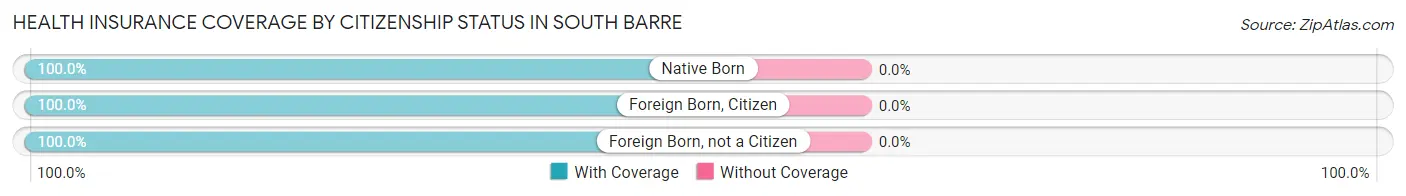
| Citizenship Status | With Coverage | Without Coverage |
| Native Born | 54 (100.0%) | 0 (0.0%) |
| Foreign Born, Citizen | 117 (100.0%) | 0 (0.0%) |
| Foreign Born, not a Citizen | 90 (100.0%) | 0 (0.0%) |
Health Insurance Coverage by Household Income in South Barre
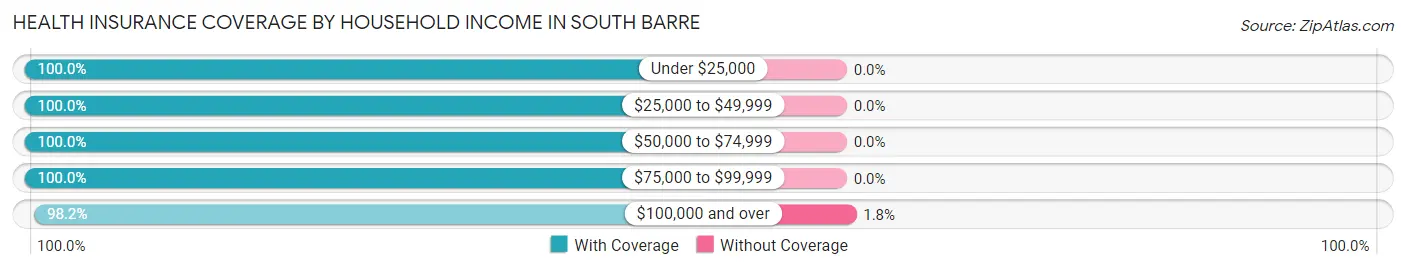
| Household Income | With Coverage | Without Coverage |
| Under $25,000 | 84 (100.0%) | 0 (0.0%) |
| $25,000 to $49,999 | 64 (100.0%) | 0 (0.0%) |
| $50,000 to $74,999 | 363 (100.0%) | 0 (0.0%) |
| $75,000 to $99,999 | 172 (100.0%) | 0 (0.0%) |
| $100,000 and over | 664 (98.2%) | 12 (1.8%) |
Public vs Private Health Insurance Coverage by Age in South Barre
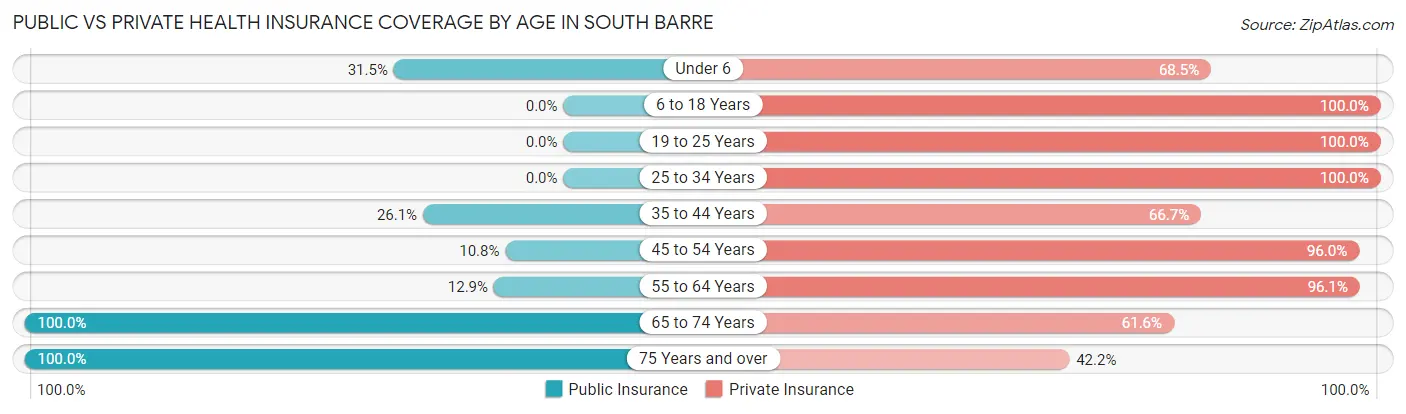
| Age Bracket | Public Insurance | Private Insurance |
| Under 6 | 17 (31.5%) | 37 (68.5%) |
| 6 to 18 Years | 0 (0.0%) | 117 (100.0%) |
| 19 to 25 Years | 0 (0.0%) | 90 (100.0%) |
| 25 to 34 Years | 0 (0.0%) | 170 (100.0%) |
| 35 to 44 Years | 43 (26.1%) | 110 (66.7%) |
| 45 to 54 Years | 35 (10.8%) | 312 (96.0%) |
| 55 to 64 Years | 40 (12.9%) | 298 (96.1%) |
| 65 to 74 Years | 86 (100.0%) | 53 (61.6%) |
| 75 Years and over | 45 (100.0%) | 19 (42.2%) |
| Total | 266 (19.5%) | 1,206 (88.5%) |
Disability Status by Sex by Age in South Barre
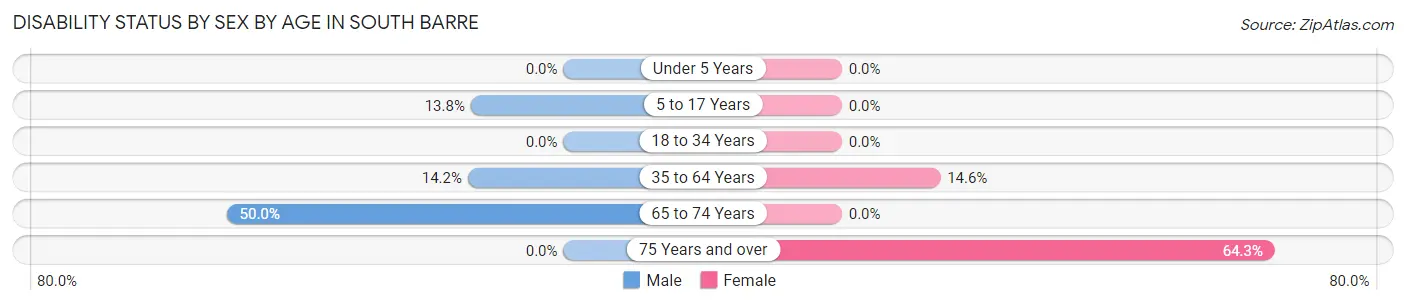
| Age Bracket | Male | Female |
| Under 5 Years | 0 (0.0%) | 0 (0.0%) |
| 5 to 17 Years | 11 (13.8%) | 0 (0.0%) |
| 18 to 34 Years | 0 (0.0%) | 0 (0.0%) |
| 35 to 64 Years | 63 (14.2%) | 52 (14.6%) |
| 65 to 74 Years | 33 (50.0%) | 0 (0.0%) |
| 75 Years and over | 0 (0.0%) | 18 (64.3%) |
Disability Class by Sex by Age in South Barre
Disability Class: Hearing Difficulty
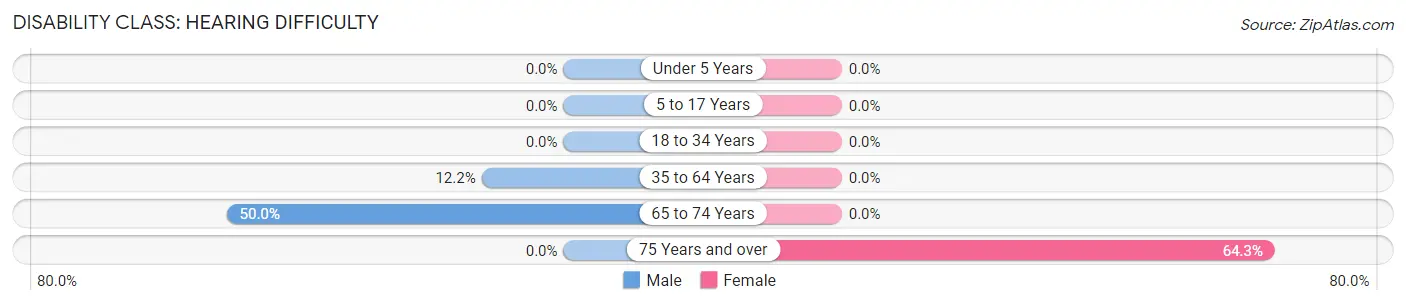
| Age Bracket | Male | Female |
| Under 5 Years | 0 (0.0%) | 0 (0.0%) |
| 5 to 17 Years | 0 (0.0%) | 0 (0.0%) |
| 18 to 34 Years | 0 (0.0%) | 0 (0.0%) |
| 35 to 64 Years | 54 (12.2%) | 0 (0.0%) |
| 65 to 74 Years | 33 (50.0%) | 0 (0.0%) |
| 75 Years and over | 0 (0.0%) | 18 (64.3%) |
Disability Class: Vision Difficulty
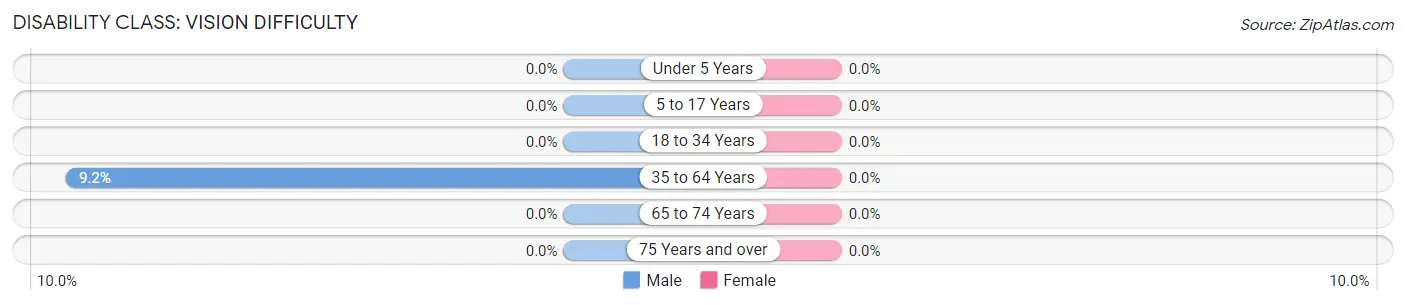
| Age Bracket | Male | Female |
| Under 5 Years | 0 (0.0%) | 0 (0.0%) |
| 5 to 17 Years | 0 (0.0%) | 0 (0.0%) |
| 18 to 34 Years | 0 (0.0%) | 0 (0.0%) |
| 35 to 64 Years | 41 (9.2%) | 0 (0.0%) |
| 65 to 74 Years | 0 (0.0%) | 0 (0.0%) |
| 75 Years and over | 0 (0.0%) | 0 (0.0%) |
Disability Class: Cognitive Difficulty
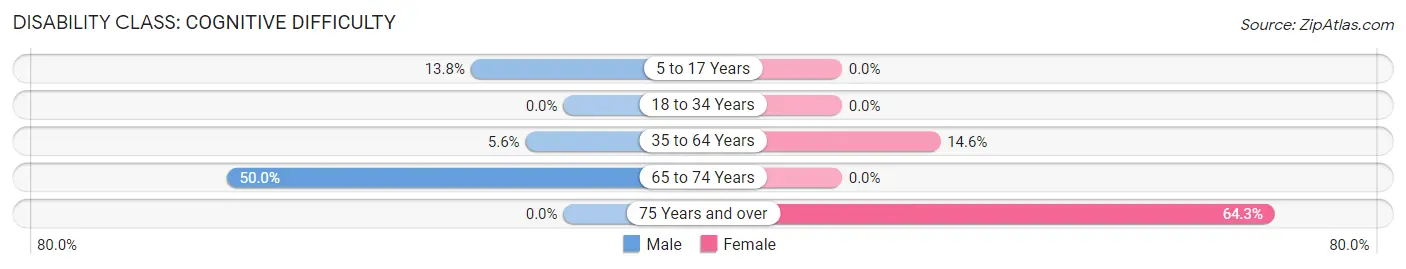
| Age Bracket | Male | Female |
| 5 to 17 Years | 11 (13.8%) | 0 (0.0%) |
| 18 to 34 Years | 0 (0.0%) | 0 (0.0%) |
| 35 to 64 Years | 25 (5.6%) | 52 (14.6%) |
| 65 to 74 Years | 33 (50.0%) | 0 (0.0%) |
| 75 Years and over | 0 (0.0%) | 18 (64.3%) |
Disability Class: Ambulatory Difficulty
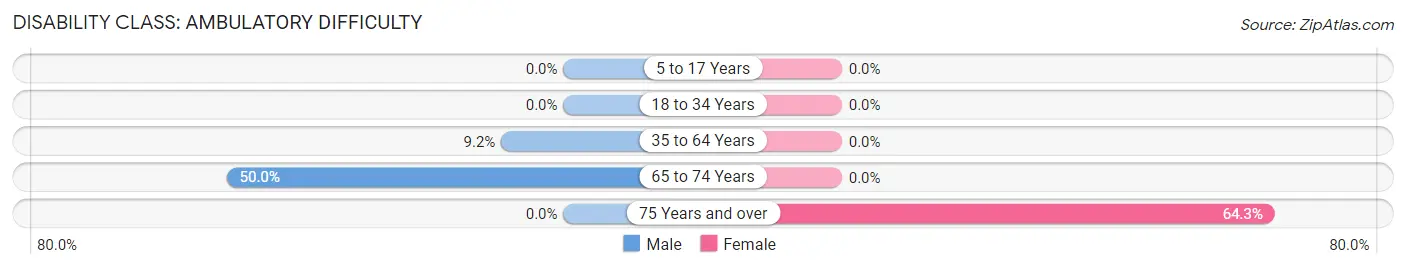
| Age Bracket | Male | Female |
| 5 to 17 Years | 0 (0.0%) | 0 (0.0%) |
| 18 to 34 Years | 0 (0.0%) | 0 (0.0%) |
| 35 to 64 Years | 41 (9.2%) | 0 (0.0%) |
| 65 to 74 Years | 33 (50.0%) | 0 (0.0%) |
| 75 Years and over | 0 (0.0%) | 18 (64.3%) |
Disability Class: Self-Care Difficulty
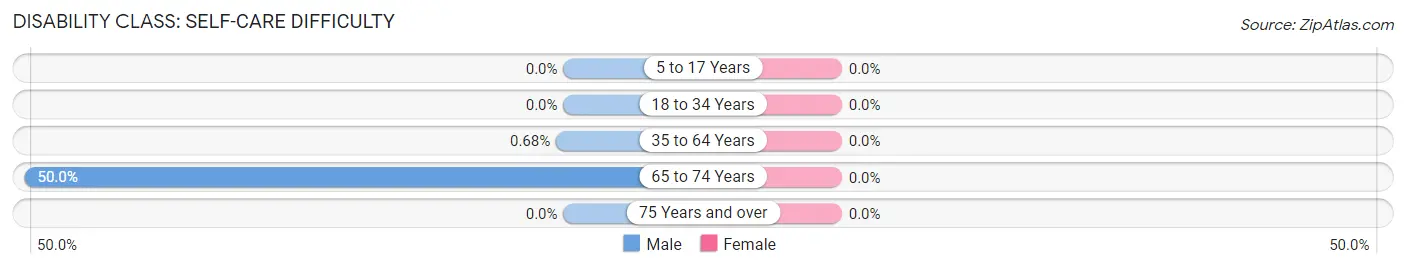
| Age Bracket | Male | Female |
| 5 to 17 Years | 0 (0.0%) | 0 (0.0%) |
| 18 to 34 Years | 0 (0.0%) | 0 (0.0%) |
| 35 to 64 Years | 3 (0.7%) | 0 (0.0%) |
| 65 to 74 Years | 33 (50.0%) | 0 (0.0%) |
| 75 Years and over | 0 (0.0%) | 0 (0.0%) |
Technology Access in South Barre
Computing Device Access in South Barre
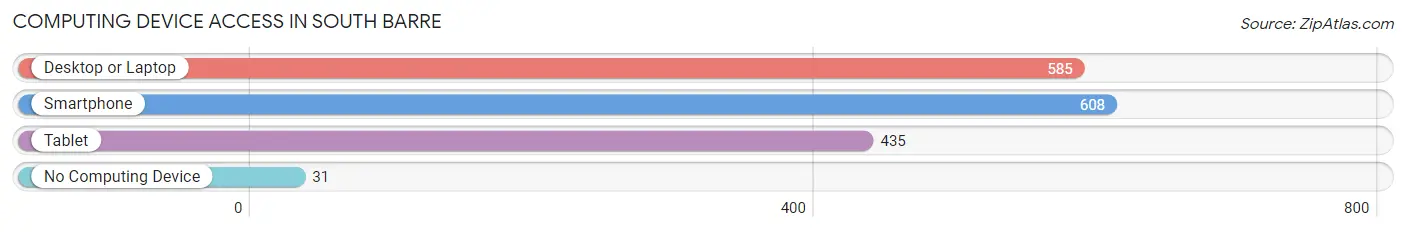
| Device Type | # Households | % Households |
| Desktop or Laptop | 585 | 82.3% |
| Smartphone | 608 | 85.5% |
| Tablet | 435 | 61.2% |
| No Computing Device | 31 | 4.4% |
| Total | 711 | 100.0% |
Internet Access in South Barre
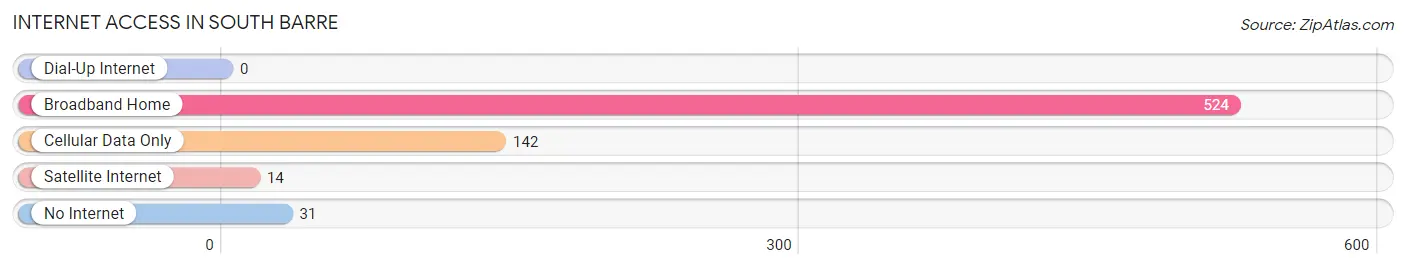
| Internet Type | # Households | % Households |
| Dial-Up Internet | 0 | 0.0% |
| Broadband Home | 524 | 73.7% |
| Cellular Data Only | 142 | 20.0% |
| Satellite Internet | 14 | 2.0% |
| No Internet | 31 | 4.4% |
| Total | 711 | 100.0% |
South Barre Summary
Barring a few minor changes, the town of South Barre, Vermont has remained largely unchanged since its incorporation in 1781. Located in the heart of Washington County, South Barre is a small rural town with a population of just over 1,000 people. The town is situated in the foothills of the Green Mountains, and is surrounded by the towns of Barre, Berlin, and Williamstown.
History
South Barre was first settled in 1781 by a group of settlers from Massachusetts. The town was originally known as “Barre”, but was later changed to “South Barre” to distinguish it from the nearby town of Barre. The town was officially incorporated in 1781, and the first town meeting was held in 1782.
The town was primarily an agricultural community, with the majority of the population engaged in farming and logging. The town also had a number of small businesses, including a sawmill, a gristmill, and a blacksmith shop.
In the late 19th century, the town began to experience a period of growth and development. The railroad arrived in 1875, and the town was connected to the rest of the state by the Central Vermont Railway. This allowed for the development of a number of industries, including a granite quarry, a brickyard, and a number of small factories.
Geography
South Barre is located in the foothills of the Green Mountains in central Vermont. The town is situated in the Winooski River Valley, and is surrounded by the towns of Barre, Berlin, and Williamstown. The town is located approximately 25 miles east of Montpelier, the state capital.
The town is primarily rural, with a few small villages scattered throughout. The largest village is South Barre Village, which is located in the center of town. The village is home to a number of small businesses, including a grocery store, a post office, and a few restaurants.
The town is home to a number of small lakes and ponds, including Lake Elmore, Lake Elmore State Park, and Lake Elmore State Forest. The town is also home to a number of small streams, including the Winooski River, which runs through the center of town.
Economy
South Barre is a small rural town with a population of just over 1,000 people. The town is primarily an agricultural community, with the majority of the population engaged in farming and logging. The town also has a number of small businesses, including a sawmill, a gristmill, and a blacksmith shop.
The town is also home to a number of small industries, including a granite quarry, a brickyard, and a number of small factories. The town is also home to a number of small businesses, including a grocery store, a post office, and a few restaurants.
Demographics
As of the 2010 census, the population of South Barre was 1,072. The racial makeup of the town was 97.3% White, 0.7% African American, 0.2% Native American, 0.2% Asian, 0.1% Pacific Islander, 0.2% from other races, and 1.3% from two or more races. Hispanic or Latino of any race were 0.7% of the population.
The median income for a household in the town was $45,833, and the median income for a family was $50,000. The per capita income for the town was $20,845. About 8.3% of families and 10.2% of the population were below the poverty line, including 11.3% of those under age 18 and 8.3% of those age 65 or over.
Common Questions
What is Per Capita Income in South Barre?
Per Capita income in South Barre is $50,134.
What is the Median Family Income in South Barre?
Median Family Income in South Barre is $109,313.
What is the Median Household income in South Barre?
Median Household Income in South Barre is $75,042.
What is Income or Wage Gap in South Barre?
Income or Wage Gap in South Barre is 6.0%.
Women in South Barre earn 94.0 cents for every dollar earned by a man.
What is Inequality or Gini Index in South Barre?
Inequality or Gini Index in South Barre is 0.39.
What is the Total Population of South Barre?
Total Population of South Barre is 1,362.
What is the Total Male Population of South Barre?
Total Male Population of South Barre is 754.
What is the Total Female Population of South Barre?
Total Female Population of South Barre is 608.
What is the Ratio of Males per 100 Females in South Barre?
There are 124.01 Males per 100 Females in South Barre.
What is the Ratio of Females per 100 Males in South Barre?
There are 80.64 Females per 100 Males in South Barre.
What is the Median Population Age in South Barre?
Median Population Age in South Barre is 52.2 Years.
What is the Average Family Size in South Barre
Average Family Size in South Barre is 2.6 People.
What is the Average Household Size in South Barre
Average Household Size in South Barre is 1.9 People.
How Large is the Labor Force in South Barre?
There are 1,001 People in the Labor Forcein in South Barre.
What is the Percentage of People in the Labor Force in South Barre?
79.4% of People are in the Labor Force in South Barre.