Jeffersonville, VT Map & Demographics
Jeffersonville Map
Jeffersonville Overview
$37,998
PER CAPITA INCOME
$68,472
AVG FAMILY INCOME
$64,306
AVG HOUSEHOLD INCOME
35.9%
WAGE / INCOME GAP [ % ]
64.1¢/ $1
WAGE / INCOME GAP [ $ ]
0.46
INEQUALITY / GINI INDEX
739
TOTAL POPULATION
384
MALE POPULATION
355
FEMALE POPULATION
108.17
MALES / 100 FEMALES
92.45
FEMALES / 100 MALES
32.6
MEDIAN AGE
3.0
AVG FAMILY SIZE
2.4
AVG HOUSEHOLD SIZE
470
LABOR FORCE [ PEOPLE ]
82.7%
PERCENT IN LABOR FORCE
8.5%
UNEMPLOYMENT RATE
Jeffersonville Zip Codes
Jeffersonville Area Codes
Income in Jeffersonville
Income Overview in Jeffersonville
Per Capita Income in Jeffersonville is $37,998, while median incomes of families and households are $68,472 and $64,306 respectively.
| Characteristic | Number | Measure |
| Per Capita Income | 739 | $37,998 |
| Median Family Income | 183 | $68,472 |
| Mean Family Income | 183 | $110,575 |
| Median Household Income | 313 | $64,306 |
| Mean Household Income | 313 | $87,148 |
| Income Deficit | 183 | $0 |
| Wage / Income Gap (%) | 739 | 35.85% |
| Wage / Income Gap ($) | 739 | 64.15¢ per $1 |
| Gini / Inequality Index | 739 | 0.46 |
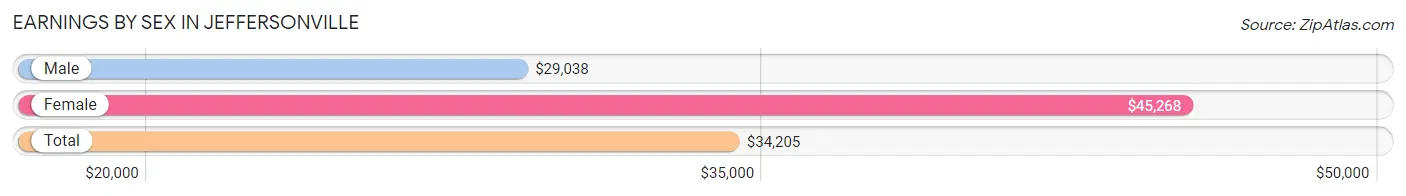
Earnings by Sex in Jeffersonville
Average Earnings in Jeffersonville are $34,205, $29,038 for men and $45,268 for women, a difference of 35.8%.
| Sex | Number | Average Earnings |
| Male | 278 (55.7%) | $29,038 |
| Female | 221 (44.3%) | $45,268 |
| Total | 499 (100.0%) | $34,205 |
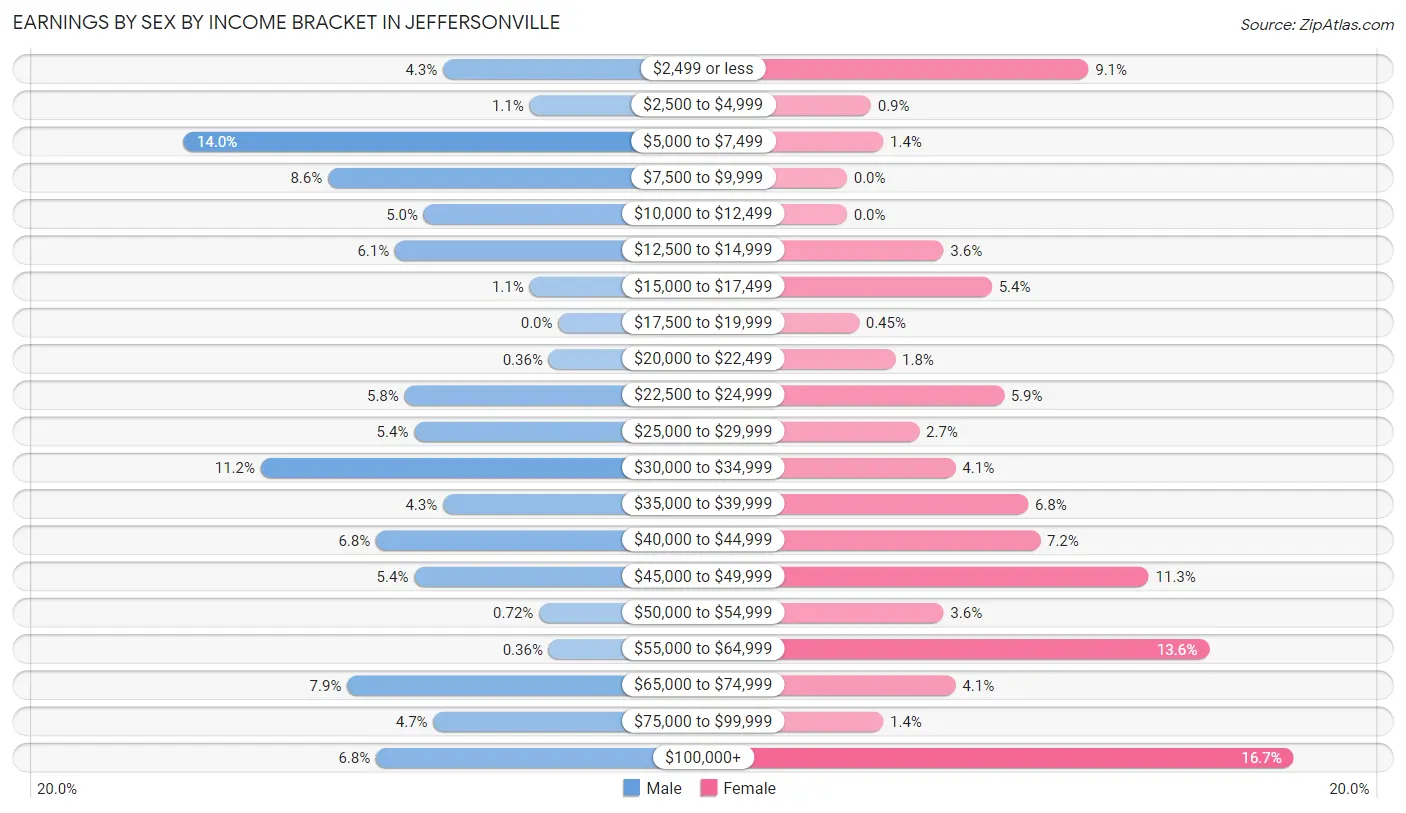
Earnings by Sex by Income Bracket in Jeffersonville
The most common earnings brackets in Jeffersonville are $5,000 to $7,499 for men (39 | 14.0%) and $100,000+ for women (37 | 16.7%).
| Income | Male | Female |
| $2,499 or less | 12 (4.3%) | 20 (9.0%) |
| $2,500 to $4,999 | 3 (1.1%) | 2 (0.9%) |
| $5,000 to $7,499 | 39 (14.0%) | 3 (1.4%) |
| $7,500 to $9,999 | 24 (8.6%) | 0 (0.0%) |
| $10,000 to $12,499 | 14 (5.0%) | 0 (0.0%) |
| $12,500 to $14,999 | 17 (6.1%) | 8 (3.6%) |
| $15,000 to $17,499 | 3 (1.1%) | 12 (5.4%) |
| $17,500 to $19,999 | 0 (0.0%) | 1 (0.4%) |
| $20,000 to $22,499 | 1 (0.4%) | 4 (1.8%) |
| $22,500 to $24,999 | 16 (5.8%) | 13 (5.9%) |
| $25,000 to $29,999 | 15 (5.4%) | 6 (2.7%) |
| $30,000 to $34,999 | 31 (11.2%) | 9 (4.1%) |
| $35,000 to $39,999 | 12 (4.3%) | 15 (6.8%) |
| $40,000 to $44,999 | 19 (6.8%) | 16 (7.2%) |
| $45,000 to $49,999 | 15 (5.4%) | 25 (11.3%) |
| $50,000 to $54,999 | 2 (0.7%) | 8 (3.6%) |
| $55,000 to $64,999 | 1 (0.4%) | 30 (13.6%) |
| $65,000 to $74,999 | 22 (7.9%) | 9 (4.1%) |
| $75,000 to $99,999 | 13 (4.7%) | 3 (1.4%) |
| $100,000+ | 19 (6.8%) | 37 (16.7%) |
| Total | 278 (100.0%) | 221 (100.0%) |
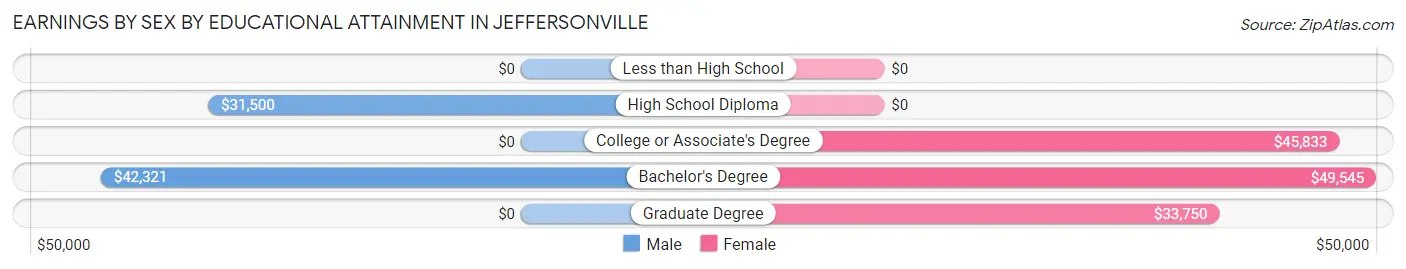
Earnings by Sex by Educational Attainment in Jeffersonville
Average earnings in Jeffersonville are $34,167 for men and $46,696 for women, a difference of 26.8%. Men with an educational attainment of bachelor's degree enjoy the highest average annual earnings of $42,321, while those with high school diploma education earn the least with $31,500. Women with an educational attainment of bachelor's degree earn the most with the average annual earnings of $49,545, while those with graduate degree education have the smallest earnings of $33,750.
| Educational Attainment | Male Income | Female Income |
| Less than High School | - | - |
| High School Diploma | $31,500 | $0 |
| College or Associate's Degree | - | - |
| Bachelor's Degree | $42,321 | $49,545 |
| Graduate Degree | - | - |
| Total | $34,167 | $46,696 |
Family Income in Jeffersonville
Family Income Brackets in Jeffersonville
According to the Jeffersonville family income data, there are 54 families falling into the $50,000 to $74,999 income range, which is the most common income bracket and makes up 29.5% of all families.
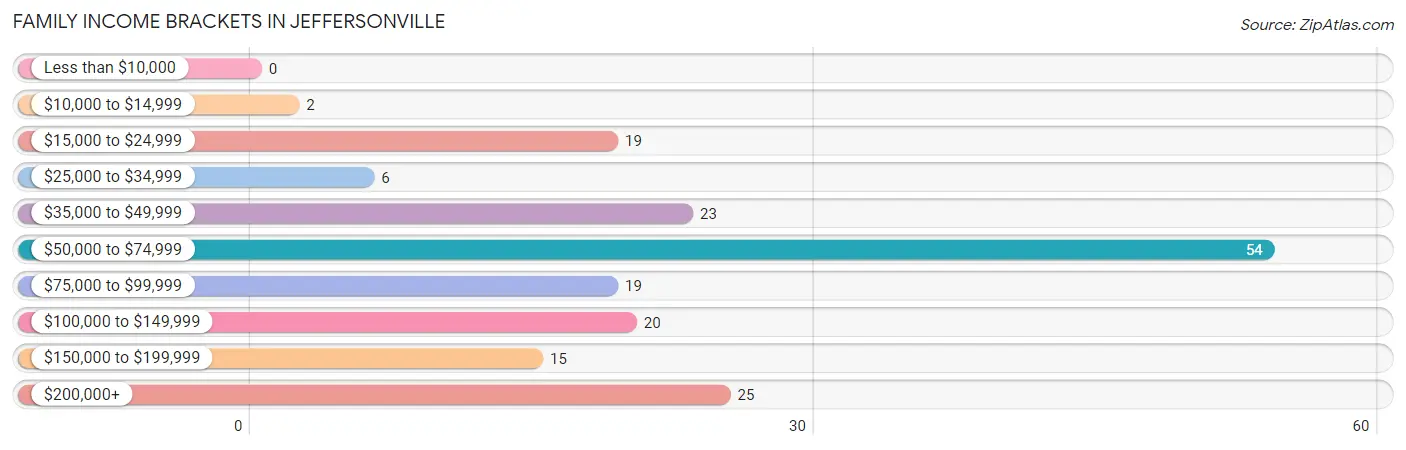
| Income Bracket | # Families | % Families |
| Less than $10,000 | 0 | 0.0% |
| $10,000 to $14,999 | 2 | 1.1% |
| $15,000 to $24,999 | 19 | 10.4% |
| $25,000 to $34,999 | 6 | 3.3% |
| $35,000 to $49,999 | 23 | 12.6% |
| $50,000 to $74,999 | 54 | 29.5% |
| $75,000 to $99,999 | 19 | 10.4% |
| $100,000 to $149,999 | 20 | 10.9% |
| $150,000 to $199,999 | 15 | 8.2% |
| $200,000+ | 25 | 13.7% |
Family Income by Famaliy Size in Jeffersonville
4-person families (35 | 19.1%) account for the highest median family income in Jeffersonville with $130,179 per family, while 2-person families (75 | 41.0%) have the highest median income of $33,606 per family member.
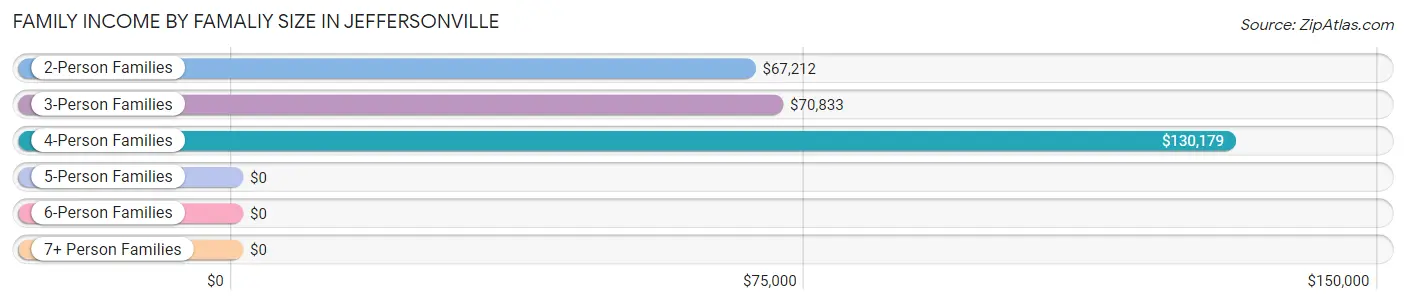
| Income Bracket | # Families | Median Income |
| 2-Person Families | 75 (41.0%) | $67,212 |
| 3-Person Families | 54 (29.5%) | $70,833 |
| 4-Person Families | 35 (19.1%) | $130,179 |
| 5-Person Families | 10 (5.5%) | $0 |
| 6-Person Families | 9 (4.9%) | $0 |
| 7+ Person Families | 0 (0.0%) | $0 |
| Total | 183 (100.0%) | $68,472 |
Family Income by Number of Earners in Jeffersonville
The median family income in Jeffersonville is $68,472, with families comprising no earners (7) having the highest median family income of $250,001, while families with 1 earner (64) have the lowest median family income of $49,500, accounting for 3.8% and 35.0% of families, respectively.
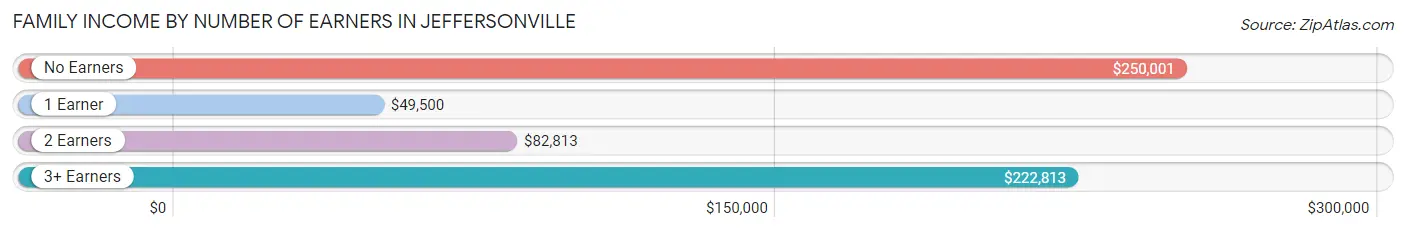
| Number of Earners | # Families | Median Income |
| No Earners | 7 (3.8%) | $250,001 |
| 1 Earner | 64 (35.0%) | $49,500 |
| 2 Earners | 93 (50.8%) | $82,813 |
| 3+ Earners | 19 (10.4%) | $222,813 |
| Total | 183 (100.0%) | $68,472 |
Household Income in Jeffersonville
Household Income Brackets in Jeffersonville
With 56 households falling in the category, the $50,000 to $74,999 income range is the most frequent in Jeffersonville, accounting for 17.9% of all households.
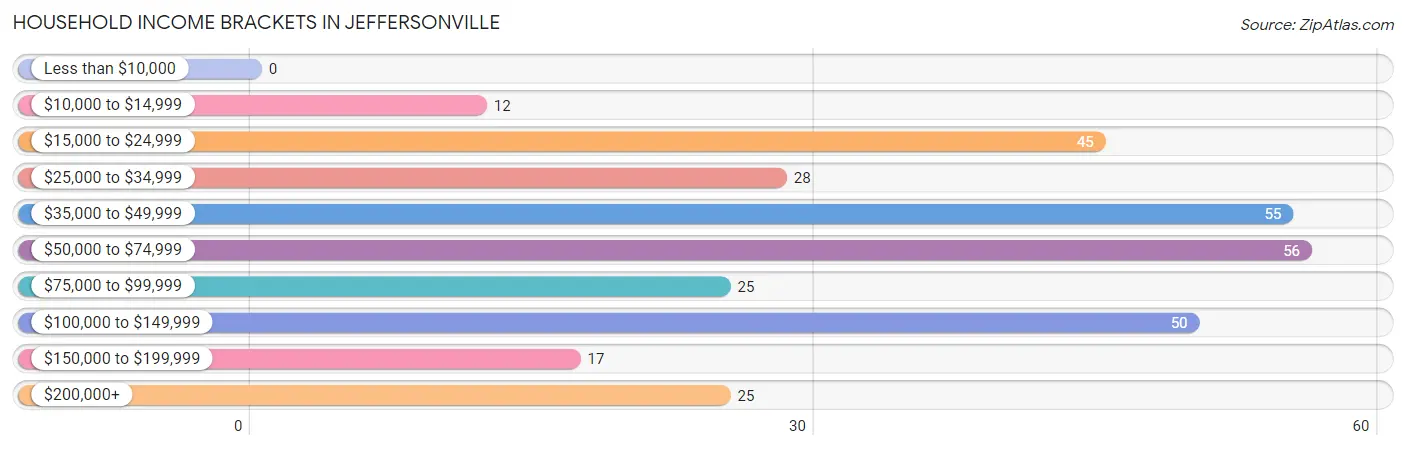
| Income Bracket | # Households | % Households |
| Less than $10,000 | 0 | 0.0% |
| $10,000 to $14,999 | 12 | 3.8% |
| $15,000 to $24,999 | 45 | 14.4% |
| $25,000 to $34,999 | 28 | 8.9% |
| $35,000 to $49,999 | 55 | 17.6% |
| $50,000 to $74,999 | 56 | 17.9% |
| $75,000 to $99,999 | 25 | 8.0% |
| $100,000 to $149,999 | 50 | 16.0% |
| $150,000 to $199,999 | 17 | 5.4% |
| $200,000+ | 25 | 8.0% |
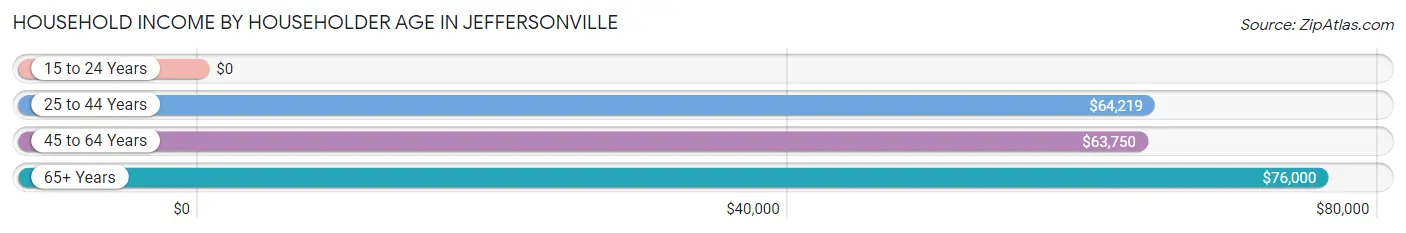
Household Income by Householder Age in Jeffersonville
The median household income in Jeffersonville is $64,306, with the highest median household income of $76,000 found in the 65+ years age bracket for the primary householder. A total of 32 households (10.2%) fall into this category. Meanwhile, the 15 to 24 years age bracket for the primary householder has the lowest median household income of $0, with 13 households (4.2%) in this group.
| Income Bracket | # Households | Median Income |
| 15 to 24 Years | 13 (4.2%) | $0 |
| 25 to 44 Years | 149 (47.6%) | $64,219 |
| 45 to 64 Years | 119 (38.0%) | $63,750 |
| 65+ Years | 32 (10.2%) | $76,000 |
| Total | 313 (100.0%) | $64,306 |
Poverty in Jeffersonville
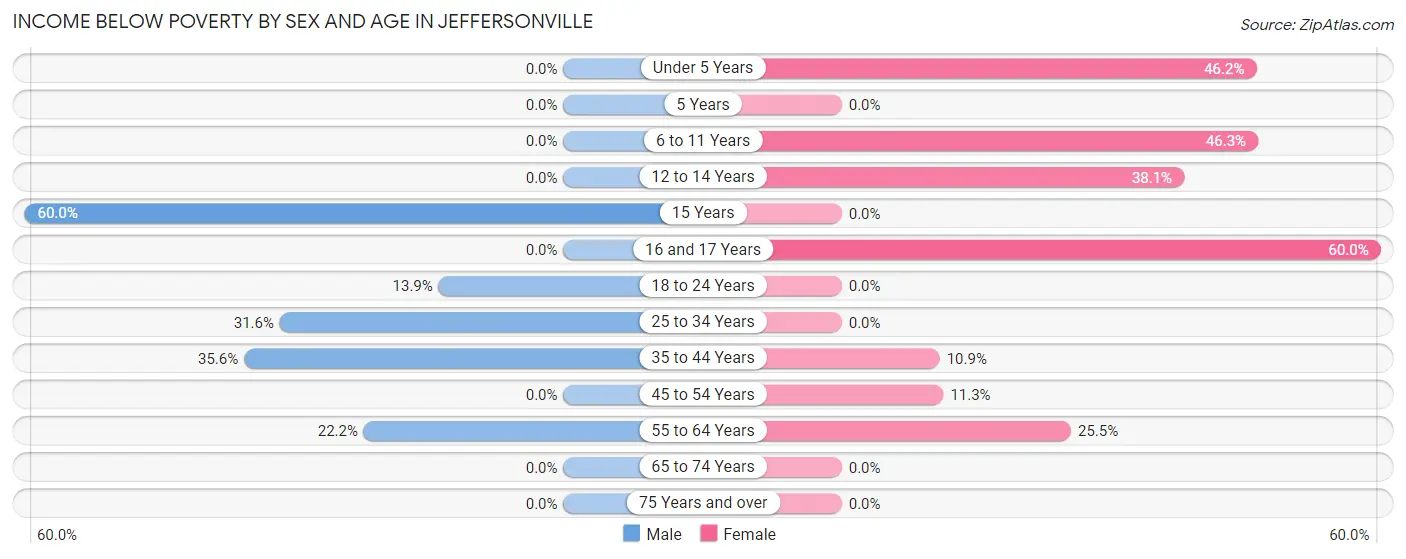
Income Below Poverty by Sex and Age in Jeffersonville
With 14.3% poverty level for males and 16.9% for females among the residents of Jeffersonville, 15 year old males and 16 and 17 year old females are the most vulnerable to poverty, with 3 males (60.0%) and 3 females (60.0%) in their respective age groups living below the poverty level.
| Age Bracket | Male | Female |
| Under 5 Years | 0 (0.0%) | 6 (46.2%) |
| 5 Years | 0 (0.0%) | 0 (0.0%) |
| 6 to 11 Years | 0 (0.0%) | 19 (46.3%) |
| 12 to 14 Years | 0 (0.0%) | 8 (38.1%) |
| 15 Years | 3 (60.0%) | 0 (0.0%) |
| 16 and 17 Years | 0 (0.0%) | 3 (60.0%) |
| 18 to 24 Years | 10 (13.9%) | 0 (0.0%) |
| 25 to 34 Years | 24 (31.6%) | 0 (0.0%) |
| 35 to 44 Years | 16 (35.6%) | 6 (10.9%) |
| 45 to 54 Years | 0 (0.0%) | 6 (11.3%) |
| 55 to 64 Years | 2 (22.2%) | 12 (25.5%) |
| 65 to 74 Years | 0 (0.0%) | 0 (0.0%) |
| 75 Years and over | 0 (0.0%) | 0 (0.0%) |
| Total | 55 (14.3%) | 60 (16.9%) |
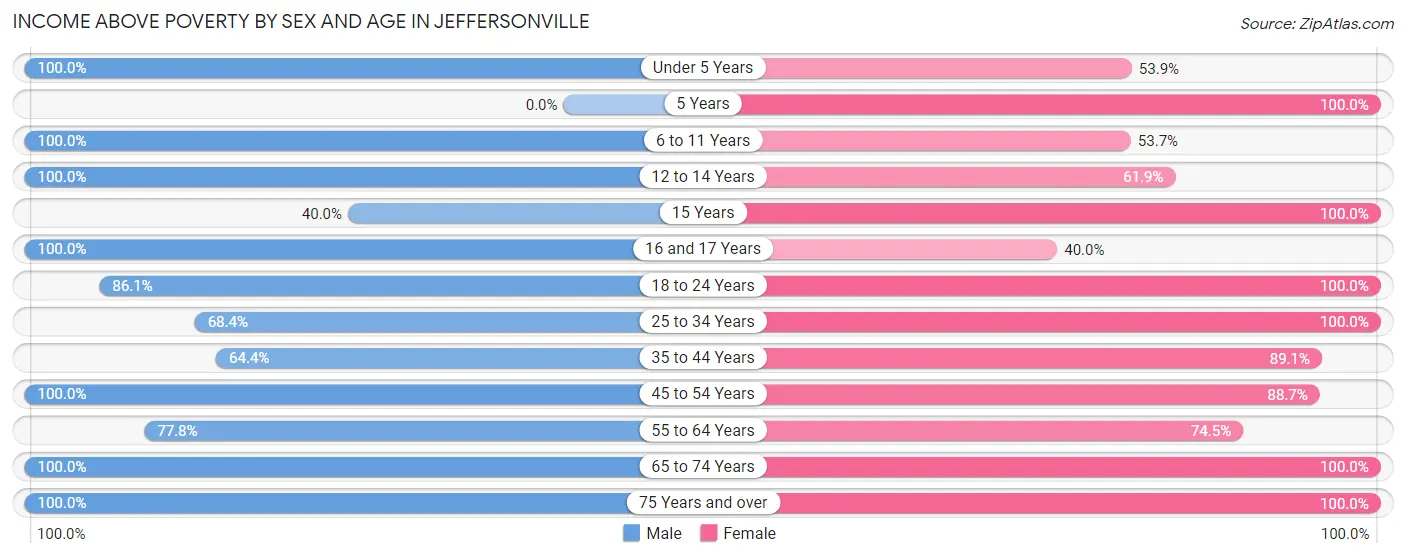
Income Above Poverty by Sex and Age in Jeffersonville
According to the poverty statistics in Jeffersonville, males aged under 5 years and females aged 5 years are the age groups that are most secure financially, with 100.0% of males and 100.0% of females in these age groups living above the poverty line.
| Age Bracket | Male | Female |
| Under 5 Years | 26 (100.0%) | 7 (53.8%) |
| 5 Years | 0 (0.0%) | 12 (100.0%) |
| 6 to 11 Years | 33 (100.0%) | 22 (53.7%) |
| 12 to 14 Years | 12 (100.0%) | 13 (61.9%) |
| 15 Years | 2 (40.0%) | 8 (100.0%) |
| 16 and 17 Years | 10 (100.0%) | 2 (40.0%) |
| 18 to 24 Years | 62 (86.1%) | 11 (100.0%) |
| 25 to 34 Years | 52 (68.4%) | 63 (100.0%) |
| 35 to 44 Years | 29 (64.4%) | 49 (89.1%) |
| 45 to 54 Years | 68 (100.0%) | 47 (88.7%) |
| 55 to 64 Years | 7 (77.8%) | 35 (74.5%) |
| 65 to 74 Years | 26 (100.0%) | 18 (100.0%) |
| 75 Years and over | 2 (100.0%) | 8 (100.0%) |
| Total | 329 (85.7%) | 295 (83.1%) |
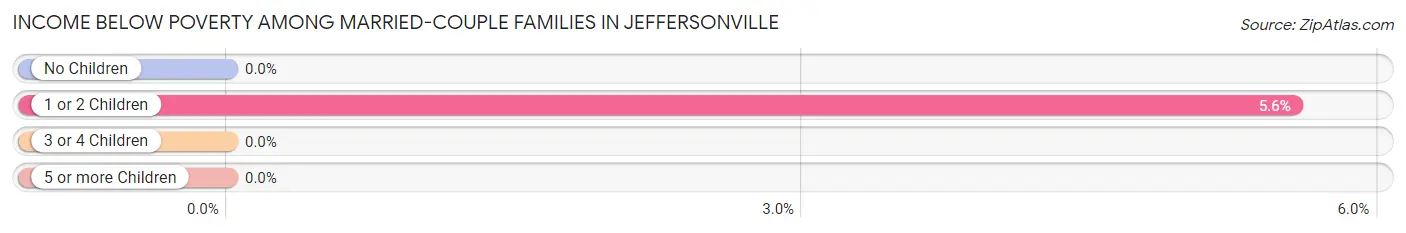
Income Below Poverty Among Married-Couple Families in Jeffersonville
The poverty statistics for married-couple families in Jeffersonville show that 1.8% or 2 of the total 112 families live below the poverty line. Families with 1 or 2 children have the highest poverty rate of 5.6%, comprising of 2 families. On the other hand, families with no children have the lowest poverty rate of 0.0%, which includes 0 families.
| Children | Above Poverty | Below Poverty |
| No Children | 67 (100.0%) | 0 (0.0%) |
| 1 or 2 Children | 34 (94.4%) | 2 (5.6%) |
| 3 or 4 Children | 9 (100.0%) | 0 (0.0%) |
| 5 or more Children | 0 (0.0%) | 0 (0.0%) |
| Total | 110 (98.2%) | 2 (1.8%) |
Income Below Poverty Among Single-Parent Households in Jeffersonville
According to the poverty data in Jeffersonville, 28.0% or 7 single-father households and 26.1% or 12 single-mother households are living below the poverty line. Among single-father households, those with 1 or 2 children have the highest poverty rate, with 7 households (70.0%) experiencing poverty. Likewise, among single-mother households, those with 3 or 4 children have the highest poverty rate, with 6 households (66.7%) falling below the poverty line.
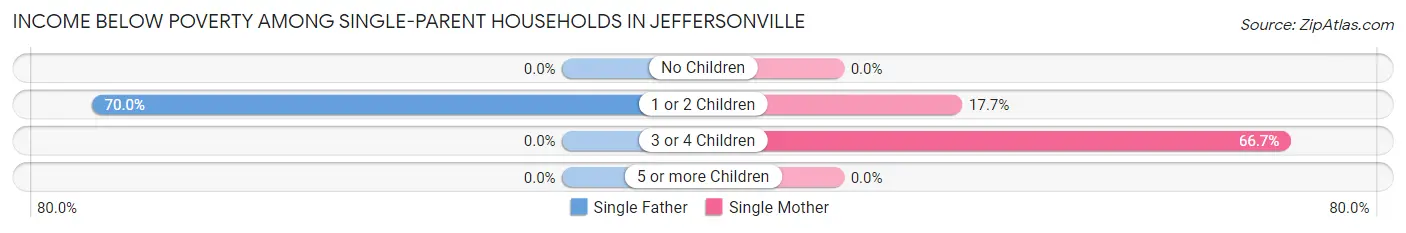
| Children | Single Father | Single Mother |
| No Children | 0 (0.0%) | 0 (0.0%) |
| 1 or 2 Children | 7 (70.0%) | 6 (17.6%) |
| 3 or 4 Children | 0 (0.0%) | 6 (66.7%) |
| 5 or more Children | 0 (0.0%) | 0 (0.0%) |
| Total | 7 (28.0%) | 12 (26.1%) |
Income Below Poverty Among Married-Couple vs Single-Parent Households in Jeffersonville
The poverty data for Jeffersonville shows that 2 of the married-couple family households (1.8%) and 19 of the single-parent households (26.8%) are living below the poverty level. Within the married-couple family households, those with 1 or 2 children have the highest poverty rate, with 2 households (5.6%) falling below the poverty line. Among the single-parent households, those with 3 or 4 children have the highest poverty rate, with 6 household (31.6%) living below poverty.
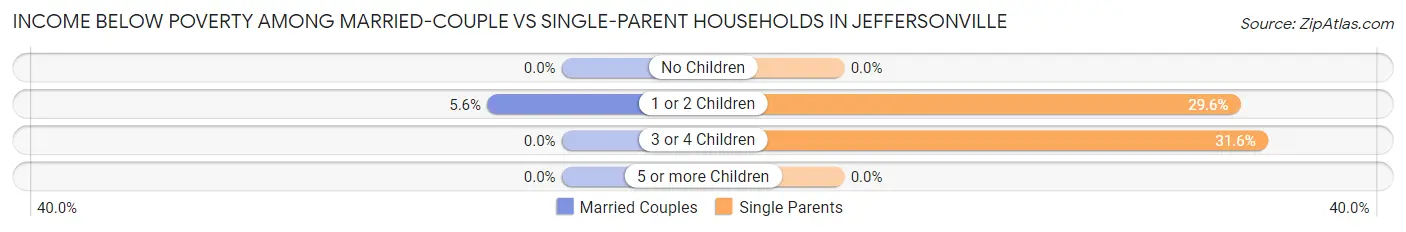
| Children | Married-Couple Families | Single-Parent Households |
| No Children | 0 (0.0%) | 0 (0.0%) |
| 1 or 2 Children | 2 (5.6%) | 13 (29.5%) |
| 3 or 4 Children | 0 (0.0%) | 6 (31.6%) |
| 5 or more Children | 0 (0.0%) | 0 (0.0%) |
| Total | 2 (1.8%) | 19 (26.8%) |
Race in Jeffersonville
The most populous races in Jeffersonville are White / Caucasian (682 | 92.3%), Two or more Races (33 | 4.5%), and Native / Alaskan (16 | 2.2%).
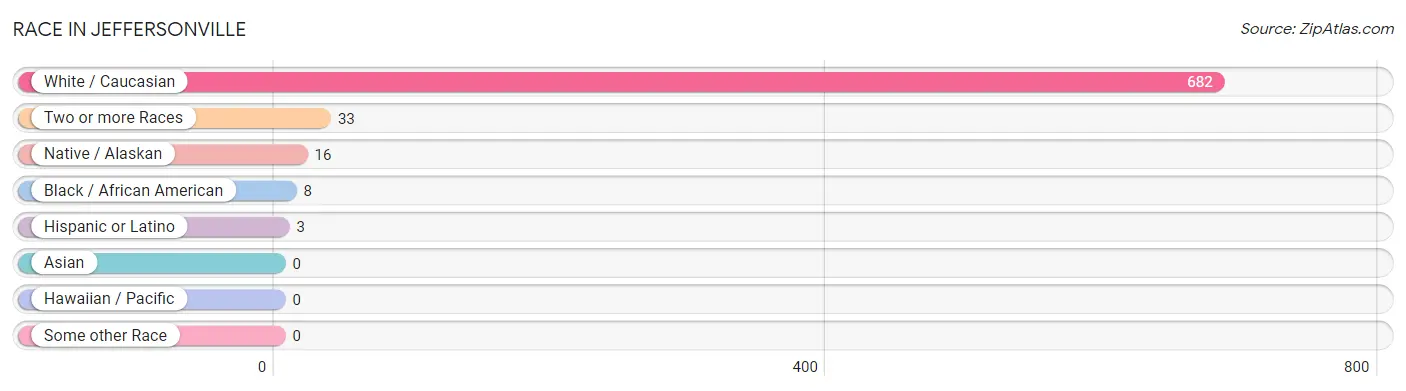
| Race | # Population | % Population |
| Asian | 0 | 0.0% |
| Black / African American | 8 | 1.1% |
| Hawaiian / Pacific | 0 | 0.0% |
| Hispanic or Latino | 3 | 0.4% |
| Native / Alaskan | 16 | 2.2% |
| White / Caucasian | 682 | 92.3% |
| Two or more Races | 33 | 4.5% |
| Some other Race | 0 | 0.0% |
| Total | 739 | 100.0% |
Ancestry in Jeffersonville
The most populous ancestries reported in Jeffersonville are Irish (189 | 25.6%), English (129 | 17.5%), German (79 | 10.7%), French Canadian (77 | 10.4%), and European (67 | 9.1%), together accounting for 73.2% of all Jeffersonville residents.
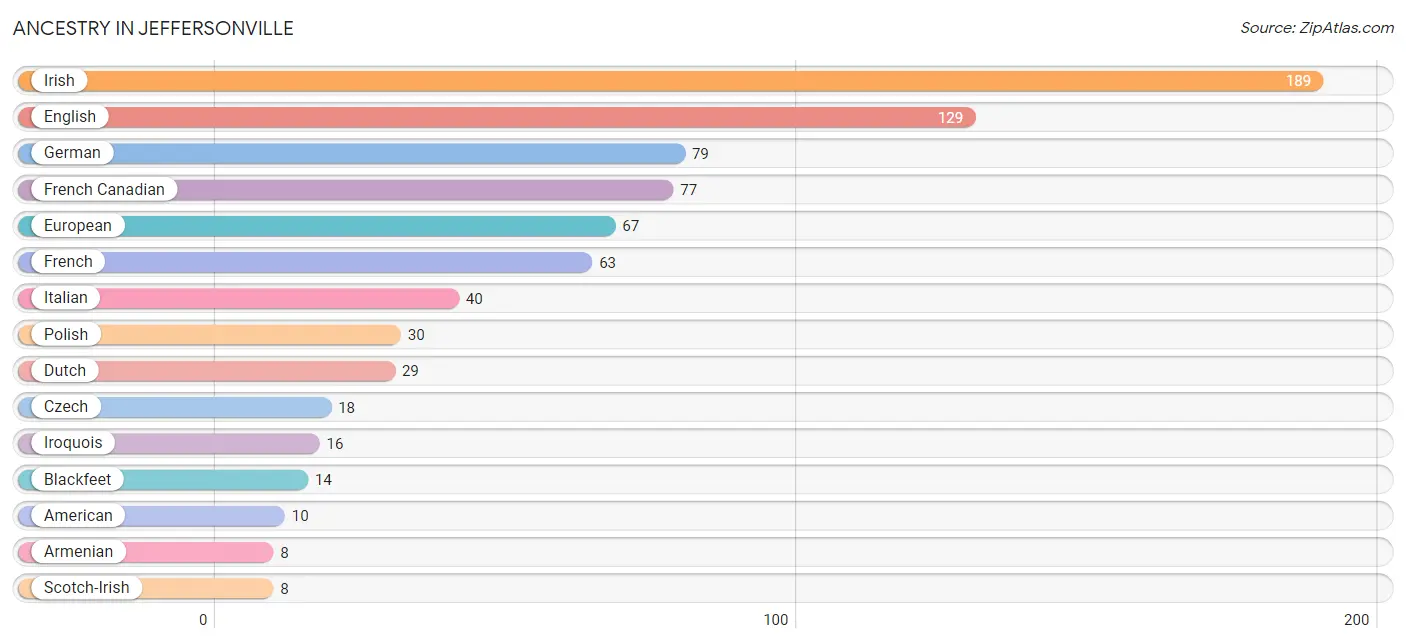
| Ancestry | # Population | % Population |
| American | 10 | 1.3% |
| Armenian | 8 | 1.1% |
| Bhutanese | 3 | 0.4% |
| Blackfeet | 14 | 1.9% |
| Czech | 18 | 2.4% |
| Dutch | 29 | 3.9% |
| English | 129 | 17.5% |
| European | 67 | 9.1% |
| French | 63 | 8.5% |
| French Canadian | 77 | 10.4% |
| German | 79 | 10.7% |
| Hungarian | 4 | 0.5% |
| Irish | 189 | 25.6% |
| Iroquois | 16 | 2.2% |
| Italian | 40 | 5.4% |
| Lithuanian | 1 | 0.1% |
| Mexican | 3 | 0.4% |
| Polish | 30 | 4.1% |
| Russian | 1 | 0.1% |
| Scotch-Irish | 8 | 1.1% |
| Scottish | 5 | 0.7% |
| Swedish | 3 | 0.4% |
| Swiss | 7 | 0.9% |
| Welsh | 8 | 1.1% | View All 24 Rows |
Immigrants in Jeffersonville
The most numerous immigrant groups reported in Jeffersonville came from , and Canada (2 | 0.3%), together accounting for 0.3% of all Jeffersonville residents.

| Immigration Origin | # Population | % Population |
| Canada | 2 | 0.3% | View All 1 Rows |
Sex and Age in Jeffersonville
Sex and Age in Jeffersonville
The most populous age groups in Jeffersonville are 15 to 19 Years (60 | 15.6%) for men and 30 to 34 Years (56 | 15.8%) for women.
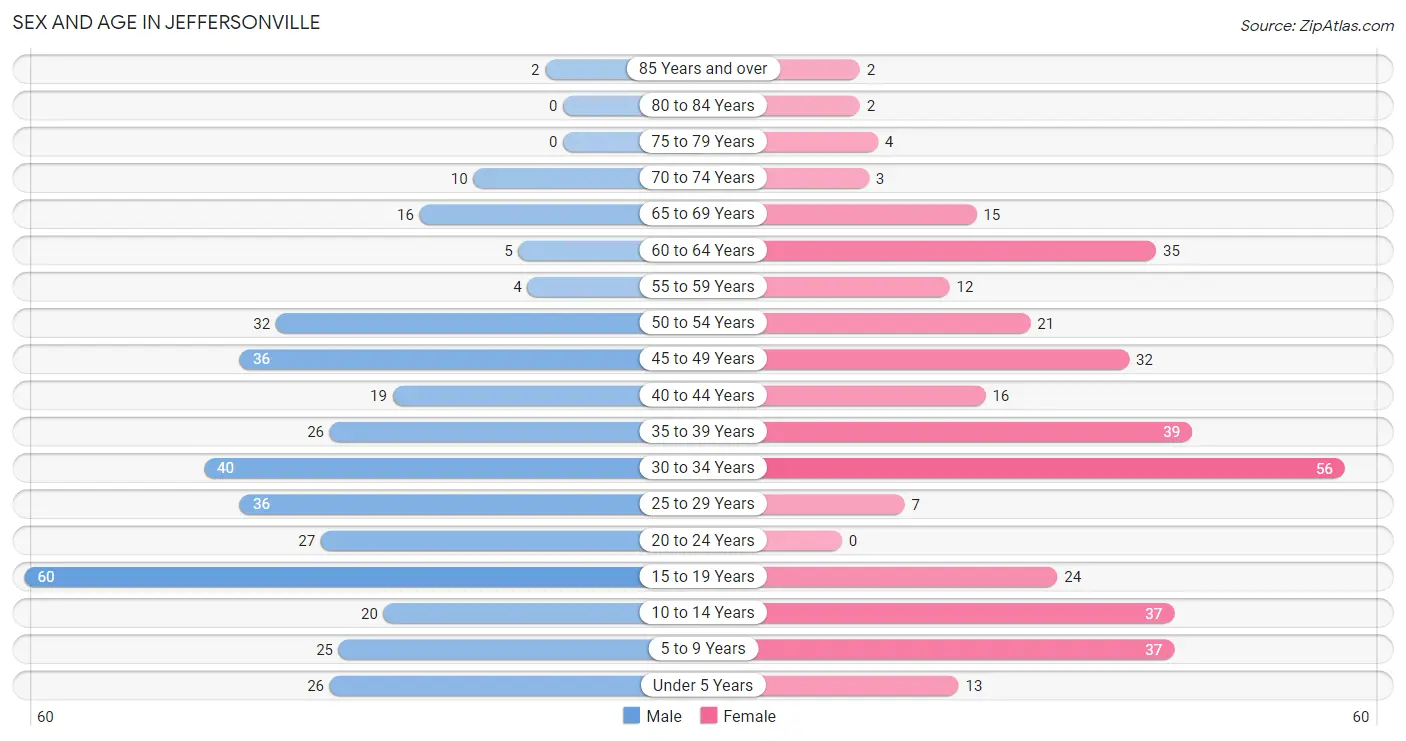
| Age Bracket | Male | Female |
| Under 5 Years | 26 (6.8%) | 13 (3.7%) |
| 5 to 9 Years | 25 (6.5%) | 37 (10.4%) |
| 10 to 14 Years | 20 (5.2%) | 37 (10.4%) |
| 15 to 19 Years | 60 (15.6%) | 24 (6.8%) |
| 20 to 24 Years | 27 (7.0%) | 0 (0.0%) |
| 25 to 29 Years | 36 (9.4%) | 7 (2.0%) |
| 30 to 34 Years | 40 (10.4%) | 56 (15.8%) |
| 35 to 39 Years | 26 (6.8%) | 39 (11.0%) |
| 40 to 44 Years | 19 (5.0%) | 16 (4.5%) |
| 45 to 49 Years | 36 (9.4%) | 32 (9.0%) |
| 50 to 54 Years | 32 (8.3%) | 21 (5.9%) |
| 55 to 59 Years | 4 (1.0%) | 12 (3.4%) |
| 60 to 64 Years | 5 (1.3%) | 35 (9.9%) |
| 65 to 69 Years | 16 (4.2%) | 15 (4.2%) |
| 70 to 74 Years | 10 (2.6%) | 3 (0.9%) |
| 75 to 79 Years | 0 (0.0%) | 4 (1.1%) |
| 80 to 84 Years | 0 (0.0%) | 2 (0.6%) |
| 85 Years and over | 2 (0.5%) | 2 (0.6%) |
| Total | 384 (100.0%) | 355 (100.0%) |
Families and Households in Jeffersonville
Median Family Size in Jeffersonville
The median family size in Jeffersonville is 3.03 persons per family, with single male/father families (25 | 13.7%) accounting for the largest median family size of 3.56 persons per family. On the other hand, married-couple families (112 | 61.2%) represent the smallest median family size with 2.95 persons per family.
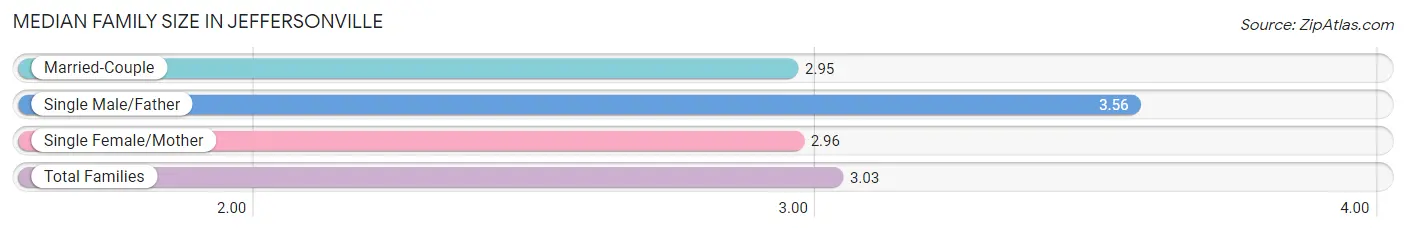
| Family Type | # Families | Family Size |
| Married-Couple | 112 (61.2%) | 2.95 |
| Single Male/Father | 25 (13.7%) | 3.56 |
| Single Female/Mother | 46 (25.1%) | 2.96 |
| Total Families | 183 (100.0%) | 3.03 |
Median Household Size in Jeffersonville
The median household size in Jeffersonville is 2.36 persons per household, with single male/father households (25 | 8.0%) accounting for the largest median household size of 3.64 persons per household. non-family households (130 | 41.5%) represent the smallest median household size with 1.32 persons per household.
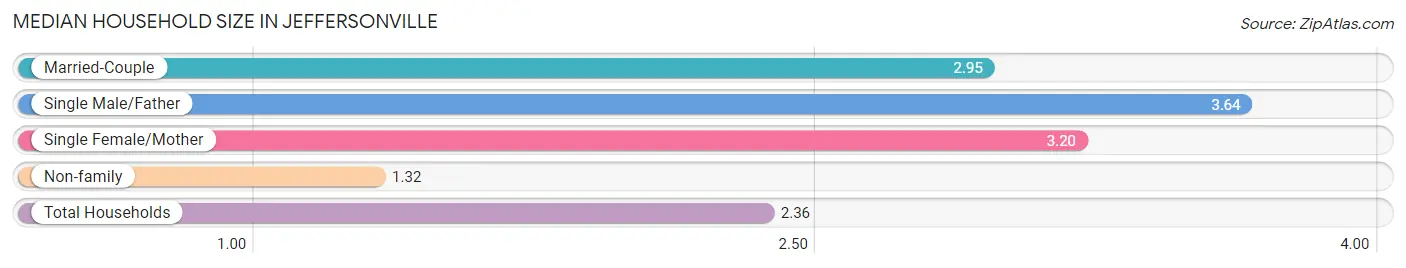
| Household Type | # Households | Household Size |
| Married-Couple | 112 (35.8%) | 2.95 |
| Single Male/Father | 25 (8.0%) | 3.64 |
| Single Female/Mother | 46 (14.7%) | 3.20 |
| Non-family | 130 (41.5%) | 1.32 |
| Total Households | 313 (100.0%) | 2.36 |
Household Size by Marriage Status in Jeffersonville
Out of a total of 313 households in Jeffersonville, 183 (58.5%) are family households, while 130 (41.5%) are nonfamily households. The most numerous type of family households are 2-person households, comprising 74, and the most common type of nonfamily households are 1-person households, comprising 84.
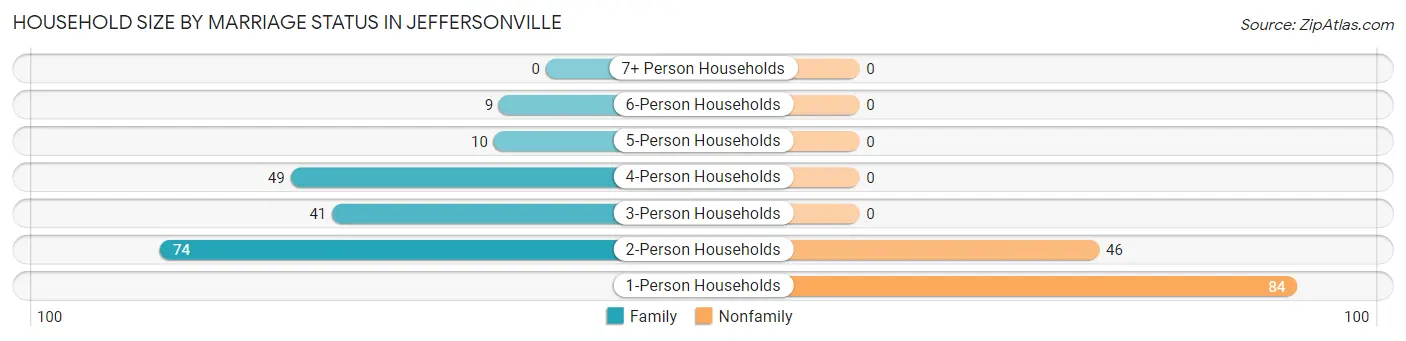
| Household Size | Family Households | Nonfamily Households |
| 1-Person Households | - | 84 (26.8%) |
| 2-Person Households | 74 (23.6%) | 46 (14.7%) |
| 3-Person Households | 41 (13.1%) | 0 (0.0%) |
| 4-Person Households | 49 (15.7%) | 0 (0.0%) |
| 5-Person Households | 10 (3.2%) | 0 (0.0%) |
| 6-Person Households | 9 (2.9%) | 0 (0.0%) |
| 7+ Person Households | 0 (0.0%) | 0 (0.0%) |
| Total | 183 (58.5%) | 130 (41.5%) |
Female Fertility in Jeffersonville
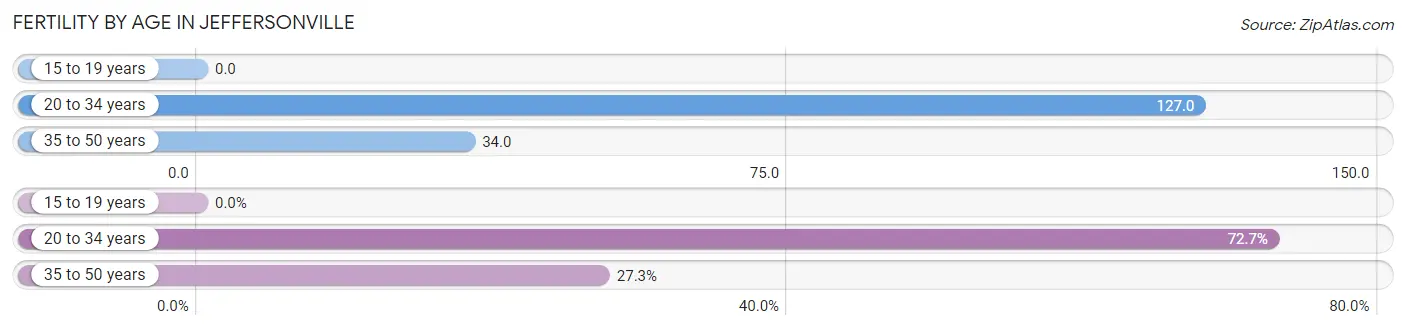
Fertility by Age in Jeffersonville
Average fertility rate in Jeffersonville is 63.0 births per 1,000 women. Women in the age bracket of 20 to 34 years have the highest fertility rate with 127.0 births per 1,000 women. Women in the age bracket of 20 to 34 years acount for 72.7% of all women with births.
| Age Bracket | Women with Births | Births / 1,000 Women |
| 15 to 19 years | 0 (0.0%) | 0.0 |
| 20 to 34 years | 8 (72.7%) | 127.0 |
| 35 to 50 years | 3 (27.3%) | 34.0 |
| Total | 11 (100.0%) | 63.0 |
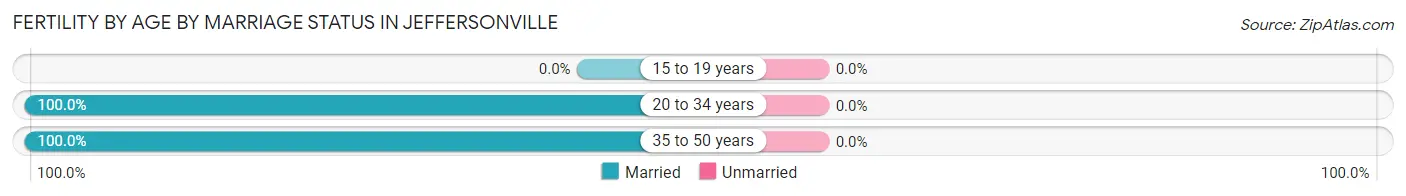
Fertility by Age by Marriage Status in Jeffersonville
| Age Bracket | Married | Unmarried |
| 15 to 19 years | 0 (0.0%) | 0 (0.0%) |
| 20 to 34 years | 8 (100.0%) | 0 (0.0%) |
| 35 to 50 years | 3 (100.0%) | 0 (0.0%) |
| Total | 11 (100.0%) | 0 (0.0%) |
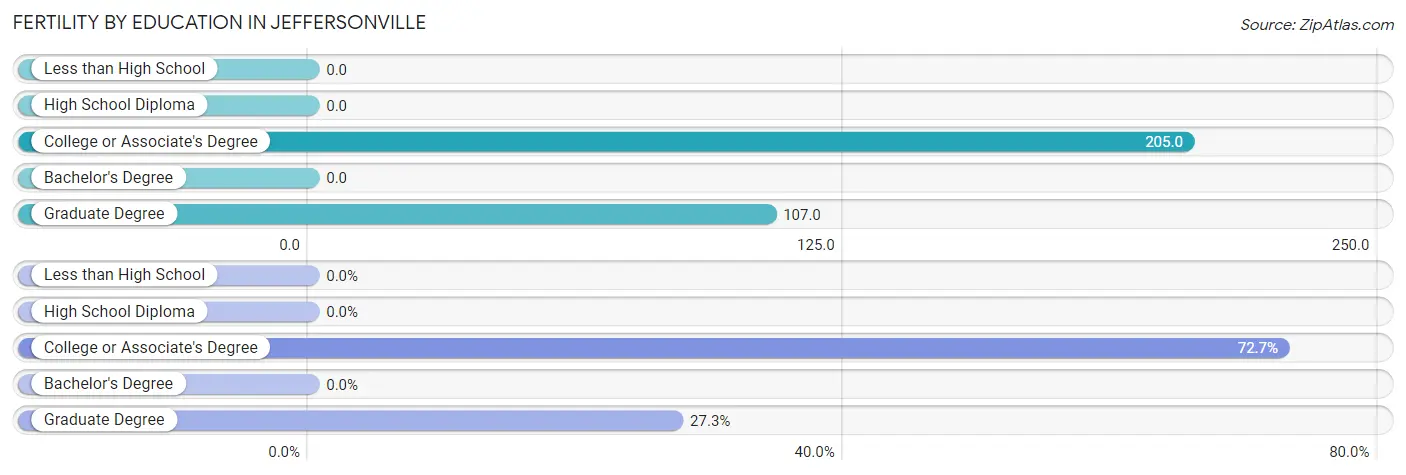
Fertility by Education in Jeffersonville
| Educational Attainment | Women with Births | Births / 1,000 Women |
| Less than High School | 0 (0.0%) | 0.0 |
| High School Diploma | 0 (0.0%) | 0.0 |
| College or Associate's Degree | 8 (72.7%) | 205.0 |
| Bachelor's Degree | 0 (0.0%) | 0.0 |
| Graduate Degree | 3 (27.3%) | 107.0 |
| Total | 11 (100.0%) | 63.0 |
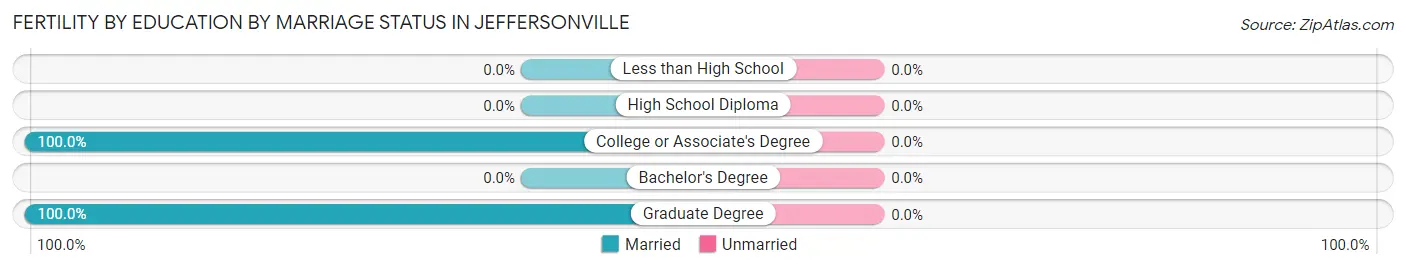
Fertility by Education by Marriage Status in Jeffersonville
| Educational Attainment | Married | Unmarried |
| Less than High School | 0 (0.0%) | 0 (0.0%) |
| High School Diploma | 0 (0.0%) | 0 (0.0%) |
| College or Associate's Degree | 8 (100.0%) | 0 (0.0%) |
| Bachelor's Degree | 0 (0.0%) | 0 (0.0%) |
| Graduate Degree | 3 (100.0%) | 0 (0.0%) |
| Total | 11 (100.0%) | 0 (0.0%) |
Employment Characteristics in Jeffersonville
Employment by Class of Employer in Jeffersonville
Among the 428 employed individuals in Jeffersonville, private company employees (271 | 63.3%), state government employees (44 | 10.3%), and local government employees (43 | 10.1%) make up the most common classes of employment.
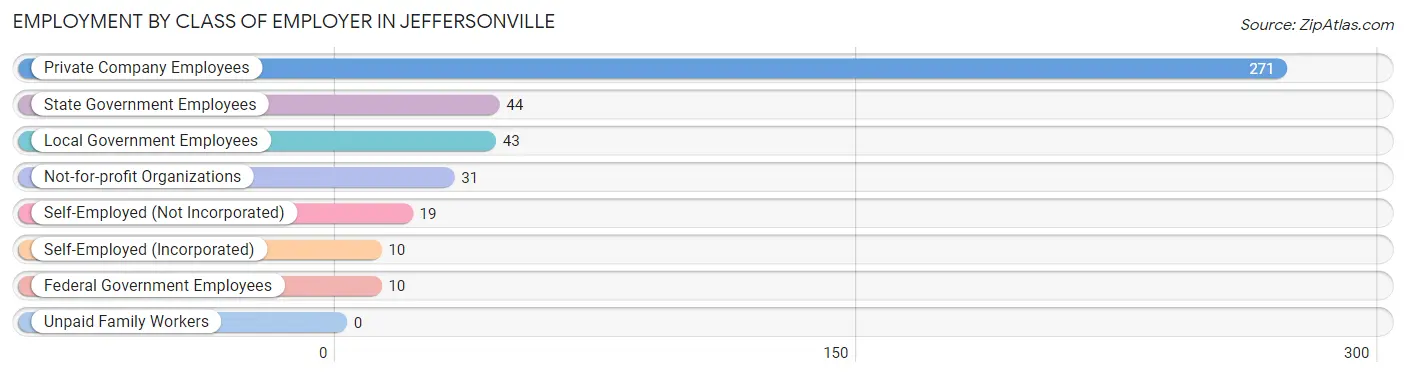
| Employer Class | # Employees | % Employees |
| Private Company Employees | 271 | 63.3% |
| Self-Employed (Incorporated) | 10 | 2.3% |
| Self-Employed (Not Incorporated) | 19 | 4.4% |
| Not-for-profit Organizations | 31 | 7.2% |
| Local Government Employees | 43 | 10.1% |
| State Government Employees | 44 | 10.3% |
| Federal Government Employees | 10 | 2.3% |
| Unpaid Family Workers | 0 | 0.0% |
| Total | 428 | 100.0% |
Employment Status by Age in Jeffersonville
According to the labor force statistics for Jeffersonville, out of the total population over 16 years of age (568), 82.7% or 470 individuals are in the labor force, with 8.5% or 40 of them unemployed. The age group with the highest labor force participation rate is 35 to 44 years, with 100.0% or 100 individuals in the labor force. Within the labor force, the 16 to 19 years age range has the highest percentage of unemployed individuals, with 32.1% or 17 of them being unemployed.
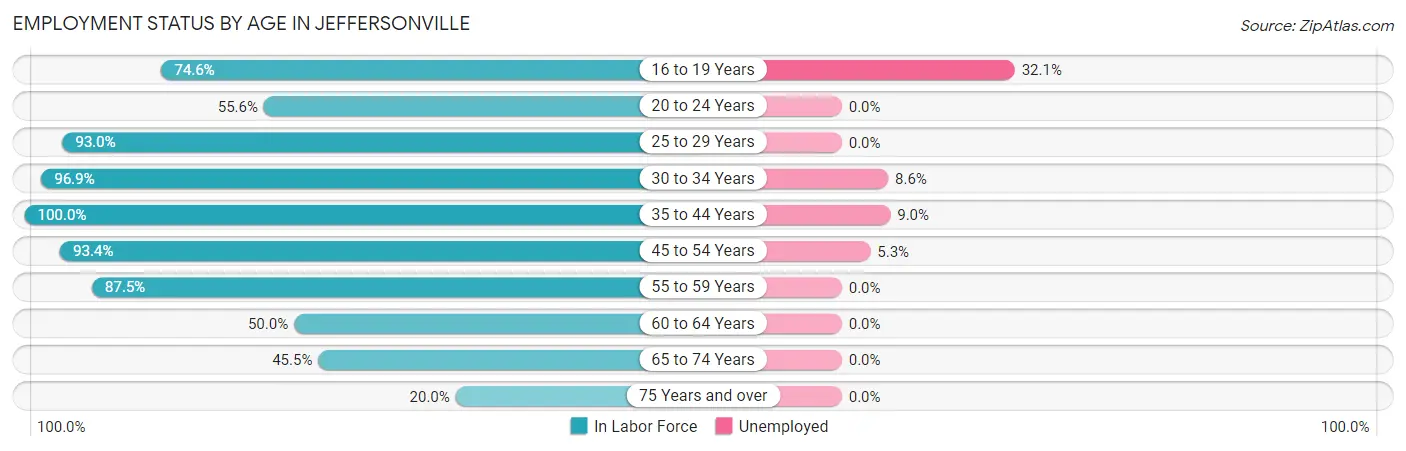
| Age Bracket | In Labor Force | Unemployed |
| 16 to 19 Years | 53 (74.6%) | 17 (32.1%) |
| 20 to 24 Years | 15 (55.6%) | 0 (0.0%) |
| 25 to 29 Years | 40 (93.0%) | 0 (0.0%) |
| 30 to 34 Years | 93 (96.9%) | 8 (8.6%) |
| 35 to 44 Years | 100 (100.0%) | 9 (9.0%) |
| 45 to 54 Years | 113 (93.4%) | 6 (5.3%) |
| 55 to 59 Years | 14 (87.5%) | 0 (0.0%) |
| 60 to 64 Years | 20 (50.0%) | 0 (0.0%) |
| 65 to 74 Years | 20 (45.5%) | 0 (0.0%) |
| 75 Years and over | 2 (20.0%) | 0 (0.0%) |
| Total | 470 (82.7%) | 40 (8.5%) |
Employment Status by Educational Attainment in Jeffersonville
According to labor force statistics for Jeffersonville, 91.3% of individuals (380) out of the total population between 25 and 64 years of age (416) are in the labor force, with 6.1% or 23 of them being unemployed. The group with the highest labor force participation rate are those with the educational attainment of college / associate degree, with 95.9% or 163 individuals in the labor force. Within the labor force, individuals with high school diploma education have the highest percentage of unemployment, with 9.8% or 6 of them being unemployed.
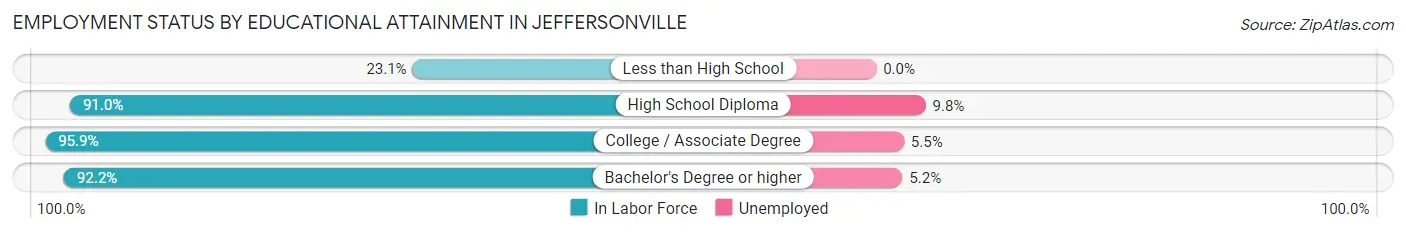
| Educational Attainment | In Labor Force | Unemployed |
| Less than High School | 3 (23.1%) | 0 (0.0%) |
| High School Diploma | 61 (91.0%) | 7 (9.8%) |
| College / Associate Degree | 163 (95.9%) | 9 (5.5%) |
| Bachelor's Degree or higher | 153 (92.2%) | 9 (5.2%) |
| Total | 380 (91.3%) | 25 (6.1%) |
Employment Occupations by Sex in Jeffersonville
Management, Business, Science and Arts Occupations
The most common Management, Business, Science and Arts occupations in Jeffersonville are Community & Social Service (74 | 17.2%), Education Instruction & Library (53 | 12.3%), Management (33 | 7.7%), Business & Financial (28 | 6.5%), and Health Diagnosing & Treating (21 | 4.9%).
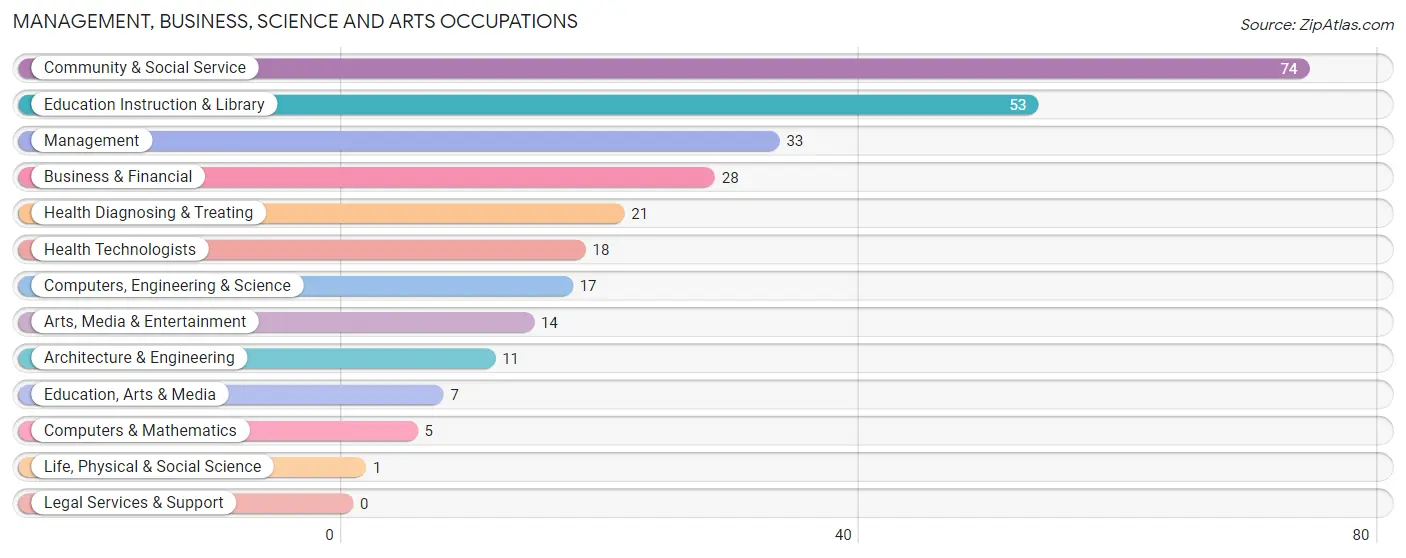
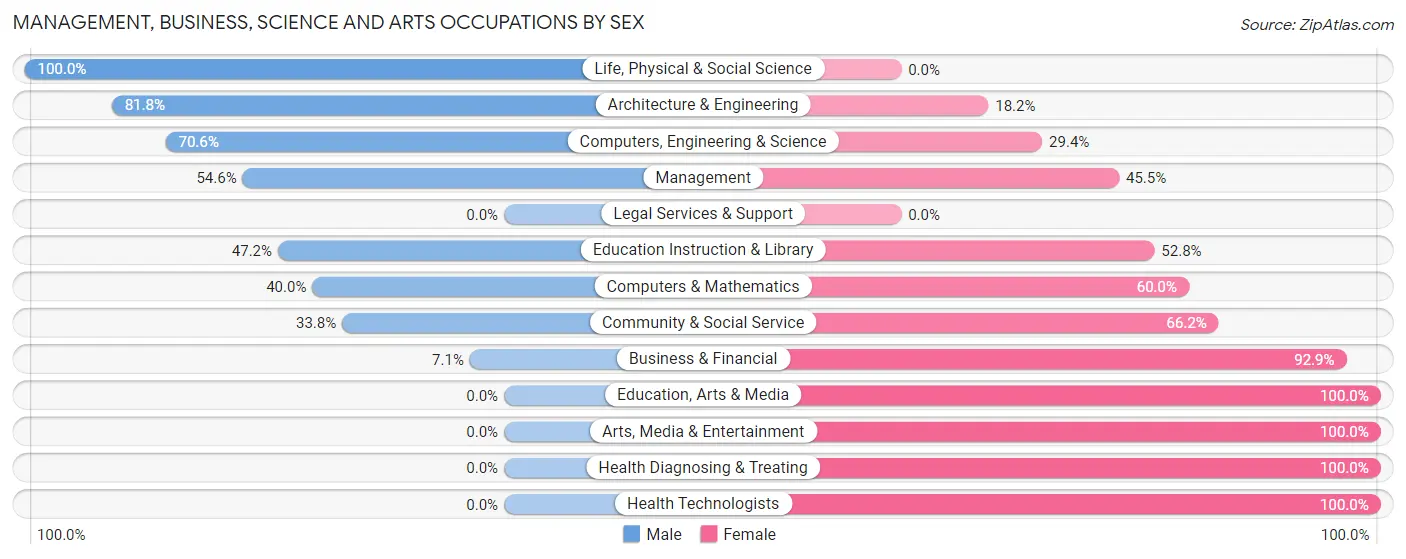
Management, Business, Science and Arts Occupations by Sex
Within the Management, Business, Science and Arts occupations in Jeffersonville, the most male-oriented occupations are Life, Physical & Social Science (100.0%), Architecture & Engineering (81.8%), and Computers, Engineering & Science (70.6%), while the most female-oriented occupations are Education, Arts & Media (100.0%), Arts, Media & Entertainment (100.0%), and Health Diagnosing & Treating (100.0%).
| Occupation | Male | Female |
| Management | 18 (54.5%) | 15 (45.5%) |
| Business & Financial | 2 (7.1%) | 26 (92.9%) |
| Computers, Engineering & Science | 12 (70.6%) | 5 (29.4%) |
| Computers & Mathematics | 2 (40.0%) | 3 (60.0%) |
| Architecture & Engineering | 9 (81.8%) | 2 (18.2%) |
| Life, Physical & Social Science | 1 (100.0%) | 0 (0.0%) |
| Community & Social Service | 25 (33.8%) | 49 (66.2%) |
| Education, Arts & Media | 0 (0.0%) | 7 (100.0%) |
| Legal Services & Support | 0 (0.0%) | 0 (0.0%) |
| Education Instruction & Library | 25 (47.2%) | 28 (52.8%) |
| Arts, Media & Entertainment | 0 (0.0%) | 14 (100.0%) |
| Health Diagnosing & Treating | 0 (0.0%) | 21 (100.0%) |
| Health Technologists | 0 (0.0%) | 18 (100.0%) |
| Total (Category) | 57 (33.0%) | 116 (67.0%) |
| Total (Overall) | 238 (55.3%) | 192 (44.7%) |
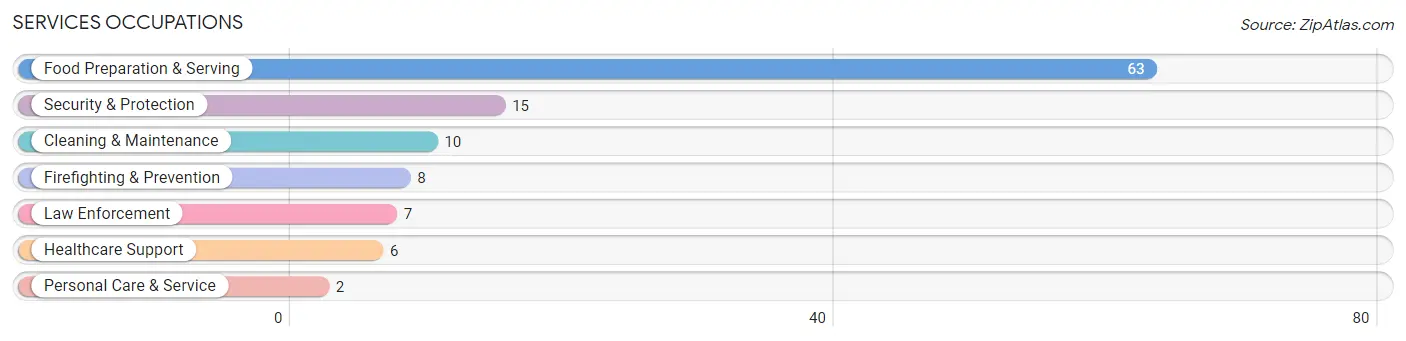
Services Occupations
The most common Services occupations in Jeffersonville are Food Preparation & Serving (63 | 14.6%), Security & Protection (15 | 3.5%), Cleaning & Maintenance (10 | 2.3%), Firefighting & Prevention (8 | 1.9%), and Law Enforcement (7 | 1.6%).
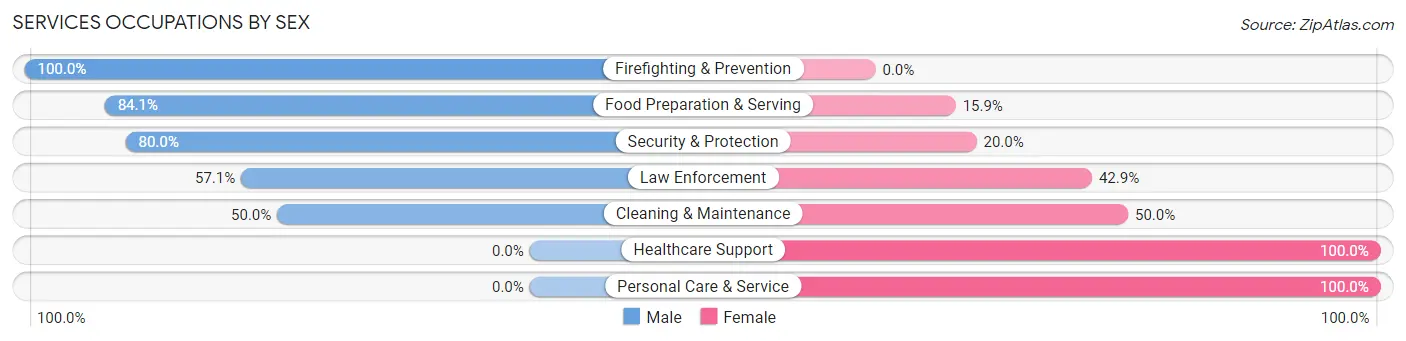
Services Occupations by Sex
Within the Services occupations in Jeffersonville, the most male-oriented occupations are Firefighting & Prevention (100.0%), Food Preparation & Serving (84.1%), and Security & Protection (80.0%), while the most female-oriented occupations are Healthcare Support (100.0%), Personal Care & Service (100.0%), and Cleaning & Maintenance (50.0%).
| Occupation | Male | Female |
| Healthcare Support | 0 (0.0%) | 6 (100.0%) |
| Security & Protection | 12 (80.0%) | 3 (20.0%) |
| Firefighting & Prevention | 8 (100.0%) | 0 (0.0%) |
| Law Enforcement | 4 (57.1%) | 3 (42.9%) |
| Food Preparation & Serving | 53 (84.1%) | 10 (15.9%) |
| Cleaning & Maintenance | 5 (50.0%) | 5 (50.0%) |
| Personal Care & Service | 0 (0.0%) | 2 (100.0%) |
| Total (Category) | 70 (72.9%) | 26 (27.1%) |
| Total (Overall) | 238 (55.3%) | 192 (44.7%) |
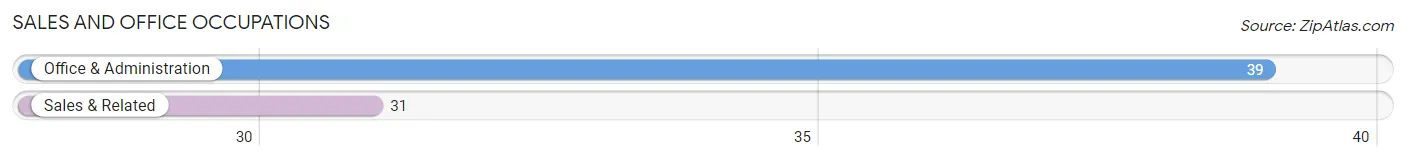
Sales and Office Occupations
The most common Sales and Office occupations in Jeffersonville are Office & Administration (39 | 9.1%), and Sales & Related (31 | 7.2%).
Sales and Office Occupations by Sex
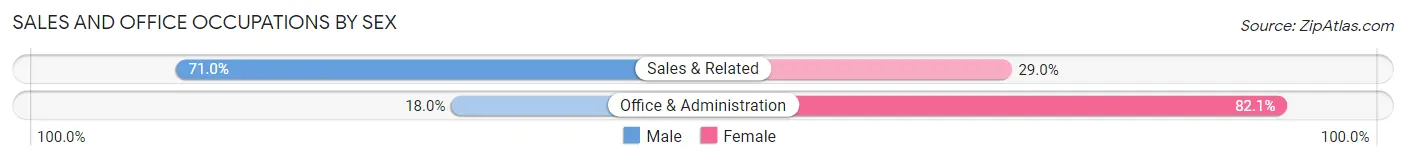
| Occupation | Male | Female |
| Sales & Related | 22 (71.0%) | 9 (29.0%) |
| Office & Administration | 7 (17.9%) | 32 (82.1%) |
| Total (Category) | 29 (41.4%) | 41 (58.6%) |
| Total (Overall) | 238 (55.3%) | 192 (44.7%) |
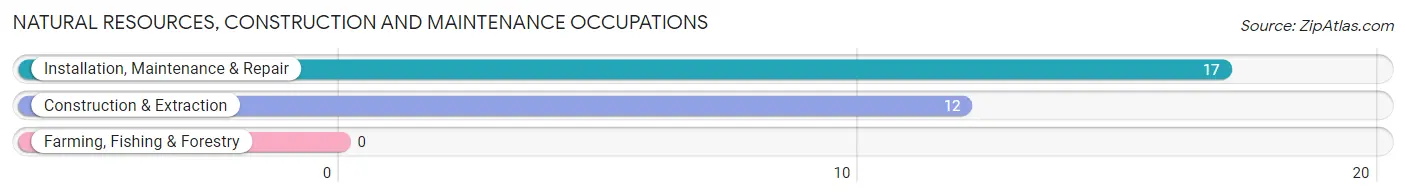
Natural Resources, Construction and Maintenance Occupations
The most common Natural Resources, Construction and Maintenance occupations in Jeffersonville are Installation, Maintenance & Repair (17 | 4.0%), and Construction & Extraction (12 | 2.8%).
Natural Resources, Construction and Maintenance Occupations by Sex
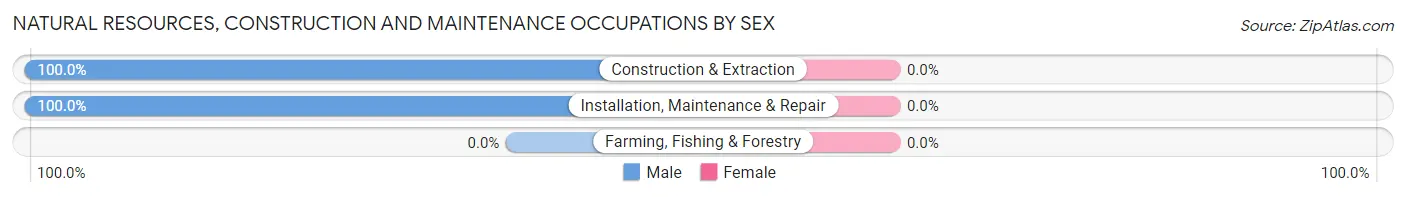
| Occupation | Male | Female |
| Farming, Fishing & Forestry | 0 (0.0%) | 0 (0.0%) |
| Construction & Extraction | 12 (100.0%) | 0 (0.0%) |
| Installation, Maintenance & Repair | 17 (100.0%) | 0 (0.0%) |
| Total (Category) | 29 (100.0%) | 0 (0.0%) |
| Total (Overall) | 238 (55.3%) | 192 (44.7%) |
Production, Transportation and Moving Occupations
The most common Production, Transportation and Moving occupations in Jeffersonville are Production (49 | 11.4%), Transportation (12 | 2.8%), and Material Moving (1 | 0.2%).
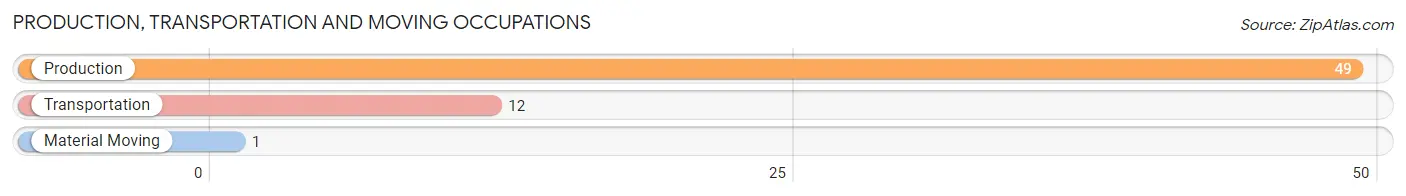
Production, Transportation and Moving Occupations by Sex
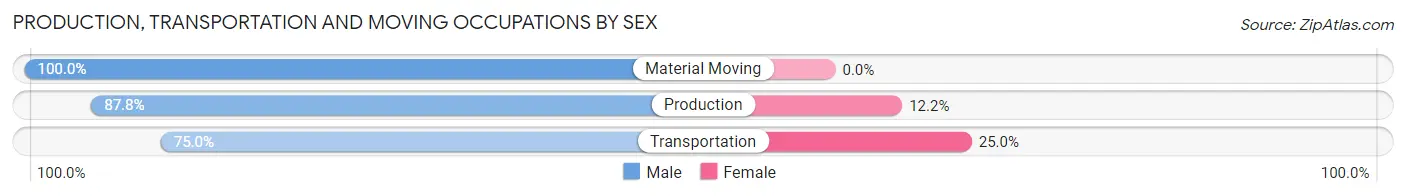
| Occupation | Male | Female |
| Production | 43 (87.8%) | 6 (12.2%) |
| Transportation | 9 (75.0%) | 3 (25.0%) |
| Material Moving | 1 (100.0%) | 0 (0.0%) |
| Total (Category) | 53 (85.5%) | 9 (14.5%) |
| Total (Overall) | 238 (55.3%) | 192 (44.7%) |
Employment Industries by Sex in Jeffersonville
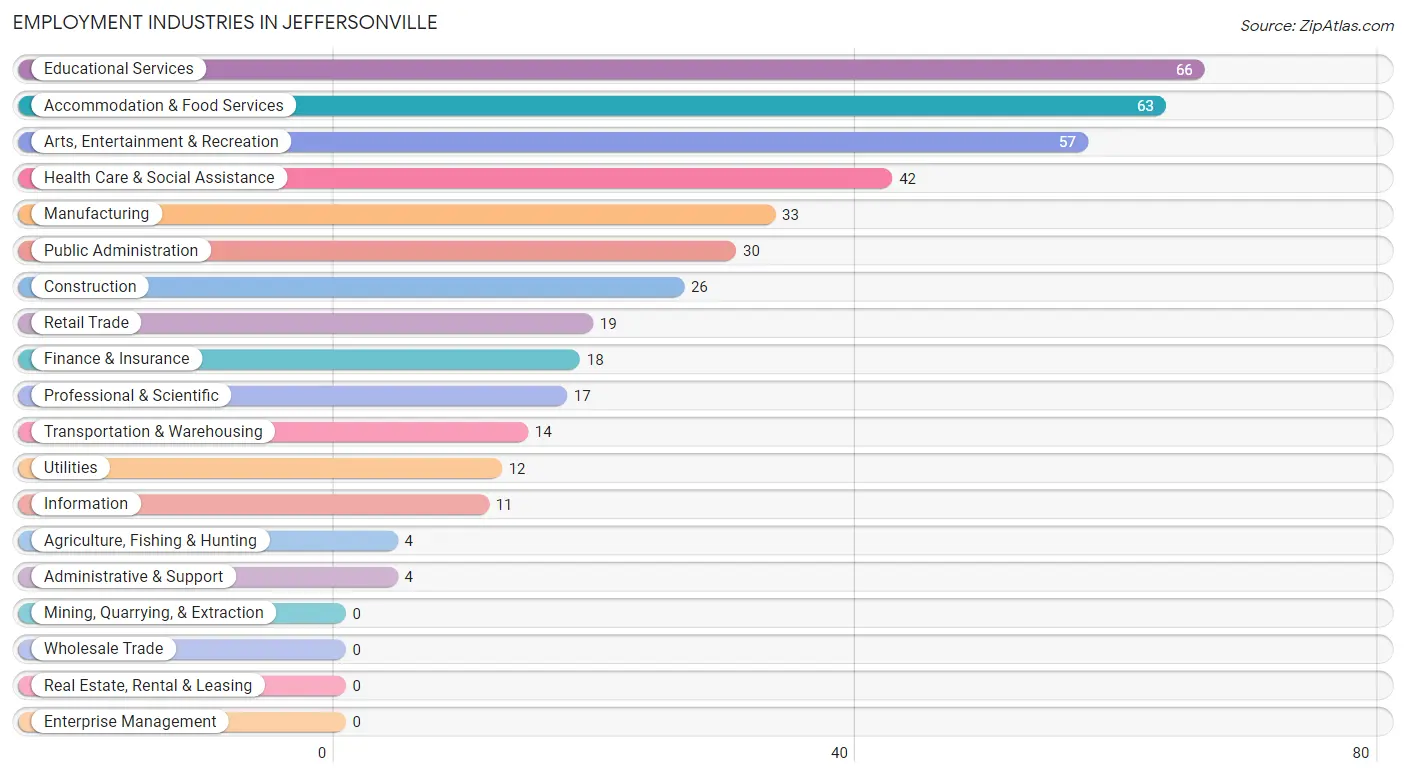
Employment Industries in Jeffersonville
The major employment industries in Jeffersonville include Educational Services (66 | 15.3%), Accommodation & Food Services (63 | 14.6%), Arts, Entertainment & Recreation (57 | 13.3%), Health Care & Social Assistance (42 | 9.8%), and Manufacturing (33 | 7.7%).
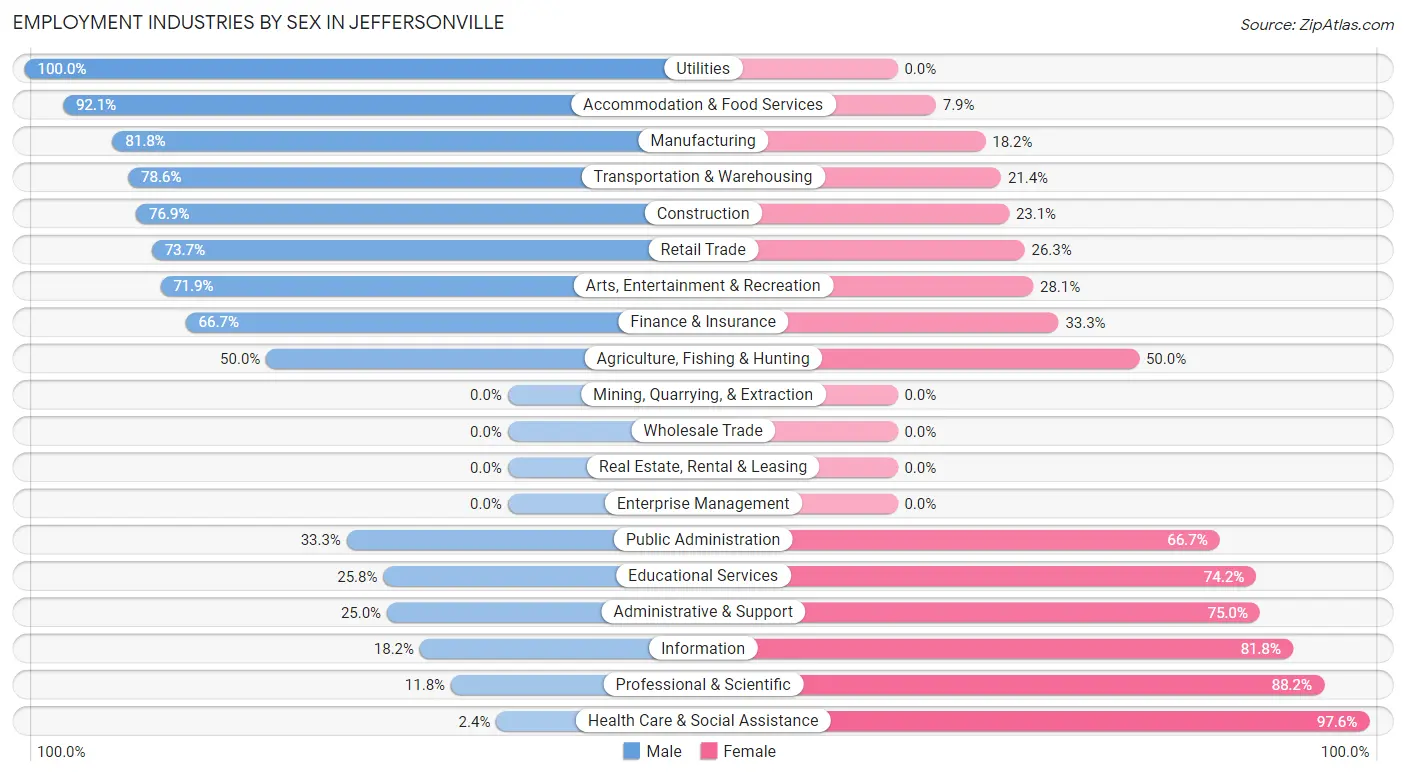
Employment Industries by Sex in Jeffersonville
The Jeffersonville industries that see more men than women are Utilities (100.0%), Accommodation & Food Services (92.1%), and Manufacturing (81.8%), whereas the industries that tend to have a higher number of women are Health Care & Social Assistance (97.6%), Professional & Scientific (88.2%), and Information (81.8%).
| Industry | Male | Female |
| Agriculture, Fishing & Hunting | 2 (50.0%) | 2 (50.0%) |
| Mining, Quarrying, & Extraction | 0 (0.0%) | 0 (0.0%) |
| Construction | 20 (76.9%) | 6 (23.1%) |
| Manufacturing | 27 (81.8%) | 6 (18.2%) |
| Wholesale Trade | 0 (0.0%) | 0 (0.0%) |
| Retail Trade | 14 (73.7%) | 5 (26.3%) |
| Transportation & Warehousing | 11 (78.6%) | 3 (21.4%) |
| Utilities | 12 (100.0%) | 0 (0.0%) |
| Information | 2 (18.2%) | 9 (81.8%) |
| Finance & Insurance | 12 (66.7%) | 6 (33.3%) |
| Real Estate, Rental & Leasing | 0 (0.0%) | 0 (0.0%) |
| Professional & Scientific | 2 (11.8%) | 15 (88.2%) |
| Enterprise Management | 0 (0.0%) | 0 (0.0%) |
| Administrative & Support | 1 (25.0%) | 3 (75.0%) |
| Educational Services | 17 (25.8%) | 49 (74.2%) |
| Health Care & Social Assistance | 1 (2.4%) | 41 (97.6%) |
| Arts, Entertainment & Recreation | 41 (71.9%) | 16 (28.1%) |
| Accommodation & Food Services | 58 (92.1%) | 5 (7.9%) |
| Public Administration | 10 (33.3%) | 20 (66.7%) |
| Total | 238 (55.3%) | 192 (44.7%) |
Education in Jeffersonville
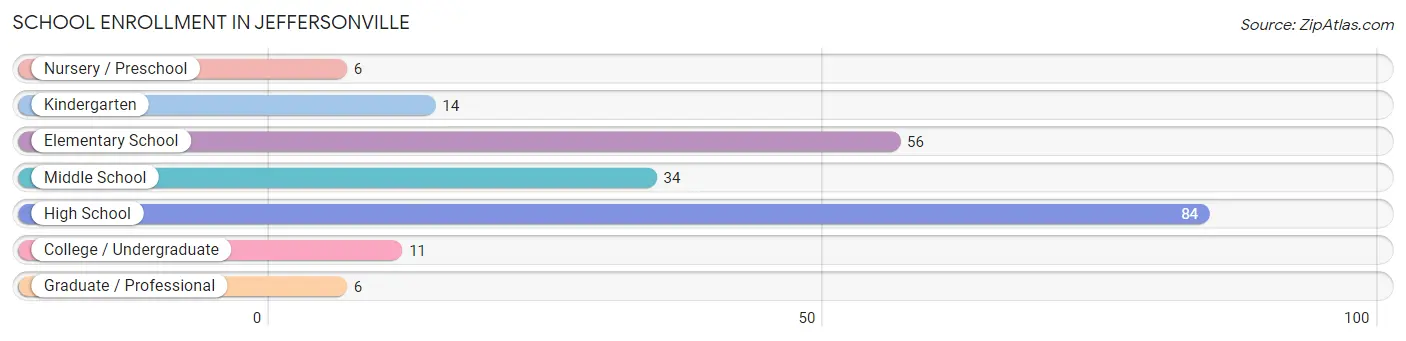
School Enrollment in Jeffersonville
The most common levels of schooling among the 211 students in Jeffersonville are high school (84 | 39.8%), elementary school (56 | 26.5%), and middle school (34 | 16.1%).
| School Level | # Students | % Students |
| Nursery / Preschool | 6 | 2.8% |
| Kindergarten | 14 | 6.6% |
| Elementary School | 56 | 26.5% |
| Middle School | 34 | 16.1% |
| High School | 84 | 39.8% |
| College / Undergraduate | 11 | 5.2% |
| Graduate / Professional | 6 | 2.8% |
| Total | 211 | 100.0% |
School Enrollment by Age by Funding Source in Jeffersonville
Out of a total of 211 students who are enrolled in schools in Jeffersonville, 5 (2.4%) attend a private institution, while the remaining 206 (97.6%) are enrolled in public schools. The age group of 3 to 4 year olds has the highest likelihood of being enrolled in private schools, with 3 (50.0% in the age bracket) enrolled. Conversely, the age group of 5 to 9 year old has the lowest likelihood of being enrolled in a private school, with 60 (100.0% in the age bracket) attending a public institution.
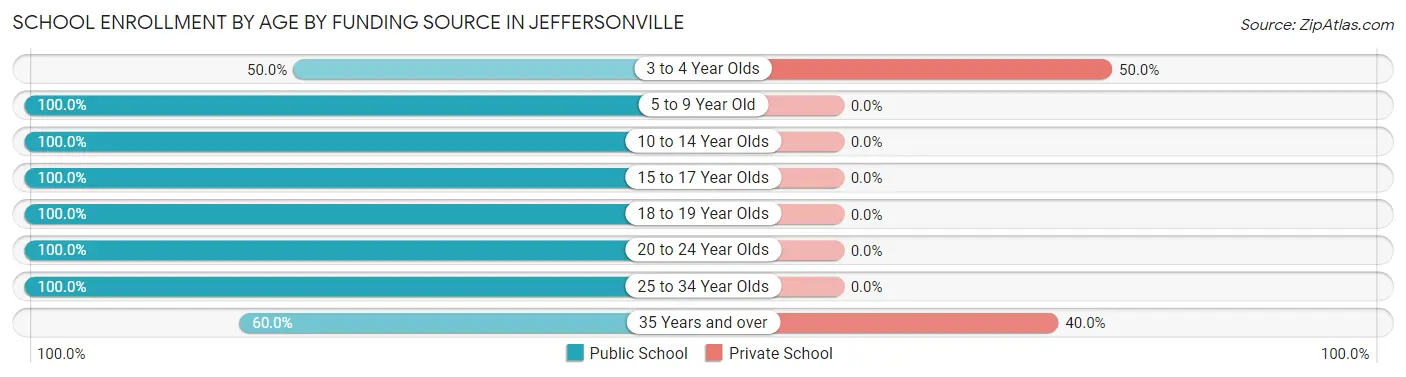
| Age Bracket | Public School | Private School |
| 3 to 4 Year Olds | 3 (50.0%) | 3 (50.0%) |
| 5 to 9 Year Old | 60 (100.0%) | 0 (0.0%) |
| 10 to 14 Year Olds | 57 (100.0%) | 0 (0.0%) |
| 15 to 17 Year Olds | 28 (100.0%) | 0 (0.0%) |
| 18 to 19 Year Olds | 43 (100.0%) | 0 (0.0%) |
| 20 to 24 Year Olds | 10 (100.0%) | 0 (0.0%) |
| 25 to 34 Year Olds | 2 (100.0%) | 0 (0.0%) |
| 35 Years and over | 3 (60.0%) | 2 (40.0%) |
| Total | 206 (97.6%) | 5 (2.4%) |
Educational Attainment by Field of Study in Jeffersonville
Social sciences (33 | 16.0%), business (28 | 13.6%), science & technology (24 | 11.7%), literature & languages (23 | 11.2%), and education (21 | 10.2%) are the most common fields of study among 206 individuals in Jeffersonville who have obtained a bachelor's degree or higher.
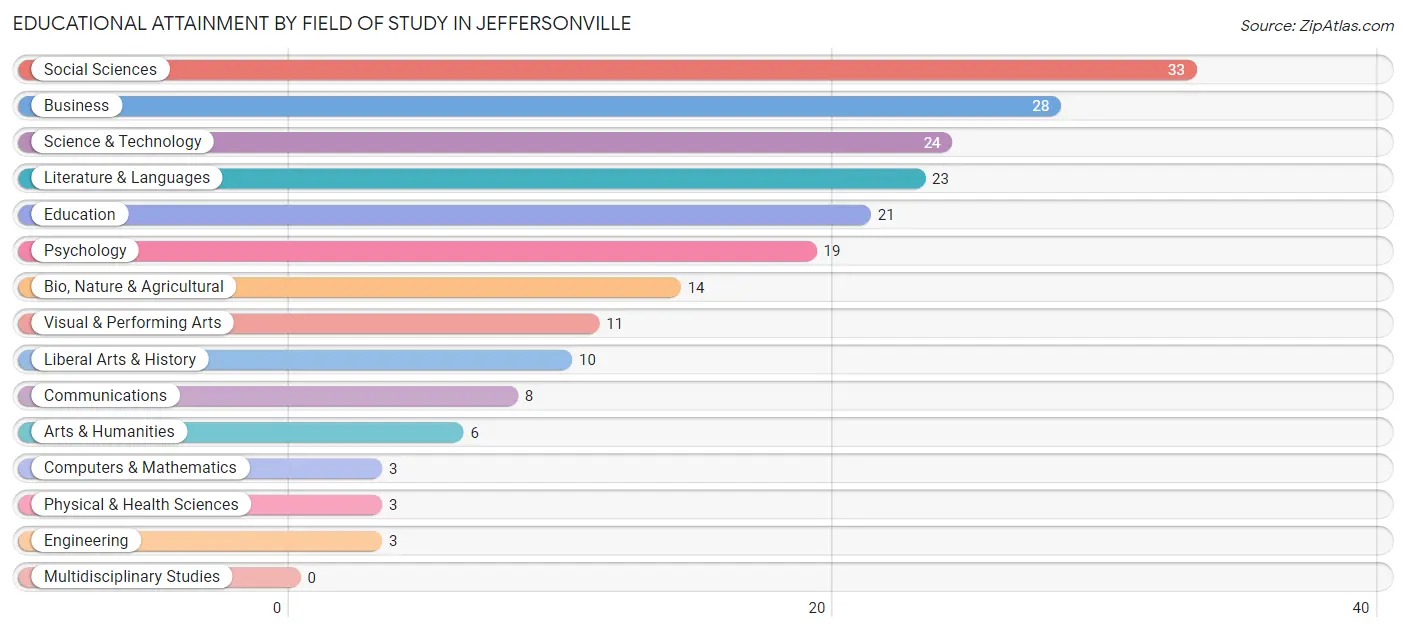
| Field of Study | # Graduates | % Graduates |
| Computers & Mathematics | 3 | 1.5% |
| Bio, Nature & Agricultural | 14 | 6.8% |
| Physical & Health Sciences | 3 | 1.5% |
| Psychology | 19 | 9.2% |
| Social Sciences | 33 | 16.0% |
| Engineering | 3 | 1.5% |
| Multidisciplinary Studies | 0 | 0.0% |
| Science & Technology | 24 | 11.7% |
| Business | 28 | 13.6% |
| Education | 21 | 10.2% |
| Literature & Languages | 23 | 11.2% |
| Liberal Arts & History | 10 | 4.9% |
| Visual & Performing Arts | 11 | 5.3% |
| Communications | 8 | 3.9% |
| Arts & Humanities | 6 | 2.9% |
| Total | 206 | 100.0% |
Transportation & Commute in Jeffersonville
Vehicle Availability by Sex in Jeffersonville
The most prevalent vehicle ownership categories in Jeffersonville are males with 2 vehicles (144, accounting for 60.5%) and females with 2 vehicles (107, making up 75.8%).
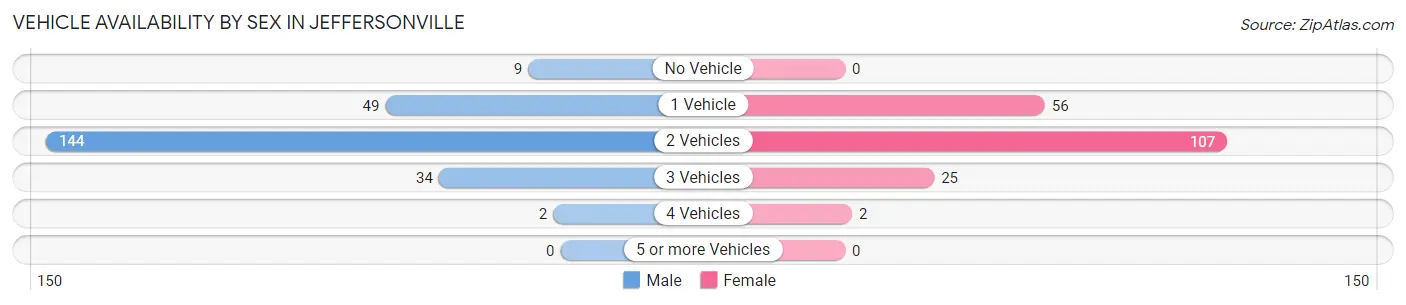
| Vehicles Available | Male | Female |
| No Vehicle | 9 (3.8%) | 0 (0.0%) |
| 1 Vehicle | 49 (20.6%) | 56 (29.5%) |
| 2 Vehicles | 144 (60.5%) | 107 (56.3%) |
| 3 Vehicles | 34 (14.3%) | 25 (13.2%) |
| 4 Vehicles | 2 (0.8%) | 2 (1.1%) |
| 5 or more Vehicles | 0 (0.0%) | 0 (0.0%) |
| Total | 238 (100.0%) | 190 (100.0%) |
Commute Time in Jeffersonville
The most frequently occuring commute durations in Jeffersonville are 45 to 59 minutes (108 commuters, 27.5%), 10 to 14 minutes (68 commuters, 17.3%), and 30 to 34 minutes (50 commuters, 12.7%).
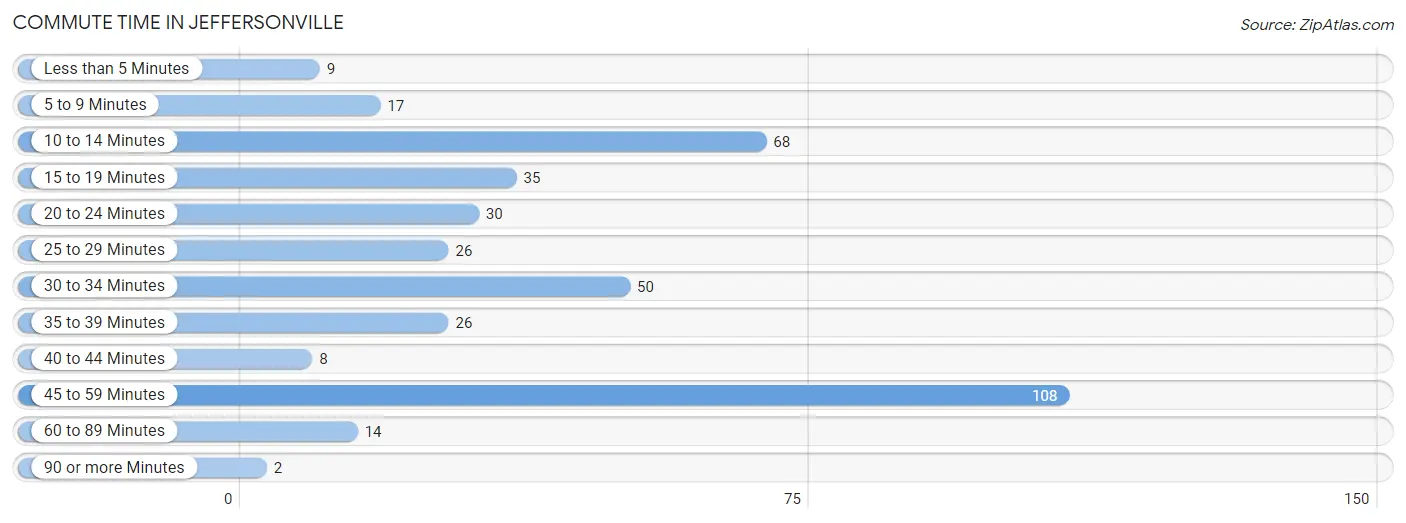
| Commute Time | # Commuters | % Commuters |
| Less than 5 Minutes | 9 | 2.3% |
| 5 to 9 Minutes | 17 | 4.3% |
| 10 to 14 Minutes | 68 | 17.3% |
| 15 to 19 Minutes | 35 | 8.9% |
| 20 to 24 Minutes | 30 | 7.6% |
| 25 to 29 Minutes | 26 | 6.6% |
| 30 to 34 Minutes | 50 | 12.7% |
| 35 to 39 Minutes | 26 | 6.6% |
| 40 to 44 Minutes | 8 | 2.0% |
| 45 to 59 Minutes | 108 | 27.5% |
| 60 to 89 Minutes | 14 | 3.6% |
| 90 or more Minutes | 2 | 0.5% |
Commute Time by Sex in Jeffersonville
The most common commute times in Jeffersonville are 45 to 59 minutes (68 commuters, 28.8%) for males and 45 to 59 minutes (40 commuters, 25.5%) for females.
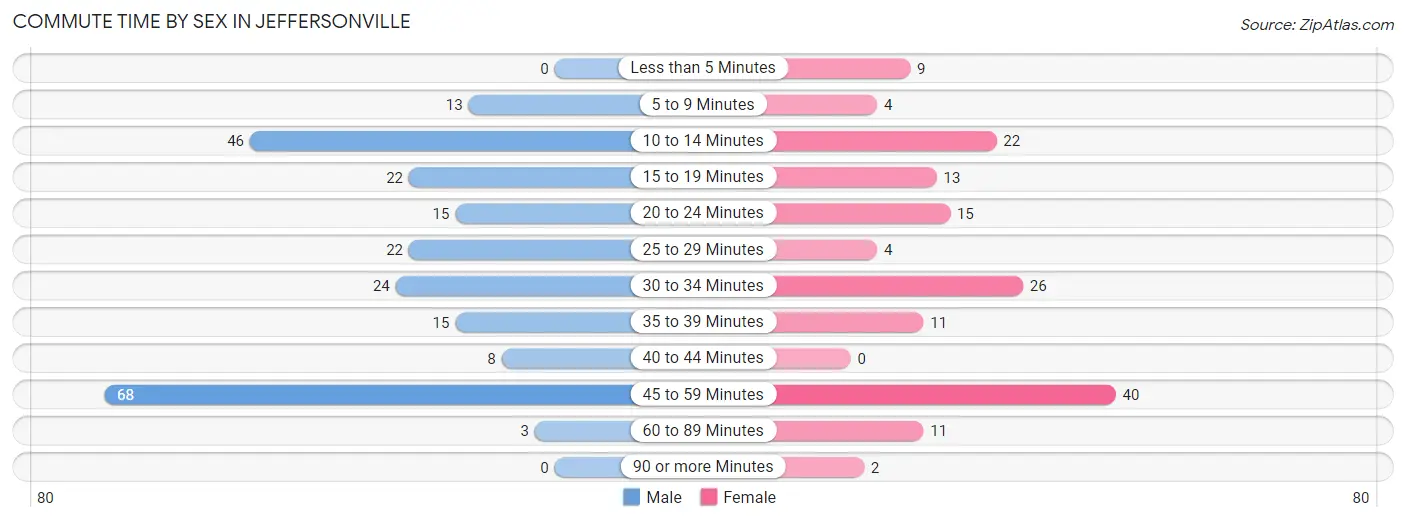
| Commute Time | Male | Female |
| Less than 5 Minutes | 0 (0.0%) | 9 (5.7%) |
| 5 to 9 Minutes | 13 (5.5%) | 4 (2.5%) |
| 10 to 14 Minutes | 46 (19.5%) | 22 (14.0%) |
| 15 to 19 Minutes | 22 (9.3%) | 13 (8.3%) |
| 20 to 24 Minutes | 15 (6.4%) | 15 (9.6%) |
| 25 to 29 Minutes | 22 (9.3%) | 4 (2.5%) |
| 30 to 34 Minutes | 24 (10.2%) | 26 (16.6%) |
| 35 to 39 Minutes | 15 (6.4%) | 11 (7.0%) |
| 40 to 44 Minutes | 8 (3.4%) | 0 (0.0%) |
| 45 to 59 Minutes | 68 (28.8%) | 40 (25.5%) |
| 60 to 89 Minutes | 3 (1.3%) | 11 (7.0%) |
| 90 or more Minutes | 0 (0.0%) | 2 (1.3%) |
Time of Departure to Work by Sex in Jeffersonville
The most frequent times of departure to work in Jeffersonville are 7:30 AM to 7:59 AM (48, 20.3%) for males and 7:00 AM to 7:29 AM (55, 35.0%) for females.
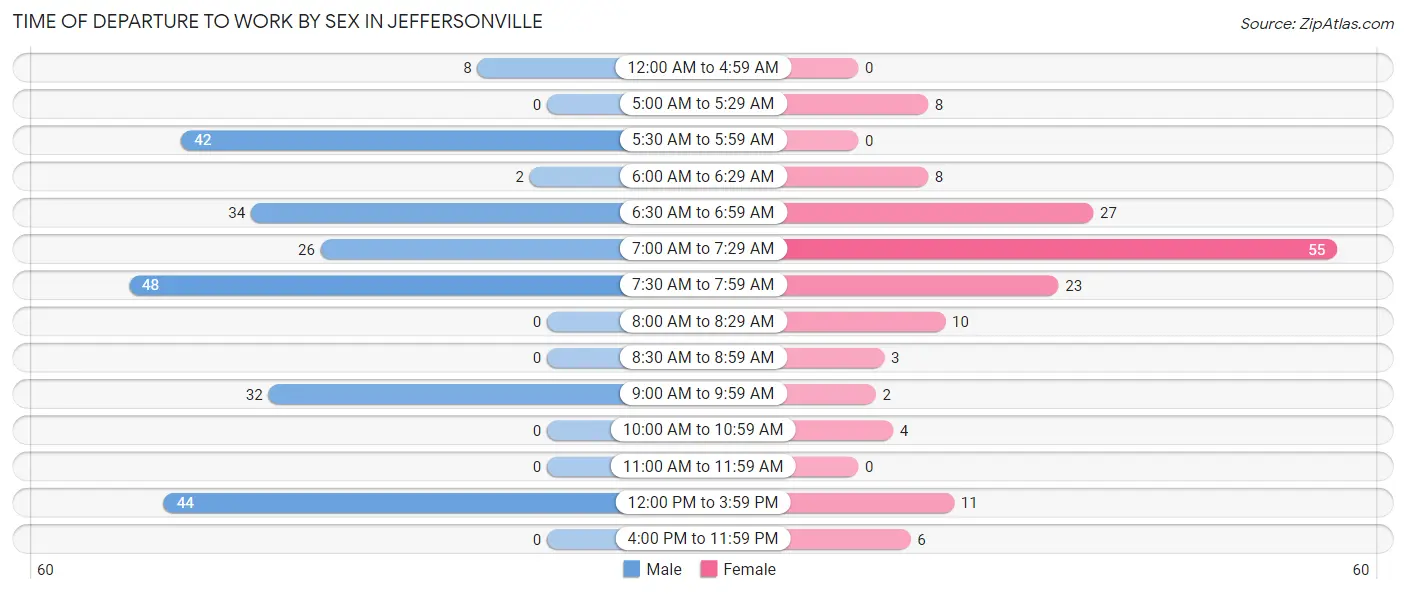
| Time of Departure | Male | Female |
| 12:00 AM to 4:59 AM | 8 (3.4%) | 0 (0.0%) |
| 5:00 AM to 5:29 AM | 0 (0.0%) | 8 (5.1%) |
| 5:30 AM to 5:59 AM | 42 (17.8%) | 0 (0.0%) |
| 6:00 AM to 6:29 AM | 2 (0.9%) | 8 (5.1%) |
| 6:30 AM to 6:59 AM | 34 (14.4%) | 27 (17.2%) |
| 7:00 AM to 7:29 AM | 26 (11.0%) | 55 (35.0%) |
| 7:30 AM to 7:59 AM | 48 (20.3%) | 23 (14.6%) |
| 8:00 AM to 8:29 AM | 0 (0.0%) | 10 (6.4%) |
| 8:30 AM to 8:59 AM | 0 (0.0%) | 3 (1.9%) |
| 9:00 AM to 9:59 AM | 32 (13.6%) | 2 (1.3%) |
| 10:00 AM to 10:59 AM | 0 (0.0%) | 4 (2.5%) |
| 11:00 AM to 11:59 AM | 0 (0.0%) | 0 (0.0%) |
| 12:00 PM to 3:59 PM | 44 (18.6%) | 11 (7.0%) |
| 4:00 PM to 11:59 PM | 0 (0.0%) | 6 (3.8%) |
| Total | 236 (100.0%) | 157 (100.0%) |
Housing Occupancy in Jeffersonville
Occupancy by Ownership in Jeffersonville
Of the total 313 dwellings in Jeffersonville, owner-occupied units account for 91 (29.1%), while renter-occupied units make up 222 (70.9%).
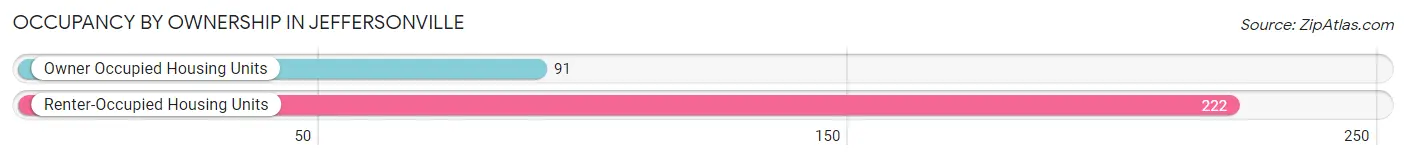
| Occupancy | # Housing Units | % Housing Units |
| Owner Occupied Housing Units | 91 | 29.1% |
| Renter-Occupied Housing Units | 222 | 70.9% |
| Total Occupied Housing Units | 313 | 100.0% |
Occupancy by Household Size in Jeffersonville
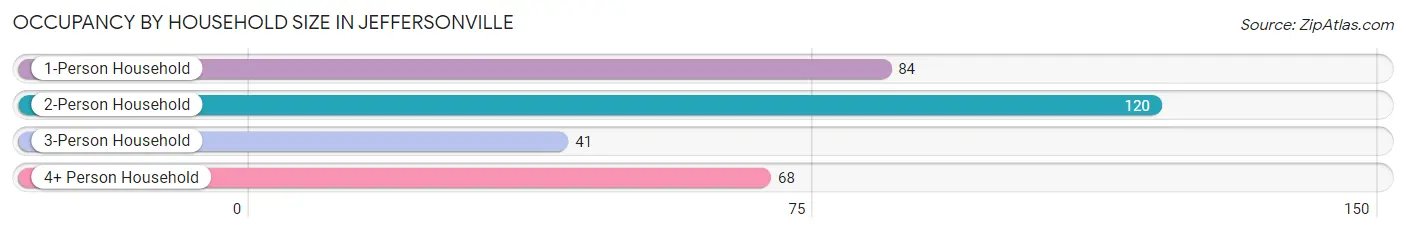
| Household Size | # Housing Units | % Housing Units |
| 1-Person Household | 84 | 26.8% |
| 2-Person Household | 120 | 38.3% |
| 3-Person Household | 41 | 13.1% |
| 4+ Person Household | 68 | 21.7% |
| Total Housing Units | 313 | 100.0% |
Occupancy by Ownership by Household Size in Jeffersonville
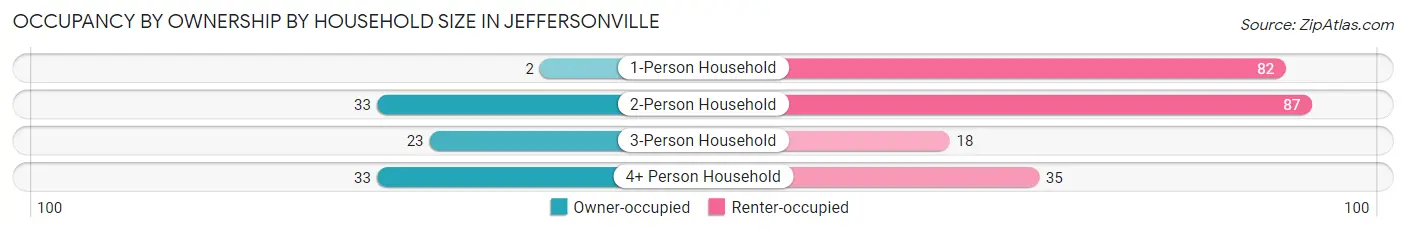
| Household Size | Owner-occupied | Renter-occupied |
| 1-Person Household | 2 (2.4%) | 82 (97.6%) |
| 2-Person Household | 33 (27.5%) | 87 (72.5%) |
| 3-Person Household | 23 (56.1%) | 18 (43.9%) |
| 4+ Person Household | 33 (48.5%) | 35 (51.5%) |
| Total Housing Units | 91 (29.1%) | 222 (70.9%) |
Occupancy by Educational Attainment in Jeffersonville
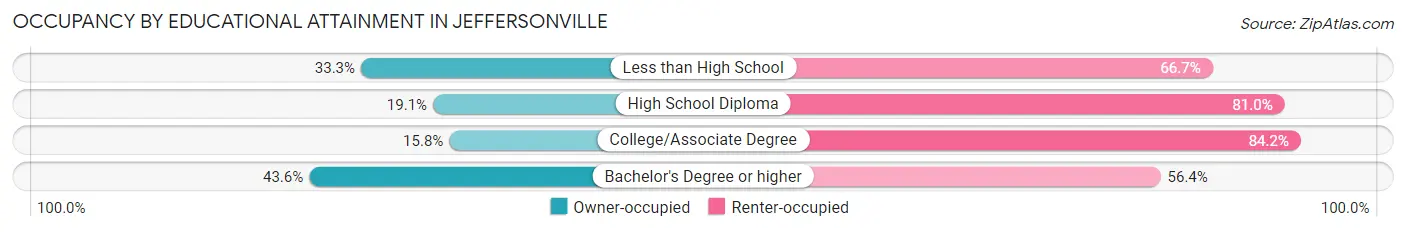
| Household Size | Owner-occupied | Renter-occupied |
| Less than High School | 6 (33.3%) | 12 (66.7%) |
| High School Diploma | 8 (19.1%) | 34 (80.9%) |
| College/Associate Degree | 19 (15.8%) | 101 (84.2%) |
| Bachelor's Degree or higher | 58 (43.6%) | 75 (56.4%) |
Occupancy by Age of Householder in Jeffersonville
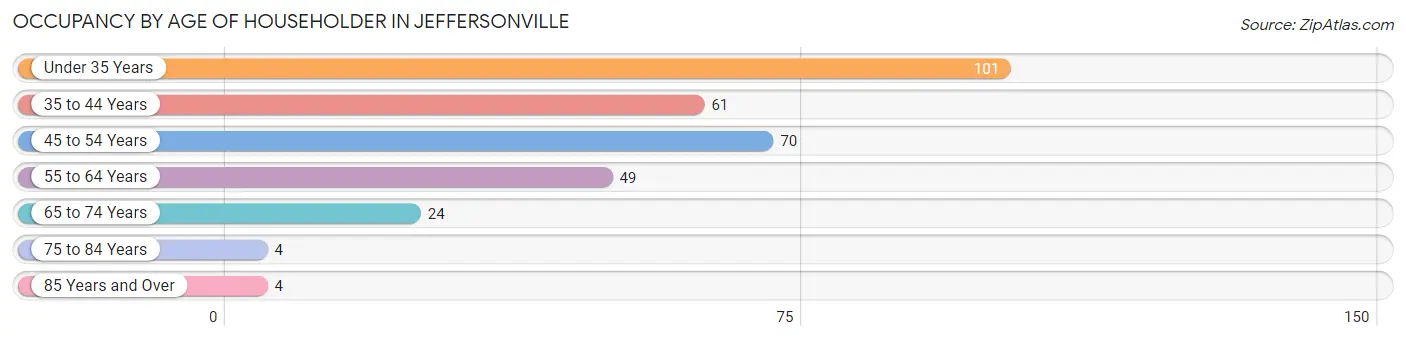
| Age Bracket | # Households | % Households |
| Under 35 Years | 101 | 32.3% |
| 35 to 44 Years | 61 | 19.5% |
| 45 to 54 Years | 70 | 22.4% |
| 55 to 64 Years | 49 | 15.7% |
| 65 to 74 Years | 24 | 7.7% |
| 75 to 84 Years | 4 | 1.3% |
| 85 Years and Over | 4 | 1.3% |
| Total | 313 | 100.0% |
Housing Finances in Jeffersonville
Median Income by Occupancy in Jeffersonville
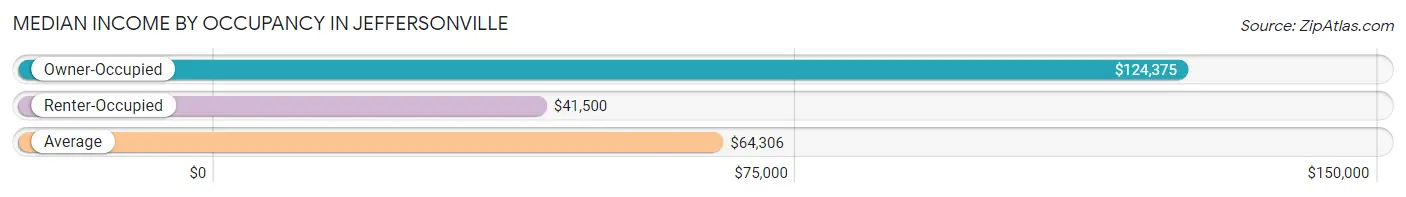
| Occupancy Type | # Households | Median Income |
| Owner-Occupied | 91 (29.1%) | $124,375 |
| Renter-Occupied | 222 (70.9%) | $41,500 |
| Average | 313 (100.0%) | $64,306 |
Occupancy by Householder Income Bracket in Jeffersonville
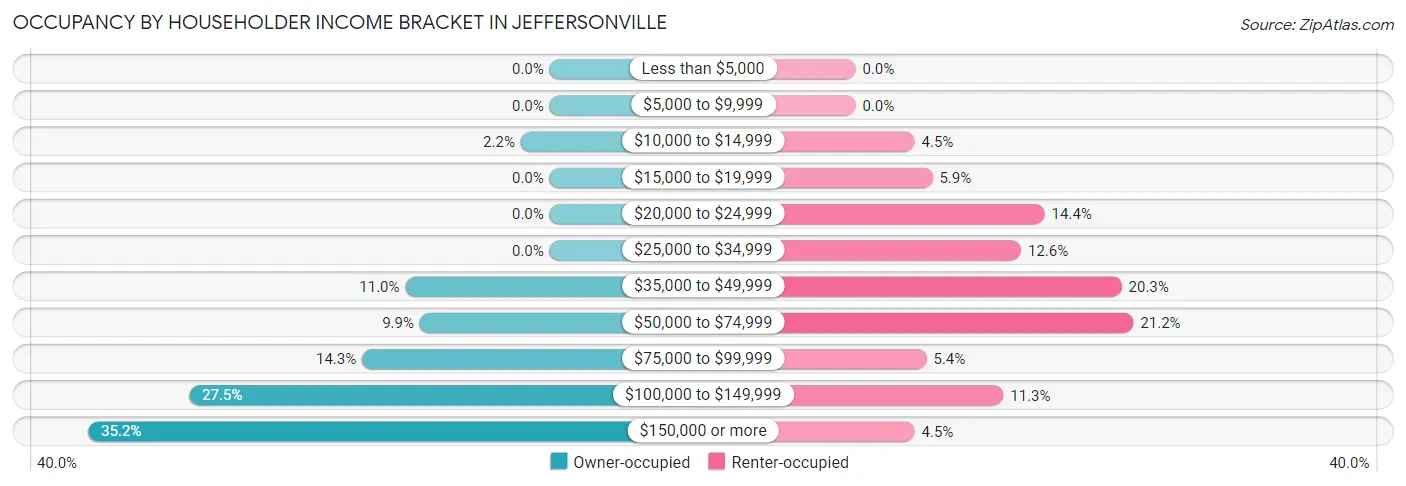
| Income Bracket | Owner-occupied | Renter-occupied |
| Less than $5,000 | 0 (0.0%) | 0 (0.0%) |
| $5,000 to $9,999 | 0 (0.0%) | 0 (0.0%) |
| $10,000 to $14,999 | 2 (2.2%) | 10 (4.5%) |
| $15,000 to $19,999 | 0 (0.0%) | 13 (5.9%) |
| $20,000 to $24,999 | 0 (0.0%) | 32 (14.4%) |
| $25,000 to $34,999 | 0 (0.0%) | 28 (12.6%) |
| $35,000 to $49,999 | 10 (11.0%) | 45 (20.3%) |
| $50,000 to $74,999 | 9 (9.9%) | 47 (21.2%) |
| $75,000 to $99,999 | 13 (14.3%) | 12 (5.4%) |
| $100,000 to $149,999 | 25 (27.5%) | 25 (11.3%) |
| $150,000 or more | 32 (35.2%) | 10 (4.5%) |
| Total | 91 (100.0%) | 222 (100.0%) |
Monthly Housing Cost Tiers in Jeffersonville
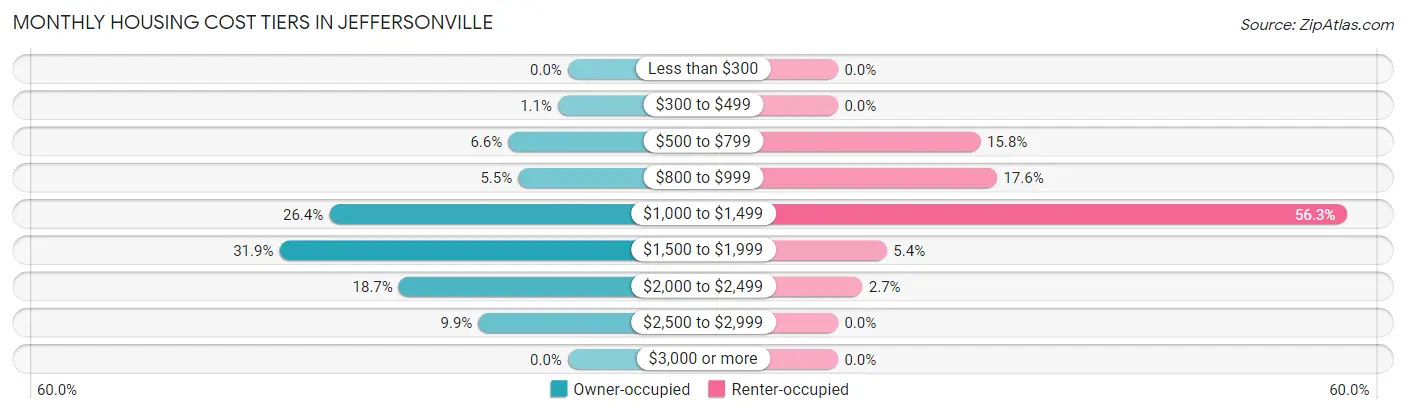
| Monthly Cost | Owner-occupied | Renter-occupied |
| Less than $300 | 0 (0.0%) | 0 (0.0%) |
| $300 to $499 | 1 (1.1%) | 0 (0.0%) |
| $500 to $799 | 6 (6.6%) | 35 (15.8%) |
| $800 to $999 | 5 (5.5%) | 39 (17.6%) |
| $1,000 to $1,499 | 24 (26.4%) | 125 (56.3%) |
| $1,500 to $1,999 | 29 (31.9%) | 12 (5.4%) |
| $2,000 to $2,499 | 17 (18.7%) | 6 (2.7%) |
| $2,500 to $2,999 | 9 (9.9%) | 0 (0.0%) |
| $3,000 or more | 0 (0.0%) | 0 (0.0%) |
| Total | 91 (100.0%) | 222 (100.0%) |
Physical Housing Characteristics in Jeffersonville
Housing Structures in Jeffersonville
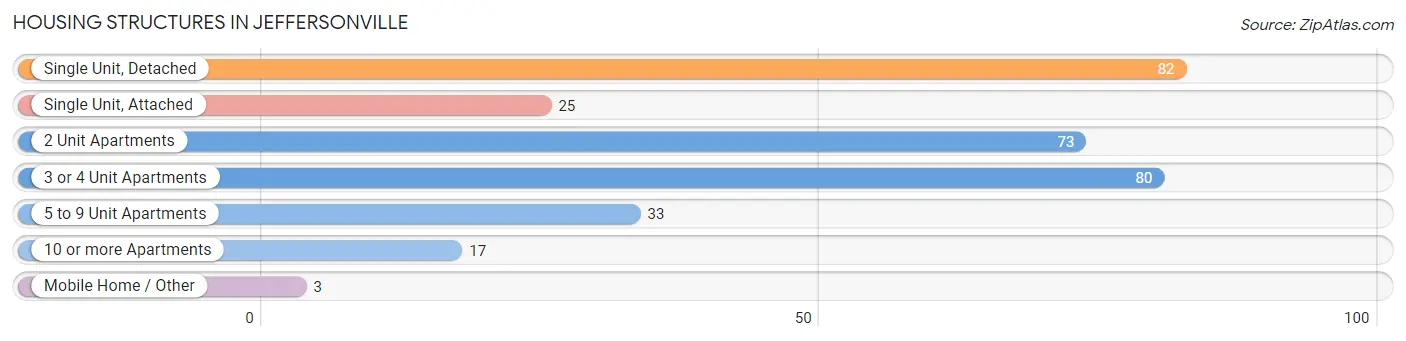
| Structure Type | # Housing Units | % Housing Units |
| Single Unit, Detached | 82 | 26.2% |
| Single Unit, Attached | 25 | 8.0% |
| 2 Unit Apartments | 73 | 23.3% |
| 3 or 4 Unit Apartments | 80 | 25.6% |
| 5 to 9 Unit Apartments | 33 | 10.5% |
| 10 or more Apartments | 17 | 5.4% |
| Mobile Home / Other | 3 | 1.0% |
| Total | 313 | 100.0% |
Housing Structures by Occupancy in Jeffersonville
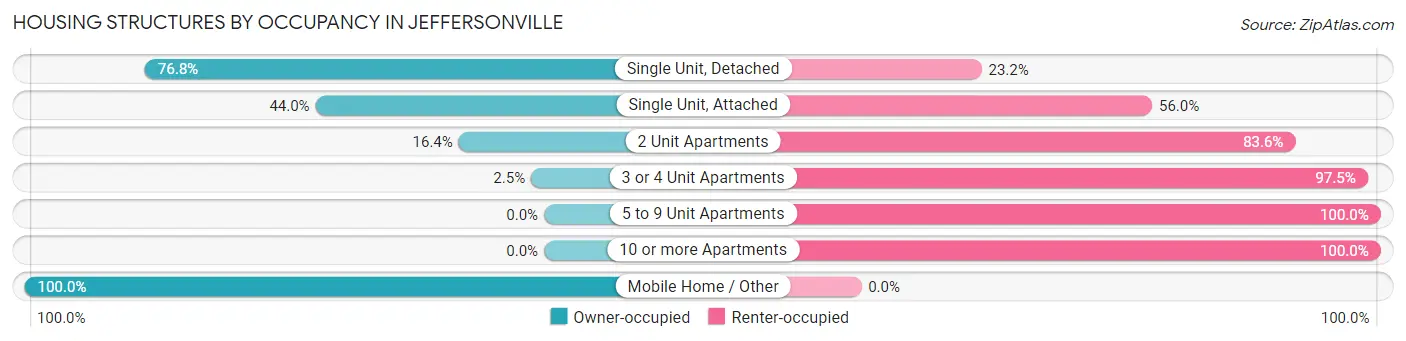
| Structure Type | Owner-occupied | Renter-occupied |
| Single Unit, Detached | 63 (76.8%) | 19 (23.2%) |
| Single Unit, Attached | 11 (44.0%) | 14 (56.0%) |
| 2 Unit Apartments | 12 (16.4%) | 61 (83.6%) |
| 3 or 4 Unit Apartments | 2 (2.5%) | 78 (97.5%) |
| 5 to 9 Unit Apartments | 0 (0.0%) | 33 (100.0%) |
| 10 or more Apartments | 0 (0.0%) | 17 (100.0%) |
| Mobile Home / Other | 3 (100.0%) | 0 (0.0%) |
| Total | 91 (29.1%) | 222 (70.9%) |
Housing Structures by Number of Rooms in Jeffersonville
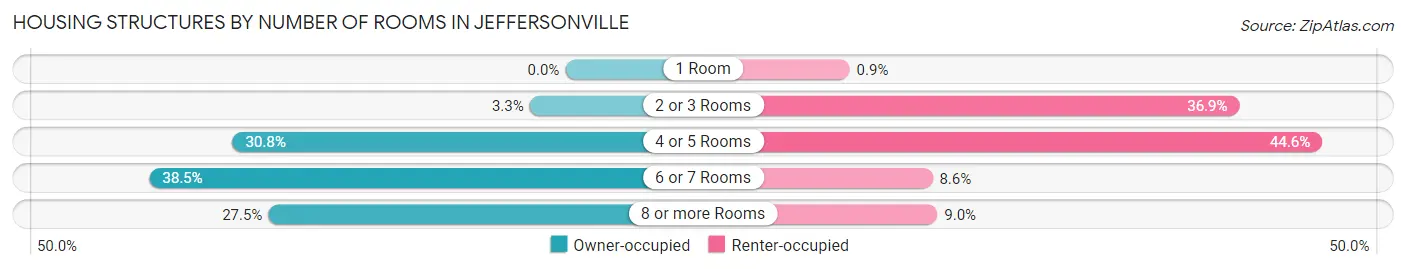
| Number of Rooms | Owner-occupied | Renter-occupied |
| 1 Room | 0 (0.0%) | 2 (0.9%) |
| 2 or 3 Rooms | 3 (3.3%) | 82 (36.9%) |
| 4 or 5 Rooms | 28 (30.8%) | 99 (44.6%) |
| 6 or 7 Rooms | 35 (38.5%) | 19 (8.6%) |
| 8 or more Rooms | 25 (27.5%) | 20 (9.0%) |
| Total | 91 (100.0%) | 222 (100.0%) |
Housing Structure by Heating Type in Jeffersonville
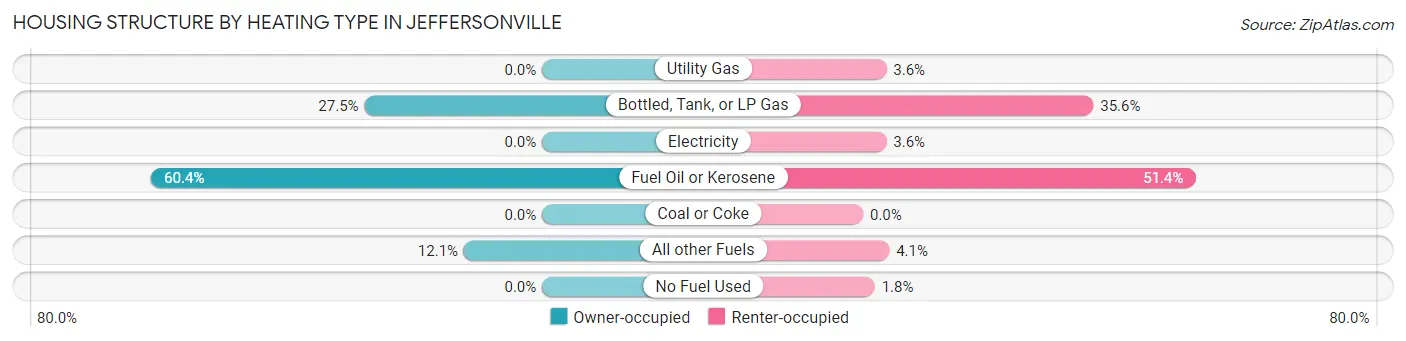
| Heating Type | Owner-occupied | Renter-occupied |
| Utility Gas | 0 (0.0%) | 8 (3.6%) |
| Bottled, Tank, or LP Gas | 25 (27.5%) | 79 (35.6%) |
| Electricity | 0 (0.0%) | 8 (3.6%) |
| Fuel Oil or Kerosene | 55 (60.4%) | 114 (51.3%) |
| Coal or Coke | 0 (0.0%) | 0 (0.0%) |
| All other Fuels | 11 (12.1%) | 9 (4.1%) |
| No Fuel Used | 0 (0.0%) | 4 (1.8%) |
| Total | 91 (100.0%) | 222 (100.0%) |
Household Vehicle Usage in Jeffersonville
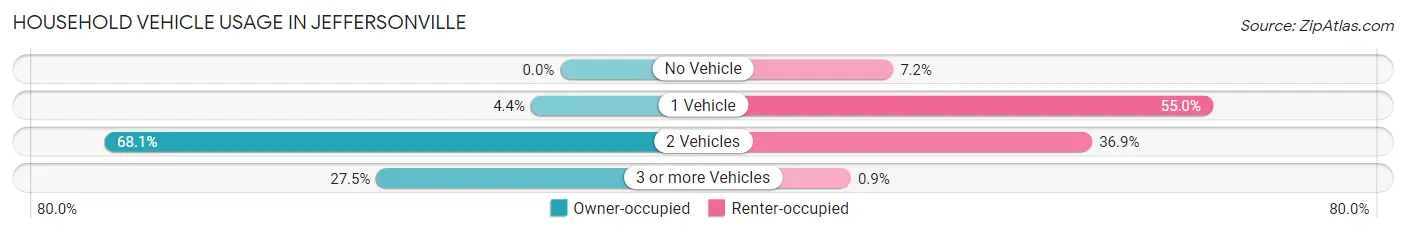
| Vehicles per Household | Owner-occupied | Renter-occupied |
| No Vehicle | 0 (0.0%) | 16 (7.2%) |
| 1 Vehicle | 4 (4.4%) | 122 (54.9%) |
| 2 Vehicles | 62 (68.1%) | 82 (36.9%) |
| 3 or more Vehicles | 25 (27.5%) | 2 (0.9%) |
| Total | 91 (100.0%) | 222 (100.0%) |
Real Estate & Mortgages in Jeffersonville
Real Estate and Mortgage Overview in Jeffersonville
| Characteristic | Without Mortgage | With Mortgage |
| Housing Units | 10 | 81 |
| Median Property Value | $290,000 | $278,800 |
| Median Household Income | - | - |
| Monthly Housing Costs | $800 | $0 |
| Real Estate Taxes | $4,500 | $0 |
Property Value by Mortgage Status in Jeffersonville
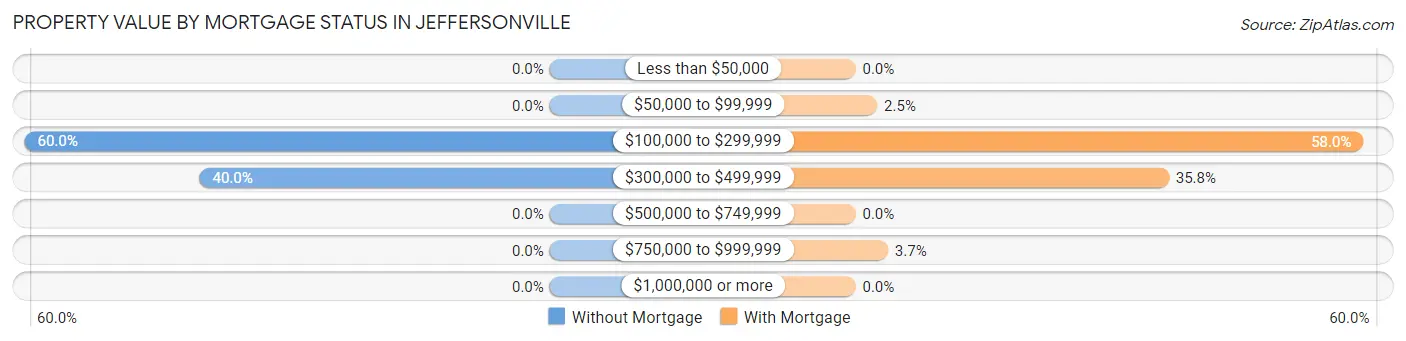
| Property Value | Without Mortgage | With Mortgage |
| Less than $50,000 | 0 (0.0%) | 0 (0.0%) |
| $50,000 to $99,999 | 0 (0.0%) | 2 (2.5%) |
| $100,000 to $299,999 | 6 (60.0%) | 47 (58.0%) |
| $300,000 to $499,999 | 4 (40.0%) | 29 (35.8%) |
| $500,000 to $749,999 | 0 (0.0%) | 0 (0.0%) |
| $750,000 to $999,999 | 0 (0.0%) | 3 (3.7%) |
| $1,000,000 or more | 0 (0.0%) | 0 (0.0%) |
| Total | 10 (100.0%) | 81 (100.0%) |
Household Income by Mortgage Status in Jeffersonville
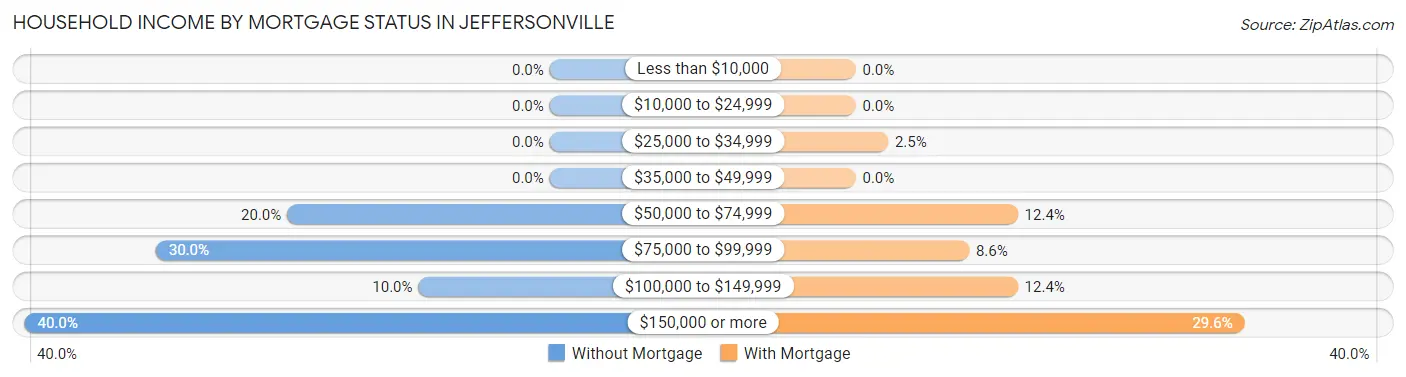
| Household Income | Without Mortgage | With Mortgage |
| Less than $10,000 | 0 (0.0%) | 0 (0.0%) |
| $10,000 to $24,999 | 0 (0.0%) | 0 (0.0%) |
| $25,000 to $34,999 | 0 (0.0%) | 2 (2.5%) |
| $35,000 to $49,999 | 0 (0.0%) | 0 (0.0%) |
| $50,000 to $74,999 | 2 (20.0%) | 10 (12.3%) |
| $75,000 to $99,999 | 3 (30.0%) | 7 (8.6%) |
| $100,000 to $149,999 | 1 (10.0%) | 10 (12.3%) |
| $150,000 or more | 4 (40.0%) | 24 (29.6%) |
| Total | 10 (100.0%) | 81 (100.0%) |
Property Value to Household Income Ratio in Jeffersonville
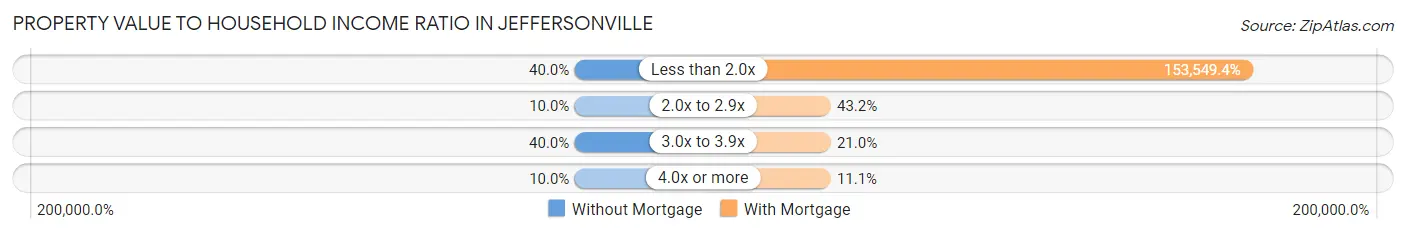
| Value-to-Income Ratio | Without Mortgage | With Mortgage |
| Less than 2.0x | 4 (40.0%) | 124,375 (153,549.4%) |
| 2.0x to 2.9x | 1 (10.0%) | 35 (43.2%) |
| 3.0x to 3.9x | 4 (40.0%) | 17 (21.0%) |
| 4.0x or more | 1 (10.0%) | 9 (11.1%) |
| Total | 10 (100.0%) | 81 (100.0%) |
Real Estate Taxes by Mortgage Status in Jeffersonville
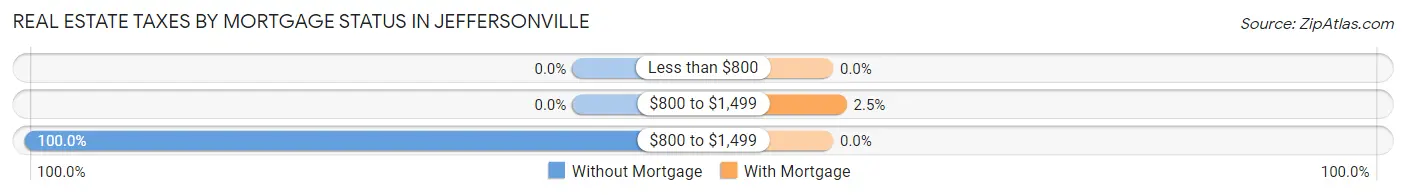
| Property Taxes | Without Mortgage | With Mortgage |
| Less than $800 | 0 (0.0%) | 0 (0.0%) |
| $800 to $1,499 | 0 (0.0%) | 2 (2.5%) |
| $800 to $1,499 | 10 (100.0%) | 0 (0.0%) |
| Total | 10 (100.0%) | 81 (100.0%) |
Health & Disability in Jeffersonville
Health Insurance Coverage by Age in Jeffersonville
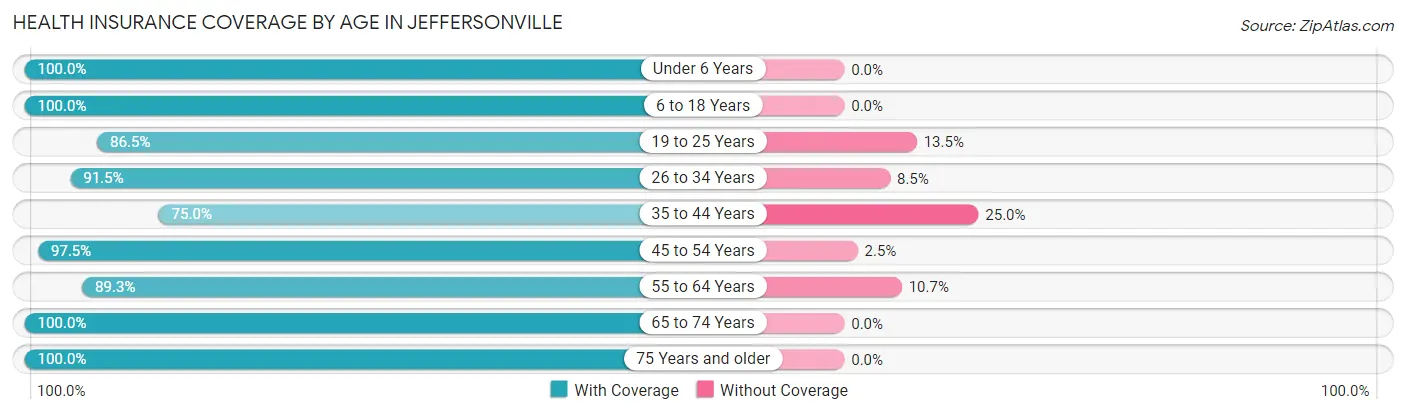
| Age Bracket | With Coverage | Without Coverage |
| Under 6 Years | 51 (100.0%) | 0 (0.0%) |
| 6 to 18 Years | 191 (100.0%) | 0 (0.0%) |
| 19 to 25 Years | 32 (86.5%) | 5 (13.5%) |
| 26 to 34 Years | 118 (91.5%) | 11 (8.5%) |
| 35 to 44 Years | 75 (75.0%) | 25 (25.0%) |
| 45 to 54 Years | 118 (97.5%) | 3 (2.5%) |
| 55 to 64 Years | 50 (89.3%) | 6 (10.7%) |
| 65 to 74 Years | 44 (100.0%) | 0 (0.0%) |
| 75 Years and older | 10 (100.0%) | 0 (0.0%) |
| Total | 689 (93.2%) | 50 (6.8%) |
Health Insurance Coverage by Citizenship Status in Jeffersonville
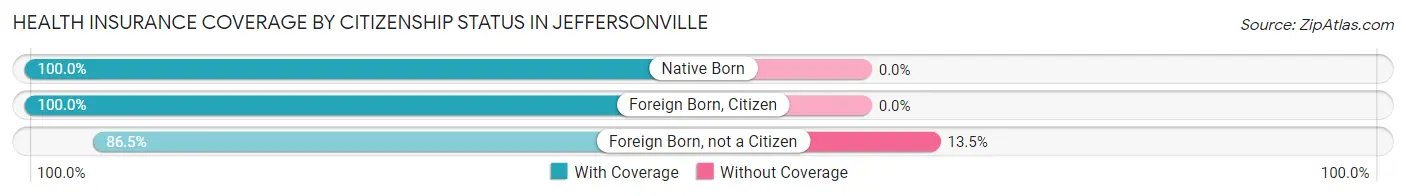
| Citizenship Status | With Coverage | Without Coverage |
| Native Born | 51 (100.0%) | 0 (0.0%) |
| Foreign Born, Citizen | 191 (100.0%) | 0 (0.0%) |
| Foreign Born, not a Citizen | 32 (86.5%) | 5 (13.5%) |
Health Insurance Coverage by Household Income in Jeffersonville
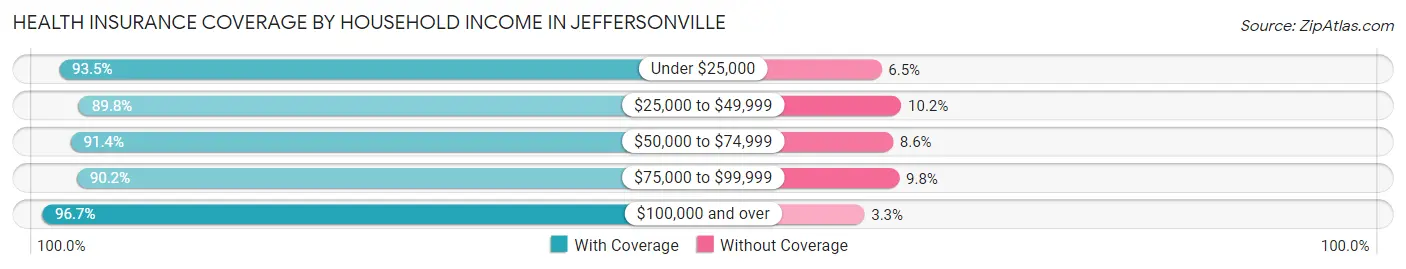
| Household Income | With Coverage | Without Coverage |
| Under $25,000 | 101 (93.5%) | 7 (6.5%) |
| $25,000 to $49,999 | 150 (89.8%) | 17 (10.2%) |
| $50,000 to $74,999 | 127 (91.4%) | 12 (8.6%) |
| $75,000 to $99,999 | 46 (90.2%) | 5 (9.8%) |
| $100,000 and over | 265 (96.7%) | 9 (3.3%) |
Public vs Private Health Insurance Coverage by Age in Jeffersonville
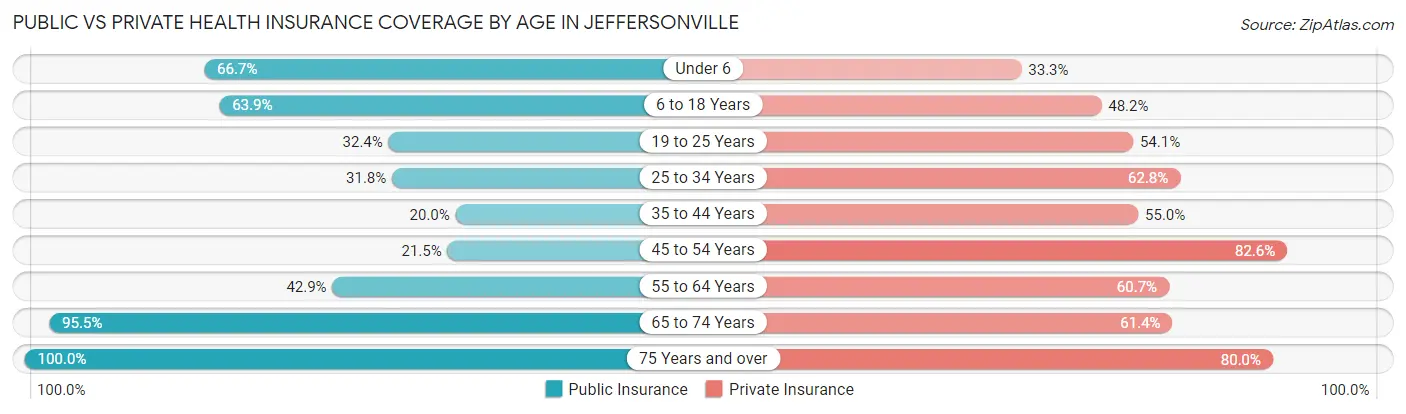
| Age Bracket | Public Insurance | Private Insurance |
| Under 6 | 34 (66.7%) | 17 (33.3%) |
| 6 to 18 Years | 122 (63.9%) | 92 (48.2%) |
| 19 to 25 Years | 12 (32.4%) | 20 (54.0%) |
| 25 to 34 Years | 41 (31.8%) | 81 (62.8%) |
| 35 to 44 Years | 20 (20.0%) | 55 (55.0%) |
| 45 to 54 Years | 26 (21.5%) | 100 (82.6%) |
| 55 to 64 Years | 24 (42.9%) | 34 (60.7%) |
| 65 to 74 Years | 42 (95.5%) | 27 (61.4%) |
| 75 Years and over | 10 (100.0%) | 8 (80.0%) |
| Total | 331 (44.8%) | 434 (58.7%) |
Disability Status by Sex by Age in Jeffersonville
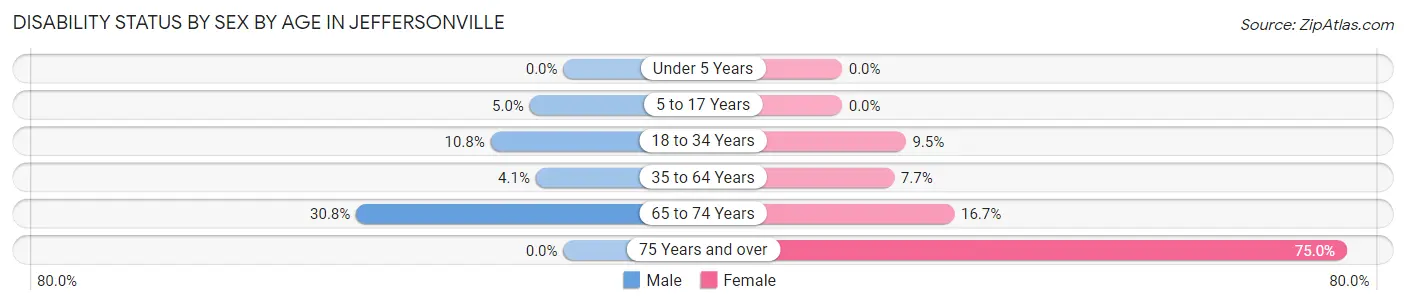
| Age Bracket | Male | Female |
| Under 5 Years | 0 (0.0%) | 0 (0.0%) |
| 5 to 17 Years | 3 (5.0%) | 0 (0.0%) |
| 18 to 34 Years | 16 (10.8%) | 7 (9.5%) |
| 35 to 64 Years | 5 (4.1%) | 12 (7.7%) |
| 65 to 74 Years | 8 (30.8%) | 3 (16.7%) |
| 75 Years and over | 0 (0.0%) | 6 (75.0%) |
Disability Class by Sex by Age in Jeffersonville
Disability Class: Hearing Difficulty
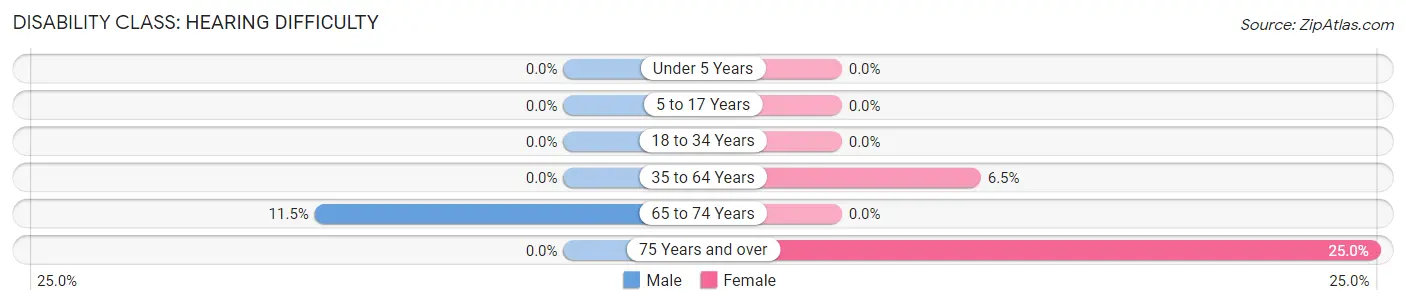
| Age Bracket | Male | Female |
| Under 5 Years | 0 (0.0%) | 0 (0.0%) |
| 5 to 17 Years | 0 (0.0%) | 0 (0.0%) |
| 18 to 34 Years | 0 (0.0%) | 0 (0.0%) |
| 35 to 64 Years | 0 (0.0%) | 10 (6.5%) |
| 65 to 74 Years | 3 (11.5%) | 0 (0.0%) |
| 75 Years and over | 0 (0.0%) | 2 (25.0%) |
Disability Class: Vision Difficulty
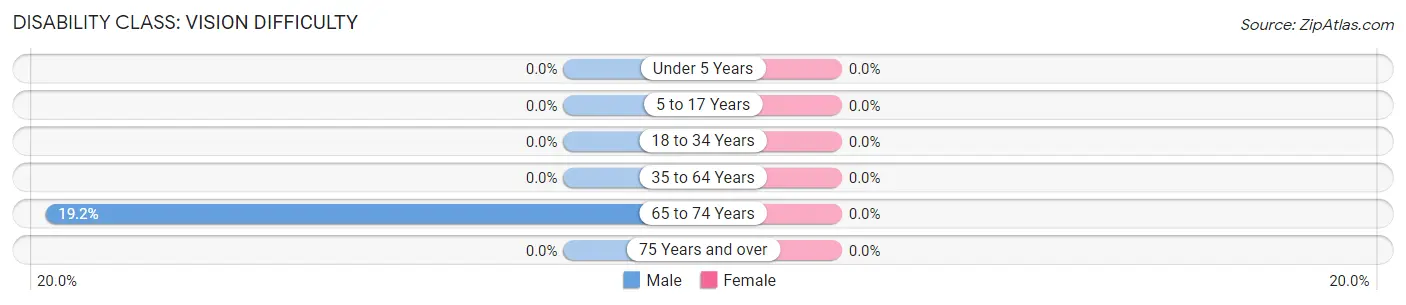
| Age Bracket | Male | Female |
| Under 5 Years | 0 (0.0%) | 0 (0.0%) |
| 5 to 17 Years | 0 (0.0%) | 0 (0.0%) |
| 18 to 34 Years | 0 (0.0%) | 0 (0.0%) |
| 35 to 64 Years | 0 (0.0%) | 0 (0.0%) |
| 65 to 74 Years | 5 (19.2%) | 0 (0.0%) |
| 75 Years and over | 0 (0.0%) | 0 (0.0%) |
Disability Class: Cognitive Difficulty
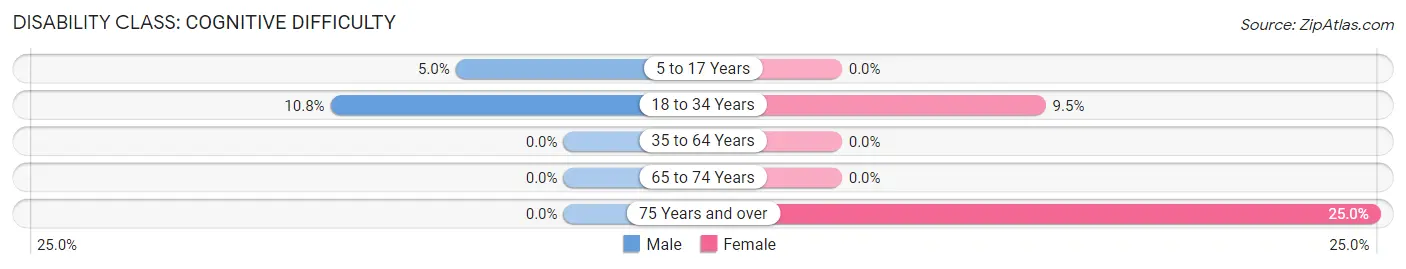
| Age Bracket | Male | Female |
| 5 to 17 Years | 3 (5.0%) | 0 (0.0%) |
| 18 to 34 Years | 16 (10.8%) | 7 (9.5%) |
| 35 to 64 Years | 0 (0.0%) | 0 (0.0%) |
| 65 to 74 Years | 0 (0.0%) | 0 (0.0%) |
| 75 Years and over | 0 (0.0%) | 2 (25.0%) |
Disability Class: Ambulatory Difficulty
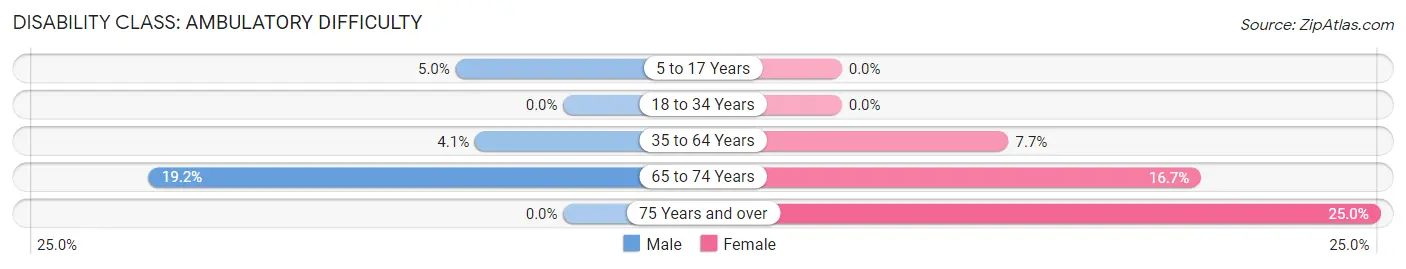
| Age Bracket | Male | Female |
| 5 to 17 Years | 3 (5.0%) | 0 (0.0%) |
| 18 to 34 Years | 0 (0.0%) | 0 (0.0%) |
| 35 to 64 Years | 5 (4.1%) | 12 (7.7%) |
| 65 to 74 Years | 5 (19.2%) | 3 (16.7%) |
| 75 Years and over | 0 (0.0%) | 2 (25.0%) |
Disability Class: Self-Care Difficulty
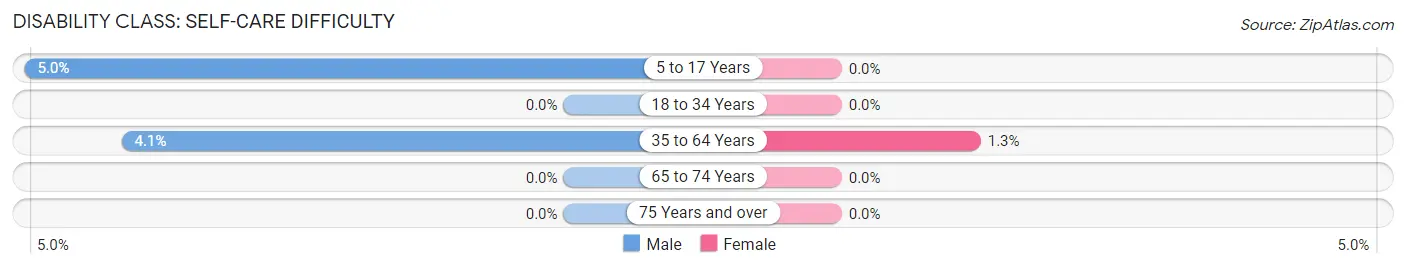
| Age Bracket | Male | Female |
| 5 to 17 Years | 3 (5.0%) | 0 (0.0%) |
| 18 to 34 Years | 0 (0.0%) | 0 (0.0%) |
| 35 to 64 Years | 5 (4.1%) | 2 (1.3%) |
| 65 to 74 Years | 0 (0.0%) | 0 (0.0%) |
| 75 Years and over | 0 (0.0%) | 0 (0.0%) |
Technology Access in Jeffersonville
Computing Device Access in Jeffersonville
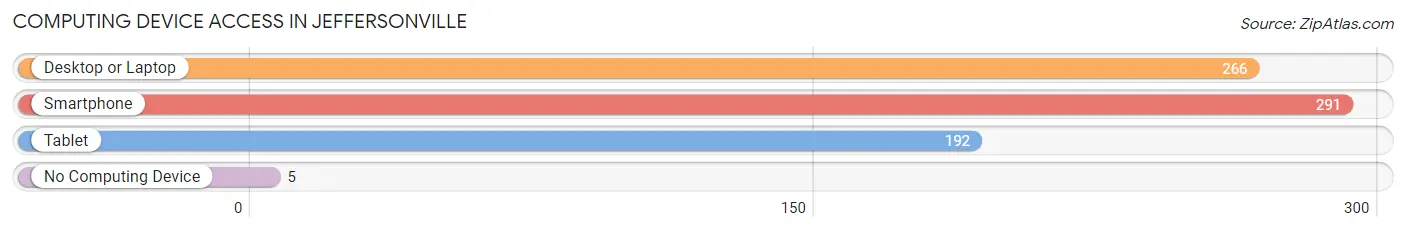
| Device Type | # Households | % Households |
| Desktop or Laptop | 266 | 85.0% |
| Smartphone | 291 | 93.0% |
| Tablet | 192 | 61.3% |
| No Computing Device | 5 | 1.6% |
| Total | 313 | 100.0% |
Internet Access in Jeffersonville
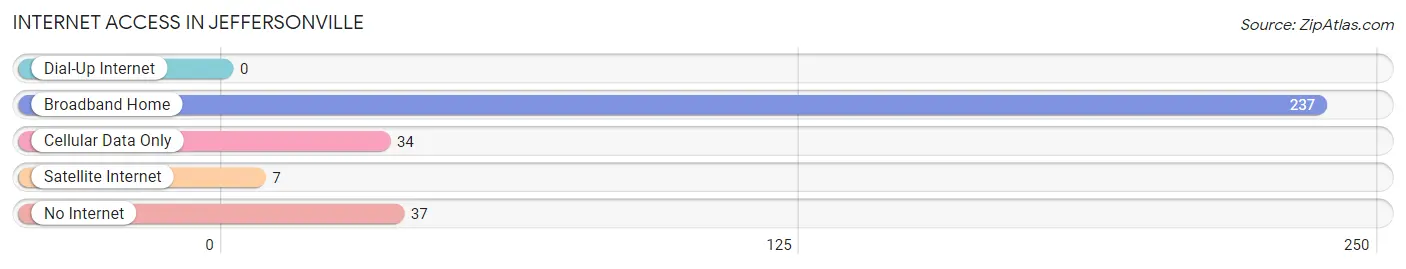
| Internet Type | # Households | % Households |
| Dial-Up Internet | 0 | 0.0% |
| Broadband Home | 237 | 75.7% |
| Cellular Data Only | 34 | 10.9% |
| Satellite Internet | 7 | 2.2% |
| No Internet | 37 | 11.8% |
| Total | 313 | 100.0% |
Jeffersonville Summary
Jeffersonville is a small town located in Lamoille County, Vermont. It is situated in the Green Mountains, and is home to a population of approximately 1,500 people. The town was founded in 1781 and is named after Thomas Jefferson, the third President of the United States.
Geography
Jeffersonville is located in the Green Mountains of Vermont, and is situated in the Lamoille Valley. The town is bordered by Cambridge to the north, Johnson to the east, Waterville to the south, and Belvidere to the west. The town is located at an elevation of 1,000 feet above sea level. The town is home to several small lakes, including Lake Elmore, Lake Eden, and Lake Lamoille. The Lamoille River runs through the town, and is a popular spot for fishing and swimming.
Climate
Jeffersonville has a humid continental climate, with cold winters and warm summers. The average temperature in the winter is around 20 degrees Fahrenheit, and the average temperature in the summer is around 70 degrees Fahrenheit. The town receives an average of 40 inches of precipitation per year, with most of it falling in the form of snow.
Demographics
As of the 2010 census, the population of Jeffersonville was 1,521. The racial makeup of the town was 97.3% White, 0.3% African American, 0.2% Native American, 0.3% Asian, 0.1% Pacific Islander, 0.3% from other races, and 1.4% from two or more races. Hispanic or Latino of any race were 1.2% of the population.
Economy
Jeffersonville is a small, rural town, and the economy is largely based on agriculture and tourism. The town is home to several small farms, and the surrounding area is known for its production of maple syrup. The town is also home to several small businesses, including restaurants, shops, and a few bed and breakfasts.
The town is also home to the Smugglers' Notch ski resort, which is a popular destination for skiing and snowboarding. The resort is located just outside of town, and is a major source of revenue for the town.
Education
Jeffersonville is served by the Lamoille South Supervisory Union, which operates several schools in the area. The town is home to the Jeffersonville Elementary School, which serves students in grades K-6. The town is also home to the Lamoille Union High School, which serves students in grades 7-12.
Conclusion
Jeffersonville is a small town located in the Green Mountains of Vermont. The town is home to a population of approximately 1,500 people, and is known for its agriculture and tourism. The town is served by the Lamoille South Supervisory Union, which operates several schools in the area. The town is also home to the Smugglers' Notch ski resort, which is a popular destination for skiing and snowboarding.
Common Questions
What is Per Capita Income in Jeffersonville?
Per Capita income in Jeffersonville is $37,998.
What is the Median Family Income in Jeffersonville?
Median Family Income in Jeffersonville is $68,472.
What is the Median Household income in Jeffersonville?
Median Household Income in Jeffersonville is $64,306.
What is Income or Wage Gap in Jeffersonville?
Income or Wage Gap in Jeffersonville is 35.9%.
Women in Jeffersonville earn 64.1 cents for every dollar earned by a man.
What is Inequality or Gini Index in Jeffersonville?
Inequality or Gini Index in Jeffersonville is 0.46.
What is the Total Population of Jeffersonville?
Total Population of Jeffersonville is 739.
What is the Total Male Population of Jeffersonville?
Total Male Population of Jeffersonville is 384.
What is the Total Female Population of Jeffersonville?
Total Female Population of Jeffersonville is 355.
What is the Ratio of Males per 100 Females in Jeffersonville?
There are 108.17 Males per 100 Females in Jeffersonville.
What is the Ratio of Females per 100 Males in Jeffersonville?
There are 92.45 Females per 100 Males in Jeffersonville.
What is the Median Population Age in Jeffersonville?
Median Population Age in Jeffersonville is 32.6 Years.
What is the Average Family Size in Jeffersonville
Average Family Size in Jeffersonville is 3.0 People.
What is the Average Household Size in Jeffersonville
Average Household Size in Jeffersonville is 2.4 People.
How Large is the Labor Force in Jeffersonville?
There are 470 People in the Labor Forcein in Jeffersonville.
What is the Percentage of People in the Labor Force in Jeffersonville?
82.7% of People are in the Labor Force in Jeffersonville.
What is the Unemployment Rate in Jeffersonville?
Unemployment Rate in Jeffersonville is 8.5%.