Greensboro, VT Map & Demographics
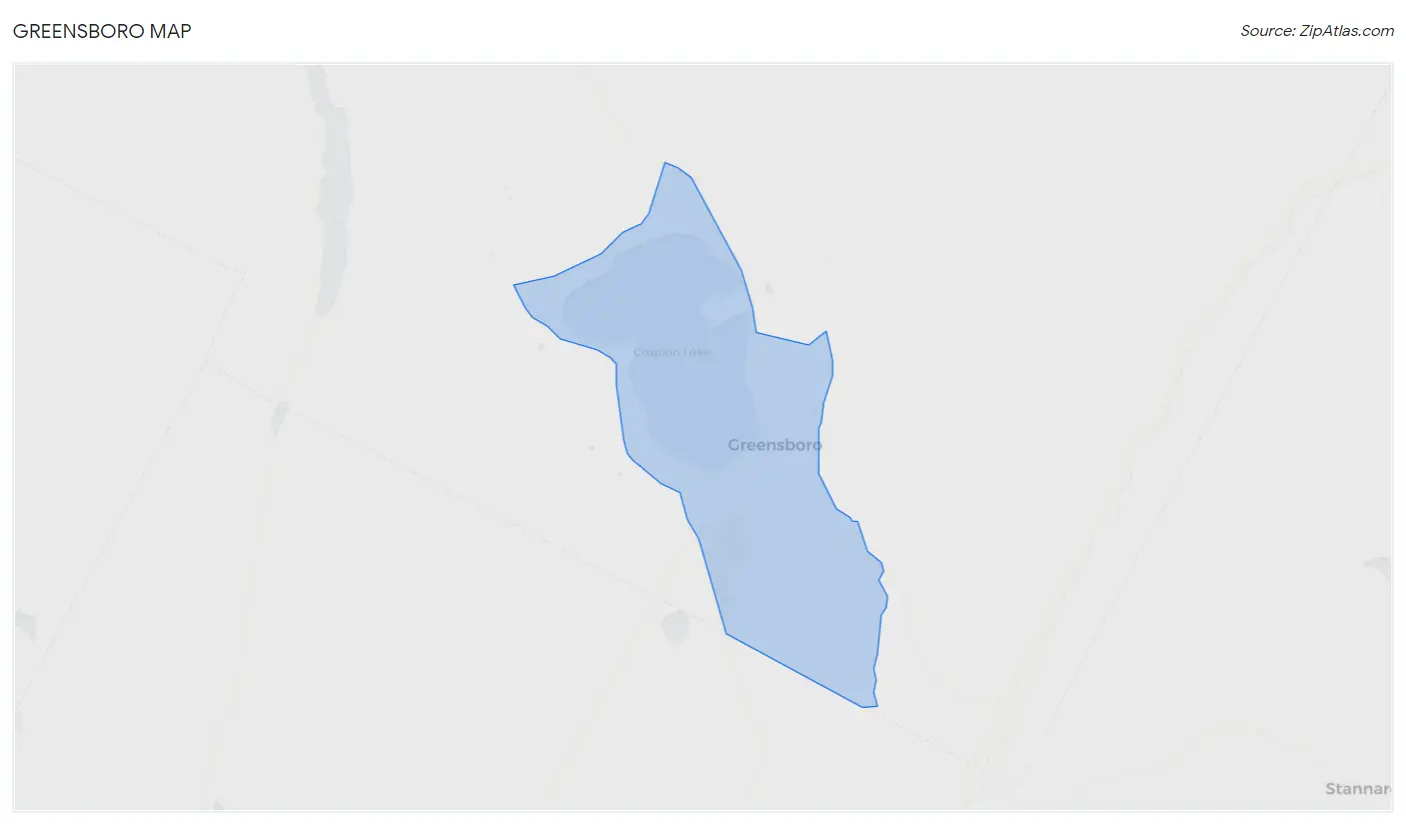
Greensboro Map
Greensboro Overview
$104,751
PER CAPITA INCOME
$178,125
AVG FAMILY INCOME
$85,000
AVG HOUSEHOLD INCOME
3.1%
WAGE / INCOME GAP [ % ]
96.9¢/ $1
WAGE / INCOME GAP [ $ ]
0.60
INEQUALITY / GINI INDEX
102
TOTAL POPULATION
49
MALE POPULATION
53
FEMALE POPULATION
92.45
MALES / 100 FEMALES
108.16
FEMALES / 100 MALES
67.0
MEDIAN AGE
2.6
AVG FAMILY SIZE
1.8
AVG HOUSEHOLD SIZE
42
LABOR FORCE [ PEOPLE ]
41.2%
PERCENT IN LABOR FORCE
Greensboro Zip Codes
Greensboro Area Codes
Income in Greensboro
Income Overview in Greensboro
Per Capita Income in Greensboro is $104,751, while median incomes of families and households are $178,125 and $85,000 respectively.
| Characteristic | Number | Measure |
| Per Capita Income | 102 | $104,751 |
| Median Family Income | 25 | $178,125 |
| Mean Family Income | 25 | $279,888 |
| Median Household Income | 56 | $85,000 |
| Mean Household Income | 56 | $187,438 |
| Income Deficit | 25 | $0 |
| Wage / Income Gap (%) | 102 | 3.05% |
| Wage / Income Gap ($) | 102 | 96.95¢ per $1 |
| Gini / Inequality Index | 102 | 0.60 |
Earnings by Sex in Greensboro
Average Earnings in Greensboro are $43,056, $41,875 for men and $43,194 for women, a difference of 3.0%.
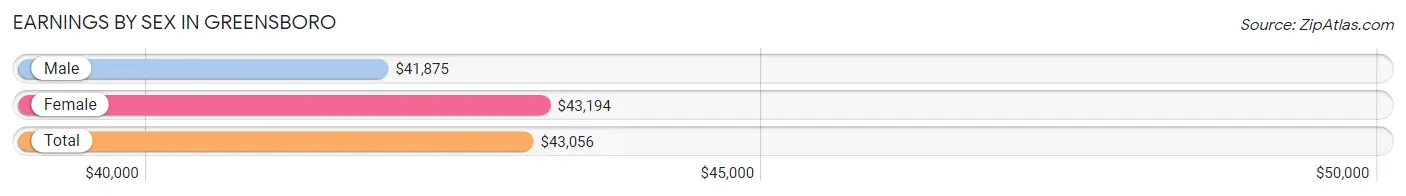
| Sex | Number | Average Earnings |
| Male | 29 (60.4%) | $41,875 |
| Female | 19 (39.6%) | $43,194 |
| Total | 48 (100.0%) | $43,056 |
Earnings by Sex by Income Bracket in Greensboro
The most common earnings brackets in Greensboro are $10,000 to $12,499 for men (10 | 34.5%) and $40,000 to $44,999 for women (9 | 47.4%).
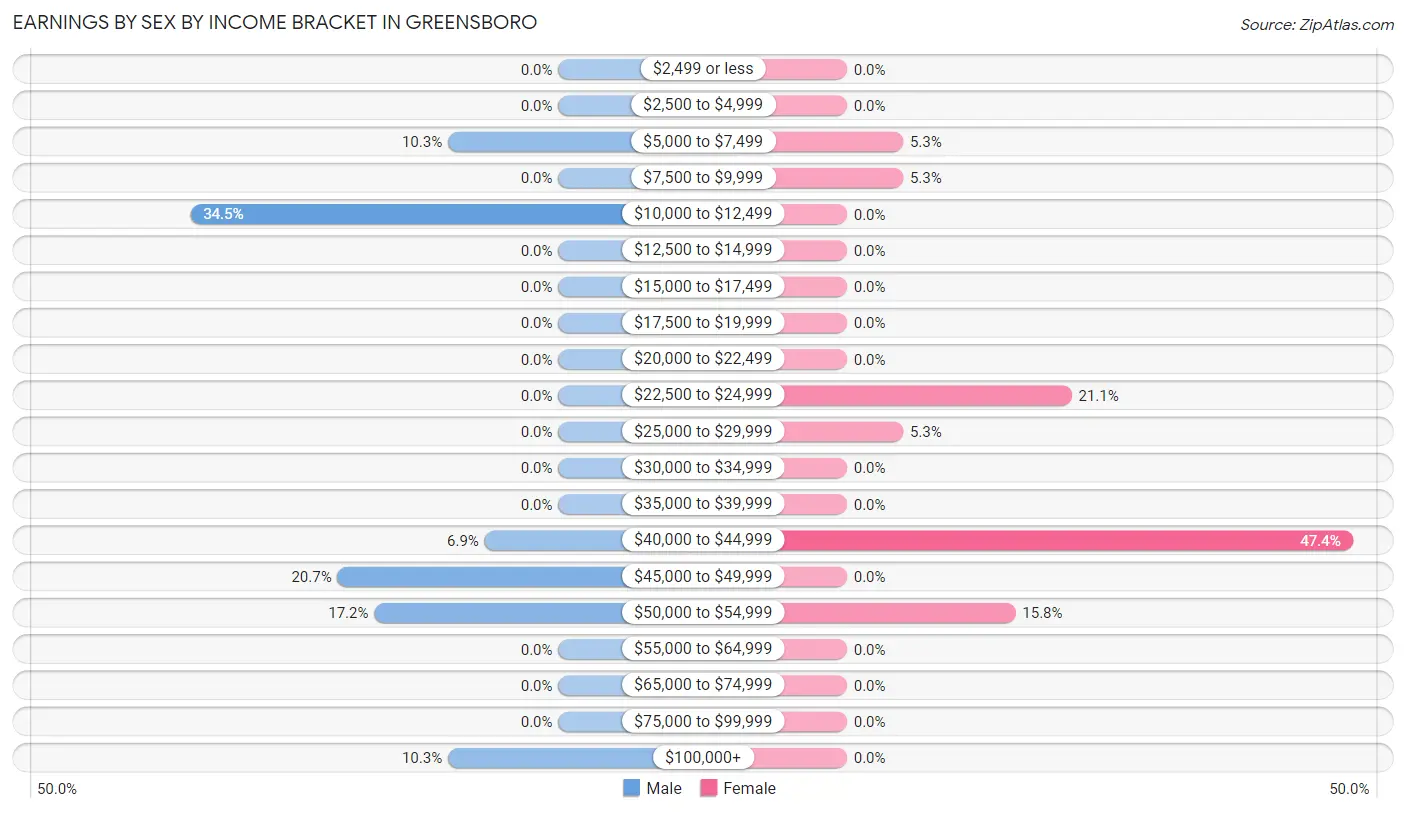
| Income | Male | Female |
| $2,499 or less | 0 (0.0%) | 0 (0.0%) |
| $2,500 to $4,999 | 0 (0.0%) | 0 (0.0%) |
| $5,000 to $7,499 | 3 (10.3%) | 1 (5.3%) |
| $7,500 to $9,999 | 0 (0.0%) | 1 (5.3%) |
| $10,000 to $12,499 | 10 (34.5%) | 0 (0.0%) |
| $12,500 to $14,999 | 0 (0.0%) | 0 (0.0%) |
| $15,000 to $17,499 | 0 (0.0%) | 0 (0.0%) |
| $17,500 to $19,999 | 0 (0.0%) | 0 (0.0%) |
| $20,000 to $22,499 | 0 (0.0%) | 0 (0.0%) |
| $22,500 to $24,999 | 0 (0.0%) | 4 (21.0%) |
| $25,000 to $29,999 | 0 (0.0%) | 1 (5.3%) |
| $30,000 to $34,999 | 0 (0.0%) | 0 (0.0%) |
| $35,000 to $39,999 | 0 (0.0%) | 0 (0.0%) |
| $40,000 to $44,999 | 2 (6.9%) | 9 (47.4%) |
| $45,000 to $49,999 | 6 (20.7%) | 0 (0.0%) |
| $50,000 to $54,999 | 5 (17.2%) | 3 (15.8%) |
| $55,000 to $64,999 | 0 (0.0%) | 0 (0.0%) |
| $65,000 to $74,999 | 0 (0.0%) | 0 (0.0%) |
| $75,000 to $99,999 | 0 (0.0%) | 0 (0.0%) |
| $100,000+ | 3 (10.3%) | 0 (0.0%) |
| Total | 29 (100.0%) | 19 (100.0%) |
Earnings by Sex by Educational Attainment in Greensboro
Average earnings in Greensboro are $46,250 for men and $42,917 for women, a difference of 7.2%. Men with an educational attainment of bachelor's degree enjoy the highest average annual earnings of $41,250, while those with bachelor's degree education earn the least with $41,250. Women with an educational attainment of graduate degree earn the most with the average annual earnings of $44,167, while those with college or associate's degree education have the smallest earnings of $23,125.
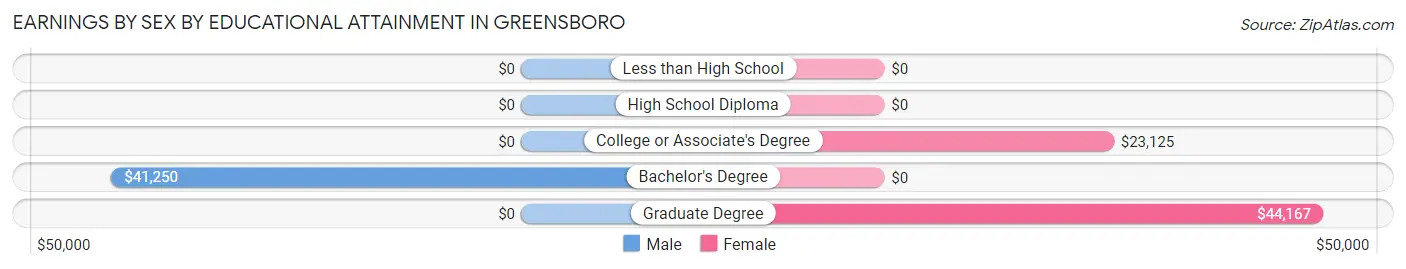
| Educational Attainment | Male Income | Female Income |
| Less than High School | - | - |
| High School Diploma | - | - |
| College or Associate's Degree | - | - |
| Bachelor's Degree | $41,250 | $0 |
| Graduate Degree | - | - |
| Total | $46,250 | $42,917 |
Family Income in Greensboro
Family Income Brackets in Greensboro
According to the Greensboro family income data, there are 8 families falling into the $200,000+ income range, which is the most common income bracket and makes up 32.0% of all families.
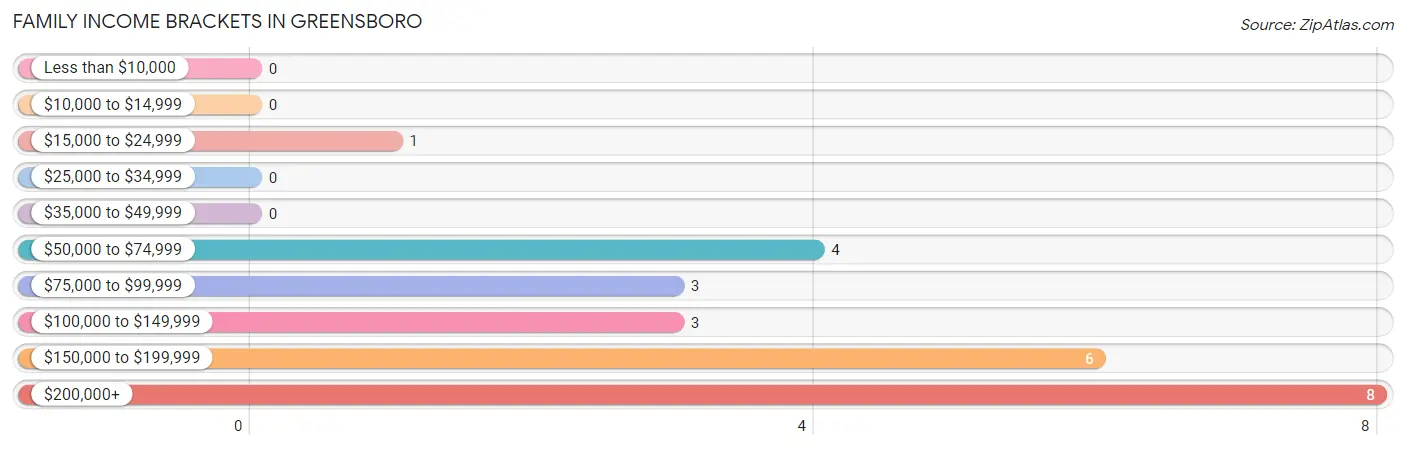
| Income Bracket | # Families | % Families |
| Less than $10,000 | 0 | 0.0% |
| $10,000 to $14,999 | 0 | 0.0% |
| $15,000 to $24,999 | 1 | 4.0% |
| $25,000 to $34,999 | 0 | 0.0% |
| $35,000 to $49,999 | 0 | 0.0% |
| $50,000 to $74,999 | 4 | 16.0% |
| $75,000 to $99,999 | 3 | 12.0% |
| $100,000 to $149,999 | 3 | 12.0% |
| $150,000 to $199,999 | 6 | 24.0% |
| $200,000+ | 8 | 32.0% |
Family Income by Famaliy Size in Greensboro
2-person families (18 | 72.0%) account for the highest median family income in Greensboro with $143,750 per family, while 2-person families (18 | 72.0%) have the highest median income of $71,875 per family member.
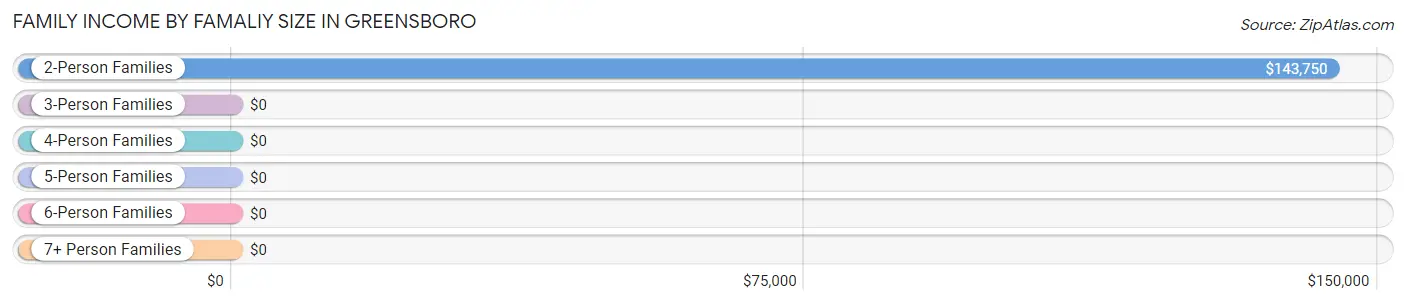
| Income Bracket | # Families | Median Income |
| 2-Person Families | 18 (72.0%) | $143,750 |
| 3-Person Families | 4 (16.0%) | $0 |
| 4-Person Families | 0 (0.0%) | $0 |
| 5-Person Families | 3 (12.0%) | $0 |
| 6-Person Families | 0 (0.0%) | $0 |
| 7+ Person Families | 0 (0.0%) | $0 |
| Total | 25 (100.0%) | $178,125 |
Family Income by Number of Earners in Greensboro
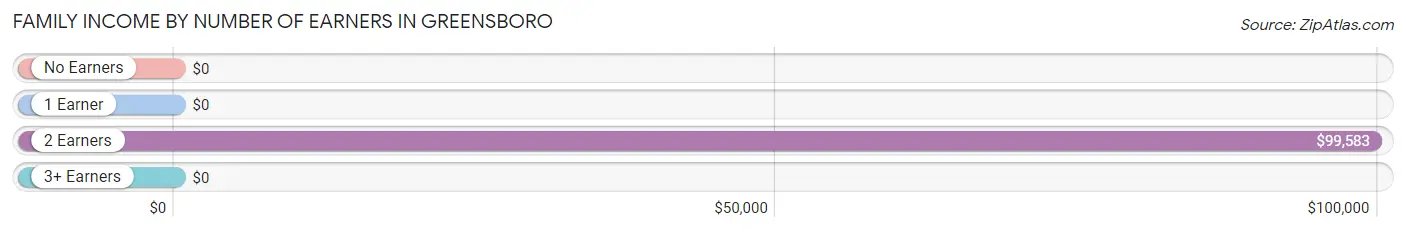
| Number of Earners | # Families | Median Income |
| No Earners | 9 (36.0%) | $0 |
| 1 Earner | 6 (24.0%) | $0 |
| 2 Earners | 7 (28.0%) | $99,583 |
| 3+ Earners | 3 (12.0%) | $0 |
| Total | 25 (100.0%) | $178,125 |
Household Income in Greensboro
Household Income Brackets in Greensboro
With 14 households falling in the category, the $50,000 to $74,999 income range is the most frequent in Greensboro, accounting for 25.0% of all households.
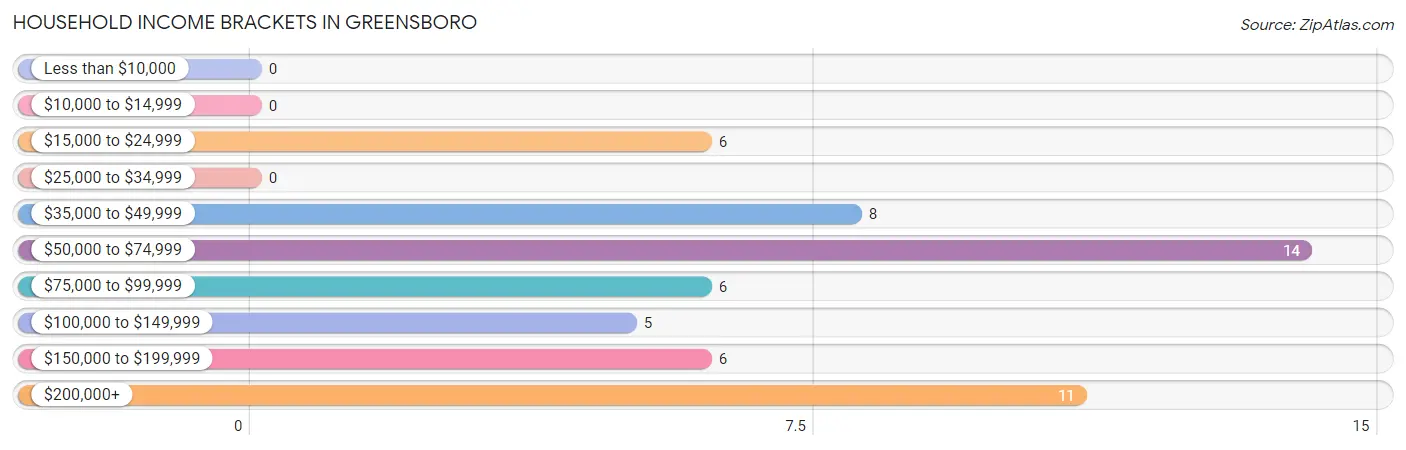
| Income Bracket | # Households | % Households |
| Less than $10,000 | 0 | 0.0% |
| $10,000 to $14,999 | 0 | 0.0% |
| $15,000 to $24,999 | 6 | 10.7% |
| $25,000 to $34,999 | 0 | 0.0% |
| $35,000 to $49,999 | 8 | 14.3% |
| $50,000 to $74,999 | 14 | 25.0% |
| $75,000 to $99,999 | 6 | 10.7% |
| $100,000 to $149,999 | 5 | 8.9% |
| $150,000 to $199,999 | 6 | 10.7% |
| $200,000+ | 11 | 19.6% |
Household Income by Householder Age in Greensboro
| Income Bracket | # Households | Median Income |
| 15 to 24 Years | 3 (5.4%) | $0 |
| 25 to 44 Years | 3 (5.4%) | $0 |
| 45 to 64 Years | 6 (10.7%) | $0 |
| 65+ Years | 44 (78.6%) | $0 |
| Total | 56 (100.0%) | $85,000 |
Poverty in Greensboro
Income Below Poverty by Sex and Age in Greensboro
| Age Bracket | Male | Female |
| Under 5 Years | 0 (0.0%) | 0 (0.0%) |
| 5 Years | 0 (0.0%) | 0 (0.0%) |
| 6 to 11 Years | 0 (0.0%) | 0 (0.0%) |
| 12 to 14 Years | 0 (0.0%) | 0 (0.0%) |
| 15 Years | 0 (0.0%) | 0 (0.0%) |
| 16 and 17 Years | 0 (0.0%) | 0 (0.0%) |
| 18 to 24 Years | 0 (0.0%) | 0 (0.0%) |
| 25 to 34 Years | 0 (0.0%) | 0 (0.0%) |
| 35 to 44 Years | 0 (0.0%) | 0 (0.0%) |
| 45 to 54 Years | 0 (0.0%) | 0 (0.0%) |
| 55 to 64 Years | 0 (0.0%) | 0 (0.0%) |
| 65 to 74 Years | 0 (0.0%) | 0 (0.0%) |
| 75 Years and over | 0 (0.0%) | 0 (0.0%) |
| Total | 0 (0.0%) | 0 (0.0%) |
Income Above Poverty by Sex and Age in Greensboro
According to the poverty statistics in Greensboro, males aged 16 and 17 years and females aged 18 to 24 years are the age groups that are most secure financially, with 100.0% of males and 100.0% of females in these age groups living above the poverty line.
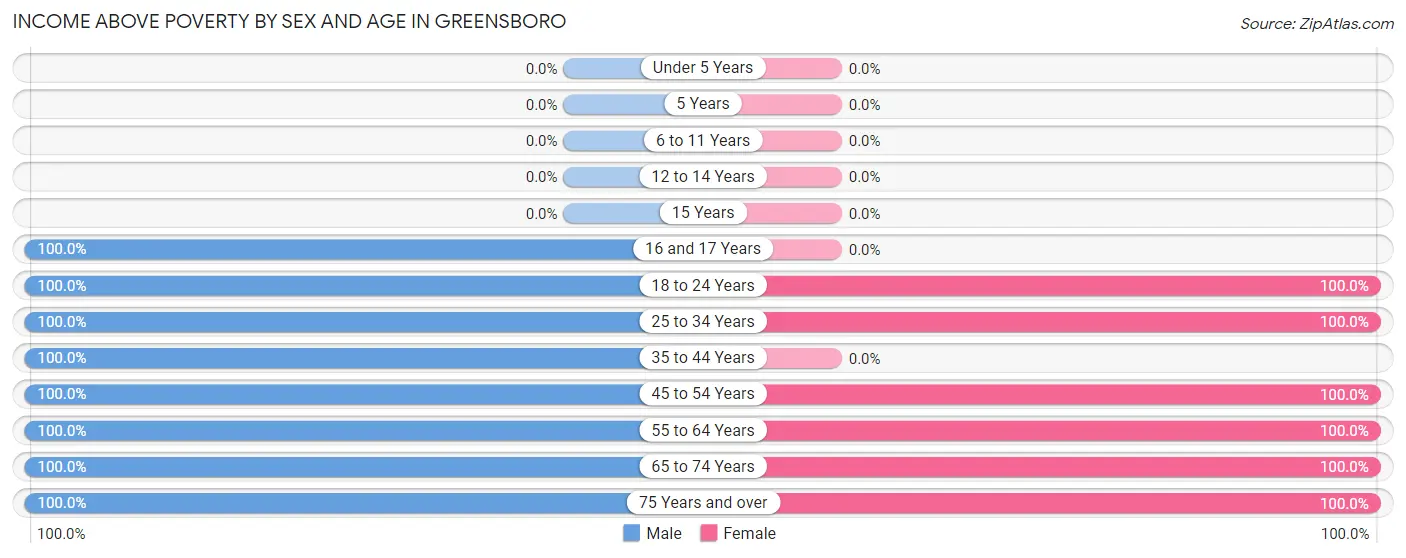
| Age Bracket | Male | Female |
| Under 5 Years | 0 (0.0%) | 0 (0.0%) |
| 5 Years | 0 (0.0%) | 0 (0.0%) |
| 6 to 11 Years | 0 (0.0%) | 0 (0.0%) |
| 12 to 14 Years | 0 (0.0%) | 0 (0.0%) |
| 15 Years | 0 (0.0%) | 0 (0.0%) |
| 16 and 17 Years | 3 (100.0%) | 0 (0.0%) |
| 18 to 24 Years | 14 (100.0%) | 3 (100.0%) |
| 25 to 34 Years | 5 (100.0%) | 3 (100.0%) |
| 35 to 44 Years | 3 (100.0%) | 0 (0.0%) |
| 45 to 54 Years | 3 (100.0%) | 3 (100.0%) |
| 55 to 64 Years | 1 (100.0%) | 3 (100.0%) |
| 65 to 74 Years | 15 (100.0%) | 28 (100.0%) |
| 75 Years and over | 5 (100.0%) | 13 (100.0%) |
| Total | 49 (100.0%) | 53 (100.0%) |
Income Below Poverty Among Married-Couple Families in Greensboro
| Children | Above Poverty | Below Poverty |
| No Children | 19 (100.0%) | 0 (0.0%) |
| 1 or 2 Children | 3 (100.0%) | 0 (0.0%) |
| 3 or 4 Children | 0 (0.0%) | 0 (0.0%) |
| 5 or more Children | 0 (0.0%) | 0 (0.0%) |
| Total | 22 (100.0%) | 0 (0.0%) |
Income Below Poverty Among Single-Parent Households in Greensboro
| Children | Single Father | Single Mother |
| No Children | 0 (0.0%) | 0 (0.0%) |
| 1 or 2 Children | 0 (0.0%) | 0 (0.0%) |
| 3 or 4 Children | 0 (0.0%) | 0 (0.0%) |
| 5 or more Children | 0 (0.0%) | 0 (0.0%) |
| Total | 0 (0.0%) | 0 (0.0%) |
Income Below Poverty Among Married-Couple vs Single-Parent Households in Greensboro
| Children | Married-Couple Families | Single-Parent Households |
| No Children | 0 (0.0%) | 0 (0.0%) |
| 1 or 2 Children | 0 (0.0%) | 0 (0.0%) |
| 3 or 4 Children | 0 (0.0%) | 0 (0.0%) |
| 5 or more Children | 0 (0.0%) | 0 (0.0%) |
| Total | 0 (0.0%) | 0 (0.0%) |
Race in Greensboro
The most populous races in Greensboro are White / Caucasian (96 | 94.1%), Two or more Races (6 | 5.9%), and Hispanic or Latino (5 | 4.9%).
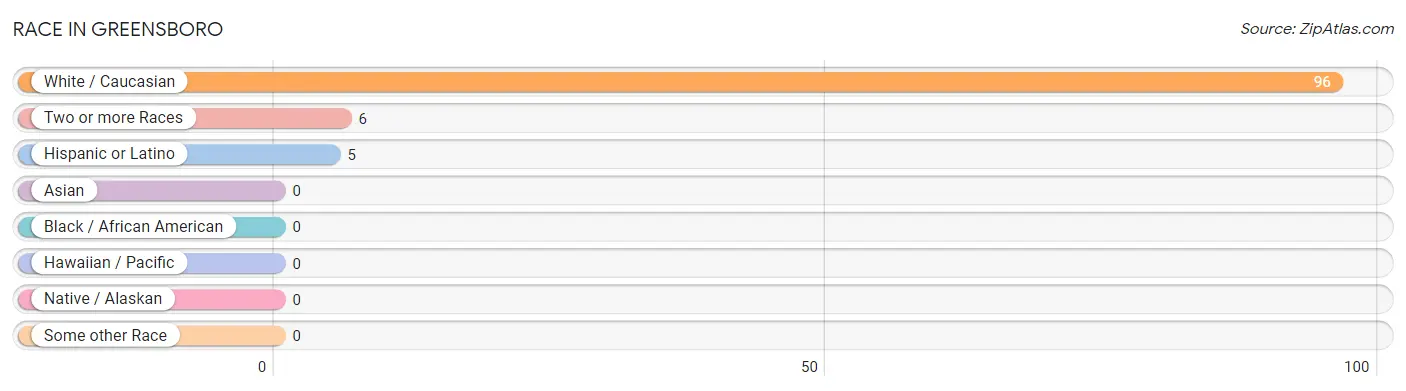
| Race | # Population | % Population |
| Asian | 0 | 0.0% |
| Black / African American | 0 | 0.0% |
| Hawaiian / Pacific | 0 | 0.0% |
| Hispanic or Latino | 5 | 4.9% |
| Native / Alaskan | 0 | 0.0% |
| White / Caucasian | 96 | 94.1% |
| Two or more Races | 6 | 5.9% |
| Some other Race | 0 | 0.0% |
| Total | 102 | 100.0% |
Ancestry in Greensboro
The most populous ancestries reported in Greensboro are English (27 | 26.5%), German (24 | 23.5%), Scottish (17 | 16.7%), Swedish (10 | 9.8%), and French Canadian (9 | 8.8%), together accounting for 85.3% of all Greensboro residents.
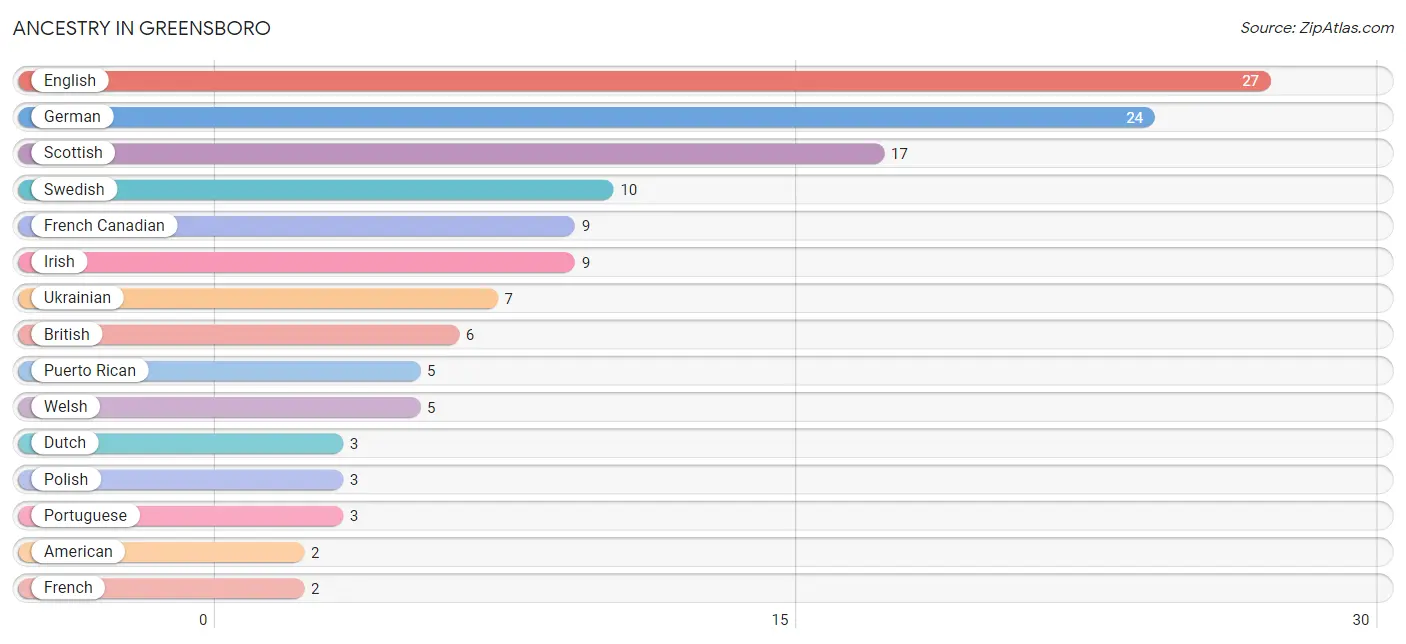
| Ancestry | # Population | % Population |
| American | 2 | 2.0% |
| British | 6 | 5.9% |
| Dutch | 3 | 2.9% |
| English | 27 | 26.5% |
| French | 2 | 2.0% |
| French Canadian | 9 | 8.8% |
| German | 24 | 23.5% |
| Irish | 9 | 8.8% |
| Iroquois | 1 | 1.0% |
| Polish | 3 | 2.9% |
| Portuguese | 3 | 2.9% |
| Puerto Rican | 5 | 4.9% |
| Scottish | 17 | 16.7% |
| Sioux | 1 | 1.0% |
| Swedish | 10 | 9.8% |
| Ukrainian | 7 | 6.9% |
| Welsh | 5 | 4.9% | View All 17 Rows |
Immigrants in Greensboro

| Immigration Origin | # Population | % Population | View All 0 Rows |
Sex and Age in Greensboro
Sex and Age in Greensboro
The most populous age groups in Greensboro are 20 to 24 Years (11 | 22.5%) for men and 70 to 74 Years (17 | 32.1%) for women.
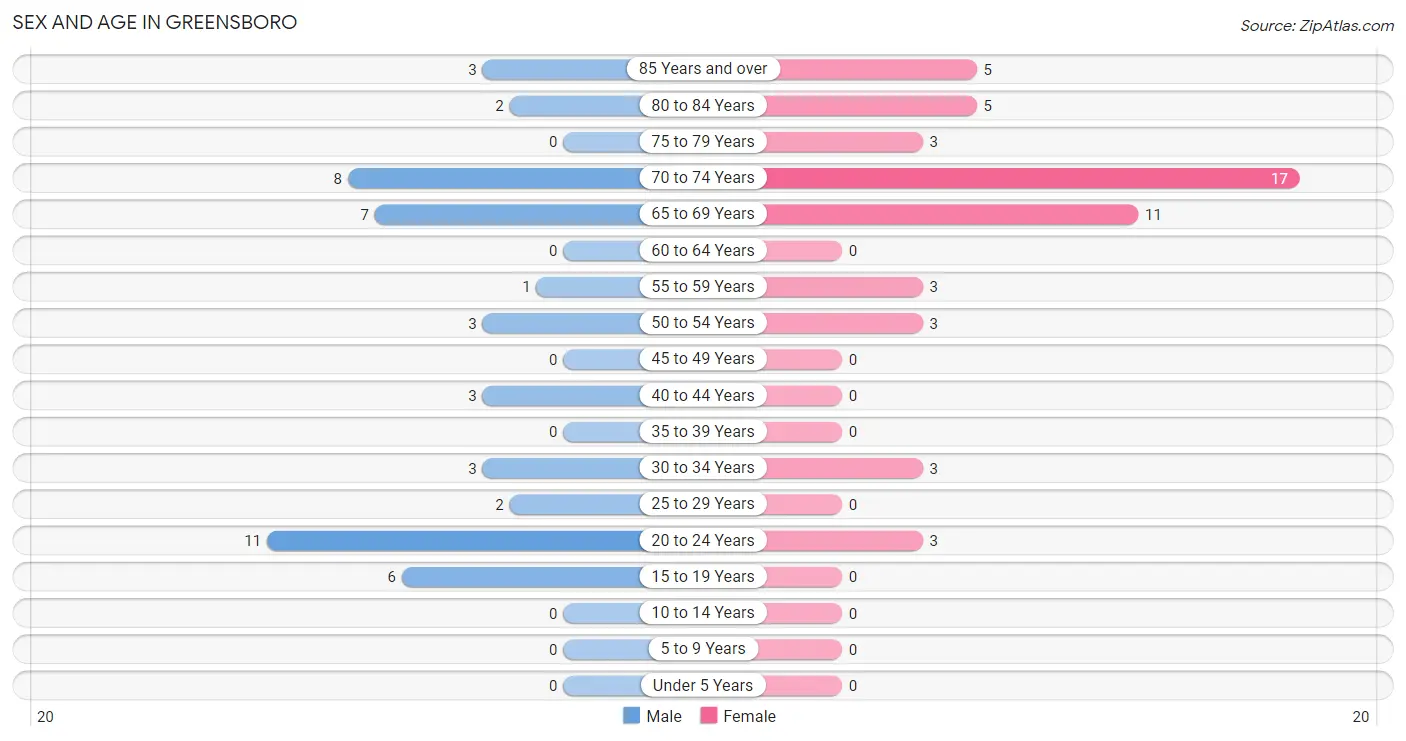
| Age Bracket | Male | Female |
| Under 5 Years | 0 (0.0%) | 0 (0.0%) |
| 5 to 9 Years | 0 (0.0%) | 0 (0.0%) |
| 10 to 14 Years | 0 (0.0%) | 0 (0.0%) |
| 15 to 19 Years | 6 (12.2%) | 0 (0.0%) |
| 20 to 24 Years | 11 (22.5%) | 3 (5.7%) |
| 25 to 29 Years | 2 (4.1%) | 0 (0.0%) |
| 30 to 34 Years | 3 (6.1%) | 3 (5.7%) |
| 35 to 39 Years | 0 (0.0%) | 0 (0.0%) |
| 40 to 44 Years | 3 (6.1%) | 0 (0.0%) |
| 45 to 49 Years | 0 (0.0%) | 0 (0.0%) |
| 50 to 54 Years | 3 (6.1%) | 3 (5.7%) |
| 55 to 59 Years | 1 (2.0%) | 3 (5.7%) |
| 60 to 64 Years | 0 (0.0%) | 0 (0.0%) |
| 65 to 69 Years | 7 (14.3%) | 11 (20.7%) |
| 70 to 74 Years | 8 (16.3%) | 17 (32.1%) |
| 75 to 79 Years | 0 (0.0%) | 3 (5.7%) |
| 80 to 84 Years | 2 (4.1%) | 5 (9.4%) |
| 85 Years and over | 3 (6.1%) | 5 (9.4%) |
| Total | 49 (100.0%) | 53 (100.0%) |
Families and Households in Greensboro
Median Family Size in Greensboro
The median family size in Greensboro is 2.60 persons per family, with single female/mother families (1 | 4.0%) accounting for the largest median family size of 3 persons per family. On the other hand, single male/father families (2 | 8.0%) represent the smallest median family size with 2.50 persons per family.
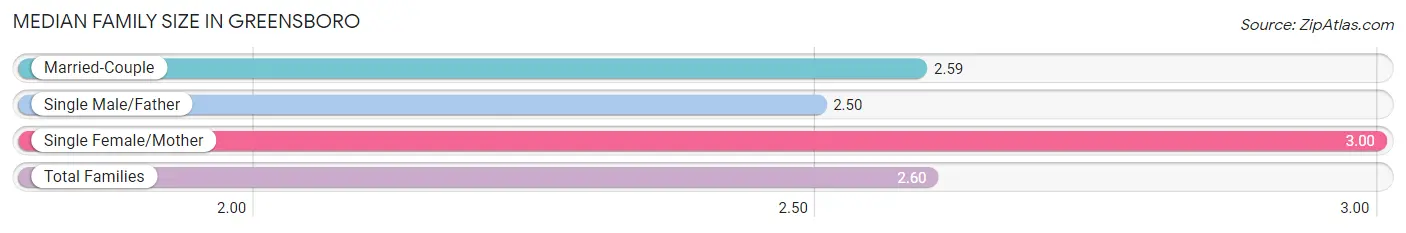
| Family Type | # Families | Family Size |
| Married-Couple | 22 (88.0%) | 2.59 |
| Single Male/Father | 2 (8.0%) | 2.50 |
| Single Female/Mother | 1 (4.0%) | 3.00 |
| Total Families | 25 (100.0%) | 2.60 |
Median Household Size in Greensboro
The median household size in Greensboro is 1.82 persons per household, with single female/mother households (1 | 1.8%) accounting for the largest median household size of 3 persons per household. non-family households (31 | 55.4%) represent the smallest median household size with 1.19 persons per household.
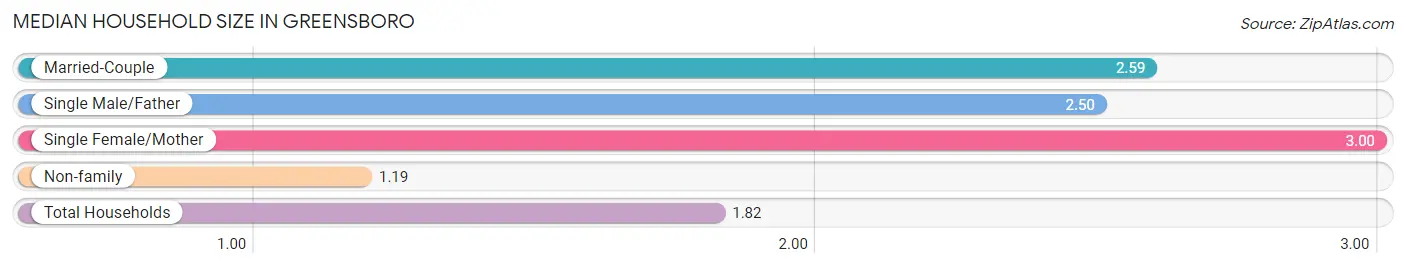
| Household Type | # Households | Household Size |
| Married-Couple | 22 (39.3%) | 2.59 |
| Single Male/Father | 2 (3.6%) | 2.50 |
| Single Female/Mother | 1 (1.8%) | 3.00 |
| Non-family | 31 (55.4%) | 1.19 |
| Total Households | 56 (100.0%) | 1.82 |
Household Size by Marriage Status in Greensboro
Out of a total of 56 households in Greensboro, 25 (44.6%) are family households, while 31 (55.4%) are nonfamily households. The most numerous type of family households are 2-person households, comprising 18, and the most common type of nonfamily households are 1-person households, comprising 27.
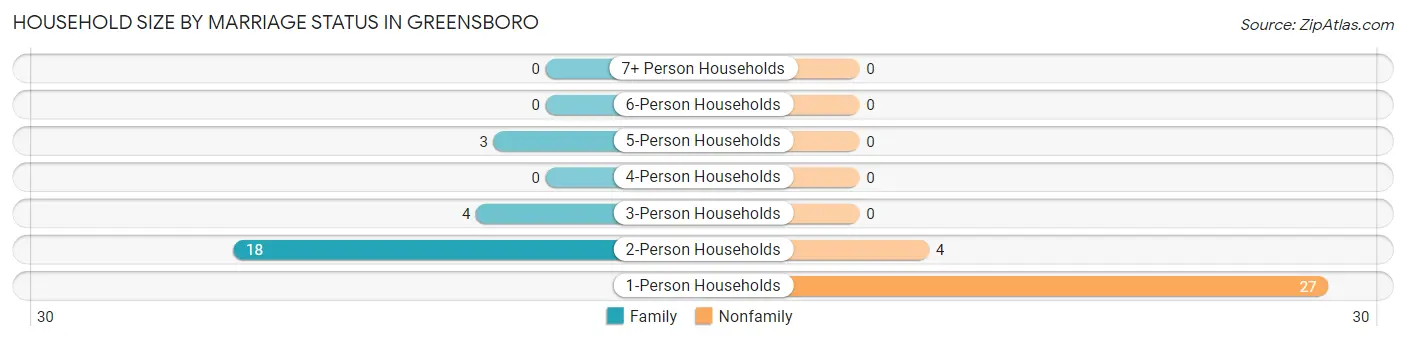
| Household Size | Family Households | Nonfamily Households |
| 1-Person Households | - | 27 (48.2%) |
| 2-Person Households | 18 (32.1%) | 4 (7.1%) |
| 3-Person Households | 4 (7.1%) | 0 (0.0%) |
| 4-Person Households | 0 (0.0%) | 0 (0.0%) |
| 5-Person Households | 3 (5.4%) | 0 (0.0%) |
| 6-Person Households | 0 (0.0%) | 0 (0.0%) |
| 7+ Person Households | 0 (0.0%) | 0 (0.0%) |
| Total | 25 (44.6%) | 31 (55.4%) |
Female Fertility in Greensboro
Fertility by Age in Greensboro
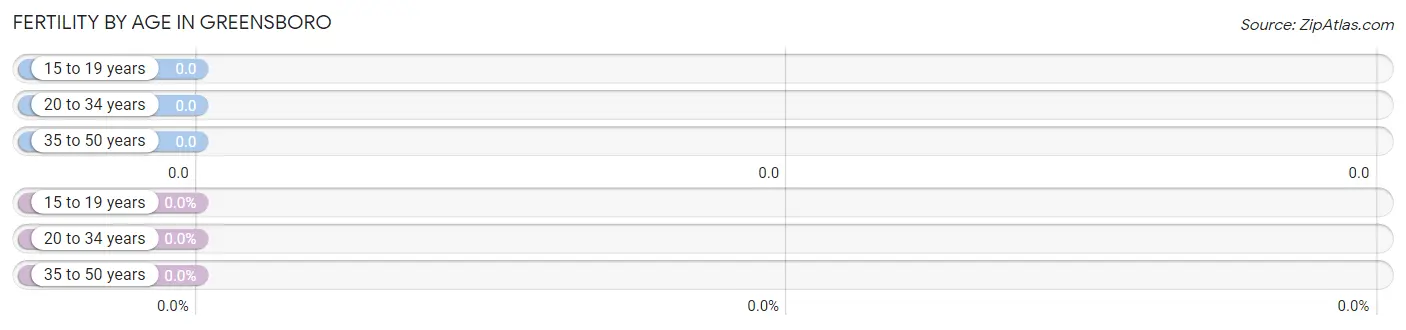
| Age Bracket | Women with Births | Births / 1,000 Women |
| 15 to 19 years | 0 (0.0%) | 0.0 |
| 20 to 34 years | 0 (0.0%) | 0.0 |
| 35 to 50 years | 0 (0.0%) | 0.0 |
| Total | 0 (0.0%) | 0.0 |
Fertility by Age by Marriage Status in Greensboro
| Age Bracket | Married | Unmarried |
| 15 to 19 years | 0 (0.0%) | 0 (0.0%) |
| 20 to 34 years | 0 (0.0%) | 0 (0.0%) |
| 35 to 50 years | 0 (0.0%) | 0 (0.0%) |
| Total | 0 (0.0%) | 0 (0.0%) |
Fertility by Education in Greensboro
| Educational Attainment | Women with Births | Births / 1,000 Women |
| Less than High School | 0 (0.0%) | 0.0 |
| High School Diploma | 0 (0.0%) | 0.0 |
| College or Associate's Degree | 0 (0.0%) | 0.0 |
| Bachelor's Degree | 0 (0.0%) | 0.0 |
| Graduate Degree | 0 (0.0%) | 0.0 |
| Total | 0 (0.0%) | 0.0 |
Fertility by Education by Marriage Status in Greensboro
| Educational Attainment | Married | Unmarried |
| Less than High School | 0 (0.0%) | 0 (0.0%) |
| High School Diploma | 0 (0.0%) | 0 (0.0%) |
| College or Associate's Degree | 0 (0.0%) | 0 (0.0%) |
| Bachelor's Degree | 0 (0.0%) | 0 (0.0%) |
| Graduate Degree | 0 (0.0%) | 0 (0.0%) |
| Total | 0 (0.0%) | 0 (0.0%) |
Employment Characteristics in Greensboro
Employment by Class of Employer in Greensboro
Among the 41 employed individuals in Greensboro, private company employees (15 | 36.6%), local government employees (12 | 29.3%), and not-for-profit organizations (8 | 19.5%) make up the most common classes of employment.
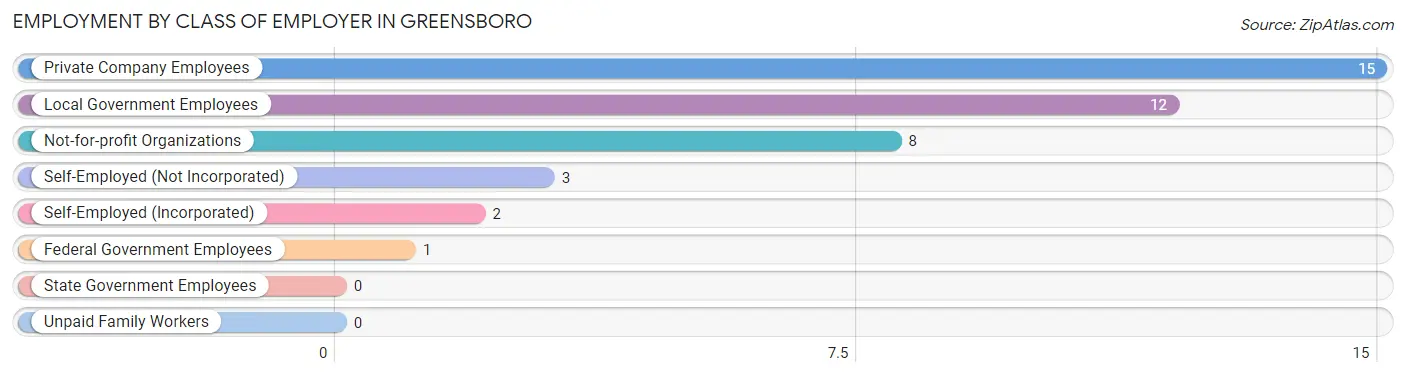
| Employer Class | # Employees | % Employees |
| Private Company Employees | 15 | 36.6% |
| Self-Employed (Incorporated) | 2 | 4.9% |
| Self-Employed (Not Incorporated) | 3 | 7.3% |
| Not-for-profit Organizations | 8 | 19.5% |
| Local Government Employees | 12 | 29.3% |
| State Government Employees | 0 | 0.0% |
| Federal Government Employees | 1 | 2.4% |
| Unpaid Family Workers | 0 | 0.0% |
| Total | 41 | 100.0% |
Employment Status by Age in Greensboro
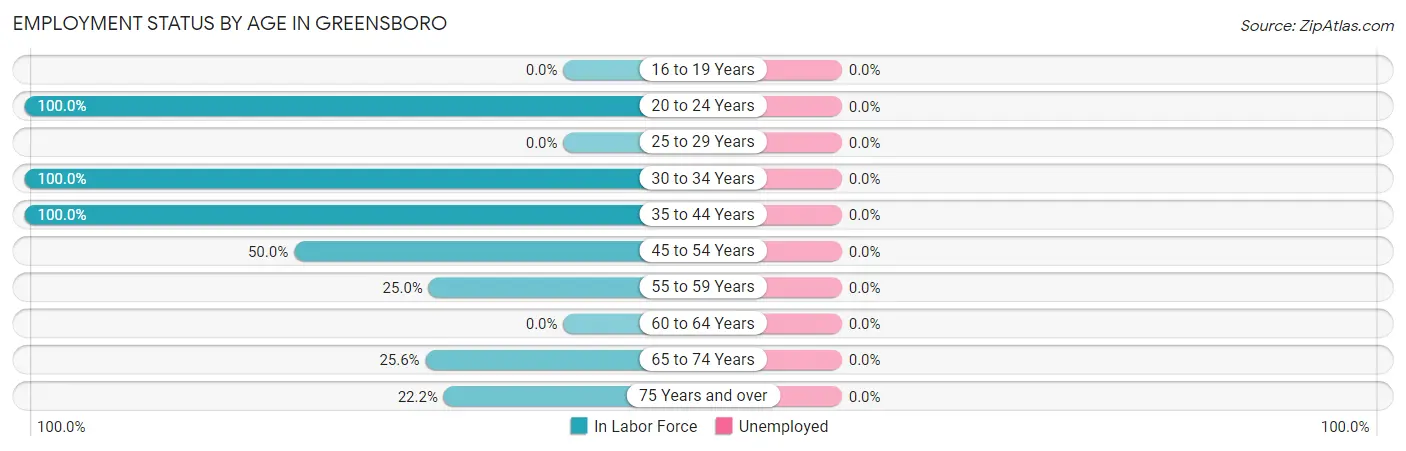
| Age Bracket | In Labor Force | Unemployed |
| 16 to 19 Years | 0 (0.0%) | 0 (0.0%) |
| 20 to 24 Years | 14 (100.0%) | 0 (0.0%) |
| 25 to 29 Years | 0 (0.0%) | 0 (0.0%) |
| 30 to 34 Years | 6 (100.0%) | 0 (0.0%) |
| 35 to 44 Years | 3 (100.0%) | 0 (0.0%) |
| 45 to 54 Years | 3 (50.0%) | 0 (0.0%) |
| 55 to 59 Years | 1 (25.0%) | 0 (0.0%) |
| 60 to 64 Years | 0 (0.0%) | 0 (0.0%) |
| 65 to 74 Years | 11 (25.6%) | 0 (0.0%) |
| 75 Years and over | 4 (22.2%) | 0 (0.0%) |
| Total | 42 (41.2%) | 0 (0.0%) |
Employment Status by Educational Attainment in Greensboro
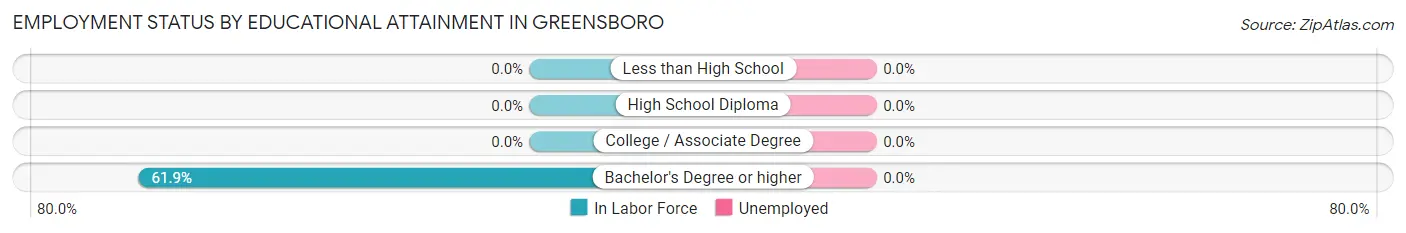
| Educational Attainment | In Labor Force | Unemployed |
| Less than High School | 0 (0.0%) | 0 (0.0%) |
| High School Diploma | 0 (0.0%) | 0 (0.0%) |
| College / Associate Degree | 0 (0.0%) | 0 (0.0%) |
| Bachelor's Degree or higher | 13 (61.9%) | 0 (0.0%) |
| Total | 13 (61.9%) | 0 (0.0%) |
Employment Occupations by Sex in Greensboro
Management, Business, Science and Arts Occupations
The most common Management, Business, Science and Arts occupations in Greensboro are Community & Social Service (20 | 47.6%), Education Instruction & Library (12 | 28.6%), Business & Financial (6 | 14.3%), Computers, Engineering & Science (6 | 14.3%), and Computers & Mathematics (5 | 11.9%).
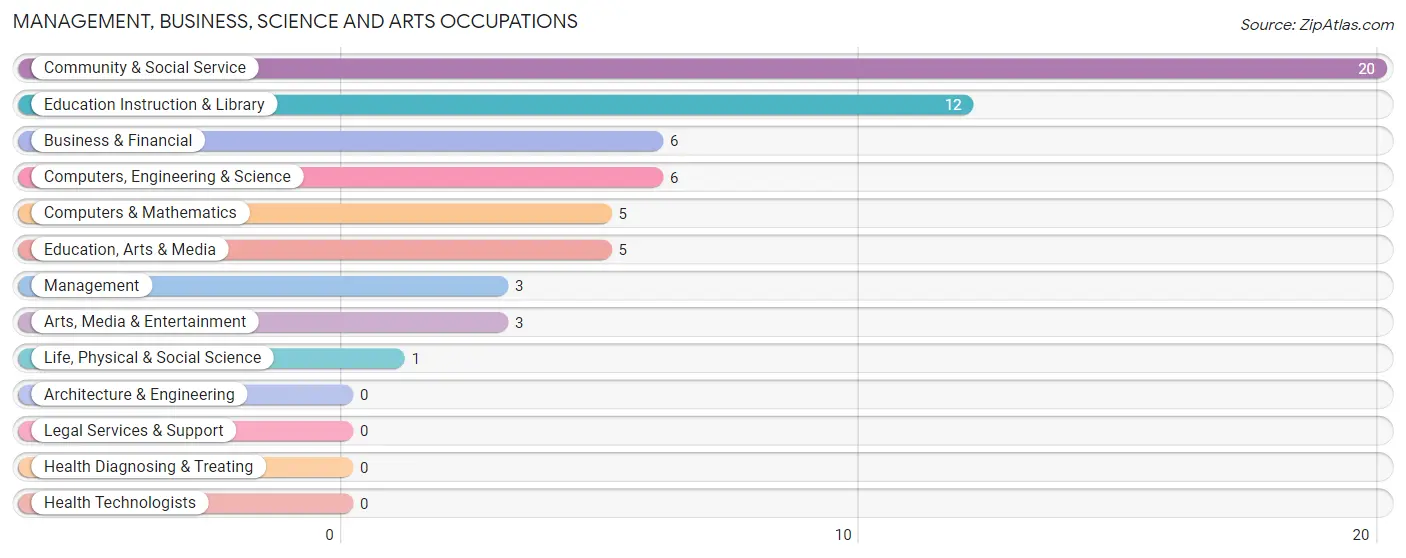
Management, Business, Science and Arts Occupations by Sex
Within the Management, Business, Science and Arts occupations in Greensboro, the most male-oriented occupations are Management (100.0%), Business & Financial (100.0%), and Computers & Mathematics (100.0%), while the most female-oriented occupations are Life, Physical & Social Science (100.0%), Education Instruction & Library (100.0%), and Community & Social Service (80.0%).
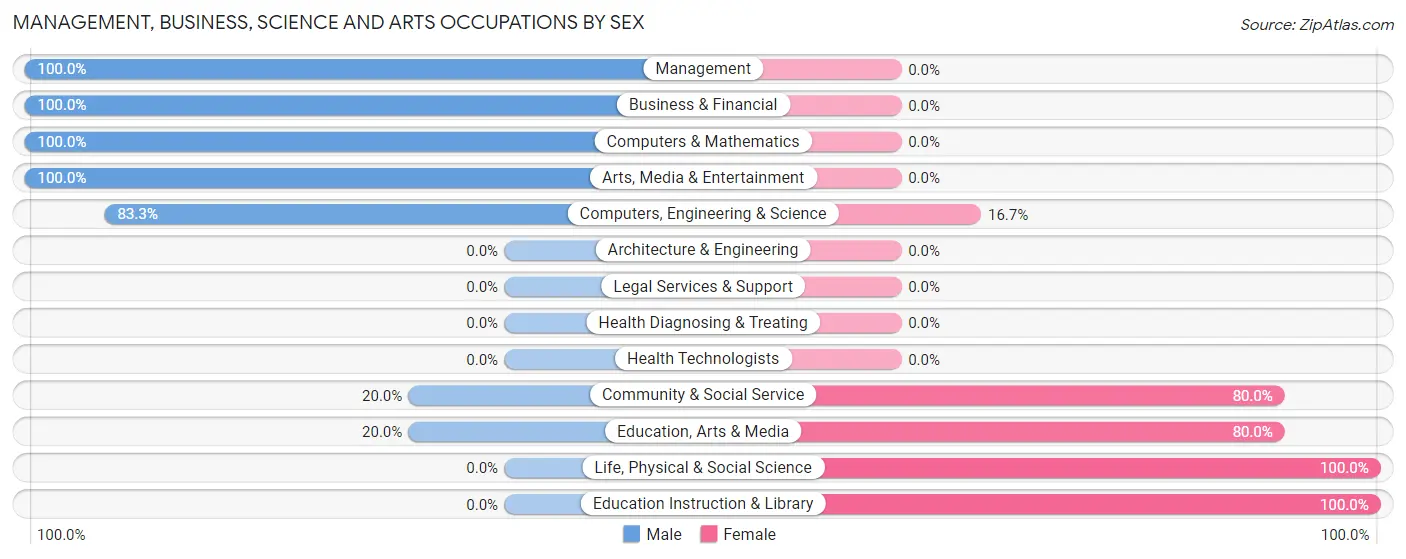
| Occupation | Male | Female |
| Management | 3 (100.0%) | 0 (0.0%) |
| Business & Financial | 6 (100.0%) | 0 (0.0%) |
| Computers, Engineering & Science | 5 (83.3%) | 1 (16.7%) |
| Computers & Mathematics | 5 (100.0%) | 0 (0.0%) |
| Architecture & Engineering | 0 (0.0%) | 0 (0.0%) |
| Life, Physical & Social Science | 0 (0.0%) | 1 (100.0%) |
| Community & Social Service | 4 (20.0%) | 16 (80.0%) |
| Education, Arts & Media | 1 (20.0%) | 4 (80.0%) |
| Legal Services & Support | 0 (0.0%) | 0 (0.0%) |
| Education Instruction & Library | 0 (0.0%) | 12 (100.0%) |
| Arts, Media & Entertainment | 3 (100.0%) | 0 (0.0%) |
| Health Diagnosing & Treating | 0 (0.0%) | 0 (0.0%) |
| Health Technologists | 0 (0.0%) | 0 (0.0%) |
| Total (Category) | 18 (51.4%) | 17 (48.6%) |
| Total (Overall) | 24 (57.1%) | 18 (42.9%) |
Services Occupations
Services Occupations by Sex
| Occupation | Male | Female |
| Healthcare Support | 0 (0.0%) | 0 (0.0%) |
| Security & Protection | 0 (0.0%) | 0 (0.0%) |
| Firefighting & Prevention | 0 (0.0%) | 0 (0.0%) |
| Law Enforcement | 0 (0.0%) | 0 (0.0%) |
| Food Preparation & Serving | 0 (0.0%) | 0 (0.0%) |
| Cleaning & Maintenance | 0 (0.0%) | 0 (0.0%) |
| Personal Care & Service | 0 (0.0%) | 0 (0.0%) |
| Total (Category) | 0 (0.0%) | 0 (0.0%) |
| Total (Overall) | 24 (57.1%) | 18 (42.9%) |
Sales and Office Occupations
The most common Sales and Office occupations in Greensboro are , and Office & Administration (2 | 4.8%).
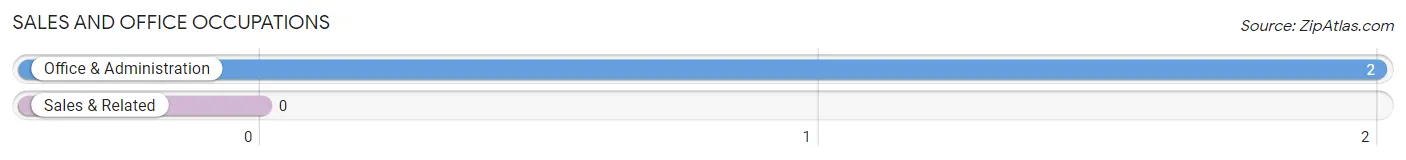
Sales and Office Occupations by Sex
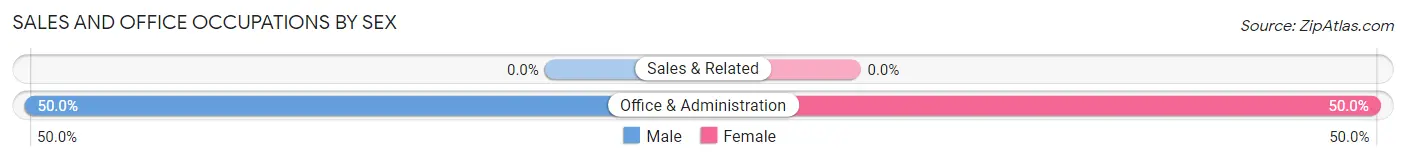
| Occupation | Male | Female |
| Sales & Related | 0 (0.0%) | 0 (0.0%) |
| Office & Administration | 1 (50.0%) | 1 (50.0%) |
| Total (Category) | 1 (50.0%) | 1 (50.0%) |
| Total (Overall) | 24 (57.1%) | 18 (42.9%) |
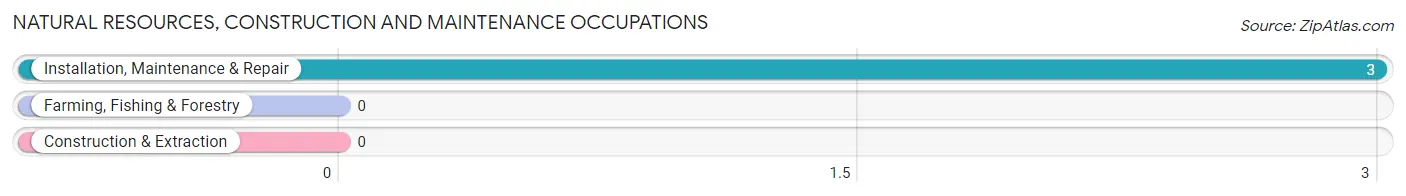
Natural Resources, Construction and Maintenance Occupations
The most common Natural Resources, Construction and Maintenance occupations in Greensboro are , and Installation, Maintenance & Repair (3 | 7.1%).
Natural Resources, Construction and Maintenance Occupations by Sex
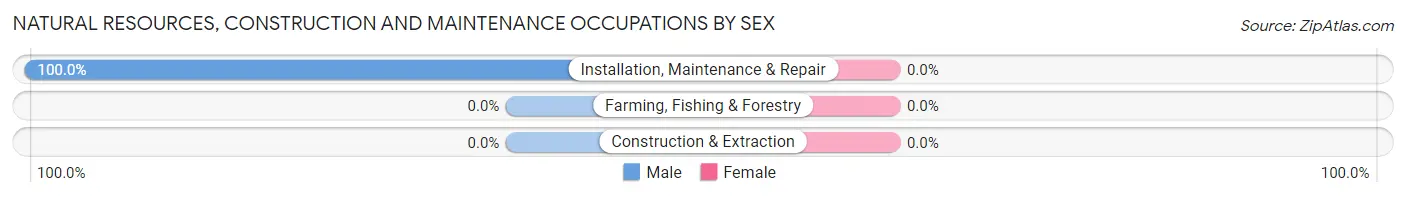
| Occupation | Male | Female |
| Farming, Fishing & Forestry | 0 (0.0%) | 0 (0.0%) |
| Construction & Extraction | 0 (0.0%) | 0 (0.0%) |
| Installation, Maintenance & Repair | 3 (100.0%) | 0 (0.0%) |
| Total (Category) | 3 (100.0%) | 0 (0.0%) |
| Total (Overall) | 24 (57.1%) | 18 (42.9%) |
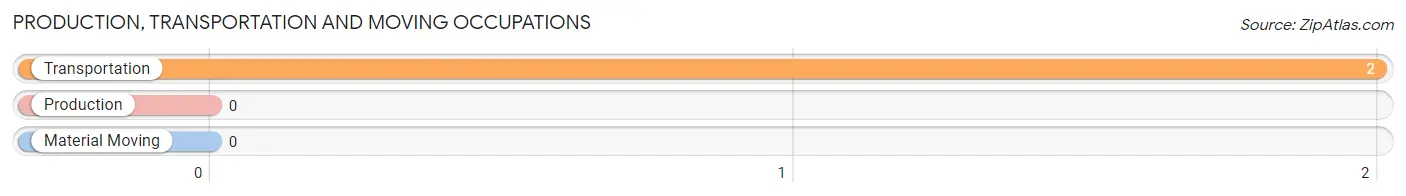
Production, Transportation and Moving Occupations
The most common Production, Transportation and Moving occupations in Greensboro are , and Transportation (2 | 4.8%).
Production, Transportation and Moving Occupations by Sex
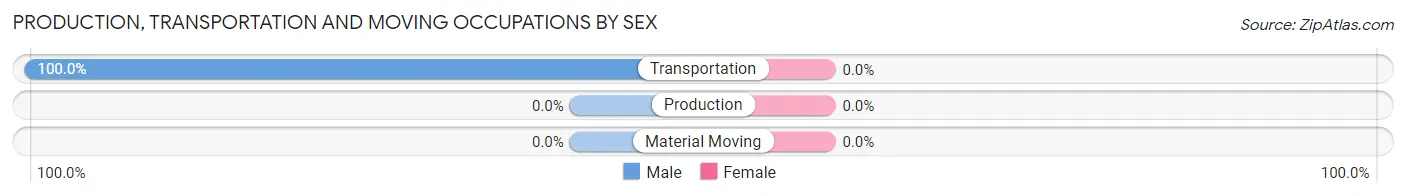
| Occupation | Male | Female |
| Production | 0 (0.0%) | 0 (0.0%) |
| Transportation | 2 (100.0%) | 0 (0.0%) |
| Material Moving | 0 (0.0%) | 0 (0.0%) |
| Total (Category) | 2 (100.0%) | 0 (0.0%) |
| Total (Overall) | 24 (57.1%) | 18 (42.9%) |
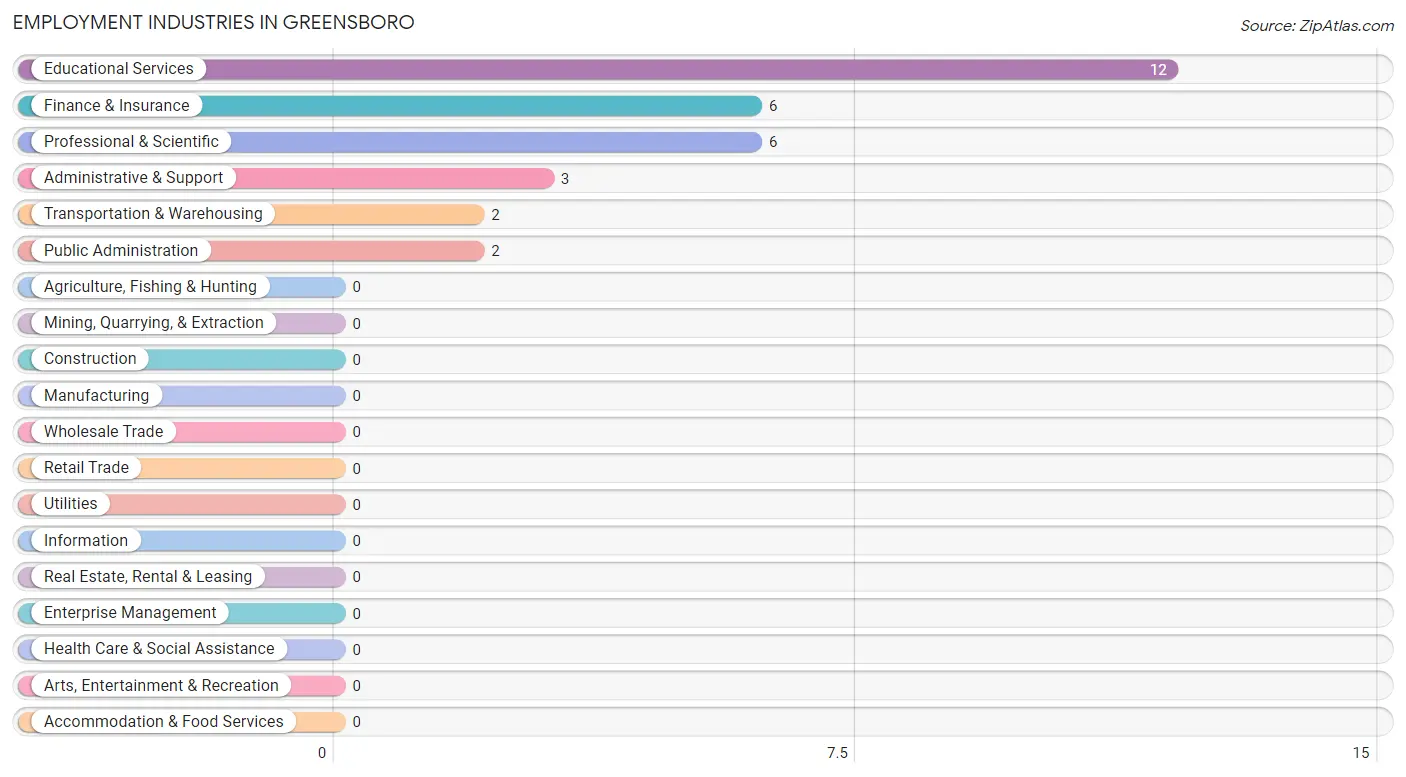
Employment Industries by Sex in Greensboro
Employment Industries in Greensboro
The major employment industries in Greensboro include Educational Services (12 | 28.6%), Finance & Insurance (6 | 14.3%), Professional & Scientific (6 | 14.3%), Administrative & Support (3 | 7.1%), and Transportation & Warehousing (2 | 4.8%).
Employment Industries by Sex in Greensboro
The Greensboro industries that see more men than women are Transportation & Warehousing (100.0%), Finance & Insurance (100.0%), and Administrative & Support (100.0%), whereas the industries that tend to have a higher number of women are Educational Services (100.0%), Public Administration (50.0%), and Professional & Scientific (16.7%).
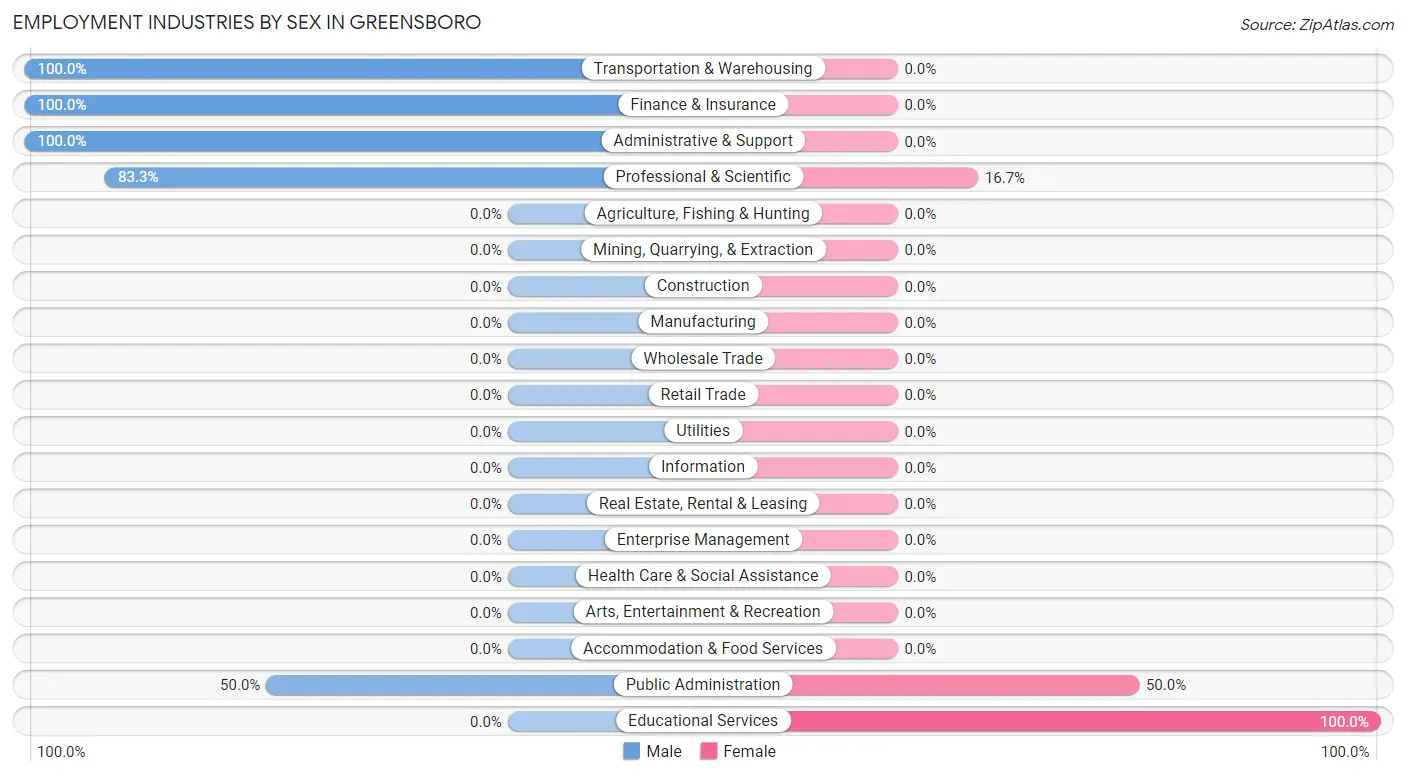
| Industry | Male | Female |
| Agriculture, Fishing & Hunting | 0 (0.0%) | 0 (0.0%) |
| Mining, Quarrying, & Extraction | 0 (0.0%) | 0 (0.0%) |
| Construction | 0 (0.0%) | 0 (0.0%) |
| Manufacturing | 0 (0.0%) | 0 (0.0%) |
| Wholesale Trade | 0 (0.0%) | 0 (0.0%) |
| Retail Trade | 0 (0.0%) | 0 (0.0%) |
| Transportation & Warehousing | 2 (100.0%) | 0 (0.0%) |
| Utilities | 0 (0.0%) | 0 (0.0%) |
| Information | 0 (0.0%) | 0 (0.0%) |
| Finance & Insurance | 6 (100.0%) | 0 (0.0%) |
| Real Estate, Rental & Leasing | 0 (0.0%) | 0 (0.0%) |
| Professional & Scientific | 5 (83.3%) | 1 (16.7%) |
| Enterprise Management | 0 (0.0%) | 0 (0.0%) |
| Administrative & Support | 3 (100.0%) | 0 (0.0%) |
| Educational Services | 0 (0.0%) | 12 (100.0%) |
| Health Care & Social Assistance | 0 (0.0%) | 0 (0.0%) |
| Arts, Entertainment & Recreation | 0 (0.0%) | 0 (0.0%) |
| Accommodation & Food Services | 0 (0.0%) | 0 (0.0%) |
| Public Administration | 1 (50.0%) | 1 (50.0%) |
| Total | 24 (57.1%) | 18 (42.9%) |
Education in Greensboro
School Enrollment in Greensboro
The most common levels of schooling among the 14 students in Greensboro are college / undergraduate (11 | 78.6%), and high school (3 | 21.4%).
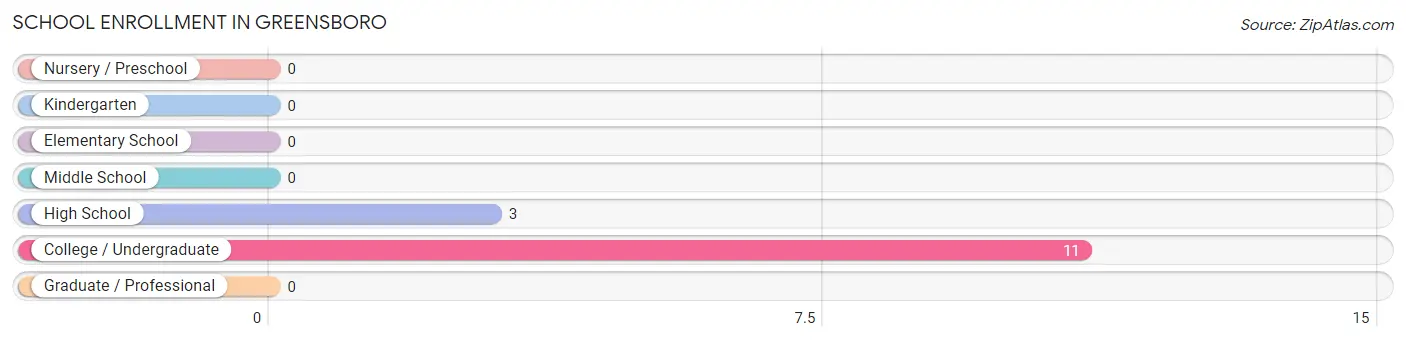
| School Level | # Students | % Students |
| Nursery / Preschool | 0 | 0.0% |
| Kindergarten | 0 | 0.0% |
| Elementary School | 0 | 0.0% |
| Middle School | 0 | 0.0% |
| High School | 3 | 21.4% |
| College / Undergraduate | 11 | 78.6% |
| Graduate / Professional | 0 | 0.0% |
| Total | 14 | 100.0% |
School Enrollment by Age by Funding Source in Greensboro
Out of a total of 14 students who are enrolled in schools in Greensboro, 12 (85.7%) attend a private institution, while the remaining 2 (14.3%) are enrolled in public schools. The age group of 15 to 17 year olds has the highest likelihood of being enrolled in private schools, with 3 (100.0% in the age bracket) enrolled. Conversely, the age group of 20 to 24 year olds has the lowest likelihood of being enrolled in a private school, with 2 (33.3% in the age bracket) attending a public institution.
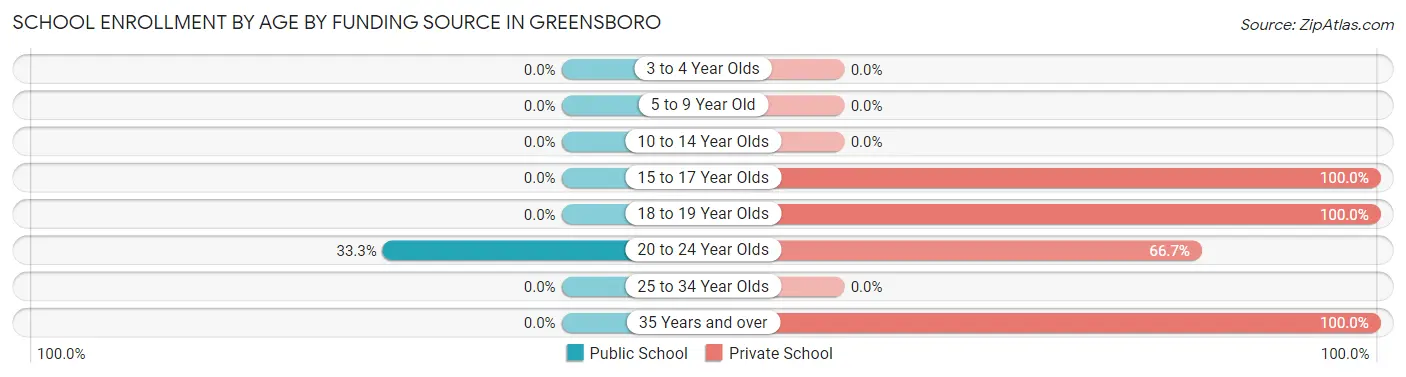
| Age Bracket | Public School | Private School |
| 3 to 4 Year Olds | 0 (0.0%) | 0 (0.0%) |
| 5 to 9 Year Old | 0 (0.0%) | 0 (0.0%) |
| 10 to 14 Year Olds | 0 (0.0%) | 0 (0.0%) |
| 15 to 17 Year Olds | 0 (0.0%) | 3 (100.0%) |
| 18 to 19 Year Olds | 0 (0.0%) | 3 (100.0%) |
| 20 to 24 Year Olds | 2 (33.3%) | 4 (66.7%) |
| 25 to 34 Year Olds | 0 (0.0%) | 0 (0.0%) |
| 35 Years and over | 0 (0.0%) | 2 (100.0%) |
| Total | 2 (14.3%) | 12 (85.7%) |
Educational Attainment by Field of Study in Greensboro
Social sciences (21 | 31.8%), liberal arts & history (19 | 28.8%), education (10 | 15.1%), literature & languages (6 | 9.1%), and visual & performing arts (6 | 9.1%) are the most common fields of study among 66 individuals in Greensboro who have obtained a bachelor's degree or higher.
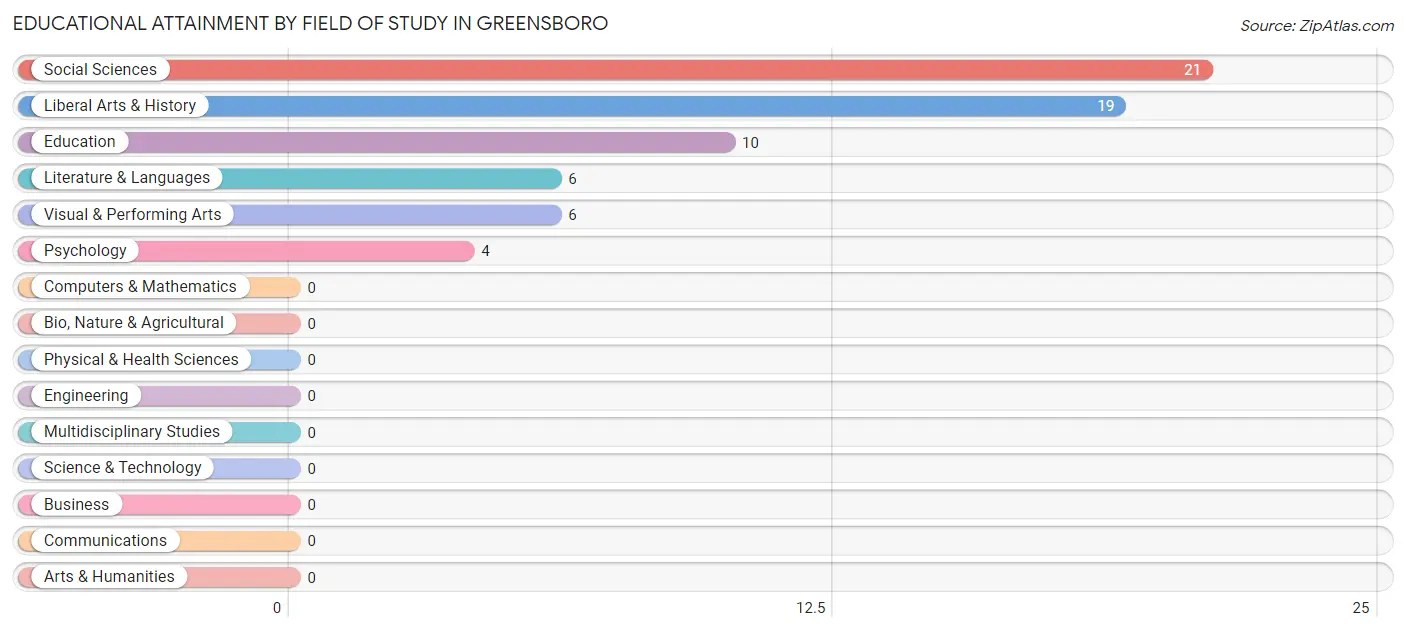
| Field of Study | # Graduates | % Graduates |
| Computers & Mathematics | 0 | 0.0% |
| Bio, Nature & Agricultural | 0 | 0.0% |
| Physical & Health Sciences | 0 | 0.0% |
| Psychology | 4 | 6.1% |
| Social Sciences | 21 | 31.8% |
| Engineering | 0 | 0.0% |
| Multidisciplinary Studies | 0 | 0.0% |
| Science & Technology | 0 | 0.0% |
| Business | 0 | 0.0% |
| Education | 10 | 15.1% |
| Literature & Languages | 6 | 9.1% |
| Liberal Arts & History | 19 | 28.8% |
| Visual & Performing Arts | 6 | 9.1% |
| Communications | 0 | 0.0% |
| Arts & Humanities | 0 | 0.0% |
| Total | 66 | 100.0% |
Transportation & Commute in Greensboro
Vehicle Availability by Sex in Greensboro
The most prevalent vehicle ownership categories in Greensboro are males with 2 vehicles (16, accounting for 66.7%) and females with 2 vehicles (6, making up 94.1%).
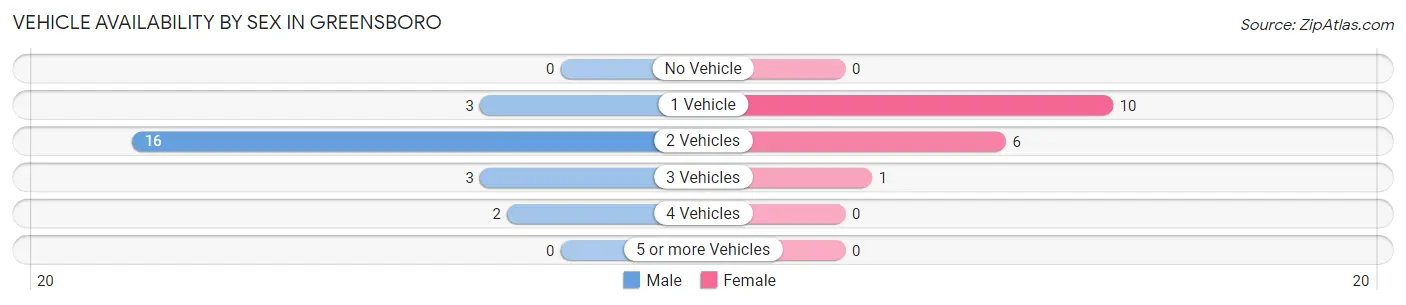
| Vehicles Available | Male | Female |
| No Vehicle | 0 (0.0%) | 0 (0.0%) |
| 1 Vehicle | 3 (12.5%) | 10 (58.8%) |
| 2 Vehicles | 16 (66.7%) | 6 (35.3%) |
| 3 Vehicles | 3 (12.5%) | 1 (5.9%) |
| 4 Vehicles | 2 (8.3%) | 0 (0.0%) |
| 5 or more Vehicles | 0 (0.0%) | 0 (0.0%) |
| Total | 24 (100.0%) | 17 (100.0%) |
Commute Time in Greensboro
The most frequently occuring commute durations in Greensboro are 45 to 59 minutes (9 commuters, 23.1%), 15 to 19 minutes (7 commuters, 17.9%), and 10 to 14 minutes (5 commuters, 12.8%).
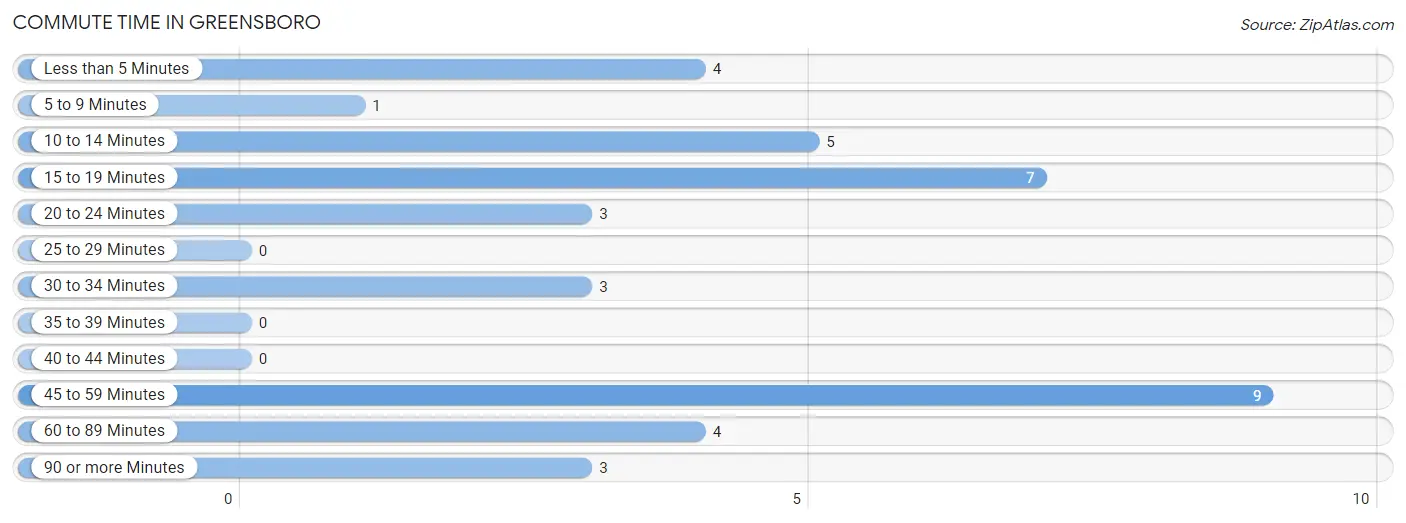
| Commute Time | # Commuters | % Commuters |
| Less than 5 Minutes | 4 | 10.3% |
| 5 to 9 Minutes | 1 | 2.6% |
| 10 to 14 Minutes | 5 | 12.8% |
| 15 to 19 Minutes | 7 | 17.9% |
| 20 to 24 Minutes | 3 | 7.7% |
| 25 to 29 Minutes | 0 | 0.0% |
| 30 to 34 Minutes | 3 | 7.7% |
| 35 to 39 Minutes | 0 | 0.0% |
| 40 to 44 Minutes | 0 | 0.0% |
| 45 to 59 Minutes | 9 | 23.1% |
| 60 to 89 Minutes | 4 | 10.3% |
| 90 or more Minutes | 3 | 7.7% |
Commute Time by Sex in Greensboro
The most common commute times in Greensboro are 15 to 19 minutes (7 commuters, 30.4%) for males and 45 to 59 minutes (6 commuters, 37.5%) for females.
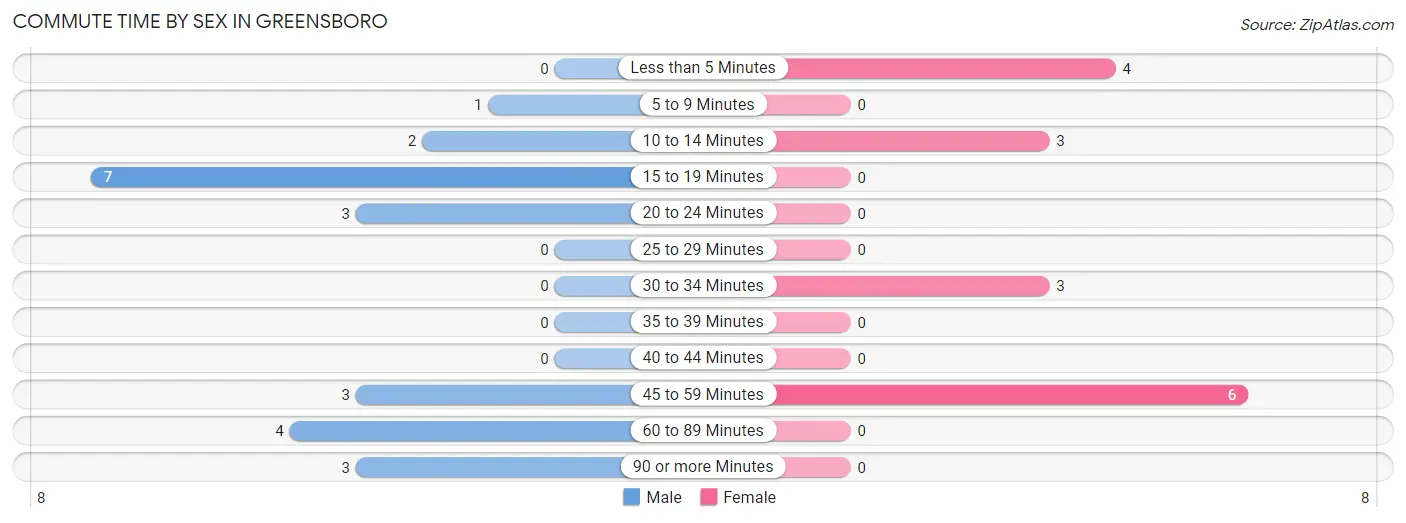
| Commute Time | Male | Female |
| Less than 5 Minutes | 0 (0.0%) | 4 (25.0%) |
| 5 to 9 Minutes | 1 (4.3%) | 0 (0.0%) |
| 10 to 14 Minutes | 2 (8.7%) | 3 (18.8%) |
| 15 to 19 Minutes | 7 (30.4%) | 0 (0.0%) |
| 20 to 24 Minutes | 3 (13.0%) | 0 (0.0%) |
| 25 to 29 Minutes | 0 (0.0%) | 0 (0.0%) |
| 30 to 34 Minutes | 0 (0.0%) | 3 (18.8%) |
| 35 to 39 Minutes | 0 (0.0%) | 0 (0.0%) |
| 40 to 44 Minutes | 0 (0.0%) | 0 (0.0%) |
| 45 to 59 Minutes | 3 (13.0%) | 6 (37.5%) |
| 60 to 89 Minutes | 4 (17.4%) | 0 (0.0%) |
| 90 or more Minutes | 3 (13.0%) | 0 (0.0%) |
Time of Departure to Work by Sex in Greensboro
The most frequent times of departure to work in Greensboro are 7:00 AM to 7:29 AM (10, 43.5%) for males and 12:00 PM to 3:59 PM (10, 62.5%) for females.
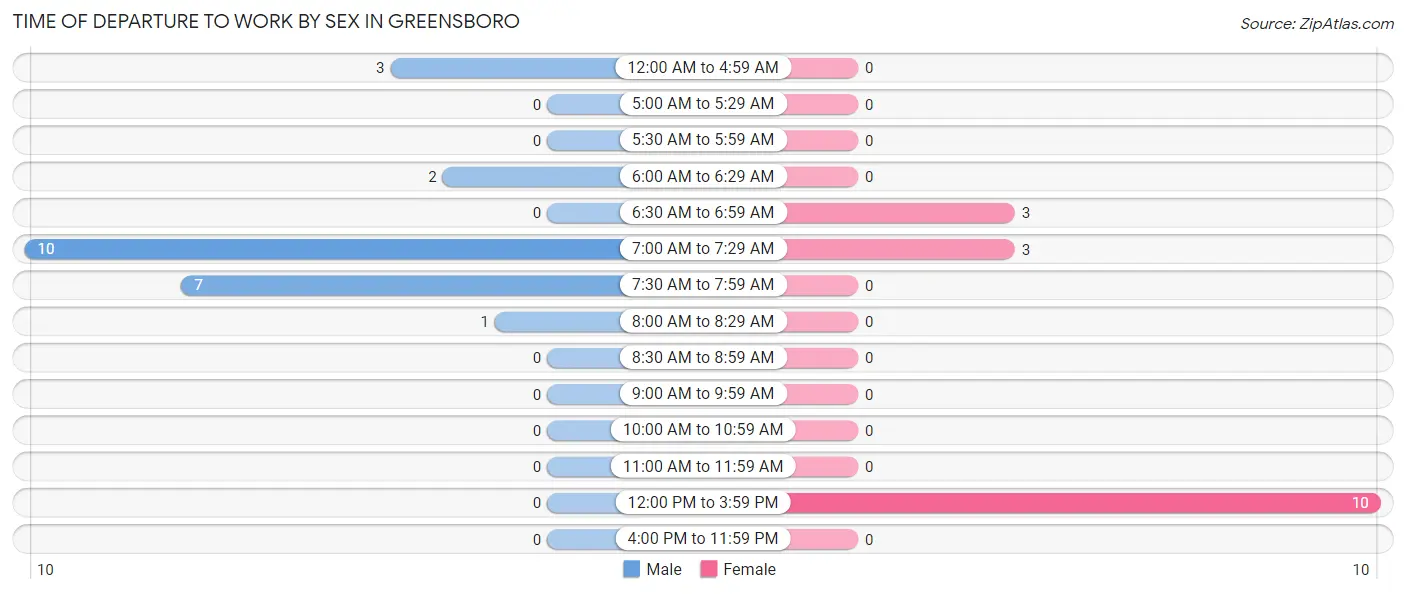
| Time of Departure | Male | Female |
| 12:00 AM to 4:59 AM | 3 (13.0%) | 0 (0.0%) |
| 5:00 AM to 5:29 AM | 0 (0.0%) | 0 (0.0%) |
| 5:30 AM to 5:59 AM | 0 (0.0%) | 0 (0.0%) |
| 6:00 AM to 6:29 AM | 2 (8.7%) | 0 (0.0%) |
| 6:30 AM to 6:59 AM | 0 (0.0%) | 3 (18.8%) |
| 7:00 AM to 7:29 AM | 10 (43.5%) | 3 (18.8%) |
| 7:30 AM to 7:59 AM | 7 (30.4%) | 0 (0.0%) |
| 8:00 AM to 8:29 AM | 1 (4.3%) | 0 (0.0%) |
| 8:30 AM to 8:59 AM | 0 (0.0%) | 0 (0.0%) |
| 9:00 AM to 9:59 AM | 0 (0.0%) | 0 (0.0%) |
| 10:00 AM to 10:59 AM | 0 (0.0%) | 0 (0.0%) |
| 11:00 AM to 11:59 AM | 0 (0.0%) | 0 (0.0%) |
| 12:00 PM to 3:59 PM | 0 (0.0%) | 10 (62.5%) |
| 4:00 PM to 11:59 PM | 0 (0.0%) | 0 (0.0%) |
| Total | 23 (100.0%) | 16 (100.0%) |
Housing Occupancy in Greensboro
Occupancy by Ownership in Greensboro
Of the total 56 dwellings in Greensboro, owner-occupied units account for 41 (73.2%), while renter-occupied units make up 15 (26.8%).
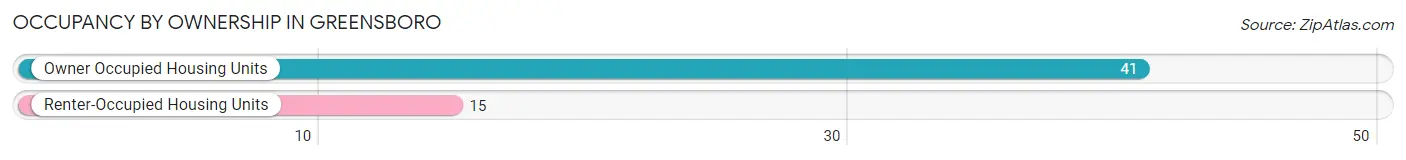
| Occupancy | # Housing Units | % Housing Units |
| Owner Occupied Housing Units | 41 | 73.2% |
| Renter-Occupied Housing Units | 15 | 26.8% |
| Total Occupied Housing Units | 56 | 100.0% |
Occupancy by Household Size in Greensboro
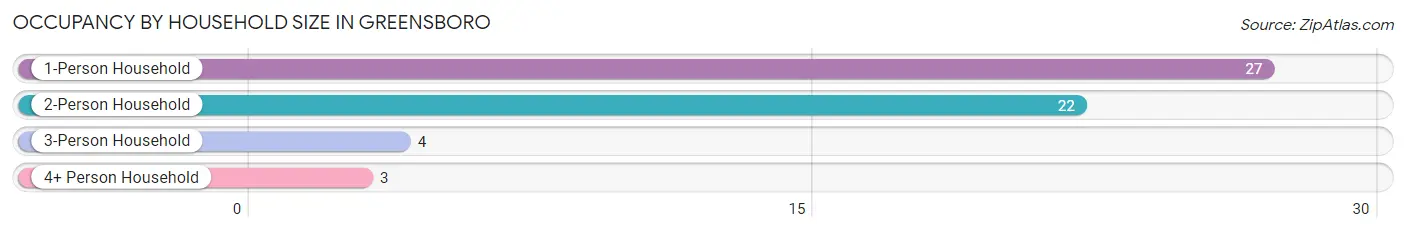
| Household Size | # Housing Units | % Housing Units |
| 1-Person Household | 27 | 48.2% |
| 2-Person Household | 22 | 39.3% |
| 3-Person Household | 4 | 7.1% |
| 4+ Person Household | 3 | 5.4% |
| Total Housing Units | 56 | 100.0% |
Occupancy by Ownership by Household Size in Greensboro
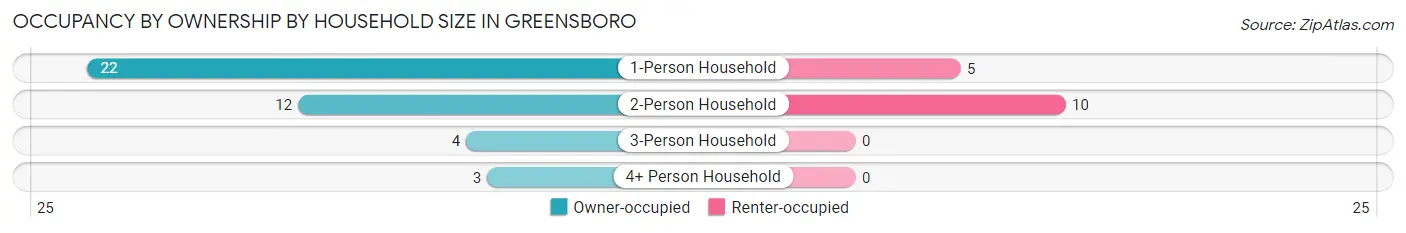
| Household Size | Owner-occupied | Renter-occupied |
| 1-Person Household | 22 (81.5%) | 5 (18.5%) |
| 2-Person Household | 12 (54.5%) | 10 (45.5%) |
| 3-Person Household | 4 (100.0%) | 0 (0.0%) |
| 4+ Person Household | 3 (100.0%) | 0 (0.0%) |
| Total Housing Units | 41 (73.2%) | 15 (26.8%) |
Occupancy by Educational Attainment in Greensboro
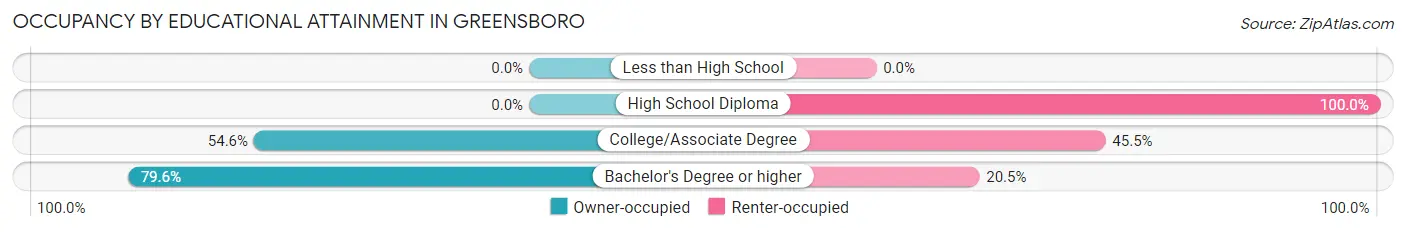
| Household Size | Owner-occupied | Renter-occupied |
| Less than High School | 0 (0.0%) | 0 (0.0%) |
| High School Diploma | 0 (0.0%) | 1 (100.0%) |
| College/Associate Degree | 6 (54.5%) | 5 (45.5%) |
| Bachelor's Degree or higher | 35 (79.5%) | 9 (20.4%) |
Occupancy by Age of Householder in Greensboro
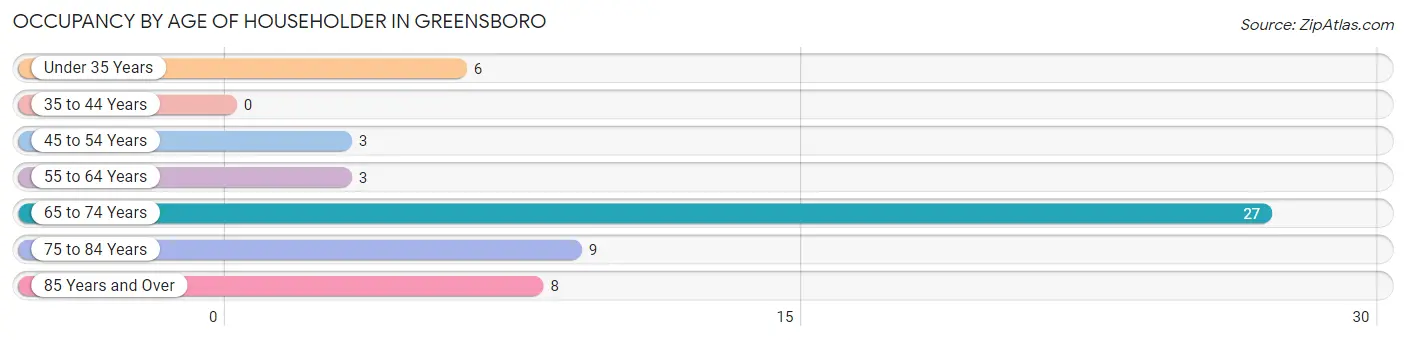
| Age Bracket | # Households | % Households |
| Under 35 Years | 6 | 10.7% |
| 35 to 44 Years | 0 | 0.0% |
| 45 to 54 Years | 3 | 5.4% |
| 55 to 64 Years | 3 | 5.4% |
| 65 to 74 Years | 27 | 48.2% |
| 75 to 84 Years | 9 | 16.1% |
| 85 Years and Over | 8 | 14.3% |
| Total | 56 | 100.0% |
Housing Finances in Greensboro
Median Income by Occupancy in Greensboro
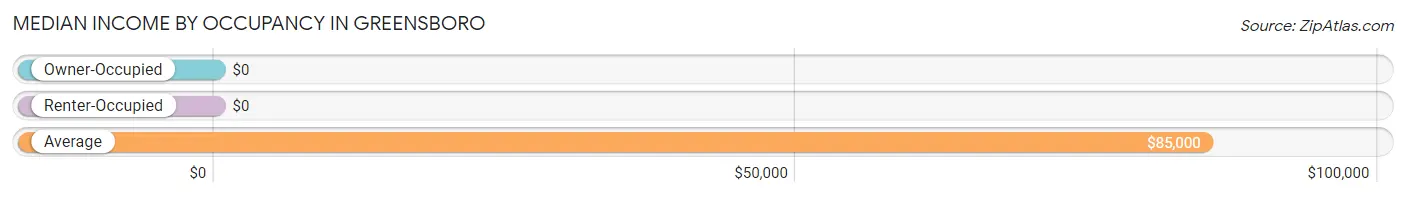
| Occupancy Type | # Households | Median Income |
| Owner-Occupied | 41 (73.2%) | $0 |
| Renter-Occupied | 15 (26.8%) | $0 |
| Average | 56 (100.0%) | $85,000 |
Occupancy by Householder Income Bracket in Greensboro
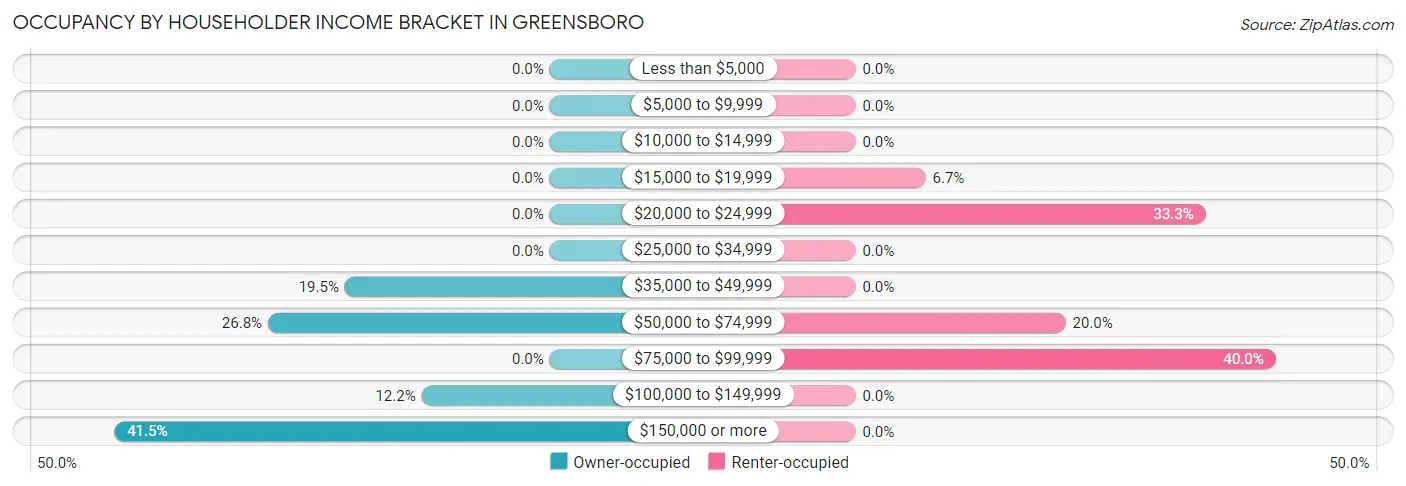
| Income Bracket | Owner-occupied | Renter-occupied |
| Less than $5,000 | 0 (0.0%) | 0 (0.0%) |
| $5,000 to $9,999 | 0 (0.0%) | 0 (0.0%) |
| $10,000 to $14,999 | 0 (0.0%) | 0 (0.0%) |
| $15,000 to $19,999 | 0 (0.0%) | 1 (6.7%) |
| $20,000 to $24,999 | 0 (0.0%) | 5 (33.3%) |
| $25,000 to $34,999 | 0 (0.0%) | 0 (0.0%) |
| $35,000 to $49,999 | 8 (19.5%) | 0 (0.0%) |
| $50,000 to $74,999 | 11 (26.8%) | 3 (20.0%) |
| $75,000 to $99,999 | 0 (0.0%) | 6 (40.0%) |
| $100,000 to $149,999 | 5 (12.2%) | 0 (0.0%) |
| $150,000 or more | 17 (41.5%) | 0 (0.0%) |
| Total | 41 (100.0%) | 15 (100.0%) |
Monthly Housing Cost Tiers in Greensboro
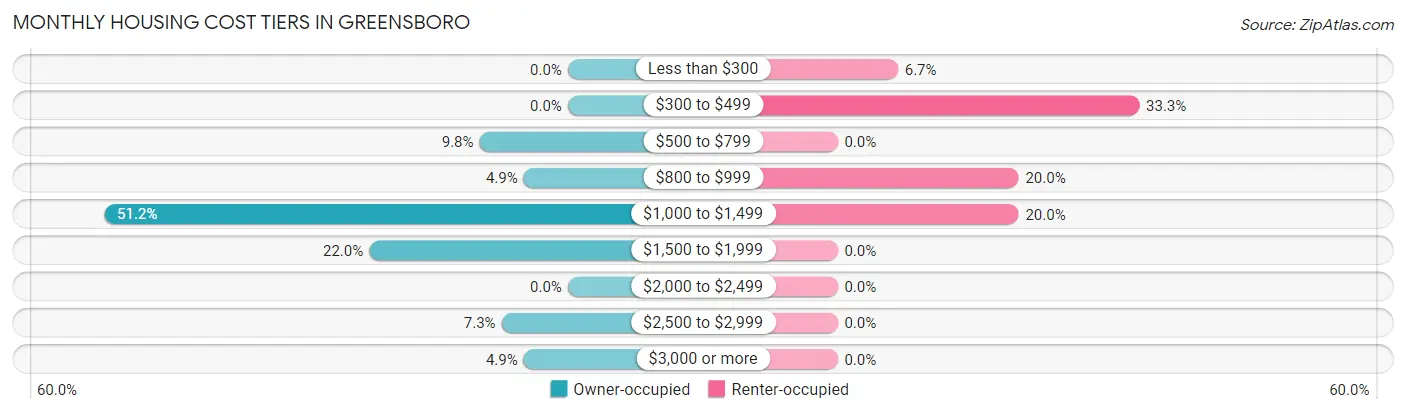
| Monthly Cost | Owner-occupied | Renter-occupied |
| Less than $300 | 0 (0.0%) | 1 (6.7%) |
| $300 to $499 | 0 (0.0%) | 5 (33.3%) |
| $500 to $799 | 4 (9.8%) | 0 (0.0%) |
| $800 to $999 | 2 (4.9%) | 3 (20.0%) |
| $1,000 to $1,499 | 21 (51.2%) | 3 (20.0%) |
| $1,500 to $1,999 | 9 (22.0%) | 0 (0.0%) |
| $2,000 to $2,499 | 0 (0.0%) | 0 (0.0%) |
| $2,500 to $2,999 | 3 (7.3%) | 0 (0.0%) |
| $3,000 or more | 2 (4.9%) | 0 (0.0%) |
| Total | 41 (100.0%) | 15 (100.0%) |
Physical Housing Characteristics in Greensboro
Housing Structures in Greensboro
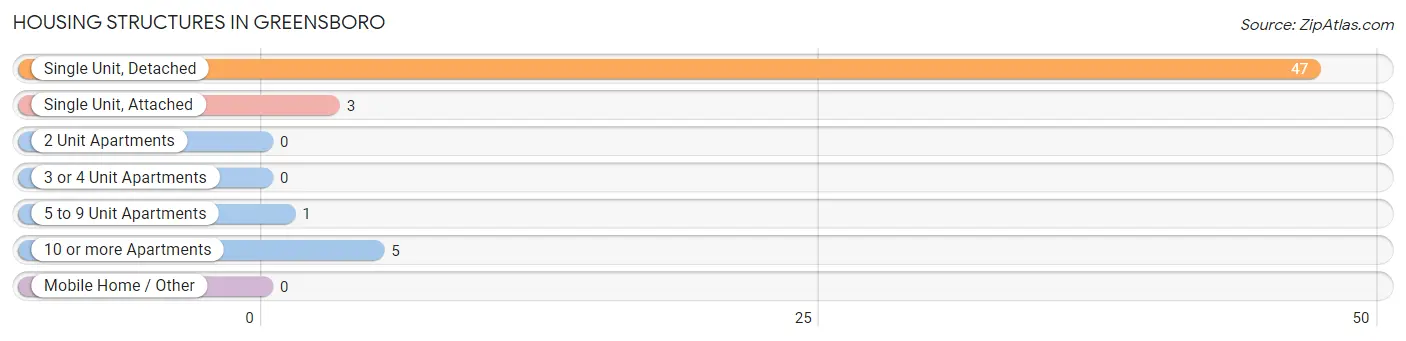
| Structure Type | # Housing Units | % Housing Units |
| Single Unit, Detached | 47 | 83.9% |
| Single Unit, Attached | 3 | 5.4% |
| 2 Unit Apartments | 0 | 0.0% |
| 3 or 4 Unit Apartments | 0 | 0.0% |
| 5 to 9 Unit Apartments | 1 | 1.8% |
| 10 or more Apartments | 5 | 8.9% |
| Mobile Home / Other | 0 | 0.0% |
| Total | 56 | 100.0% |
Housing Structures by Occupancy in Greensboro
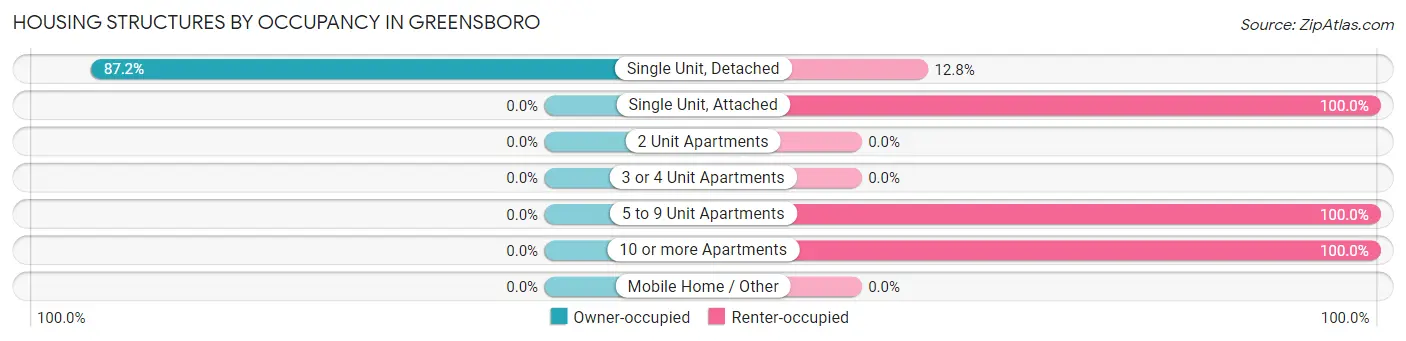
| Structure Type | Owner-occupied | Renter-occupied |
| Single Unit, Detached | 41 (87.2%) | 6 (12.8%) |
| Single Unit, Attached | 0 (0.0%) | 3 (100.0%) |
| 2 Unit Apartments | 0 (0.0%) | 0 (0.0%) |
| 3 or 4 Unit Apartments | 0 (0.0%) | 0 (0.0%) |
| 5 to 9 Unit Apartments | 0 (0.0%) | 1 (100.0%) |
| 10 or more Apartments | 0 (0.0%) | 5 (100.0%) |
| Mobile Home / Other | 0 (0.0%) | 0 (0.0%) |
| Total | 41 (73.2%) | 15 (26.8%) |
Housing Structures by Number of Rooms in Greensboro
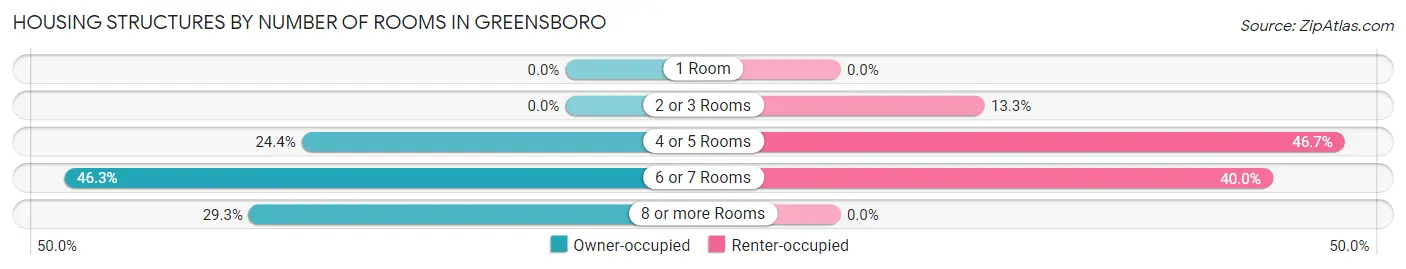
| Number of Rooms | Owner-occupied | Renter-occupied |
| 1 Room | 0 (0.0%) | 0 (0.0%) |
| 2 or 3 Rooms | 0 (0.0%) | 2 (13.3%) |
| 4 or 5 Rooms | 10 (24.4%) | 7 (46.7%) |
| 6 or 7 Rooms | 19 (46.3%) | 6 (40.0%) |
| 8 or more Rooms | 12 (29.3%) | 0 (0.0%) |
| Total | 41 (100.0%) | 15 (100.0%) |
Housing Structure by Heating Type in Greensboro
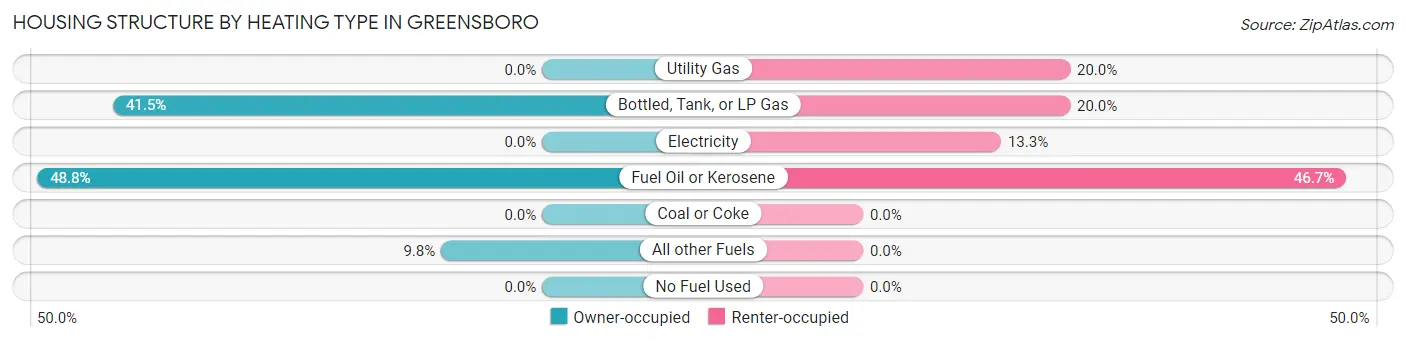
| Heating Type | Owner-occupied | Renter-occupied |
| Utility Gas | 0 (0.0%) | 3 (20.0%) |
| Bottled, Tank, or LP Gas | 17 (41.5%) | 3 (20.0%) |
| Electricity | 0 (0.0%) | 2 (13.3%) |
| Fuel Oil or Kerosene | 20 (48.8%) | 7 (46.7%) |
| Coal or Coke | 0 (0.0%) | 0 (0.0%) |
| All other Fuels | 4 (9.8%) | 0 (0.0%) |
| No Fuel Used | 0 (0.0%) | 0 (0.0%) |
| Total | 41 (100.0%) | 15 (100.0%) |
Household Vehicle Usage in Greensboro
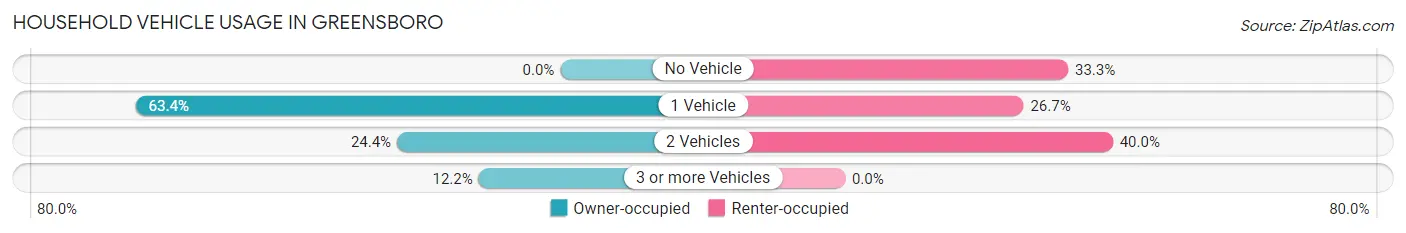
| Vehicles per Household | Owner-occupied | Renter-occupied |
| No Vehicle | 0 (0.0%) | 5 (33.3%) |
| 1 Vehicle | 26 (63.4%) | 4 (26.7%) |
| 2 Vehicles | 10 (24.4%) | 6 (40.0%) |
| 3 or more Vehicles | 5 (12.2%) | 0 (0.0%) |
| Total | 41 (100.0%) | 15 (100.0%) |
Real Estate & Mortgages in Greensboro
Real Estate and Mortgage Overview in Greensboro
| Characteristic | Without Mortgage | With Mortgage |
| Housing Units | 22 | 19 |
| Median Property Value | $488,900 | $378,600 |
| Median Household Income | $179,167 | $2 |
| Monthly Housing Costs | $1,183 | $2 |
| Real Estate Taxes | $9,063 | $0 |
Property Value by Mortgage Status in Greensboro
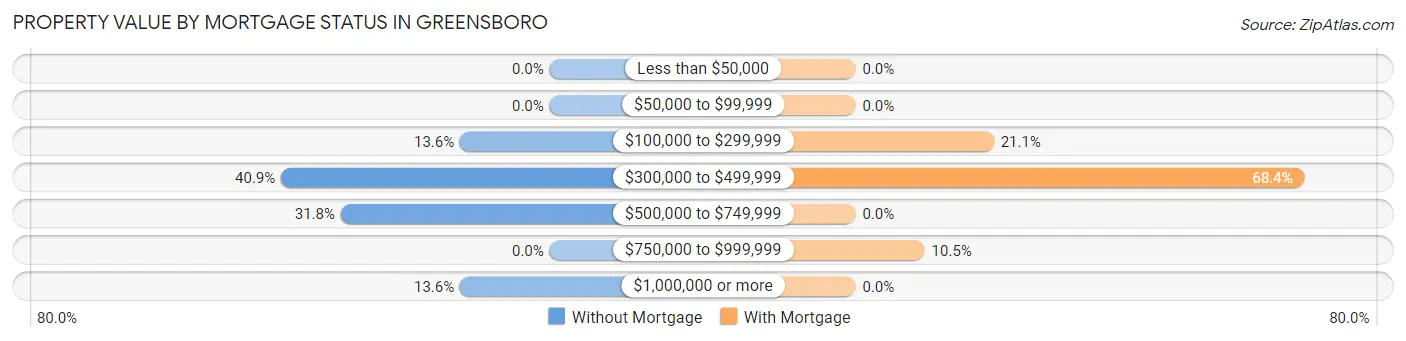
| Property Value | Without Mortgage | With Mortgage |
| Less than $50,000 | 0 (0.0%) | 0 (0.0%) |
| $50,000 to $99,999 | 0 (0.0%) | 0 (0.0%) |
| $100,000 to $299,999 | 3 (13.6%) | 4 (21.0%) |
| $300,000 to $499,999 | 9 (40.9%) | 13 (68.4%) |
| $500,000 to $749,999 | 7 (31.8%) | 0 (0.0%) |
| $750,000 to $999,999 | 0 (0.0%) | 2 (10.5%) |
| $1,000,000 or more | 3 (13.6%) | 0 (0.0%) |
| Total | 22 (100.0%) | 19 (100.0%) |
Household Income by Mortgage Status in Greensboro
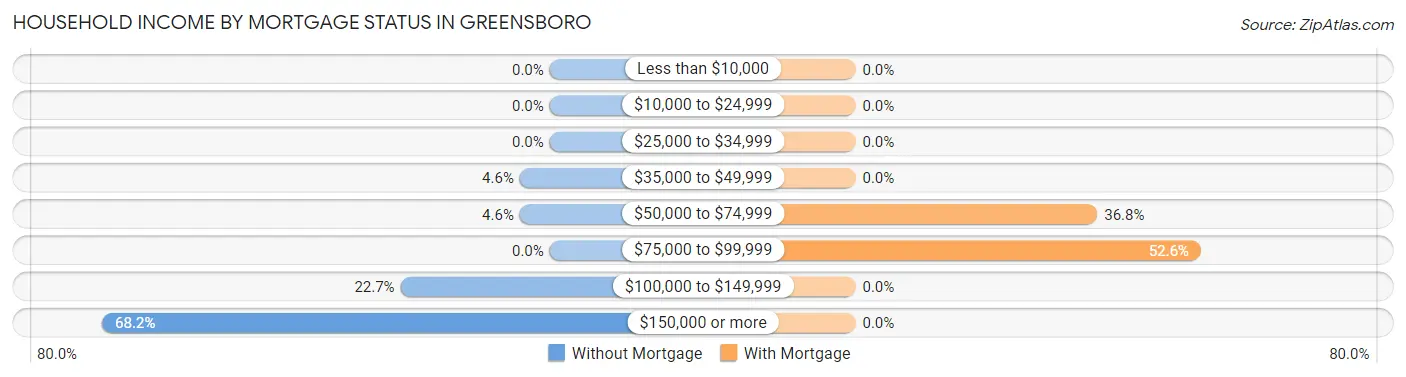
| Household Income | Without Mortgage | With Mortgage |
| Less than $10,000 | 0 (0.0%) | 0 (0.0%) |
| $10,000 to $24,999 | 0 (0.0%) | 0 (0.0%) |
| $25,000 to $34,999 | 0 (0.0%) | 0 (0.0%) |
| $35,000 to $49,999 | 1 (4.5%) | 0 (0.0%) |
| $50,000 to $74,999 | 1 (4.5%) | 7 (36.8%) |
| $75,000 to $99,999 | 0 (0.0%) | 10 (52.6%) |
| $100,000 to $149,999 | 5 (22.7%) | 0 (0.0%) |
| $150,000 or more | 15 (68.2%) | 0 (0.0%) |
| Total | 22 (100.0%) | 19 (100.0%) |
Property Value to Household Income Ratio in Greensboro
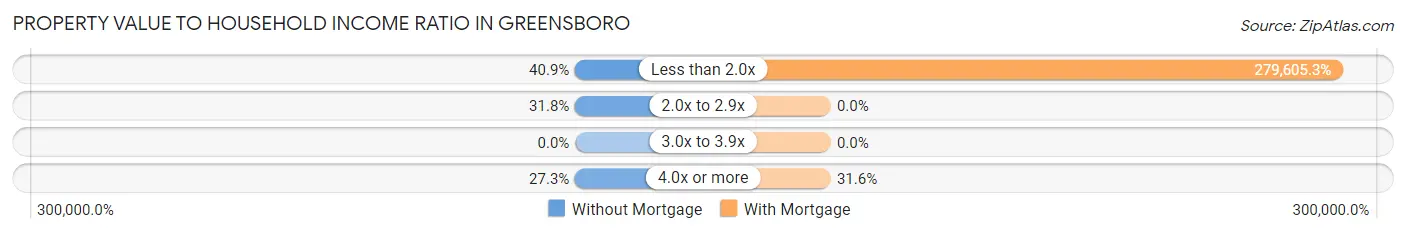
| Value-to-Income Ratio | Without Mortgage | With Mortgage |
| Less than 2.0x | 9 (40.9%) | 53,125 (279,605.3%) |
| 2.0x to 2.9x | 7 (31.8%) | 0 (0.0%) |
| 3.0x to 3.9x | 0 (0.0%) | 0 (0.0%) |
| 4.0x or more | 6 (27.3%) | 6 (31.6%) |
| Total | 22 (100.0%) | 19 (100.0%) |
Real Estate Taxes by Mortgage Status in Greensboro
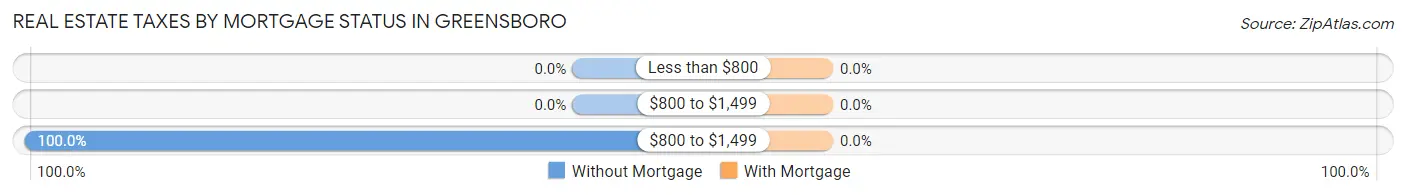
| Property Taxes | Without Mortgage | With Mortgage |
| Less than $800 | 0 (0.0%) | 0 (0.0%) |
| $800 to $1,499 | 0 (0.0%) | 0 (0.0%) |
| $800 to $1,499 | 22 (100.0%) | 0 (0.0%) |
| Total | 22 (100.0%) | 19 (100.0%) |
Health & Disability in Greensboro
Health Insurance Coverage by Age in Greensboro
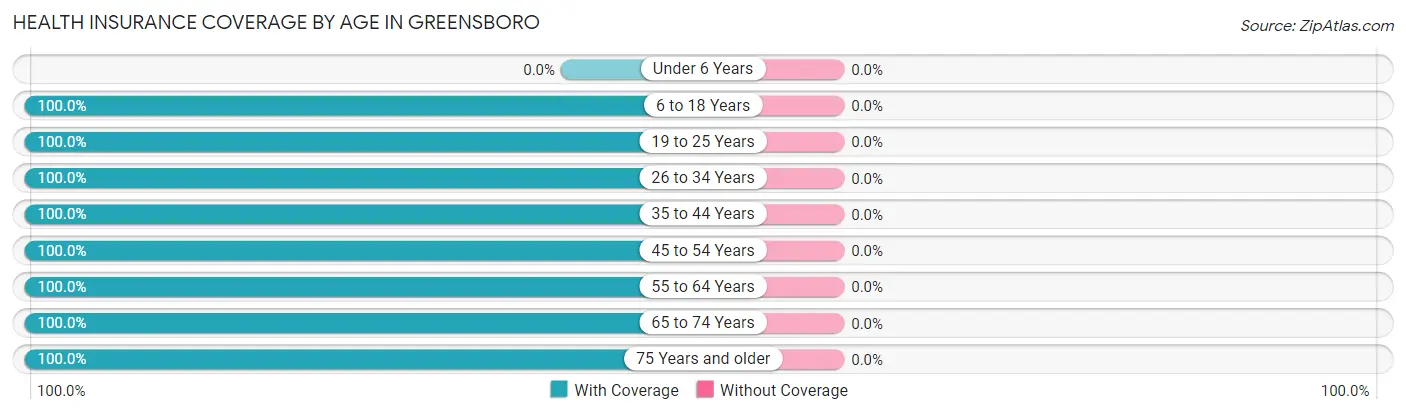
| Age Bracket | With Coverage | Without Coverage |
| Under 6 Years | 0 (0.0%) | 0 (0.0%) |
| 6 to 18 Years | 6 (100.0%) | 0 (0.0%) |
| 19 to 25 Years | 14 (100.0%) | 0 (0.0%) |
| 26 to 34 Years | 8 (100.0%) | 0 (0.0%) |
| 35 to 44 Years | 3 (100.0%) | 0 (0.0%) |
| 45 to 54 Years | 6 (100.0%) | 0 (0.0%) |
| 55 to 64 Years | 4 (100.0%) | 0 (0.0%) |
| 65 to 74 Years | 43 (100.0%) | 0 (0.0%) |
| 75 Years and older | 18 (100.0%) | 0 (0.0%) |
| Total | 102 (100.0%) | 0 (0.0%) |
Health Insurance Coverage by Citizenship Status in Greensboro
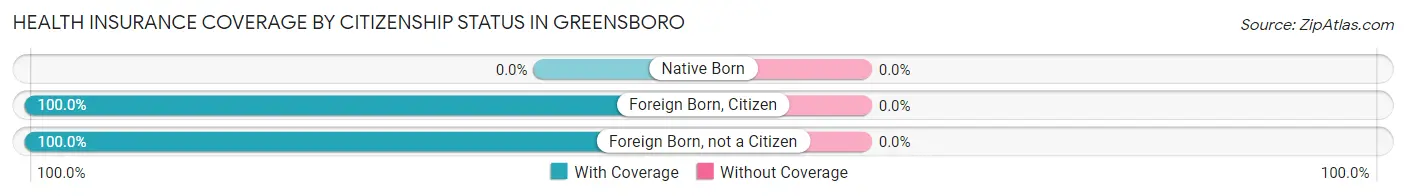
| Citizenship Status | With Coverage | Without Coverage |
| Native Born | 0 (0.0%) | 0 (0.0%) |
| Foreign Born, Citizen | 6 (100.0%) | 0 (0.0%) |
| Foreign Born, not a Citizen | 14 (100.0%) | 0 (0.0%) |
Health Insurance Coverage by Household Income in Greensboro
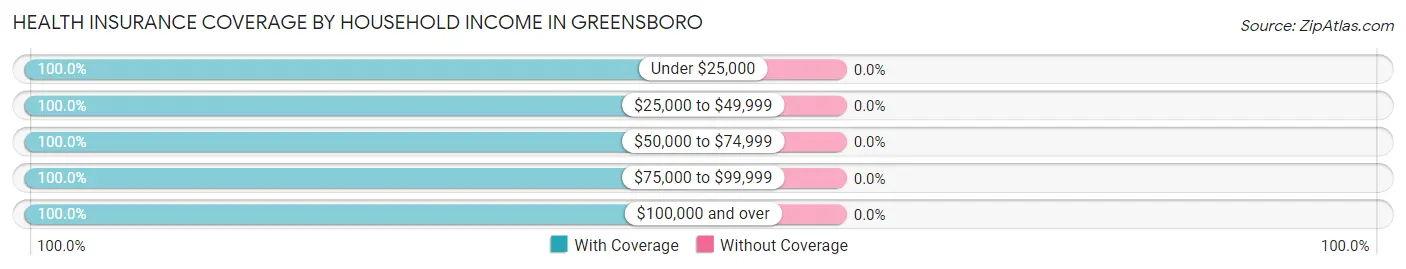
| Household Income | With Coverage | Without Coverage |
| Under $25,000 | 8 (100.0%) | 0 (0.0%) |
| $25,000 to $49,999 | 9 (100.0%) | 0 (0.0%) |
| $50,000 to $74,999 | 16 (100.0%) | 0 (0.0%) |
| $75,000 to $99,999 | 14 (100.0%) | 0 (0.0%) |
| $100,000 and over | 55 (100.0%) | 0 (0.0%) |
Public vs Private Health Insurance Coverage by Age in Greensboro
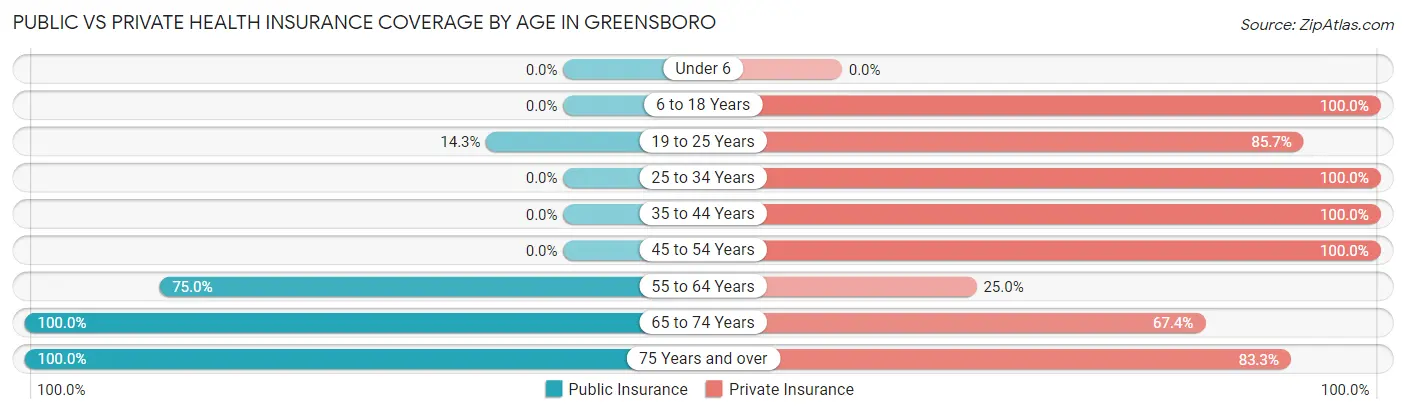
| Age Bracket | Public Insurance | Private Insurance |
| Under 6 | 0 (0.0%) | 0 (0.0%) |
| 6 to 18 Years | 0 (0.0%) | 6 (100.0%) |
| 19 to 25 Years | 2 (14.3%) | 12 (85.7%) |
| 25 to 34 Years | 0 (0.0%) | 8 (100.0%) |
| 35 to 44 Years | 0 (0.0%) | 3 (100.0%) |
| 45 to 54 Years | 0 (0.0%) | 6 (100.0%) |
| 55 to 64 Years | 3 (75.0%) | 1 (25.0%) |
| 65 to 74 Years | 43 (100.0%) | 29 (67.4%) |
| 75 Years and over | 18 (100.0%) | 15 (83.3%) |
| Total | 66 (64.7%) | 80 (78.4%) |
Disability Status by Sex by Age in Greensboro
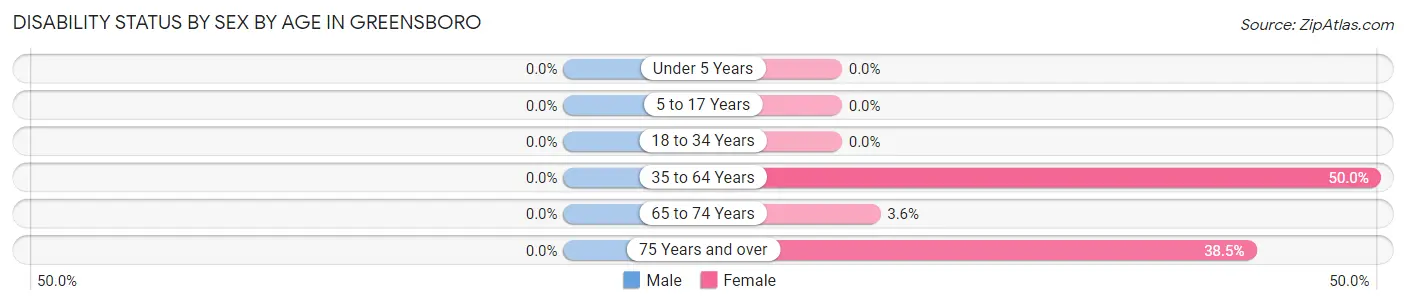
| Age Bracket | Male | Female |
| Under 5 Years | 0 (0.0%) | 0 (0.0%) |
| 5 to 17 Years | 0 (0.0%) | 0 (0.0%) |
| 18 to 34 Years | 0 (0.0%) | 0 (0.0%) |
| 35 to 64 Years | 0 (0.0%) | 3 (50.0%) |
| 65 to 74 Years | 0 (0.0%) | 1 (3.6%) |
| 75 Years and over | 0 (0.0%) | 5 (38.5%) |
Disability Class by Sex by Age in Greensboro
Disability Class: Hearing Difficulty
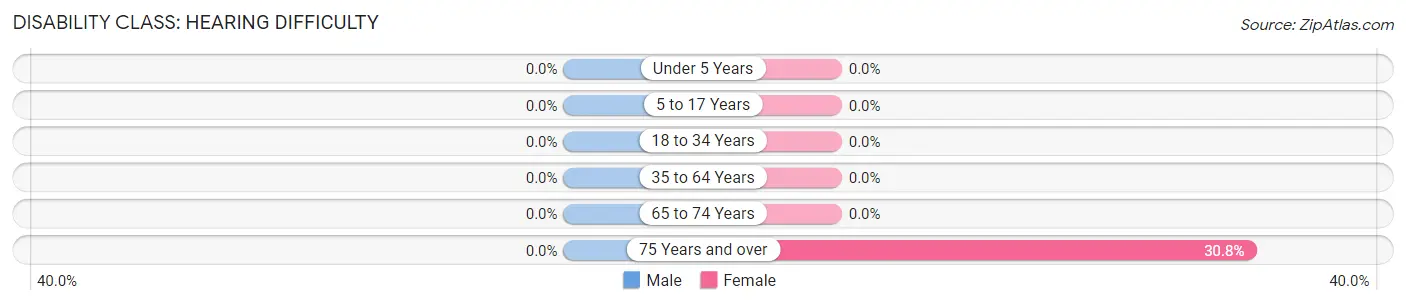
| Age Bracket | Male | Female |
| Under 5 Years | 0 (0.0%) | 0 (0.0%) |
| 5 to 17 Years | 0 (0.0%) | 0 (0.0%) |
| 18 to 34 Years | 0 (0.0%) | 0 (0.0%) |
| 35 to 64 Years | 0 (0.0%) | 0 (0.0%) |
| 65 to 74 Years | 0 (0.0%) | 0 (0.0%) |
| 75 Years and over | 0 (0.0%) | 4 (30.8%) |
Disability Class: Vision Difficulty

| Age Bracket | Male | Female |
| Under 5 Years | 0 (0.0%) | 0 (0.0%) |
| 5 to 17 Years | 0 (0.0%) | 0 (0.0%) |
| 18 to 34 Years | 0 (0.0%) | 0 (0.0%) |
| 35 to 64 Years | 0 (0.0%) | 0 (0.0%) |
| 65 to 74 Years | 0 (0.0%) | 0 (0.0%) |
| 75 Years and over | 0 (0.0%) | 4 (30.8%) |
Disability Class: Cognitive Difficulty

| Age Bracket | Male | Female |
| 5 to 17 Years | 0 (0.0%) | 0 (0.0%) |
| 18 to 34 Years | 0 (0.0%) | 0 (0.0%) |
| 35 to 64 Years | 0 (0.0%) | 0 (0.0%) |
| 65 to 74 Years | 0 (0.0%) | 0 (0.0%) |
| 75 Years and over | 0 (0.0%) | 1 (7.7%) |
Disability Class: Ambulatory Difficulty
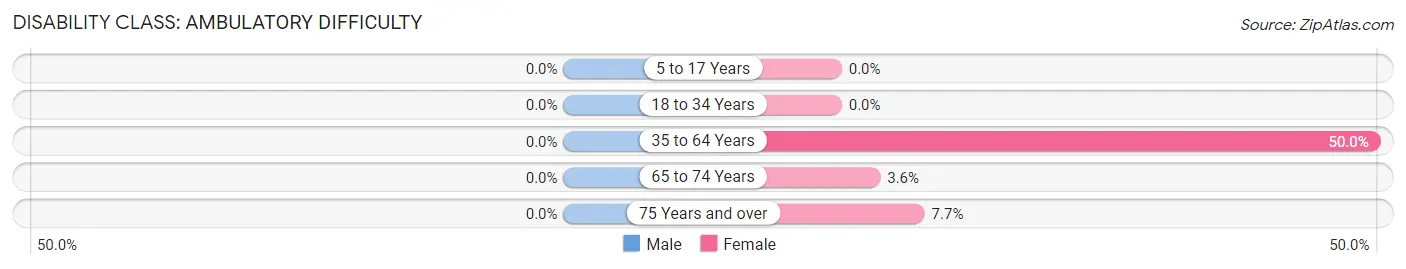
| Age Bracket | Male | Female |
| 5 to 17 Years | 0 (0.0%) | 0 (0.0%) |
| 18 to 34 Years | 0 (0.0%) | 0 (0.0%) |
| 35 to 64 Years | 0 (0.0%) | 3 (50.0%) |
| 65 to 74 Years | 0 (0.0%) | 1 (3.6%) |
| 75 Years and over | 0 (0.0%) | 1 (7.7%) |
Disability Class: Self-Care Difficulty
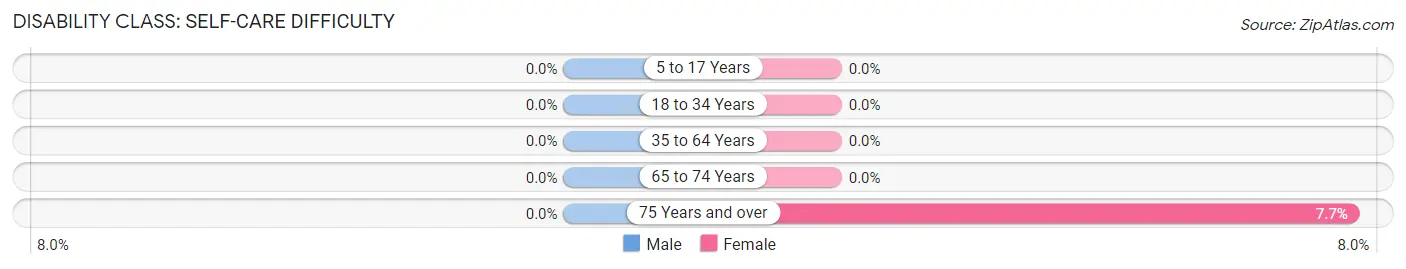
| Age Bracket | Male | Female |
| 5 to 17 Years | 0 (0.0%) | 0 (0.0%) |
| 18 to 34 Years | 0 (0.0%) | 0 (0.0%) |
| 35 to 64 Years | 0 (0.0%) | 0 (0.0%) |
| 65 to 74 Years | 0 (0.0%) | 0 (0.0%) |
| 75 Years and over | 0 (0.0%) | 1 (7.7%) |
Technology Access in Greensboro
Computing Device Access in Greensboro
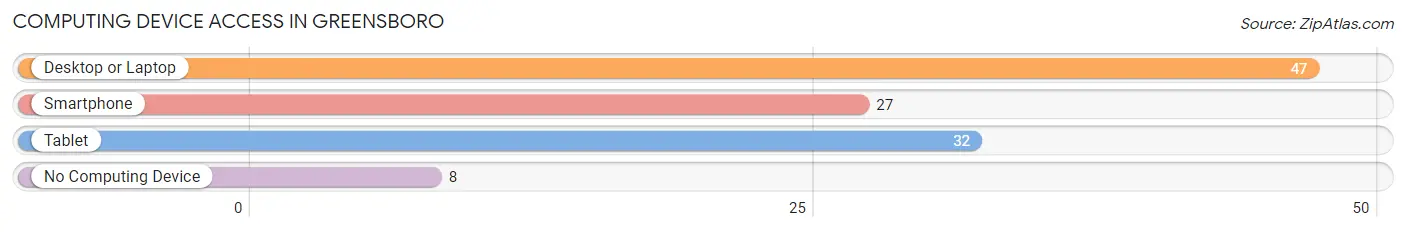
| Device Type | # Households | % Households |
| Desktop or Laptop | 47 | 83.9% |
| Smartphone | 27 | 48.2% |
| Tablet | 32 | 57.1% |
| No Computing Device | 8 | 14.3% |
| Total | 56 | 100.0% |
Internet Access in Greensboro
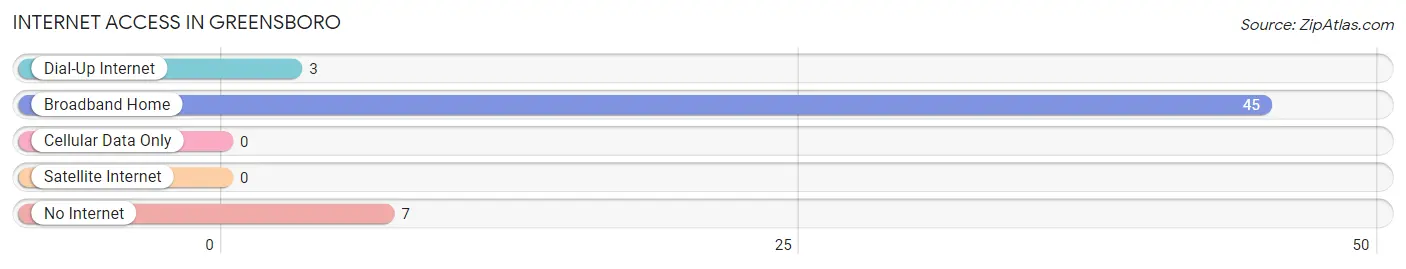
| Internet Type | # Households | % Households |
| Dial-Up Internet | 3 | 5.4% |
| Broadband Home | 45 | 80.4% |
| Cellular Data Only | 0 | 0.0% |
| Satellite Internet | 0 | 0.0% |
| No Internet | 7 | 12.5% |
| Total | 56 | 100.0% |
Greensboro Summary
Greensboro is a town located in the state of Vermont, in the United States of America. It is situated in the county of Orleans, and is part of the Northeast Kingdom region of the state. The town has a population of 1,717 people, according to the 2010 census.
Geography
Greensboro is located in the northern part of the state of Vermont, in the county of Orleans. It is situated in the Northeast Kingdom region of the state, and is bordered by the towns of Craftsbury, Hardwick, and Walden. The town is situated on the western shore of Lake Caspian, and is surrounded by the Green Mountains. The highest point in the town is the summit of Mount Hunger, which has an elevation of 2,890 feet.
The town has a total area of 33.2 square miles, of which 32.7 square miles is land and 0.5 square miles is water. The town is drained by the North Branch of the Lamoille River, which flows through the town from north to south.
History
Greensboro was first settled in 1790, and was incorporated in 1795. The town was named after General Nathanael Greene, a Revolutionary War hero. The town was originally an agricultural community, and was known for its dairy farms and orchards.
In the late 19th century, the town became a popular tourist destination, and several grand hotels were built in the area. The town was also home to several summer camps, which attracted visitors from all over the country.
Economy
Greensboro’s economy is largely based on tourism and agriculture. The town is home to several small businesses, including restaurants, shops, and galleries. The town is also home to several farms, which produce dairy products, fruits, and vegetables.
The town is also home to several educational institutions, including the Craftsbury Outdoor Center, a world-renowned outdoor education center, and Sterling College, a small liberal arts college.
Demographics
According to the 2010 census, the town of Greensboro has a population of 1,717 people. The racial makeup of the town is 97.3% White, 0.5% African American, 0.3% Native American, 0.2% Asian, 0.1% Pacific Islander, 0.2% from other races, and 1.4% from two or more races.
The median household income in the town is $45,000, and the median family income is $50,000. The per capita income in the town is $22,000. The town has a poverty rate of 11.3%.
Conclusion
Greensboro is a small town located in the state of Vermont. It is situated in the county of Orleans, and is part of the Northeast Kingdom region of the state. The town has a population of 1,717 people, according to the 2010 census. The town’s economy is largely based on tourism and agriculture, and it is home to several small businesses, farms, and educational institutions. The town has a median household income of $45,000, and a poverty rate of 11.3%.
Common Questions
What is Per Capita Income in Greensboro?
Per Capita income in Greensboro is $104,751.
What is the Median Family Income in Greensboro?
Median Family Income in Greensboro is $178,125.
What is the Median Household income in Greensboro?
Median Household Income in Greensboro is $85,000.
What is Income or Wage Gap in Greensboro?
Income or Wage Gap in Greensboro is 3.1%.
Women in Greensboro earn 96.9 cents for every dollar earned by a man.
What is Inequality or Gini Index in Greensboro?
Inequality or Gini Index in Greensboro is 0.60.
What is the Total Population of Greensboro?
Total Population of Greensboro is 102.
What is the Total Male Population of Greensboro?
Total Male Population of Greensboro is 49.
What is the Total Female Population of Greensboro?
Total Female Population of Greensboro is 53.
What is the Ratio of Males per 100 Females in Greensboro?
There are 92.45 Males per 100 Females in Greensboro.
What is the Ratio of Females per 100 Males in Greensboro?
There are 108.16 Females per 100 Males in Greensboro.
What is the Median Population Age in Greensboro?
Median Population Age in Greensboro is 67.0 Years.
What is the Average Family Size in Greensboro
Average Family Size in Greensboro is 2.6 People.
What is the Average Household Size in Greensboro
Average Household Size in Greensboro is 1.8 People.
How Large is the Labor Force in Greensboro?
There are 42 People in the Labor Forcein in Greensboro.
What is the Percentage of People in the Labor Force in Greensboro?
41.2% of People are in the Labor Force in Greensboro.