Shelburne, VT Map & Demographics
Shelburne Map
Shelburne Overview
$57,268
PER CAPITA INCOME
$120,417
AVG FAMILY INCOME
$102,213
AVG HOUSEHOLD INCOME
8.2%
WAGE / INCOME GAP [ % ]
91.8¢/ $1
WAGE / INCOME GAP [ $ ]
0.43
INEQUALITY / GINI INDEX
6,195
TOTAL POPULATION
3,022
MALE POPULATION
3,173
FEMALE POPULATION
95.24
MALES / 100 FEMALES
105.00
FEMALES / 100 MALES
49.2
MEDIAN AGE
2.7
AVG FAMILY SIZE
2.3
AVG HOUSEHOLD SIZE
3,059
LABOR FORCE [ PEOPLE ]
59.9%
PERCENT IN LABOR FORCE
4.4%
UNEMPLOYMENT RATE
Shelburne Zip Codes
Shelburne Area Codes
Income in Shelburne
Income Overview in Shelburne
Per Capita Income in Shelburne is $57,268, while median incomes of families and households are $120,417 and $102,213 respectively.
| Characteristic | Number | Measure |
| Per Capita Income | 6,195 | $57,268 |
| Median Family Income | 1,914 | $120,417 |
| Mean Family Income | 1,914 | $142,797 |
| Median Household Income | 2,673 | $102,213 |
| Mean Household Income | 2,673 | $129,313 |
| Income Deficit | 1,914 | $0 |
| Wage / Income Gap (%) | 6,195 | 8.16% |
| Wage / Income Gap ($) | 6,195 | 91.84¢ per $1 |
| Gini / Inequality Index | 6,195 | 0.43 |
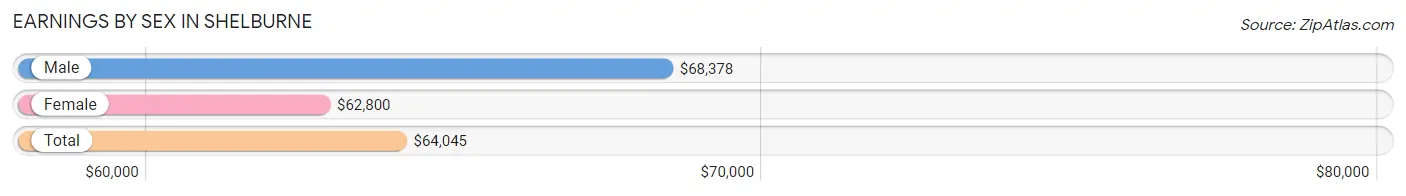
Earnings by Sex in Shelburne
Average Earnings in Shelburne are $64,045, $68,378 for men and $62,800 for women, a difference of 8.2%.
| Sex | Number | Average Earnings |
| Male | 1,673 (51.3%) | $68,378 |
| Female | 1,586 (48.7%) | $62,800 |
| Total | 3,259 (100.0%) | $64,045 |
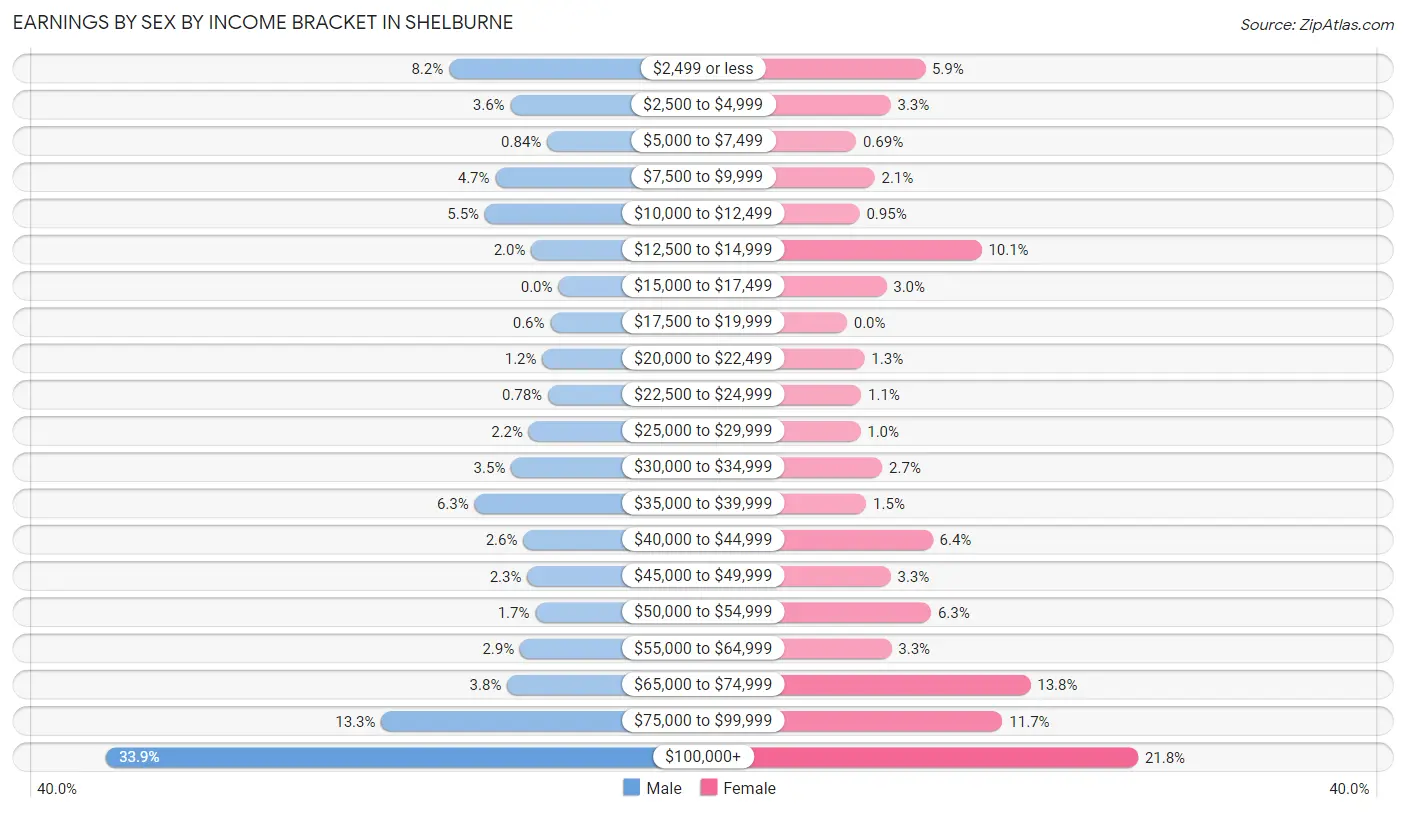
Earnings by Sex by Income Bracket in Shelburne
The most common earnings brackets in Shelburne are $100,000+ for men (567 | 33.9%) and $100,000+ for women (346 | 21.8%).
| Income | Male | Female |
| $2,499 or less | 137 (8.2%) | 93 (5.9%) |
| $2,500 to $4,999 | 60 (3.6%) | 52 (3.3%) |
| $5,000 to $7,499 | 14 (0.8%) | 11 (0.7%) |
| $7,500 to $9,999 | 79 (4.7%) | 33 (2.1%) |
| $10,000 to $12,499 | 92 (5.5%) | 15 (0.9%) |
| $12,500 to $14,999 | 34 (2.0%) | 160 (10.1%) |
| $15,000 to $17,499 | 0 (0.0%) | 47 (3.0%) |
| $17,500 to $19,999 | 10 (0.6%) | 0 (0.0%) |
| $20,000 to $22,499 | 20 (1.2%) | 21 (1.3%) |
| $22,500 to $24,999 | 13 (0.8%) | 17 (1.1%) |
| $25,000 to $29,999 | 37 (2.2%) | 16 (1.0%) |
| $30,000 to $34,999 | 59 (3.5%) | 42 (2.6%) |
| $35,000 to $39,999 | 105 (6.3%) | 23 (1.5%) |
| $40,000 to $44,999 | 44 (2.6%) | 102 (6.4%) |
| $45,000 to $49,999 | 39 (2.3%) | 52 (3.3%) |
| $50,000 to $54,999 | 29 (1.7%) | 100 (6.3%) |
| $55,000 to $64,999 | 48 (2.9%) | 53 (3.3%) |
| $65,000 to $74,999 | 64 (3.8%) | 218 (13.8%) |
| $75,000 to $99,999 | 222 (13.3%) | 185 (11.7%) |
| $100,000+ | 567 (33.9%) | 346 (21.8%) |
| Total | 1,673 (100.0%) | 1,586 (100.0%) |
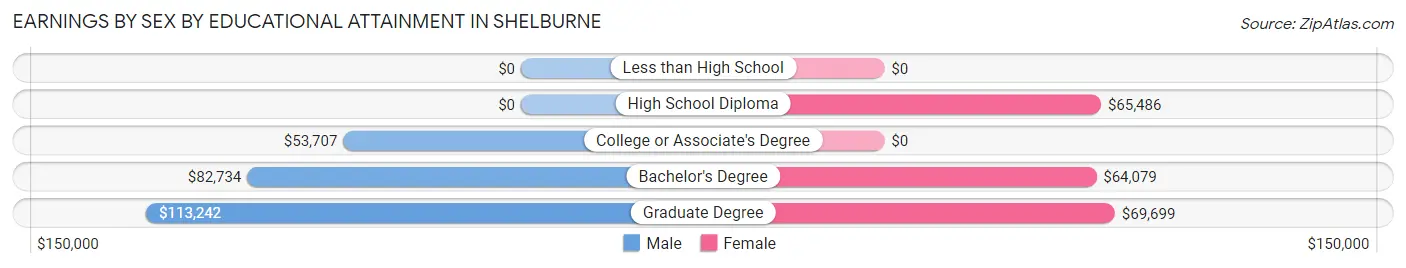
Earnings by Sex by Educational Attainment in Shelburne
Average earnings in Shelburne are $83,486 for men and $66,736 for women, a difference of 20.1%. Men with an educational attainment of graduate degree enjoy the highest average annual earnings of $113,242, while those with college or associate's degree education earn the least with $53,707. Women with an educational attainment of graduate degree earn the most with the average annual earnings of $69,699, while those with bachelor's degree education have the smallest earnings of $64,079.
| Educational Attainment | Male Income | Female Income |
| Less than High School | - | - |
| High School Diploma | - | - |
| College or Associate's Degree | $53,707 | $0 |
| Bachelor's Degree | $82,734 | $64,079 |
| Graduate Degree | $113,242 | $69,699 |
| Total | $83,486 | $66,736 |
Family Income in Shelburne
Family Income Brackets in Shelburne
According to the Shelburne family income data, there are 456 families falling into the $200,000+ income range, which is the most common income bracket and makes up 23.8% of all families.
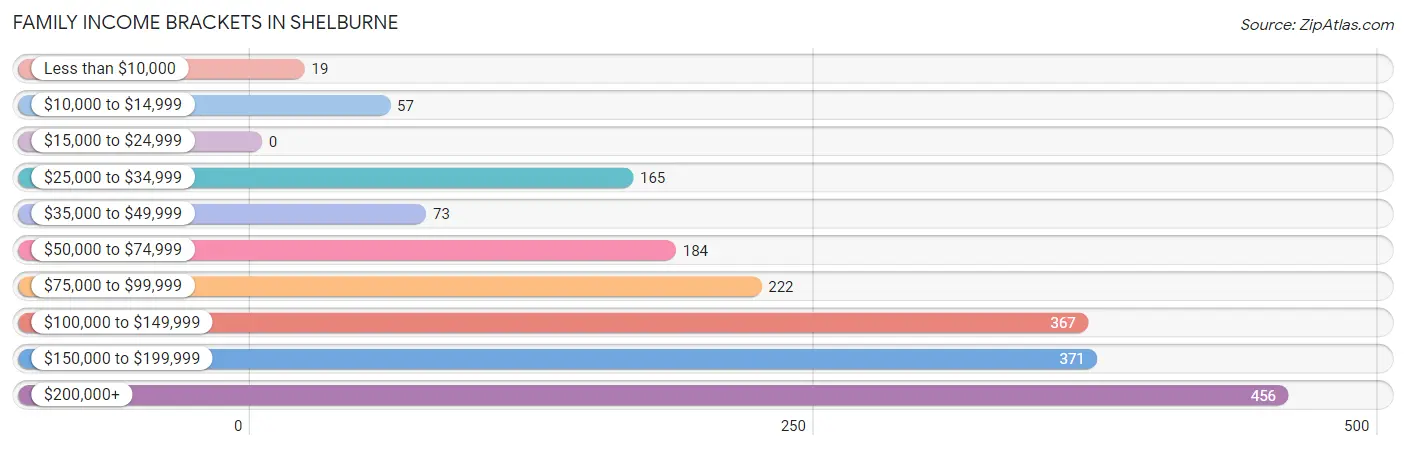
| Income Bracket | # Families | % Families |
| Less than $10,000 | 19 | 1.0% |
| $10,000 to $14,999 | 57 | 3.0% |
| $15,000 to $24,999 | 0 | 0.0% |
| $25,000 to $34,999 | 165 | 8.6% |
| $35,000 to $49,999 | 73 | 3.8% |
| $50,000 to $74,999 | 184 | 9.6% |
| $75,000 to $99,999 | 222 | 11.6% |
| $100,000 to $149,999 | 367 | 19.2% |
| $150,000 to $199,999 | 371 | 19.4% |
| $200,000+ | 456 | 23.8% |
Family Income by Famaliy Size in Shelburne
4-person families (359 | 18.8%) account for the highest median family income in Shelburne with $188,813 per family, while 2-person families (1,101 | 57.5%) have the highest median income of $53,931 per family member.
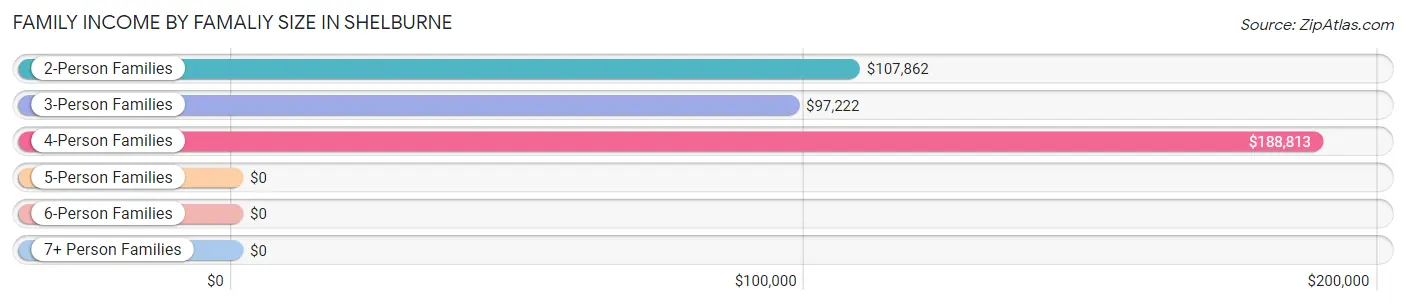
| Income Bracket | # Families | Median Income |
| 2-Person Families | 1,101 (57.5%) | $107,862 |
| 3-Person Families | 394 (20.6%) | $97,222 |
| 4-Person Families | 359 (18.8%) | $188,813 |
| 5-Person Families | 33 (1.7%) | $0 |
| 6-Person Families | 27 (1.4%) | $0 |
| 7+ Person Families | 0 (0.0%) | $0 |
| Total | 1,914 (100.0%) | $120,417 |
Family Income by Number of Earners in Shelburne
The median family income in Shelburne is $120,417, with families comprising 3+ earners (148) having the highest median family income of $188,750, while families with no earners (463) have the lowest median family income of $93,511, accounting for 7.7% and 24.2% of families, respectively.
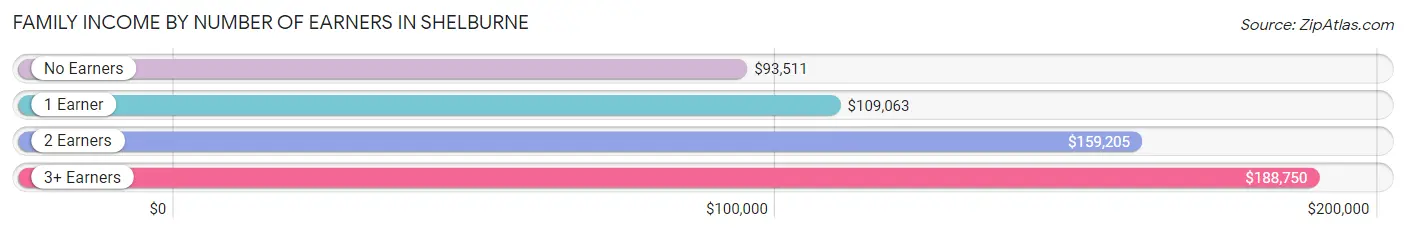
| Number of Earners | # Families | Median Income |
| No Earners | 463 (24.2%) | $93,511 |
| 1 Earner | 294 (15.4%) | $109,063 |
| 2 Earners | 1,009 (52.7%) | $159,205 |
| 3+ Earners | 148 (7.7%) | $188,750 |
| Total | 1,914 (100.0%) | $120,417 |
Household Income in Shelburne
Household Income Brackets in Shelburne
With 519 households falling in the category, the $100,000 to $149,999 income range is the most frequent in Shelburne, accounting for 19.4% of all households. In contrast, only 64 households (2.4%) fall into the less than $10,000 income bracket, making it the least populous group.
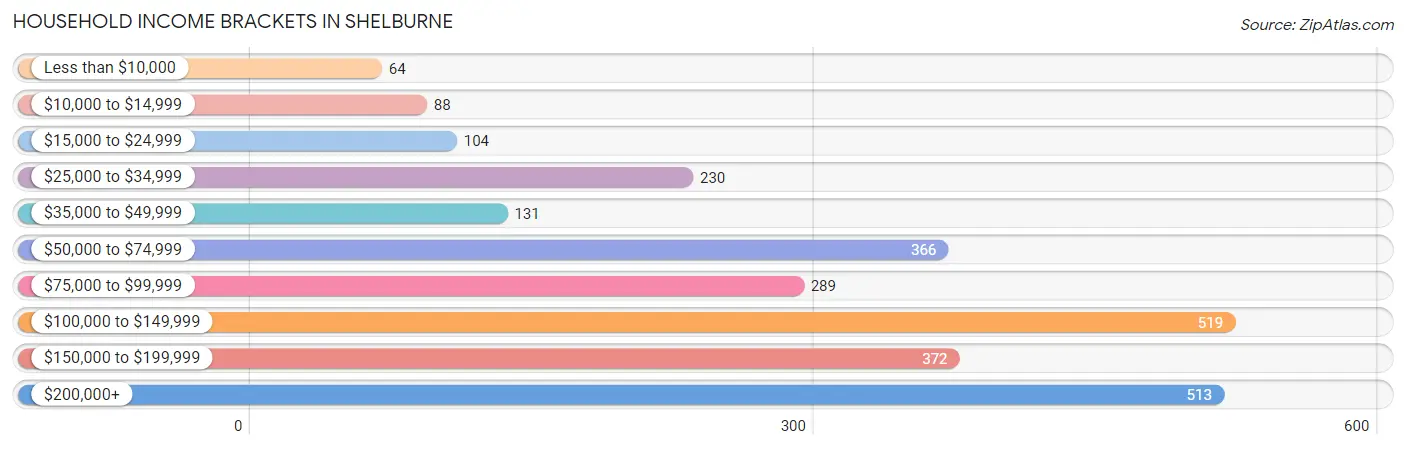
| Income Bracket | # Households | % Households |
| Less than $10,000 | 64 | 2.4% |
| $10,000 to $14,999 | 88 | 3.3% |
| $15,000 to $24,999 | 104 | 3.9% |
| $25,000 to $34,999 | 230 | 8.6% |
| $35,000 to $49,999 | 131 | 4.9% |
| $50,000 to $74,999 | 366 | 13.7% |
| $75,000 to $99,999 | 289 | 10.8% |
| $100,000 to $149,999 | 519 | 19.4% |
| $150,000 to $199,999 | 372 | 13.9% |
| $200,000+ | 513 | 19.2% |
Household Income by Householder Age in Shelburne
The median household income in Shelburne is $102,213, with the highest median household income of $114,318 found in the 25 to 44 years age bracket for the primary householder. A total of 560 households (20.9%) fall into this category. Meanwhile, the 15 to 24 years age bracket for the primary householder has the lowest median household income of $0, with 19 households (0.7%) in this group.
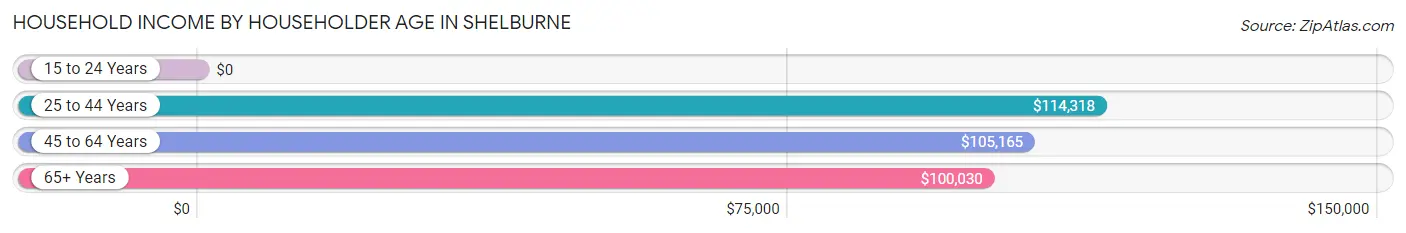
| Income Bracket | # Households | Median Income |
| 15 to 24 Years | 19 (0.7%) | $0 |
| 25 to 44 Years | 560 (20.9%) | $114,318 |
| 45 to 64 Years | 1,103 (41.3%) | $105,165 |
| 65+ Years | 991 (37.1%) | $100,030 |
| Total | 2,673 (100.0%) | $102,213 |
Poverty in Shelburne
Income Below Poverty by Sex and Age in Shelburne
With 4.8% poverty level for males and 7.7% for females among the residents of Shelburne, 5 year old males and 25 to 34 year old females are the most vulnerable to poverty, with 33 males (54.1%) and 33 females (18.3%) in their respective age groups living below the poverty level.
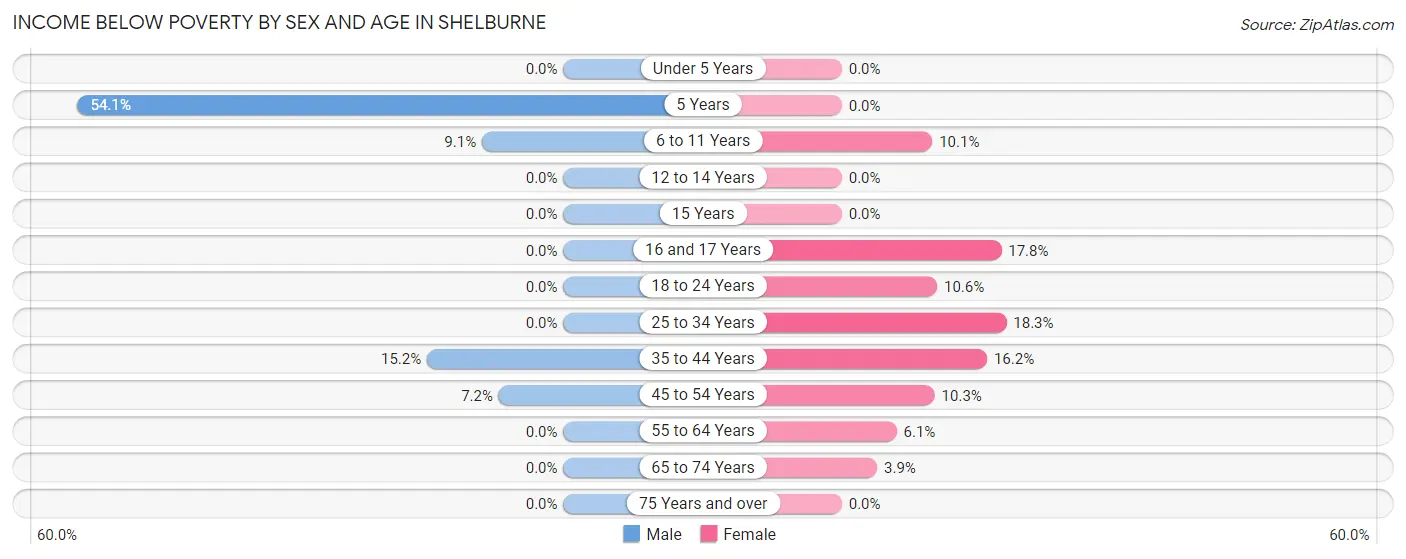
| Age Bracket | Male | Female |
| Under 5 Years | 0 (0.0%) | 0 (0.0%) |
| 5 Years | 33 (54.1%) | 0 (0.0%) |
| 6 to 11 Years | 28 (9.1%) | 15 (10.1%) |
| 12 to 14 Years | 0 (0.0%) | 0 (0.0%) |
| 15 Years | 0 (0.0%) | 0 (0.0%) |
| 16 and 17 Years | 0 (0.0%) | 19 (17.8%) |
| 18 to 24 Years | 0 (0.0%) | 7 (10.6%) |
| 25 to 34 Years | 0 (0.0%) | 33 (18.3%) |
| 35 to 44 Years | 51 (15.2%) | 76 (16.2%) |
| 45 to 54 Years | 31 (7.2%) | 40 (10.3%) |
| 55 to 64 Years | 0 (0.0%) | 35 (6.1%) |
| 65 to 74 Years | 0 (0.0%) | 14 (3.9%) |
| 75 Years and over | 0 (0.0%) | 0 (0.0%) |
| Total | 143 (4.8%) | 239 (7.7%) |
Income Above Poverty by Sex and Age in Shelburne
According to the poverty statistics in Shelburne, males aged under 5 years and females aged under 5 years are the age groups that are most secure financially, with 100.0% of males and 100.0% of females in these age groups living above the poverty line.
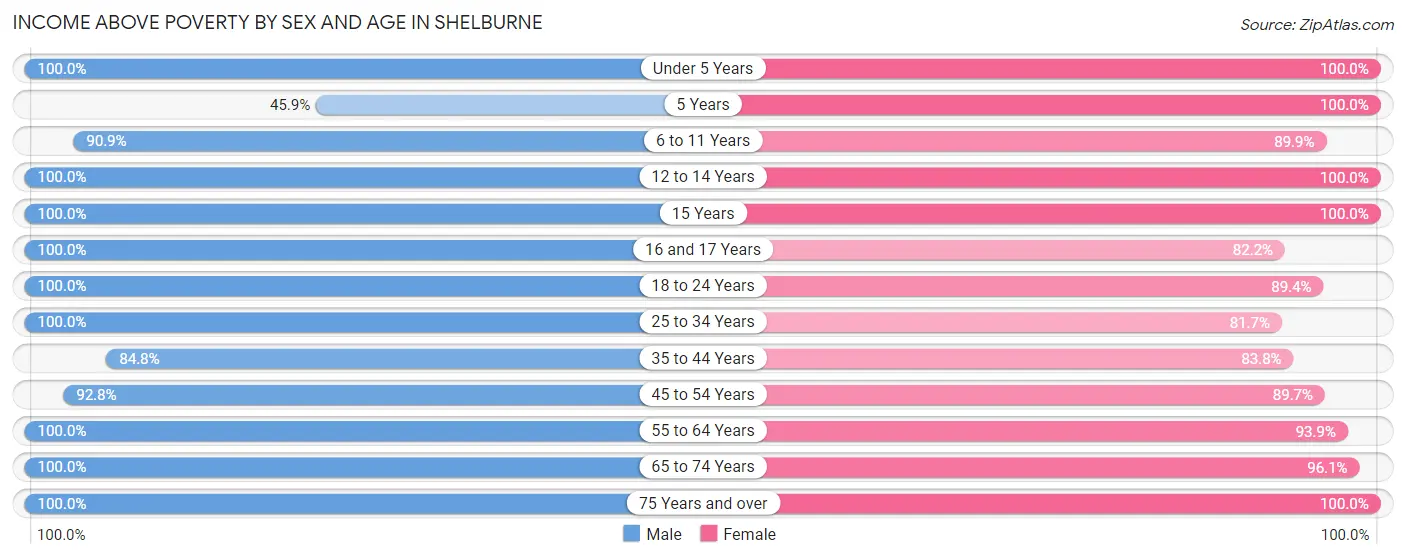
| Age Bracket | Male | Female |
| Under 5 Years | 104 (100.0%) | 102 (100.0%) |
| 5 Years | 28 (45.9%) | 7 (100.0%) |
| 6 to 11 Years | 281 (90.9%) | 134 (89.9%) |
| 12 to 14 Years | 133 (100.0%) | 134 (100.0%) |
| 15 Years | 28 (100.0%) | 57 (100.0%) |
| 16 and 17 Years | 225 (100.0%) | 88 (82.2%) |
| 18 to 24 Years | 189 (100.0%) | 59 (89.4%) |
| 25 to 34 Years | 112 (100.0%) | 147 (81.7%) |
| 35 to 44 Years | 285 (84.8%) | 394 (83.8%) |
| 45 to 54 Years | 400 (92.8%) | 347 (89.7%) |
| 55 to 64 Years | 318 (100.0%) | 539 (93.9%) |
| 65 to 74 Years | 346 (100.0%) | 342 (96.1%) |
| 75 Years and over | 404 (100.0%) | 503 (100.0%) |
| Total | 2,853 (95.2%) | 2,853 (92.3%) |
Income Below Poverty Among Married-Couple Families in Shelburne
The poverty statistics for married-couple families in Shelburne show that 2.1% or 31 of the total 1,499 families live below the poverty line. Families with 1 or 2 children have the highest poverty rate of 5.8%, comprising of 31 families. On the other hand, families with no children have the lowest poverty rate of 0.0%, which includes 0 families.
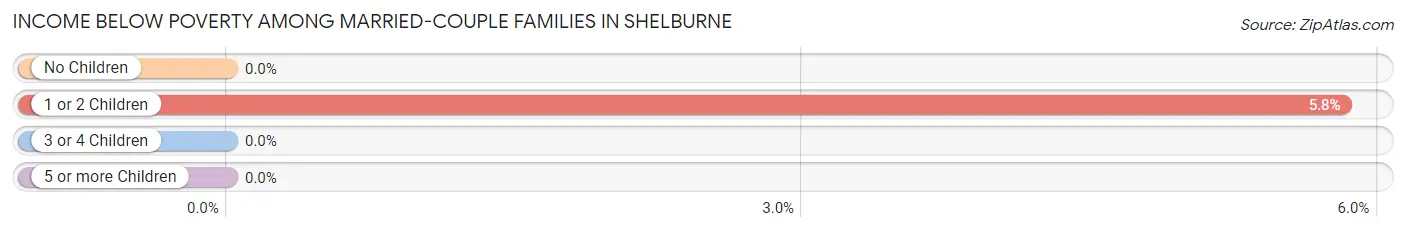
| Children | Above Poverty | Below Poverty |
| No Children | 922 (100.0%) | 0 (0.0%) |
| 1 or 2 Children | 502 (94.2%) | 31 (5.8%) |
| 3 or 4 Children | 44 (100.0%) | 0 (0.0%) |
| 5 or more Children | 0 (0.0%) | 0 (0.0%) |
| Total | 1,468 (97.9%) | 31 (2.1%) |
Income Below Poverty Among Single-Parent Households in Shelburne
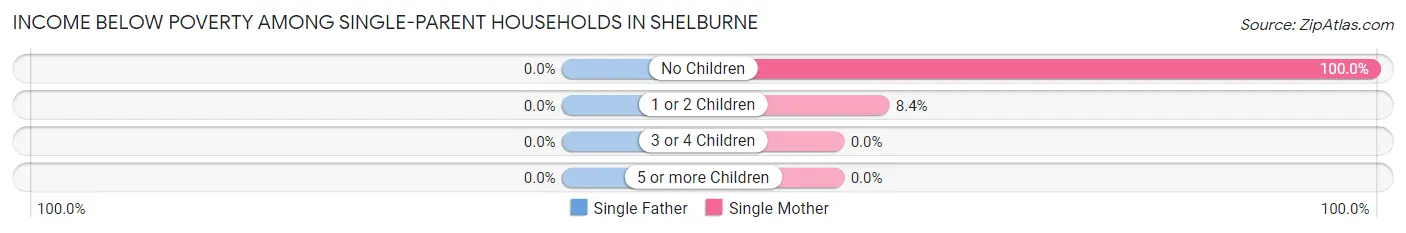
| Children | Single Father | Single Mother |
| No Children | 0 (0.0%) | 26 (100.0%) |
| 1 or 2 Children | 0 (0.0%) | 19 (8.4%) |
| 3 or 4 Children | 0 (0.0%) | 0 (0.0%) |
| 5 or more Children | 0 (0.0%) | 0 (0.0%) |
| Total | 0 (0.0%) | 45 (17.9%) |
Income Below Poverty Among Married-Couple vs Single-Parent Households in Shelburne
The poverty data for Shelburne shows that 31 of the married-couple family households (2.1%) and 45 of the single-parent households (10.8%) are living below the poverty level. Within the married-couple family households, those with 1 or 2 children have the highest poverty rate, with 31 households (5.8%) falling below the poverty line. Among the single-parent households, those with no children have the highest poverty rate, with 26 household (100.0%) living below poverty.
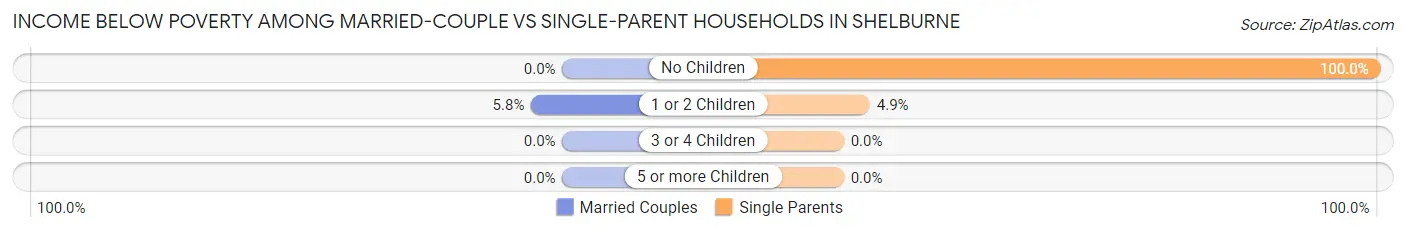
| Children | Married-Couple Families | Single-Parent Households |
| No Children | 0 (0.0%) | 26 (100.0%) |
| 1 or 2 Children | 31 (5.8%) | 19 (4.9%) |
| 3 or 4 Children | 0 (0.0%) | 0 (0.0%) |
| 5 or more Children | 0 (0.0%) | 0 (0.0%) |
| Total | 31 (2.1%) | 45 (10.8%) |
Race in Shelburne
The most populous races in Shelburne are White / Caucasian (5,724 | 92.4%), Two or more Races (367 | 5.9%), and Hispanic or Latino (195 | 3.2%).
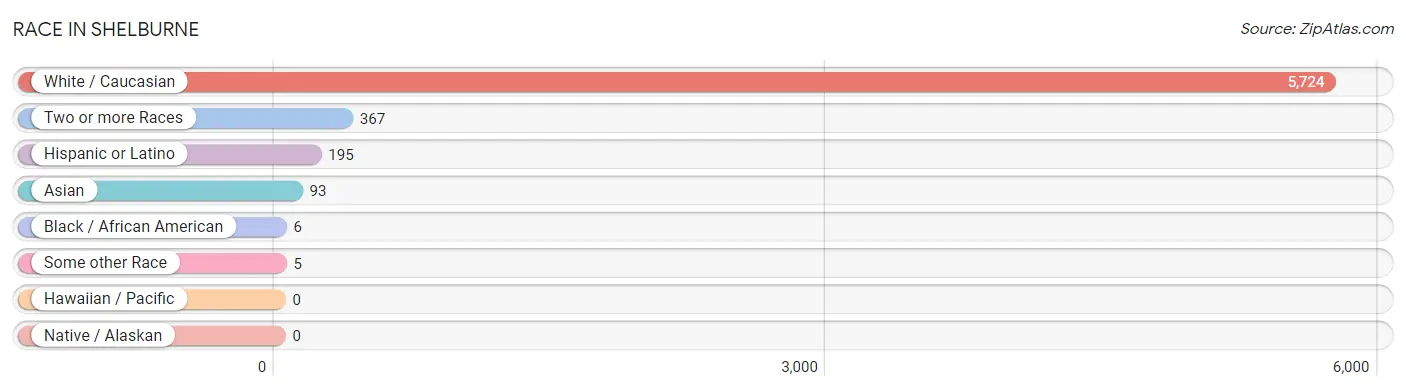
| Race | # Population | % Population |
| Asian | 93 | 1.5% |
| Black / African American | 6 | 0.1% |
| Hawaiian / Pacific | 0 | 0.0% |
| Hispanic or Latino | 195 | 3.2% |
| Native / Alaskan | 0 | 0.0% |
| White / Caucasian | 5,724 | 92.4% |
| Two or more Races | 367 | 5.9% |
| Some other Race | 5 | 0.1% |
| Total | 6,195 | 100.0% |
Ancestry in Shelburne
The most populous ancestries reported in Shelburne are English (1,349 | 21.8%), German (896 | 14.5%), Irish (878 | 14.2%), French (504 | 8.1%), and French Canadian (476 | 7.7%), together accounting for 66.2% of all Shelburne residents.
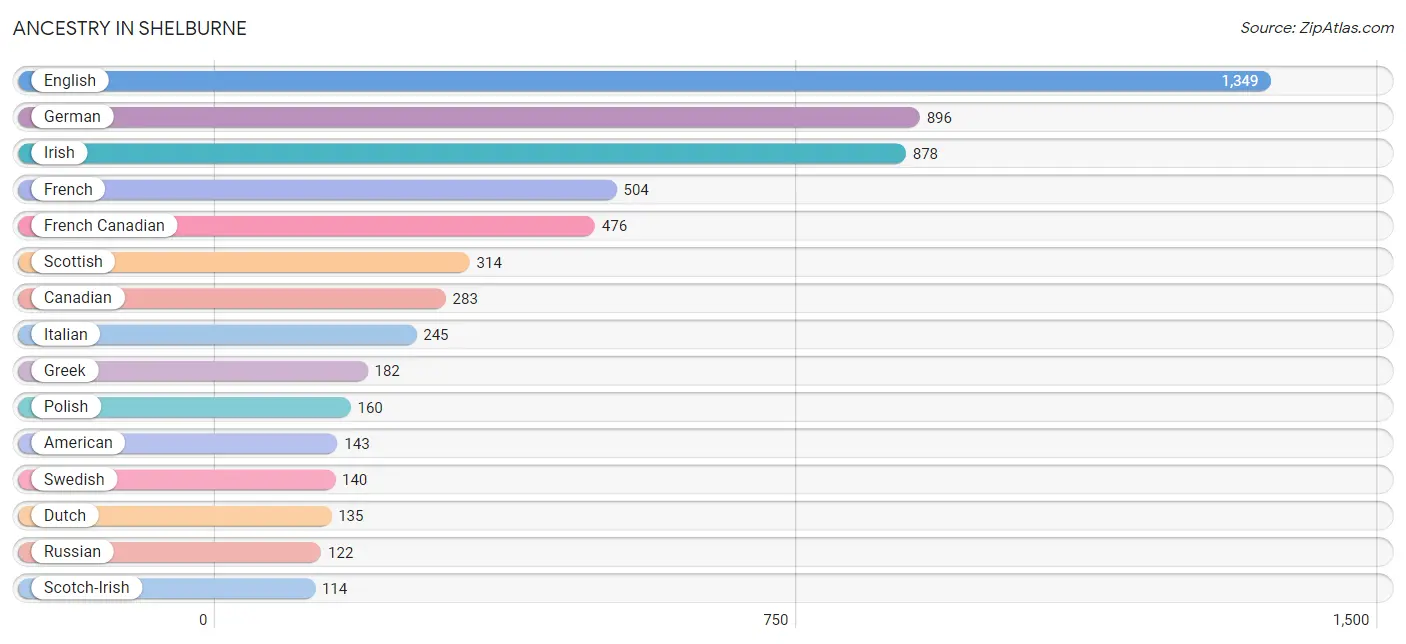
| Ancestry | # Population | % Population |
| American | 143 | 2.3% |
| Argentinean | 17 | 0.3% |
| Belgian | 15 | 0.2% |
| Bhutanese | 42 | 0.7% |
| Blackfeet | 14 | 0.2% |
| British | 15 | 0.2% |
| Canadian | 283 | 4.6% |
| Chippewa | 12 | 0.2% |
| Choctaw | 14 | 0.2% |
| Colombian | 53 | 0.9% |
| Cuban | 10 | 0.2% |
| Czech | 46 | 0.7% |
| Danish | 47 | 0.8% |
| Dutch | 135 | 2.2% |
| Eastern European | 43 | 0.7% |
| English | 1,349 | 21.8% |
| European | 112 | 1.8% |
| French | 504 | 8.1% |
| French American Indian | 42 | 0.7% |
| French Canadian | 476 | 7.7% |
| German | 896 | 14.5% |
| Greek | 182 | 2.9% |
| Hungarian | 26 | 0.4% |
| Indian (Asian) | 99 | 1.6% |
| Iranian | 23 | 0.4% |
| Irish | 878 | 14.2% |
| Italian | 245 | 4.0% |
| Korean | 21 | 0.3% |
| Lithuanian | 14 | 0.2% |
| Maltese | 14 | 0.2% |
| Mexican | 13 | 0.2% |
| Northern European | 90 | 1.5% |
| Norwegian | 74 | 1.2% |
| Peruvian | 5 | 0.1% |
| Polish | 160 | 2.6% |
| Portuguese | 13 | 0.2% |
| Puerto Rican | 27 | 0.4% |
| Russian | 122 | 2.0% |
| Scandinavian | 14 | 0.2% |
| Scotch-Irish | 114 | 1.8% |
| Scottish | 314 | 5.1% |
| Slovak | 31 | 0.5% |
| South American | 75 | 1.2% |
| Spaniard | 66 | 1.1% |
| Sri Lankan | 5 | 0.1% |
| Swedish | 140 | 2.3% |
| Swiss | 17 | 0.3% |
| Ukrainian | 32 | 0.5% |
| Welsh | 99 | 1.6% |
| Yugoslavian | 12 | 0.2% | View All 50 Rows |
Immigrants in Shelburne
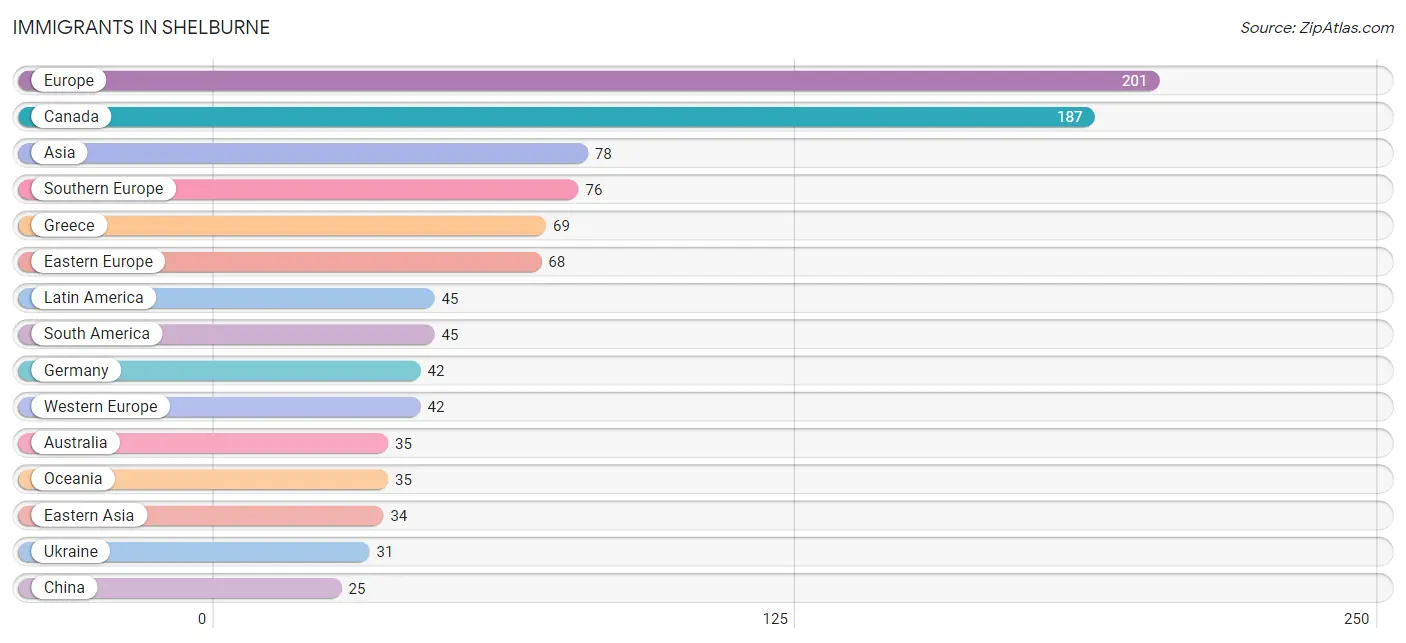
The most numerous immigrant groups reported in Shelburne came from Europe (201 | 3.2%), Canada (187 | 3.0%), Asia (78 | 1.3%), Southern Europe (76 | 1.2%), and Greece (69 | 1.1%), together accounting for 9.9% of all Shelburne residents.
| Immigration Origin | # Population | % Population |
| Argentina | 17 | 0.3% |
| Asia | 78 | 1.3% |
| Australia | 35 | 0.6% |
| Bosnia and Herzegovina | 12 | 0.2% |
| Canada | 187 | 3.0% |
| China | 25 | 0.4% |
| Colombia | 23 | 0.4% |
| Eastern Asia | 34 | 0.5% |
| Eastern Europe | 68 | 1.1% |
| Europe | 201 | 3.2% |
| Germany | 42 | 0.7% |
| Greece | 69 | 1.1% |
| Iran | 23 | 0.4% |
| Ireland | 15 | 0.2% |
| Japan | 9 | 0.2% |
| Latin America | 45 | 0.7% |
| Northern Europe | 15 | 0.2% |
| Oceania | 35 | 0.6% |
| Peru | 5 | 0.1% |
| Philippines | 21 | 0.3% |
| Poland | 25 | 0.4% |
| Portugal | 7 | 0.1% |
| South America | 45 | 0.7% |
| South Central Asia | 23 | 0.4% |
| South Eastern Asia | 21 | 0.3% |
| Southern Europe | 76 | 1.2% |
| Ukraine | 31 | 0.5% |
| Western Europe | 42 | 0.7% | View All 28 Rows |
Sex and Age in Shelburne
Sex and Age in Shelburne
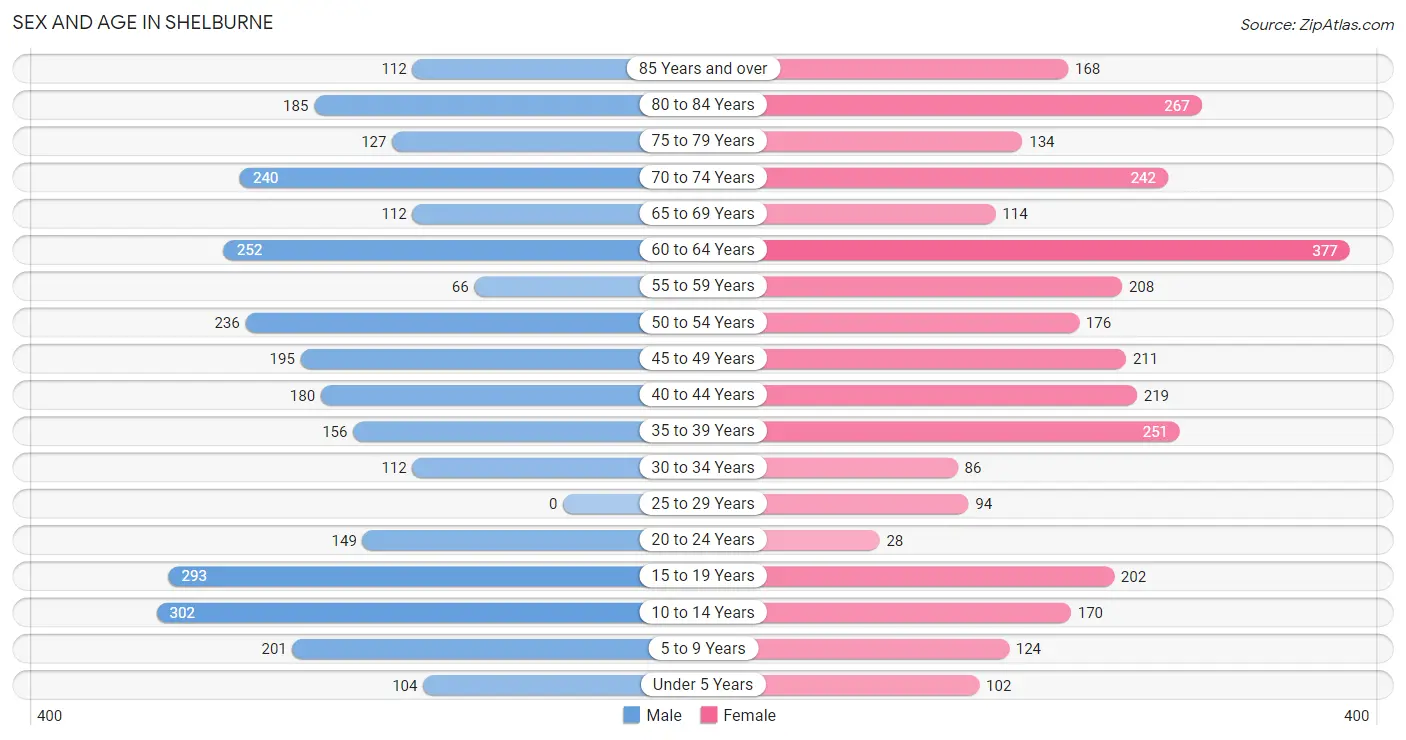
The most populous age groups in Shelburne are 10 to 14 Years (302 | 10.0%) for men and 60 to 64 Years (377 | 11.9%) for women.
| Age Bracket | Male | Female |
| Under 5 Years | 104 (3.4%) | 102 (3.2%) |
| 5 to 9 Years | 201 (6.7%) | 124 (3.9%) |
| 10 to 14 Years | 302 (10.0%) | 170 (5.4%) |
| 15 to 19 Years | 293 (9.7%) | 202 (6.4%) |
| 20 to 24 Years | 149 (4.9%) | 28 (0.9%) |
| 25 to 29 Years | 0 (0.0%) | 94 (3.0%) |
| 30 to 34 Years | 112 (3.7%) | 86 (2.7%) |
| 35 to 39 Years | 156 (5.2%) | 251 (7.9%) |
| 40 to 44 Years | 180 (6.0%) | 219 (6.9%) |
| 45 to 49 Years | 195 (6.5%) | 211 (6.7%) |
| 50 to 54 Years | 236 (7.8%) | 176 (5.6%) |
| 55 to 59 Years | 66 (2.2%) | 208 (6.6%) |
| 60 to 64 Years | 252 (8.3%) | 377 (11.9%) |
| 65 to 69 Years | 112 (3.7%) | 114 (3.6%) |
| 70 to 74 Years | 240 (7.9%) | 242 (7.6%) |
| 75 to 79 Years | 127 (4.2%) | 134 (4.2%) |
| 80 to 84 Years | 185 (6.1%) | 267 (8.4%) |
| 85 Years and over | 112 (3.7%) | 168 (5.3%) |
| Total | 3,022 (100.0%) | 3,173 (100.0%) |
Families and Households in Shelburne
Median Family Size in Shelburne
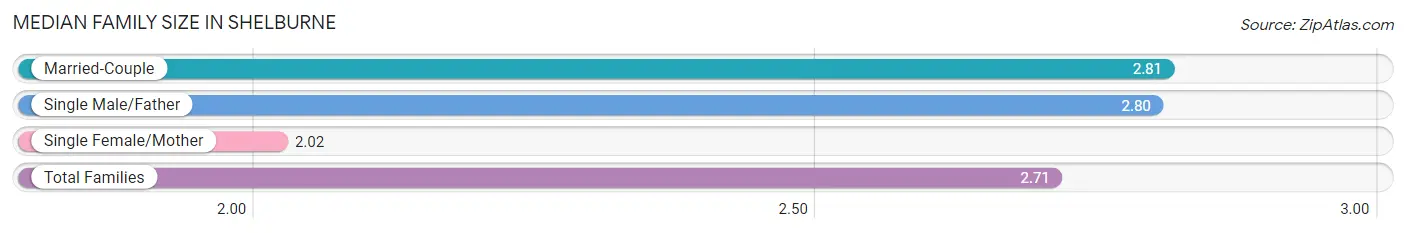
The median family size in Shelburne is 2.71 persons per family, with married-couple families (1,499 | 78.3%) accounting for the largest median family size of 2.81 persons per family. On the other hand, single female/mother families (252 | 13.2%) represent the smallest median family size with 2.02 persons per family.
| Family Type | # Families | Family Size |
| Married-Couple | 1,499 (78.3%) | 2.81 |
| Single Male/Father | 163 (8.5%) | 2.80 |
| Single Female/Mother | 252 (13.2%) | 2.02 |
| Total Families | 1,914 (100.0%) | 2.71 |
Median Household Size in Shelburne
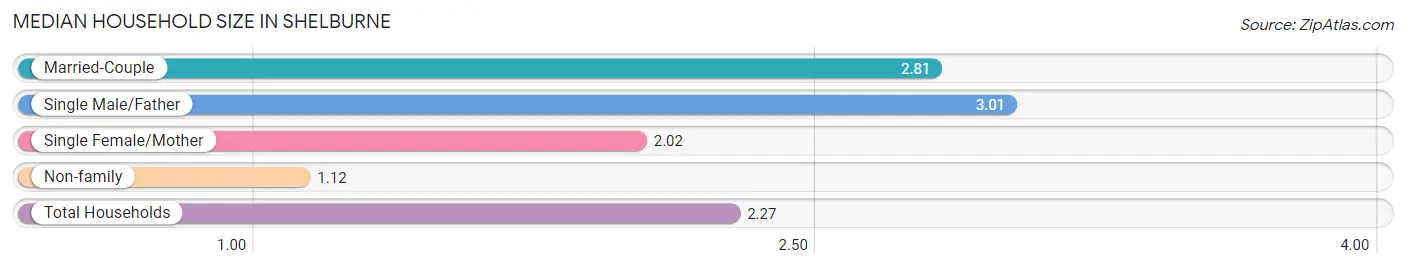
The median household size in Shelburne is 2.27 persons per household, with single male/father households (163 | 6.1%) accounting for the largest median household size of 3.01 persons per household. non-family households (759 | 28.4%) represent the smallest median household size with 1.12 persons per household.
| Household Type | # Households | Household Size |
| Married-Couple | 1,499 (56.1%) | 2.81 |
| Single Male/Father | 163 (6.1%) | 3.01 |
| Single Female/Mother | 252 (9.4%) | 2.02 |
| Non-family | 759 (28.4%) | 1.12 |
| Total Households | 2,673 (100.0%) | 2.27 |
Household Size by Marriage Status in Shelburne
Out of a total of 2,673 households in Shelburne, 1,914 (71.6%) are family households, while 759 (28.4%) are nonfamily households. The most numerous type of family households are 2-person households, comprising 1,101, and the most common type of nonfamily households are 1-person households, comprising 645.
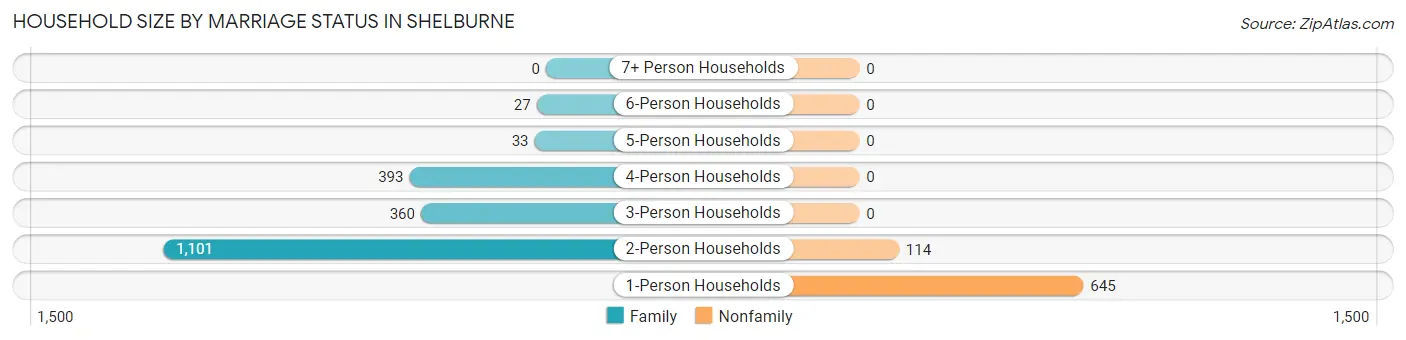
| Household Size | Family Households | Nonfamily Households |
| 1-Person Households | - | 645 (24.1%) |
| 2-Person Households | 1,101 (41.2%) | 114 (4.3%) |
| 3-Person Households | 360 (13.5%) | 0 (0.0%) |
| 4-Person Households | 393 (14.7%) | 0 (0.0%) |
| 5-Person Households | 33 (1.2%) | 0 (0.0%) |
| 6-Person Households | 27 (1.0%) | 0 (0.0%) |
| 7+ Person Households | 0 (0.0%) | 0 (0.0%) |
| Total | 1,914 (71.6%) | 759 (28.4%) |
Female Fertility in Shelburne
Fertility by Age in Shelburne
Average fertility rate in Shelburne is 66.0 births per 1,000 women. Women in the age bracket of 20 to 34 years have the highest fertility rate with 221.0 births per 1,000 women. Women in the age bracket of 20 to 34 years acount for 62.2% of all women with births.
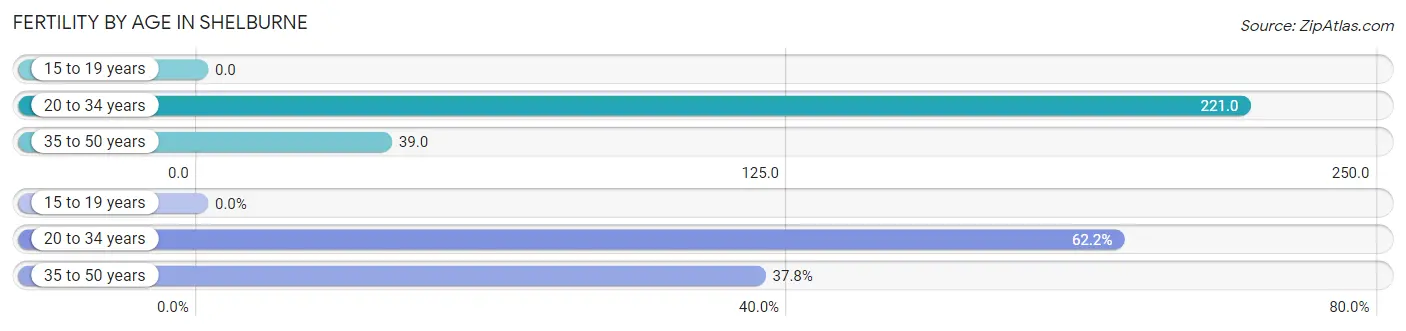
| Age Bracket | Women with Births | Births / 1,000 Women |
| 15 to 19 years | 0 (0.0%) | 0.0 |
| 20 to 34 years | 46 (62.2%) | 221.0 |
| 35 to 50 years | 28 (37.8%) | 39.0 |
| Total | 74 (100.0%) | 66.0 |
Fertility by Age by Marriage Status in Shelburne
86.5% of women with births (74) in Shelburne are married. The highest percentage of unmarried women with births falls into 35 to 50 years age bracket with 17.9% of them unmarried at the time of birth, while the lowest percentage of unmarried women with births belong to 20 to 34 years age bracket with 10.9% of them unmarried.
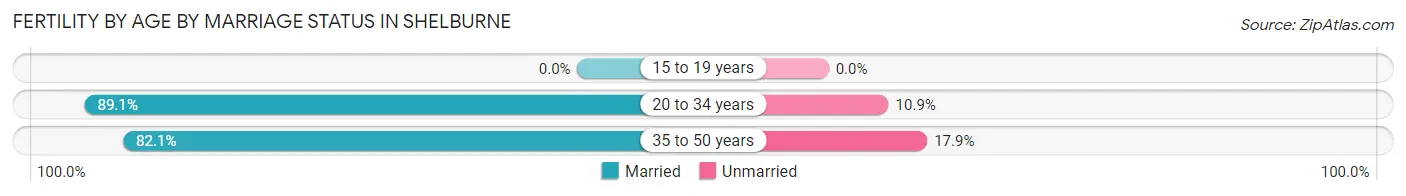
| Age Bracket | Married | Unmarried |
| 15 to 19 years | 0 (0.0%) | 0 (0.0%) |
| 20 to 34 years | 41 (89.1%) | 5 (10.9%) |
| 35 to 50 years | 23 (82.1%) | 5 (17.9%) |
| Total | 64 (86.5%) | 10 (13.5%) |
Fertility by Education in Shelburne
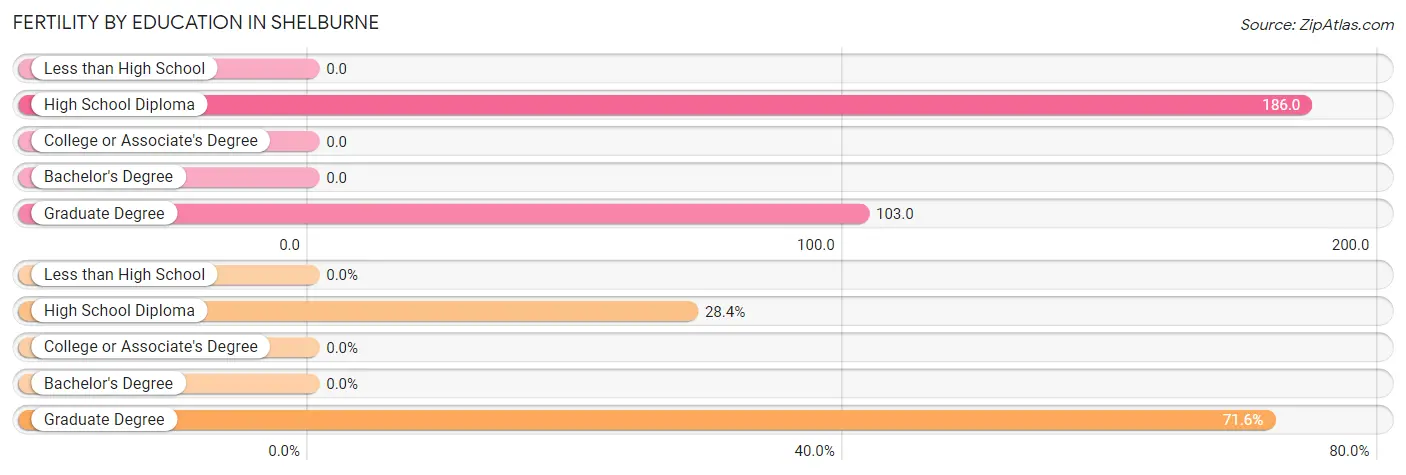
| Educational Attainment | Women with Births | Births / 1,000 Women |
| Less than High School | 0 (0.0%) | 0.0 |
| High School Diploma | 21 (28.4%) | 186.0 |
| College or Associate's Degree | 0 (0.0%) | 0.0 |
| Bachelor's Degree | 0 (0.0%) | 0.0 |
| Graduate Degree | 53 (71.6%) | 103.0 |
| Total | 74 (100.0%) | 66.0 |
Fertility by Education by Marriage Status in Shelburne
13.5% of women with births in Shelburne are unmarried. Women with the educational attainment of graduate degree are most likely to be married with 100.0% of them married at childbirth, while women with the educational attainment of high school diploma are least likely to be married with 47.6% of them unmarried at childbirth.
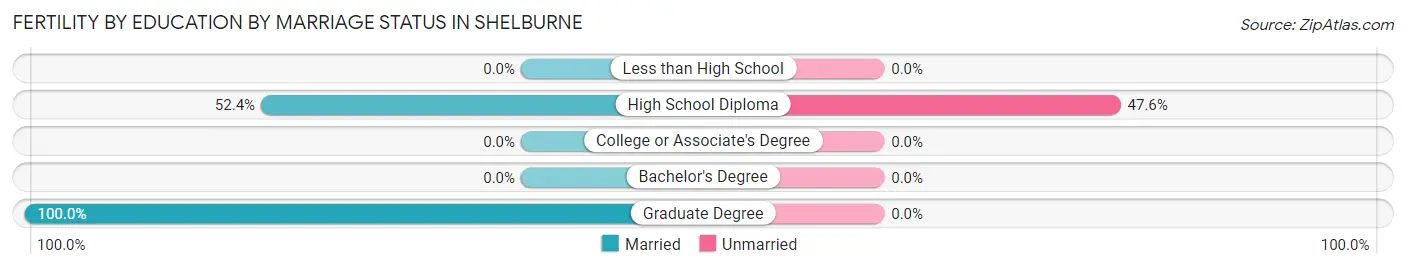
| Educational Attainment | Married | Unmarried |
| Less than High School | 0 (0.0%) | 0 (0.0%) |
| High School Diploma | 11 (52.4%) | 10 (47.6%) |
| College or Associate's Degree | 0 (0.0%) | 0 (0.0%) |
| Bachelor's Degree | 0 (0.0%) | 0 (0.0%) |
| Graduate Degree | 53 (100.0%) | 0 (0.0%) |
| Total | 64 (86.5%) | 10 (13.5%) |
Employment Characteristics in Shelburne
Employment by Class of Employer in Shelburne
Among the 2,887 employed individuals in Shelburne, private company employees (1,257 | 43.5%), not-for-profit organizations (677 | 23.4%), and self-employed (not incorporated) (373 | 12.9%) make up the most common classes of employment.
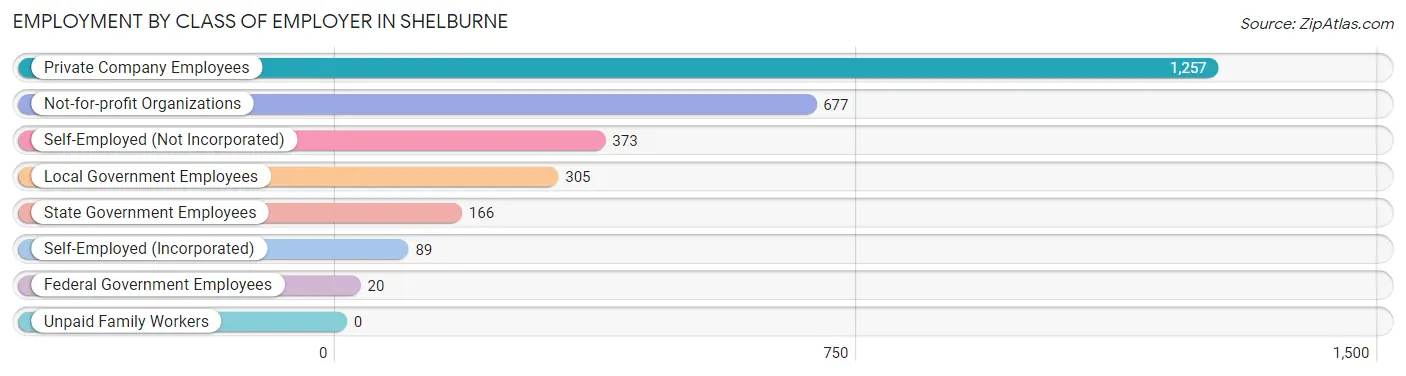
| Employer Class | # Employees | % Employees |
| Private Company Employees | 1,257 | 43.5% |
| Self-Employed (Incorporated) | 89 | 3.1% |
| Self-Employed (Not Incorporated) | 373 | 12.9% |
| Not-for-profit Organizations | 677 | 23.4% |
| Local Government Employees | 305 | 10.6% |
| State Government Employees | 166 | 5.8% |
| Federal Government Employees | 20 | 0.7% |
| Unpaid Family Workers | 0 | 0.0% |
| Total | 2,887 | 100.0% |
Employment Status by Age in Shelburne
According to the labor force statistics for Shelburne, out of the total population over 16 years of age (5,107), 59.9% or 3,059 individuals are in the labor force, with 4.4% or 135 of them unemployed. The age group with the highest labor force participation rate is 30 to 34 years, with 97.5% or 193 individuals in the labor force. Within the labor force, the 16 to 19 years age range has the highest percentage of unemployed individuals, with 51.3% or 77 of them being unemployed.
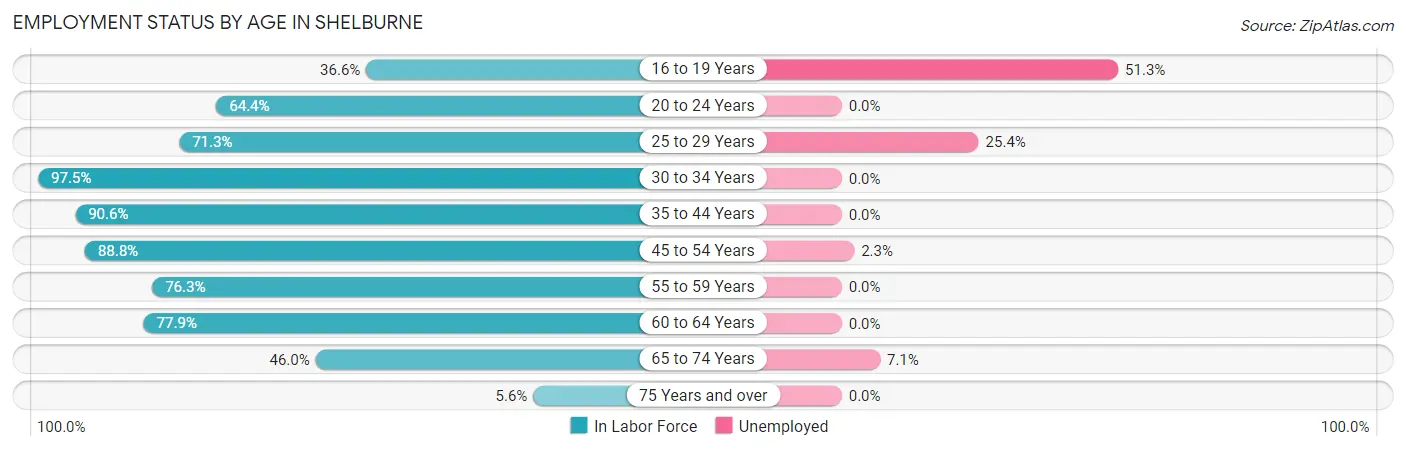
| Age Bracket | In Labor Force | Unemployed |
| 16 to 19 Years | 150 (36.6%) | 77 (51.3%) |
| 20 to 24 Years | 114 (64.4%) | 0 (0.0%) |
| 25 to 29 Years | 67 (71.3%) | 17 (25.4%) |
| 30 to 34 Years | 193 (97.5%) | 0 (0.0%) |
| 35 to 44 Years | 730 (90.6%) | 0 (0.0%) |
| 45 to 54 Years | 726 (88.8%) | 17 (2.3%) |
| 55 to 59 Years | 209 (76.3%) | 0 (0.0%) |
| 60 to 64 Years | 490 (77.9%) | 0 (0.0%) |
| 65 to 74 Years | 326 (46.0%) | 23 (7.1%) |
| 75 Years and over | 56 (5.6%) | 0 (0.0%) |
| Total | 3,059 (59.9%) | 135 (4.4%) |
Employment Status by Educational Attainment in Shelburne
According to labor force statistics for Shelburne, 85.7% of individuals (2,416) out of the total population between 25 and 64 years of age (2,819) are in the labor force, with 1.4% or 34 of them being unemployed. The group with the highest labor force participation rate are those with the educational attainment of college / associate degree, with 91.7% or 593 individuals in the labor force. Within the labor force, individuals with college / associate degree education have the highest percentage of unemployment, with 2.9% or 17 of them being unemployed.
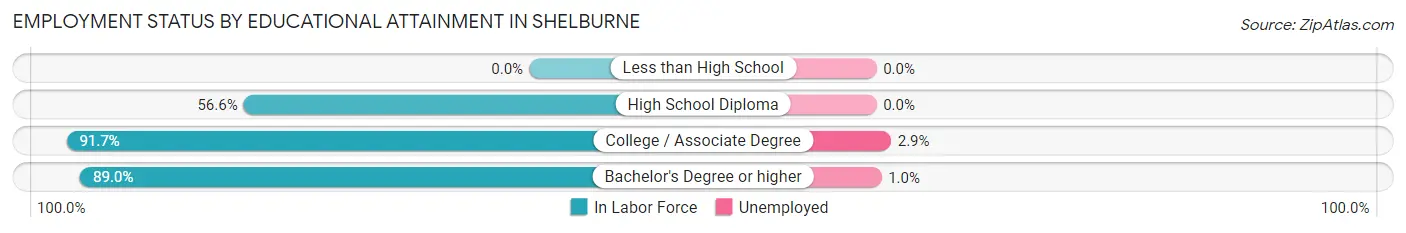
| Educational Attainment | In Labor Force | Unemployed |
| Less than High School | 0 (0.0%) | 0 (0.0%) |
| High School Diploma | 128 (56.6%) | 0 (0.0%) |
| College / Associate Degree | 593 (91.7%) | 19 (2.9%) |
| Bachelor's Degree or higher | 1,694 (89.0%) | 19 (1.0%) |
| Total | 2,416 (85.7%) | 39 (1.4%) |
Employment Occupations by Sex in Shelburne
Management, Business, Science and Arts Occupations
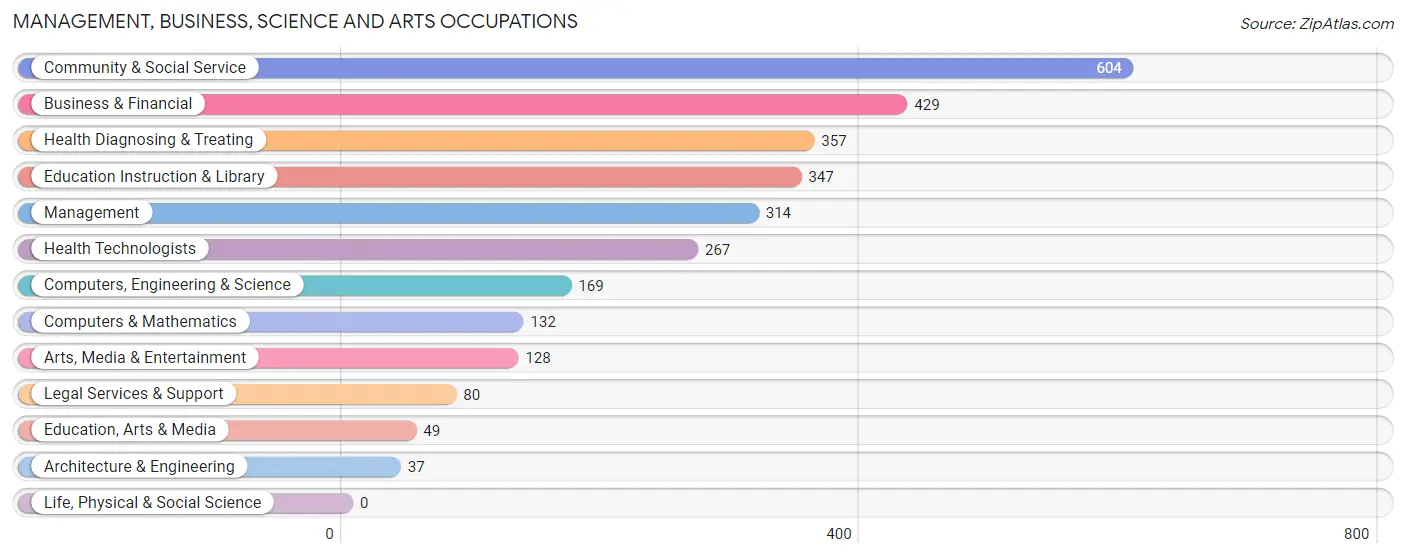
The most common Management, Business, Science and Arts occupations in Shelburne are Community & Social Service (604 | 20.6%), Business & Financial (429 | 14.7%), Health Diagnosing & Treating (357 | 12.2%), Education Instruction & Library (347 | 11.9%), and Management (314 | 10.7%).
Management, Business, Science and Arts Occupations by Sex
Within the Management, Business, Science and Arts occupations in Shelburne, the most male-oriented occupations are Architecture & Engineering (91.9%), Computers, Engineering & Science (78.7%), and Computers & Mathematics (75.0%), while the most female-oriented occupations are Arts, Media & Entertainment (83.6%), Health Diagnosing & Treating (73.7%), and Health Technologists (64.8%).
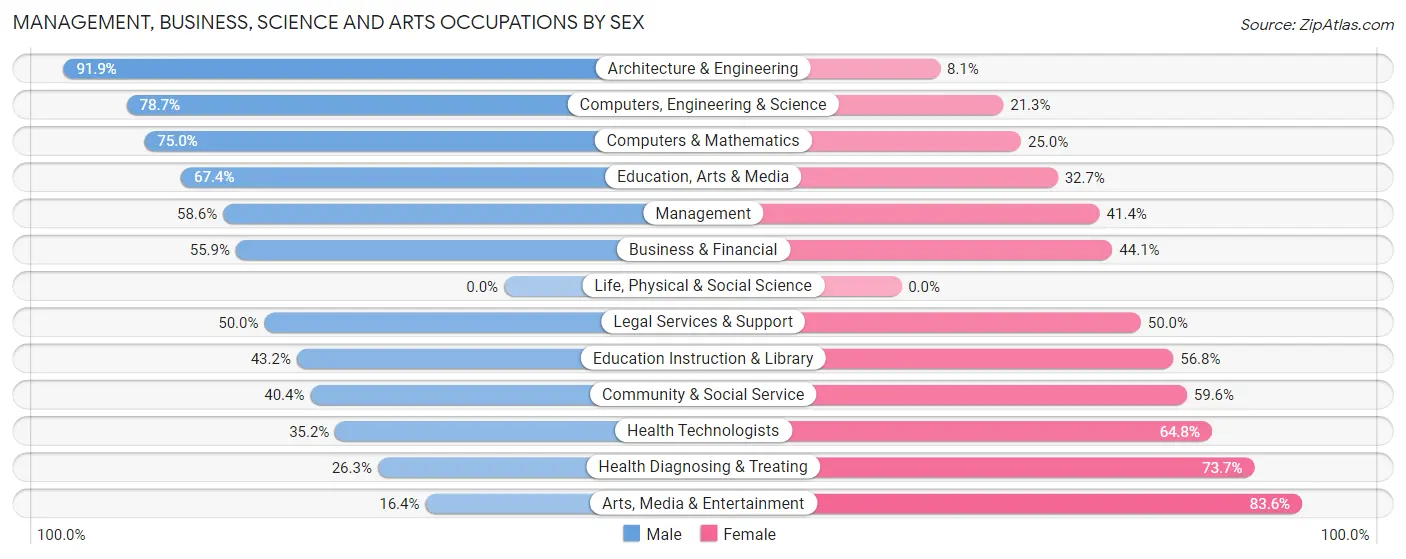
| Occupation | Male | Female |
| Management | 184 (58.6%) | 130 (41.4%) |
| Business & Financial | 240 (55.9%) | 189 (44.1%) |
| Computers, Engineering & Science | 133 (78.7%) | 36 (21.3%) |
| Computers & Mathematics | 99 (75.0%) | 33 (25.0%) |
| Architecture & Engineering | 34 (91.9%) | 3 (8.1%) |
| Life, Physical & Social Science | 0 (0.0%) | 0 (0.0%) |
| Community & Social Service | 244 (40.4%) | 360 (59.6%) |
| Education, Arts & Media | 33 (67.3%) | 16 (32.7%) |
| Legal Services & Support | 40 (50.0%) | 40 (50.0%) |
| Education Instruction & Library | 150 (43.2%) | 197 (56.8%) |
| Arts, Media & Entertainment | 21 (16.4%) | 107 (83.6%) |
| Health Diagnosing & Treating | 94 (26.3%) | 263 (73.7%) |
| Health Technologists | 94 (35.2%) | 173 (64.8%) |
| Total (Category) | 895 (47.8%) | 978 (52.2%) |
| Total (Overall) | 1,459 (49.8%) | 1,468 (50.1%) |
Services Occupations
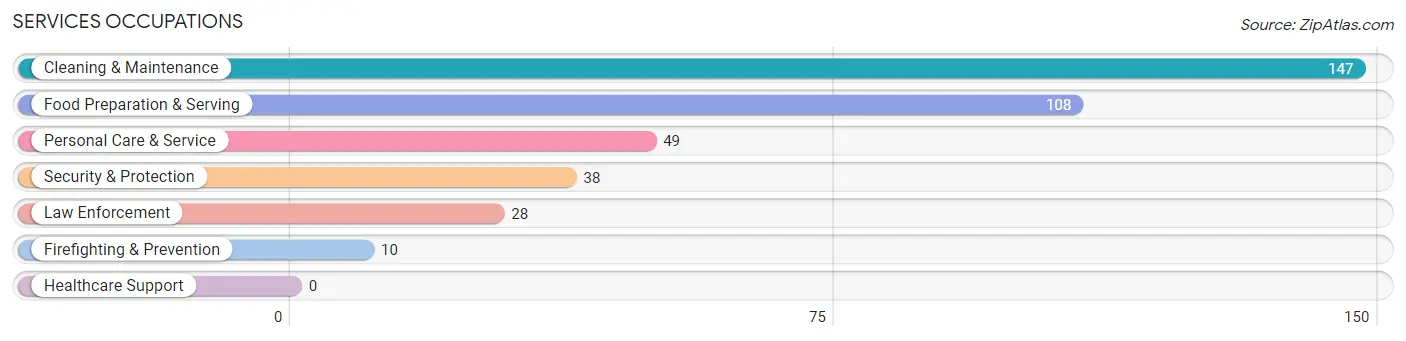
The most common Services occupations in Shelburne are Cleaning & Maintenance (147 | 5.0%), Food Preparation & Serving (108 | 3.7%), Personal Care & Service (49 | 1.7%), Security & Protection (38 | 1.3%), and Law Enforcement (28 | 1.0%).
Services Occupations by Sex
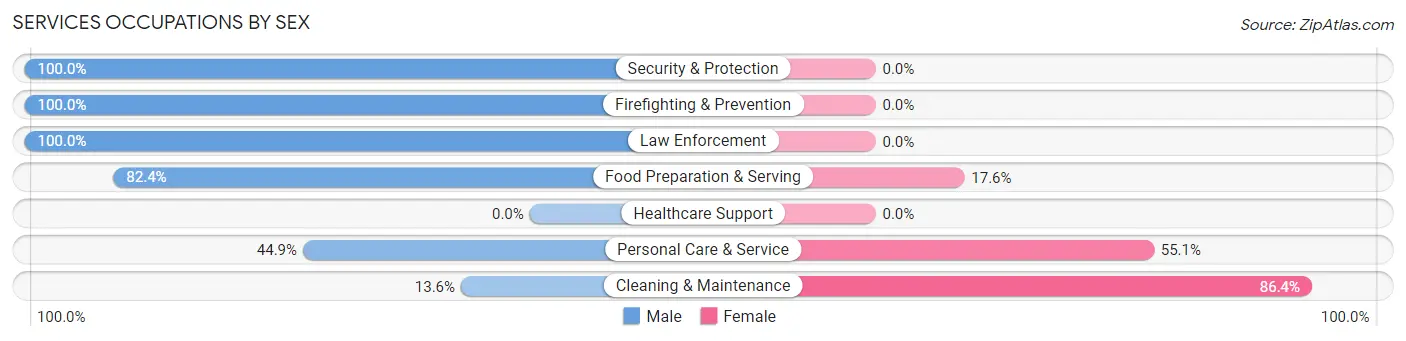
Within the Services occupations in Shelburne, the most male-oriented occupations are Security & Protection (100.0%), Firefighting & Prevention (100.0%), and Law Enforcement (100.0%), while the most female-oriented occupations are Cleaning & Maintenance (86.4%), Personal Care & Service (55.1%), and Food Preparation & Serving (17.6%).
| Occupation | Male | Female |
| Healthcare Support | 0 (0.0%) | 0 (0.0%) |
| Security & Protection | 38 (100.0%) | 0 (0.0%) |
| Firefighting & Prevention | 10 (100.0%) | 0 (0.0%) |
| Law Enforcement | 28 (100.0%) | 0 (0.0%) |
| Food Preparation & Serving | 89 (82.4%) | 19 (17.6%) |
| Cleaning & Maintenance | 20 (13.6%) | 127 (86.4%) |
| Personal Care & Service | 22 (44.9%) | 27 (55.1%) |
| Total (Category) | 169 (49.4%) | 173 (50.6%) |
| Total (Overall) | 1,459 (49.8%) | 1,468 (50.1%) |
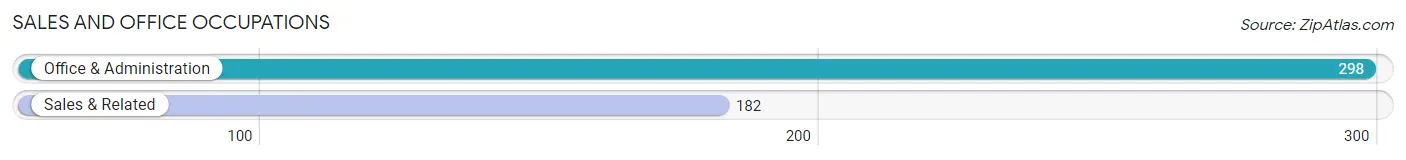
Sales and Office Occupations
The most common Sales and Office occupations in Shelburne are Office & Administration (298 | 10.2%), and Sales & Related (182 | 6.2%).
Sales and Office Occupations by Sex
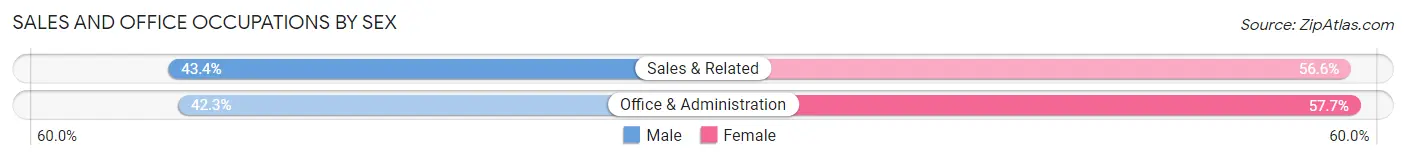
| Occupation | Male | Female |
| Sales & Related | 79 (43.4%) | 103 (56.6%) |
| Office & Administration | 126 (42.3%) | 172 (57.7%) |
| Total (Category) | 205 (42.7%) | 275 (57.3%) |
| Total (Overall) | 1,459 (49.8%) | 1,468 (50.1%) |
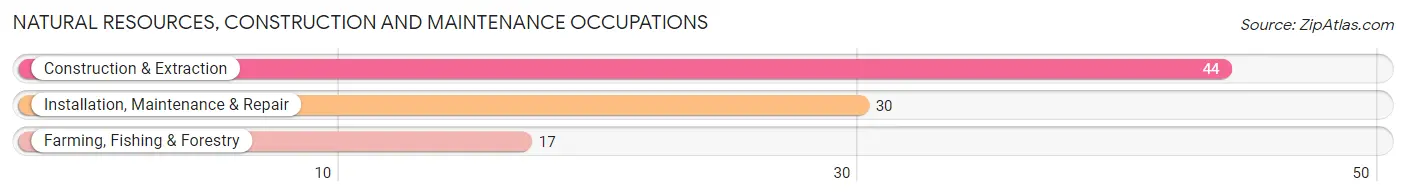
Natural Resources, Construction and Maintenance Occupations
The most common Natural Resources, Construction and Maintenance occupations in Shelburne are Construction & Extraction (44 | 1.5%), Installation, Maintenance & Repair (30 | 1.0%), and Farming, Fishing & Forestry (17 | 0.6%).
Natural Resources, Construction and Maintenance Occupations by Sex
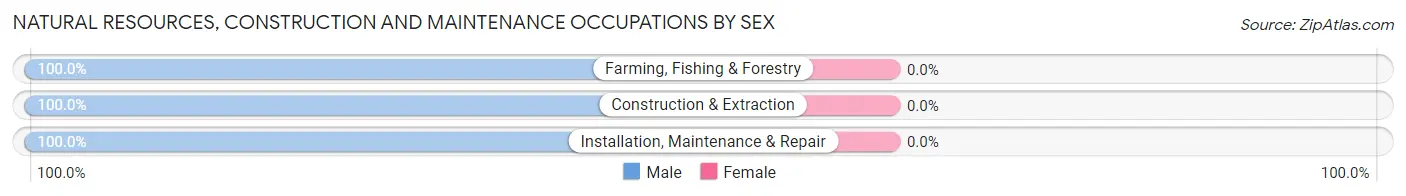
| Occupation | Male | Female |
| Farming, Fishing & Forestry | 17 (100.0%) | 0 (0.0%) |
| Construction & Extraction | 44 (100.0%) | 0 (0.0%) |
| Installation, Maintenance & Repair | 30 (100.0%) | 0 (0.0%) |
| Total (Category) | 91 (100.0%) | 0 (0.0%) |
| Total (Overall) | 1,459 (49.8%) | 1,468 (50.1%) |
Production, Transportation and Moving Occupations
The most common Production, Transportation and Moving occupations in Shelburne are Material Moving (53 | 1.8%), Transportation (47 | 1.6%), and Production (41 | 1.4%).
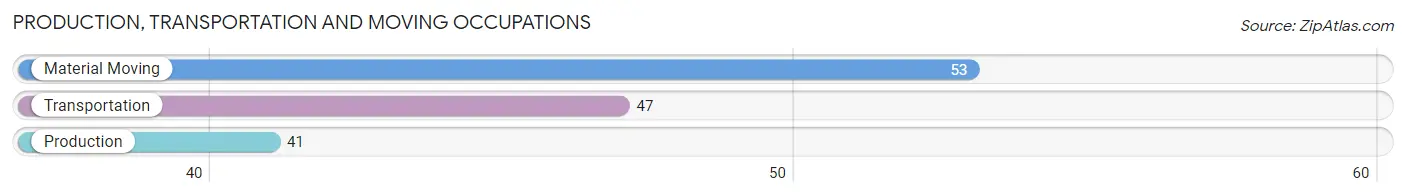
Production, Transportation and Moving Occupations by Sex
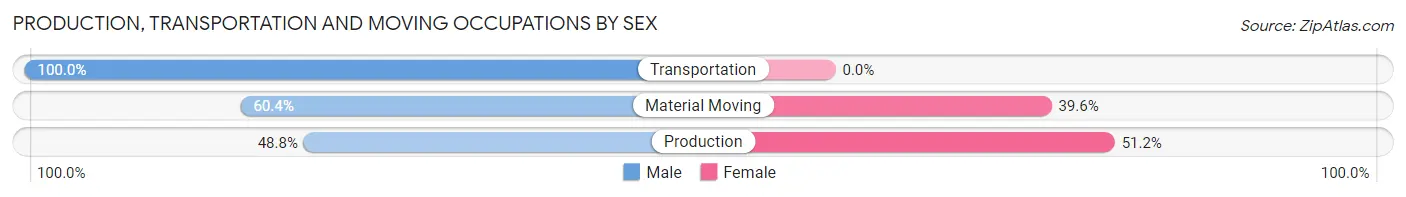
| Occupation | Male | Female |
| Production | 20 (48.8%) | 21 (51.2%) |
| Transportation | 47 (100.0%) | 0 (0.0%) |
| Material Moving | 32 (60.4%) | 21 (39.6%) |
| Total (Category) | 99 (70.2%) | 42 (29.8%) |
| Total (Overall) | 1,459 (49.8%) | 1,468 (50.1%) |
Employment Industries by Sex in Shelburne
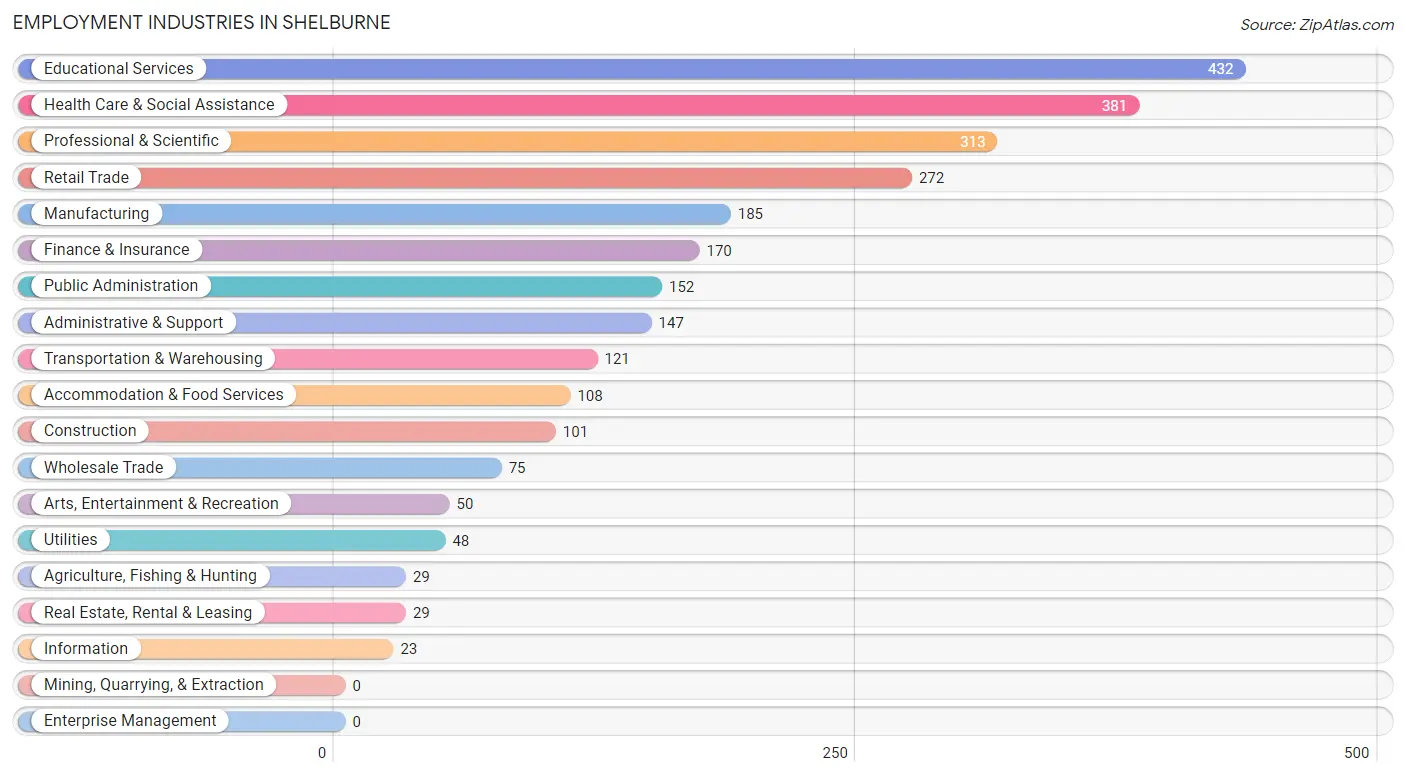
Employment Industries in Shelburne
The major employment industries in Shelburne include Educational Services (432 | 14.8%), Health Care & Social Assistance (381 | 13.0%), Professional & Scientific (313 | 10.7%), Retail Trade (272 | 9.3%), and Manufacturing (185 | 6.3%).
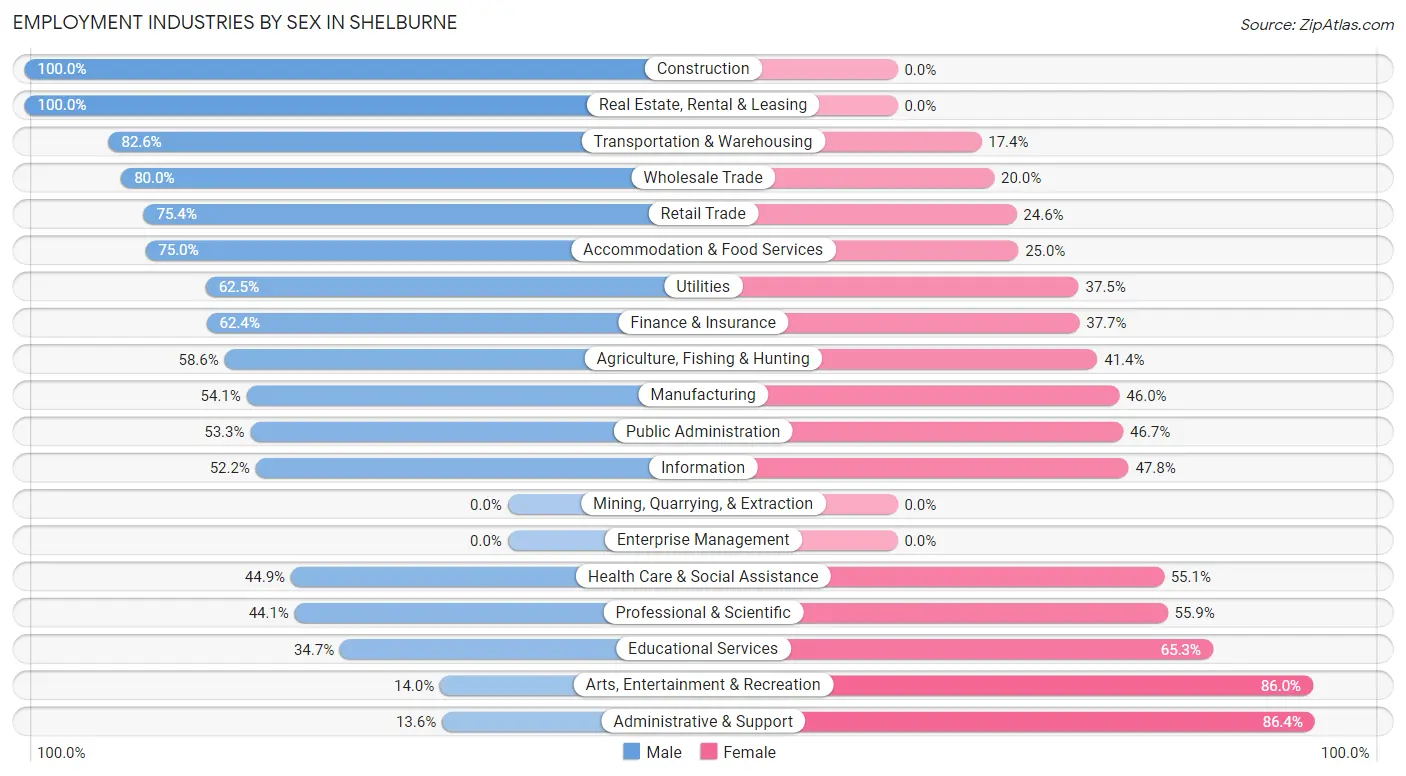
Employment Industries by Sex in Shelburne
The Shelburne industries that see more men than women are Construction (100.0%), Real Estate, Rental & Leasing (100.0%), and Transportation & Warehousing (82.6%), whereas the industries that tend to have a higher number of women are Administrative & Support (86.4%), Arts, Entertainment & Recreation (86.0%), and Educational Services (65.3%).
| Industry | Male | Female |
| Agriculture, Fishing & Hunting | 17 (58.6%) | 12 (41.4%) |
| Mining, Quarrying, & Extraction | 0 (0.0%) | 0 (0.0%) |
| Construction | 101 (100.0%) | 0 (0.0%) |
| Manufacturing | 100 (54.0%) | 85 (46.0%) |
| Wholesale Trade | 60 (80.0%) | 15 (20.0%) |
| Retail Trade | 205 (75.4%) | 67 (24.6%) |
| Transportation & Warehousing | 100 (82.6%) | 21 (17.4%) |
| Utilities | 30 (62.5%) | 18 (37.5%) |
| Information | 12 (52.2%) | 11 (47.8%) |
| Finance & Insurance | 106 (62.4%) | 64 (37.7%) |
| Real Estate, Rental & Leasing | 29 (100.0%) | 0 (0.0%) |
| Professional & Scientific | 138 (44.1%) | 175 (55.9%) |
| Enterprise Management | 0 (0.0%) | 0 (0.0%) |
| Administrative & Support | 20 (13.6%) | 127 (86.4%) |
| Educational Services | 150 (34.7%) | 282 (65.3%) |
| Health Care & Social Assistance | 171 (44.9%) | 210 (55.1%) |
| Arts, Entertainment & Recreation | 7 (14.0%) | 43 (86.0%) |
| Accommodation & Food Services | 81 (75.0%) | 27 (25.0%) |
| Public Administration | 81 (53.3%) | 71 (46.7%) |
| Total | 1,459 (49.8%) | 1,468 (50.1%) |
Education in Shelburne
School Enrollment in Shelburne
The most common levels of schooling among the 1,357 students in Shelburne are high school (447 | 32.9%), middle school (355 | 26.2%), and elementary school (294 | 21.7%).
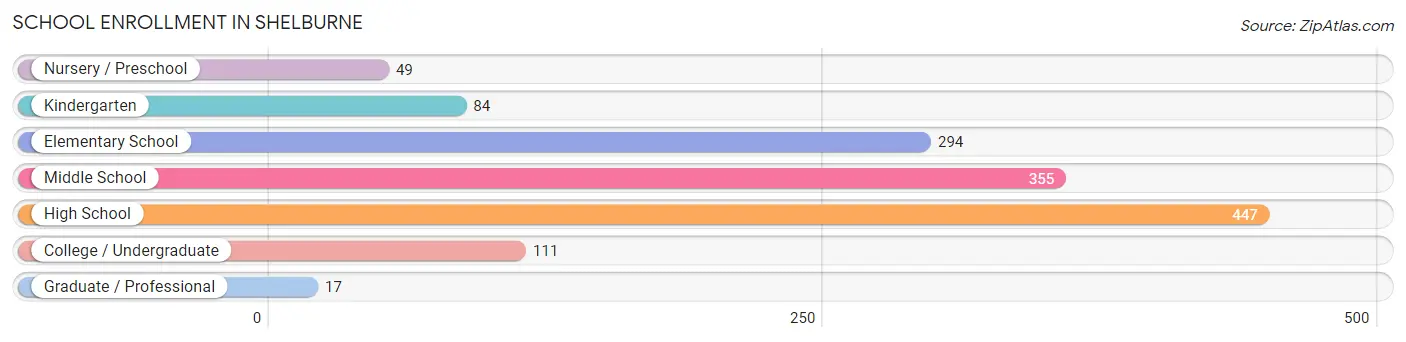
| School Level | # Students | % Students |
| Nursery / Preschool | 49 | 3.6% |
| Kindergarten | 84 | 6.2% |
| Elementary School | 294 | 21.7% |
| Middle School | 355 | 26.2% |
| High School | 447 | 32.9% |
| College / Undergraduate | 111 | 8.2% |
| Graduate / Professional | 17 | 1.3% |
| Total | 1,357 | 100.0% |
School Enrollment by Age by Funding Source in Shelburne
Out of a total of 1,357 students who are enrolled in schools in Shelburne, 123 (9.1%) attend a private institution, while the remaining 1,234 (90.9%) are enrolled in public schools. The age group of 3 to 4 year olds has the highest likelihood of being enrolled in private schools, with 17 (43.6% in the age bracket) enrolled. Conversely, the age group of 10 to 14 year olds has the lowest likelihood of being enrolled in a private school, with 447 (100.0% in the age bracket) attending a public institution.
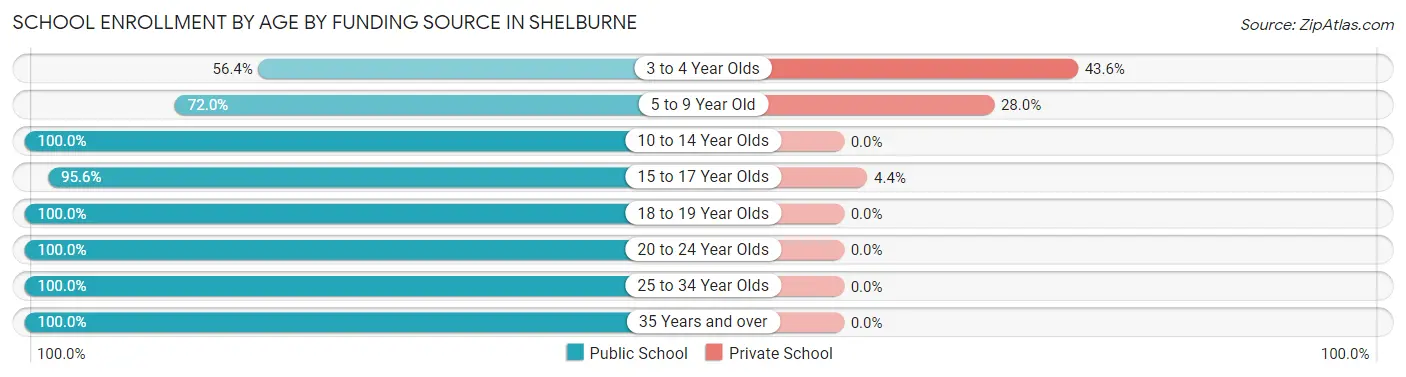
| Age Bracket | Public School | Private School |
| 3 to 4 Year Olds | 22 (56.4%) | 17 (43.6%) |
| 5 to 9 Year Old | 234 (72.0%) | 91 (28.0%) |
| 10 to 14 Year Olds | 447 (100.0%) | 0 (0.0%) |
| 15 to 17 Year Olds | 349 (95.6%) | 16 (4.4%) |
| 18 to 19 Year Olds | 53 (100.0%) | 0 (0.0%) |
| 20 to 24 Year Olds | 56 (100.0%) | 0 (0.0%) |
| 25 to 34 Year Olds | 35 (100.0%) | 0 (0.0%) |
| 35 Years and over | 37 (100.0%) | 0 (0.0%) |
| Total | 1,234 (90.9%) | 123 (9.1%) |
Educational Attainment by Field of Study in Shelburne
Social sciences (525 | 15.0%), education (397 | 11.3%), science & technology (372 | 10.6%), literature & languages (371 | 10.6%), and business (351 | 10.0%) are the most common fields of study among 3,504 individuals in Shelburne who have obtained a bachelor's degree or higher.
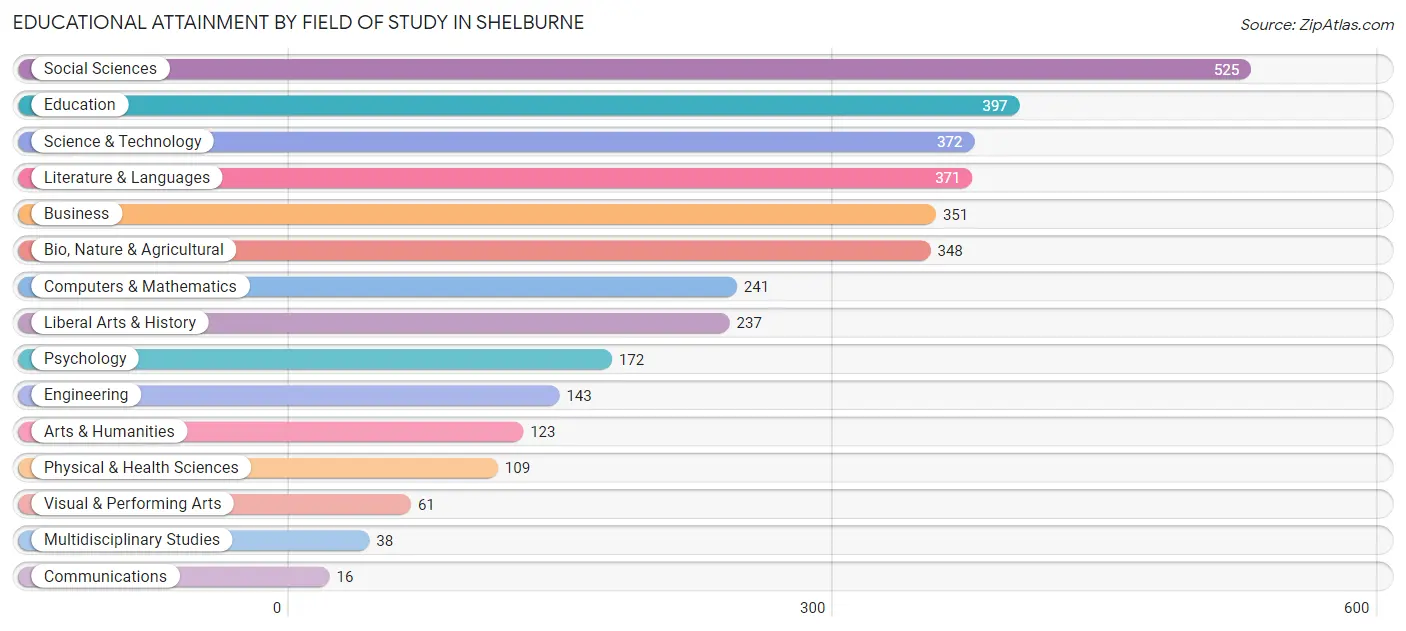
| Field of Study | # Graduates | % Graduates |
| Computers & Mathematics | 241 | 6.9% |
| Bio, Nature & Agricultural | 348 | 9.9% |
| Physical & Health Sciences | 109 | 3.1% |
| Psychology | 172 | 4.9% |
| Social Sciences | 525 | 15.0% |
| Engineering | 143 | 4.1% |
| Multidisciplinary Studies | 38 | 1.1% |
| Science & Technology | 372 | 10.6% |
| Business | 351 | 10.0% |
| Education | 397 | 11.3% |
| Literature & Languages | 371 | 10.6% |
| Liberal Arts & History | 237 | 6.8% |
| Visual & Performing Arts | 61 | 1.7% |
| Communications | 16 | 0.5% |
| Arts & Humanities | 123 | 3.5% |
| Total | 3,504 | 100.0% |
Transportation & Commute in Shelburne
Vehicle Availability by Sex in Shelburne
The most prevalent vehicle ownership categories in Shelburne are males with 2 vehicles (746, accounting for 51.7%) and females with 2 vehicles (692, making up 51.7%).
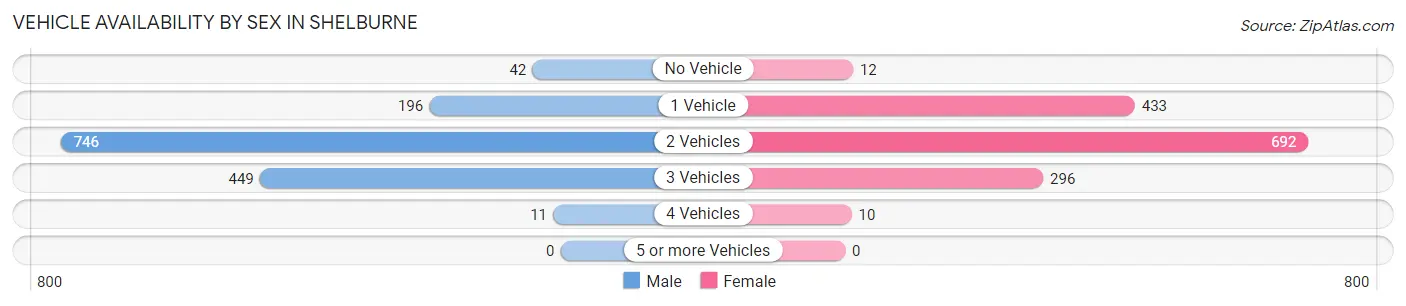
| Vehicles Available | Male | Female |
| No Vehicle | 42 (2.9%) | 12 (0.8%) |
| 1 Vehicle | 196 (13.6%) | 433 (30.0%) |
| 2 Vehicles | 746 (51.7%) | 692 (48.0%) |
| 3 Vehicles | 449 (31.1%) | 296 (20.5%) |
| 4 Vehicles | 11 (0.8%) | 10 (0.7%) |
| 5 or more Vehicles | 0 (0.0%) | 0 (0.0%) |
| Total | 1,444 (100.0%) | 1,443 (100.0%) |
Commute Time in Shelburne
The most frequently occuring commute durations in Shelburne are 20 to 24 minutes (508 commuters, 21.1%), 15 to 19 minutes (424 commuters, 17.6%), and 10 to 14 minutes (400 commuters, 16.6%).
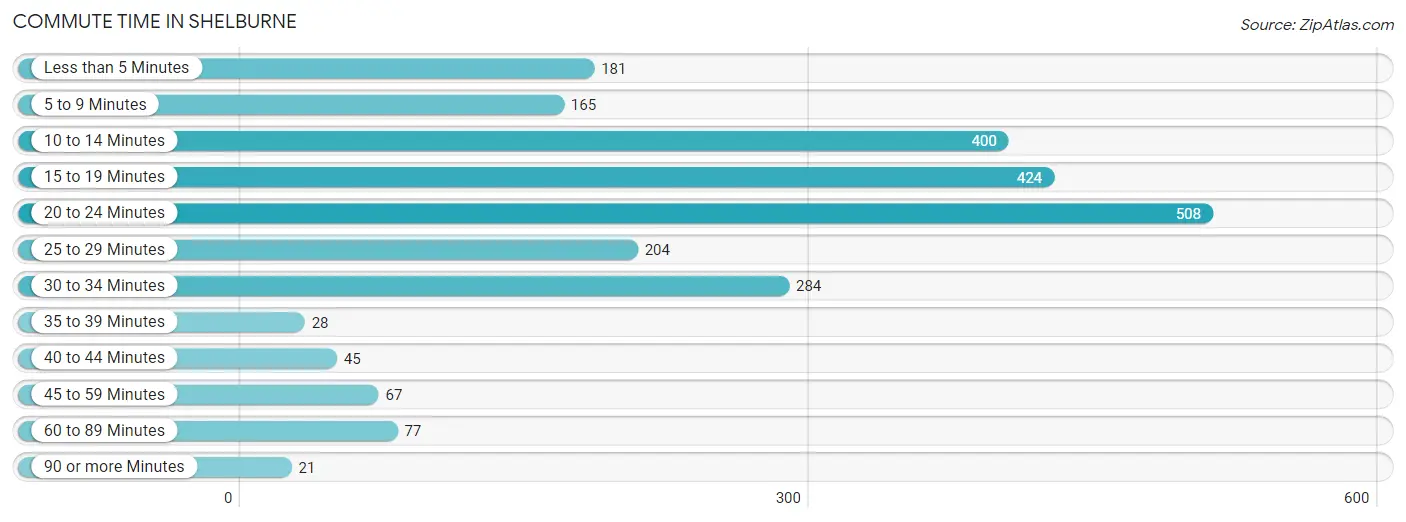
| Commute Time | # Commuters | % Commuters |
| Less than 5 Minutes | 181 | 7.5% |
| 5 to 9 Minutes | 165 | 6.9% |
| 10 to 14 Minutes | 400 | 16.6% |
| 15 to 19 Minutes | 424 | 17.6% |
| 20 to 24 Minutes | 508 | 21.1% |
| 25 to 29 Minutes | 204 | 8.5% |
| 30 to 34 Minutes | 284 | 11.8% |
| 35 to 39 Minutes | 28 | 1.2% |
| 40 to 44 Minutes | 45 | 1.9% |
| 45 to 59 Minutes | 67 | 2.8% |
| 60 to 89 Minutes | 77 | 3.2% |
| 90 or more Minutes | 21 | 0.9% |
Commute Time by Sex in Shelburne
The most common commute times in Shelburne are 20 to 24 minutes (355 commuters, 29.6%) for males and 15 to 19 minutes (195 commuters, 16.2%) for females.
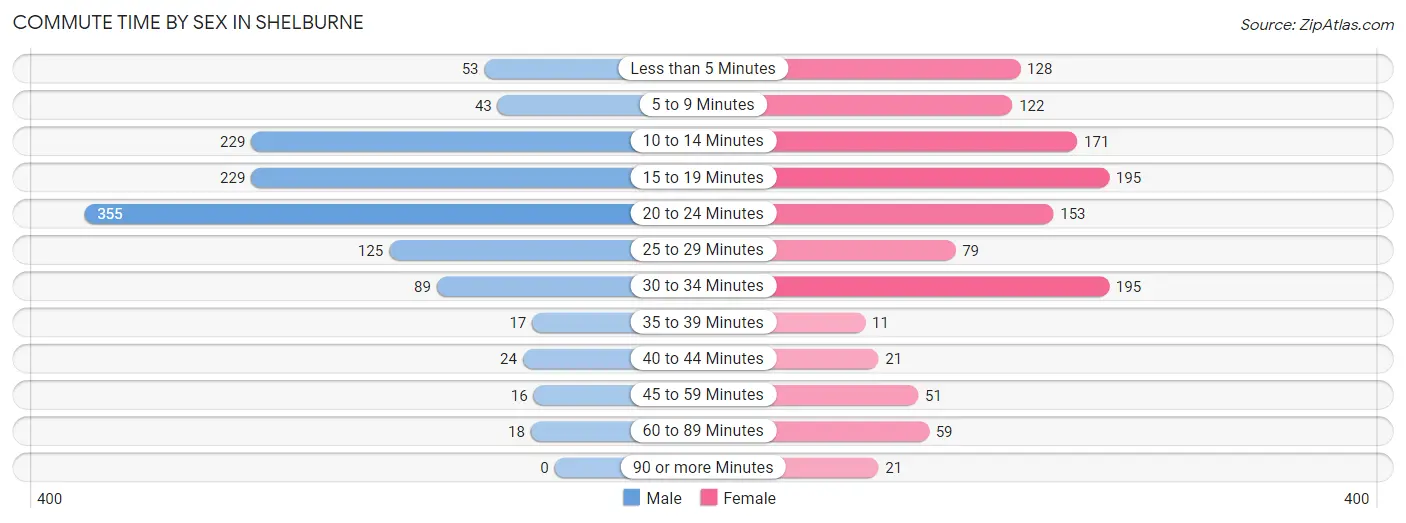
| Commute Time | Male | Female |
| Less than 5 Minutes | 53 (4.4%) | 128 (10.6%) |
| 5 to 9 Minutes | 43 (3.6%) | 122 (10.1%) |
| 10 to 14 Minutes | 229 (19.1%) | 171 (14.2%) |
| 15 to 19 Minutes | 229 (19.1%) | 195 (16.2%) |
| 20 to 24 Minutes | 355 (29.6%) | 153 (12.7%) |
| 25 to 29 Minutes | 125 (10.4%) | 79 (6.6%) |
| 30 to 34 Minutes | 89 (7.4%) | 195 (16.2%) |
| 35 to 39 Minutes | 17 (1.4%) | 11 (0.9%) |
| 40 to 44 Minutes | 24 (2.0%) | 21 (1.7%) |
| 45 to 59 Minutes | 16 (1.3%) | 51 (4.2%) |
| 60 to 89 Minutes | 18 (1.5%) | 59 (4.9%) |
| 90 or more Minutes | 0 (0.0%) | 21 (1.7%) |
Time of Departure to Work by Sex in Shelburne
The most frequent times of departure to work in Shelburne are 7:30 AM to 7:59 AM (259, 21.6%) for males and 7:30 AM to 7:59 AM (463, 38.4%) for females.
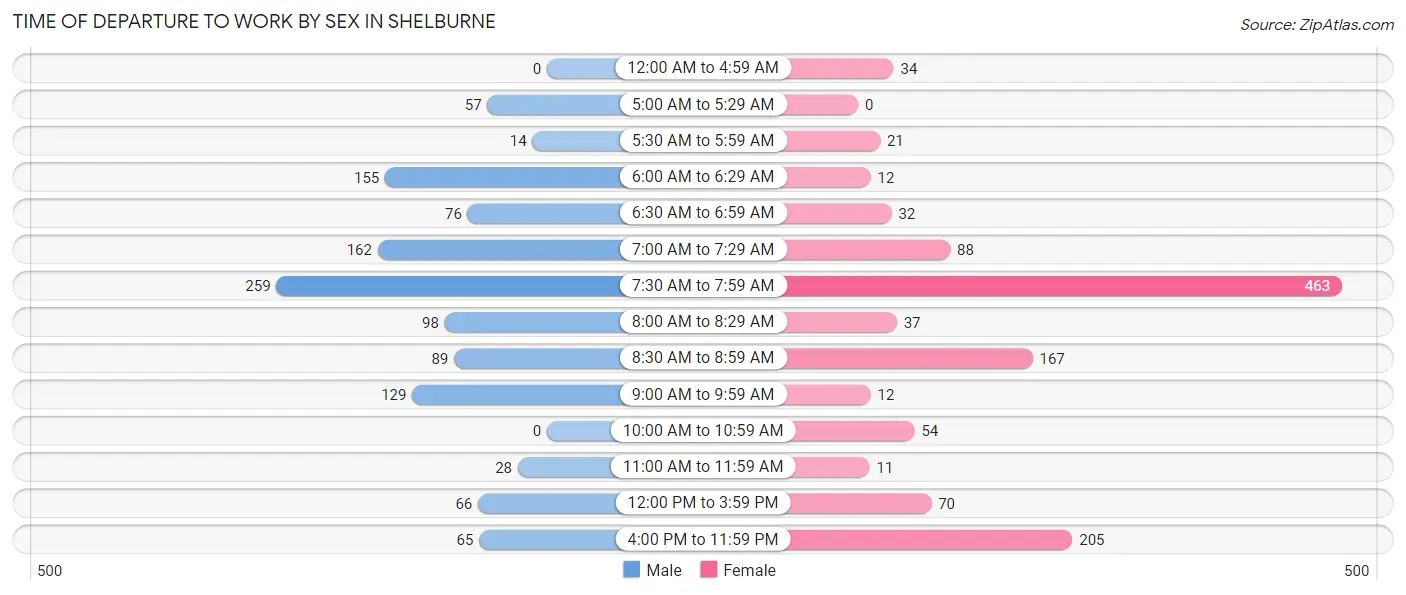
| Time of Departure | Male | Female |
| 12:00 AM to 4:59 AM | 0 (0.0%) | 34 (2.8%) |
| 5:00 AM to 5:29 AM | 57 (4.8%) | 0 (0.0%) |
| 5:30 AM to 5:59 AM | 14 (1.2%) | 21 (1.7%) |
| 6:00 AM to 6:29 AM | 155 (12.9%) | 12 (1.0%) |
| 6:30 AM to 6:59 AM | 76 (6.3%) | 32 (2.6%) |
| 7:00 AM to 7:29 AM | 162 (13.5%) | 88 (7.3%) |
| 7:30 AM to 7:59 AM | 259 (21.6%) | 463 (38.4%) |
| 8:00 AM to 8:29 AM | 98 (8.2%) | 37 (3.1%) |
| 8:30 AM to 8:59 AM | 89 (7.4%) | 167 (13.9%) |
| 9:00 AM to 9:59 AM | 129 (10.8%) | 12 (1.0%) |
| 10:00 AM to 10:59 AM | 0 (0.0%) | 54 (4.5%) |
| 11:00 AM to 11:59 AM | 28 (2.3%) | 11 (0.9%) |
| 12:00 PM to 3:59 PM | 66 (5.5%) | 70 (5.8%) |
| 4:00 PM to 11:59 PM | 65 (5.4%) | 205 (17.0%) |
| Total | 1,198 (100.0%) | 1,206 (100.0%) |
Housing Occupancy in Shelburne
Occupancy by Ownership in Shelburne
Of the total 2,673 dwellings in Shelburne, owner-occupied units account for 1,810 (67.7%), while renter-occupied units make up 863 (32.3%).
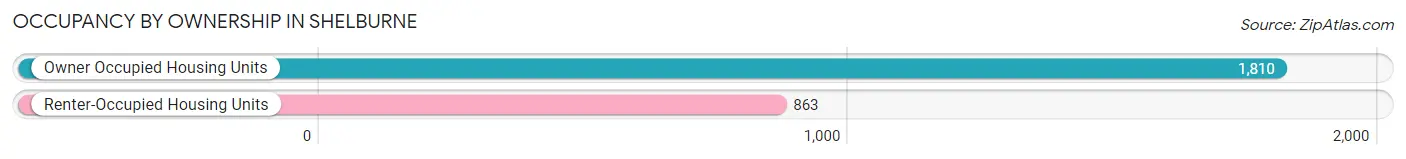
| Occupancy | # Housing Units | % Housing Units |
| Owner Occupied Housing Units | 1,810 | 67.7% |
| Renter-Occupied Housing Units | 863 | 32.3% |
| Total Occupied Housing Units | 2,673 | 100.0% |
Occupancy by Household Size in Shelburne
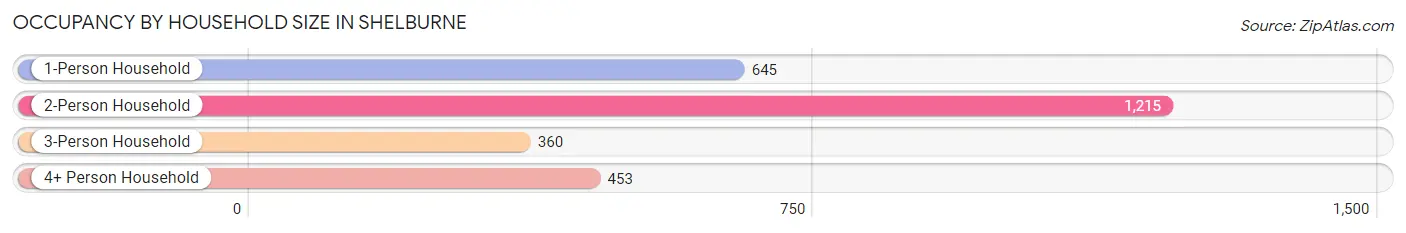
| Household Size | # Housing Units | % Housing Units |
| 1-Person Household | 645 | 24.1% |
| 2-Person Household | 1,215 | 45.5% |
| 3-Person Household | 360 | 13.5% |
| 4+ Person Household | 453 | 17.0% |
| Total Housing Units | 2,673 | 100.0% |
Occupancy by Ownership by Household Size in Shelburne
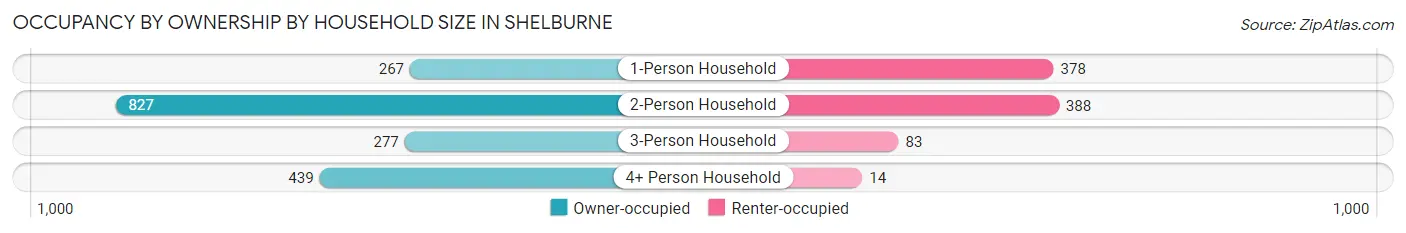
| Household Size | Owner-occupied | Renter-occupied |
| 1-Person Household | 267 (41.4%) | 378 (58.6%) |
| 2-Person Household | 827 (68.1%) | 388 (31.9%) |
| 3-Person Household | 277 (76.9%) | 83 (23.1%) |
| 4+ Person Household | 439 (96.9%) | 14 (3.1%) |
| Total Housing Units | 1,810 (67.7%) | 863 (32.3%) |
Occupancy by Educational Attainment in Shelburne
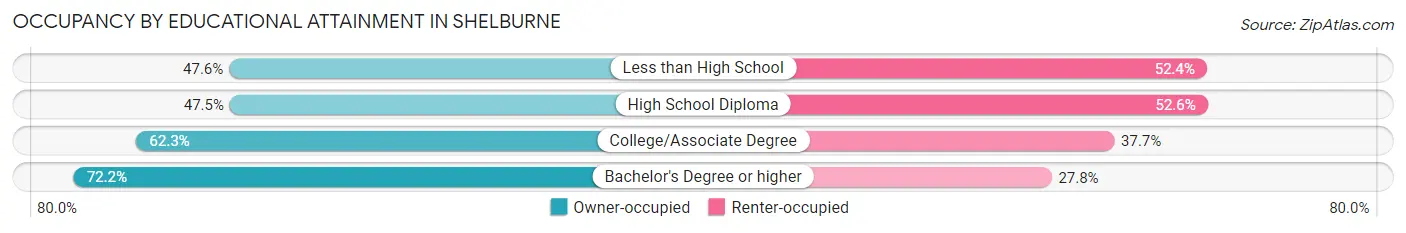
| Household Size | Owner-occupied | Renter-occupied |
| Less than High School | 39 (47.6%) | 43 (52.4%) |
| High School Diploma | 93 (47.4%) | 103 (52.5%) |
| College/Associate Degree | 320 (62.3%) | 194 (37.7%) |
| Bachelor's Degree or higher | 1,358 (72.2%) | 523 (27.8%) |
Occupancy by Age of Householder in Shelburne
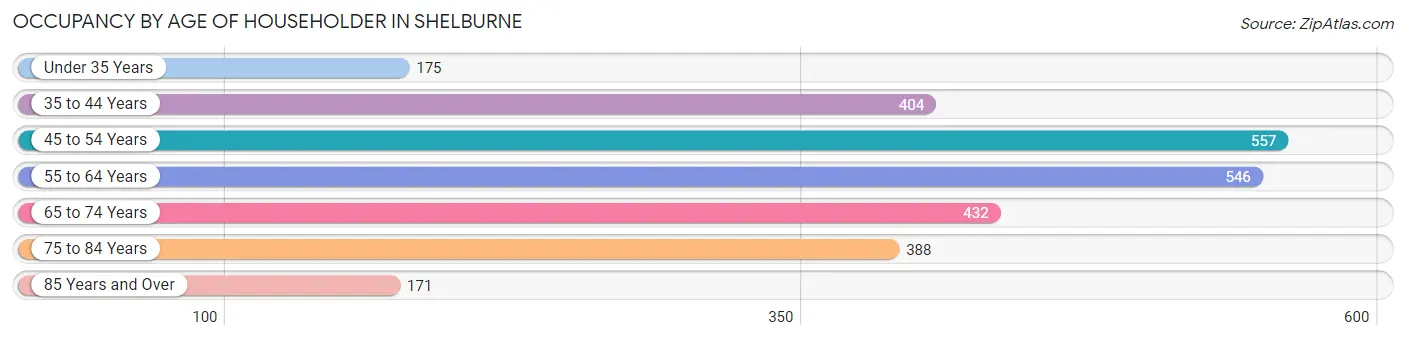
| Age Bracket | # Households | % Households |
| Under 35 Years | 175 | 6.6% |
| 35 to 44 Years | 404 | 15.1% |
| 45 to 54 Years | 557 | 20.8% |
| 55 to 64 Years | 546 | 20.4% |
| 65 to 74 Years | 432 | 16.2% |
| 75 to 84 Years | 388 | 14.5% |
| 85 Years and Over | 171 | 6.4% |
| Total | 2,673 | 100.0% |
Housing Finances in Shelburne
Median Income by Occupancy in Shelburne
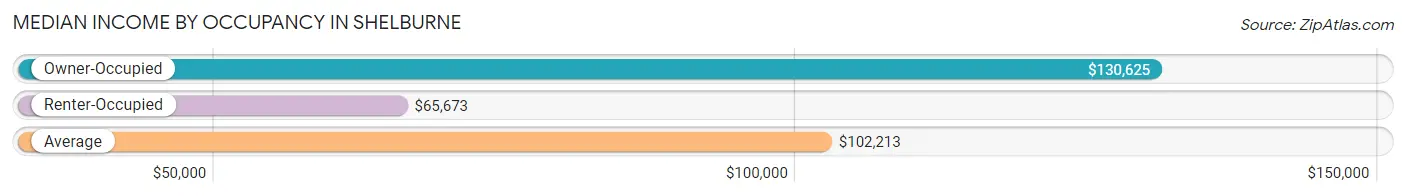
| Occupancy Type | # Households | Median Income |
| Owner-Occupied | 1,810 (67.7%) | $130,625 |
| Renter-Occupied | 863 (32.3%) | $65,673 |
| Average | 2,673 (100.0%) | $102,213 |
Occupancy by Householder Income Bracket in Shelburne
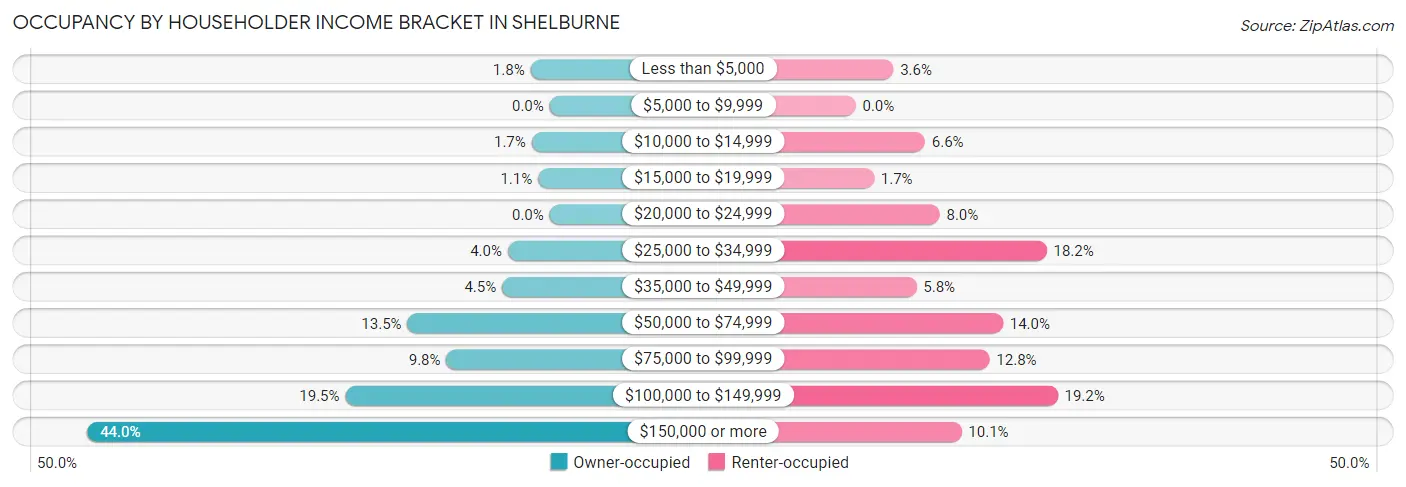
| Income Bracket | Owner-occupied | Renter-occupied |
| Less than $5,000 | 33 (1.8%) | 31 (3.6%) |
| $5,000 to $9,999 | 0 (0.0%) | 0 (0.0%) |
| $10,000 to $14,999 | 31 (1.7%) | 57 (6.6%) |
| $15,000 to $19,999 | 20 (1.1%) | 15 (1.7%) |
| $20,000 to $24,999 | 0 (0.0%) | 69 (8.0%) |
| $25,000 to $34,999 | 72 (4.0%) | 157 (18.2%) |
| $35,000 to $49,999 | 82 (4.5%) | 50 (5.8%) |
| $50,000 to $74,999 | 245 (13.5%) | 121 (14.0%) |
| $75,000 to $99,999 | 178 (9.8%) | 110 (12.8%) |
| $100,000 to $149,999 | 352 (19.5%) | 166 (19.2%) |
| $150,000 or more | 797 (44.0%) | 87 (10.1%) |
| Total | 1,810 (100.0%) | 863 (100.0%) |
Monthly Housing Cost Tiers in Shelburne
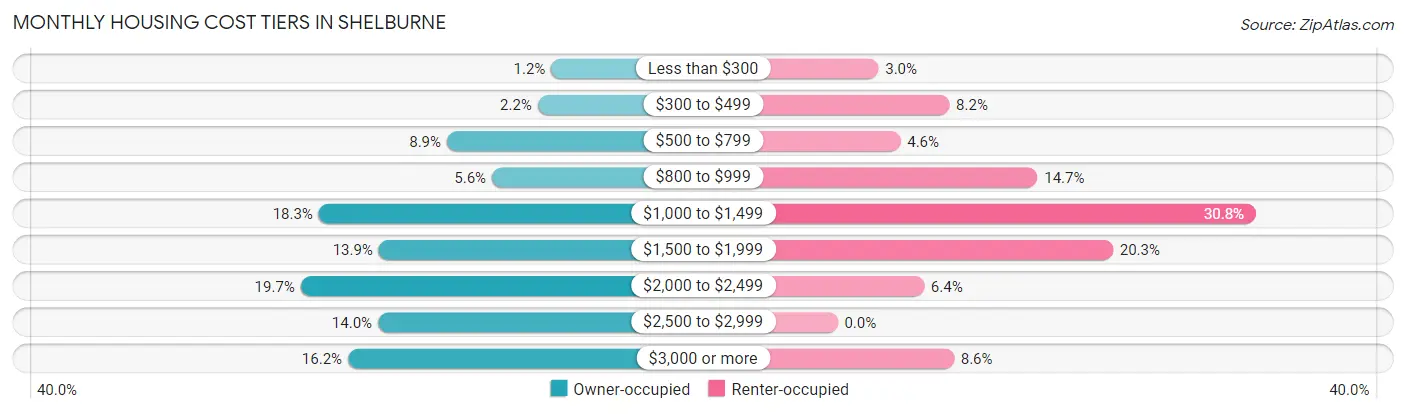
| Monthly Cost | Owner-occupied | Renter-occupied |
| Less than $300 | 22 (1.2%) | 26 (3.0%) |
| $300 to $499 | 40 (2.2%) | 71 (8.2%) |
| $500 to $799 | 161 (8.9%) | 40 (4.6%) |
| $800 to $999 | 101 (5.6%) | 127 (14.7%) |
| $1,000 to $1,499 | 332 (18.3%) | 266 (30.8%) |
| $1,500 to $1,999 | 252 (13.9%) | 175 (20.3%) |
| $2,000 to $2,499 | 356 (19.7%) | 55 (6.4%) |
| $2,500 to $2,999 | 253 (14.0%) | 0 (0.0%) |
| $3,000 or more | 293 (16.2%) | 74 (8.6%) |
| Total | 1,810 (100.0%) | 863 (100.0%) |
Physical Housing Characteristics in Shelburne
Housing Structures in Shelburne
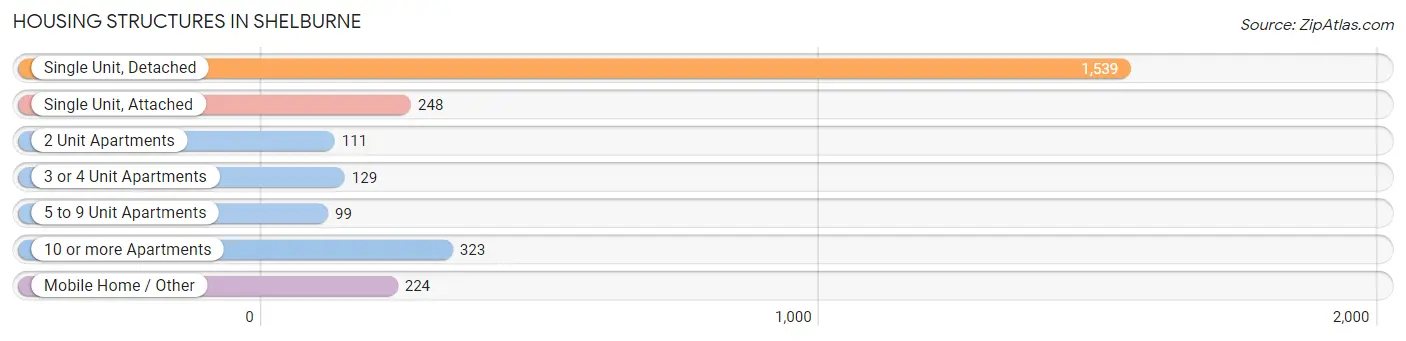
| Structure Type | # Housing Units | % Housing Units |
| Single Unit, Detached | 1,539 | 57.6% |
| Single Unit, Attached | 248 | 9.3% |
| 2 Unit Apartments | 111 | 4.2% |
| 3 or 4 Unit Apartments | 129 | 4.8% |
| 5 to 9 Unit Apartments | 99 | 3.7% |
| 10 or more Apartments | 323 | 12.1% |
| Mobile Home / Other | 224 | 8.4% |
| Total | 2,673 | 100.0% |
Housing Structures by Occupancy in Shelburne
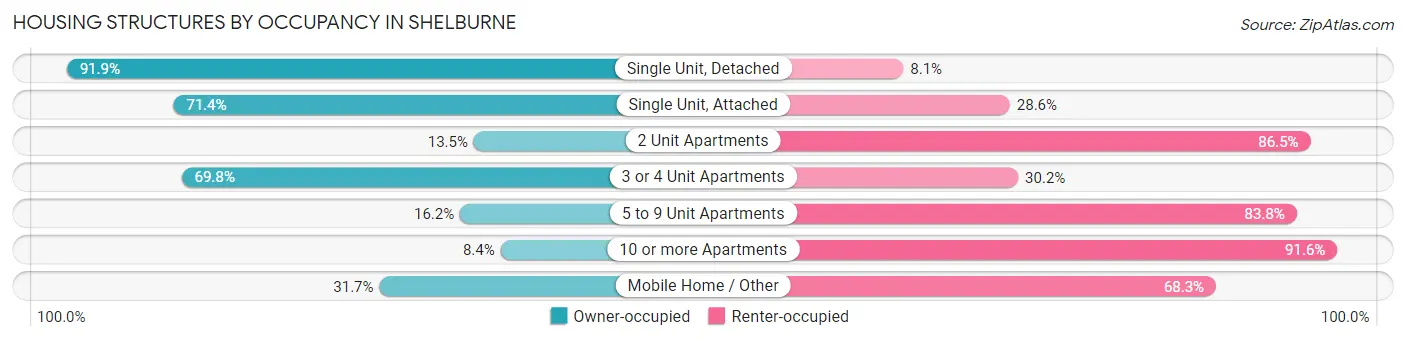
| Structure Type | Owner-occupied | Renter-occupied |
| Single Unit, Detached | 1,414 (91.9%) | 125 (8.1%) |
| Single Unit, Attached | 177 (71.4%) | 71 (28.6%) |
| 2 Unit Apartments | 15 (13.5%) | 96 (86.5%) |
| 3 or 4 Unit Apartments | 90 (69.8%) | 39 (30.2%) |
| 5 to 9 Unit Apartments | 16 (16.2%) | 83 (83.8%) |
| 10 or more Apartments | 27 (8.4%) | 296 (91.6%) |
| Mobile Home / Other | 71 (31.7%) | 153 (68.3%) |
| Total | 1,810 (67.7%) | 863 (32.3%) |
Housing Structures by Number of Rooms in Shelburne
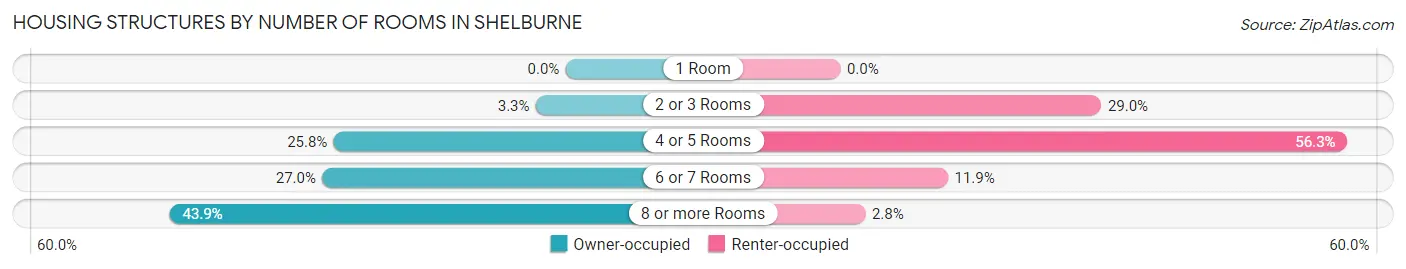
| Number of Rooms | Owner-occupied | Renter-occupied |
| 1 Room | 0 (0.0%) | 0 (0.0%) |
| 2 or 3 Rooms | 60 (3.3%) | 250 (29.0%) |
| 4 or 5 Rooms | 466 (25.8%) | 486 (56.3%) |
| 6 or 7 Rooms | 489 (27.0%) | 103 (11.9%) |
| 8 or more Rooms | 795 (43.9%) | 24 (2.8%) |
| Total | 1,810 (100.0%) | 863 (100.0%) |
Housing Structure by Heating Type in Shelburne
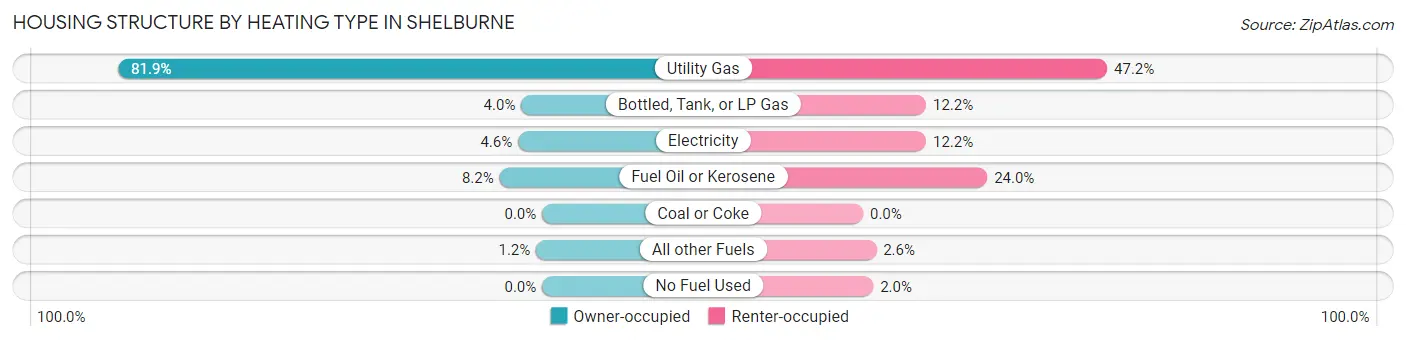
| Heating Type | Owner-occupied | Renter-occupied |
| Utility Gas | 1,483 (81.9%) | 407 (47.2%) |
| Bottled, Tank, or LP Gas | 73 (4.0%) | 105 (12.2%) |
| Electricity | 84 (4.6%) | 105 (12.2%) |
| Fuel Oil or Kerosene | 149 (8.2%) | 207 (24.0%) |
| Coal or Coke | 0 (0.0%) | 0 (0.0%) |
| All other Fuels | 21 (1.2%) | 22 (2.5%) |
| No Fuel Used | 0 (0.0%) | 17 (2.0%) |
| Total | 1,810 (100.0%) | 863 (100.0%) |
Household Vehicle Usage in Shelburne
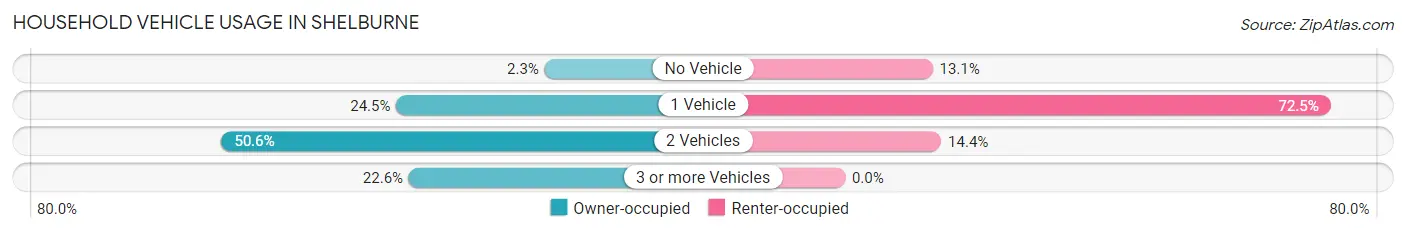
| Vehicles per Household | Owner-occupied | Renter-occupied |
| No Vehicle | 42 (2.3%) | 113 (13.1%) |
| 1 Vehicle | 443 (24.5%) | 626 (72.5%) |
| 2 Vehicles | 916 (50.6%) | 124 (14.4%) |
| 3 or more Vehicles | 409 (22.6%) | 0 (0.0%) |
| Total | 1,810 (100.0%) | 863 (100.0%) |
Real Estate & Mortgages in Shelburne
Real Estate and Mortgage Overview in Shelburne
| Characteristic | Without Mortgage | With Mortgage |
| Housing Units | 606 | 1,204 |
| Median Property Value | $413,900 | $472,200 |
| Median Household Income | $94,605 | $568 |
| Monthly Housing Costs | $898 | $293 |
| Real Estate Taxes | $5,761 | $0 |
Property Value by Mortgage Status in Shelburne
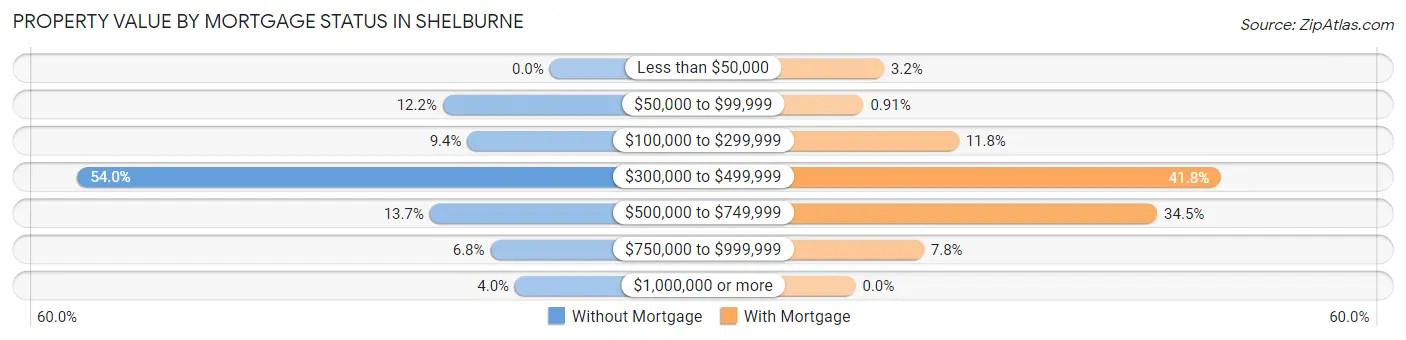
| Property Value | Without Mortgage | With Mortgage |
| Less than $50,000 | 0 (0.0%) | 39 (3.2%) |
| $50,000 to $99,999 | 74 (12.2%) | 11 (0.9%) |
| $100,000 to $299,999 | 57 (9.4%) | 142 (11.8%) |
| $300,000 to $499,999 | 327 (54.0%) | 503 (41.8%) |
| $500,000 to $749,999 | 83 (13.7%) | 415 (34.5%) |
| $750,000 to $999,999 | 41 (6.8%) | 94 (7.8%) |
| $1,000,000 or more | 24 (4.0%) | 0 (0.0%) |
| Total | 606 (100.0%) | 1,204 (100.0%) |
Household Income by Mortgage Status in Shelburne
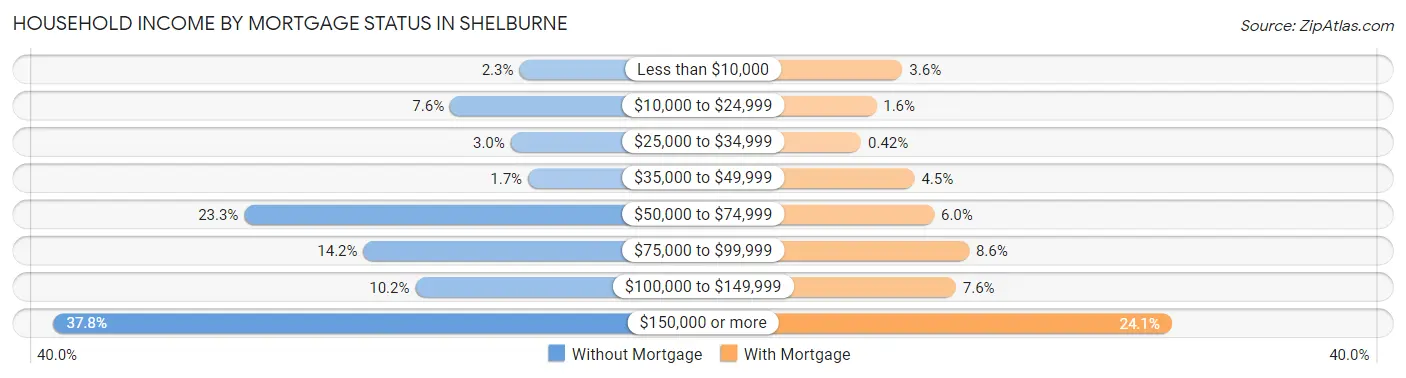
| Household Income | Without Mortgage | With Mortgage |
| Less than $10,000 | 14 (2.3%) | 43 (3.6%) |
| $10,000 to $24,999 | 46 (7.6%) | 19 (1.6%) |
| $25,000 to $34,999 | 18 (3.0%) | 5 (0.4%) |
| $35,000 to $49,999 | 10 (1.7%) | 54 (4.5%) |
| $50,000 to $74,999 | 141 (23.3%) | 72 (6.0%) |
| $75,000 to $99,999 | 86 (14.2%) | 104 (8.6%) |
| $100,000 to $149,999 | 62 (10.2%) | 92 (7.6%) |
| $150,000 or more | 229 (37.8%) | 290 (24.1%) |
| Total | 606 (100.0%) | 1,204 (100.0%) |
Property Value to Household Income Ratio in Shelburne
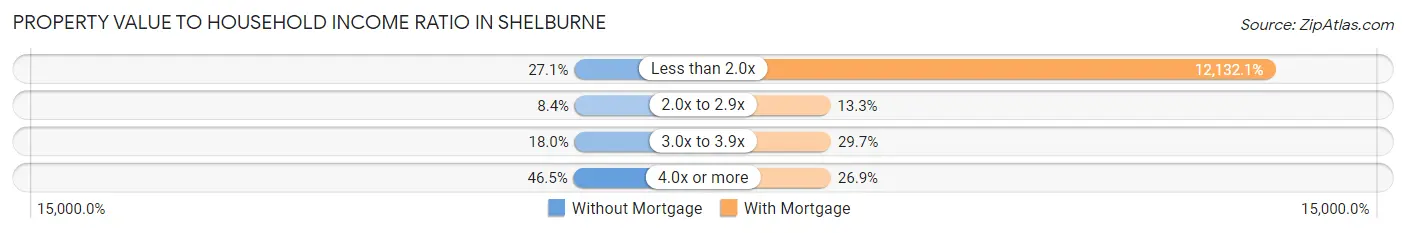
| Value-to-Income Ratio | Without Mortgage | With Mortgage |
| Less than 2.0x | 164 (27.1%) | 146,071 (12,132.1%) |
| 2.0x to 2.9x | 51 (8.4%) | 160 (13.3%) |
| 3.0x to 3.9x | 109 (18.0%) | 358 (29.7%) |
| 4.0x or more | 282 (46.5%) | 324 (26.9%) |
| Total | 606 (100.0%) | 1,204 (100.0%) |
Real Estate Taxes by Mortgage Status in Shelburne
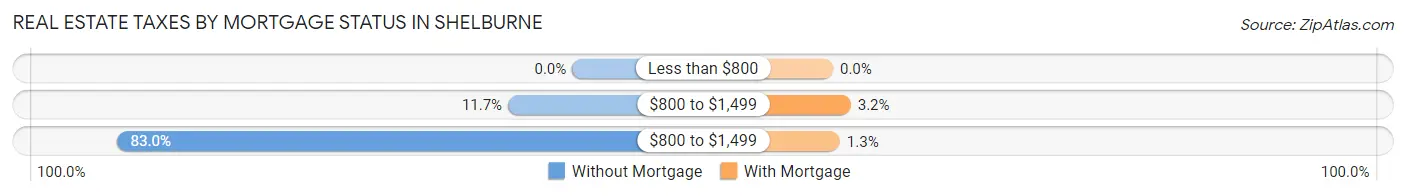
| Property Taxes | Without Mortgage | With Mortgage |
| Less than $800 | 0 (0.0%) | 0 (0.0%) |
| $800 to $1,499 | 71 (11.7%) | 39 (3.2%) |
| $800 to $1,499 | 503 (83.0%) | 15 (1.3%) |
| Total | 606 (100.0%) | 1,204 (100.0%) |
Health & Disability in Shelburne
Health Insurance Coverage by Age in Shelburne
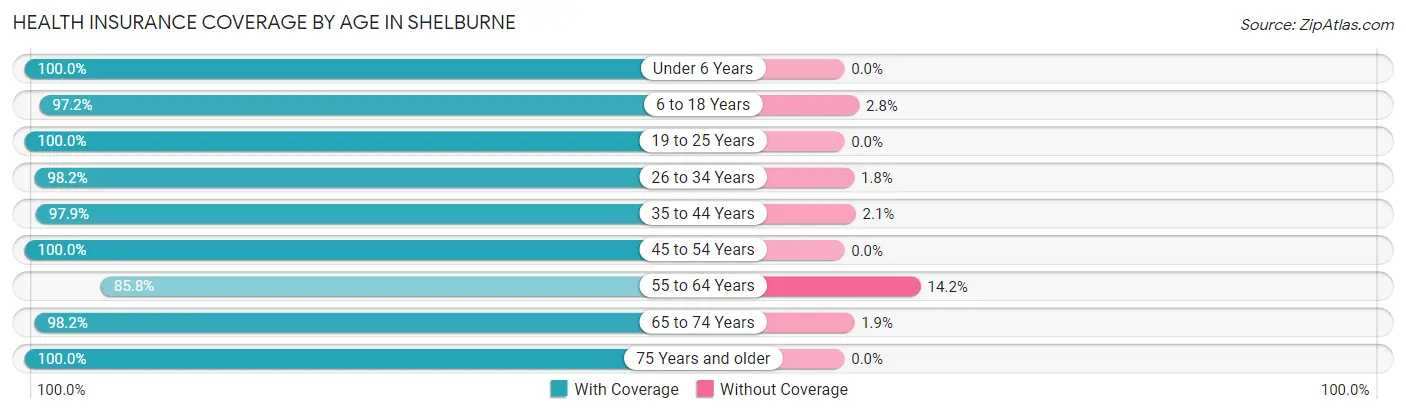
| Age Bracket | With Coverage | Without Coverage |
| Under 6 Years | 274 (100.0%) | 0 (0.0%) |
| 6 to 18 Years | 1,161 (97.2%) | 33 (2.8%) |
| 19 to 25 Years | 224 (100.0%) | 0 (0.0%) |
| 26 to 34 Years | 270 (98.2%) | 5 (1.8%) |
| 35 to 44 Years | 789 (97.9%) | 17 (2.1%) |
| 45 to 54 Years | 818 (100.0%) | 0 (0.0%) |
| 55 to 64 Years | 765 (85.8%) | 127 (14.2%) |
| 65 to 74 Years | 689 (98.2%) | 13 (1.8%) |
| 75 Years and older | 907 (100.0%) | 0 (0.0%) |
| Total | 5,897 (96.8%) | 195 (3.2%) |
Health Insurance Coverage by Citizenship Status in Shelburne
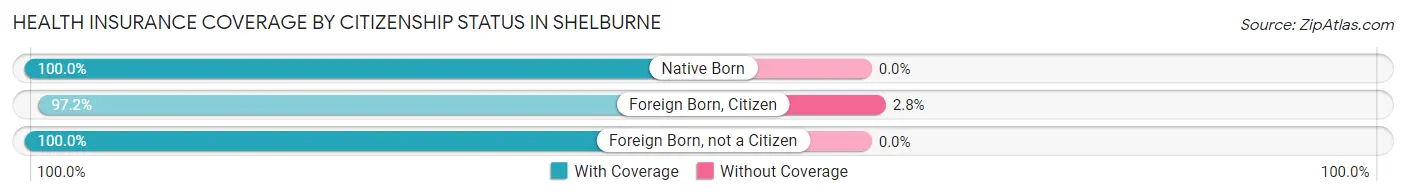
| Citizenship Status | With Coverage | Without Coverage |
| Native Born | 274 (100.0%) | 0 (0.0%) |
| Foreign Born, Citizen | 1,161 (97.2%) | 33 (2.8%) |
| Foreign Born, not a Citizen | 224 (100.0%) | 0 (0.0%) |
Health Insurance Coverage by Household Income in Shelburne
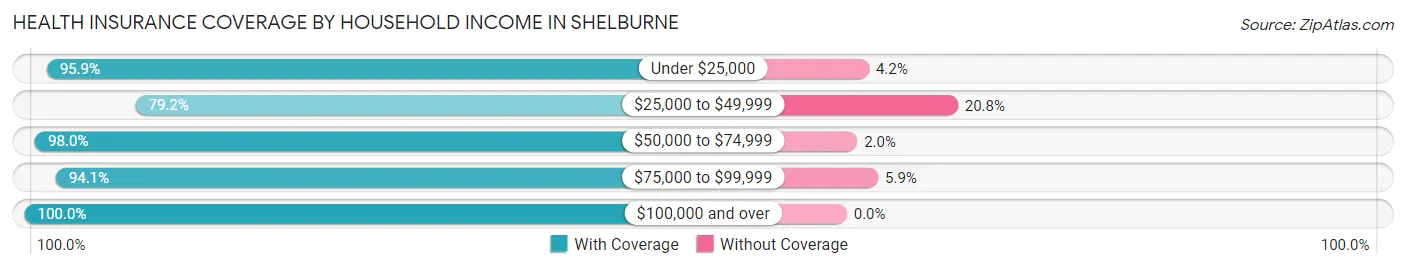
| Household Income | With Coverage | Without Coverage |
| Under $25,000 | 393 (95.9%) | 17 (4.2%) |
| $25,000 to $49,999 | 484 (79.2%) | 127 (20.8%) |
| $50,000 to $74,999 | 649 (98.0%) | 13 (2.0%) |
| $75,000 to $99,999 | 530 (94.1%) | 33 (5.9%) |
| $100,000 and over | 3,819 (100.0%) | 0 (0.0%) |
Public vs Private Health Insurance Coverage by Age in Shelburne
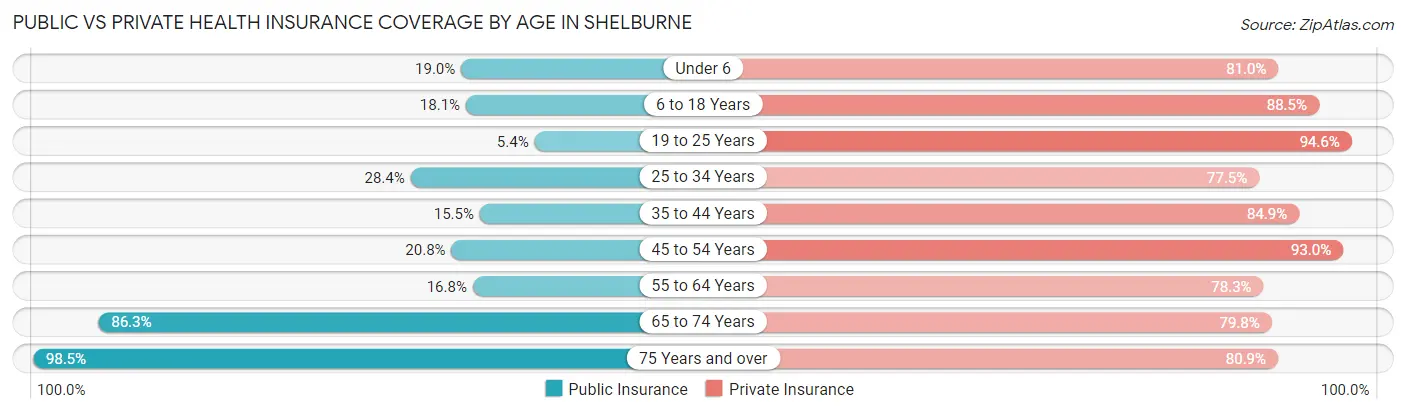
| Age Bracket | Public Insurance | Private Insurance |
| Under 6 | 52 (19.0%) | 222 (81.0%) |
| 6 to 18 Years | 216 (18.1%) | 1,057 (88.5%) |
| 19 to 25 Years | 12 (5.4%) | 212 (94.6%) |
| 25 to 34 Years | 78 (28.4%) | 213 (77.4%) |
| 35 to 44 Years | 125 (15.5%) | 684 (84.9%) |
| 45 to 54 Years | 170 (20.8%) | 761 (93.0%) |
| 55 to 64 Years | 150 (16.8%) | 698 (78.2%) |
| 65 to 74 Years | 606 (86.3%) | 560 (79.8%) |
| 75 Years and over | 893 (98.5%) | 734 (80.9%) |
| Total | 2,302 (37.8%) | 5,141 (84.4%) |
Disability Status by Sex by Age in Shelburne
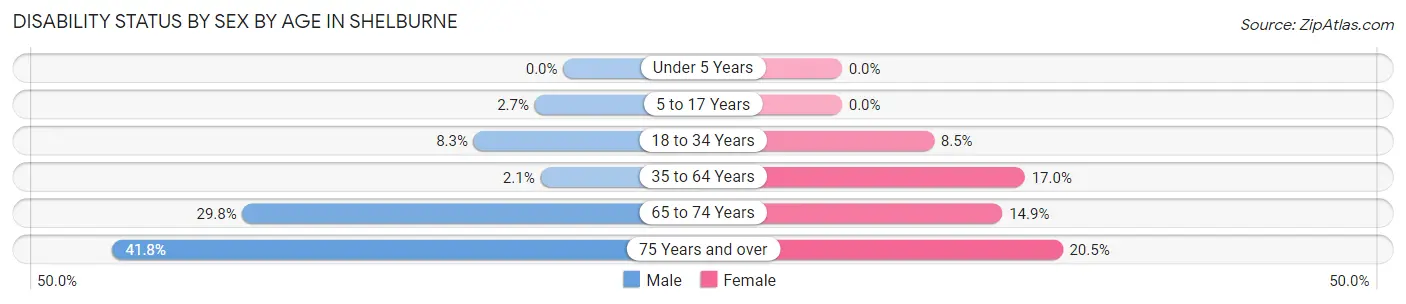
| Age Bracket | Male | Female |
| Under 5 Years | 0 (0.0%) | 0 (0.0%) |
| 5 to 17 Years | 20 (2.6%) | 0 (0.0%) |
| 18 to 34 Years | 25 (8.3%) | 21 (8.5%) |
| 35 to 64 Years | 23 (2.1%) | 243 (17.0%) |
| 65 to 74 Years | 103 (29.8%) | 53 (14.9%) |
| 75 Years and over | 169 (41.8%) | 103 (20.5%) |
Disability Class by Sex by Age in Shelburne
Disability Class: Hearing Difficulty
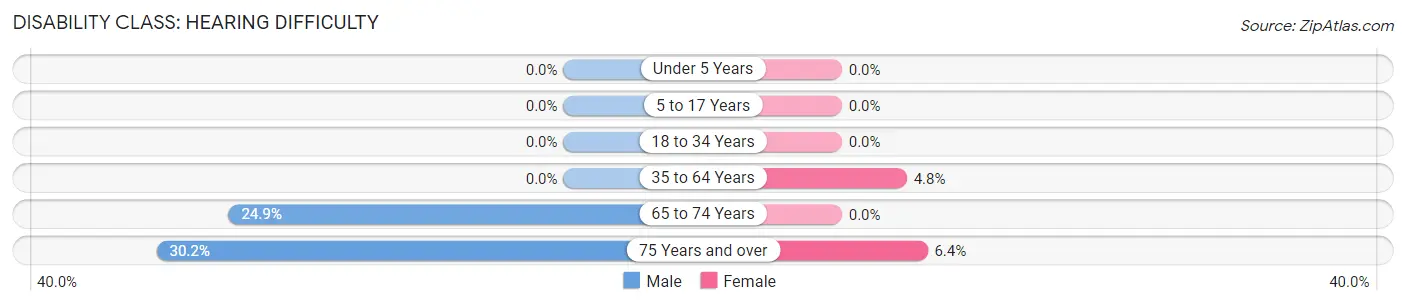
| Age Bracket | Male | Female |
| Under 5 Years | 0 (0.0%) | 0 (0.0%) |
| 5 to 17 Years | 0 (0.0%) | 0 (0.0%) |
| 18 to 34 Years | 0 (0.0%) | 0 (0.0%) |
| 35 to 64 Years | 0 (0.0%) | 69 (4.8%) |
| 65 to 74 Years | 86 (24.9%) | 0 (0.0%) |
| 75 Years and over | 122 (30.2%) | 32 (6.4%) |
Disability Class: Vision Difficulty
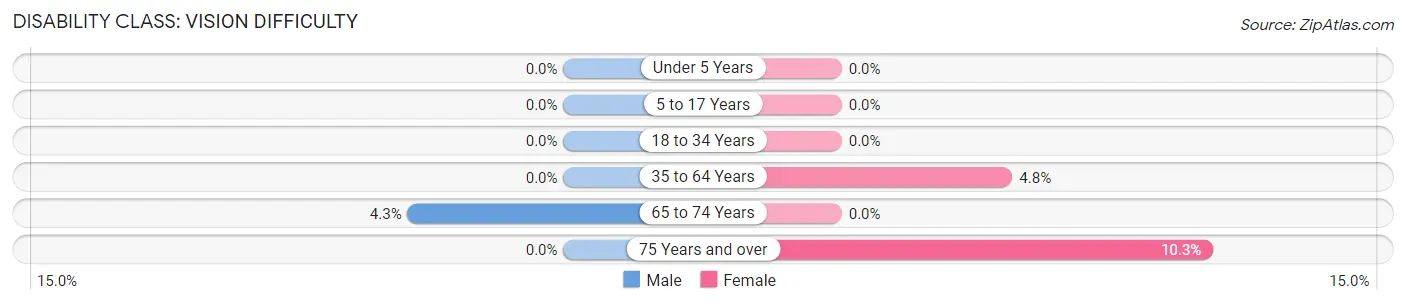
| Age Bracket | Male | Female |
| Under 5 Years | 0 (0.0%) | 0 (0.0%) |
| 5 to 17 Years | 0 (0.0%) | 0 (0.0%) |
| 18 to 34 Years | 0 (0.0%) | 0 (0.0%) |
| 35 to 64 Years | 0 (0.0%) | 68 (4.8%) |
| 65 to 74 Years | 15 (4.3%) | 0 (0.0%) |
| 75 Years and over | 0 (0.0%) | 52 (10.3%) |
Disability Class: Cognitive Difficulty
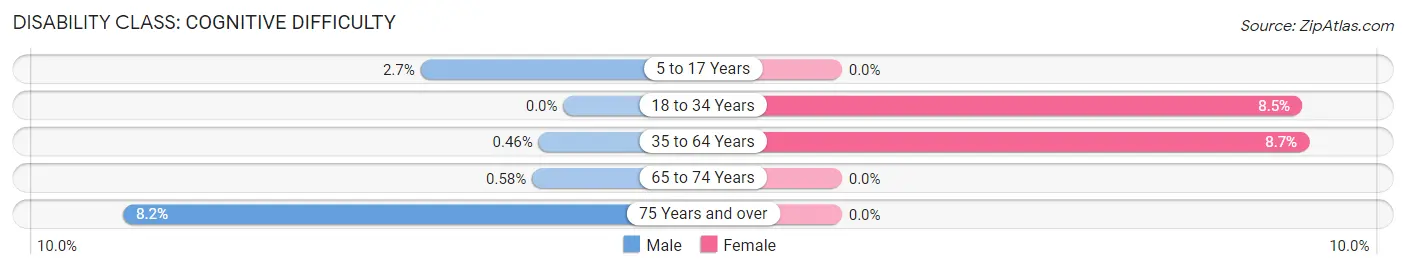
| Age Bracket | Male | Female |
| 5 to 17 Years | 20 (2.6%) | 0 (0.0%) |
| 18 to 34 Years | 0 (0.0%) | 21 (8.5%) |
| 35 to 64 Years | 5 (0.5%) | 124 (8.7%) |
| 65 to 74 Years | 2 (0.6%) | 0 (0.0%) |
| 75 Years and over | 33 (8.2%) | 0 (0.0%) |
Disability Class: Ambulatory Difficulty
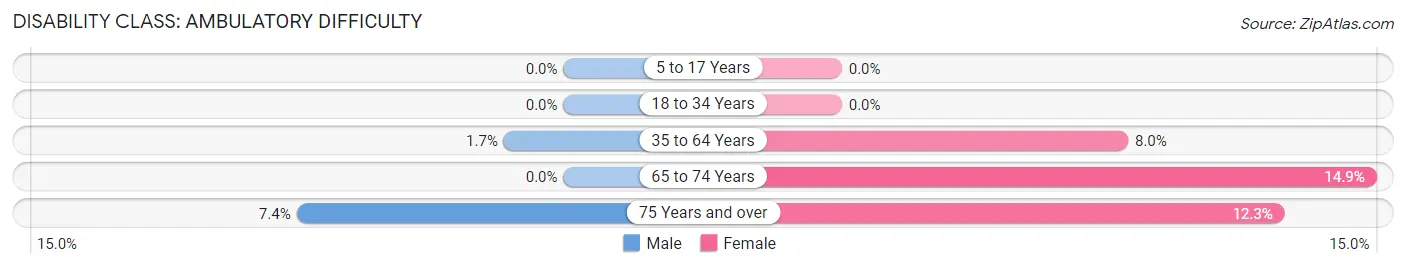
| Age Bracket | Male | Female |
| 5 to 17 Years | 0 (0.0%) | 0 (0.0%) |
| 18 to 34 Years | 0 (0.0%) | 0 (0.0%) |
| 35 to 64 Years | 18 (1.7%) | 114 (8.0%) |
| 65 to 74 Years | 0 (0.0%) | 53 (14.9%) |
| 75 Years and over | 30 (7.4%) | 62 (12.3%) |
Disability Class: Self-Care Difficulty
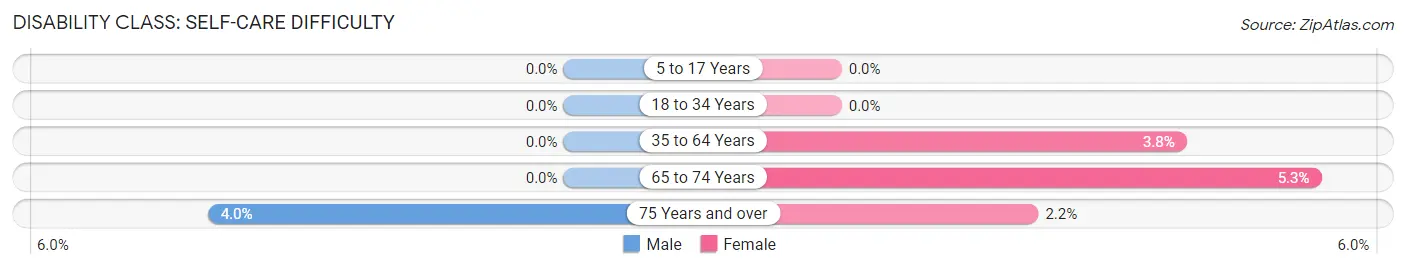
| Age Bracket | Male | Female |
| 5 to 17 Years | 0 (0.0%) | 0 (0.0%) |
| 18 to 34 Years | 0 (0.0%) | 0 (0.0%) |
| 35 to 64 Years | 0 (0.0%) | 55 (3.8%) |
| 65 to 74 Years | 0 (0.0%) | 19 (5.3%) |
| 75 Years and over | 16 (4.0%) | 11 (2.2%) |
Technology Access in Shelburne
Computing Device Access in Shelburne
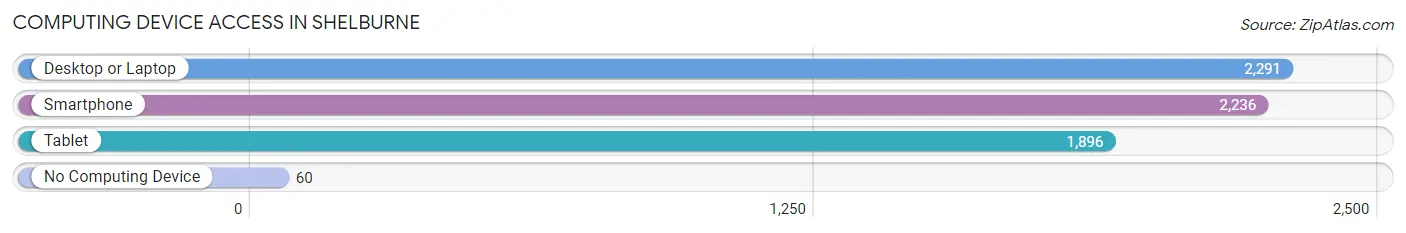
| Device Type | # Households | % Households |
| Desktop or Laptop | 2,291 | 85.7% |
| Smartphone | 2,236 | 83.7% |
| Tablet | 1,896 | 70.9% |
| No Computing Device | 60 | 2.2% |
| Total | 2,673 | 100.0% |
Internet Access in Shelburne
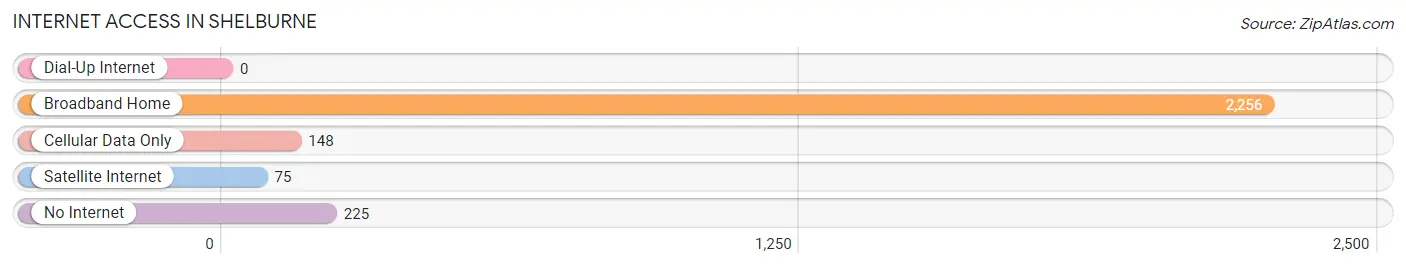
| Internet Type | # Households | % Households |
| Dial-Up Internet | 0 | 0.0% |
| Broadband Home | 2,256 | 84.4% |
| Cellular Data Only | 148 | 5.5% |
| Satellite Internet | 75 | 2.8% |
| No Internet | 225 | 8.4% |
| Total | 2,673 | 100.0% |
Shelburne Summary
Shelburne is a town located in Chittenden County, Vermont, United States. It is situated on the shores of Lake Champlain, and is part of the Burlington metropolitan area. As of the 2010 census, the town had a total population of 7,144.
History
Shelburne was first settled in 1763 by Ira Allen and his brother Remember Baker Allen. The town was named after William Petty, 2nd Earl of Shelburne, who was Prime Minister of Great Britain at the time. The town was incorporated in 1763.
In the early 19th century, Shelburne was a major port on Lake Champlain, and was home to a number of shipyards. The town was also home to a number of mills, including a gristmill, a sawmill, and a paper mill.
In the late 19th century, Shelburne was home to a number of summer resorts, and was a popular destination for tourists. The Shelburne Museum was founded in 1947 by Electra Havemeyer Webb, and is now one of the most popular tourist attractions in the area.
Geography
Shelburne is located in the northwest corner of Chittenden County, in the Champlain Valley. The town is bordered to the north by Grand Isle County, to the east by South Burlington, to the south by Charlotte, and to the west by Lake Champlain.
The town has a total area of 24.2 square miles, of which 22.2 square miles is land and 2.0 square miles is water. The town is located on the western shore of Lake Champlain, and is home to a number of small islands, including Shelburne Island, North Hero Island, and South Hero Island.
Economy
Shelburne is home to a number of businesses and industries, including manufacturing, retail, and tourism. The town is home to a number of small businesses, including restaurants, shops, and galleries.
The town is also home to a number of larger businesses, including the Shelburne Museum, the Vermont Teddy Bear Company, and the Vermont Marble Company. The town is also home to a number of educational institutions, including Shelburne Community School, Shelburne Farms, and the University of Vermont.
Demographics
As of the 2010 census, there were 7,144 people, 2,845 households, and 1,945 families residing in the town. The population density was 319.7 people per square mile. There were 3,039 housing units at an average density of 135.7 per square mile.
The racial makeup of the town was 94.3% White, 1.2% African American, 0.3% Native American, 1.7% Asian, 0.1% Pacific Islander, 0.7% from other races, and 1.9% from two or more races. Hispanic or Latino of any race were 2.3% of the population.
There were 2,845 households, out of which 33.2% had children under the age of 18 living with them, 56.2% were married couples living together, 8.7% had a female householder with no husband present, and 32.2% were non-families. 25.7% of all households were made up of individuals, and 10.2% had someone living alone who was 65 years of age or older. The average household size was 2.50 and the average family size was 3.03.
In the town, the population was spread out, with 25.2% under the age of 18, 5.7% from 18 to 24, 28.2% from 25 to 44, 28.2% from 45 to 64, and 12.7% who were 65 years of age or older. The median age was 40 years. For every 100 females, there were 94.2 males. For every 100 females age 18 and over, there were 91.2 males.
The median income for a household in the town was $60,938, and the median income for a family was $71,917. Males had a median income of $50,000 versus $36,250 for females. The per capita income for the town was $30,945. About 3.2% of families and 5.2% of the population were below the poverty line, including 6.2% of those under age 18 and 4.2% of those age 65 or over.
Common Questions
What is Per Capita Income in Shelburne?
Per Capita income in Shelburne is $57,268.
What is the Median Family Income in Shelburne?
Median Family Income in Shelburne is $120,417.
What is the Median Household income in Shelburne?
Median Household Income in Shelburne is $102,213.
What is Income or Wage Gap in Shelburne?
Income or Wage Gap in Shelburne is 8.2%.
Women in Shelburne earn 91.8 cents for every dollar earned by a man.
What is Inequality or Gini Index in Shelburne?
Inequality or Gini Index in Shelburne is 0.43.
What is the Total Population of Shelburne?
Total Population of Shelburne is 6,195.
What is the Total Male Population of Shelburne?
Total Male Population of Shelburne is 3,022.
What is the Total Female Population of Shelburne?
Total Female Population of Shelburne is 3,173.
What is the Ratio of Males per 100 Females in Shelburne?
There are 95.24 Males per 100 Females in Shelburne.
What is the Ratio of Females per 100 Males in Shelburne?
There are 105.00 Females per 100 Males in Shelburne.
What is the Median Population Age in Shelburne?
Median Population Age in Shelburne is 49.2 Years.
What is the Average Family Size in Shelburne
Average Family Size in Shelburne is 2.7 People.
What is the Average Household Size in Shelburne
Average Household Size in Shelburne is 2.3 People.
How Large is the Labor Force in Shelburne?
There are 3,059 People in the Labor Forcein in Shelburne.
What is the Percentage of People in the Labor Force in Shelburne?
59.9% of People are in the Labor Force in Shelburne.
What is the Unemployment Rate in Shelburne?
Unemployment Rate in Shelburne is 4.4%.