West Brattleboro, VT Map & Demographics
West Brattleboro Map
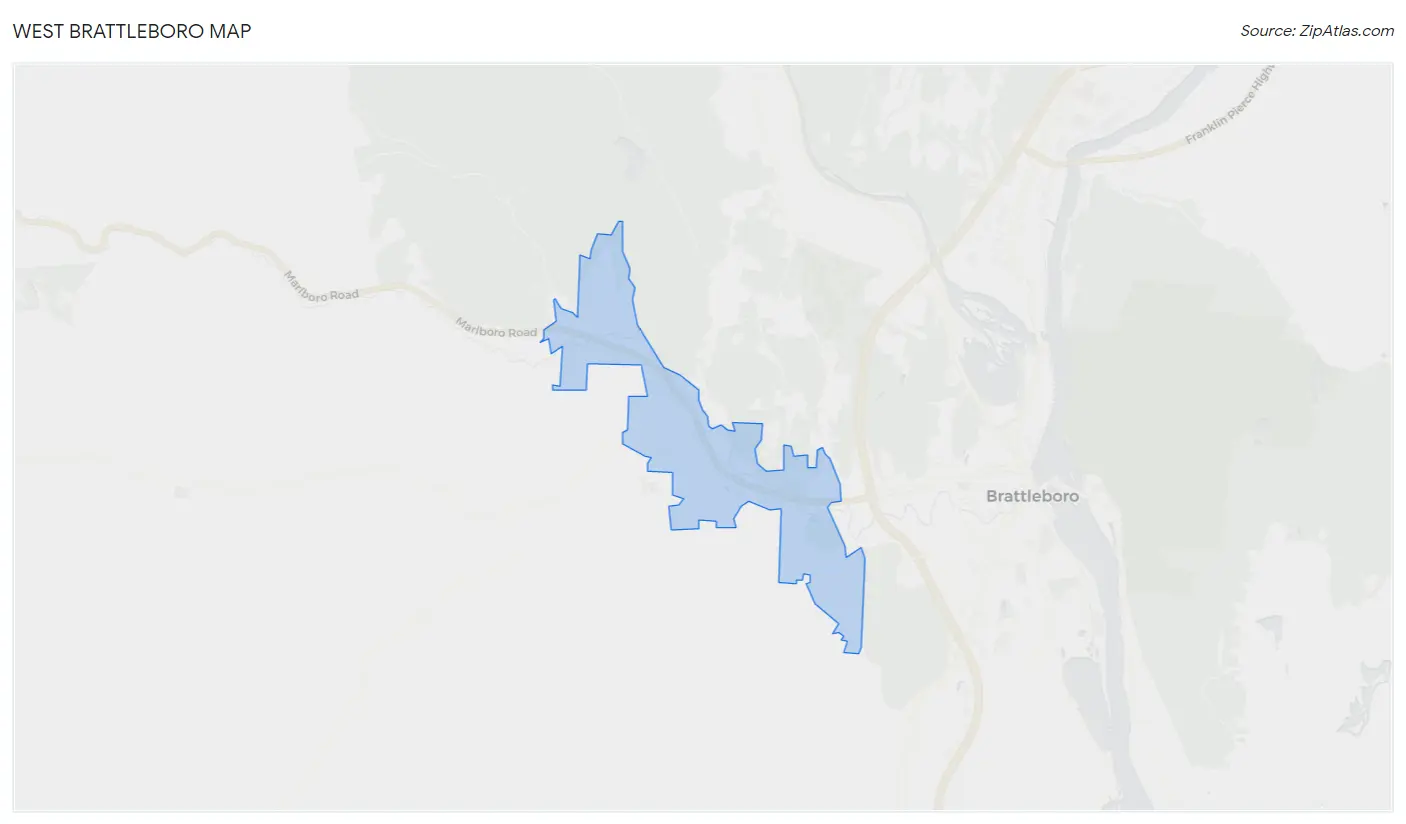
West Brattleboro Overview
$28,562
PER CAPITA INCOME
$48,846
AVG FAMILY INCOME
$40,446
AVG HOUSEHOLD INCOME
29.9%
WAGE / INCOME GAP [ % ]
70.1¢/ $1
WAGE / INCOME GAP [ $ ]
0.42
INEQUALITY / GINI INDEX
2,817
TOTAL POPULATION
1,234
MALE POPULATION
1,583
FEMALE POPULATION
77.95
MALES / 100 FEMALES
128.28
FEMALES / 100 MALES
42.7
MEDIAN AGE
3.0
AVG FAMILY SIZE
2.1
AVG HOUSEHOLD SIZE
1,521
LABOR FORCE [ PEOPLE ]
68.1%
PERCENT IN LABOR FORCE
4.9%
UNEMPLOYMENT RATE
West Brattleboro Area Codes
Income in West Brattleboro
Income Overview in West Brattleboro
Per Capita Income in West Brattleboro is $28,562, while median incomes of families and households are $48,846 and $40,446 respectively.
| Characteristic | Number | Measure |
| Per Capita Income | 2,817 | $28,562 |
| Median Family Income | 652 | $48,846 |
| Mean Family Income | 652 | $72,074 |
| Median Household Income | 1,340 | $40,446 |
| Mean Household Income | 1,340 | $54,718 |
| Income Deficit | 652 | $0 |
| Wage / Income Gap (%) | 2,817 | 29.85% |
| Wage / Income Gap ($) | 2,817 | 70.15¢ per $1 |
| Gini / Inequality Index | 2,817 | 0.42 |
Earnings by Sex in West Brattleboro
Average Earnings in West Brattleboro are $35,400, $38,213 for men and $26,806 for women, a difference of 29.8%.
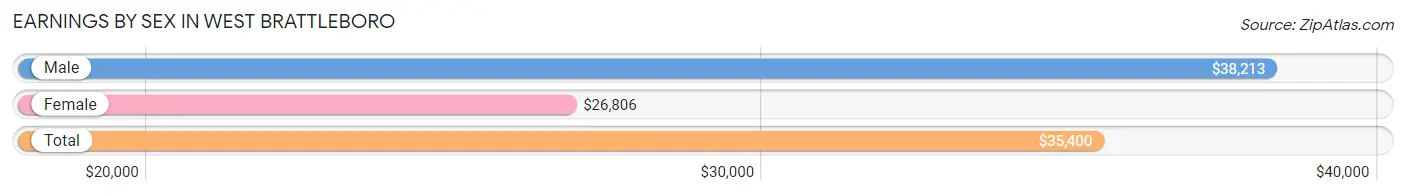
| Sex | Number | Average Earnings |
| Male | 637 (39.0%) | $38,213 |
| Female | 997 (61.0%) | $26,806 |
| Total | 1,634 (100.0%) | $35,400 |
Earnings by Sex by Income Bracket in West Brattleboro
The most common earnings brackets in West Brattleboro are $35,000 to $39,999 for men (145 | 22.8%) and $2,499 or less for women (146 | 14.6%).
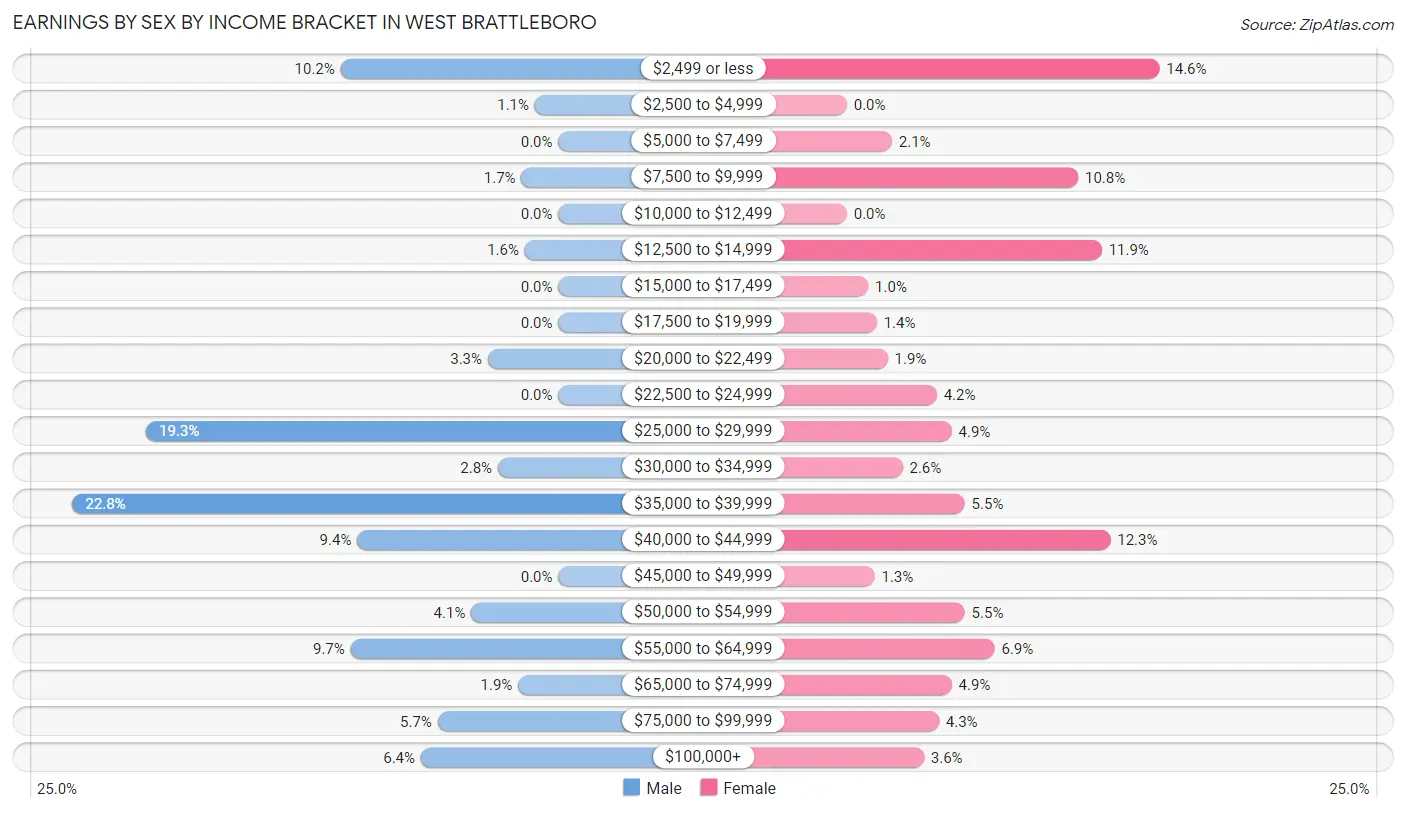
| Income | Male | Female |
| $2,499 or less | 65 (10.2%) | 146 (14.6%) |
| $2,500 to $4,999 | 7 (1.1%) | 0 (0.0%) |
| $5,000 to $7,499 | 0 (0.0%) | 21 (2.1%) |
| $7,500 to $9,999 | 11 (1.7%) | 108 (10.8%) |
| $10,000 to $12,499 | 0 (0.0%) | 0 (0.0%) |
| $12,500 to $14,999 | 10 (1.6%) | 119 (11.9%) |
| $15,000 to $17,499 | 0 (0.0%) | 10 (1.0%) |
| $17,500 to $19,999 | 0 (0.0%) | 14 (1.4%) |
| $20,000 to $22,499 | 21 (3.3%) | 19 (1.9%) |
| $22,500 to $24,999 | 0 (0.0%) | 42 (4.2%) |
| $25,000 to $29,999 | 123 (19.3%) | 49 (4.9%) |
| $30,000 to $34,999 | 18 (2.8%) | 26 (2.6%) |
| $35,000 to $39,999 | 145 (22.8%) | 55 (5.5%) |
| $40,000 to $44,999 | 60 (9.4%) | 123 (12.3%) |
| $45,000 to $49,999 | 0 (0.0%) | 13 (1.3%) |
| $50,000 to $54,999 | 26 (4.1%) | 55 (5.5%) |
| $55,000 to $64,999 | 62 (9.7%) | 69 (6.9%) |
| $65,000 to $74,999 | 12 (1.9%) | 49 (4.9%) |
| $75,000 to $99,999 | 36 (5.7%) | 43 (4.3%) |
| $100,000+ | 41 (6.4%) | 36 (3.6%) |
| Total | 637 (100.0%) | 997 (100.0%) |
Earnings by Sex by Educational Attainment in West Brattleboro
Average earnings in West Brattleboro are $39,474 for men and $34,038 for women, a difference of 13.8%. Men with an educational attainment of college or associate's degree enjoy the highest average annual earnings of $43,313, while those with high school diploma education earn the least with $38,575. Women with an educational attainment of graduate degree earn the most with the average annual earnings of $58,056, while those with high school diploma education have the smallest earnings of $33,000.
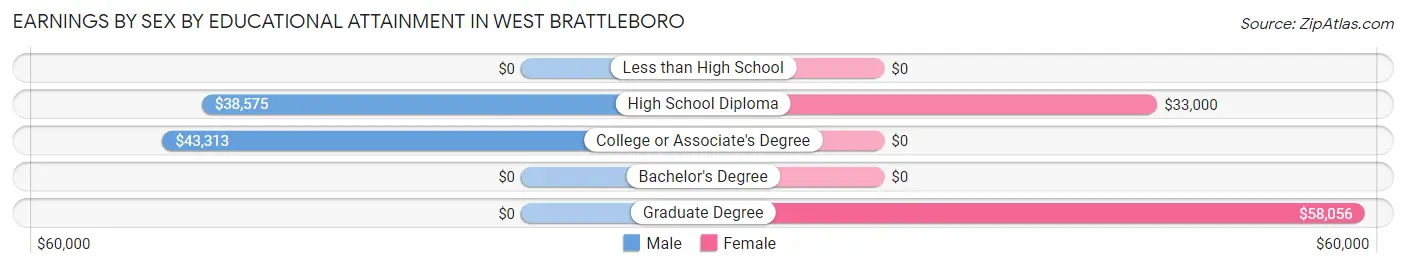
| Educational Attainment | Male Income | Female Income |
| Less than High School | - | - |
| High School Diploma | $38,575 | $33,000 |
| College or Associate's Degree | $43,313 | $0 |
| Bachelor's Degree | - | - |
| Graduate Degree | - | - |
| Total | $39,474 | $34,038 |
Family Income in West Brattleboro
Family Income Brackets in West Brattleboro
According to the West Brattleboro family income data, there are 213 families falling into the $35,000 to $49,999 income range, which is the most common income bracket and makes up 32.7% of all families.
| Income Bracket | # Families | % Families |
| Less than $10,000 | 27 | 4.1% |
| $10,000 to $14,999 | 0 | 0.0% |
| $15,000 to $24,999 | 64 | 9.8% |
| $25,000 to $34,999 | 40 | 6.1% |
| $35,000 to $49,999 | 213 | 32.7% |
| $50,000 to $74,999 | 27 | 4.1% |
| $75,000 to $99,999 | 84 | 12.9% |
| $100,000 to $149,999 | 147 | 22.5% |
| $150,000 to $199,999 | 50 | 7.7% |
| $200,000+ | 0 | 0.0% |
Family Income by Famaliy Size in West Brattleboro
3-person families (114 | 17.5%) account for the highest median family income in West Brattleboro with $123,333 per family, while 3-person families (114 | 17.5%) have the highest median income of $41,111 per family member.
| Income Bracket | # Families | Median Income |
| 2-Person Families | 434 (66.6%) | $43,354 |
| 3-Person Families | 114 (17.5%) | $123,333 |
| 4-Person Families | 94 (14.4%) | $0 |
| 5-Person Families | 0 (0.0%) | $0 |
| 6-Person Families | 10 (1.5%) | $0 |
| 7+ Person Families | 0 (0.0%) | $0 |
| Total | 652 (100.0%) | $48,846 |
Family Income by Number of Earners in West Brattleboro
The median family income in West Brattleboro is $48,846, with families comprising 3+ earners (66) having the highest median family income of $124,833, while families with 1 earner (282) have the lowest median family income of $39,861, accounting for 10.1% and 43.2% of families, respectively.
| Number of Earners | # Families | Median Income |
| No Earners | 92 (14.1%) | $41,583 |
| 1 Earner | 282 (43.2%) | $39,861 |
| 2 Earners | 212 (32.5%) | $101,759 |
| 3+ Earners | 66 (10.1%) | $124,833 |
| Total | 652 (100.0%) | $48,846 |
Household Income in West Brattleboro
Household Income Brackets in West Brattleboro
With 359 households falling in the category, the $35,000 to $49,999 income range is the most frequent in West Brattleboro, accounting for 26.8% of all households.
| Income Bracket | # Households | % Households |
| Less than $10,000 | 56 | 4.2% |
| $10,000 to $14,999 | 234 | 17.5% |
| $15,000 to $24,999 | 111 | 8.3% |
| $25,000 to $34,999 | 86 | 6.4% |
| $35,000 to $49,999 | 359 | 26.8% |
| $50,000 to $74,999 | 105 | 7.8% |
| $75,000 to $99,999 | 134 | 10.0% |
| $100,000 to $149,999 | 205 | 15.3% |
| $150,000 to $199,999 | 50 | 3.7% |
| $200,000+ | 0 | 0.0% |
Household Income by Householder Age in West Brattleboro
The median household income in West Brattleboro is $40,446, with the highest median household income of $43,727 found in the 25 to 44 years age bracket for the primary householder. A total of 412 households (30.7%) fall into this category. Meanwhile, the 15 to 24 years age bracket for the primary householder has the lowest median household income of $0, with 14 households (1.0%) in this group.
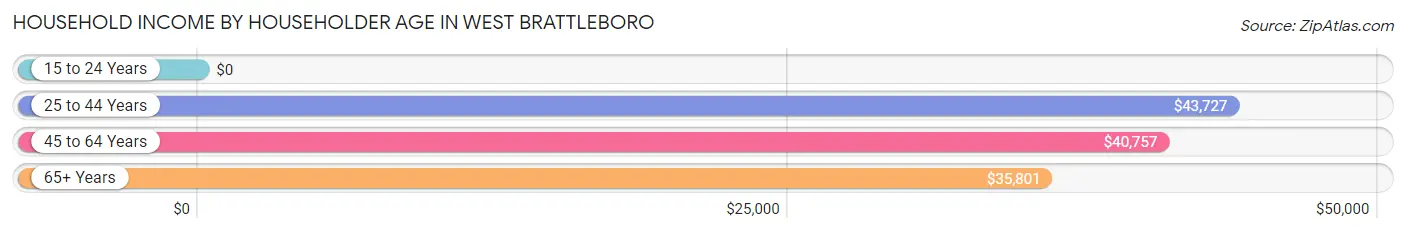
| Income Bracket | # Households | Median Income |
| 15 to 24 Years | 14 (1.0%) | $0 |
| 25 to 44 Years | 412 (30.7%) | $43,727 |
| 45 to 64 Years | 501 (37.4%) | $40,757 |
| 65+ Years | 413 (30.8%) | $35,801 |
| Total | 1,340 (100.0%) | $40,446 |
Poverty in West Brattleboro
Income Below Poverty by Sex and Age in West Brattleboro
With 12.7% poverty level for males and 27.7% for females among the residents of West Brattleboro, under 5 year old males and 12 to 14 year old females are the most vulnerable to poverty, with 101 males (65.2%) and 20 females (100.0%) in their respective age groups living below the poverty level.
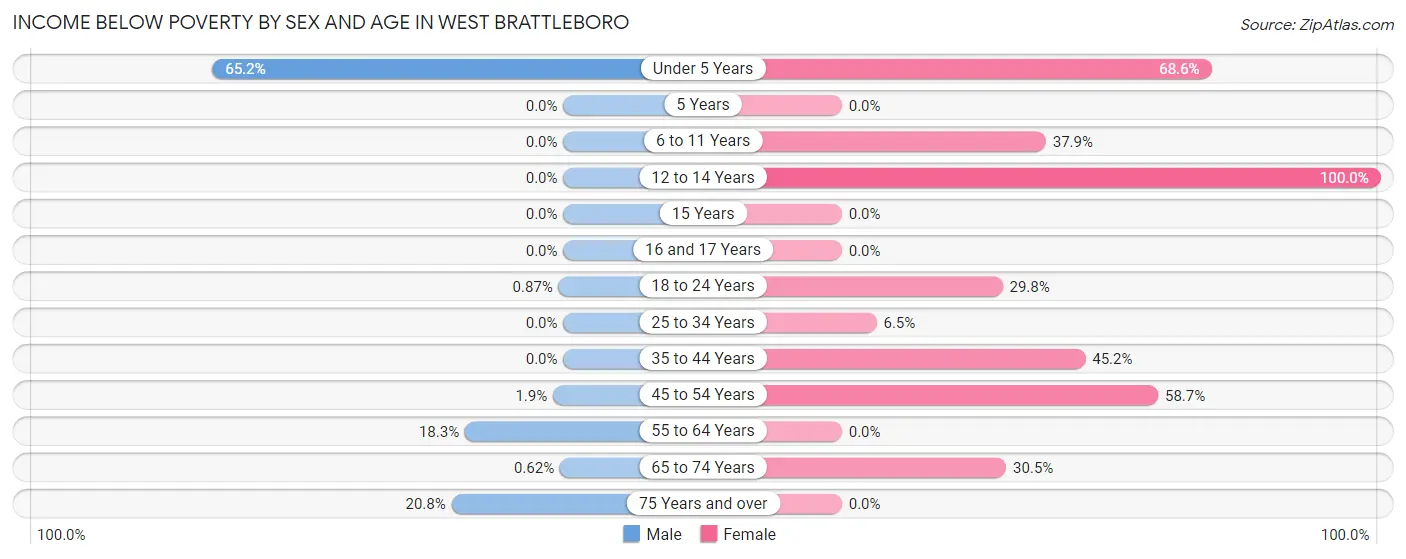
| Age Bracket | Male | Female |
| Under 5 Years | 101 (65.2%) | 59 (68.6%) |
| 5 Years | 0 (0.0%) | 0 (0.0%) |
| 6 to 11 Years | 0 (0.0%) | 39 (37.9%) |
| 12 to 14 Years | 0 (0.0%) | 20 (100.0%) |
| 15 Years | 0 (0.0%) | 0 (0.0%) |
| 16 and 17 Years | 0 (0.0%) | 0 (0.0%) |
| 18 to 24 Years | 1 (0.9%) | 37 (29.8%) |
| 25 to 34 Years | 0 (0.0%) | 16 (6.5%) |
| 35 to 44 Years | 0 (0.0%) | 113 (45.2%) |
| 45 to 54 Years | 3 (1.9%) | 54 (58.7%) |
| 55 to 64 Years | 40 (18.3%) | 0 (0.0%) |
| 65 to 74 Years | 1 (0.6%) | 101 (30.5%) |
| 75 Years and over | 11 (20.7%) | 0 (0.0%) |
| Total | 157 (12.7%) | 439 (27.7%) |
Income Above Poverty by Sex and Age in West Brattleboro
According to the poverty statistics in West Brattleboro, males aged 6 to 11 years and females aged 5 years are the age groups that are most secure financially, with 100.0% of males and 100.0% of females in these age groups living above the poverty line.
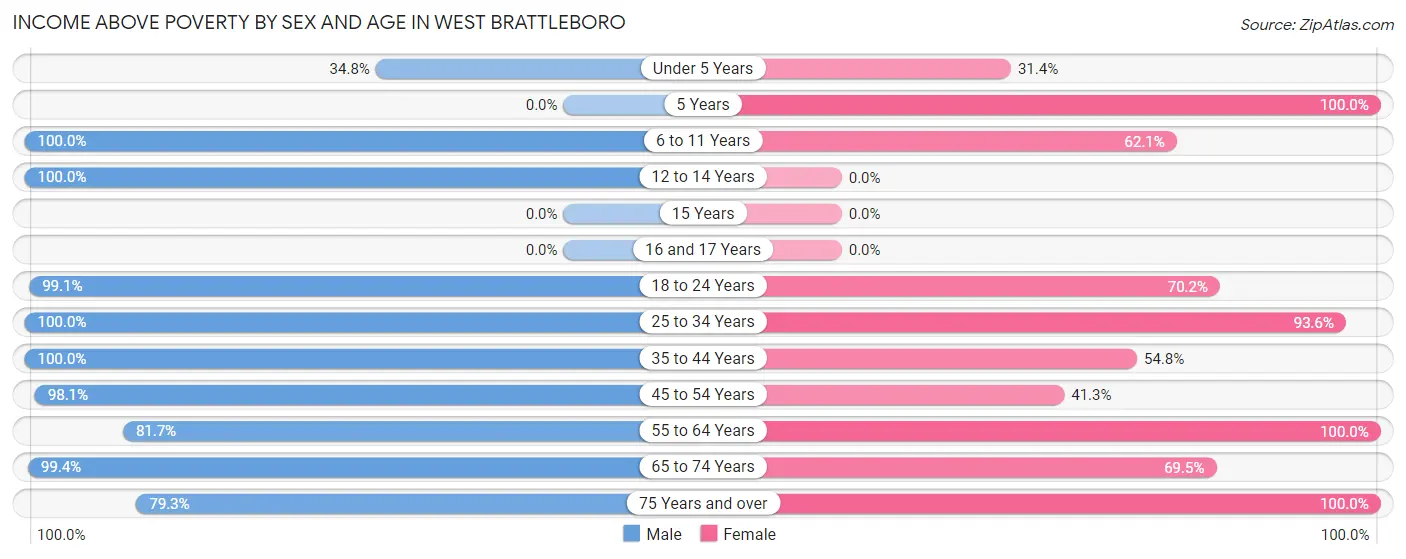
| Age Bracket | Male | Female |
| Under 5 Years | 54 (34.8%) | 27 (31.4%) |
| 5 Years | 0 (0.0%) | 10 (100.0%) |
| 6 to 11 Years | 139 (100.0%) | 64 (62.1%) |
| 12 to 14 Years | 71 (100.0%) | 0 (0.0%) |
| 15 Years | 0 (0.0%) | 0 (0.0%) |
| 16 and 17 Years | 0 (0.0%) | 0 (0.0%) |
| 18 to 24 Years | 114 (99.1%) | 87 (70.2%) |
| 25 to 34 Years | 68 (100.0%) | 232 (93.5%) |
| 35 to 44 Years | 95 (100.0%) | 137 (54.8%) |
| 45 to 54 Years | 154 (98.1%) | 38 (41.3%) |
| 55 to 64 Years | 179 (81.7%) | 223 (100.0%) |
| 65 to 74 Years | 161 (99.4%) | 230 (69.5%) |
| 75 Years and over | 42 (79.2%) | 96 (100.0%) |
| Total | 1,077 (87.3%) | 1,144 (72.3%) |
Income Below Poverty Among Married-Couple Families in West Brattleboro
The poverty statistics for married-couple families in West Brattleboro show that 2.5% or 10 of the total 392 families live below the poverty line. Families with no children have the highest poverty rate of 3.6%, comprising of 10 families. On the other hand, families with 1 or 2 children have the lowest poverty rate of 0.0%, which includes 0 families.
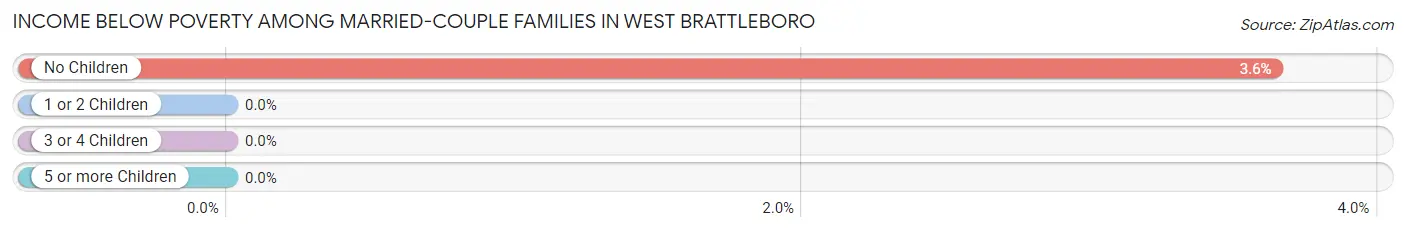
| Children | Above Poverty | Below Poverty |
| No Children | 265 (96.4%) | 10 (3.6%) |
| 1 or 2 Children | 107 (100.0%) | 0 (0.0%) |
| 3 or 4 Children | 10 (100.0%) | 0 (0.0%) |
| 5 or more Children | 0 (0.0%) | 0 (0.0%) |
| Total | 382 (97.5%) | 10 (2.5%) |
Income Below Poverty Among Single-Parent Households in West Brattleboro
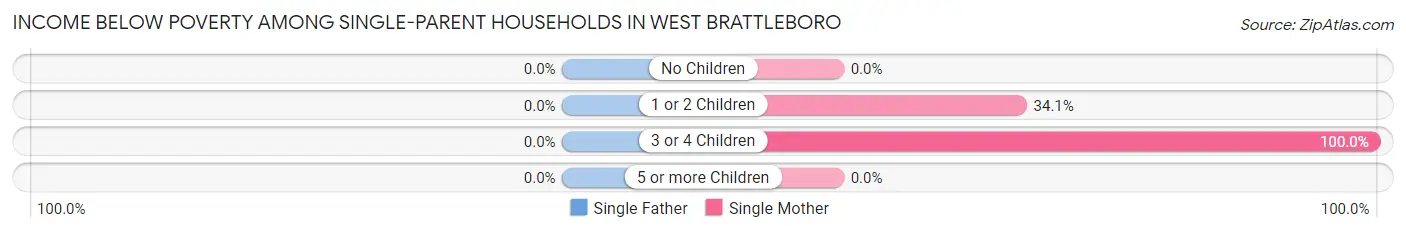
| Children | Single Father | Single Mother |
| No Children | 0 (0.0%) | 0 (0.0%) |
| 1 or 2 Children | 0 (0.0%) | 46 (34.1%) |
| 3 or 4 Children | 0 (0.0%) | 16 (100.0%) |
| 5 or more Children | 0 (0.0%) | 0 (0.0%) |
| Total | 0 (0.0%) | 62 (28.7%) |
Income Below Poverty Among Married-Couple vs Single-Parent Households in West Brattleboro
The poverty data for West Brattleboro shows that 10 of the married-couple family households (2.5%) and 62 of the single-parent households (23.8%) are living below the poverty level. Within the married-couple family households, those with no children have the highest poverty rate, with 10 households (3.6%) falling below the poverty line. Among the single-parent households, those with 3 or 4 children have the highest poverty rate, with 16 household (100.0%) living below poverty.
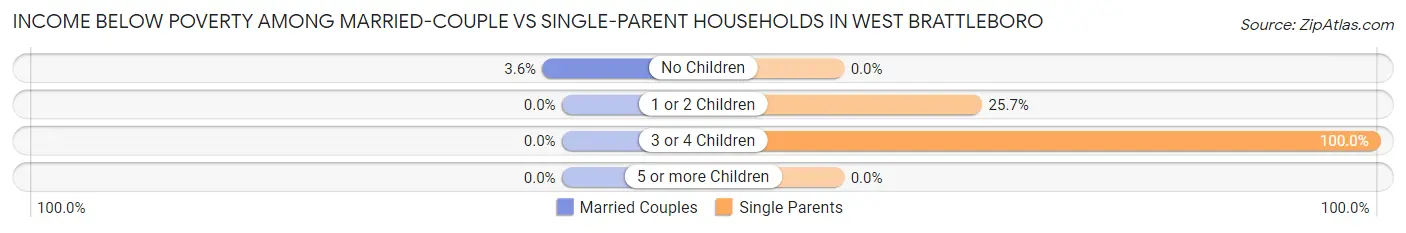
| Children | Married-Couple Families | Single-Parent Households |
| No Children | 10 (3.6%) | 0 (0.0%) |
| 1 or 2 Children | 0 (0.0%) | 46 (25.7%) |
| 3 or 4 Children | 0 (0.0%) | 16 (100.0%) |
| 5 or more Children | 0 (0.0%) | 0 (0.0%) |
| Total | 10 (2.5%) | 62 (23.8%) |
Race in West Brattleboro
The most populous races in West Brattleboro are White / Caucasian (2,545 | 90.3%), Two or more Races (198 | 7.0%), and Hispanic or Latino (80 | 2.8%).
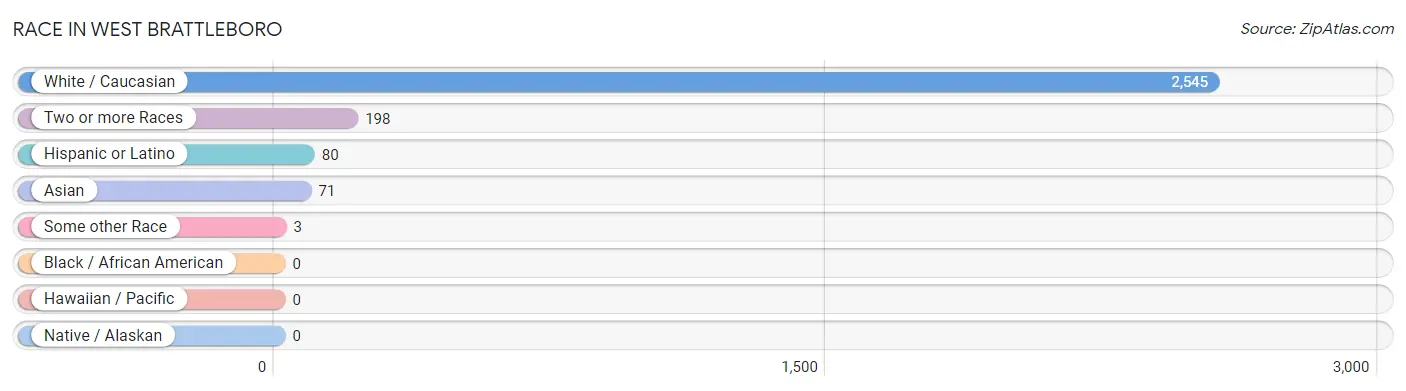
| Race | # Population | % Population |
| Asian | 71 | 2.5% |
| Black / African American | 0 | 0.0% |
| Hawaiian / Pacific | 0 | 0.0% |
| Hispanic or Latino | 80 | 2.8% |
| Native / Alaskan | 0 | 0.0% |
| White / Caucasian | 2,545 | 90.3% |
| Two or more Races | 198 | 7.0% |
| Some other Race | 3 | 0.1% |
| Total | 2,817 | 100.0% |
Ancestry in West Brattleboro
The most populous ancestries reported in West Brattleboro are Irish (389 | 13.8%), English (370 | 13.1%), German (370 | 13.1%), French (235 | 8.3%), and Italian (220 | 7.8%), together accounting for 56.2% of all West Brattleboro residents.
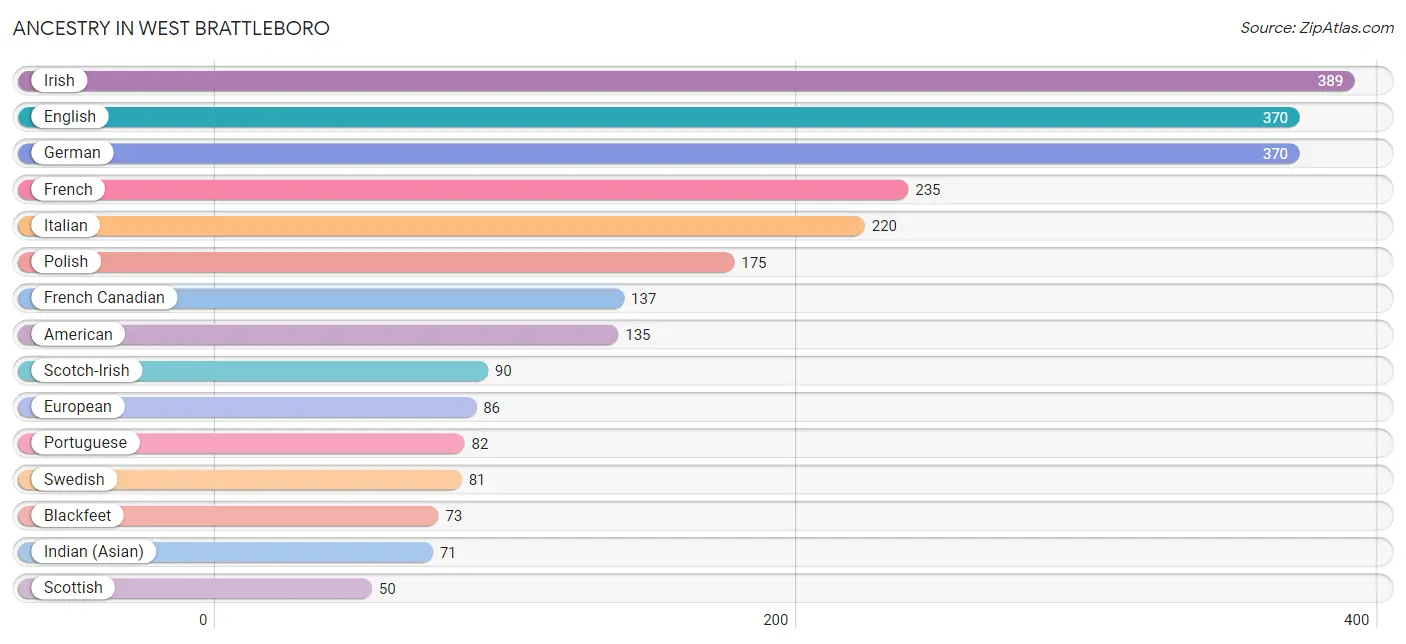
| Ancestry | # Population | % Population |
| American | 135 | 4.8% |
| Arab | 45 | 1.6% |
| Austrian | 10 | 0.4% |
| Blackfeet | 73 | 2.6% |
| British | 31 | 1.1% |
| Canadian | 9 | 0.3% |
| Cherokee | 13 | 0.5% |
| Chilean | 3 | 0.1% |
| Cuban | 11 | 0.4% |
| Danish | 10 | 0.4% |
| Dutch | 36 | 1.3% |
| English | 370 | 13.1% |
| European | 86 | 3.0% |
| Finnish | 15 | 0.5% |
| French | 235 | 8.3% |
| French Canadian | 137 | 4.9% |
| German | 370 | 13.1% |
| Indian (Asian) | 71 | 2.5% |
| Iranian | 1 | 0.0% |
| Irish | 389 | 13.8% |
| Italian | 220 | 7.8% |
| Lebanese | 45 | 1.6% |
| Lithuanian | 44 | 1.6% |
| Nigerian | 13 | 0.5% |
| Northern European | 28 | 1.0% |
| Polish | 175 | 6.2% |
| Portuguese | 82 | 2.9% |
| Puerto Rican | 46 | 1.6% |
| Russian | 22 | 0.8% |
| Samoan | 31 | 1.1% |
| Scotch-Irish | 90 | 3.2% |
| Scottish | 50 | 1.8% |
| South American | 3 | 0.1% |
| Subsaharan African | 13 | 0.5% |
| Swedish | 81 | 2.9% |
| Swiss | 27 | 1.0% |
| Welsh | 42 | 1.5% | View All 37 Rows |
Immigrants in West Brattleboro
The most numerous immigrant groups reported in West Brattleboro came from Europe (36 | 1.3%), Northern Europe (23 | 0.8%), Asia (15 | 0.5%), Philippines (14 | 0.5%), and South Eastern Asia (14 | 0.5%), together accounting for 3.6% of all West Brattleboro residents.
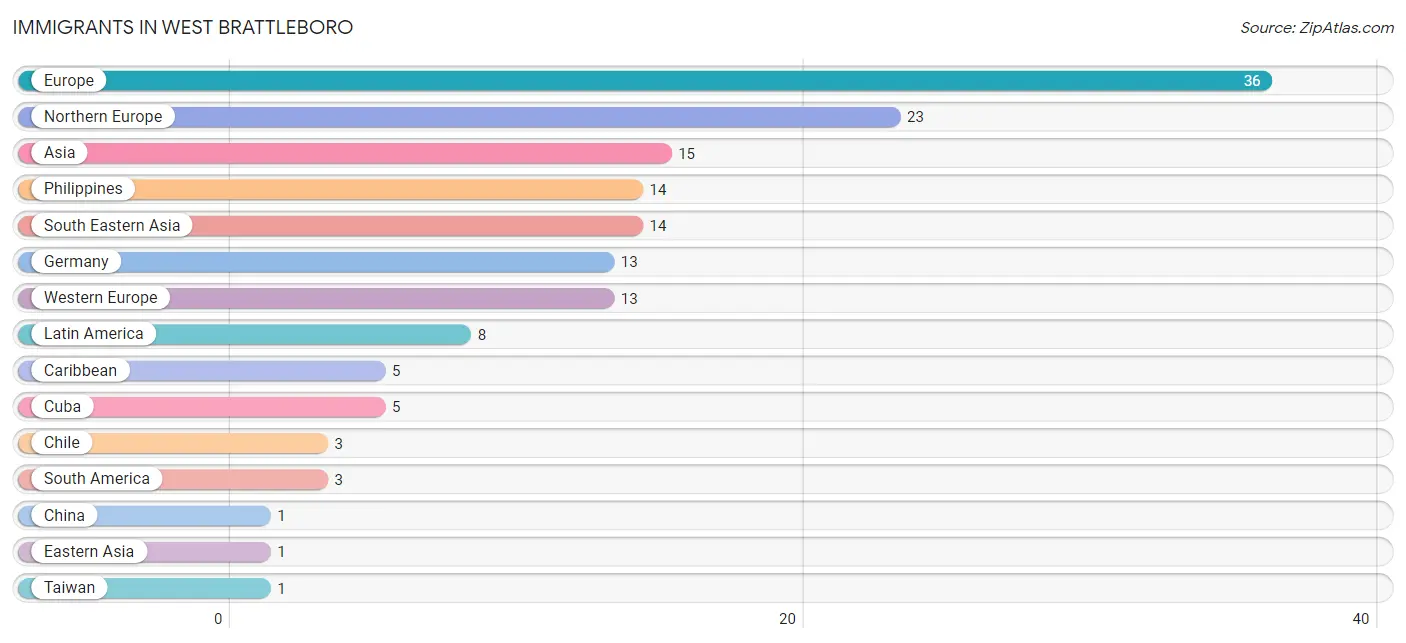
| Immigration Origin | # Population | % Population |
| Asia | 15 | 0.5% |
| Caribbean | 5 | 0.2% |
| Chile | 3 | 0.1% |
| China | 1 | 0.0% |
| Cuba | 5 | 0.2% |
| Eastern Asia | 1 | 0.0% |
| Europe | 36 | 1.3% |
| Germany | 13 | 0.5% |
| Latin America | 8 | 0.3% |
| Northern Europe | 23 | 0.8% |
| Philippines | 14 | 0.5% |
| South America | 3 | 0.1% |
| South Eastern Asia | 14 | 0.5% |
| Taiwan | 1 | 0.0% |
| Western Europe | 13 | 0.5% | View All 15 Rows |
Sex and Age in West Brattleboro
Sex and Age in West Brattleboro
The most populous age groups in West Brattleboro are 55 to 59 Years (164 | 13.3%) for men and 65 to 69 Years (228 | 14.4%) for women.
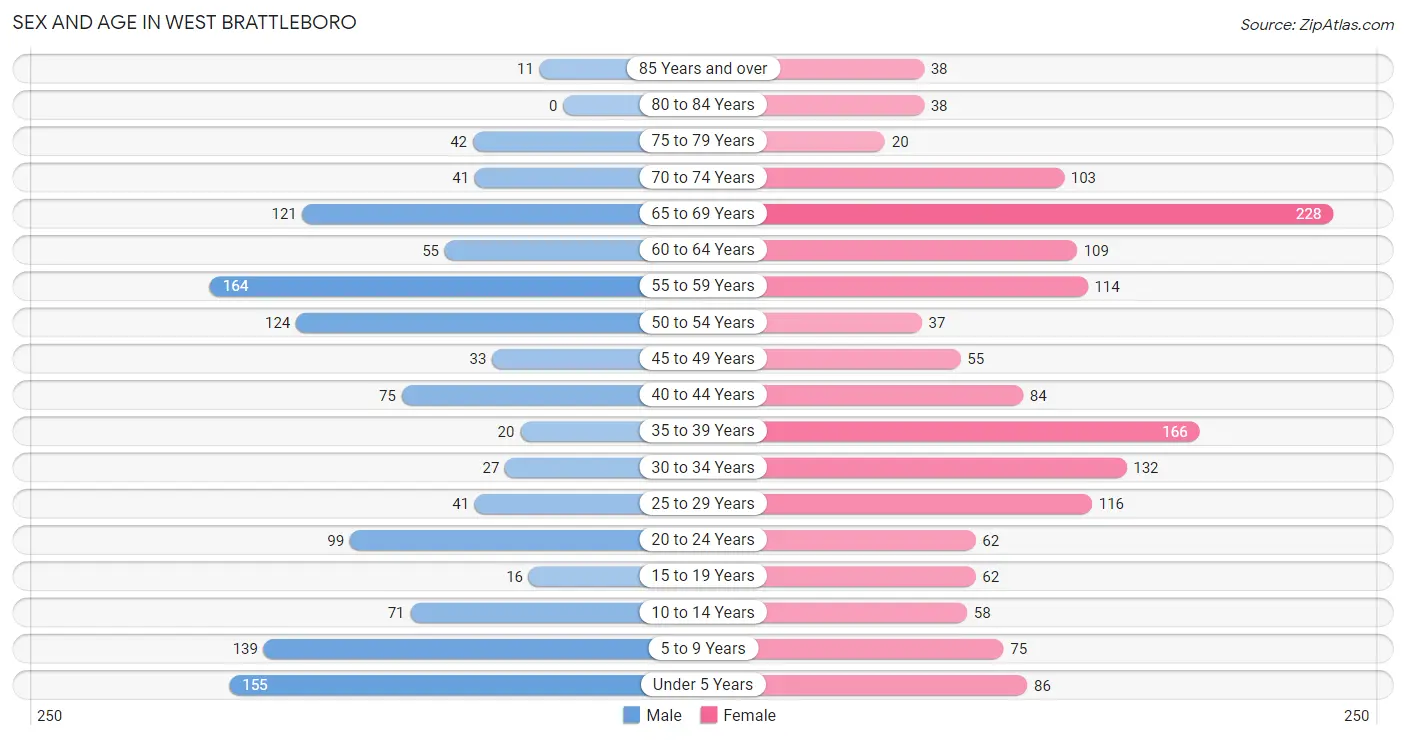
| Age Bracket | Male | Female |
| Under 5 Years | 155 (12.6%) | 86 (5.4%) |
| 5 to 9 Years | 139 (11.3%) | 75 (4.7%) |
| 10 to 14 Years | 71 (5.8%) | 58 (3.7%) |
| 15 to 19 Years | 16 (1.3%) | 62 (3.9%) |
| 20 to 24 Years | 99 (8.0%) | 62 (3.9%) |
| 25 to 29 Years | 41 (3.3%) | 116 (7.3%) |
| 30 to 34 Years | 27 (2.2%) | 132 (8.3%) |
| 35 to 39 Years | 20 (1.6%) | 166 (10.5%) |
| 40 to 44 Years | 75 (6.1%) | 84 (5.3%) |
| 45 to 49 Years | 33 (2.7%) | 55 (3.5%) |
| 50 to 54 Years | 124 (10.1%) | 37 (2.3%) |
| 55 to 59 Years | 164 (13.3%) | 114 (7.2%) |
| 60 to 64 Years | 55 (4.5%) | 109 (6.9%) |
| 65 to 69 Years | 121 (9.8%) | 228 (14.4%) |
| 70 to 74 Years | 41 (3.3%) | 103 (6.5%) |
| 75 to 79 Years | 42 (3.4%) | 20 (1.3%) |
| 80 to 84 Years | 0 (0.0%) | 38 (2.4%) |
| 85 Years and over | 11 (0.9%) | 38 (2.4%) |
| Total | 1,234 (100.0%) | 1,583 (100.0%) |
Families and Households in West Brattleboro
Median Family Size in West Brattleboro
The median family size in West Brattleboro is 2.97 persons per family, with single female/mother families (216 | 33.1%) accounting for the largest median family size of 3.15 persons per family. On the other hand, single male/father families (44 | 6.8%) represent the smallest median family size with 2.50 persons per family.
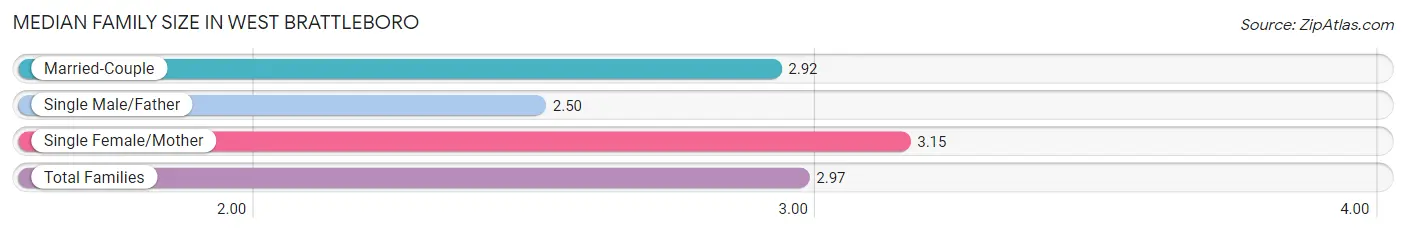
| Family Type | # Families | Family Size |
| Married-Couple | 392 (60.1%) | 2.92 |
| Single Male/Father | 44 (6.8%) | 2.50 |
| Single Female/Mother | 216 (33.1%) | 3.15 |
| Total Families | 652 (100.0%) | 2.97 |
Median Household Size in West Brattleboro
The median household size in West Brattleboro is 2.10 persons per household, with single female/mother households (216 | 16.1%) accounting for the largest median household size of 3.75 persons per household. non-family households (688 | 51.3%) represent the smallest median household size with 1.08 persons per household.
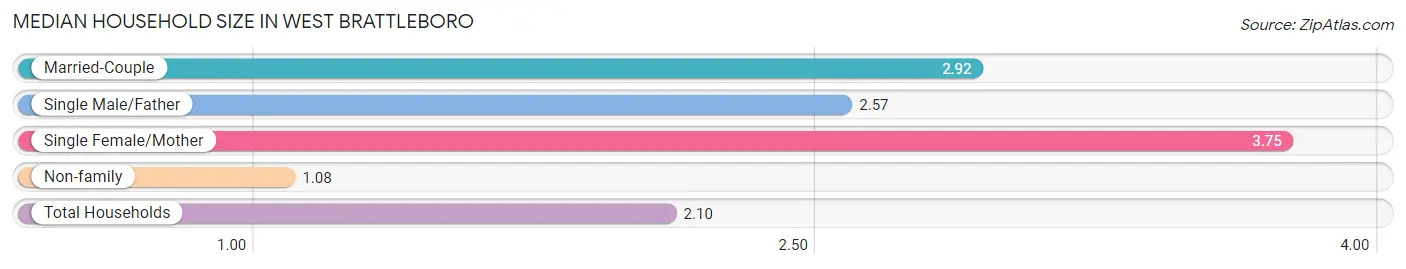
| Household Type | # Households | Household Size |
| Married-Couple | 392 (29.2%) | 2.92 |
| Single Male/Father | 44 (3.3%) | 2.57 |
| Single Female/Mother | 216 (16.1%) | 3.75 |
| Non-family | 688 (51.3%) | 1.08 |
| Total Households | 1,340 (100.0%) | 2.10 |
Household Size by Marriage Status in West Brattleboro
Out of a total of 1,340 households in West Brattleboro, 652 (48.7%) are family households, while 688 (51.3%) are nonfamily households. The most numerous type of family households are 2-person households, comprising 381, and the most common type of nonfamily households are 1-person households, comprising 654.
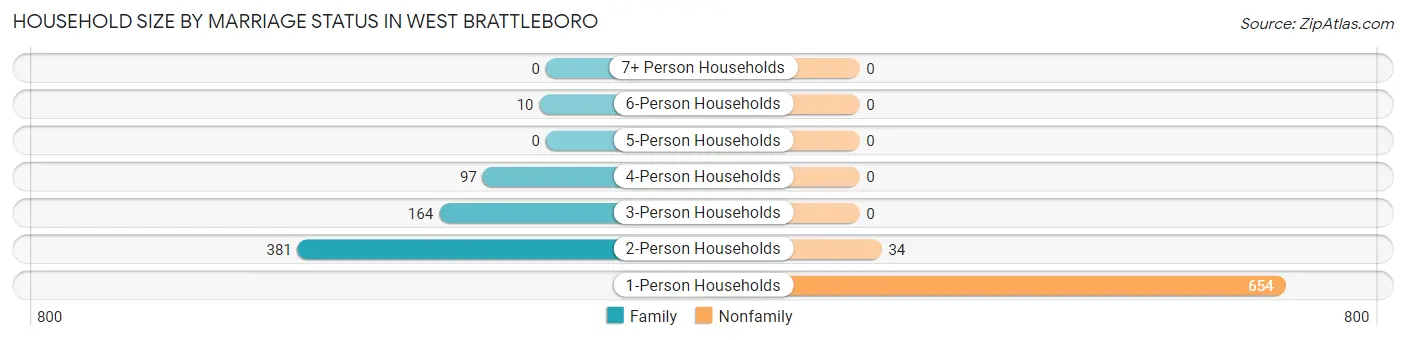
| Household Size | Family Households | Nonfamily Households |
| 1-Person Households | - | 654 (48.8%) |
| 2-Person Households | 381 (28.4%) | 34 (2.5%) |
| 3-Person Households | 164 (12.2%) | 0 (0.0%) |
| 4-Person Households | 97 (7.2%) | 0 (0.0%) |
| 5-Person Households | 0 (0.0%) | 0 (0.0%) |
| 6-Person Households | 10 (0.7%) | 0 (0.0%) |
| 7+ Person Households | 0 (0.0%) | 0 (0.0%) |
| Total | 652 (48.7%) | 688 (51.3%) |
Female Fertility in West Brattleboro
Fertility by Age in West Brattleboro
Average fertility rate in West Brattleboro is 119.0 births per 1,000 women. Women in the age bracket of 20 to 34 years have the highest fertility rate with 226.0 births per 1,000 women. Women in the age bracket of 20 to 34 years acount for 84.3% of all women with births.
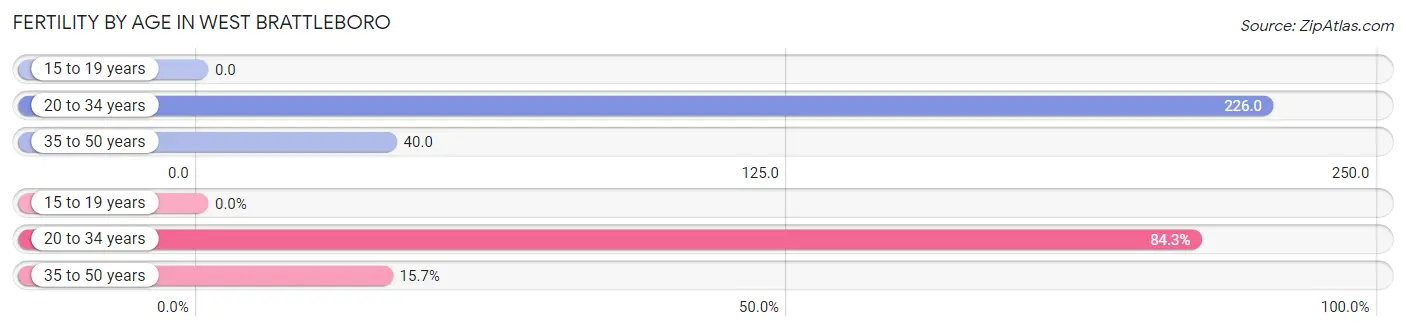
| Age Bracket | Women with Births | Births / 1,000 Women |
| 15 to 19 years | 0 (0.0%) | 0.0 |
| 20 to 34 years | 70 (84.3%) | 226.0 |
| 35 to 50 years | 13 (15.7%) | 40.0 |
| Total | 83 (100.0%) | 119.0 |
Fertility by Age by Marriage Status in West Brattleboro
36.1% of women with births (83) in West Brattleboro are married. The highest percentage of unmarried women with births falls into 20 to 34 years age bracket with 75.7% of them unmarried at the time of birth, while the lowest percentage of unmarried women with births belong to 35 to 50 years age bracket with 0.0% of them unmarried.
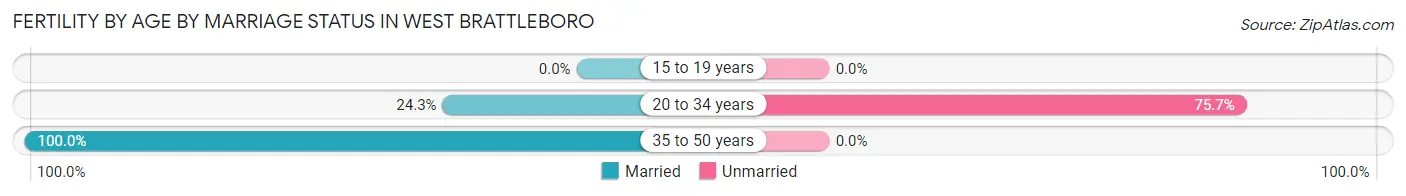
| Age Bracket | Married | Unmarried |
| 15 to 19 years | 0 (0.0%) | 0 (0.0%) |
| 20 to 34 years | 17 (24.3%) | 53 (75.7%) |
| 35 to 50 years | 13 (100.0%) | 0 (0.0%) |
| Total | 30 (36.1%) | 53 (63.9%) |
Fertility by Education in West Brattleboro
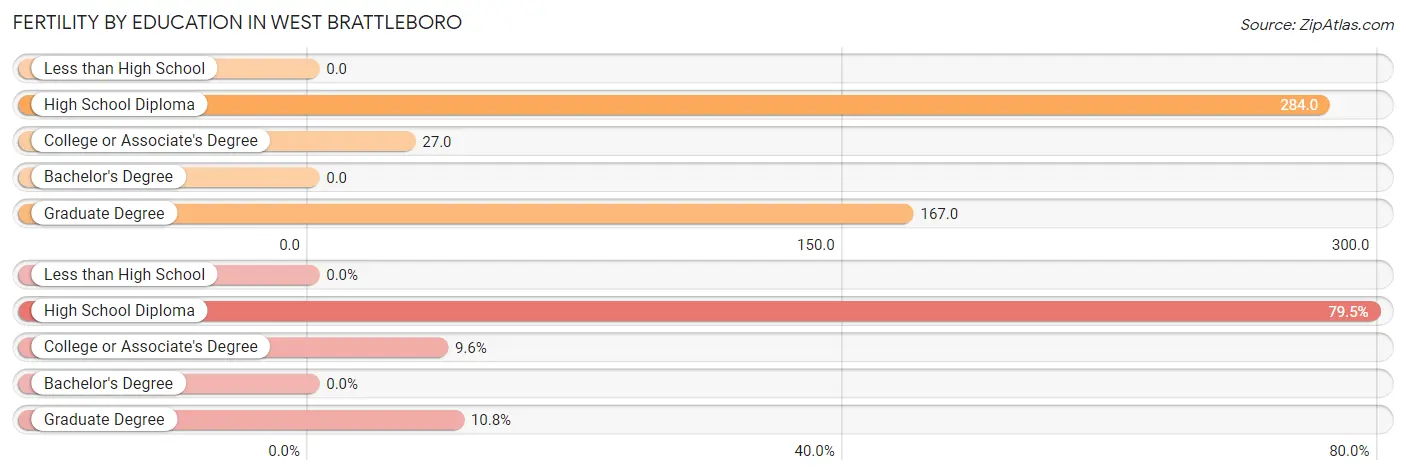
| Educational Attainment | Women with Births | Births / 1,000 Women |
| Less than High School | 0 (0.0%) | 0.0 |
| High School Diploma | 66 (79.5%) | 284.0 |
| College or Associate's Degree | 8 (9.6%) | 27.0 |
| Bachelor's Degree | 0 (0.0%) | 0.0 |
| Graduate Degree | 9 (10.8%) | 167.0 |
| Total | 83 (100.0%) | 119.0 |
Fertility by Education by Marriage Status in West Brattleboro
63.9% of women with births in West Brattleboro are unmarried. Women with the educational attainment of college or associate's degree are most likely to be married with 100.0% of them married at childbirth, while women with the educational attainment of high school diploma are least likely to be married with 80.3% of them unmarried at childbirth.
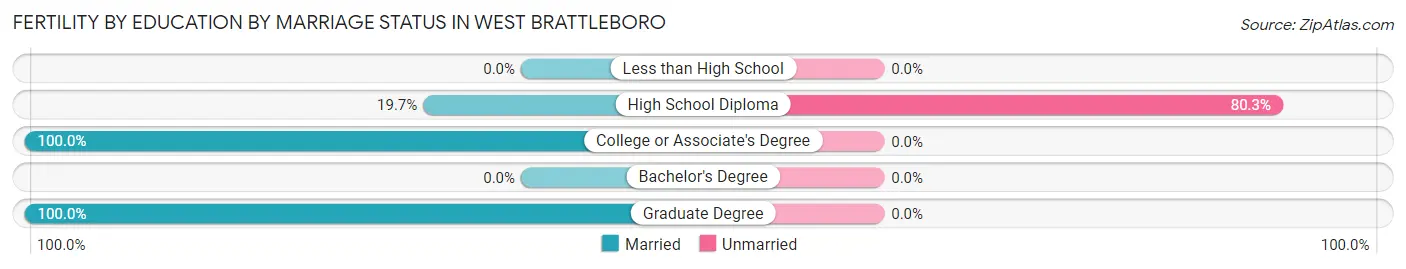
| Educational Attainment | Married | Unmarried |
| Less than High School | 0 (0.0%) | 0 (0.0%) |
| High School Diploma | 13 (19.7%) | 53 (80.3%) |
| College or Associate's Degree | 8 (100.0%) | 0 (0.0%) |
| Bachelor's Degree | 0 (0.0%) | 0 (0.0%) |
| Graduate Degree | 9 (100.0%) | 0 (0.0%) |
| Total | 30 (36.1%) | 53 (63.9%) |
Employment Characteristics in West Brattleboro
Employment by Class of Employer in West Brattleboro
Among the 1,397 employed individuals in West Brattleboro, private company employees (1,061 | 75.9%), not-for-profit organizations (213 | 15.2%), and self-employed (not incorporated) (95 | 6.8%) make up the most common classes of employment.
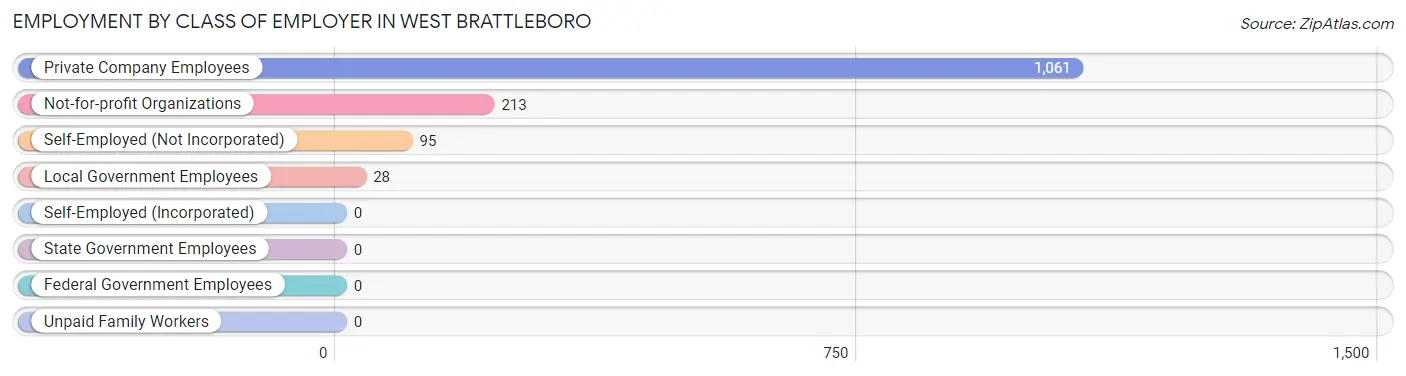
| Employer Class | # Employees | % Employees |
| Private Company Employees | 1,061 | 75.9% |
| Self-Employed (Incorporated) | 0 | 0.0% |
| Self-Employed (Not Incorporated) | 95 | 6.8% |
| Not-for-profit Organizations | 213 | 15.2% |
| Local Government Employees | 28 | 2.0% |
| State Government Employees | 0 | 0.0% |
| Federal Government Employees | 0 | 0.0% |
| Unpaid Family Workers | 0 | 0.0% |
| Total | 1,397 | 100.0% |
Employment Status by Age in West Brattleboro
According to the labor force statistics for West Brattleboro, out of the total population over 16 years of age (2,233), 68.1% or 1,521 individuals are in the labor force, with 4.9% or 75 of them unemployed. The age group with the highest labor force participation rate is 30 to 34 years, with 100.0% or 159 individuals in the labor force. Within the labor force, the 55 to 59 years age range has the highest percentage of unemployed individuals, with 12.4% or 33 of them being unemployed.
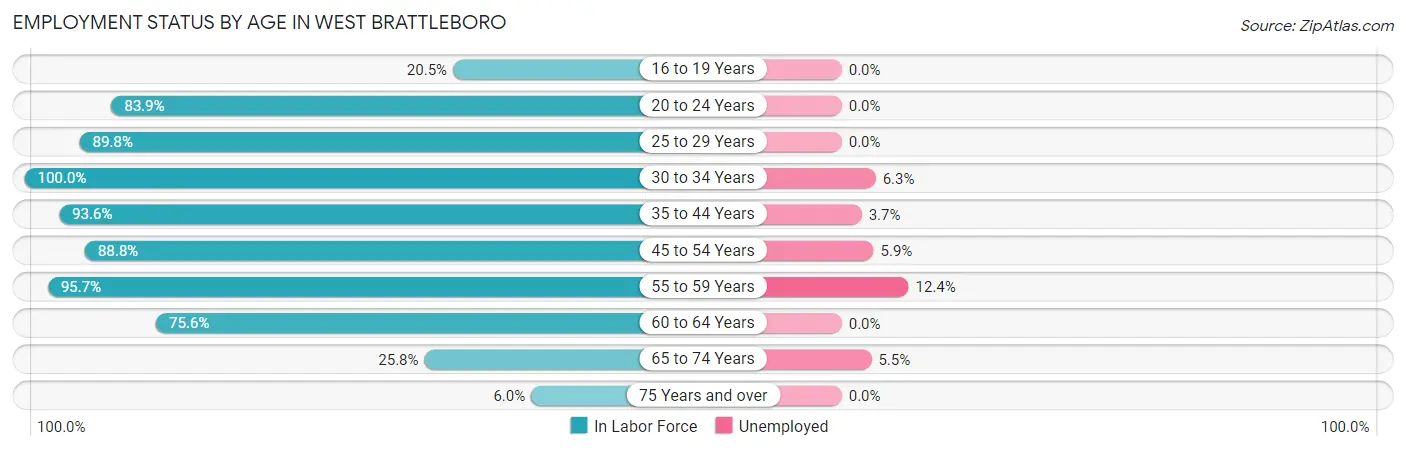
| Age Bracket | In Labor Force | Unemployed |
| 16 to 19 Years | 16 (20.5%) | 0 (0.0%) |
| 20 to 24 Years | 135 (83.9%) | 0 (0.0%) |
| 25 to 29 Years | 141 (89.8%) | 0 (0.0%) |
| 30 to 34 Years | 159 (100.0%) | 10 (6.3%) |
| 35 to 44 Years | 323 (93.6%) | 12 (3.7%) |
| 45 to 54 Years | 221 (88.8%) | 13 (5.9%) |
| 55 to 59 Years | 266 (95.7%) | 33 (12.4%) |
| 60 to 64 Years | 124 (75.6%) | 0 (0.0%) |
| 65 to 74 Years | 127 (25.8%) | 7 (5.5%) |
| 75 Years and over | 9 (6.0%) | 0 (0.0%) |
| Total | 1,521 (68.1%) | 75 (4.9%) |
Employment Status by Educational Attainment in West Brattleboro
According to labor force statistics for West Brattleboro, 91.3% of individuals (1,234) out of the total population between 25 and 64 years of age (1,352) are in the labor force, with 5.5% or 68 of them being unemployed. The group with the highest labor force participation rate are those with the educational attainment of bachelor's degree or higher, with 97.0% or 392 individuals in the labor force. Within the labor force, individuals with bachelor's degree or higher education have the highest percentage of unemployment, with 7.1% or 28 of them being unemployed.
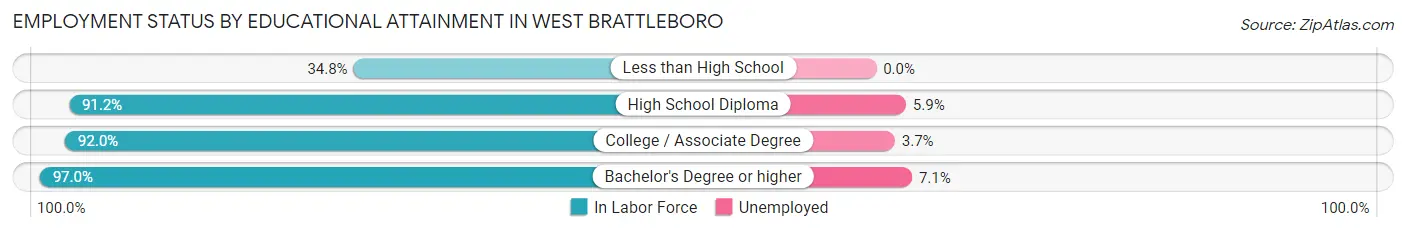
| Educational Attainment | In Labor Force | Unemployed |
| Less than High School | 16 (34.8%) | 0 (0.0%) |
| High School Diploma | 424 (91.2%) | 27 (5.9%) |
| College / Associate Degree | 402 (92.0%) | 16 (3.7%) |
| Bachelor's Degree or higher | 392 (97.0%) | 29 (7.1%) |
| Total | 1,234 (91.3%) | 74 (5.5%) |
Employment Occupations by Sex in West Brattleboro
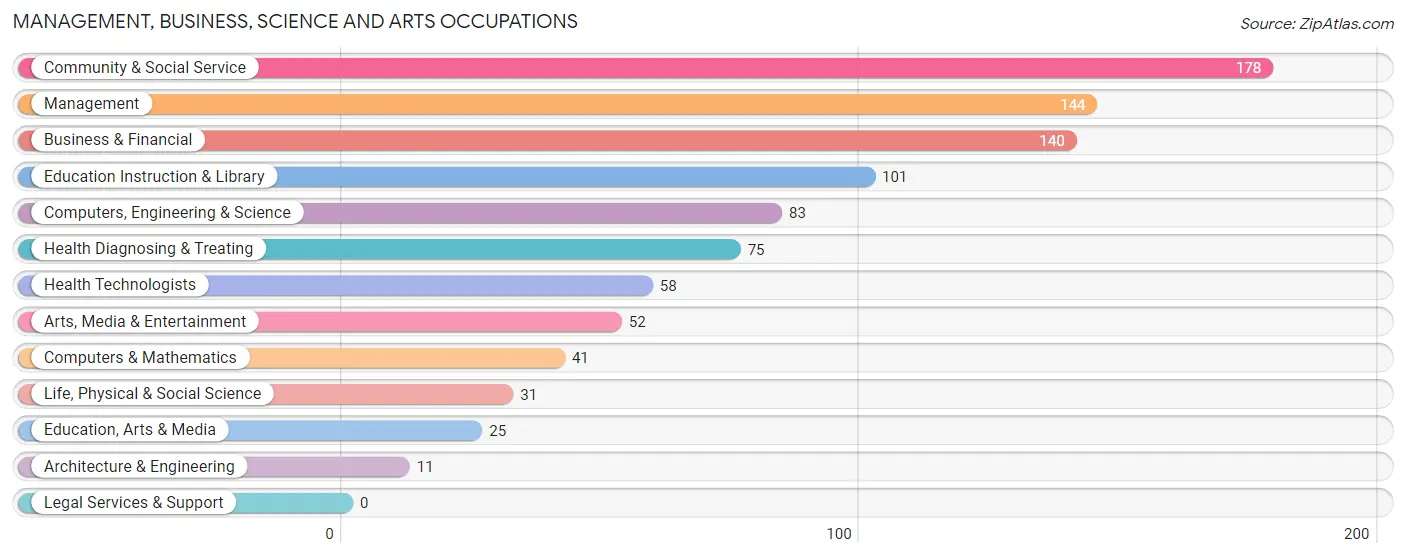
Management, Business, Science and Arts Occupations
The most common Management, Business, Science and Arts occupations in West Brattleboro are Community & Social Service (178 | 12.3%), Management (144 | 10.0%), Business & Financial (140 | 9.7%), Education Instruction & Library (101 | 7.0%), and Computers, Engineering & Science (83 | 5.7%).
Management, Business, Science and Arts Occupations by Sex
Within the Management, Business, Science and Arts occupations in West Brattleboro, the most male-oriented occupations are Architecture & Engineering (100.0%), Computers & Mathematics (75.6%), and Computers, Engineering & Science (72.3%), while the most female-oriented occupations are Education Instruction & Library (100.0%), Arts, Media & Entertainment (100.0%), and Health Diagnosing & Treating (100.0%).
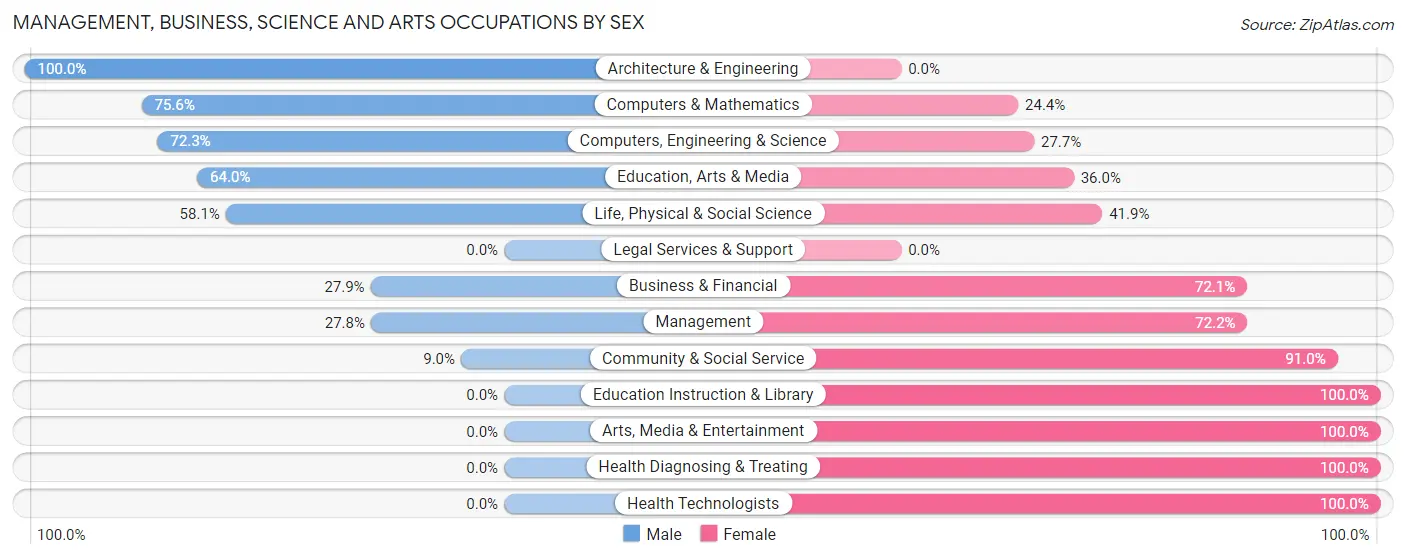
| Occupation | Male | Female |
| Management | 40 (27.8%) | 104 (72.2%) |
| Business & Financial | 39 (27.9%) | 101 (72.1%) |
| Computers, Engineering & Science | 60 (72.3%) | 23 (27.7%) |
| Computers & Mathematics | 31 (75.6%) | 10 (24.4%) |
| Architecture & Engineering | 11 (100.0%) | 0 (0.0%) |
| Life, Physical & Social Science | 18 (58.1%) | 13 (41.9%) |
| Community & Social Service | 16 (9.0%) | 162 (91.0%) |
| Education, Arts & Media | 16 (64.0%) | 9 (36.0%) |
| Legal Services & Support | 0 (0.0%) | 0 (0.0%) |
| Education Instruction & Library | 0 (0.0%) | 101 (100.0%) |
| Arts, Media & Entertainment | 0 (0.0%) | 52 (100.0%) |
| Health Diagnosing & Treating | 0 (0.0%) | 75 (100.0%) |
| Health Technologists | 0 (0.0%) | 58 (100.0%) |
| Total (Category) | 155 (25.0%) | 465 (75.0%) |
| Total (Overall) | 583 (40.3%) | 863 (59.7%) |
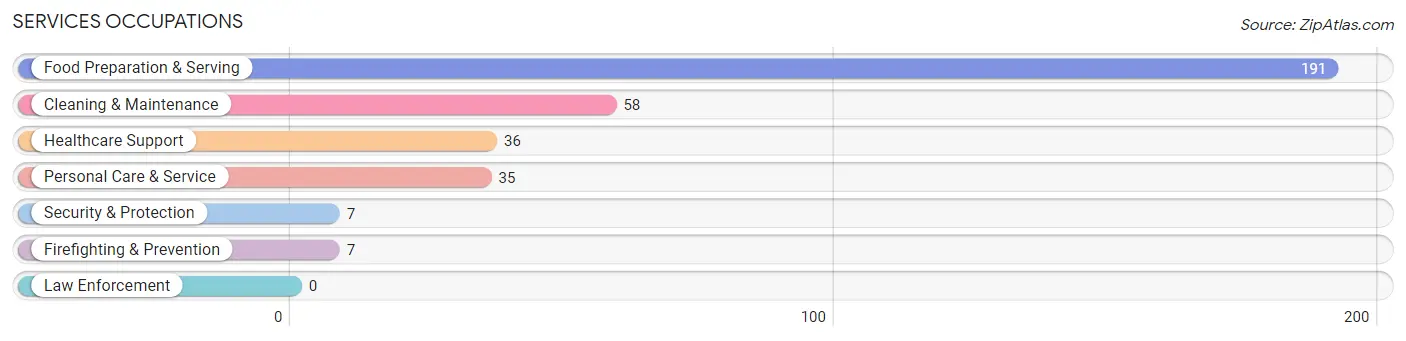
Services Occupations
The most common Services occupations in West Brattleboro are Food Preparation & Serving (191 | 13.2%), Cleaning & Maintenance (58 | 4.0%), Healthcare Support (36 | 2.5%), Personal Care & Service (35 | 2.4%), and Security & Protection (7 | 0.5%).
Services Occupations by Sex
Within the Services occupations in West Brattleboro, the most male-oriented occupations are Security & Protection (100.0%), Firefighting & Prevention (100.0%), and Cleaning & Maintenance (55.2%), while the most female-oriented occupations are Healthcare Support (100.0%), Personal Care & Service (77.1%), and Food Preparation & Serving (52.4%).
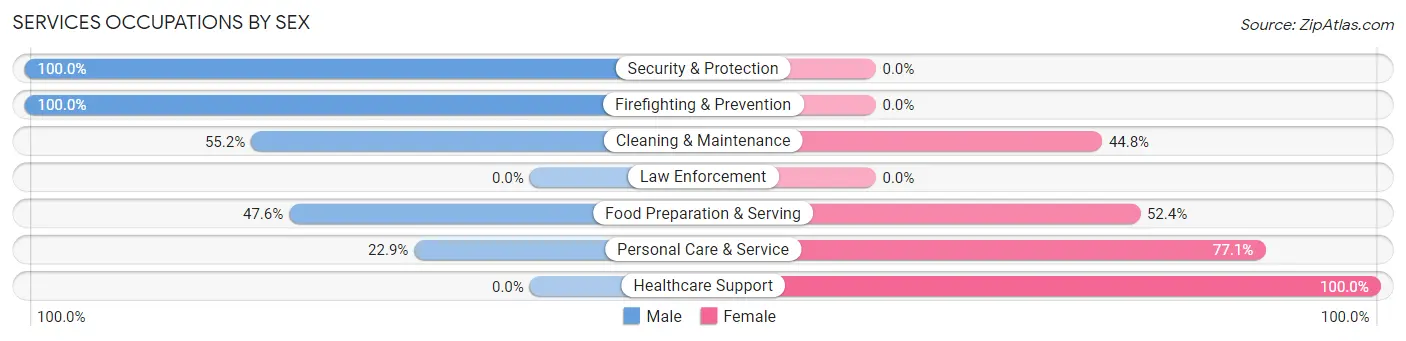
| Occupation | Male | Female |
| Healthcare Support | 0 (0.0%) | 36 (100.0%) |
| Security & Protection | 7 (100.0%) | 0 (0.0%) |
| Firefighting & Prevention | 7 (100.0%) | 0 (0.0%) |
| Law Enforcement | 0 (0.0%) | 0 (0.0%) |
| Food Preparation & Serving | 91 (47.6%) | 100 (52.4%) |
| Cleaning & Maintenance | 32 (55.2%) | 26 (44.8%) |
| Personal Care & Service | 8 (22.9%) | 27 (77.1%) |
| Total (Category) | 138 (42.2%) | 189 (57.8%) |
| Total (Overall) | 583 (40.3%) | 863 (59.7%) |
Sales and Office Occupations
The most common Sales and Office occupations in West Brattleboro are Office & Administration (104 | 7.2%), and Sales & Related (90 | 6.2%).
Sales and Office Occupations by Sex
| Occupation | Male | Female |
| Sales & Related | 21 (23.3%) | 69 (76.7%) |
| Office & Administration | 40 (38.5%) | 64 (61.5%) |
| Total (Category) | 61 (31.4%) | 133 (68.6%) |
| Total (Overall) | 583 (40.3%) | 863 (59.7%) |
Natural Resources, Construction and Maintenance Occupations
The most common Natural Resources, Construction and Maintenance occupations in West Brattleboro are Construction & Extraction (41 | 2.8%), Farming, Fishing & Forestry (13 | 0.9%), and Installation, Maintenance & Repair (11 | 0.8%).
Natural Resources, Construction and Maintenance Occupations by Sex
| Occupation | Male | Female |
| Farming, Fishing & Forestry | 0 (0.0%) | 13 (100.0%) |
| Construction & Extraction | 41 (100.0%) | 0 (0.0%) |
| Installation, Maintenance & Repair | 11 (100.0%) | 0 (0.0%) |
| Total (Category) | 52 (80.0%) | 13 (20.0%) |
| Total (Overall) | 583 (40.3%) | 863 (59.7%) |
Production, Transportation and Moving Occupations
The most common Production, Transportation and Moving occupations in West Brattleboro are Material Moving (117 | 8.1%), Production (88 | 6.1%), and Transportation (35 | 2.4%).
Production, Transportation and Moving Occupations by Sex
| Occupation | Male | Female |
| Production | 25 (28.4%) | 63 (71.6%) |
| Transportation | 35 (100.0%) | 0 (0.0%) |
| Material Moving | 117 (100.0%) | 0 (0.0%) |
| Total (Category) | 177 (73.8%) | 63 (26.3%) |
| Total (Overall) | 583 (40.3%) | 863 (59.7%) |
Employment Industries by Sex in West Brattleboro
Employment Industries in West Brattleboro
The major employment industries in West Brattleboro include Retail Trade (261 | 18.0%), Health Care & Social Assistance (183 | 12.7%), Educational Services (169 | 11.7%), Accommodation & Food Services (169 | 11.7%), and Real Estate, Rental & Leasing (123 | 8.5%).
Employment Industries by Sex in West Brattleboro
The West Brattleboro industries that see more men than women are Construction (100.0%), Administrative & Support (100.0%), and Public Administration (100.0%), whereas the industries that tend to have a higher number of women are Agriculture, Fishing & Hunting (100.0%), Health Care & Social Assistance (90.7%), and Educational Services (87.6%).
| Industry | Male | Female |
| Agriculture, Fishing & Hunting | 0 (0.0%) | 13 (100.0%) |
| Mining, Quarrying, & Extraction | 0 (0.0%) | 0 (0.0%) |
| Construction | 60 (100.0%) | 0 (0.0%) |
| Manufacturing | 60 (57.1%) | 45 (42.9%) |
| Wholesale Trade | 37 (80.4%) | 9 (19.6%) |
| Retail Trade | 96 (36.8%) | 165 (63.2%) |
| Transportation & Warehousing | 11 (29.7%) | 26 (70.3%) |
| Utilities | 0 (0.0%) | 0 (0.0%) |
| Information | 11 (45.8%) | 13 (54.2%) |
| Finance & Insurance | 16 (22.9%) | 54 (77.1%) |
| Real Estate, Rental & Leasing | 107 (87.0%) | 16 (13.0%) |
| Professional & Scientific | 65 (63.7%) | 37 (36.3%) |
| Enterprise Management | 0 (0.0%) | 0 (0.0%) |
| Administrative & Support | 16 (100.0%) | 0 (0.0%) |
| Educational Services | 21 (12.4%) | 148 (87.6%) |
| Health Care & Social Assistance | 17 (9.3%) | 166 (90.7%) |
| Arts, Entertainment & Recreation | 0 (0.0%) | 0 (0.0%) |
| Accommodation & Food Services | 59 (34.9%) | 110 (65.1%) |
| Public Administration | 7 (100.0%) | 0 (0.0%) |
| Total | 583 (40.3%) | 863 (59.7%) |
Education in West Brattleboro
School Enrollment in West Brattleboro
The most common levels of schooling among the 543 students in West Brattleboro are elementary school (204 | 37.6%), college / undergraduate (136 | 25.1%), and middle school (129 | 23.8%).
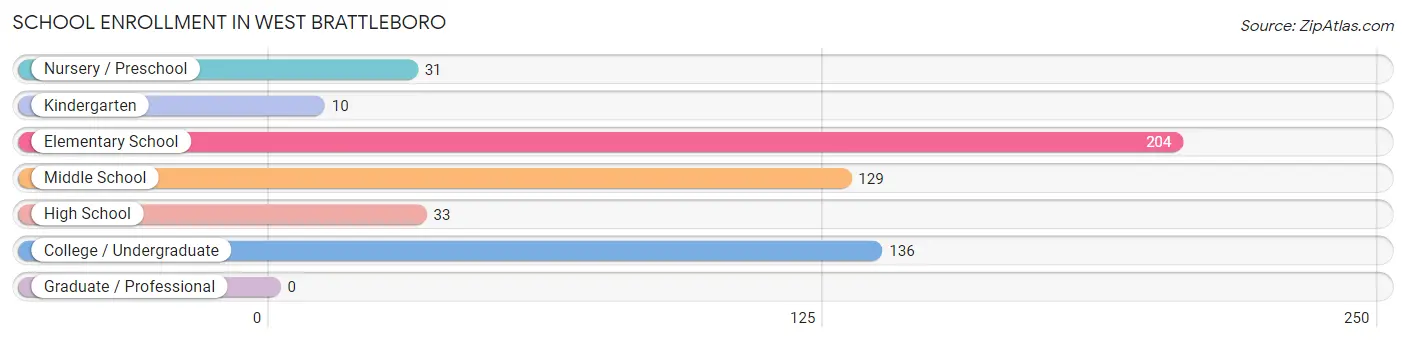
| School Level | # Students | % Students |
| Nursery / Preschool | 31 | 5.7% |
| Kindergarten | 10 | 1.8% |
| Elementary School | 204 | 37.6% |
| Middle School | 129 | 23.8% |
| High School | 33 | 6.1% |
| College / Undergraduate | 136 | 25.1% |
| Graduate / Professional | 0 | 0.0% |
| Total | 543 | 100.0% |
School Enrollment by Age by Funding Source in West Brattleboro
Out of a total of 543 students who are enrolled in schools in West Brattleboro, 134 (24.7%) attend a private institution, while the remaining 409 (75.3%) are enrolled in public schools. The age group of 3 to 4 year olds has the highest likelihood of being enrolled in private schools, with 31 (100.0% in the age bracket) enrolled. Conversely, the age group of 10 to 14 year olds has the lowest likelihood of being enrolled in a private school, with 129 (100.0% in the age bracket) attending a public institution.
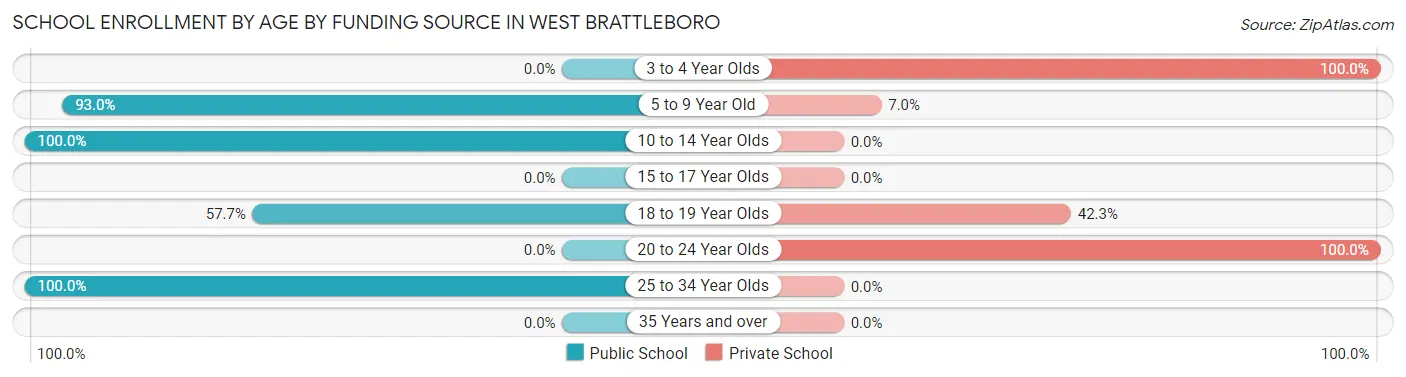
| Age Bracket | Public School | Private School |
| 3 to 4 Year Olds | 0 (0.0%) | 31 (100.0%) |
| 5 to 9 Year Old | 199 (93.0%) | 15 (7.0%) |
| 10 to 14 Year Olds | 129 (100.0%) | 0 (0.0%) |
| 15 to 17 Year Olds | 0 (0.0%) | 0 (0.0%) |
| 18 to 19 Year Olds | 45 (57.7%) | 33 (42.3%) |
| 20 to 24 Year Olds | 0 (0.0%) | 55 (100.0%) |
| 25 to 34 Year Olds | 36 (100.0%) | 0 (0.0%) |
| 35 Years and over | 0 (0.0%) | 0 (0.0%) |
| Total | 409 (75.3%) | 134 (24.7%) |
Educational Attainment by Field of Study in West Brattleboro
Visual & performing arts (120 | 19.0%), bio, nature & agricultural (119 | 18.8%), business (70 | 11.1%), education (52 | 8.2%), and literature & languages (51 | 8.1%) are the most common fields of study among 632 individuals in West Brattleboro who have obtained a bachelor's degree or higher.
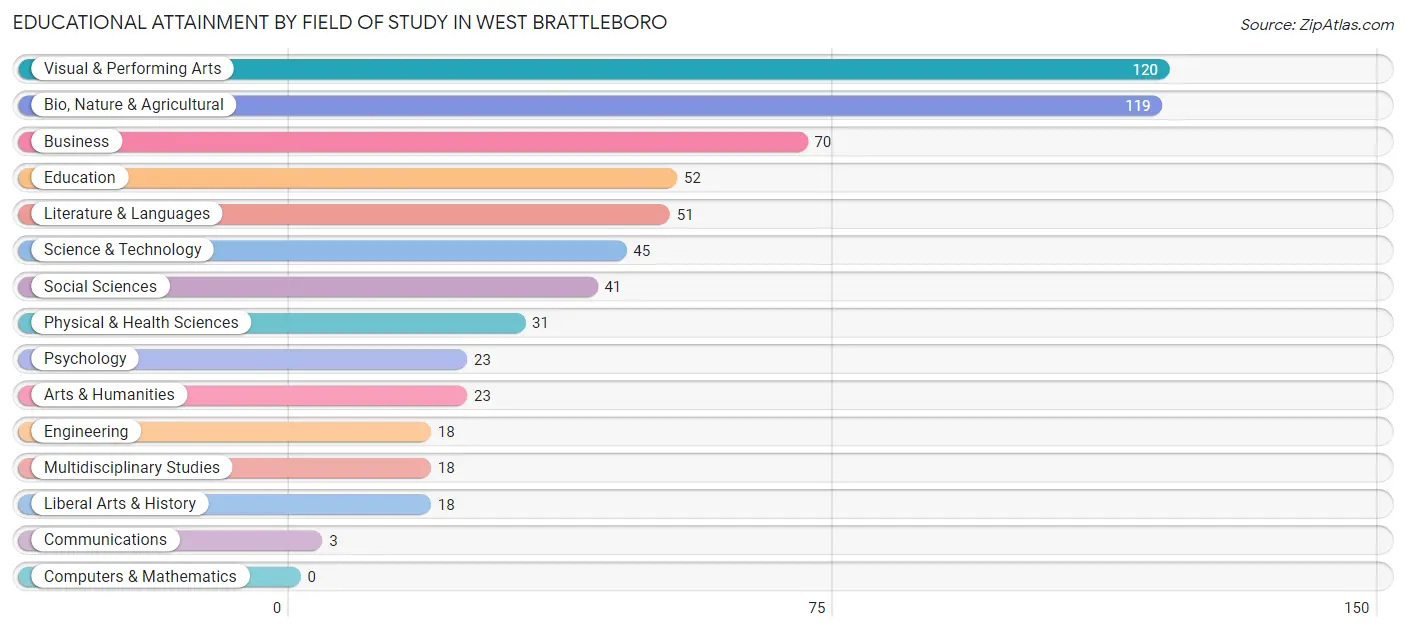
| Field of Study | # Graduates | % Graduates |
| Computers & Mathematics | 0 | 0.0% |
| Bio, Nature & Agricultural | 119 | 18.8% |
| Physical & Health Sciences | 31 | 4.9% |
| Psychology | 23 | 3.6% |
| Social Sciences | 41 | 6.5% |
| Engineering | 18 | 2.9% |
| Multidisciplinary Studies | 18 | 2.9% |
| Science & Technology | 45 | 7.1% |
| Business | 70 | 11.1% |
| Education | 52 | 8.2% |
| Literature & Languages | 51 | 8.1% |
| Liberal Arts & History | 18 | 2.9% |
| Visual & Performing Arts | 120 | 19.0% |
| Communications | 3 | 0.5% |
| Arts & Humanities | 23 | 3.6% |
| Total | 632 | 100.0% |
Transportation & Commute in West Brattleboro
Vehicle Availability by Sex in West Brattleboro
The most prevalent vehicle ownership categories in West Brattleboro are males with 2 vehicles (317, accounting for 56.2%) and females with 2 vehicles (325, making up 38.1%).
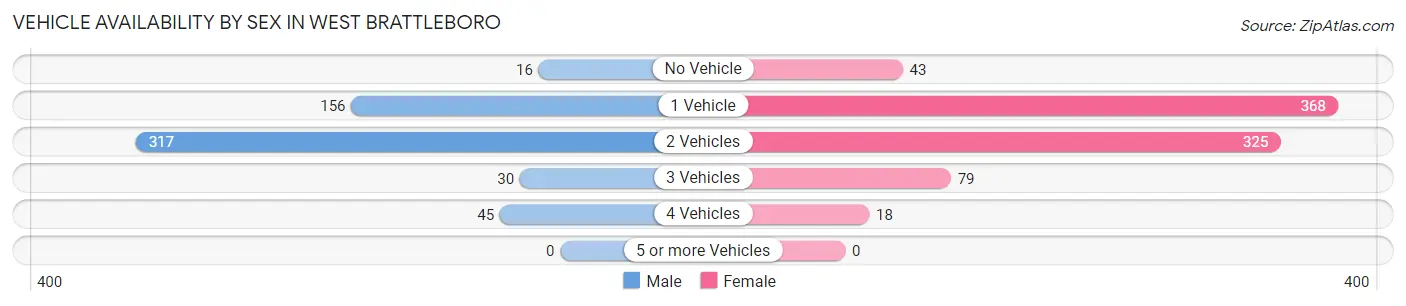
| Vehicles Available | Male | Female |
| No Vehicle | 16 (2.8%) | 43 (5.2%) |
| 1 Vehicle | 156 (27.7%) | 368 (44.2%) |
| 2 Vehicles | 317 (56.2%) | 325 (39.0%) |
| 3 Vehicles | 30 (5.3%) | 79 (9.5%) |
| 4 Vehicles | 45 (8.0%) | 18 (2.2%) |
| 5 or more Vehicles | 0 (0.0%) | 0 (0.0%) |
| Total | 564 (100.0%) | 833 (100.0%) |
Commute Time in West Brattleboro
The most frequently occuring commute durations in West Brattleboro are 5 to 9 minutes (412 commuters, 33.9%), 10 to 14 minutes (302 commuters, 24.8%), and 20 to 24 minutes (111 commuters, 9.1%).
| Commute Time | # Commuters | % Commuters |
| Less than 5 Minutes | 18 | 1.5% |
| 5 to 9 Minutes | 412 | 33.9% |
| 10 to 14 Minutes | 302 | 24.8% |
| 15 to 19 Minutes | 81 | 6.7% |
| 20 to 24 Minutes | 111 | 9.1% |
| 25 to 29 Minutes | 60 | 4.9% |
| 30 to 34 Minutes | 64 | 5.3% |
| 35 to 39 Minutes | 71 | 5.8% |
| 40 to 44 Minutes | 16 | 1.3% |
| 45 to 59 Minutes | 0 | 0.0% |
| 60 to 89 Minutes | 31 | 2.5% |
| 90 or more Minutes | 50 | 4.1% |
Commute Time by Sex in West Brattleboro
The most common commute times in West Brattleboro are 5 to 9 minutes (145 commuters, 32.5%) for males and 5 to 9 minutes (267 commuters, 34.7%) for females.
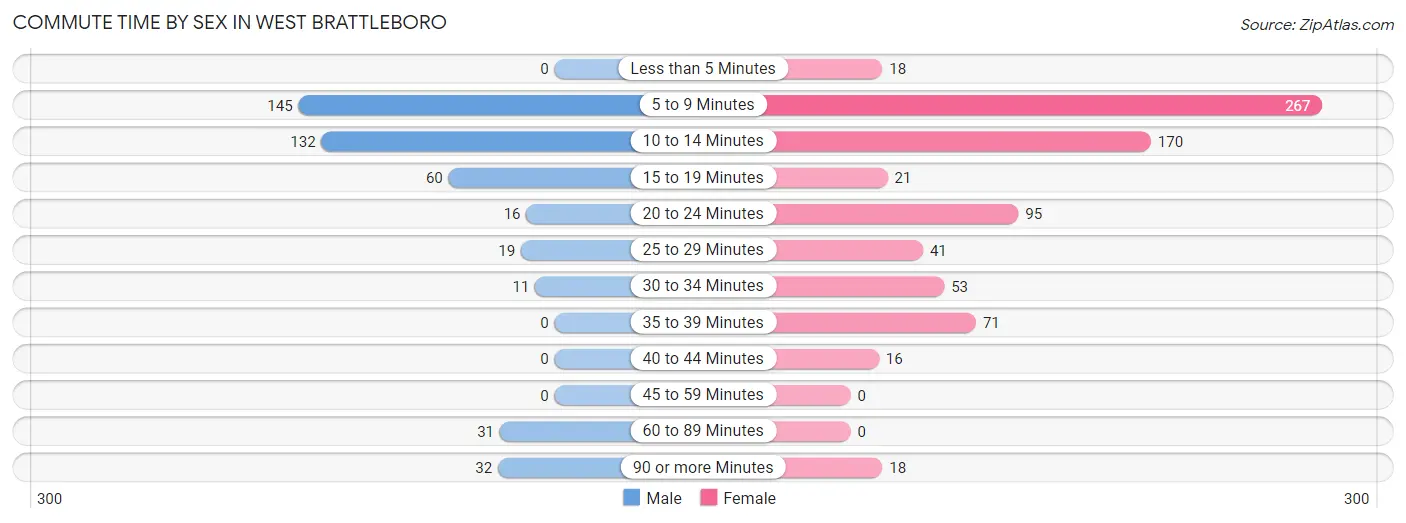
| Commute Time | Male | Female |
| Less than 5 Minutes | 0 (0.0%) | 18 (2.3%) |
| 5 to 9 Minutes | 145 (32.5%) | 267 (34.7%) |
| 10 to 14 Minutes | 132 (29.6%) | 170 (22.1%) |
| 15 to 19 Minutes | 60 (13.5%) | 21 (2.7%) |
| 20 to 24 Minutes | 16 (3.6%) | 95 (12.3%) |
| 25 to 29 Minutes | 19 (4.3%) | 41 (5.3%) |
| 30 to 34 Minutes | 11 (2.5%) | 53 (6.9%) |
| 35 to 39 Minutes | 0 (0.0%) | 71 (9.2%) |
| 40 to 44 Minutes | 0 (0.0%) | 16 (2.1%) |
| 45 to 59 Minutes | 0 (0.0%) | 0 (0.0%) |
| 60 to 89 Minutes | 31 (7.0%) | 0 (0.0%) |
| 90 or more Minutes | 32 (7.2%) | 18 (2.3%) |
Time of Departure to Work by Sex in West Brattleboro
The most frequent times of departure to work in West Brattleboro are 8:00 AM to 8:29 AM (103, 23.1%) for males and 7:30 AM to 7:59 AM (170, 22.1%) for females.
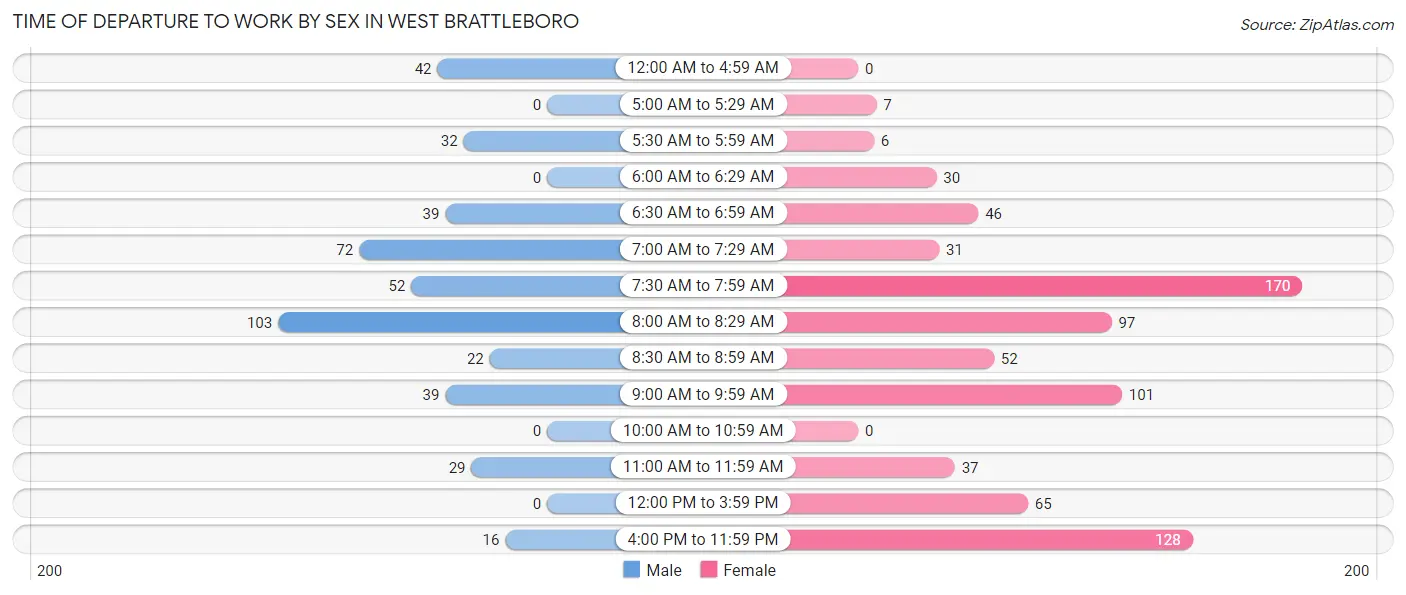
| Time of Departure | Male | Female |
| 12:00 AM to 4:59 AM | 42 (9.4%) | 0 (0.0%) |
| 5:00 AM to 5:29 AM | 0 (0.0%) | 7 (0.9%) |
| 5:30 AM to 5:59 AM | 32 (7.2%) | 6 (0.8%) |
| 6:00 AM to 6:29 AM | 0 (0.0%) | 30 (3.9%) |
| 6:30 AM to 6:59 AM | 39 (8.7%) | 46 (6.0%) |
| 7:00 AM to 7:29 AM | 72 (16.1%) | 31 (4.0%) |
| 7:30 AM to 7:59 AM | 52 (11.7%) | 170 (22.1%) |
| 8:00 AM to 8:29 AM | 103 (23.1%) | 97 (12.6%) |
| 8:30 AM to 8:59 AM | 22 (4.9%) | 52 (6.8%) |
| 9:00 AM to 9:59 AM | 39 (8.7%) | 101 (13.1%) |
| 10:00 AM to 10:59 AM | 0 (0.0%) | 0 (0.0%) |
| 11:00 AM to 11:59 AM | 29 (6.5%) | 37 (4.8%) |
| 12:00 PM to 3:59 PM | 0 (0.0%) | 65 (8.4%) |
| 4:00 PM to 11:59 PM | 16 (3.6%) | 128 (16.6%) |
| Total | 446 (100.0%) | 770 (100.0%) |
Housing Occupancy in West Brattleboro
Occupancy by Ownership in West Brattleboro
Of the total 1,340 dwellings in West Brattleboro, owner-occupied units account for 726 (54.2%), while renter-occupied units make up 614 (45.8%).
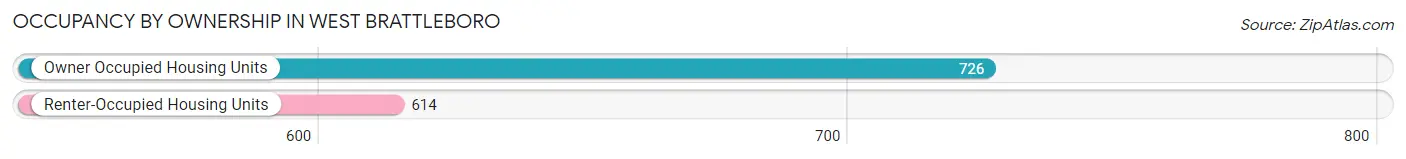
| Occupancy | # Housing Units | % Housing Units |
| Owner Occupied Housing Units | 726 | 54.2% |
| Renter-Occupied Housing Units | 614 | 45.8% |
| Total Occupied Housing Units | 1,340 | 100.0% |
Occupancy by Household Size in West Brattleboro
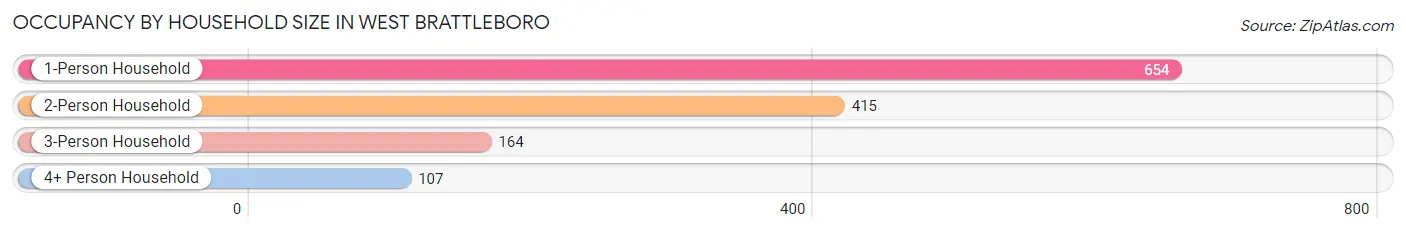
| Household Size | # Housing Units | % Housing Units |
| 1-Person Household | 654 | 48.8% |
| 2-Person Household | 415 | 31.0% |
| 3-Person Household | 164 | 12.2% |
| 4+ Person Household | 107 | 8.0% |
| Total Housing Units | 1,340 | 100.0% |
Occupancy by Ownership by Household Size in West Brattleboro
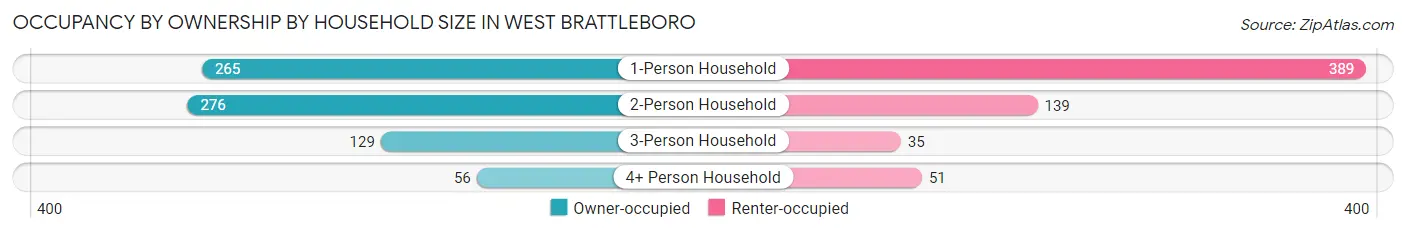
| Household Size | Owner-occupied | Renter-occupied |
| 1-Person Household | 265 (40.5%) | 389 (59.5%) |
| 2-Person Household | 276 (66.5%) | 139 (33.5%) |
| 3-Person Household | 129 (78.7%) | 35 (21.3%) |
| 4+ Person Household | 56 (52.3%) | 51 (47.7%) |
| Total Housing Units | 726 (54.2%) | 614 (45.8%) |
Occupancy by Educational Attainment in West Brattleboro
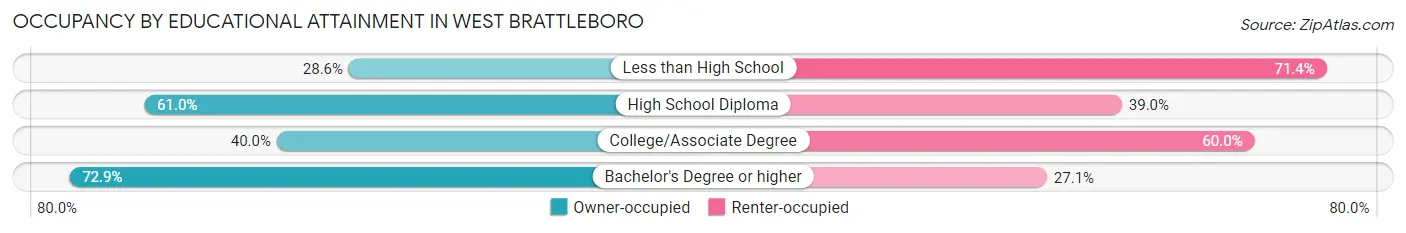
| Household Size | Owner-occupied | Renter-occupied |
| Less than High School | 16 (28.6%) | 40 (71.4%) |
| High School Diploma | 249 (61.0%) | 159 (39.0%) |
| College/Associate Degree | 216 (40.0%) | 324 (60.0%) |
| Bachelor's Degree or higher | 245 (72.9%) | 91 (27.1%) |
Occupancy by Age of Householder in West Brattleboro
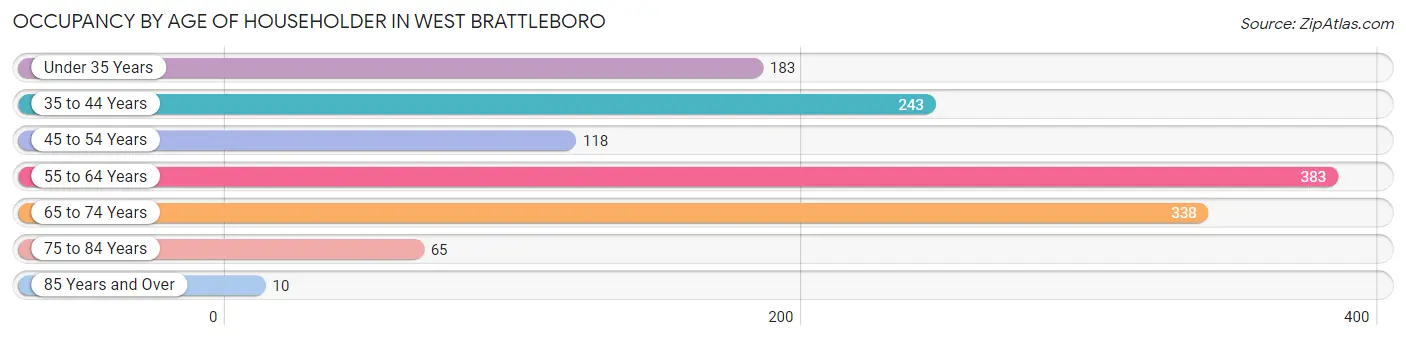
| Age Bracket | # Households | % Households |
| Under 35 Years | 183 | 13.7% |
| 35 to 44 Years | 243 | 18.1% |
| 45 to 54 Years | 118 | 8.8% |
| 55 to 64 Years | 383 | 28.6% |
| 65 to 74 Years | 338 | 25.2% |
| 75 to 84 Years | 65 | 4.9% |
| 85 Years and Over | 10 | 0.7% |
| Total | 1,340 | 100.0% |
Housing Finances in West Brattleboro
Median Income by Occupancy in West Brattleboro
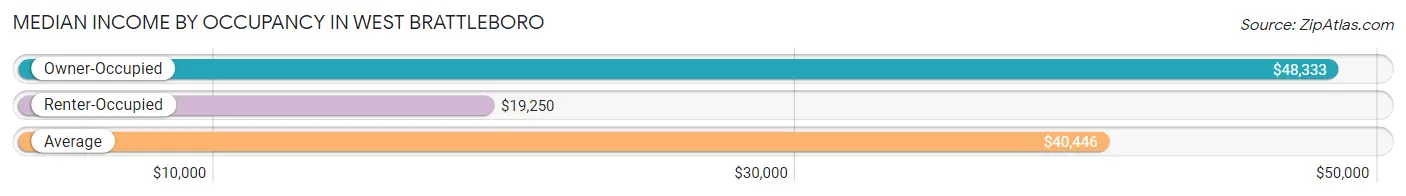
| Occupancy Type | # Households | Median Income |
| Owner-Occupied | 726 (54.2%) | $48,333 |
| Renter-Occupied | 614 (45.8%) | $19,250 |
| Average | 1,340 (100.0%) | $40,446 |
Occupancy by Householder Income Bracket in West Brattleboro
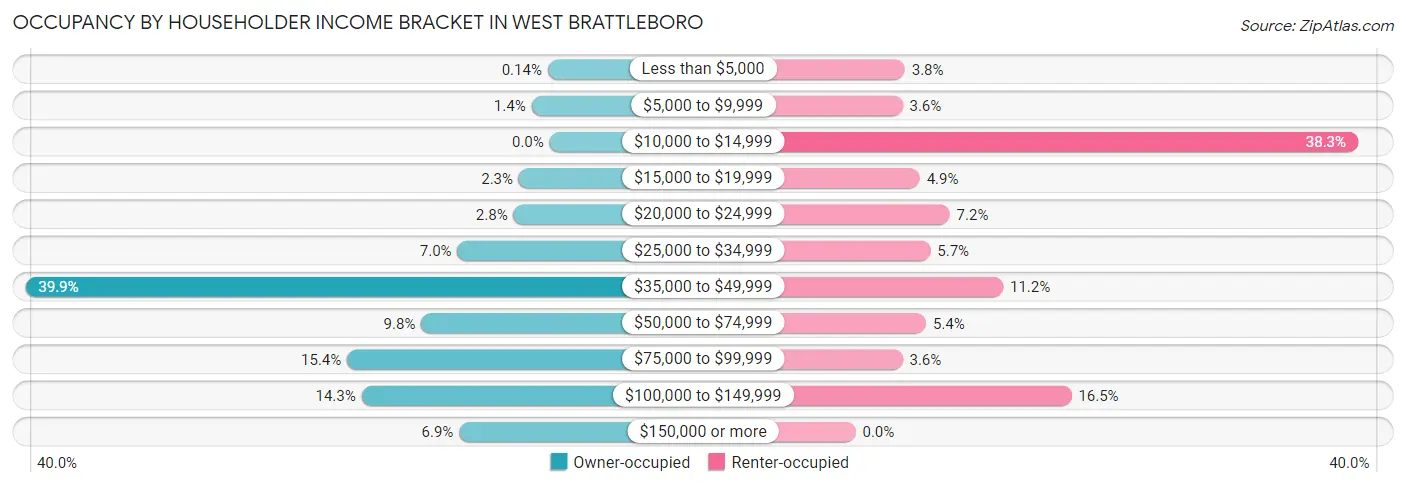
| Income Bracket | Owner-occupied | Renter-occupied |
| Less than $5,000 | 1 (0.1%) | 23 (3.7%) |
| $5,000 to $9,999 | 10 (1.4%) | 22 (3.6%) |
| $10,000 to $14,999 | 0 (0.0%) | 235 (38.3%) |
| $15,000 to $19,999 | 17 (2.3%) | 30 (4.9%) |
| $20,000 to $24,999 | 20 (2.8%) | 44 (7.2%) |
| $25,000 to $34,999 | 51 (7.0%) | 35 (5.7%) |
| $35,000 to $49,999 | 290 (39.9%) | 69 (11.2%) |
| $50,000 to $74,999 | 71 (9.8%) | 33 (5.4%) |
| $75,000 to $99,999 | 112 (15.4%) | 22 (3.6%) |
| $100,000 to $149,999 | 104 (14.3%) | 101 (16.5%) |
| $150,000 or more | 50 (6.9%) | 0 (0.0%) |
| Total | 726 (100.0%) | 614 (100.0%) |
Monthly Housing Cost Tiers in West Brattleboro
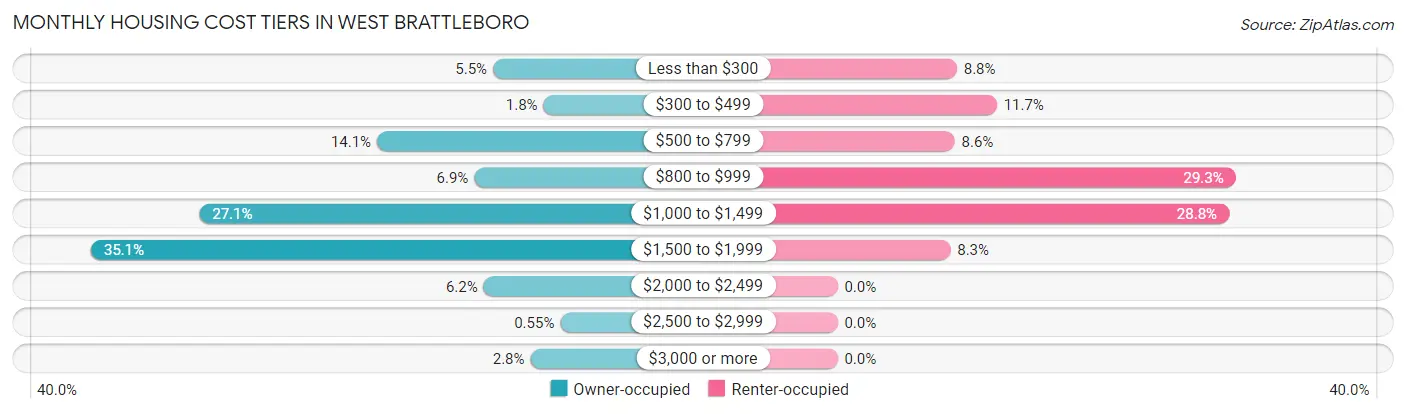
| Monthly Cost | Owner-occupied | Renter-occupied |
| Less than $300 | 40 (5.5%) | 54 (8.8%) |
| $300 to $499 | 13 (1.8%) | 72 (11.7%) |
| $500 to $799 | 102 (14.1%) | 53 (8.6%) |
| $800 to $999 | 50 (6.9%) | 180 (29.3%) |
| $1,000 to $1,499 | 197 (27.1%) | 177 (28.8%) |
| $1,500 to $1,999 | 255 (35.1%) | 51 (8.3%) |
| $2,000 to $2,499 | 45 (6.2%) | 0 (0.0%) |
| $2,500 to $2,999 | 4 (0.5%) | 0 (0.0%) |
| $3,000 or more | 20 (2.8%) | 0 (0.0%) |
| Total | 726 (100.0%) | 614 (100.0%) |
Physical Housing Characteristics in West Brattleboro
Housing Structures in West Brattleboro
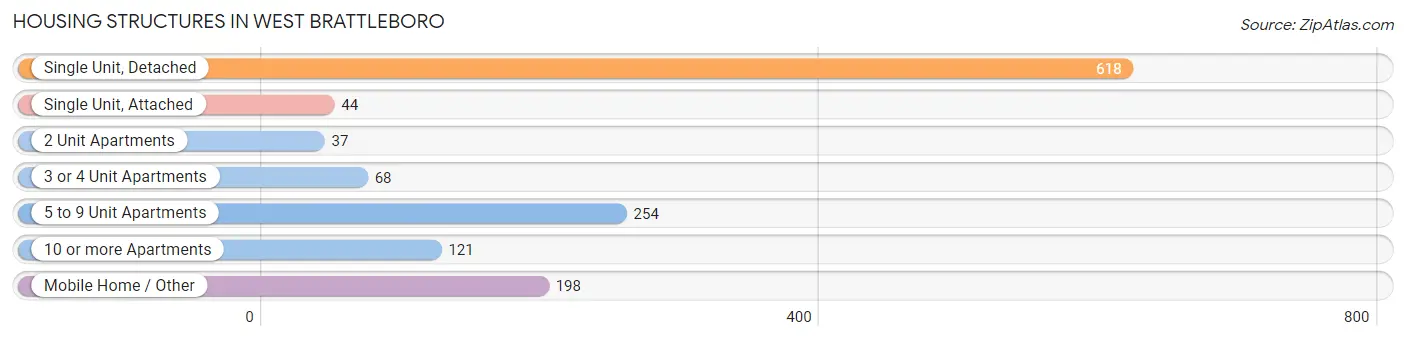
| Structure Type | # Housing Units | % Housing Units |
| Single Unit, Detached | 618 | 46.1% |
| Single Unit, Attached | 44 | 3.3% |
| 2 Unit Apartments | 37 | 2.8% |
| 3 or 4 Unit Apartments | 68 | 5.1% |
| 5 to 9 Unit Apartments | 254 | 19.0% |
| 10 or more Apartments | 121 | 9.0% |
| Mobile Home / Other | 198 | 14.8% |
| Total | 1,340 | 100.0% |
Housing Structures by Occupancy in West Brattleboro
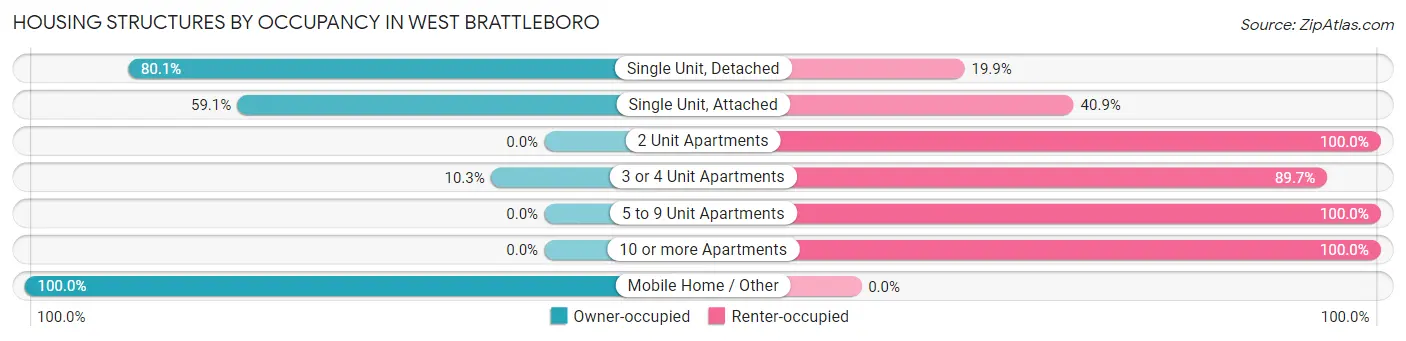
| Structure Type | Owner-occupied | Renter-occupied |
| Single Unit, Detached | 495 (80.1%) | 123 (19.9%) |
| Single Unit, Attached | 26 (59.1%) | 18 (40.9%) |
| 2 Unit Apartments | 0 (0.0%) | 37 (100.0%) |
| 3 or 4 Unit Apartments | 7 (10.3%) | 61 (89.7%) |
| 5 to 9 Unit Apartments | 0 (0.0%) | 254 (100.0%) |
| 10 or more Apartments | 0 (0.0%) | 121 (100.0%) |
| Mobile Home / Other | 198 (100.0%) | 0 (0.0%) |
| Total | 726 (54.2%) | 614 (45.8%) |
Housing Structures by Number of Rooms in West Brattleboro
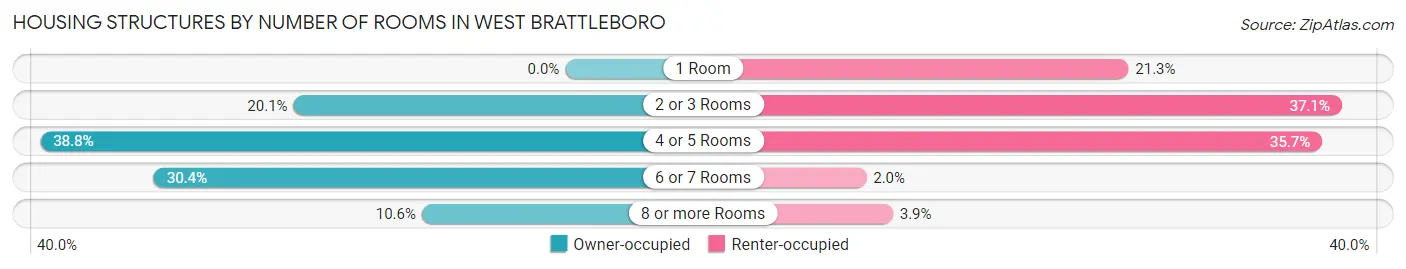
| Number of Rooms | Owner-occupied | Renter-occupied |
| 1 Room | 0 (0.0%) | 131 (21.3%) |
| 2 or 3 Rooms | 146 (20.1%) | 228 (37.1%) |
| 4 or 5 Rooms | 282 (38.8%) | 219 (35.7%) |
| 6 or 7 Rooms | 221 (30.4%) | 12 (1.9%) |
| 8 or more Rooms | 77 (10.6%) | 24 (3.9%) |
| Total | 726 (100.0%) | 614 (100.0%) |
Housing Structure by Heating Type in West Brattleboro
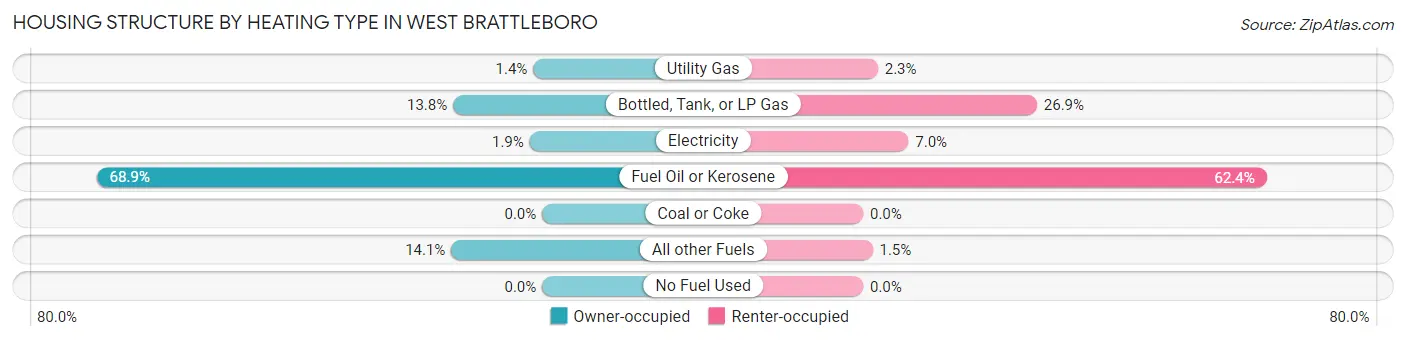
| Heating Type | Owner-occupied | Renter-occupied |
| Utility Gas | 10 (1.4%) | 14 (2.3%) |
| Bottled, Tank, or LP Gas | 100 (13.8%) | 165 (26.9%) |
| Electricity | 14 (1.9%) | 43 (7.0%) |
| Fuel Oil or Kerosene | 500 (68.9%) | 383 (62.4%) |
| Coal or Coke | 0 (0.0%) | 0 (0.0%) |
| All other Fuels | 102 (14.1%) | 9 (1.5%) |
| No Fuel Used | 0 (0.0%) | 0 (0.0%) |
| Total | 726 (100.0%) | 614 (100.0%) |
Household Vehicle Usage in West Brattleboro
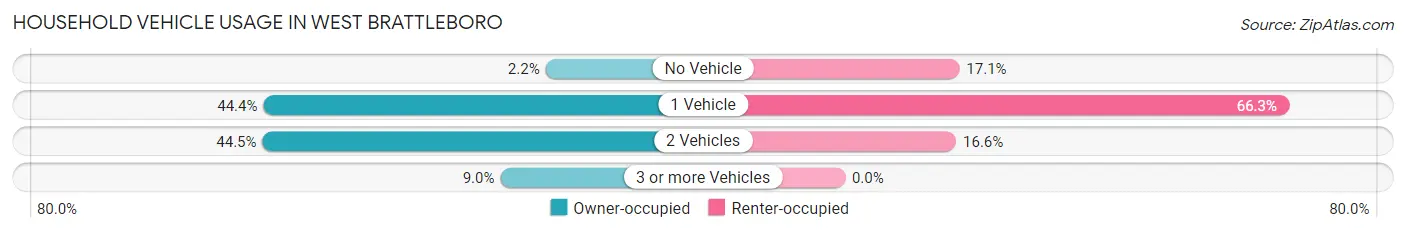
| Vehicles per Household | Owner-occupied | Renter-occupied |
| No Vehicle | 16 (2.2%) | 105 (17.1%) |
| 1 Vehicle | 322 (44.4%) | 407 (66.3%) |
| 2 Vehicles | 323 (44.5%) | 102 (16.6%) |
| 3 or more Vehicles | 65 (8.9%) | 0 (0.0%) |
| Total | 726 (100.0%) | 614 (100.0%) |
Real Estate & Mortgages in West Brattleboro
Real Estate and Mortgage Overview in West Brattleboro
| Characteristic | Without Mortgage | With Mortgage |
| Housing Units | 247 | 479 |
| Median Property Value | - | - |
| Median Household Income | $40,876 | $43 |
| Monthly Housing Costs | $613 | $20 |
| Real Estate Taxes | $1,194 | $0 |
Property Value by Mortgage Status in West Brattleboro
| Property Value | Without Mortgage | With Mortgage |
| Less than $50,000 | 76 (30.8%) | 53 (11.1%) |
| $50,000 to $99,999 | 88 (35.6%) | 27 (5.6%) |
| $100,000 to $299,999 | 76 (30.8%) | 346 (72.2%) |
| $300,000 to $499,999 | 7 (2.8%) | 53 (11.1%) |
| $500,000 to $749,999 | 0 (0.0%) | 0 (0.0%) |
| $750,000 to $999,999 | 0 (0.0%) | 0 (0.0%) |
| $1,000,000 or more | 0 (0.0%) | 0 (0.0%) |
| Total | 247 (100.0%) | 479 (100.0%) |
Household Income by Mortgage Status in West Brattleboro
| Household Income | Without Mortgage | With Mortgage |
| Less than $10,000 | 10 (4.1%) | 0 (0.0%) |
| $10,000 to $24,999 | 20 (8.1%) | 1 (0.2%) |
| $25,000 to $34,999 | 26 (10.5%) | 17 (3.5%) |
| $35,000 to $49,999 | 152 (61.5%) | 25 (5.2%) |
| $50,000 to $74,999 | 10 (4.1%) | 138 (28.8%) |
| $75,000 to $99,999 | 14 (5.7%) | 61 (12.7%) |
| $100,000 to $149,999 | 8 (3.2%) | 98 (20.5%) |
| $150,000 or more | 7 (2.8%) | 96 (20.0%) |
| Total | 247 (100.0%) | 479 (100.0%) |
Property Value to Household Income Ratio in West Brattleboro
| Value-to-Income Ratio | Without Mortgage | With Mortgage |
| Less than 2.0x | 154 (62.4%) | 69,826 (14,577.4%) |
| 2.0x to 2.9x | 22 (8.9%) | 161 (33.6%) |
| 3.0x to 3.9x | 27 (10.9%) | 68 (14.2%) |
| 4.0x or more | 44 (17.8%) | 43 (9.0%) |
| Total | 247 (100.0%) | 479 (100.0%) |
Real Estate Taxes by Mortgage Status in West Brattleboro
| Property Taxes | Without Mortgage | With Mortgage |
| Less than $800 | 57 (23.1%) | 1 (0.2%) |
| $800 to $1,499 | 97 (39.3%) | 7 (1.5%) |
| $800 to $1,499 | 83 (33.6%) | 46 (9.6%) |
| Total | 247 (100.0%) | 479 (100.0%) |
Health & Disability in West Brattleboro
Health Insurance Coverage by Age in West Brattleboro
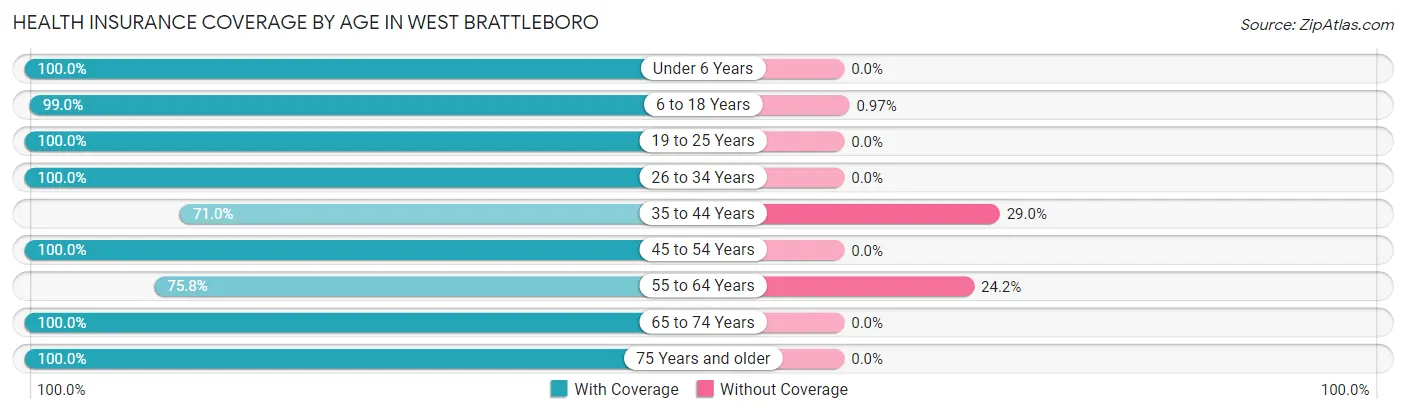
| Age Bracket | With Coverage | Without Coverage |
| Under 6 Years | 251 (100.0%) | 0 (0.0%) |
| 6 to 18 Years | 407 (99.0%) | 4 (1.0%) |
| 19 to 25 Years | 161 (100.0%) | 0 (0.0%) |
| 26 to 34 Years | 316 (100.0%) | 0 (0.0%) |
| 35 to 44 Years | 245 (71.0%) | 100 (29.0%) |
| 45 to 54 Years | 249 (100.0%) | 0 (0.0%) |
| 55 to 64 Years | 335 (75.8%) | 107 (24.2%) |
| 65 to 74 Years | 493 (100.0%) | 0 (0.0%) |
| 75 Years and older | 149 (100.0%) | 0 (0.0%) |
| Total | 2,606 (92.5%) | 211 (7.5%) |
Health Insurance Coverage by Citizenship Status in West Brattleboro
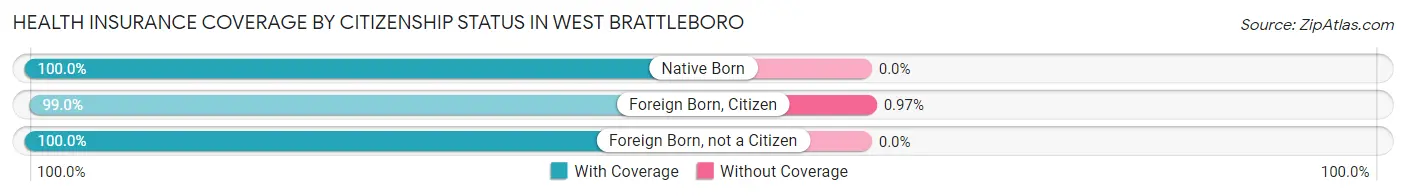
| Citizenship Status | With Coverage | Without Coverage |
| Native Born | 251 (100.0%) | 0 (0.0%) |
| Foreign Born, Citizen | 407 (99.0%) | 4 (1.0%) |
| Foreign Born, not a Citizen | 161 (100.0%) | 0 (0.0%) |
Health Insurance Coverage by Household Income in West Brattleboro
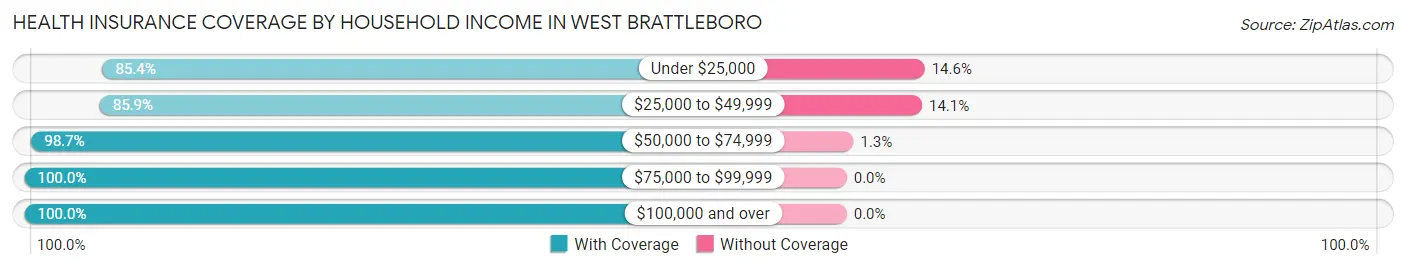
| Household Income | With Coverage | Without Coverage |
| Under $25,000 | 585 (85.4%) | 100 (14.6%) |
| $25,000 to $49,999 | 652 (85.9%) | 107 (14.1%) |
| $50,000 to $74,999 | 314 (98.7%) | 4 (1.3%) |
| $75,000 to $99,999 | 378 (100.0%) | 0 (0.0%) |
| $100,000 and over | 669 (100.0%) | 0 (0.0%) |
Public vs Private Health Insurance Coverage by Age in West Brattleboro
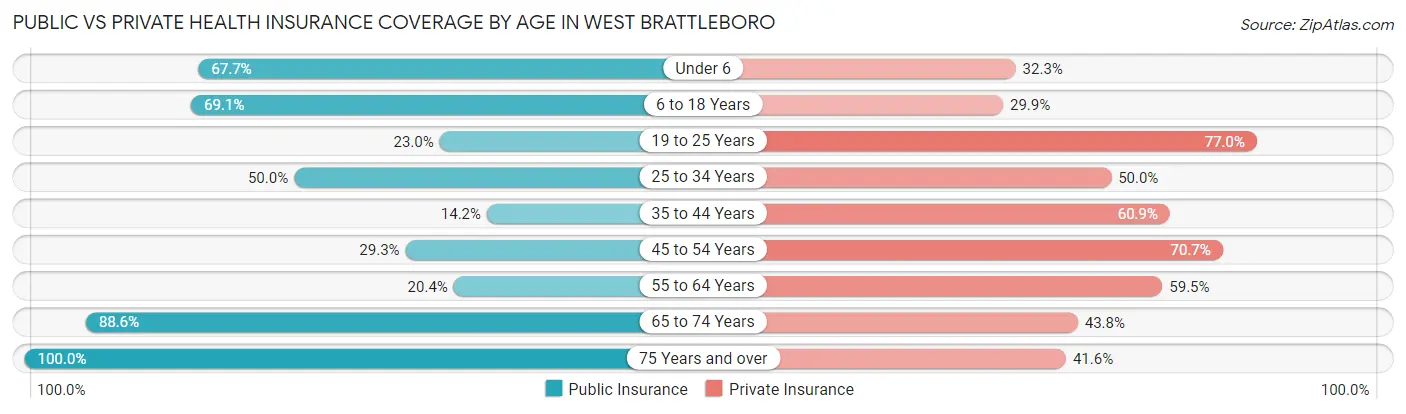
| Age Bracket | Public Insurance | Private Insurance |
| Under 6 | 170 (67.7%) | 81 (32.3%) |
| 6 to 18 Years | 284 (69.1%) | 123 (29.9%) |
| 19 to 25 Years | 37 (23.0%) | 124 (77.0%) |
| 25 to 34 Years | 158 (50.0%) | 158 (50.0%) |
| 35 to 44 Years | 49 (14.2%) | 210 (60.9%) |
| 45 to 54 Years | 73 (29.3%) | 176 (70.7%) |
| 55 to 64 Years | 90 (20.4%) | 263 (59.5%) |
| 65 to 74 Years | 437 (88.6%) | 216 (43.8%) |
| 75 Years and over | 149 (100.0%) | 62 (41.6%) |
| Total | 1,447 (51.4%) | 1,413 (50.2%) |
Disability Status by Sex by Age in West Brattleboro
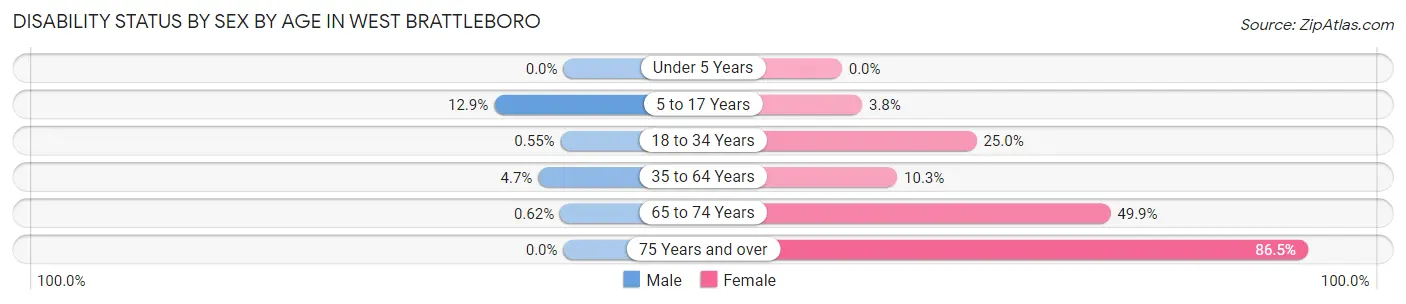
| Age Bracket | Male | Female |
| Under 5 Years | 0 (0.0%) | 0 (0.0%) |
| 5 to 17 Years | 27 (12.9%) | 5 (3.8%) |
| 18 to 34 Years | 1 (0.5%) | 93 (25.0%) |
| 35 to 64 Years | 22 (4.7%) | 58 (10.3%) |
| 65 to 74 Years | 1 (0.6%) | 165 (49.8%) |
| 75 Years and over | 0 (0.0%) | 83 (86.5%) |
Disability Class by Sex by Age in West Brattleboro
Disability Class: Hearing Difficulty
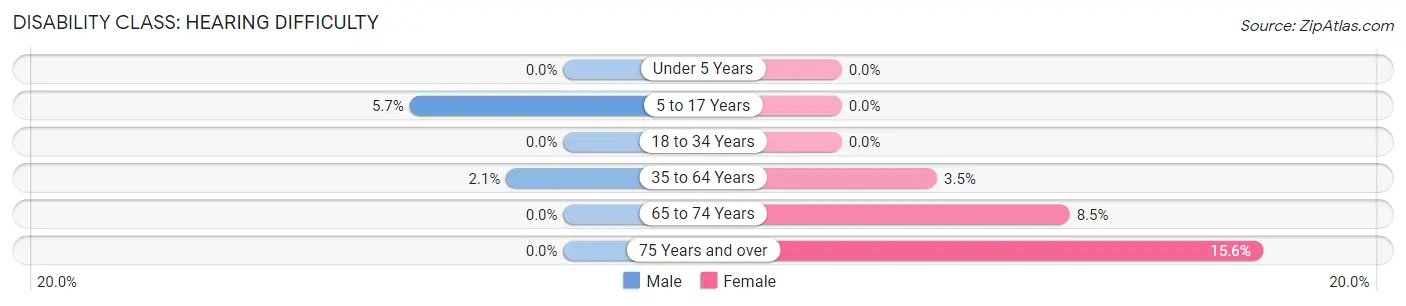
| Age Bracket | Male | Female |
| Under 5 Years | 0 (0.0%) | 0 (0.0%) |
| 5 to 17 Years | 12 (5.7%) | 0 (0.0%) |
| 18 to 34 Years | 0 (0.0%) | 0 (0.0%) |
| 35 to 64 Years | 10 (2.1%) | 20 (3.5%) |
| 65 to 74 Years | 0 (0.0%) | 28 (8.5%) |
| 75 Years and over | 0 (0.0%) | 15 (15.6%) |
Disability Class: Vision Difficulty
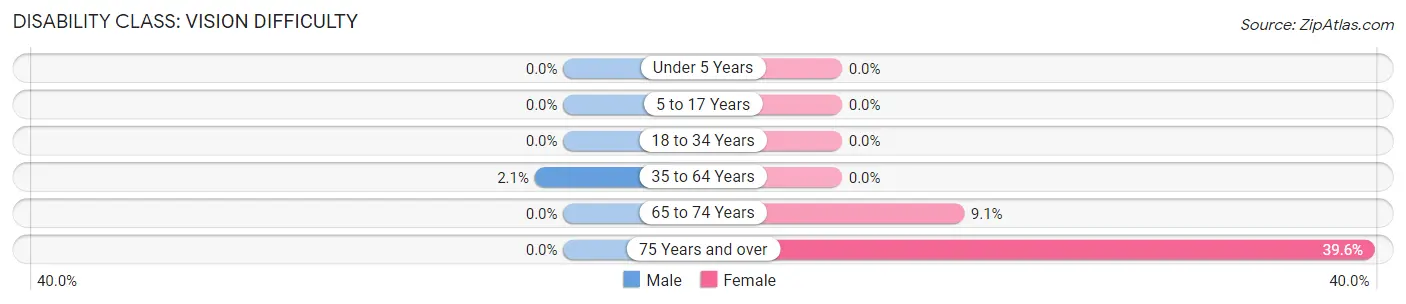
| Age Bracket | Male | Female |
| Under 5 Years | 0 (0.0%) | 0 (0.0%) |
| 5 to 17 Years | 0 (0.0%) | 0 (0.0%) |
| 18 to 34 Years | 0 (0.0%) | 0 (0.0%) |
| 35 to 64 Years | 10 (2.1%) | 0 (0.0%) |
| 65 to 74 Years | 0 (0.0%) | 30 (9.1%) |
| 75 Years and over | 0 (0.0%) | 38 (39.6%) |
Disability Class: Cognitive Difficulty
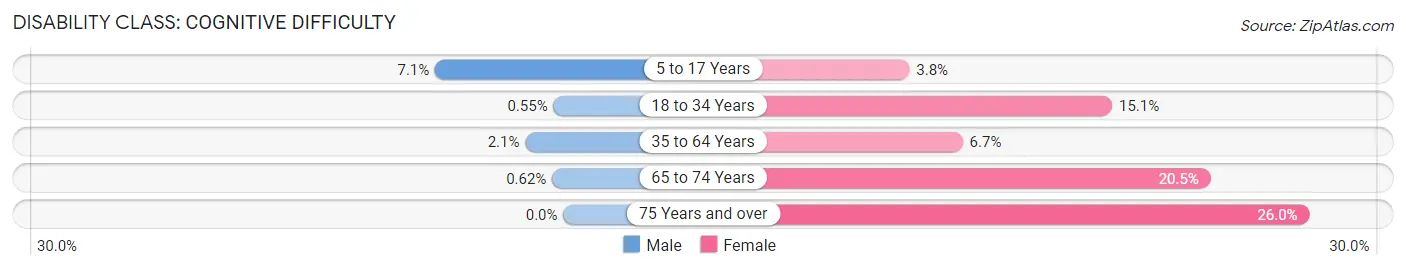
| Age Bracket | Male | Female |
| 5 to 17 Years | 15 (7.1%) | 5 (3.8%) |
| 18 to 34 Years | 1 (0.5%) | 56 (15.0%) |
| 35 to 64 Years | 10 (2.1%) | 38 (6.7%) |
| 65 to 74 Years | 1 (0.6%) | 68 (20.5%) |
| 75 Years and over | 0 (0.0%) | 25 (26.0%) |
Disability Class: Ambulatory Difficulty
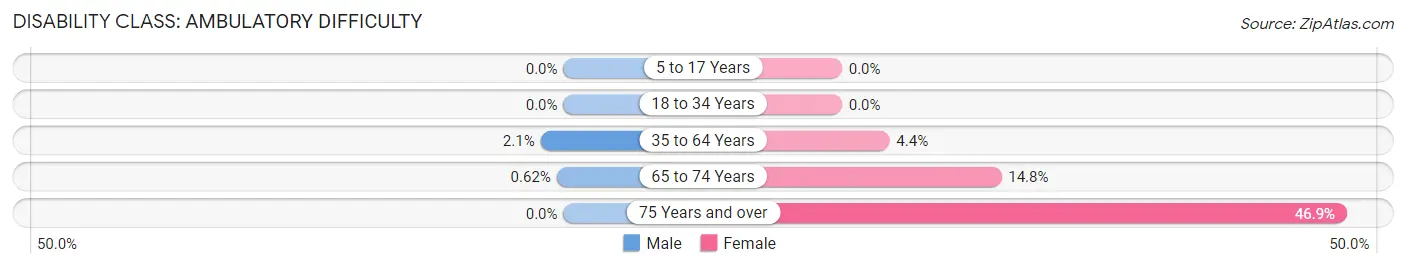
| Age Bracket | Male | Female |
| 5 to 17 Years | 0 (0.0%) | 0 (0.0%) |
| 18 to 34 Years | 0 (0.0%) | 0 (0.0%) |
| 35 to 64 Years | 10 (2.1%) | 25 (4.4%) |
| 65 to 74 Years | 1 (0.6%) | 49 (14.8%) |
| 75 Years and over | 0 (0.0%) | 45 (46.9%) |
Disability Class: Self-Care Difficulty
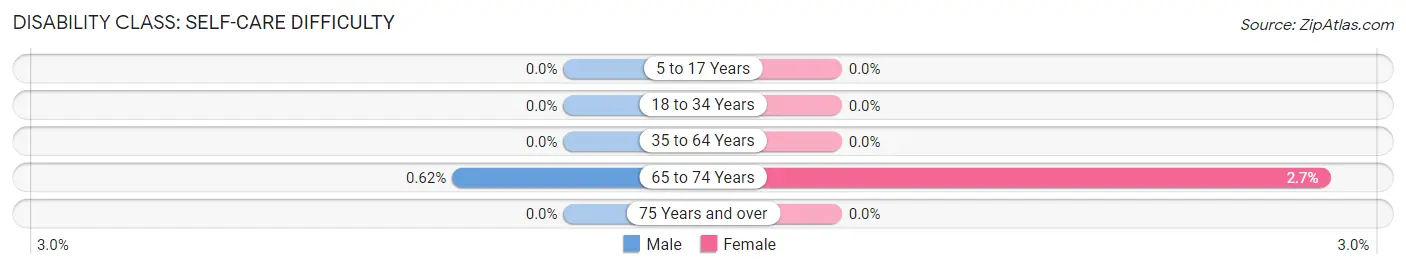
| Age Bracket | Male | Female |
| 5 to 17 Years | 0 (0.0%) | 0 (0.0%) |
| 18 to 34 Years | 0 (0.0%) | 0 (0.0%) |
| 35 to 64 Years | 0 (0.0%) | 0 (0.0%) |
| 65 to 74 Years | 1 (0.6%) | 9 (2.7%) |
| 75 Years and over | 0 (0.0%) | 0 (0.0%) |
Technology Access in West Brattleboro
Computing Device Access in West Brattleboro
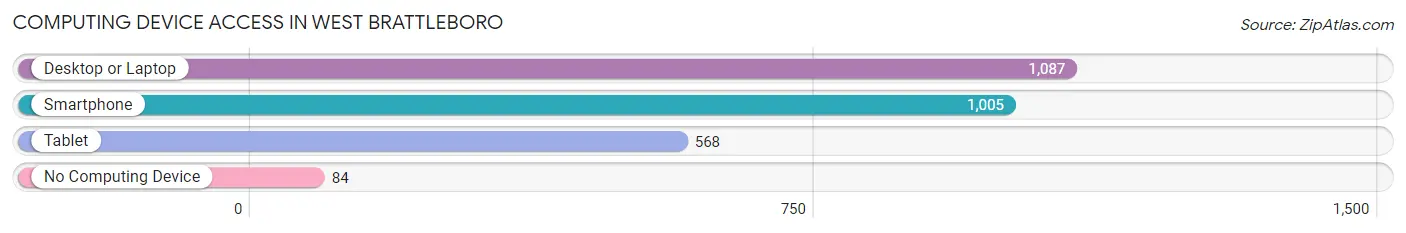
| Device Type | # Households | % Households |
| Desktop or Laptop | 1,087 | 81.1% |
| Smartphone | 1,005 | 75.0% |
| Tablet | 568 | 42.4% |
| No Computing Device | 84 | 6.3% |
| Total | 1,340 | 100.0% |
Internet Access in West Brattleboro
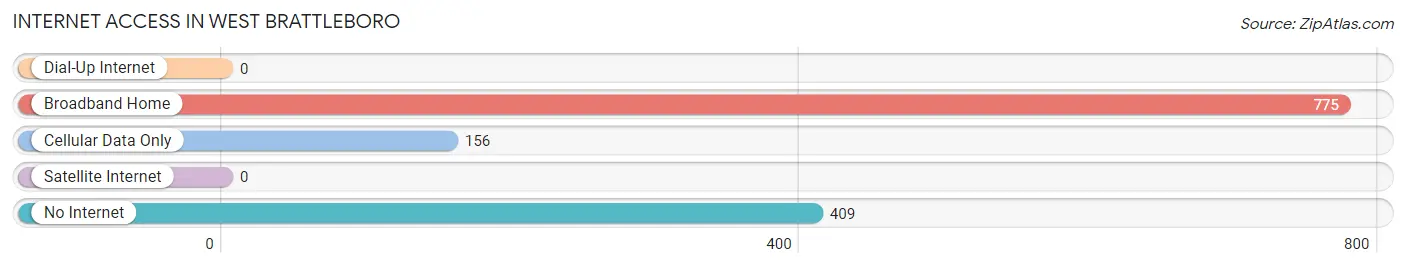
| Internet Type | # Households | % Households |
| Dial-Up Internet | 0 | 0.0% |
| Broadband Home | 775 | 57.8% |
| Cellular Data Only | 156 | 11.6% |
| Satellite Internet | 0 | 0.0% |
| No Internet | 409 | 30.5% |
| Total | 1,340 | 100.0% |
West Brattleboro Summary
West Brattleboro is a small town located in the southwestern corner of the state of Vermont. It is situated in the Connecticut River Valley, and is bordered by the towns of Putney, Dummerston, and Guilford. The town has a population of approximately 1,500 people, and is part of the larger Brattleboro metropolitan area.
History
West Brattleboro was first settled in 1753 by a group of settlers from Massachusetts. The town was originally known as “West Town”, and was part of the larger town of Brattleboro. In 1781, the town was officially incorporated as West Brattleboro.
The town was primarily an agricultural community for much of its history. In the late 19th century, the town began to develop a small manufacturing industry, which included a woolen mill, a paper mill, and a sawmill. The town also had a small railroad station, which connected it to the larger towns of Brattleboro and Bellows Falls.
In the early 20th century, the town began to experience a decline in its manufacturing industry, and the population began to decline as well. In the 1950s, the town began to experience a resurgence in its economy, as the town began to attract new businesses and industries.
Geography
West Brattleboro is located in the southwestern corner of the state of Vermont. It is situated in the Connecticut River Valley, and is bordered by the towns of Putney, Dummerston, and Guilford. The town is located approximately 10 miles west of the city of Brattleboro, and is approximately 30 miles south of the state capital of Montpelier.
The town is located in a hilly region, and is surrounded by the Green Mountains to the east and the Taconic Mountains to the west. The town is located at an elevation of approximately 1,000 feet above sea level.
Economy
West Brattleboro is a small, rural town, and its economy is largely based on agriculture and tourism. The town is home to several small farms, which produce a variety of crops, including corn, hay, and apples. The town also has several small businesses, including a general store, a hardware store, and a restaurant.
The town is also home to several small manufacturing businesses, including a furniture factory, a printing company, and a woodworking shop. The town is also home to several small service businesses, including a gas station, a post office, and a bank.
Demographics
As of the 2010 census, the population of West Brattleboro was 1,521. The racial makeup of the town was 97.2% White, 0.7% African American, 0.3% Native American, 0.3% Asian, 0.2% from other races, and 1.5% from two or more races. Hispanic or Latino of any race were 1.2% of the population.
The median household income in West Brattleboro was $45,938, and the median family income was $51,250. The per capita income for the town was $21,945. About 8.2% of families and 10.2% of the population were below the poverty line, including 14.2% of those under age 18 and 5.2% of those age 65 or over.
Common Questions
What is Per Capita Income in West Brattleboro?
Per Capita income in West Brattleboro is $28,562.
What is the Median Family Income in West Brattleboro?
Median Family Income in West Brattleboro is $48,846.
What is the Median Household income in West Brattleboro?
Median Household Income in West Brattleboro is $40,446.
What is Income or Wage Gap in West Brattleboro?
Income or Wage Gap in West Brattleboro is 29.9%.
Women in West Brattleboro earn 70.1 cents for every dollar earned by a man.
What is Inequality or Gini Index in West Brattleboro?
Inequality or Gini Index in West Brattleboro is 0.42.
What is the Total Population of West Brattleboro?
Total Population of West Brattleboro is 2,817.
What is the Total Male Population of West Brattleboro?
Total Male Population of West Brattleboro is 1,234.
What is the Total Female Population of West Brattleboro?
Total Female Population of West Brattleboro is 1,583.
What is the Ratio of Males per 100 Females in West Brattleboro?
There are 77.95 Males per 100 Females in West Brattleboro.
What is the Ratio of Females per 100 Males in West Brattleboro?
There are 128.28 Females per 100 Males in West Brattleboro.
What is the Median Population Age in West Brattleboro?
Median Population Age in West Brattleboro is 42.7 Years.
What is the Average Family Size in West Brattleboro
Average Family Size in West Brattleboro is 3.0 People.
What is the Average Household Size in West Brattleboro
Average Household Size in West Brattleboro is 2.1 People.
How Large is the Labor Force in West Brattleboro?
There are 1,521 People in the Labor Forcein in West Brattleboro.
What is the Percentage of People in the Labor Force in West Brattleboro?
68.1% of People are in the Labor Force in West Brattleboro.
What is the Unemployment Rate in West Brattleboro?
Unemployment Rate in West Brattleboro is 4.9%.