North Springfield, VT Map & Demographics
North Springfield Map
North Springfield Overview
$32,723
PER CAPITA INCOME
$64,483
AVG FAMILY INCOME
$64,177
AVG HOUSEHOLD INCOME
0.16
INEQUALITY / GINI INDEX
447
TOTAL POPULATION
246
MALE POPULATION
201
FEMALE POPULATION
122.39
MALES / 100 FEMALES
81.71
FEMALES / 100 MALES
61.0
MEDIAN AGE
1.9
AVG FAMILY SIZE
1.8
AVG HOUSEHOLD SIZE
326
LABOR FORCE [ PEOPLE ]
72.9%
PERCENT IN LABOR FORCE
North Springfield Zip Codes
North Springfield Area Codes
Income in North Springfield
Income Overview in North Springfield
Per Capita Income in North Springfield is $32,723, while median incomes of families and households are $64,483 and $64,177 respectively.
| Characteristic | Number | Measure |
| Per Capita Income | 447 | $32,723 |
| Median Family Income | 197 | $64,483 |
| Mean Family Income | 197 | $73,833 |
| Median Household Income | 233 | $64,177 |
| Mean Household Income | 233 | $70,198 |
| Income Deficit | 197 | $0 |
| Wage / Income Gap (%) | 447 | 0.00% |
| Wage / Income Gap ($) | 447 | 100.00¢ per $1 |
| Gini / Inequality Index | 447 | 0.16 |
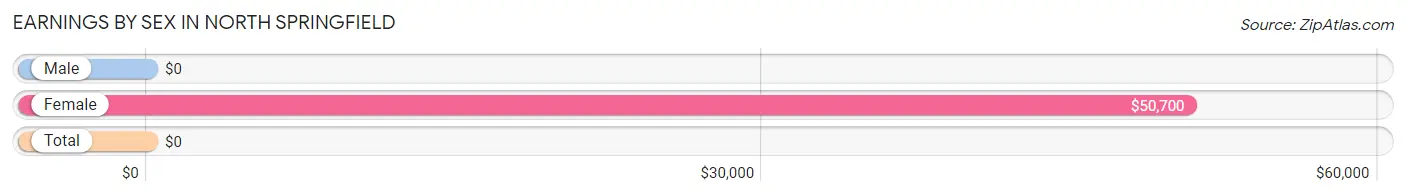
Earnings by Sex in North Springfield
| Sex | Number | Average Earnings |
| Male | 184 (56.4%) | $0 |
| Female | 142 (43.6%) | $50,700 |
| Total | 326 (100.0%) | $0 |
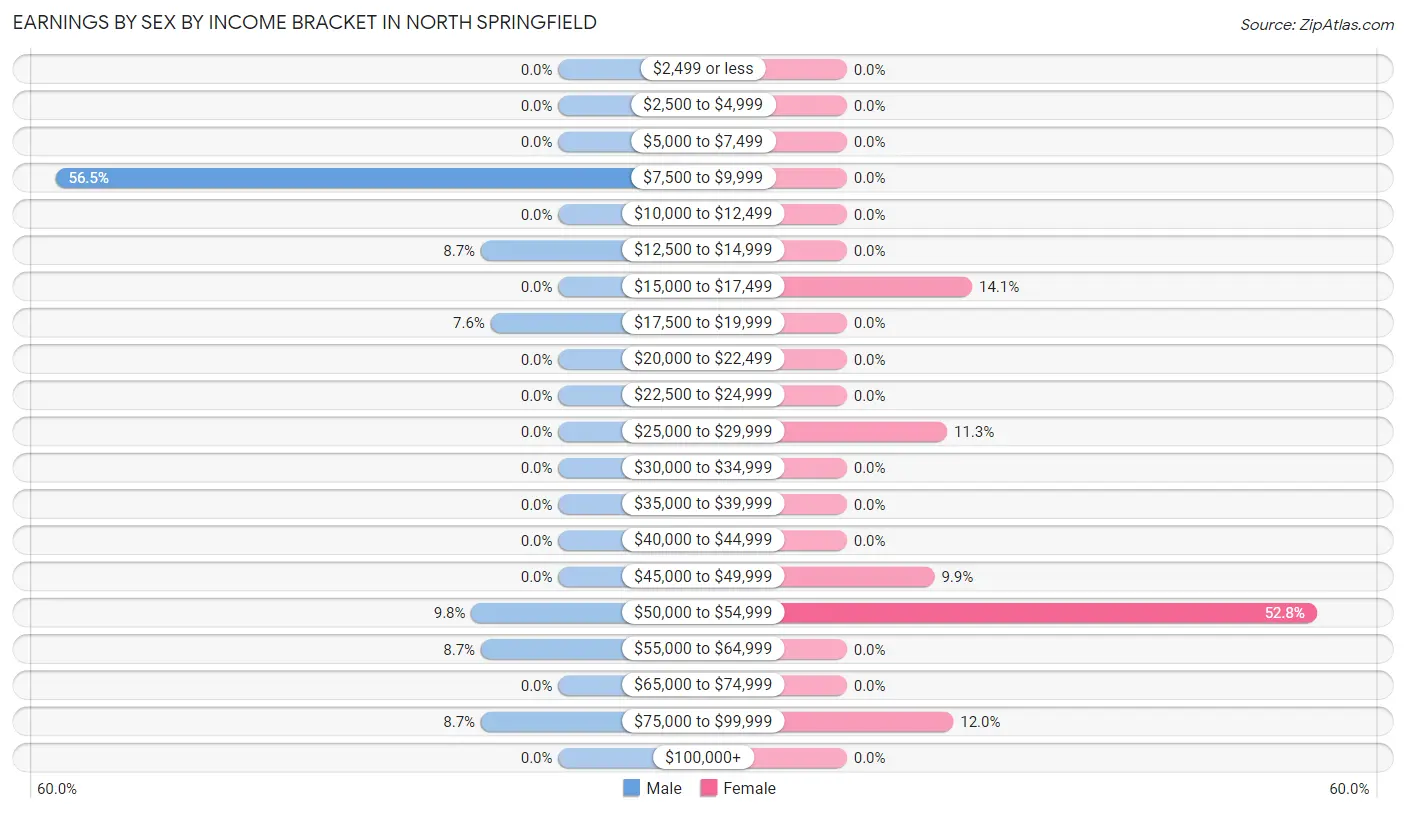
Earnings by Sex by Income Bracket in North Springfield
The most common earnings brackets in North Springfield are $7,500 to $9,999 for men (104 | 56.5%) and $50,000 to $54,999 for women (75 | 52.8%).
| Income | Male | Female |
| $2,499 or less | 0 (0.0%) | 0 (0.0%) |
| $2,500 to $4,999 | 0 (0.0%) | 0 (0.0%) |
| $5,000 to $7,499 | 0 (0.0%) | 0 (0.0%) |
| $7,500 to $9,999 | 104 (56.5%) | 0 (0.0%) |
| $10,000 to $12,499 | 0 (0.0%) | 0 (0.0%) |
| $12,500 to $14,999 | 16 (8.7%) | 0 (0.0%) |
| $15,000 to $17,499 | 0 (0.0%) | 20 (14.1%) |
| $17,500 to $19,999 | 14 (7.6%) | 0 (0.0%) |
| $20,000 to $22,499 | 0 (0.0%) | 0 (0.0%) |
| $22,500 to $24,999 | 0 (0.0%) | 0 (0.0%) |
| $25,000 to $29,999 | 0 (0.0%) | 16 (11.3%) |
| $30,000 to $34,999 | 0 (0.0%) | 0 (0.0%) |
| $35,000 to $39,999 | 0 (0.0%) | 0 (0.0%) |
| $40,000 to $44,999 | 0 (0.0%) | 0 (0.0%) |
| $45,000 to $49,999 | 0 (0.0%) | 14 (9.9%) |
| $50,000 to $54,999 | 18 (9.8%) | 75 (52.8%) |
| $55,000 to $64,999 | 16 (8.7%) | 0 (0.0%) |
| $65,000 to $74,999 | 0 (0.0%) | 0 (0.0%) |
| $75,000 to $99,999 | 16 (8.7%) | 17 (12.0%) |
| $100,000+ | 0 (0.0%) | 0 (0.0%) |
| Total | 184 (100.0%) | 142 (100.0%) |
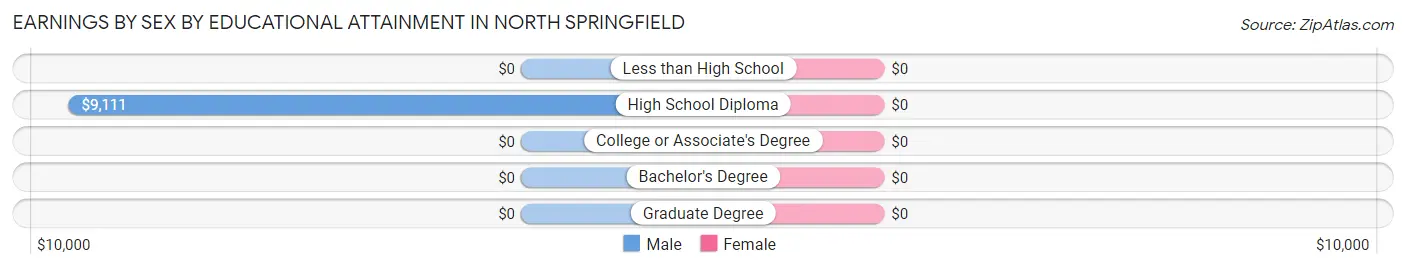
Earnings by Sex by Educational Attainment in North Springfield
| Educational Attainment | Male Income | Female Income |
| Less than High School | - | - |
| High School Diploma | $9,111 | $0 |
| College or Associate's Degree | - | - |
| Bachelor's Degree | - | - |
| Graduate Degree | - | - |
| Total | - | - |
Family Income in North Springfield
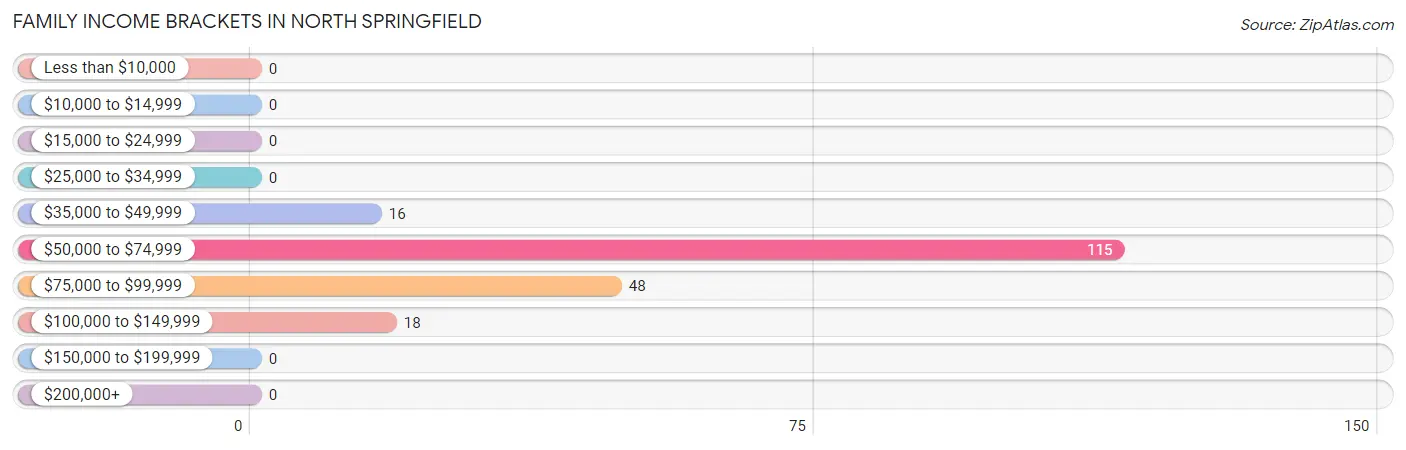
Family Income Brackets in North Springfield
According to the North Springfield family income data, there are 115 families falling into the $50,000 to $74,999 income range, which is the most common income bracket and makes up 58.4% of all families.
| Income Bracket | # Families | % Families |
| Less than $10,000 | 0 | 0.0% |
| $10,000 to $14,999 | 0 | 0.0% |
| $15,000 to $24,999 | 0 | 0.0% |
| $25,000 to $34,999 | 0 | 0.0% |
| $35,000 to $49,999 | 16 | 8.1% |
| $50,000 to $74,999 | 115 | 58.4% |
| $75,000 to $99,999 | 48 | 24.4% |
| $100,000 to $149,999 | 18 | 9.1% |
| $150,000 to $199,999 | 0 | 0.0% |
| $200,000+ | 0 | 0.0% |
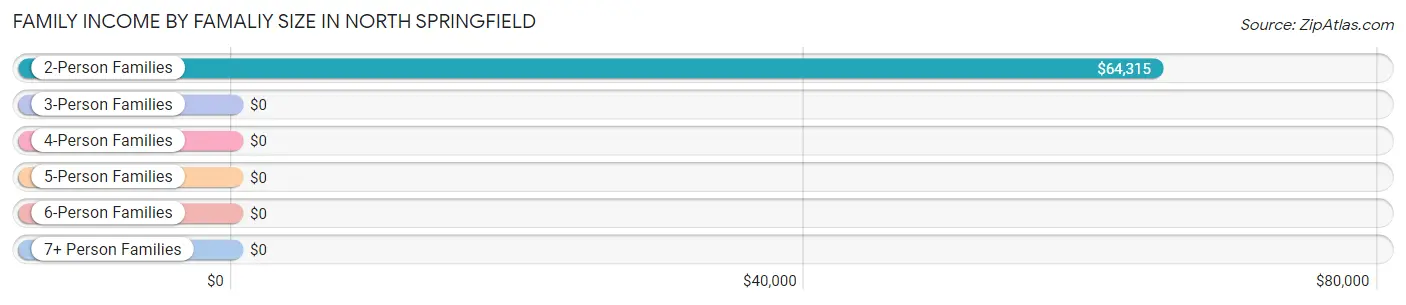
Family Income by Famaliy Size in North Springfield
2-person families (183 | 92.9%) account for the highest median family income in North Springfield with $64,315 per family, while 2-person families (183 | 92.9%) have the highest median income of $32,158 per family member.
| Income Bracket | # Families | Median Income |
| 2-Person Families | 183 (92.9%) | $64,315 |
| 3-Person Families | 14 (7.1%) | $0 |
| 4-Person Families | 0 (0.0%) | $0 |
| 5-Person Families | 0 (0.0%) | $0 |
| 6-Person Families | 0 (0.0%) | $0 |
| 7+ Person Families | 0 (0.0%) | $0 |
| Total | 197 (100.0%) | $64,483 |
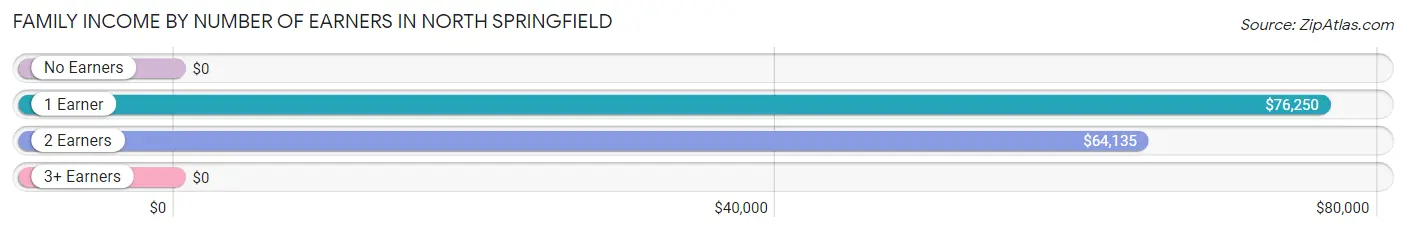
Family Income by Number of Earners in North Springfield
| Number of Earners | # Families | Median Income |
| No Earners | 11 (5.6%) | $0 |
| 1 Earner | 50 (25.4%) | $76,250 |
| 2 Earners | 136 (69.0%) | $64,135 |
| 3+ Earners | 0 (0.0%) | $0 |
| Total | 197 (100.0%) | $64,483 |
Household Income in North Springfield
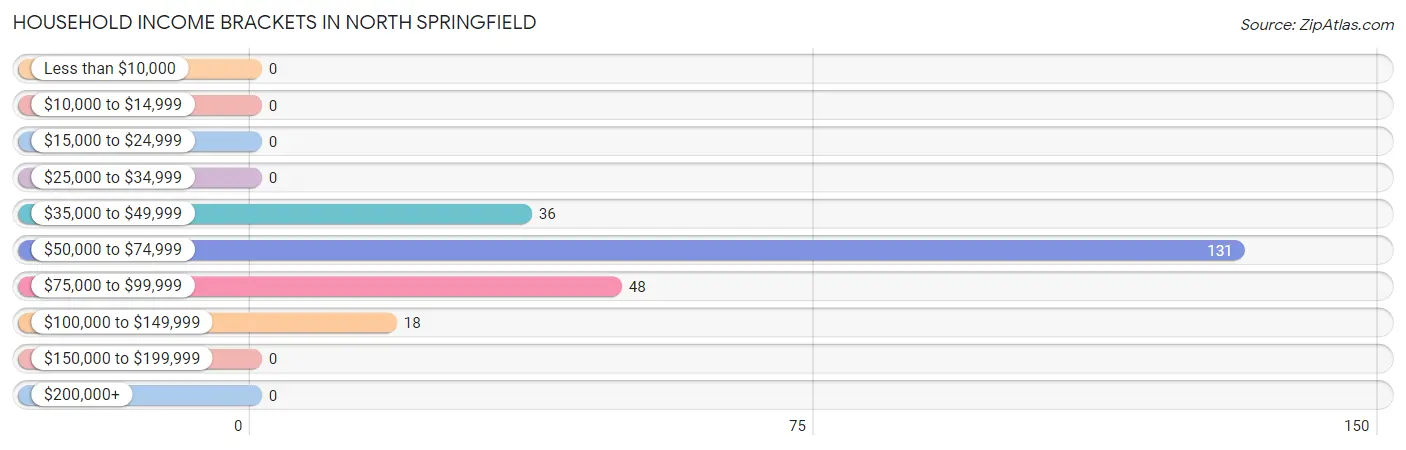
Household Income Brackets in North Springfield
With 131 households falling in the category, the $50,000 to $74,999 income range is the most frequent in North Springfield, accounting for 56.2% of all households.
| Income Bracket | # Households | % Households |
| Less than $10,000 | 0 | 0.0% |
| $10,000 to $14,999 | 0 | 0.0% |
| $15,000 to $24,999 | 0 | 0.0% |
| $25,000 to $34,999 | 0 | 0.0% |
| $35,000 to $49,999 | 36 | 15.5% |
| $50,000 to $74,999 | 131 | 56.2% |
| $75,000 to $99,999 | 48 | 20.6% |
| $100,000 to $149,999 | 18 | 7.7% |
| $150,000 to $199,999 | 0 | 0.0% |
| $200,000+ | 0 | 0.0% |
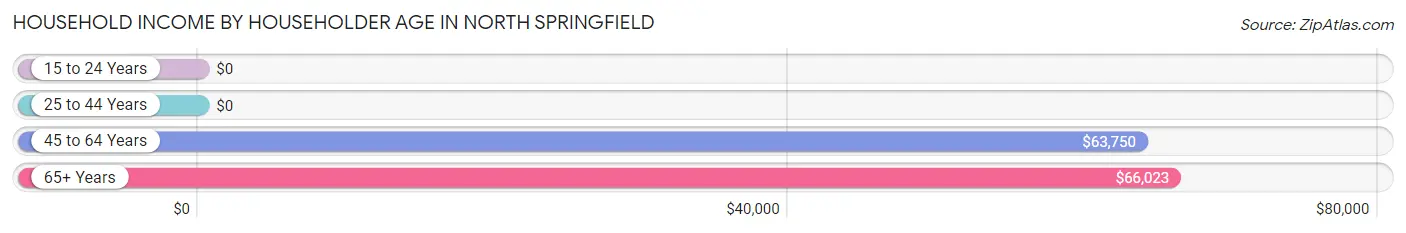
Household Income by Householder Age in North Springfield
The median household income in North Springfield is $64,177, with the highest median household income of $66,023 found in the 65+ years age bracket for the primary householder. A total of 49 households (21.0%) fall into this category.
| Income Bracket | # Households | Median Income |
| 15 to 24 Years | 0 (0.0%) | $0 |
| 25 to 44 Years | 32 (13.7%) | $0 |
| 45 to 64 Years | 152 (65.2%) | $63,750 |
| 65+ Years | 49 (21.0%) | $66,023 |
| Total | 233 (100.0%) | $64,177 |
Poverty in North Springfield
Income Below Poverty by Sex and Age in North Springfield
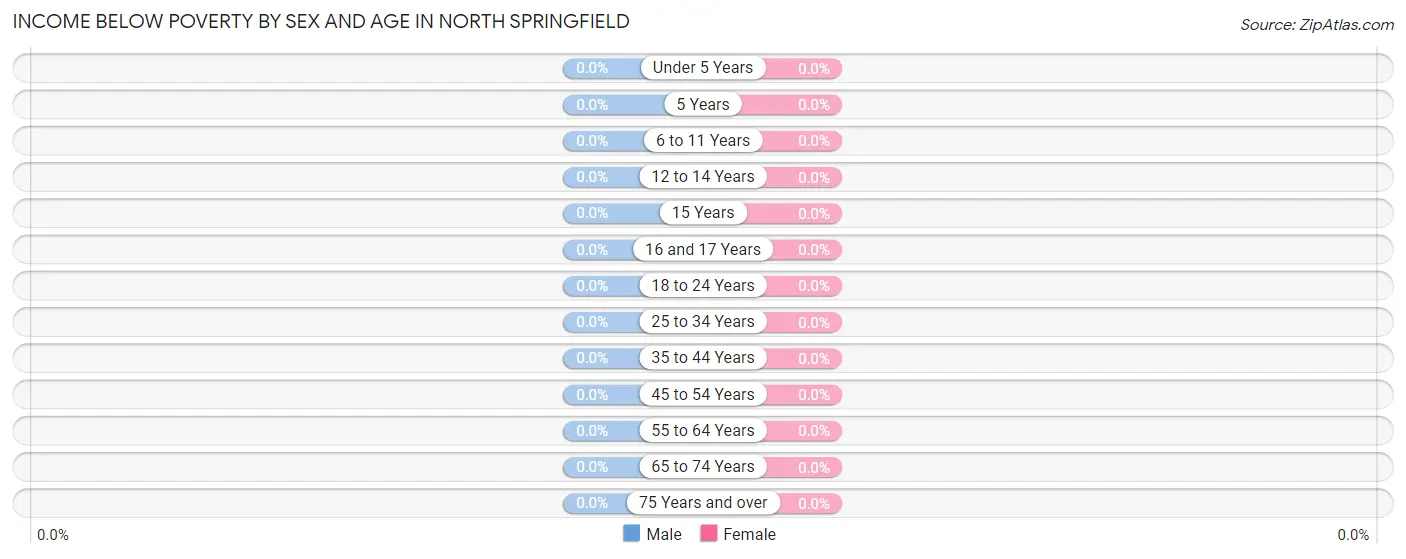
| Age Bracket | Male | Female |
| Under 5 Years | 0 (0.0%) | 0 (0.0%) |
| 5 Years | 0 (0.0%) | 0 (0.0%) |
| 6 to 11 Years | 0 (0.0%) | 0 (0.0%) |
| 12 to 14 Years | 0 (0.0%) | 0 (0.0%) |
| 15 Years | 0 (0.0%) | 0 (0.0%) |
| 16 and 17 Years | 0 (0.0%) | 0 (0.0%) |
| 18 to 24 Years | 0 (0.0%) | 0 (0.0%) |
| 25 to 34 Years | 0 (0.0%) | 0 (0.0%) |
| 35 to 44 Years | 0 (0.0%) | 0 (0.0%) |
| 45 to 54 Years | 0 (0.0%) | 0 (0.0%) |
| 55 to 64 Years | 0 (0.0%) | 0 (0.0%) |
| 65 to 74 Years | 0 (0.0%) | 0 (0.0%) |
| 75 Years and over | 0 (0.0%) | 0 (0.0%) |
| Total | 0 (0.0%) | 0 (0.0%) |
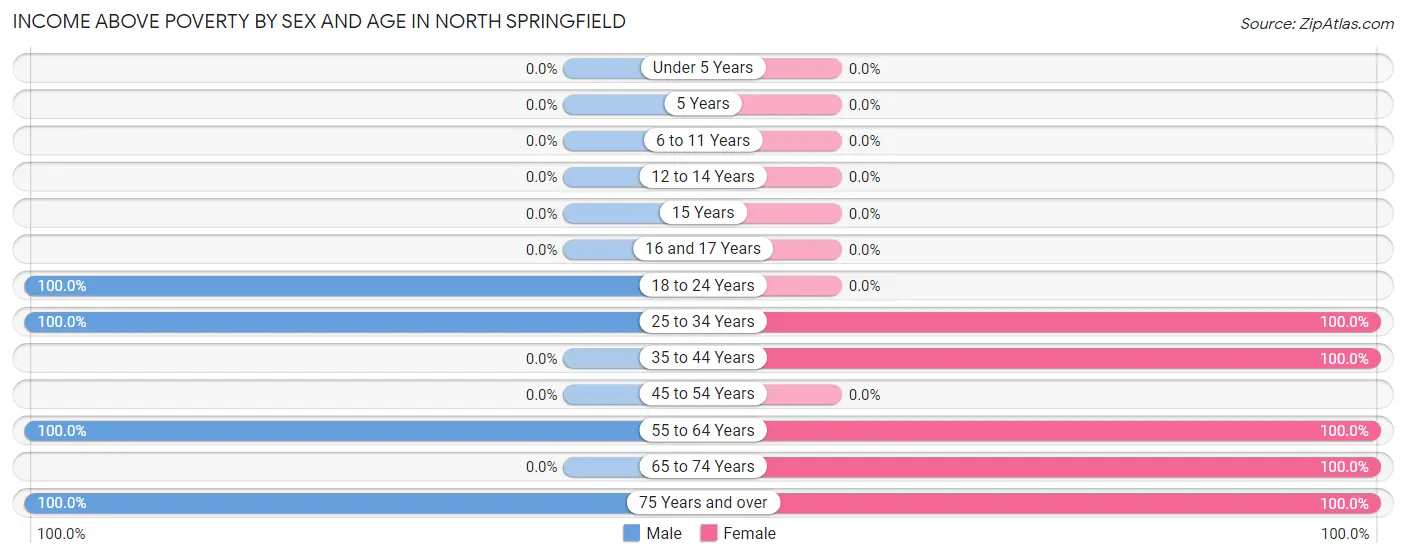
Income Above Poverty by Sex and Age in North Springfield
According to the poverty statistics in North Springfield, males aged 18 to 24 years and females aged 25 to 34 years are the age groups that are most secure financially, with 100.0% of males and 100.0% of females in these age groups living above the poverty line.
| Age Bracket | Male | Female |
| Under 5 Years | 0 (0.0%) | 0 (0.0%) |
| 5 Years | 0 (0.0%) | 0 (0.0%) |
| 6 to 11 Years | 0 (0.0%) | 0 (0.0%) |
| 12 to 14 Years | 0 (0.0%) | 0 (0.0%) |
| 15 Years | 0 (0.0%) | 0 (0.0%) |
| 16 and 17 Years | 0 (0.0%) | 0 (0.0%) |
| 18 to 24 Years | 26 (100.0%) | 0 (0.0%) |
| 25 to 34 Years | 18 (100.0%) | 17 (100.0%) |
| 35 to 44 Years | 0 (0.0%) | 30 (100.0%) |
| 45 to 54 Years | 0 (0.0%) | 0 (0.0%) |
| 55 to 64 Years | 152 (100.0%) | 15 (100.0%) |
| 65 to 74 Years | 0 (0.0%) | 106 (100.0%) |
| 75 Years and over | 22 (100.0%) | 33 (100.0%) |
| Total | 218 (100.0%) | 201 (100.0%) |
Income Below Poverty Among Married-Couple Families in North Springfield
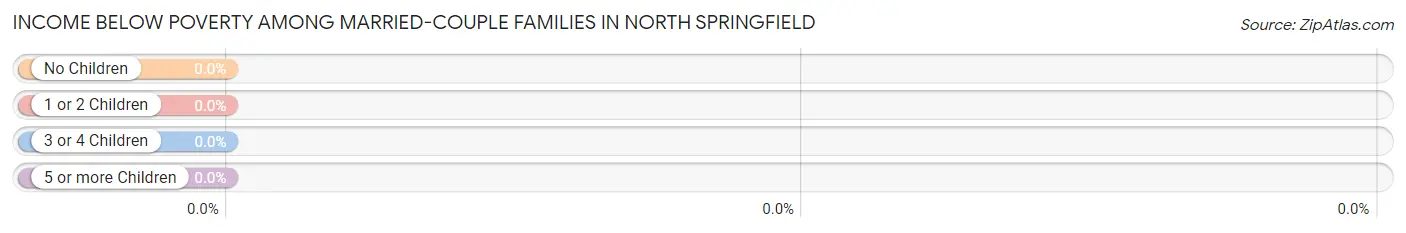
| Children | Above Poverty | Below Poverty |
| No Children | 197 (100.0%) | 0 (0.0%) |
| 1 or 2 Children | 0 (0.0%) | 0 (0.0%) |
| 3 or 4 Children | 0 (0.0%) | 0 (0.0%) |
| 5 or more Children | 0 (0.0%) | 0 (0.0%) |
| Total | 197 (100.0%) | 0 (0.0%) |
Income Below Poverty Among Single-Parent Households in North Springfield
| Children | Single Father | Single Mother |
| No Children | 0 (0.0%) | 0 (0.0%) |
| 1 or 2 Children | 0 (0.0%) | 0 (0.0%) |
| 3 or 4 Children | 0 (0.0%) | 0 (0.0%) |
| 5 or more Children | 0 (0.0%) | 0 (0.0%) |
| Total | 0 (0.0%) | 0 (0.0%) |
Income Below Poverty Among Married-Couple vs Single-Parent Households in North Springfield
| Children | Married-Couple Families | Single-Parent Households |
| No Children | 0 (0.0%) | 0 (0.0%) |
| 1 or 2 Children | 0 (0.0%) | 0 (0.0%) |
| 3 or 4 Children | 0 (0.0%) | 0 (0.0%) |
| 5 or more Children | 0 (0.0%) | 0 (0.0%) |
| Total | 0 (0.0%) | 0 (0.0%) |
Race in North Springfield
The most populous races in North Springfield are White / Caucasian (405 | 90.6%), Hispanic or Latino (42 | 9.4%), and Some other Race (42 | 9.4%).
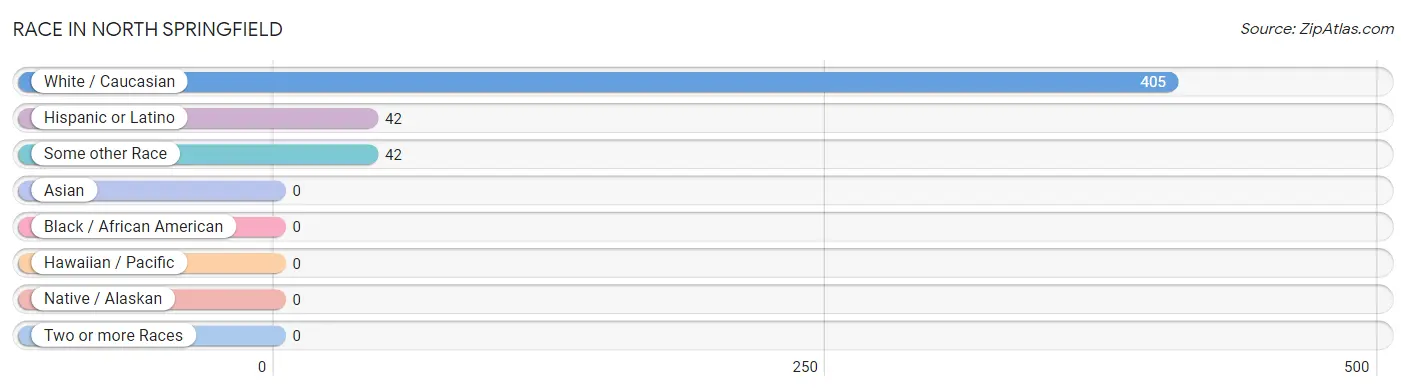
| Race | # Population | % Population |
| Asian | 0 | 0.0% |
| Black / African American | 0 | 0.0% |
| Hawaiian / Pacific | 0 | 0.0% |
| Hispanic or Latino | 42 | 9.4% |
| Native / Alaskan | 0 | 0.0% |
| White / Caucasian | 405 | 90.6% |
| Two or more Races | 0 | 0.0% |
| Some other Race | 42 | 9.4% |
| Total | 447 | 100.0% |
Ancestry in North Springfield
The most populous ancestries reported in North Springfield are English (290 | 64.9%), Mexican (42 | 9.4%), American (20 | 4.5%), French (16 | 3.6%), and Scotch-Irish (16 | 3.6%), together accounting for 85.9% of all North Springfield residents.

| Ancestry | # Population | % Population |
| American | 20 | 4.5% |
| English | 290 | 64.9% |
| French | 16 | 3.6% |
| Mexican | 42 | 9.4% |
| Scotch-Irish | 16 | 3.6% | View All 5 Rows |
Immigrants in North Springfield
The most numerous immigrant groups reported in North Springfield came from Central America (42 | 9.4%), Latin America (42 | 9.4%), and Mexico (42 | 9.4%), together accounting for 28.2% of all North Springfield residents.
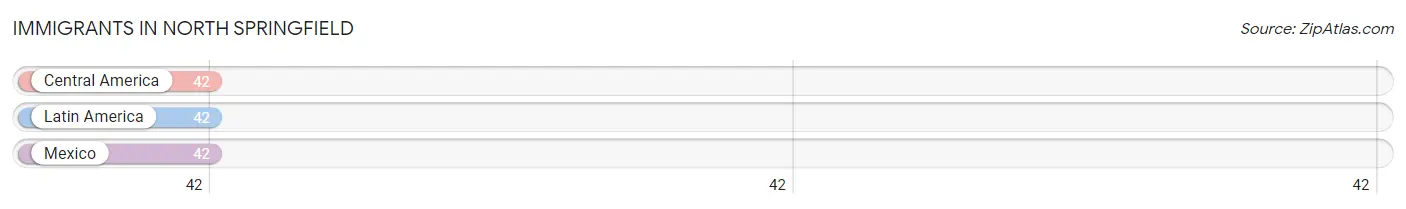
| Immigration Origin | # Population | % Population |
| Central America | 42 | 9.4% |
| Latin America | 42 | 9.4% |
| Mexico | 42 | 9.4% | View All 3 Rows |
Sex and Age in North Springfield
Sex and Age in North Springfield
The most populous age groups in North Springfield are 60 to 64 Years (152 | 61.8%) for men and 65 to 69 Years (75 | 37.3%) for women.
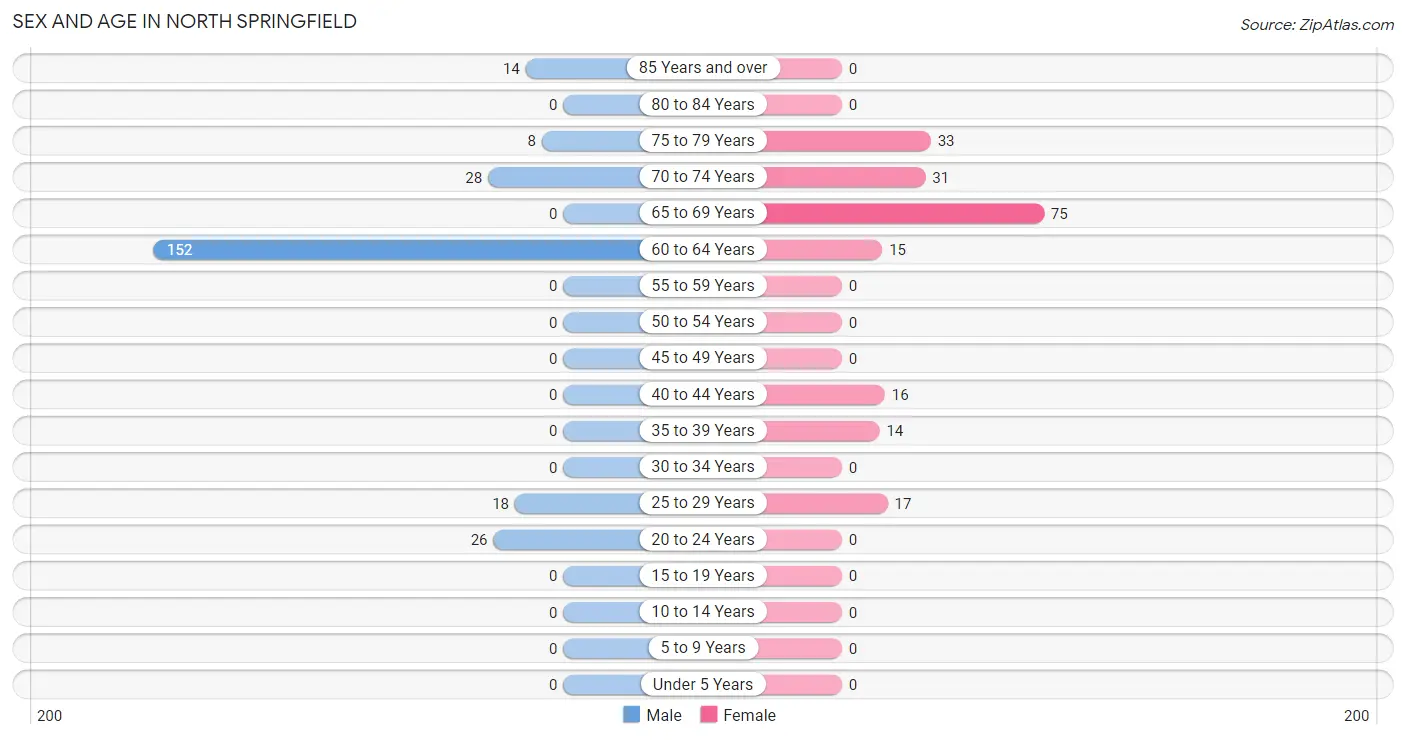
| Age Bracket | Male | Female |
| Under 5 Years | 0 (0.0%) | 0 (0.0%) |
| 5 to 9 Years | 0 (0.0%) | 0 (0.0%) |
| 10 to 14 Years | 0 (0.0%) | 0 (0.0%) |
| 15 to 19 Years | 0 (0.0%) | 0 (0.0%) |
| 20 to 24 Years | 26 (10.6%) | 0 (0.0%) |
| 25 to 29 Years | 18 (7.3%) | 17 (8.5%) |
| 30 to 34 Years | 0 (0.0%) | 0 (0.0%) |
| 35 to 39 Years | 0 (0.0%) | 14 (7.0%) |
| 40 to 44 Years | 0 (0.0%) | 16 (8.0%) |
| 45 to 49 Years | 0 (0.0%) | 0 (0.0%) |
| 50 to 54 Years | 0 (0.0%) | 0 (0.0%) |
| 55 to 59 Years | 0 (0.0%) | 0 (0.0%) |
| 60 to 64 Years | 152 (61.8%) | 15 (7.5%) |
| 65 to 69 Years | 0 (0.0%) | 75 (37.3%) |
| 70 to 74 Years | 28 (11.4%) | 31 (15.4%) |
| 75 to 79 Years | 8 (3.3%) | 33 (16.4%) |
| 80 to 84 Years | 0 (0.0%) | 0 (0.0%) |
| 85 Years and over | 14 (5.7%) | 0 (0.0%) |
| Total | 246 (100.0%) | 201 (100.0%) |
Families and Households in North Springfield
Median Family Size in North Springfield
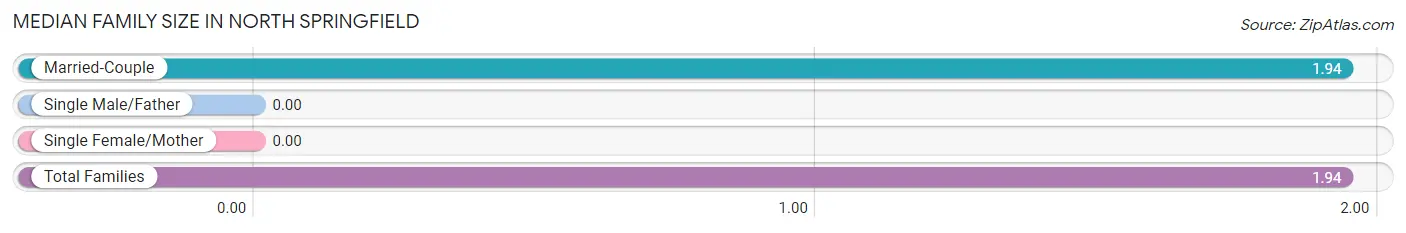
| Family Type | # Families | Family Size |
| Married-Couple | 197 (100.0%) | 1.94 |
| Single Male/Father | 0 (0.0%) | - |
| Single Female/Mother | 0 (0.0%) | - |
| Total Families | 197 (100.0%) | 1.94 |
Median Household Size in North Springfield
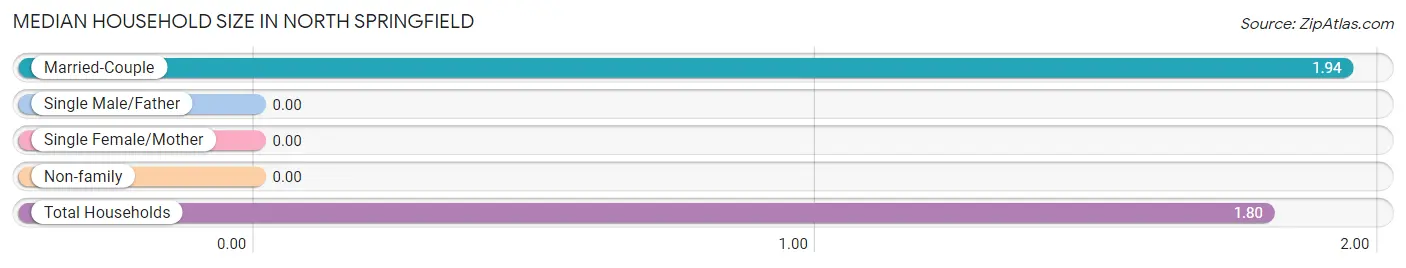
| Household Type | # Households | Household Size |
| Married-Couple | 197 (84.6%) | 1.94 |
| Single Male/Father | 0 (0.0%) | - |
| Single Female/Mother | 0 (0.0%) | - |
| Non-family | 36 (15.4%) | - |
| Total Households | 233 (100.0%) | 1.80 |
Household Size by Marriage Status in North Springfield
Out of a total of 233 households in North Springfield, 197 (84.6%) are family households, while 36 (15.4%) are nonfamily households. The most numerous type of family households are 2-person households, comprising 183, and the most common type of nonfamily households are 1-person households, comprising 36.
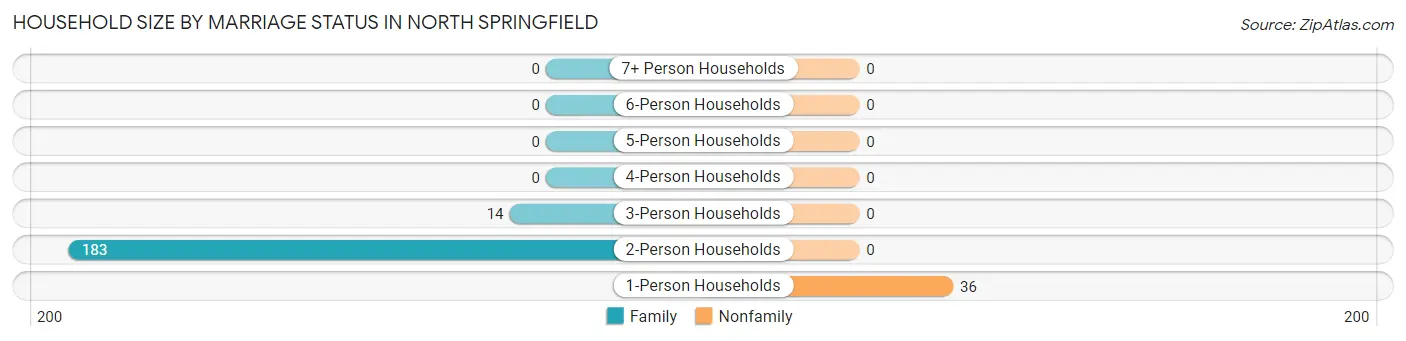
| Household Size | Family Households | Nonfamily Households |
| 1-Person Households | - | 36 (15.4%) |
| 2-Person Households | 183 (78.5%) | 0 (0.0%) |
| 3-Person Households | 14 (6.0%) | 0 (0.0%) |
| 4-Person Households | 0 (0.0%) | 0 (0.0%) |
| 5-Person Households | 0 (0.0%) | 0 (0.0%) |
| 6-Person Households | 0 (0.0%) | 0 (0.0%) |
| 7+ Person Households | 0 (0.0%) | 0 (0.0%) |
| Total | 197 (84.6%) | 36 (15.4%) |
Female Fertility in North Springfield
Fertility by Age in North Springfield
| Age Bracket | Women with Births | Births / 1,000 Women |
| 15 to 19 years | 0 (0.0%) | 0.0 |
| 20 to 34 years | 0 (0.0%) | 0.0 |
| 35 to 50 years | 0 (0.0%) | 0.0 |
| Total | 0 (0.0%) | 0.0 |
Fertility by Age by Marriage Status in North Springfield
| Age Bracket | Married | Unmarried |
| 15 to 19 years | 0 (0.0%) | 0 (0.0%) |
| 20 to 34 years | 0 (0.0%) | 0 (0.0%) |
| 35 to 50 years | 0 (0.0%) | 0 (0.0%) |
| Total | 0 (0.0%) | 0 (0.0%) |
Fertility by Education in North Springfield
| Educational Attainment | Women with Births | Births / 1,000 Women |
| Less than High School | 0 (0.0%) | 0.0 |
| High School Diploma | 0 (0.0%) | 0.0 |
| College or Associate's Degree | 0 (0.0%) | 0.0 |
| Bachelor's Degree | 0 (0.0%) | 0.0 |
| Graduate Degree | 0 (0.0%) | 0.0 |
| Total | 0 (0.0%) | 0.0 |
Fertility by Education by Marriage Status in North Springfield
| Educational Attainment | Married | Unmarried |
| Less than High School | 0 (0.0%) | 0 (0.0%) |
| High School Diploma | 0 (0.0%) | 0 (0.0%) |
| College or Associate's Degree | 0 (0.0%) | 0 (0.0%) |
| Bachelor's Degree | 0 (0.0%) | 0 (0.0%) |
| Graduate Degree | 0 (0.0%) | 0 (0.0%) |
| Total | 0 (0.0%) | 0 (0.0%) |
Employment Characteristics in North Springfield
Employment by Class of Employer in North Springfield
Among the 326 employed individuals in North Springfield, private company employees (189 | 58.0%), self-employed (not incorporated) (104 | 31.9%), and federal government employees (17 | 5.2%) make up the most common classes of employment.
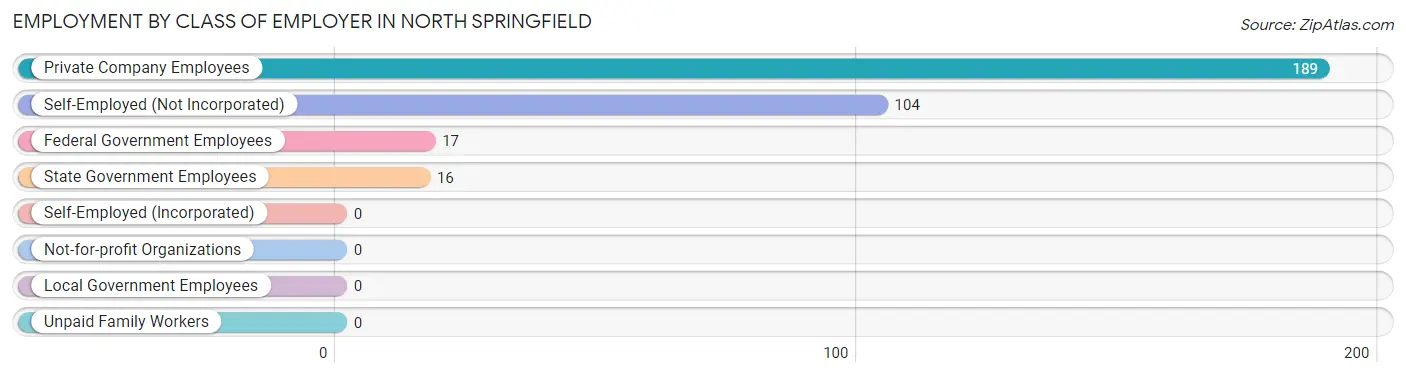
| Employer Class | # Employees | % Employees |
| Private Company Employees | 189 | 58.0% |
| Self-Employed (Incorporated) | 0 | 0.0% |
| Self-Employed (Not Incorporated) | 104 | 31.9% |
| Not-for-profit Organizations | 0 | 0.0% |
| Local Government Employees | 0 | 0.0% |
| State Government Employees | 16 | 4.9% |
| Federal Government Employees | 17 | 5.2% |
| Unpaid Family Workers | 0 | 0.0% |
| Total | 326 | 100.0% |
Employment Status by Age in North Springfield
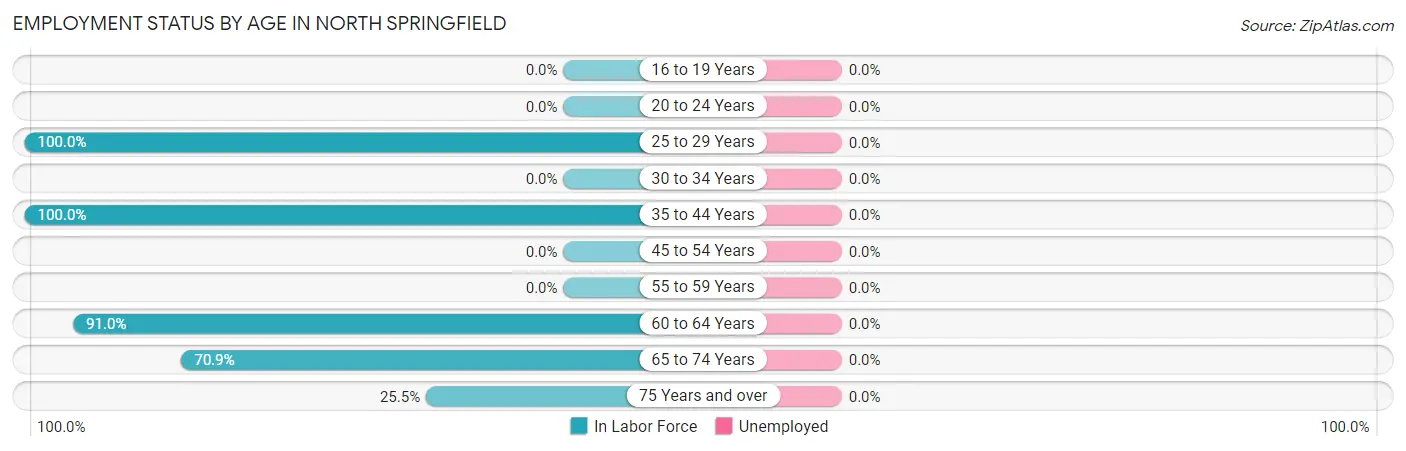
| Age Bracket | In Labor Force | Unemployed |
| 16 to 19 Years | 0 (0.0%) | 0 (0.0%) |
| 20 to 24 Years | 0 (0.0%) | 0 (0.0%) |
| 25 to 29 Years | 35 (100.0%) | 0 (0.0%) |
| 30 to 34 Years | 0 (0.0%) | 0 (0.0%) |
| 35 to 44 Years | 30 (100.0%) | 0 (0.0%) |
| 45 to 54 Years | 0 (0.0%) | 0 (0.0%) |
| 55 to 59 Years | 0 (0.0%) | 0 (0.0%) |
| 60 to 64 Years | 152 (91.0%) | 0 (0.0%) |
| 65 to 74 Years | 95 (70.9%) | 0 (0.0%) |
| 75 Years and over | 14 (25.5%) | 0 (0.0%) |
| Total | 326 (72.9%) | 0 (0.0%) |
Employment Status by Educational Attainment in North Springfield
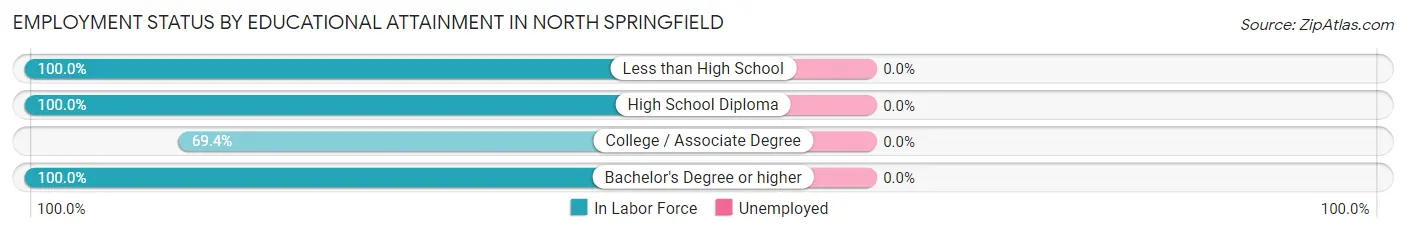
| Educational Attainment | In Labor Force | Unemployed |
| Less than High School | 16 (100.0%) | 0 (0.0%) |
| High School Diploma | 120 (100.0%) | 0 (0.0%) |
| College / Associate Degree | 34 (69.4%) | 0 (0.0%) |
| Bachelor's Degree or higher | 47 (100.0%) | 0 (0.0%) |
| Total | 217 (93.5%) | 0 (0.0%) |
Employment Occupations by Sex in North Springfield
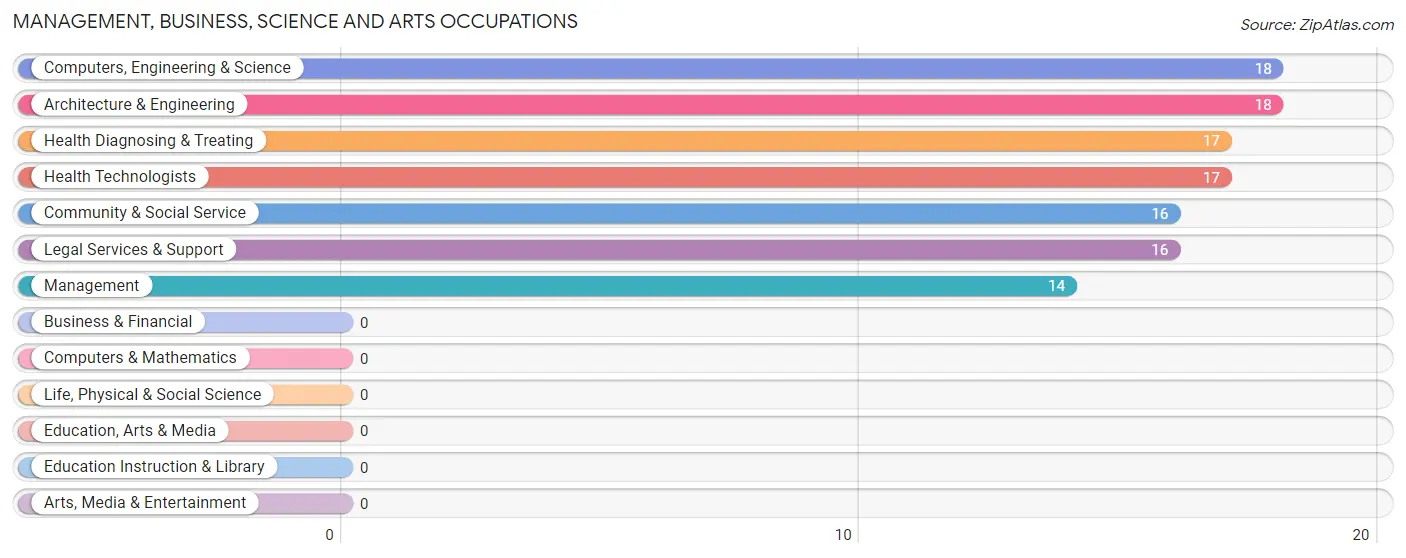
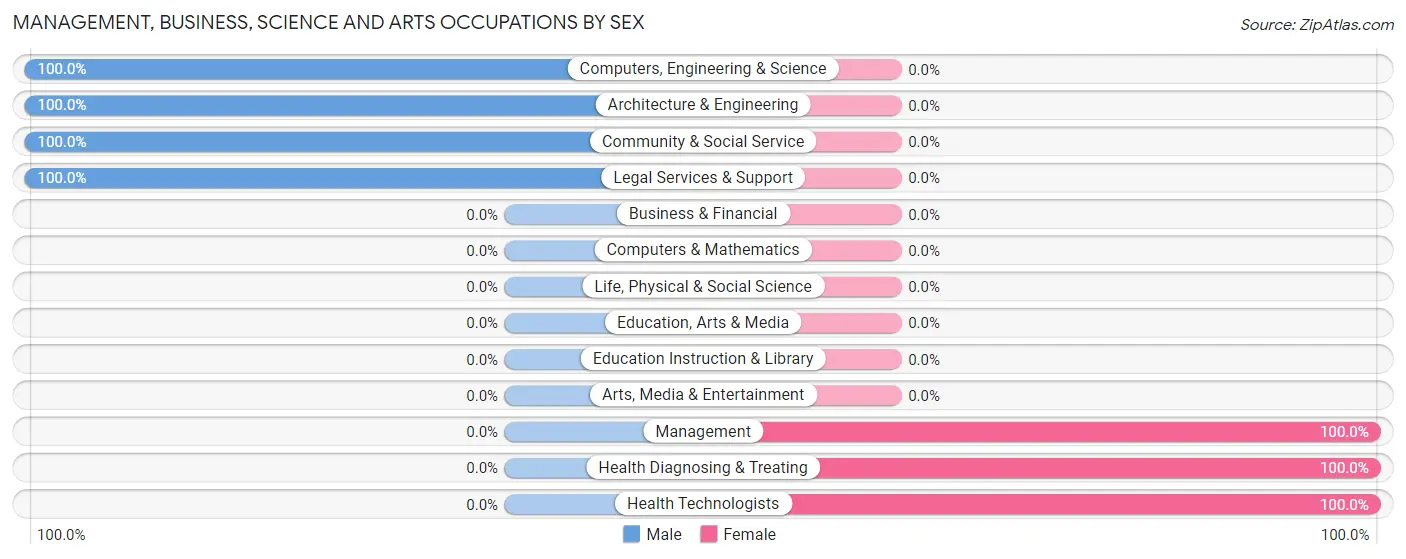
Management, Business, Science and Arts Occupations
The most common Management, Business, Science and Arts occupations in North Springfield are Computers, Engineering & Science (18 | 5.5%), Architecture & Engineering (18 | 5.5%), Health Diagnosing & Treating (17 | 5.2%), Health Technologists (17 | 5.2%), and Community & Social Service (16 | 4.9%).
Management, Business, Science and Arts Occupations by Sex
Within the Management, Business, Science and Arts occupations in North Springfield, the most male-oriented occupations are Computers, Engineering & Science (100.0%), Architecture & Engineering (100.0%), and Community & Social Service (100.0%), while the most female-oriented occupations are Management (100.0%), Health Diagnosing & Treating (100.0%), and Health Technologists (100.0%).
| Occupation | Male | Female |
| Management | 0 (0.0%) | 14 (100.0%) |
| Business & Financial | 0 (0.0%) | 0 (0.0%) |
| Computers, Engineering & Science | 18 (100.0%) | 0 (0.0%) |
| Computers & Mathematics | 0 (0.0%) | 0 (0.0%) |
| Architecture & Engineering | 18 (100.0%) | 0 (0.0%) |
| Life, Physical & Social Science | 0 (0.0%) | 0 (0.0%) |
| Community & Social Service | 16 (100.0%) | 0 (0.0%) |
| Education, Arts & Media | 0 (0.0%) | 0 (0.0%) |
| Legal Services & Support | 16 (100.0%) | 0 (0.0%) |
| Education Instruction & Library | 0 (0.0%) | 0 (0.0%) |
| Arts, Media & Entertainment | 0 (0.0%) | 0 (0.0%) |
| Health Diagnosing & Treating | 0 (0.0%) | 17 (100.0%) |
| Health Technologists | 0 (0.0%) | 17 (100.0%) |
| Total (Category) | 34 (52.3%) | 31 (47.7%) |
| Total (Overall) | 184 (56.4%) | 142 (43.6%) |
Services Occupations
The most common Services occupations in North Springfield are Cleaning & Maintenance (20 | 6.1%), and Food Preparation & Serving (16 | 4.9%).
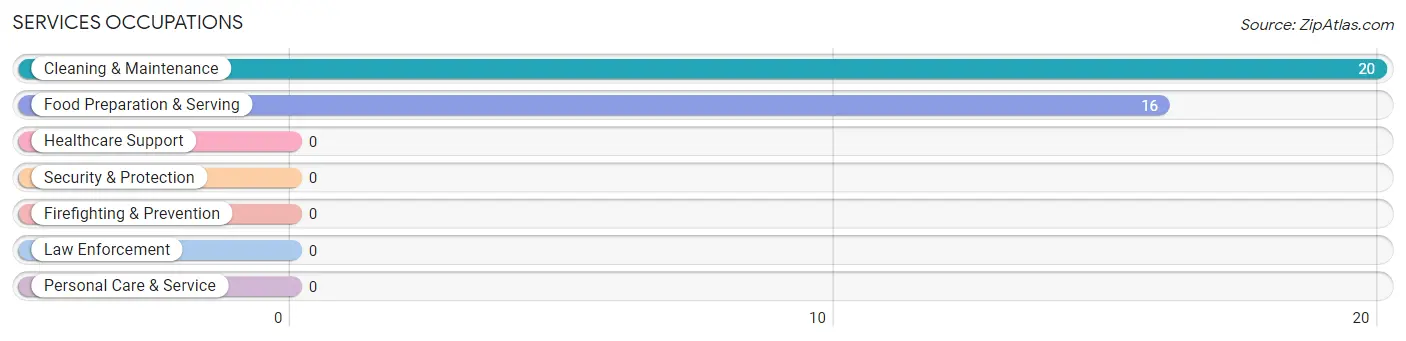
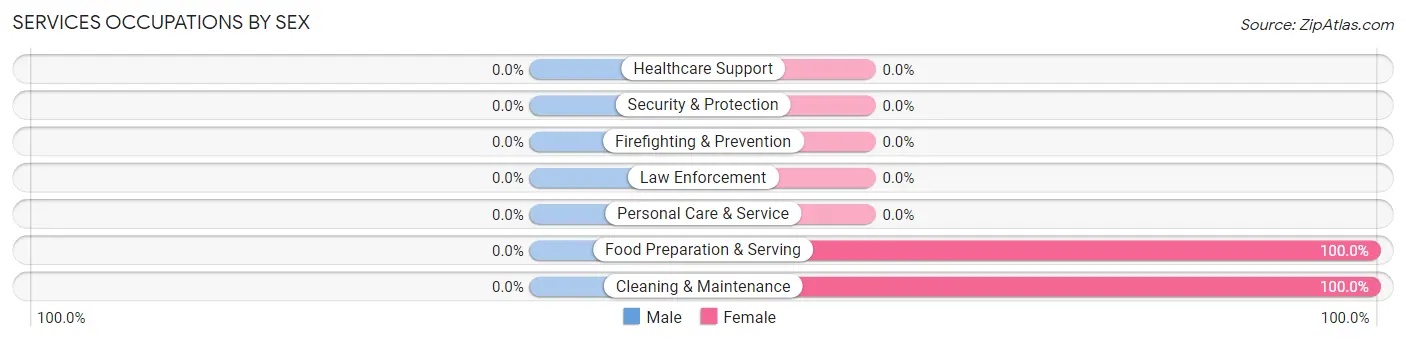
Services Occupations by Sex
| Occupation | Male | Female |
| Healthcare Support | 0 (0.0%) | 0 (0.0%) |
| Security & Protection | 0 (0.0%) | 0 (0.0%) |
| Firefighting & Prevention | 0 (0.0%) | 0 (0.0%) |
| Law Enforcement | 0 (0.0%) | 0 (0.0%) |
| Food Preparation & Serving | 0 (0.0%) | 16 (100.0%) |
| Cleaning & Maintenance | 0 (0.0%) | 20 (100.0%) |
| Personal Care & Service | 0 (0.0%) | 0 (0.0%) |
| Total (Category) | 0 (0.0%) | 36 (100.0%) |
| Total (Overall) | 184 (56.4%) | 142 (43.6%) |
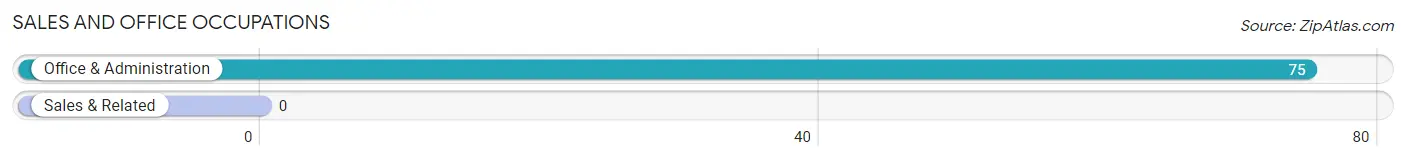
Sales and Office Occupations
The most common Sales and Office occupations in North Springfield are , and Office & Administration (75 | 23.0%).
Sales and Office Occupations by Sex
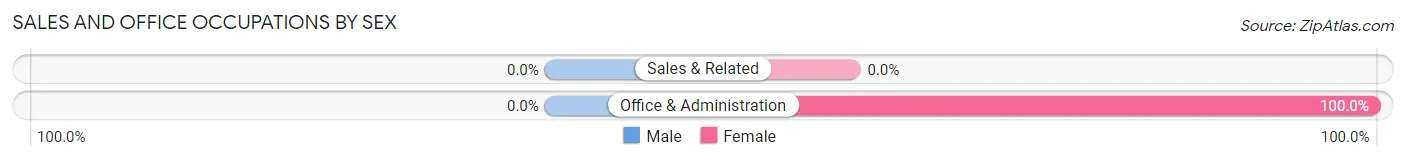
| Occupation | Male | Female |
| Sales & Related | 0 (0.0%) | 0 (0.0%) |
| Office & Administration | 0 (0.0%) | 75 (100.0%) |
| Total (Category) | 0 (0.0%) | 75 (100.0%) |
| Total (Overall) | 184 (56.4%) | 142 (43.6%) |
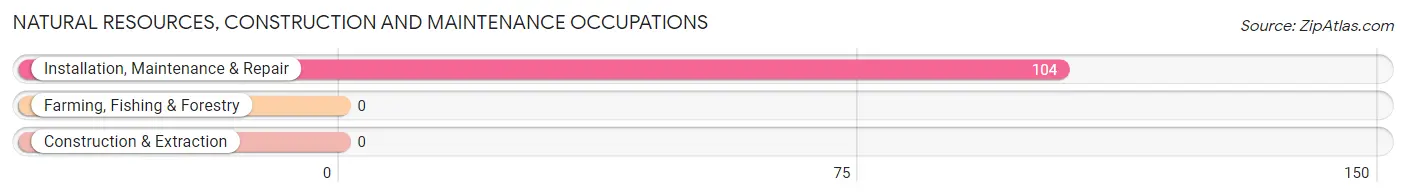
Natural Resources, Construction and Maintenance Occupations
The most common Natural Resources, Construction and Maintenance occupations in North Springfield are , and Installation, Maintenance & Repair (104 | 31.9%).
Natural Resources, Construction and Maintenance Occupations by Sex
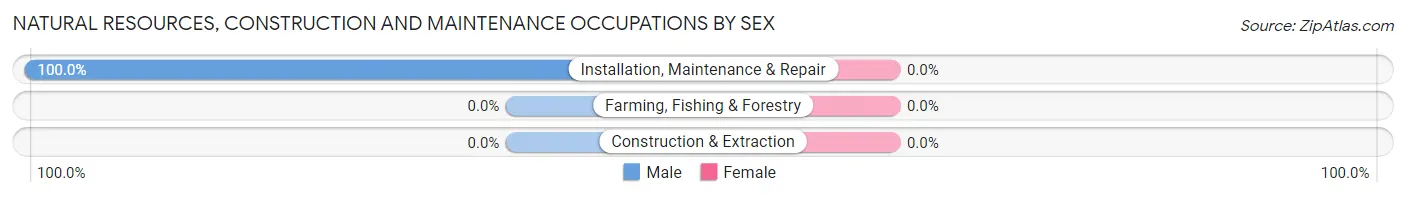
| Occupation | Male | Female |
| Farming, Fishing & Forestry | 0 (0.0%) | 0 (0.0%) |
| Construction & Extraction | 0 (0.0%) | 0 (0.0%) |
| Installation, Maintenance & Repair | 104 (100.0%) | 0 (0.0%) |
| Total (Category) | 104 (100.0%) | 0 (0.0%) |
| Total (Overall) | 184 (56.4%) | 142 (43.6%) |
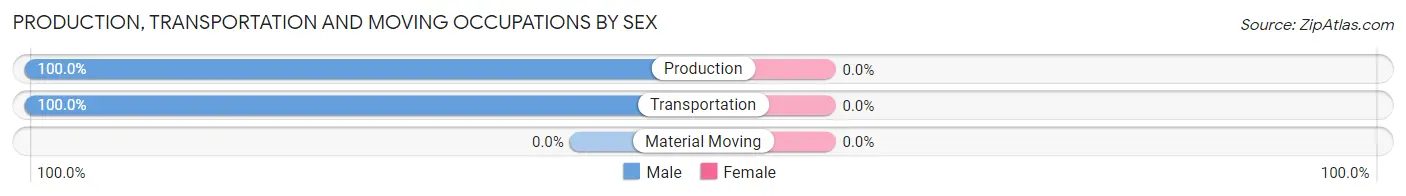
Production, Transportation and Moving Occupations
The most common Production, Transportation and Moving occupations in North Springfield are Transportation (32 | 9.8%), and Production (14 | 4.3%).
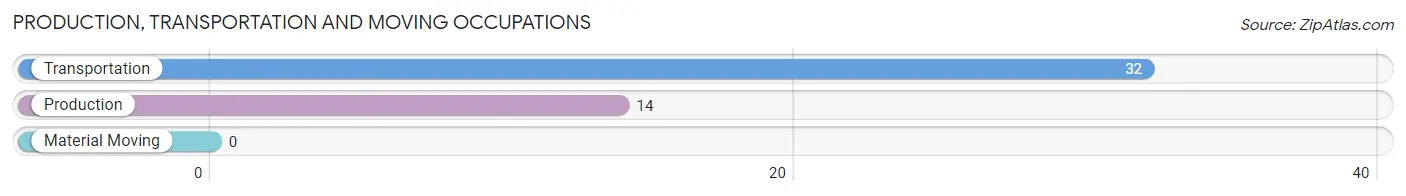
Production, Transportation and Moving Occupations by Sex
| Occupation | Male | Female |
| Production | 14 (100.0%) | 0 (0.0%) |
| Transportation | 32 (100.0%) | 0 (0.0%) |
| Material Moving | 0 (0.0%) | 0 (0.0%) |
| Total (Category) | 46 (100.0%) | 0 (0.0%) |
| Total (Overall) | 184 (56.4%) | 142 (43.6%) |
Employment Industries by Sex in North Springfield
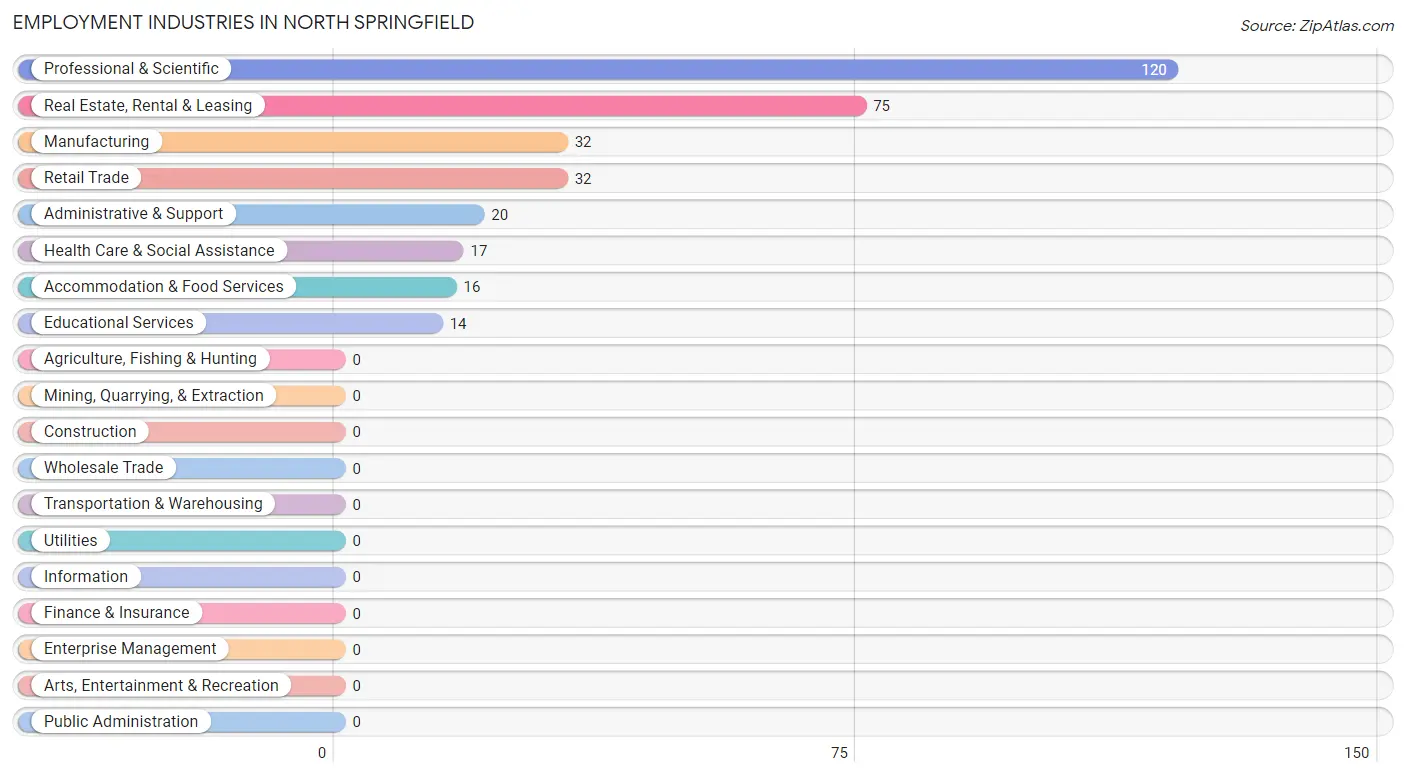
Employment Industries in North Springfield
The major employment industries in North Springfield include Professional & Scientific (120 | 36.8%), Real Estate, Rental & Leasing (75 | 23.0%), Manufacturing (32 | 9.8%), Retail Trade (32 | 9.8%), and Administrative & Support (20 | 6.1%).
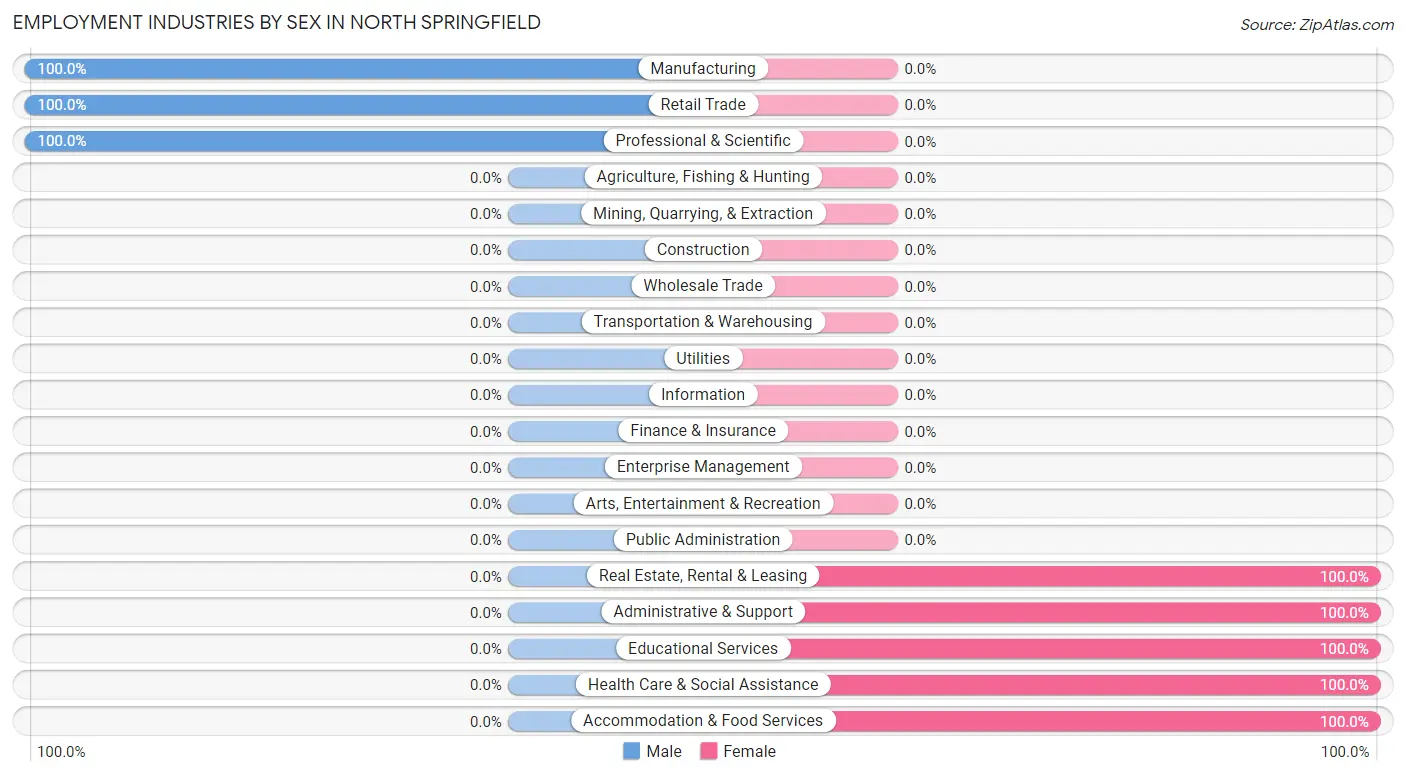
Employment Industries by Sex in North Springfield
The North Springfield industries that see more men than women are Manufacturing (100.0%), Retail Trade (100.0%), and Professional & Scientific (100.0%), whereas the industries that tend to have a higher number of women are Real Estate, Rental & Leasing (100.0%), Administrative & Support (100.0%), and Educational Services (100.0%).
| Industry | Male | Female |
| Agriculture, Fishing & Hunting | 0 (0.0%) | 0 (0.0%) |
| Mining, Quarrying, & Extraction | 0 (0.0%) | 0 (0.0%) |
| Construction | 0 (0.0%) | 0 (0.0%) |
| Manufacturing | 32 (100.0%) | 0 (0.0%) |
| Wholesale Trade | 0 (0.0%) | 0 (0.0%) |
| Retail Trade | 32 (100.0%) | 0 (0.0%) |
| Transportation & Warehousing | 0 (0.0%) | 0 (0.0%) |
| Utilities | 0 (0.0%) | 0 (0.0%) |
| Information | 0 (0.0%) | 0 (0.0%) |
| Finance & Insurance | 0 (0.0%) | 0 (0.0%) |
| Real Estate, Rental & Leasing | 0 (0.0%) | 75 (100.0%) |
| Professional & Scientific | 120 (100.0%) | 0 (0.0%) |
| Enterprise Management | 0 (0.0%) | 0 (0.0%) |
| Administrative & Support | 0 (0.0%) | 20 (100.0%) |
| Educational Services | 0 (0.0%) | 14 (100.0%) |
| Health Care & Social Assistance | 0 (0.0%) | 17 (100.0%) |
| Arts, Entertainment & Recreation | 0 (0.0%) | 0 (0.0%) |
| Accommodation & Food Services | 0 (0.0%) | 16 (100.0%) |
| Public Administration | 0 (0.0%) | 0 (0.0%) |
| Total | 184 (56.4%) | 142 (43.6%) |
Education in North Springfield
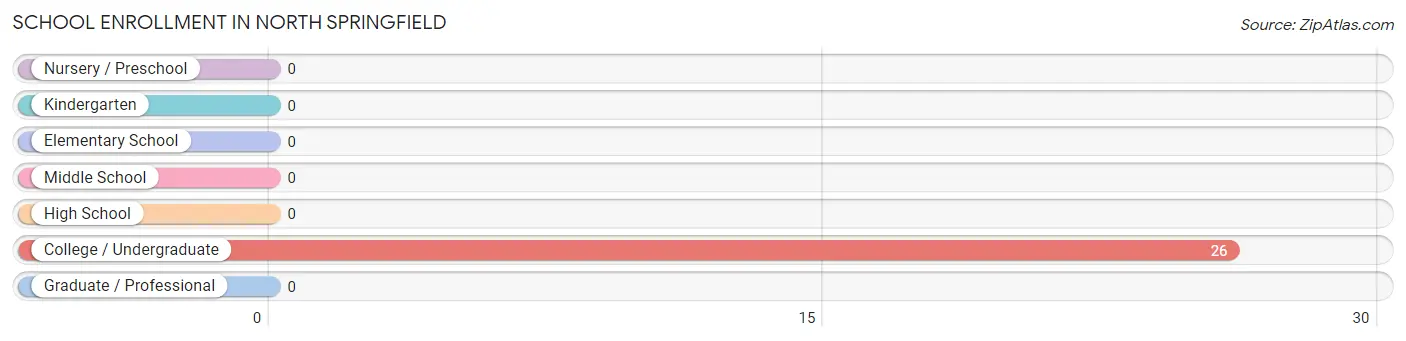
School Enrollment in North Springfield
| School Level | # Students | % Students |
| Nursery / Preschool | 0 | 0.0% |
| Kindergarten | 0 | 0.0% |
| Elementary School | 0 | 0.0% |
| Middle School | 0 | 0.0% |
| High School | 0 | 0.0% |
| College / Undergraduate | 26 | 100.0% |
| Graduate / Professional | 0 | 0.0% |
| Total | 26 | 100.0% |
School Enrollment by Age by Funding Source in North Springfield
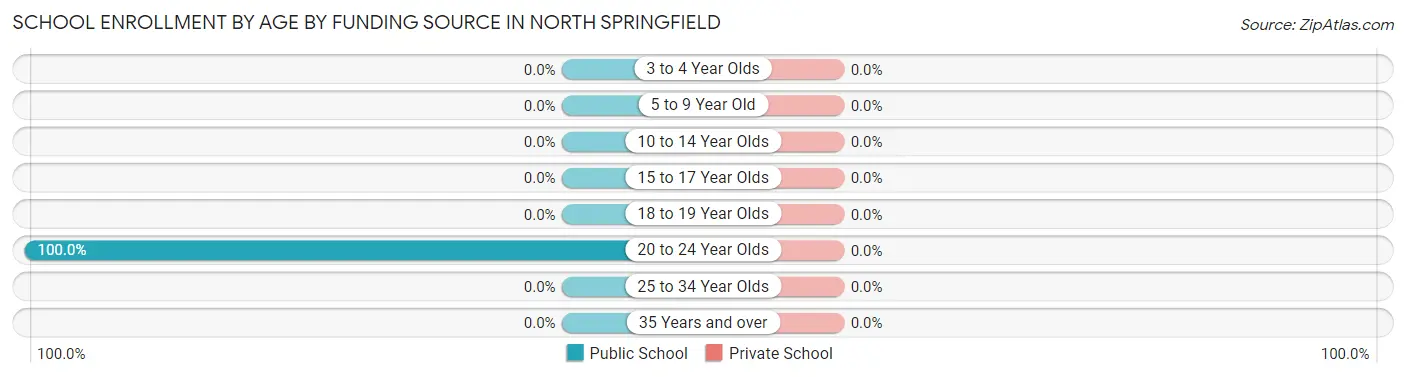
| Age Bracket | Public School | Private School |
| 3 to 4 Year Olds | 0 (0.0%) | 0 (0.0%) |
| 5 to 9 Year Old | 0 (0.0%) | 0 (0.0%) |
| 10 to 14 Year Olds | 0 (0.0%) | 0 (0.0%) |
| 15 to 17 Year Olds | 0 (0.0%) | 0 (0.0%) |
| 18 to 19 Year Olds | 0 (0.0%) | 0 (0.0%) |
| 20 to 24 Year Olds | 26 (100.0%) | 0 (0.0%) |
| 25 to 34 Year Olds | 0 (0.0%) | 0 (0.0%) |
| 35 Years and over | 0 (0.0%) | 0 (0.0%) |
| Total | 26 (100.0%) | 0 (0.0%) |
Educational Attainment by Field of Study in North Springfield
Science & technology (17 | 30.9%), psychology (16 | 29.1%), physical & health sciences (14 | 25.5%), and engineering (8 | 14.5%) are the most common fields of study among 55 individuals in North Springfield who have obtained a bachelor's degree or higher.
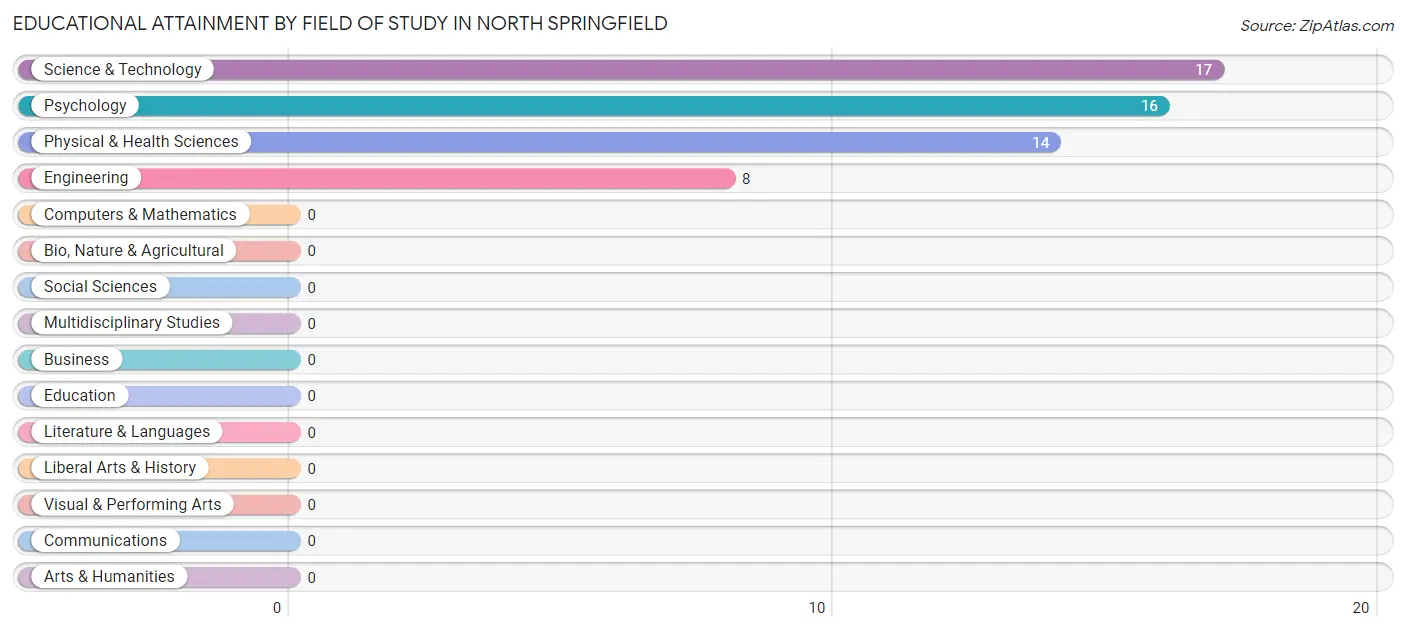
| Field of Study | # Graduates | % Graduates |
| Computers & Mathematics | 0 | 0.0% |
| Bio, Nature & Agricultural | 0 | 0.0% |
| Physical & Health Sciences | 14 | 25.5% |
| Psychology | 16 | 29.1% |
| Social Sciences | 0 | 0.0% |
| Engineering | 8 | 14.5% |
| Multidisciplinary Studies | 0 | 0.0% |
| Science & Technology | 17 | 30.9% |
| Business | 0 | 0.0% |
| Education | 0 | 0.0% |
| Literature & Languages | 0 | 0.0% |
| Liberal Arts & History | 0 | 0.0% |
| Visual & Performing Arts | 0 | 0.0% |
| Communications | 0 | 0.0% |
| Arts & Humanities | 0 | 0.0% |
| Total | 55 | 100.0% |
Transportation & Commute in North Springfield
Vehicle Availability by Sex in North Springfield
The most prevalent vehicle ownership categories in North Springfield are males with 2 vehicles (152, accounting for 82.6%) and females with 2 vehicles (122, making up 107.0%).
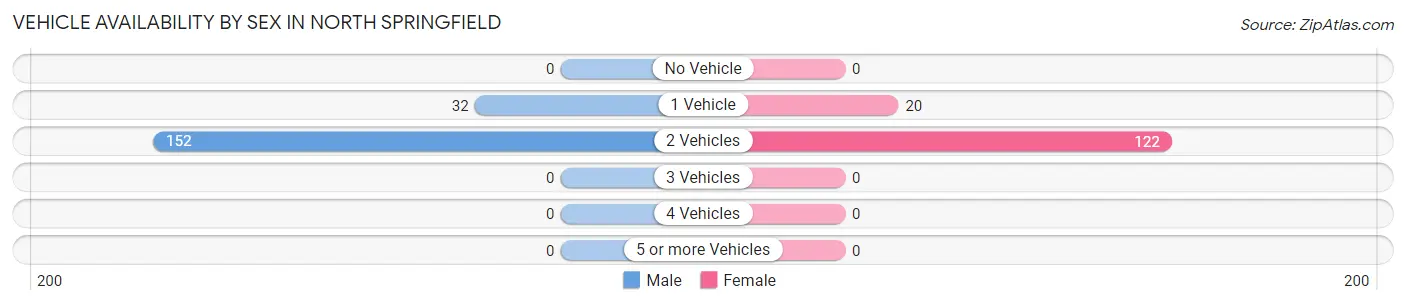
| Vehicles Available | Male | Female |
| No Vehicle | 0 (0.0%) | 0 (0.0%) |
| 1 Vehicle | 32 (17.4%) | 20 (14.1%) |
| 2 Vehicles | 152 (82.6%) | 122 (85.9%) |
| 3 Vehicles | 0 (0.0%) | 0 (0.0%) |
| 4 Vehicles | 0 (0.0%) | 0 (0.0%) |
| 5 or more Vehicles | 0 (0.0%) | 0 (0.0%) |
| Total | 184 (100.0%) | 142 (100.0%) |
Commute Time in North Springfield
The most frequently occuring commute durations in North Springfield are 10 to 14 minutes (111 commuters, 50.0%), 45 to 59 minutes (45 commuters, 20.3%), and 5 to 9 minutes (34 commuters, 15.3%).
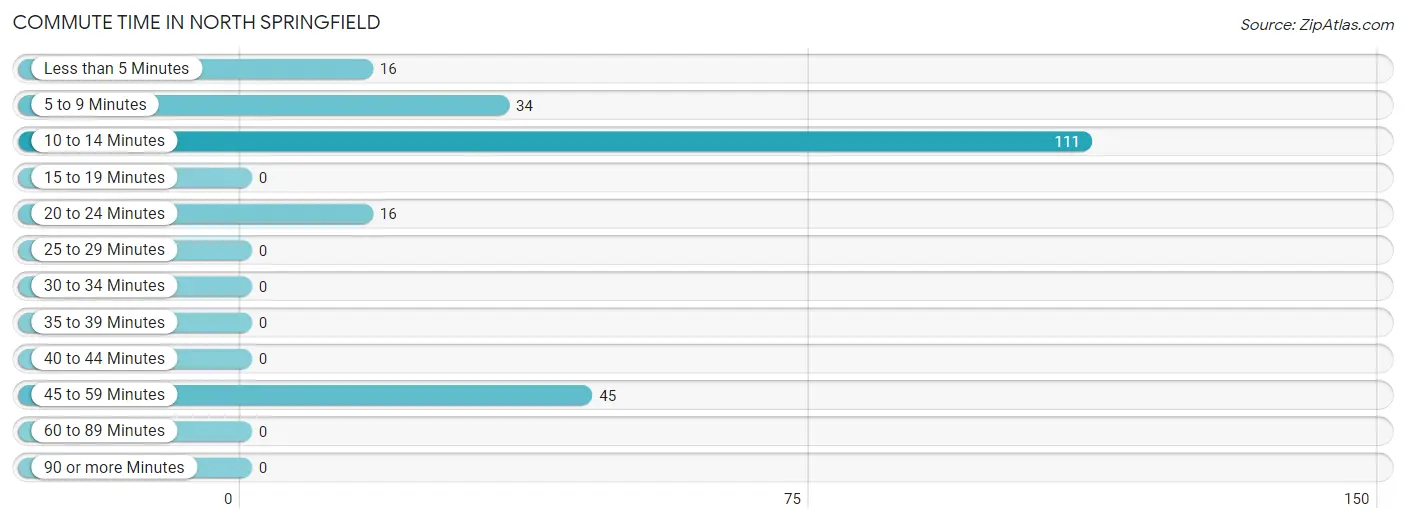
| Commute Time | # Commuters | % Commuters |
| Less than 5 Minutes | 16 | 7.2% |
| 5 to 9 Minutes | 34 | 15.3% |
| 10 to 14 Minutes | 111 | 50.0% |
| 15 to 19 Minutes | 0 | 0.0% |
| 20 to 24 Minutes | 16 | 7.2% |
| 25 to 29 Minutes | 0 | 0.0% |
| 30 to 34 Minutes | 0 | 0.0% |
| 35 to 39 Minutes | 0 | 0.0% |
| 40 to 44 Minutes | 0 | 0.0% |
| 45 to 59 Minutes | 45 | 20.3% |
| 60 to 89 Minutes | 0 | 0.0% |
| 90 or more Minutes | 0 | 0.0% |
Commute Time by Sex in North Springfield
The most common commute times in North Springfield are 5 to 9 minutes (34 commuters, 42.5%) for males and 10 to 14 minutes (95 commuters, 66.9%) for females.
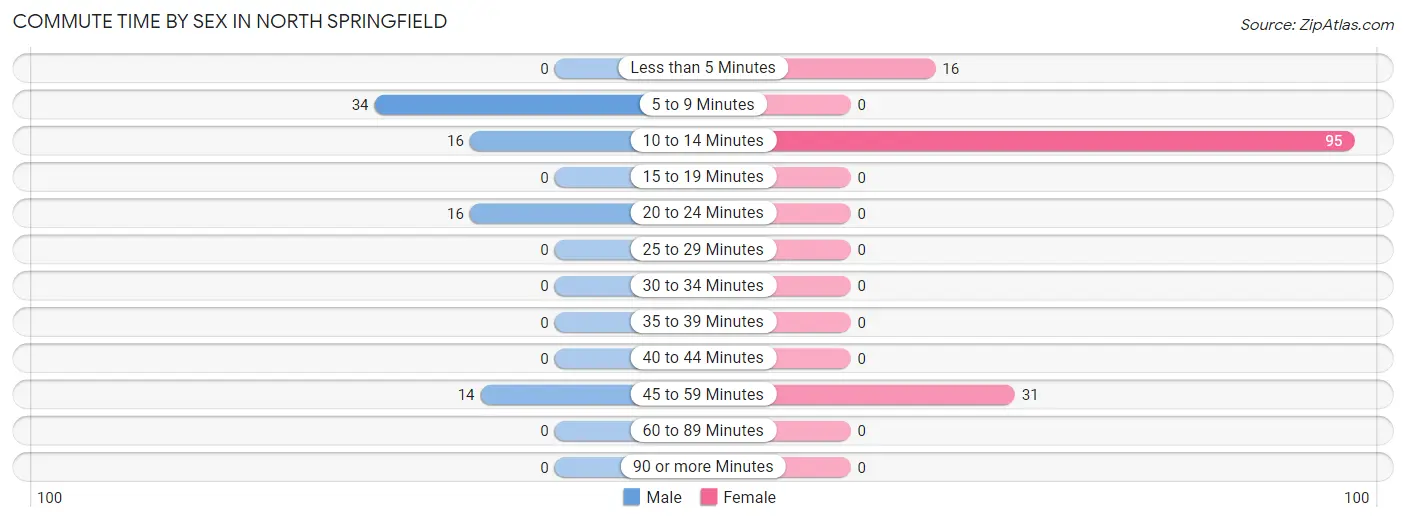
| Commute Time | Male | Female |
| Less than 5 Minutes | 0 (0.0%) | 16 (11.3%) |
| 5 to 9 Minutes | 34 (42.5%) | 0 (0.0%) |
| 10 to 14 Minutes | 16 (20.0%) | 95 (66.9%) |
| 15 to 19 Minutes | 0 (0.0%) | 0 (0.0%) |
| 20 to 24 Minutes | 16 (20.0%) | 0 (0.0%) |
| 25 to 29 Minutes | 0 (0.0%) | 0 (0.0%) |
| 30 to 34 Minutes | 0 (0.0%) | 0 (0.0%) |
| 35 to 39 Minutes | 0 (0.0%) | 0 (0.0%) |
| 40 to 44 Minutes | 0 (0.0%) | 0 (0.0%) |
| 45 to 59 Minutes | 14 (17.5%) | 31 (21.8%) |
| 60 to 89 Minutes | 0 (0.0%) | 0 (0.0%) |
| 90 or more Minutes | 0 (0.0%) | 0 (0.0%) |
Time of Departure to Work by Sex in North Springfield
The most frequent times of departure to work in North Springfield are 5:30 AM to 5:59 AM (34, 42.5%) for males and 7:30 AM to 7:59 AM (75, 52.8%) for females.
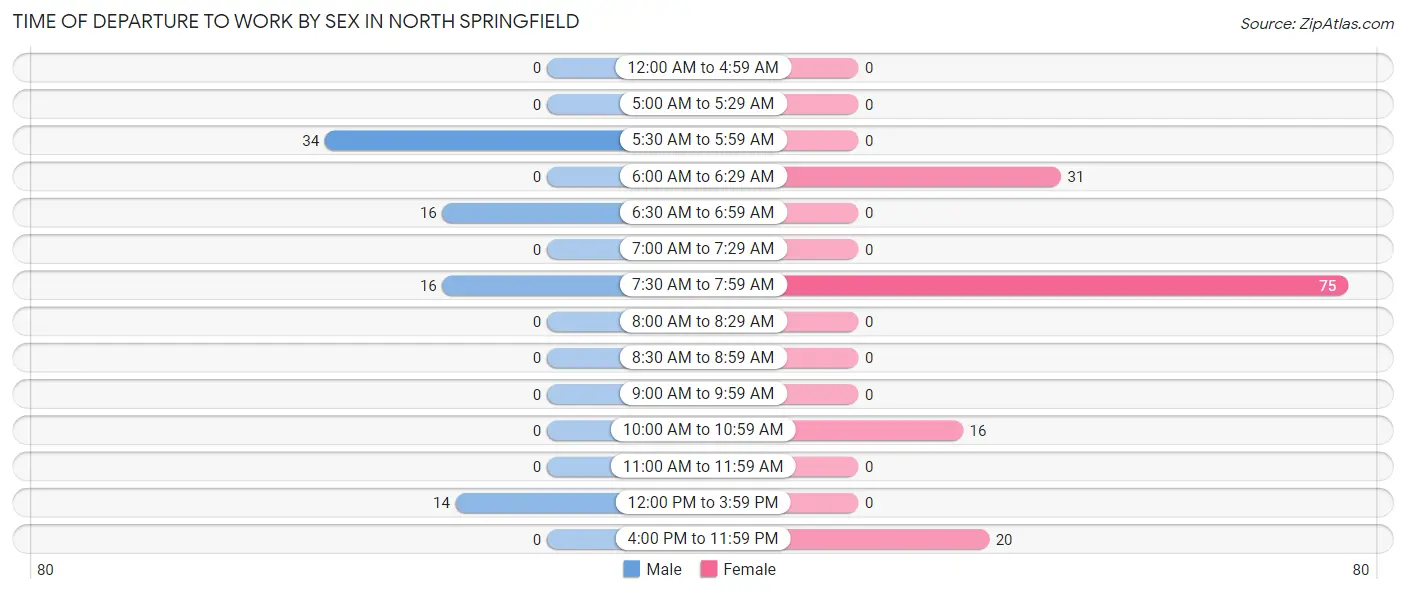
| Time of Departure | Male | Female |
| 12:00 AM to 4:59 AM | 0 (0.0%) | 0 (0.0%) |
| 5:00 AM to 5:29 AM | 0 (0.0%) | 0 (0.0%) |
| 5:30 AM to 5:59 AM | 34 (42.5%) | 0 (0.0%) |
| 6:00 AM to 6:29 AM | 0 (0.0%) | 31 (21.8%) |
| 6:30 AM to 6:59 AM | 16 (20.0%) | 0 (0.0%) |
| 7:00 AM to 7:29 AM | 0 (0.0%) | 0 (0.0%) |
| 7:30 AM to 7:59 AM | 16 (20.0%) | 75 (52.8%) |
| 8:00 AM to 8:29 AM | 0 (0.0%) | 0 (0.0%) |
| 8:30 AM to 8:59 AM | 0 (0.0%) | 0 (0.0%) |
| 9:00 AM to 9:59 AM | 0 (0.0%) | 0 (0.0%) |
| 10:00 AM to 10:59 AM | 0 (0.0%) | 16 (11.3%) |
| 11:00 AM to 11:59 AM | 0 (0.0%) | 0 (0.0%) |
| 12:00 PM to 3:59 PM | 14 (17.5%) | 0 (0.0%) |
| 4:00 PM to 11:59 PM | 0 (0.0%) | 20 (14.1%) |
| Total | 80 (100.0%) | 142 (100.0%) |
Housing Occupancy in North Springfield
Occupancy by Ownership in North Springfield
Of the total 233 dwellings in North Springfield, owner-occupied units account for 217 (93.1%), while renter-occupied units make up 16 (6.9%).
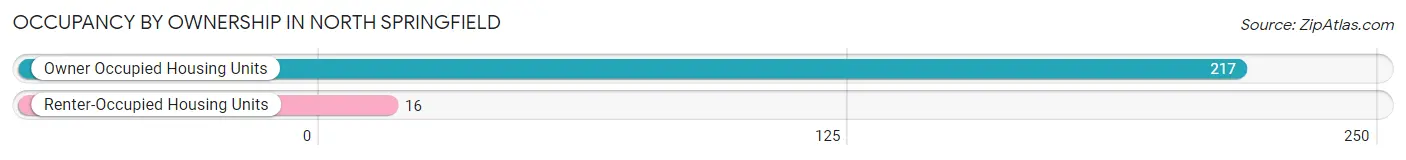
| Occupancy | # Housing Units | % Housing Units |
| Owner Occupied Housing Units | 217 | 93.1% |
| Renter-Occupied Housing Units | 16 | 6.9% |
| Total Occupied Housing Units | 233 | 100.0% |
Occupancy by Household Size in North Springfield
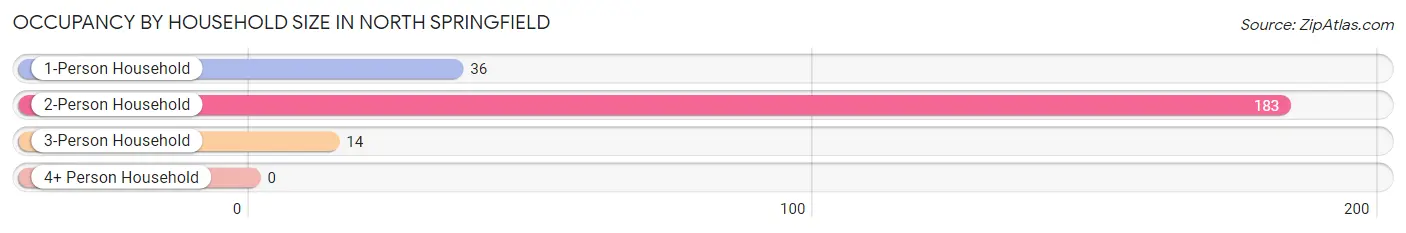
| Household Size | # Housing Units | % Housing Units |
| 1-Person Household | 36 | 15.4% |
| 2-Person Household | 183 | 78.5% |
| 3-Person Household | 14 | 6.0% |
| 4+ Person Household | 0 | 0.0% |
| Total Housing Units | 233 | 100.0% |
Occupancy by Ownership by Household Size in North Springfield
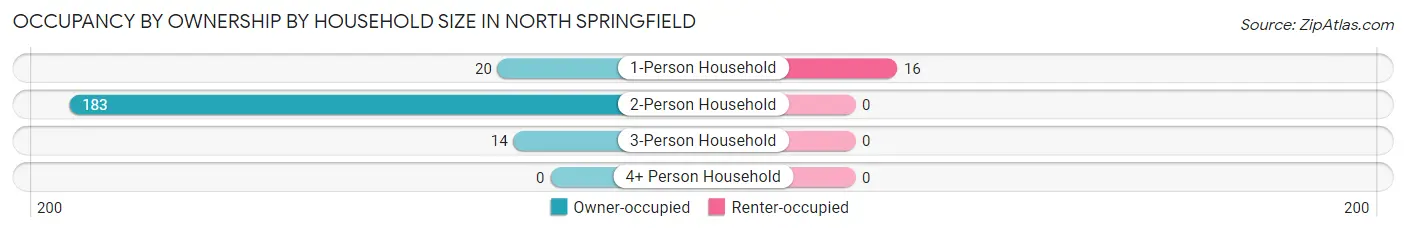
| Household Size | Owner-occupied | Renter-occupied |
| 1-Person Household | 20 (55.6%) | 16 (44.4%) |
| 2-Person Household | 183 (100.0%) | 0 (0.0%) |
| 3-Person Household | 14 (100.0%) | 0 (0.0%) |
| 4+ Person Household | 0 (0.0%) | 0 (0.0%) |
| Total Housing Units | 217 (93.1%) | 16 (6.9%) |
Occupancy by Educational Attainment in North Springfield
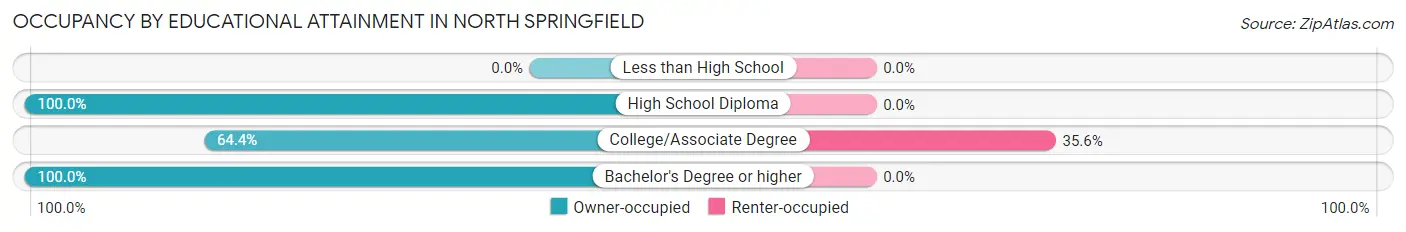
| Household Size | Owner-occupied | Renter-occupied |
| Less than High School | 0 (0.0%) | 0 (0.0%) |
| High School Diploma | 158 (100.0%) | 0 (0.0%) |
| College/Associate Degree | 29 (64.4%) | 16 (35.6%) |
| Bachelor's Degree or higher | 30 (100.0%) | 0 (0.0%) |
Occupancy by Age of Householder in North Springfield
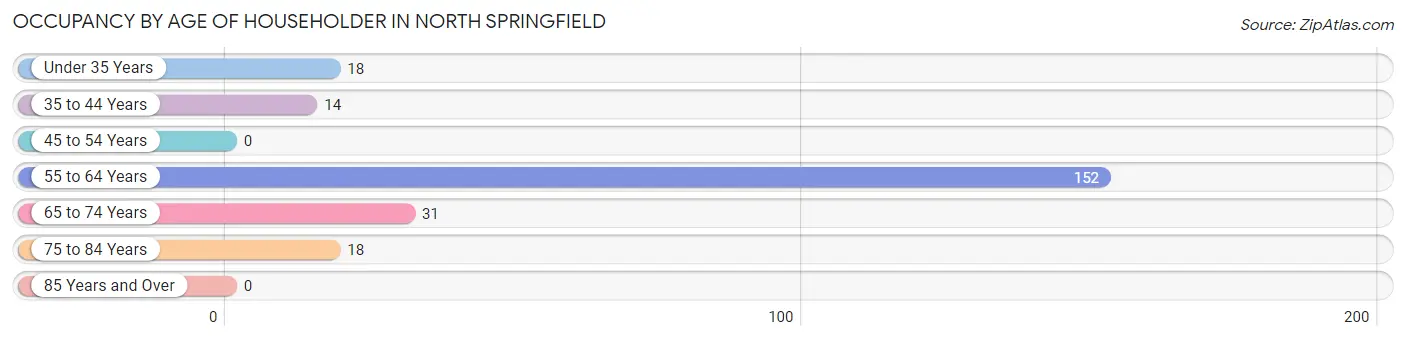
| Age Bracket | # Households | % Households |
| Under 35 Years | 18 | 7.7% |
| 35 to 44 Years | 14 | 6.0% |
| 45 to 54 Years | 0 | 0.0% |
| 55 to 64 Years | 152 | 65.2% |
| 65 to 74 Years | 31 | 13.3% |
| 75 to 84 Years | 18 | 7.7% |
| 85 Years and Over | 0 | 0.0% |
| Total | 233 | 100.0% |
Housing Finances in North Springfield
Median Income by Occupancy in North Springfield
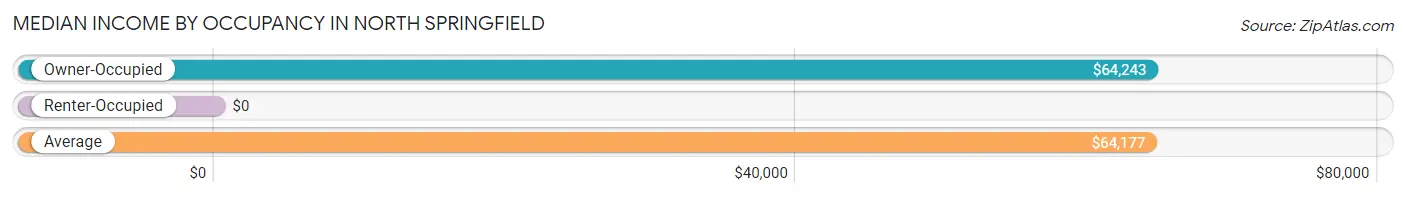
| Occupancy Type | # Households | Median Income |
| Owner-Occupied | 217 (93.1%) | $64,243 |
| Renter-Occupied | 16 (6.9%) | $0 |
| Average | 233 (100.0%) | $64,177 |
Occupancy by Householder Income Bracket in North Springfield
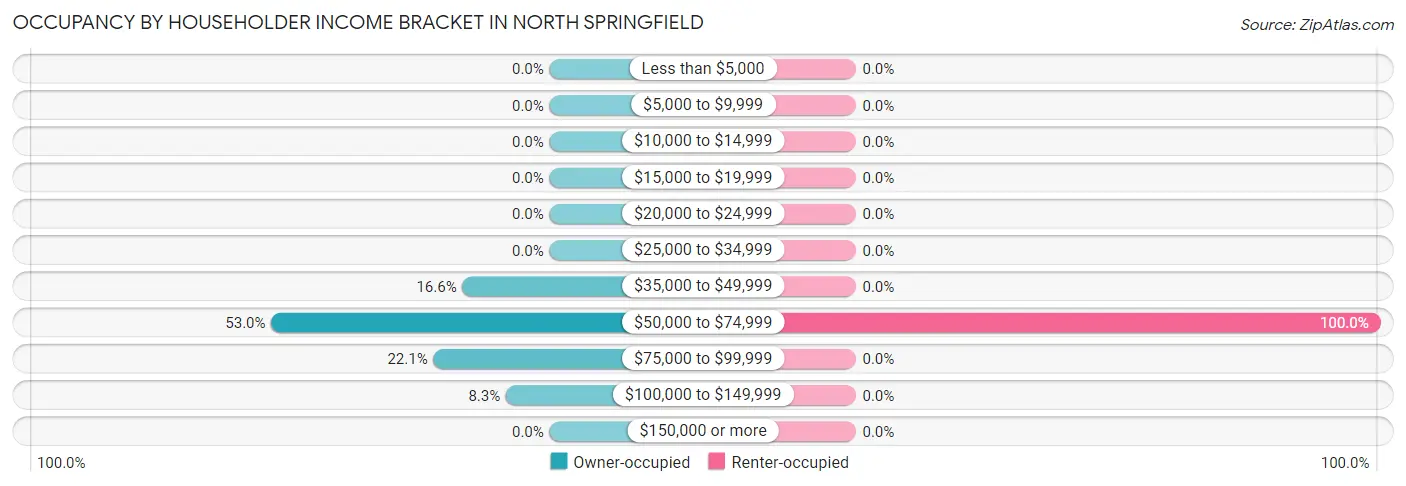
| Income Bracket | Owner-occupied | Renter-occupied |
| Less than $5,000 | 0 (0.0%) | 0 (0.0%) |
| $5,000 to $9,999 | 0 (0.0%) | 0 (0.0%) |
| $10,000 to $14,999 | 0 (0.0%) | 0 (0.0%) |
| $15,000 to $19,999 | 0 (0.0%) | 0 (0.0%) |
| $20,000 to $24,999 | 0 (0.0%) | 0 (0.0%) |
| $25,000 to $34,999 | 0 (0.0%) | 0 (0.0%) |
| $35,000 to $49,999 | 36 (16.6%) | 0 (0.0%) |
| $50,000 to $74,999 | 115 (53.0%) | 16 (100.0%) |
| $75,000 to $99,999 | 48 (22.1%) | 0 (0.0%) |
| $100,000 to $149,999 | 18 (8.3%) | 0 (0.0%) |
| $150,000 or more | 0 (0.0%) | 0 (0.0%) |
| Total | 217 (100.0%) | 16 (100.0%) |
Monthly Housing Cost Tiers in North Springfield
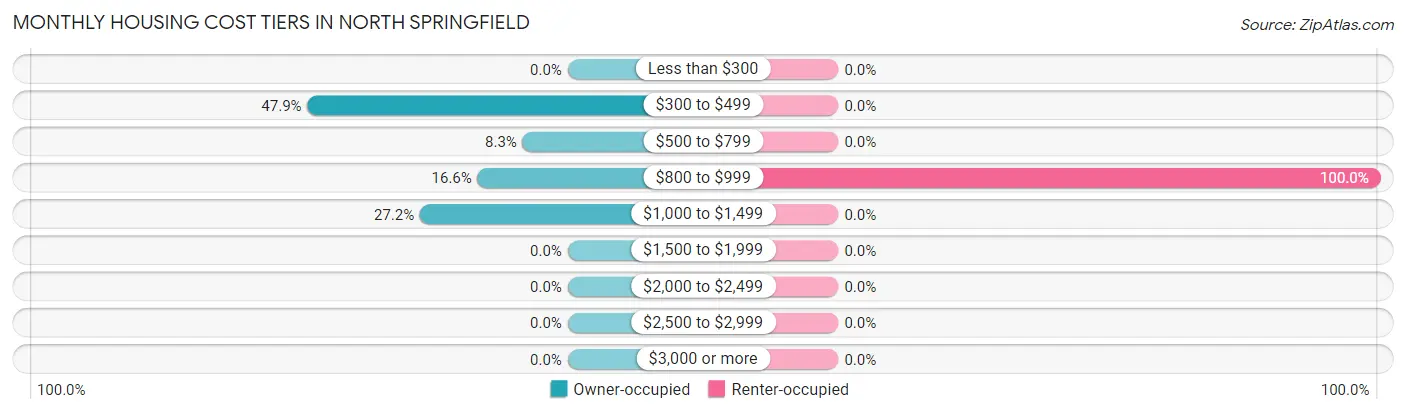
| Monthly Cost | Owner-occupied | Renter-occupied |
| Less than $300 | 0 (0.0%) | 0 (0.0%) |
| $300 to $499 | 104 (47.9%) | 0 (0.0%) |
| $500 to $799 | 18 (8.3%) | 0 (0.0%) |
| $800 to $999 | 36 (16.6%) | 16 (100.0%) |
| $1,000 to $1,499 | 59 (27.2%) | 0 (0.0%) |
| $1,500 to $1,999 | 0 (0.0%) | 0 (0.0%) |
| $2,000 to $2,499 | 0 (0.0%) | 0 (0.0%) |
| $2,500 to $2,999 | 0 (0.0%) | 0 (0.0%) |
| $3,000 or more | 0 (0.0%) | 0 (0.0%) |
| Total | 217 (100.0%) | 16 (100.0%) |
Physical Housing Characteristics in North Springfield
Housing Structures in North Springfield
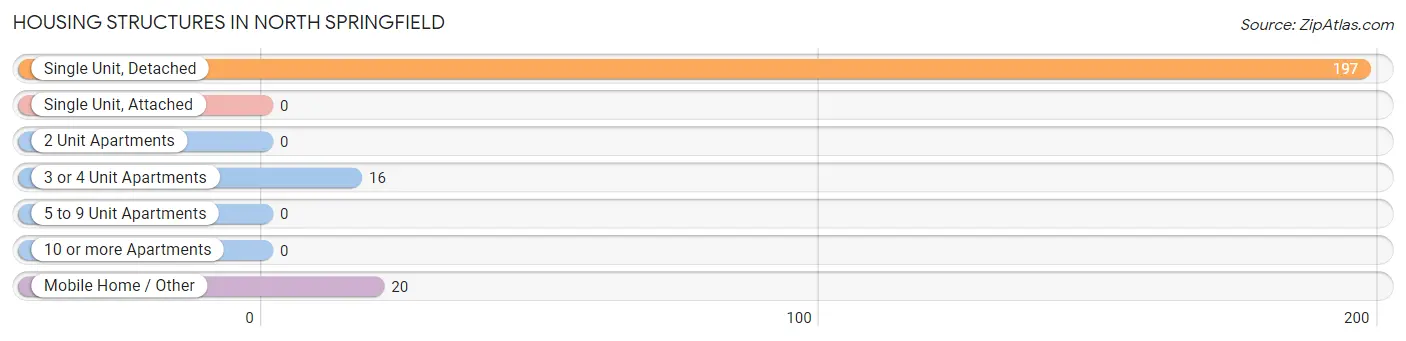
| Structure Type | # Housing Units | % Housing Units |
| Single Unit, Detached | 197 | 84.6% |
| Single Unit, Attached | 0 | 0.0% |
| 2 Unit Apartments | 0 | 0.0% |
| 3 or 4 Unit Apartments | 16 | 6.9% |
| 5 to 9 Unit Apartments | 0 | 0.0% |
| 10 or more Apartments | 0 | 0.0% |
| Mobile Home / Other | 20 | 8.6% |
| Total | 233 | 100.0% |
Housing Structures by Occupancy in North Springfield
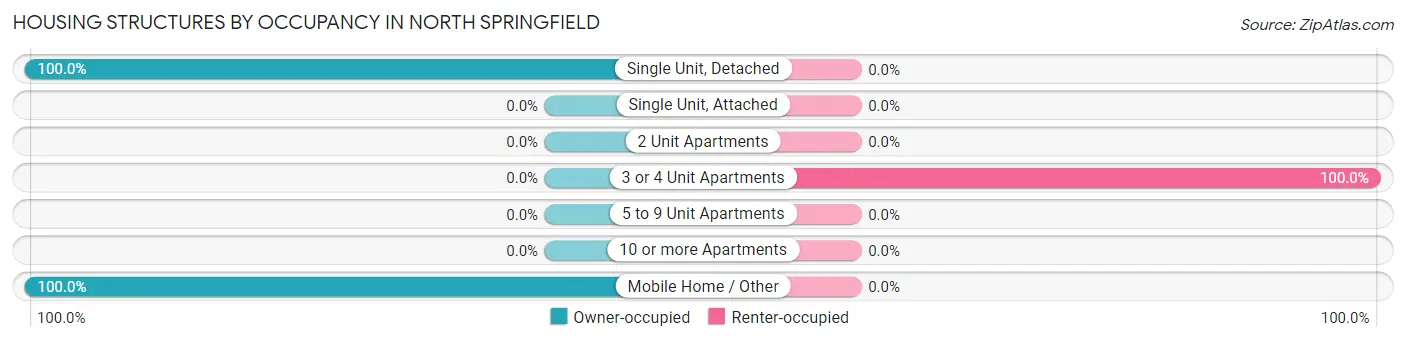
| Structure Type | Owner-occupied | Renter-occupied |
| Single Unit, Detached | 197 (100.0%) | 0 (0.0%) |
| Single Unit, Attached | 0 (0.0%) | 0 (0.0%) |
| 2 Unit Apartments | 0 (0.0%) | 0 (0.0%) |
| 3 or 4 Unit Apartments | 0 (0.0%) | 16 (100.0%) |
| 5 to 9 Unit Apartments | 0 (0.0%) | 0 (0.0%) |
| 10 or more Apartments | 0 (0.0%) | 0 (0.0%) |
| Mobile Home / Other | 20 (100.0%) | 0 (0.0%) |
| Total | 217 (93.1%) | 16 (6.9%) |
Housing Structures by Number of Rooms in North Springfield
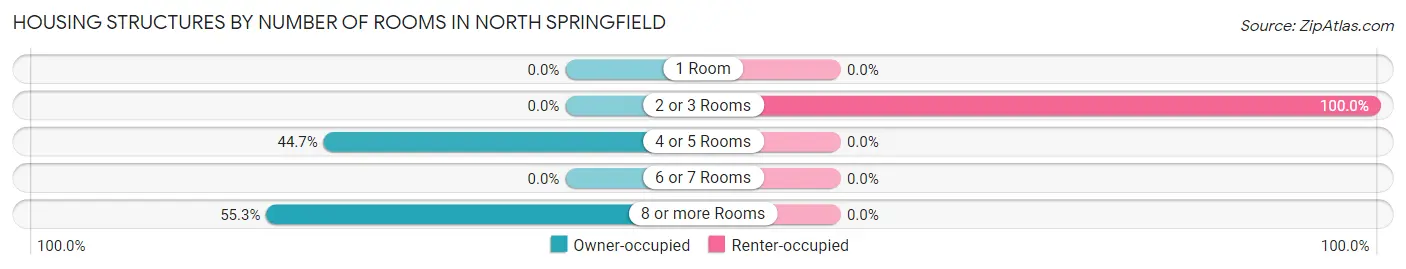
| Number of Rooms | Owner-occupied | Renter-occupied |
| 1 Room | 0 (0.0%) | 0 (0.0%) |
| 2 or 3 Rooms | 0 (0.0%) | 16 (100.0%) |
| 4 or 5 Rooms | 97 (44.7%) | 0 (0.0%) |
| 6 or 7 Rooms | 0 (0.0%) | 0 (0.0%) |
| 8 or more Rooms | 120 (55.3%) | 0 (0.0%) |
| Total | 217 (100.0%) | 16 (100.0%) |
Housing Structure by Heating Type in North Springfield
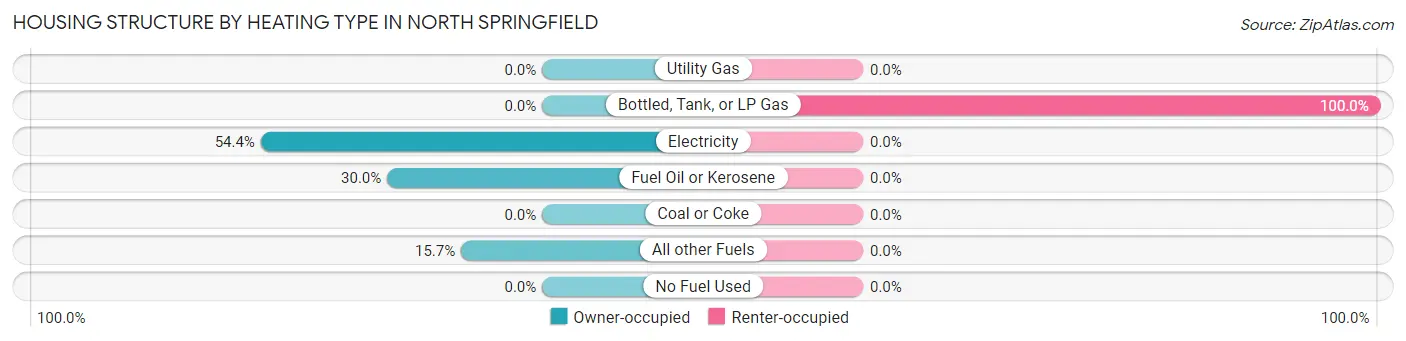
| Heating Type | Owner-occupied | Renter-occupied |
| Utility Gas | 0 (0.0%) | 0 (0.0%) |
| Bottled, Tank, or LP Gas | 0 (0.0%) | 16 (100.0%) |
| Electricity | 118 (54.4%) | 0 (0.0%) |
| Fuel Oil or Kerosene | 65 (29.9%) | 0 (0.0%) |
| Coal or Coke | 0 (0.0%) | 0 (0.0%) |
| All other Fuels | 34 (15.7%) | 0 (0.0%) |
| No Fuel Used | 0 (0.0%) | 0 (0.0%) |
| Total | 217 (100.0%) | 16 (100.0%) |
Household Vehicle Usage in North Springfield
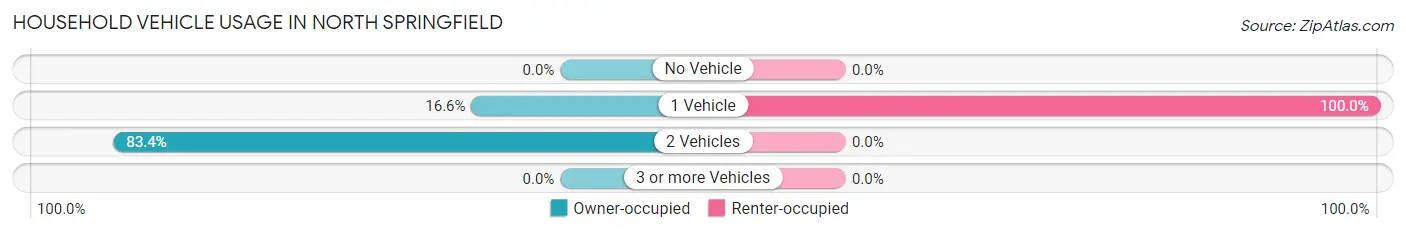
| Vehicles per Household | Owner-occupied | Renter-occupied |
| No Vehicle | 0 (0.0%) | 0 (0.0%) |
| 1 Vehicle | 36 (16.6%) | 16 (100.0%) |
| 2 Vehicles | 181 (83.4%) | 0 (0.0%) |
| 3 or more Vehicles | 0 (0.0%) | 0 (0.0%) |
| Total | 217 (100.0%) | 16 (100.0%) |
Real Estate & Mortgages in North Springfield
Real Estate and Mortgage Overview in North Springfield
| Characteristic | Without Mortgage | With Mortgage |
| Housing Units | 149 | 68 |
| Median Property Value | $164,100 | $121,900 |
| Median Household Income | $64,291 | $0 |
| Monthly Housing Costs | $472 | $0 |
| Real Estate Taxes | $3,563 | $0 |
Property Value by Mortgage Status in North Springfield
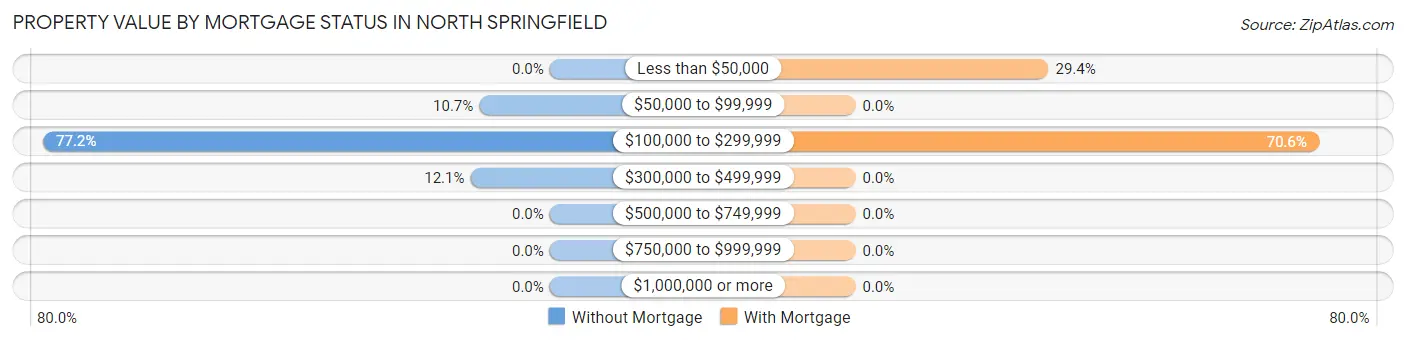
| Property Value | Without Mortgage | With Mortgage |
| Less than $50,000 | 0 (0.0%) | 20 (29.4%) |
| $50,000 to $99,999 | 16 (10.7%) | 0 (0.0%) |
| $100,000 to $299,999 | 115 (77.2%) | 48 (70.6%) |
| $300,000 to $499,999 | 18 (12.1%) | 0 (0.0%) |
| $500,000 to $749,999 | 0 (0.0%) | 0 (0.0%) |
| $750,000 to $999,999 | 0 (0.0%) | 0 (0.0%) |
| $1,000,000 or more | 0 (0.0%) | 0 (0.0%) |
| Total | 149 (100.0%) | 68 (100.0%) |
Household Income by Mortgage Status in North Springfield
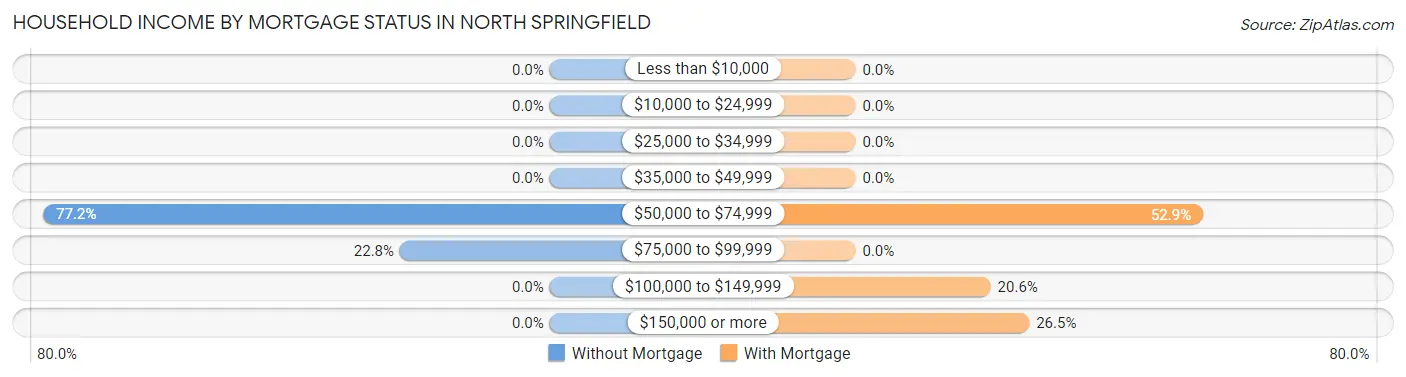
| Household Income | Without Mortgage | With Mortgage |
| Less than $10,000 | 0 (0.0%) | 0 (0.0%) |
| $10,000 to $24,999 | 0 (0.0%) | 0 (0.0%) |
| $25,000 to $34,999 | 0 (0.0%) | 0 (0.0%) |
| $35,000 to $49,999 | 0 (0.0%) | 0 (0.0%) |
| $50,000 to $74,999 | 115 (77.2%) | 36 (52.9%) |
| $75,000 to $99,999 | 34 (22.8%) | 0 (0.0%) |
| $100,000 to $149,999 | 0 (0.0%) | 14 (20.6%) |
| $150,000 or more | 0 (0.0%) | 18 (26.5%) |
| Total | 149 (100.0%) | 68 (100.0%) |
Property Value to Household Income Ratio in North Springfield
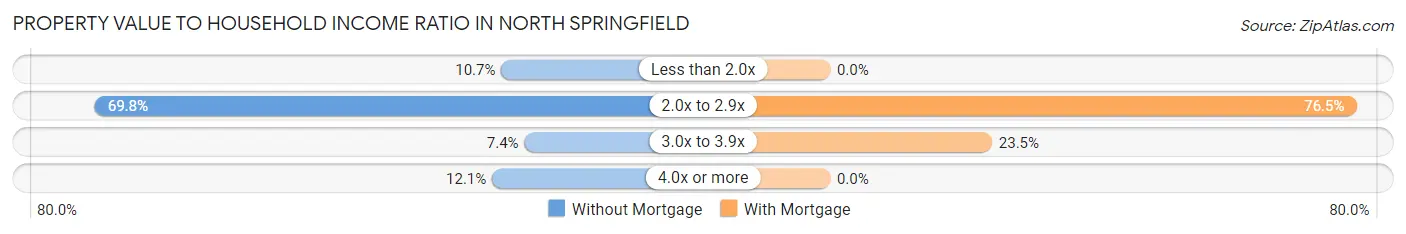
| Value-to-Income Ratio | Without Mortgage | With Mortgage |
| Less than 2.0x | 16 (10.7%) | 0 (0.0%) |
| 2.0x to 2.9x | 104 (69.8%) | 52 (76.5%) |
| 3.0x to 3.9x | 11 (7.4%) | 16 (23.5%) |
| 4.0x or more | 18 (12.1%) | 0 (0.0%) |
| Total | 149 (100.0%) | 68 (100.0%) |
Real Estate Taxes by Mortgage Status in North Springfield
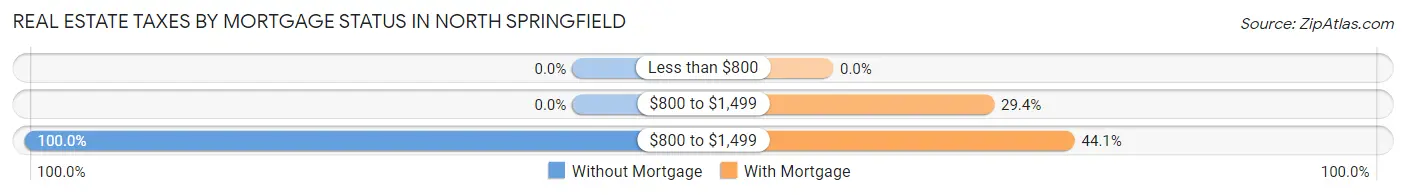
| Property Taxes | Without Mortgage | With Mortgage |
| Less than $800 | 0 (0.0%) | 0 (0.0%) |
| $800 to $1,499 | 0 (0.0%) | 20 (29.4%) |
| $800 to $1,499 | 149 (100.0%) | 30 (44.1%) |
| Total | 149 (100.0%) | 68 (100.0%) |
Health & Disability in North Springfield
Health Insurance Coverage by Age in North Springfield
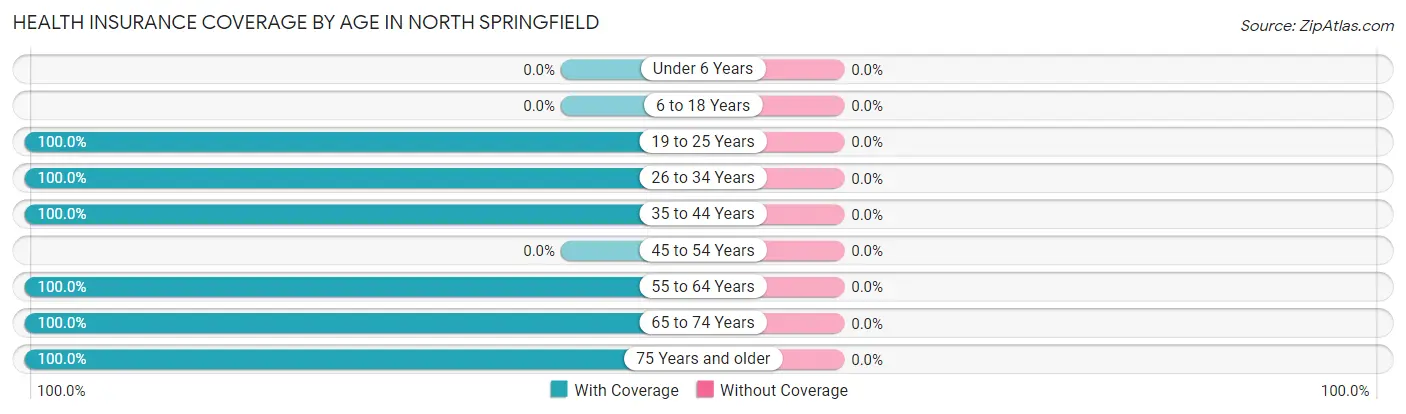
| Age Bracket | With Coverage | Without Coverage |
| Under 6 Years | 0 (0.0%) | 0 (0.0%) |
| 6 to 18 Years | 0 (0.0%) | 0 (0.0%) |
| 19 to 25 Years | 26 (100.0%) | 0 (0.0%) |
| 26 to 34 Years | 35 (100.0%) | 0 (0.0%) |
| 35 to 44 Years | 30 (100.0%) | 0 (0.0%) |
| 45 to 54 Years | 0 (0.0%) | 0 (0.0%) |
| 55 to 64 Years | 167 (100.0%) | 0 (0.0%) |
| 65 to 74 Years | 106 (100.0%) | 0 (0.0%) |
| 75 Years and older | 55 (100.0%) | 0 (0.0%) |
| Total | 419 (100.0%) | 0 (0.0%) |
Health Insurance Coverage by Citizenship Status in North Springfield
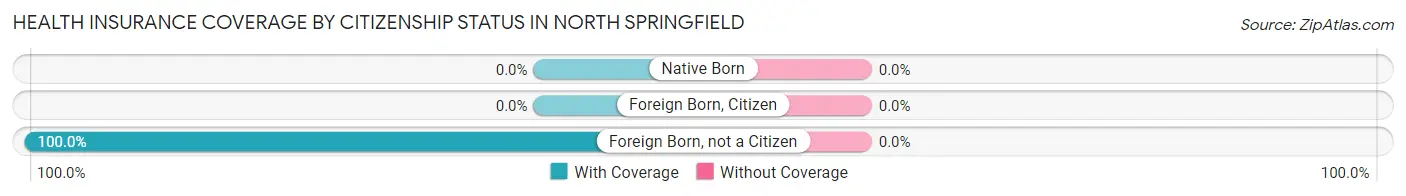
| Citizenship Status | With Coverage | Without Coverage |
| Native Born | 0 (0.0%) | 0 (0.0%) |
| Foreign Born, Citizen | 0 (0.0%) | 0 (0.0%) |
| Foreign Born, not a Citizen | 26 (100.0%) | 0 (0.0%) |
Health Insurance Coverage by Household Income in North Springfield
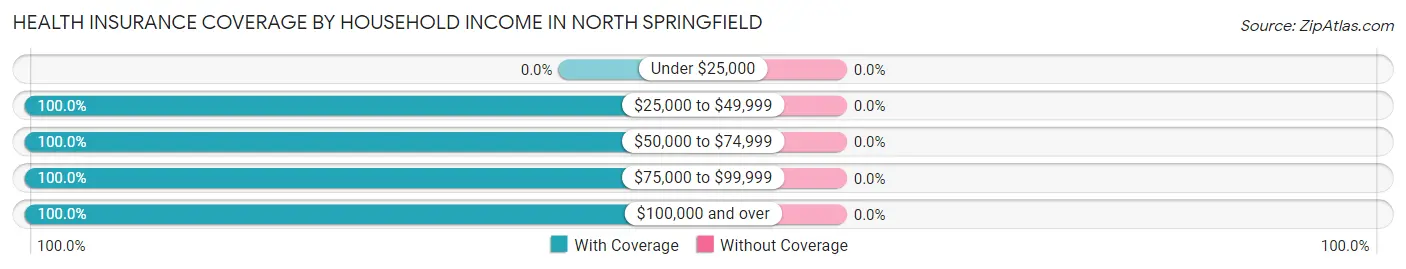
| Household Income | With Coverage | Without Coverage |
| Under $25,000 | 0 (0.0%) | 0 (0.0%) |
| $25,000 to $49,999 | 51 (100.0%) | 0 (0.0%) |
| $50,000 to $74,999 | 214 (100.0%) | 0 (0.0%) |
| $75,000 to $99,999 | 119 (100.0%) | 0 (0.0%) |
| $100,000 and over | 35 (100.0%) | 0 (0.0%) |
Public vs Private Health Insurance Coverage by Age in North Springfield
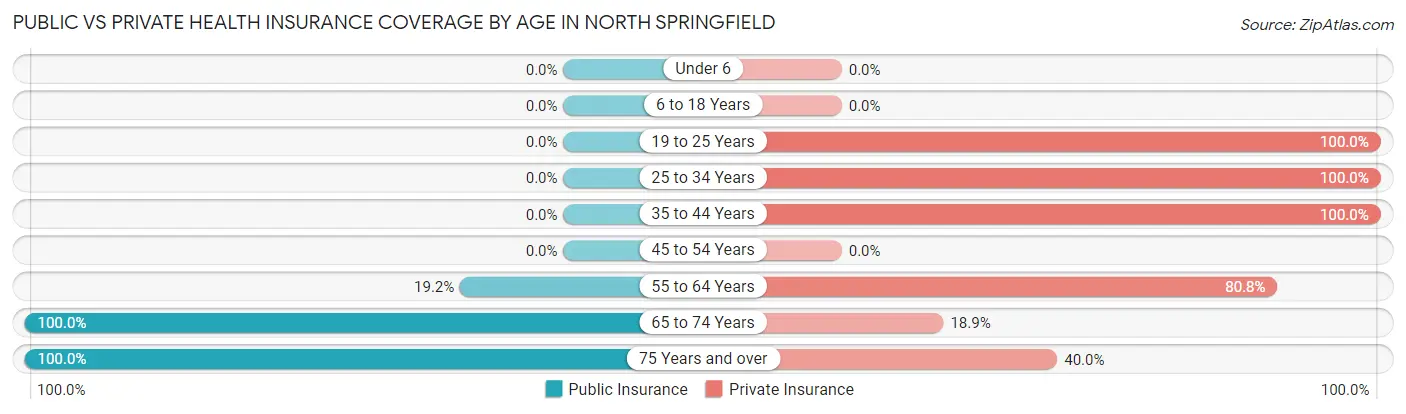
| Age Bracket | Public Insurance | Private Insurance |
| Under 6 | 0 (0.0%) | 0 (0.0%) |
| 6 to 18 Years | 0 (0.0%) | 0 (0.0%) |
| 19 to 25 Years | 0 (0.0%) | 26 (100.0%) |
| 25 to 34 Years | 0 (0.0%) | 35 (100.0%) |
| 35 to 44 Years | 0 (0.0%) | 30 (100.0%) |
| 45 to 54 Years | 0 (0.0%) | 0 (0.0%) |
| 55 to 64 Years | 32 (19.2%) | 135 (80.8%) |
| 65 to 74 Years | 106 (100.0%) | 20 (18.9%) |
| 75 Years and over | 55 (100.0%) | 22 (40.0%) |
| Total | 193 (46.1%) | 268 (64.0%) |
Disability Status by Sex by Age in North Springfield
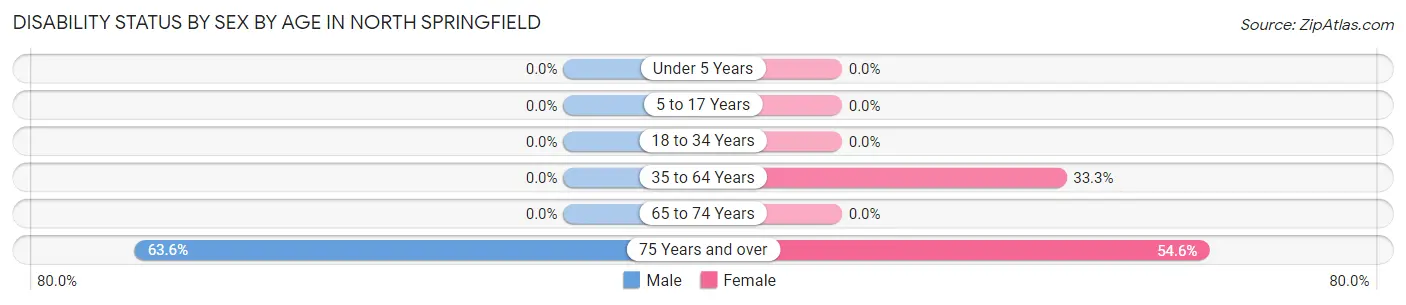
| Age Bracket | Male | Female |
| Under 5 Years | 0 (0.0%) | 0 (0.0%) |
| 5 to 17 Years | 0 (0.0%) | 0 (0.0%) |
| 18 to 34 Years | 0 (0.0%) | 0 (0.0%) |
| 35 to 64 Years | 0 (0.0%) | 15 (33.3%) |
| 65 to 74 Years | 0 (0.0%) | 0 (0.0%) |
| 75 Years and over | 14 (63.6%) | 18 (54.5%) |
Disability Class by Sex by Age in North Springfield
Disability Class: Hearing Difficulty
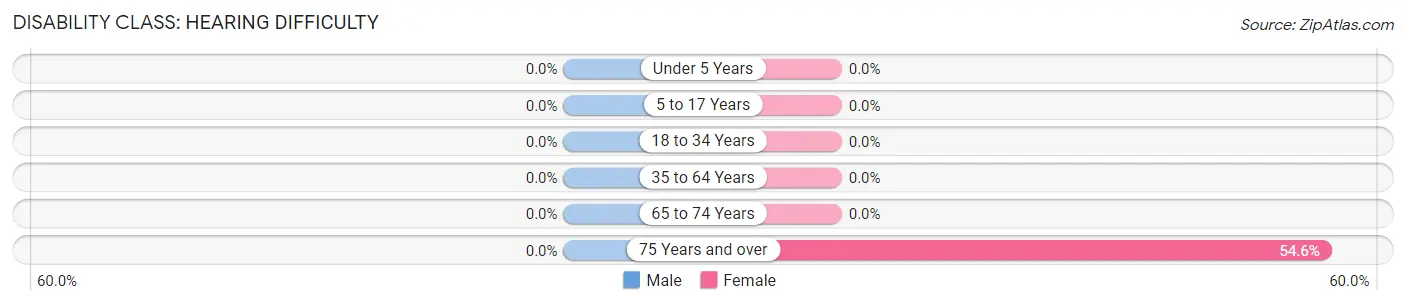
| Age Bracket | Male | Female |
| Under 5 Years | 0 (0.0%) | 0 (0.0%) |
| 5 to 17 Years | 0 (0.0%) | 0 (0.0%) |
| 18 to 34 Years | 0 (0.0%) | 0 (0.0%) |
| 35 to 64 Years | 0 (0.0%) | 0 (0.0%) |
| 65 to 74 Years | 0 (0.0%) | 0 (0.0%) |
| 75 Years and over | 0 (0.0%) | 18 (54.5%) |
Disability Class: Vision Difficulty
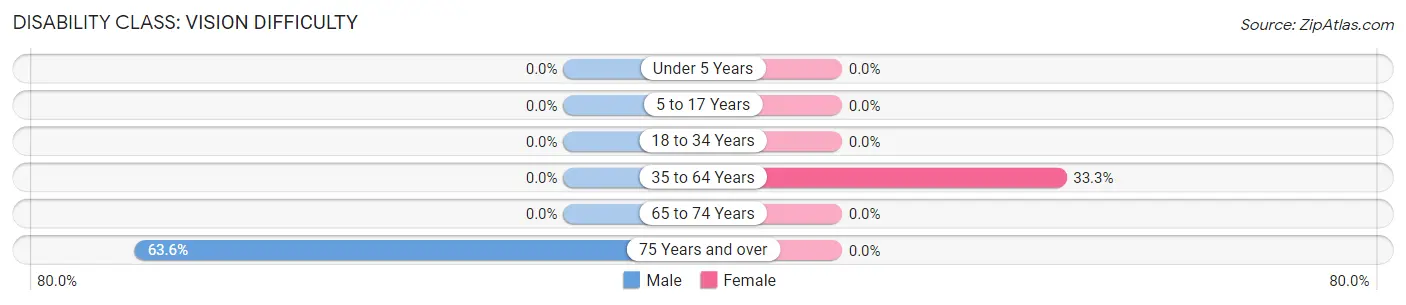
| Age Bracket | Male | Female |
| Under 5 Years | 0 (0.0%) | 0 (0.0%) |
| 5 to 17 Years | 0 (0.0%) | 0 (0.0%) |
| 18 to 34 Years | 0 (0.0%) | 0 (0.0%) |
| 35 to 64 Years | 0 (0.0%) | 15 (33.3%) |
| 65 to 74 Years | 0 (0.0%) | 0 (0.0%) |
| 75 Years and over | 14 (63.6%) | 0 (0.0%) |
Disability Class: Cognitive Difficulty
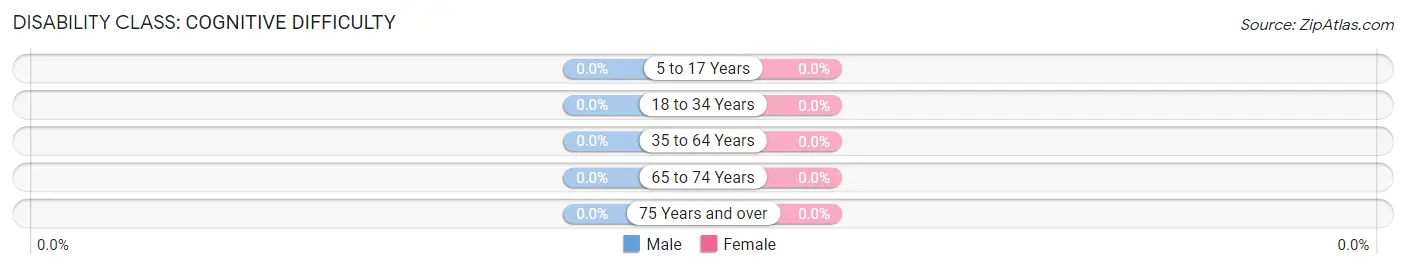
| Age Bracket | Male | Female |
| 5 to 17 Years | 0 (0.0%) | 0 (0.0%) |
| 18 to 34 Years | 0 (0.0%) | 0 (0.0%) |
| 35 to 64 Years | 0 (0.0%) | 0 (0.0%) |
| 65 to 74 Years | 0 (0.0%) | 0 (0.0%) |
| 75 Years and over | 0 (0.0%) | 0 (0.0%) |
Disability Class: Ambulatory Difficulty
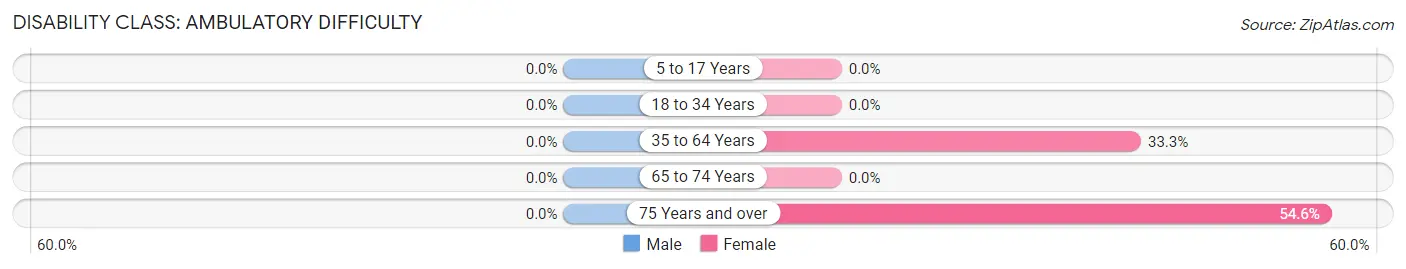
| Age Bracket | Male | Female |
| 5 to 17 Years | 0 (0.0%) | 0 (0.0%) |
| 18 to 34 Years | 0 (0.0%) | 0 (0.0%) |
| 35 to 64 Years | 0 (0.0%) | 15 (33.3%) |
| 65 to 74 Years | 0 (0.0%) | 0 (0.0%) |
| 75 Years and over | 0 (0.0%) | 18 (54.5%) |
Disability Class: Self-Care Difficulty
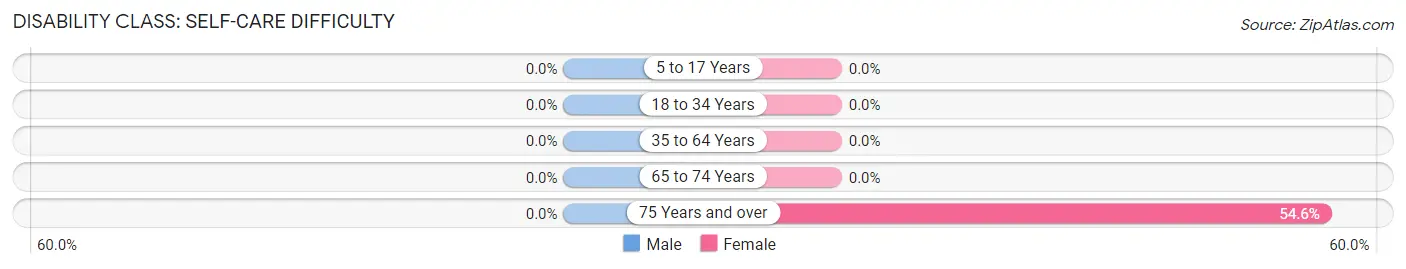
| Age Bracket | Male | Female |
| 5 to 17 Years | 0 (0.0%) | 0 (0.0%) |
| 18 to 34 Years | 0 (0.0%) | 0 (0.0%) |
| 35 to 64 Years | 0 (0.0%) | 0 (0.0%) |
| 65 to 74 Years | 0 (0.0%) | 0 (0.0%) |
| 75 Years and over | 0 (0.0%) | 18 (54.5%) |
Technology Access in North Springfield
Computing Device Access in North Springfield
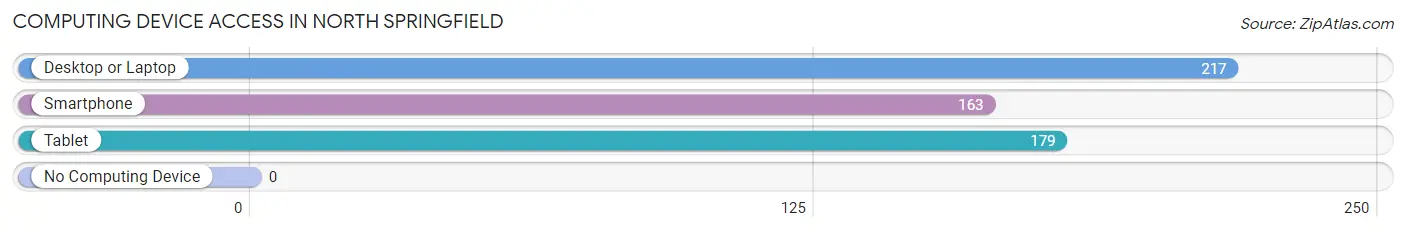
| Device Type | # Households | % Households |
| Desktop or Laptop | 217 | 93.1% |
| Smartphone | 163 | 70.0% |
| Tablet | 179 | 76.8% |
| No Computing Device | 0 | 0.0% |
| Total | 233 | 100.0% |
Internet Access in North Springfield
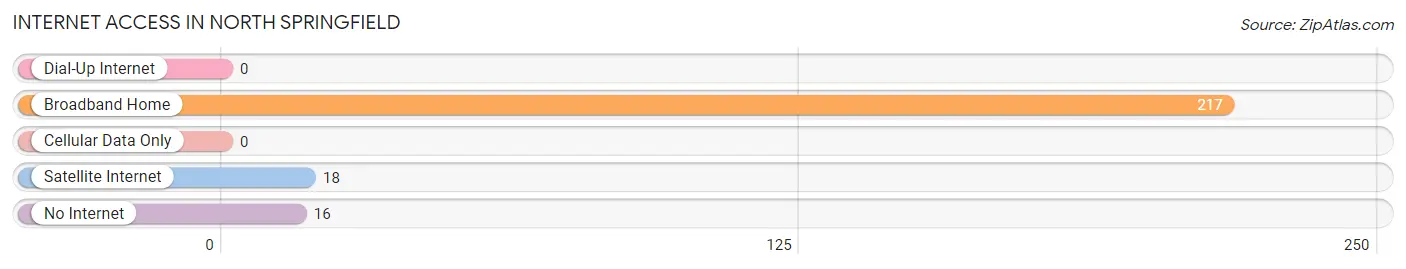
| Internet Type | # Households | % Households |
| Dial-Up Internet | 0 | 0.0% |
| Broadband Home | 217 | 93.1% |
| Cellular Data Only | 0 | 0.0% |
| Satellite Internet | 18 | 7.7% |
| No Internet | 16 | 6.9% |
| Total | 233 | 100.0% |
North Springfield Summary
History
North Springfield, Vermont is a small town located in the southeastern corner of the state. It is situated in the Connecticut River Valley, and is bordered by the towns of Weathersfield, Springfield, and Cavendish. The town was first settled in 1764 by a group of settlers from Connecticut, and was incorporated in 1781.
The town was originally known as “New Connecticut”, and was a farming community. The town was home to a number of mills, including a sawmill, gristmill, and a woolen mill. The town also had a number of small businesses, including a blacksmith, a tannery, and a general store.
In the late 19th century, the town began to experience a period of growth and prosperity. The railroad arrived in 1875, and the town became a popular tourist destination. The town was home to a number of hotels, and the area was known for its natural beauty.
In the early 20th century, the town began to decline. The railroad was abandoned in the 1930s, and the mills and businesses began to close. The town’s population began to decline, and by the 1950s, the town was in a state of decline.
Geography
North Springfield is located in the southeastern corner of Vermont, in the Connecticut River Valley. The town is bordered by the towns of Weathersfield, Springfield, and Cavendish. The town is located in the Green Mountains, and is surrounded by rolling hills and forests. The town is located at an elevation of 1,000 feet, and has a total area of 8.2 square miles.
The town is home to a number of small streams, including the Black River, which flows through the town. The town is also home to a number of small lakes, including Lake Runnemede and Lake Runnemede State Park.
Economy
North Springfield is a small, rural town, and the economy is largely based on agriculture and tourism. The town is home to a number of small farms, and the town is known for its dairy products. The town is also home to a number of small businesses, including a general store, a hardware store, and a gas station.
The town is also home to a number of tourist attractions, including the Black River Railroad Museum, the North Springfield Historical Society, and the North Springfield Arts Center. The town is also home to a number of small bed and breakfasts, and is a popular destination for outdoor activities, such as hiking, fishing, and camping.
Demographics
As of the 2010 census, the town had a population of 1,845. The population is largely white (97.2%), with a small percentage of African Americans (0.7%), Asians (0.4%), and Native Americans (0.2%). The median household income is $45,000, and the median home value is $150,000. The town has a high school graduation rate of 87.5%, and a poverty rate of 8.3%.
Common Questions
What is Per Capita Income in North Springfield?
Per Capita income in North Springfield is $32,723.
What is the Median Family Income in North Springfield?
Median Family Income in North Springfield is $64,483.
What is the Median Household income in North Springfield?
Median Household Income in North Springfield is $64,177.
What is Inequality or Gini Index in North Springfield?
Inequality or Gini Index in North Springfield is 0.16.
What is the Total Population of North Springfield?
Total Population of North Springfield is 447.
What is the Total Male Population of North Springfield?
Total Male Population of North Springfield is 246.
What is the Total Female Population of North Springfield?
Total Female Population of North Springfield is 201.
What is the Ratio of Males per 100 Females in North Springfield?
There are 122.39 Males per 100 Females in North Springfield.
What is the Ratio of Females per 100 Males in North Springfield?
There are 81.71 Females per 100 Males in North Springfield.
What is the Median Population Age in North Springfield?
Median Population Age in North Springfield is 61.0 Years.
What is the Average Family Size in North Springfield
Average Family Size in North Springfield is 1.9 People.
What is the Average Household Size in North Springfield
Average Household Size in North Springfield is 1.8 People.
How Large is the Labor Force in North Springfield?
There are 326 People in the Labor Forcein in North Springfield.
What is the Percentage of People in the Labor Force in North Springfield?
72.9% of People are in the Labor Force in North Springfield.