South Shaftsbury, VT Map & Demographics
South Shaftsbury Map
South Shaftsbury Overview
$35,543
PER CAPITA INCOME
$56,738
AVG HOUSEHOLD INCOME
1.3%
WAGE / INCOME GAP [ % ]
98.7¢/ $1
WAGE / INCOME GAP [ $ ]
0.34
INEQUALITY / GINI INDEX
427
TOTAL POPULATION
236
MALE POPULATION
191
FEMALE POPULATION
123.56
MALES / 100 FEMALES
80.93
FEMALES / 100 MALES
59.4
MEDIAN AGE
2.7
AVG FAMILY SIZE
2.3
AVG HOUSEHOLD SIZE
263
LABOR FORCE [ PEOPLE ]
68.3%
PERCENT IN LABOR FORCE
Income in South Shaftsbury
Income Overview in South Shaftsbury
| Characteristic | Number | Measure |
| Per Capita Income | 427 | $35,543 |
| Median Family Income | 140 | $0 |
| Mean Family Income | 140 | $84,151 |
| Median Household Income | 183 | $56,738 |
| Mean Household Income | 183 | $71,004 |
| Income Deficit | 140 | $0 |
| Wage / Income Gap (%) | 427 | 1.28% |
| Wage / Income Gap ($) | 427 | 98.72¢ per $1 |
| Gini / Inequality Index | 427 | 0.34 |
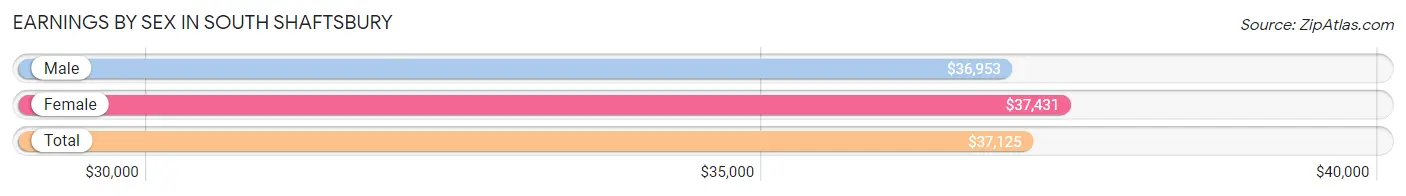
Earnings by Sex in South Shaftsbury
Average Earnings in South Shaftsbury are $37,125, $36,953 for men and $37,431 for women, a difference of 1.3%.
| Sex | Number | Average Earnings |
| Male | 128 (48.7%) | $36,953 |
| Female | 135 (51.3%) | $37,431 |
| Total | 263 (100.0%) | $37,125 |
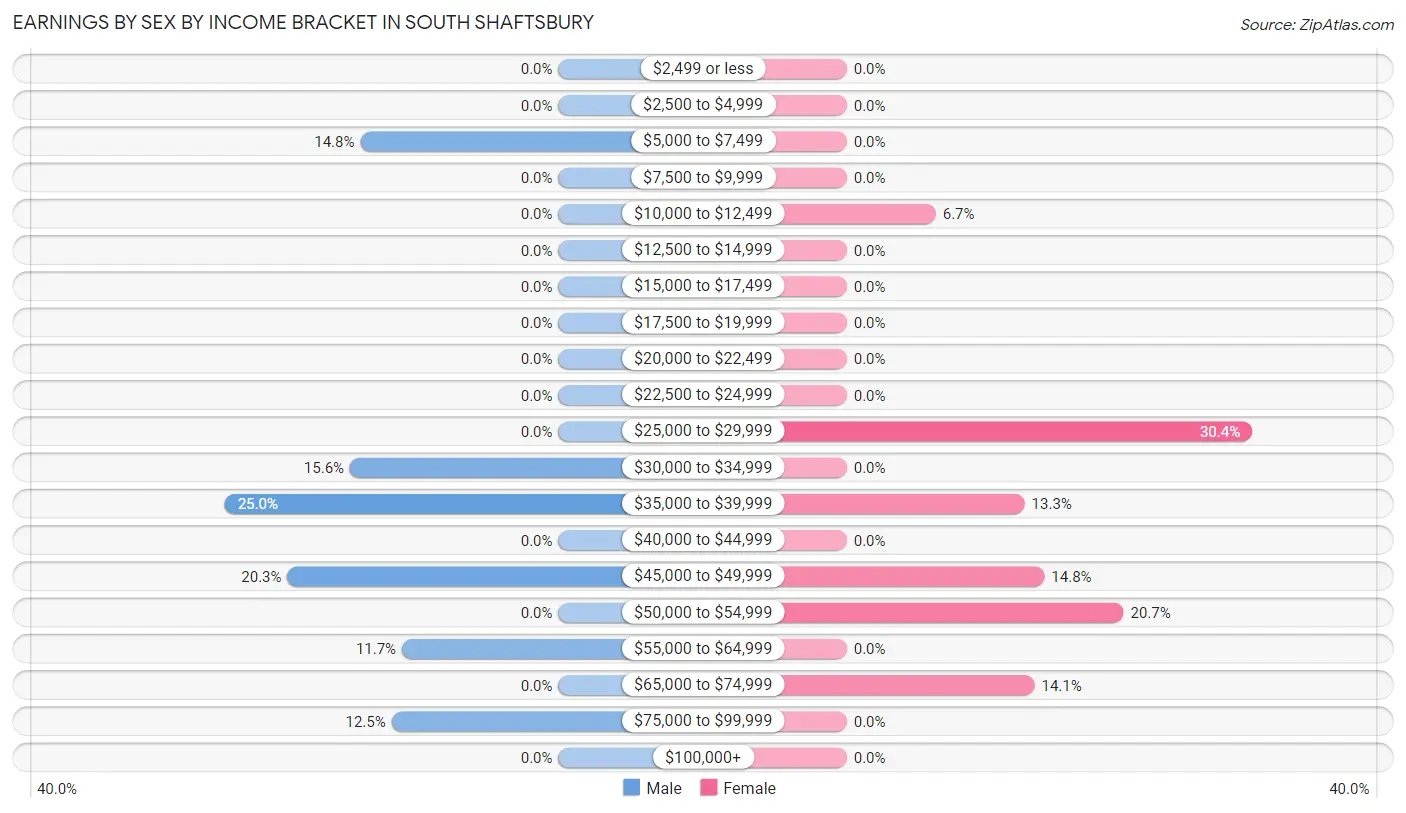
Earnings by Sex by Income Bracket in South Shaftsbury
The most common earnings brackets in South Shaftsbury are $35,000 to $39,999 for men (32 | 25.0%) and $25,000 to $29,999 for women (41 | 30.4%).
| Income | Male | Female |
| $2,499 or less | 0 (0.0%) | 0 (0.0%) |
| $2,500 to $4,999 | 0 (0.0%) | 0 (0.0%) |
| $5,000 to $7,499 | 19 (14.8%) | 0 (0.0%) |
| $7,500 to $9,999 | 0 (0.0%) | 0 (0.0%) |
| $10,000 to $12,499 | 0 (0.0%) | 9 (6.7%) |
| $12,500 to $14,999 | 0 (0.0%) | 0 (0.0%) |
| $15,000 to $17,499 | 0 (0.0%) | 0 (0.0%) |
| $17,500 to $19,999 | 0 (0.0%) | 0 (0.0%) |
| $20,000 to $22,499 | 0 (0.0%) | 0 (0.0%) |
| $22,500 to $24,999 | 0 (0.0%) | 0 (0.0%) |
| $25,000 to $29,999 | 0 (0.0%) | 41 (30.4%) |
| $30,000 to $34,999 | 20 (15.6%) | 0 (0.0%) |
| $35,000 to $39,999 | 32 (25.0%) | 18 (13.3%) |
| $40,000 to $44,999 | 0 (0.0%) | 0 (0.0%) |
| $45,000 to $49,999 | 26 (20.3%) | 20 (14.8%) |
| $50,000 to $54,999 | 0 (0.0%) | 28 (20.7%) |
| $55,000 to $64,999 | 15 (11.7%) | 0 (0.0%) |
| $65,000 to $74,999 | 0 (0.0%) | 19 (14.1%) |
| $75,000 to $99,999 | 16 (12.5%) | 0 (0.0%) |
| $100,000+ | 0 (0.0%) | 0 (0.0%) |
| Total | 128 (100.0%) | 135 (100.0%) |
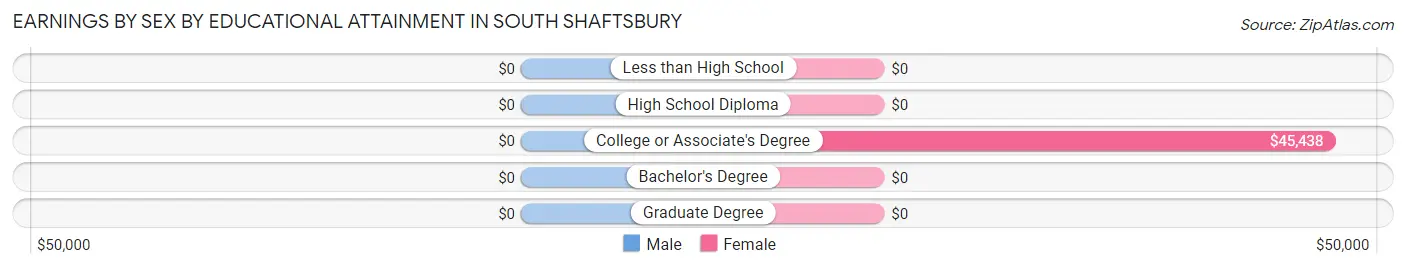
Earnings by Sex by Educational Attainment in South Shaftsbury
| Educational Attainment | Male Income | Female Income |
| Less than High School | - | - |
| High School Diploma | - | - |
| College or Associate's Degree | - | - |
| Bachelor's Degree | - | - |
| Graduate Degree | - | - |
| Total | $46,202 | $45,500 |
Family Income in South Shaftsbury
Family Income Brackets in South Shaftsbury
According to the South Shaftsbury family income data, there are 57 families falling into the $50,000 to $74,999 income range, which is the most common income bracket and makes up 40.7% of all families.
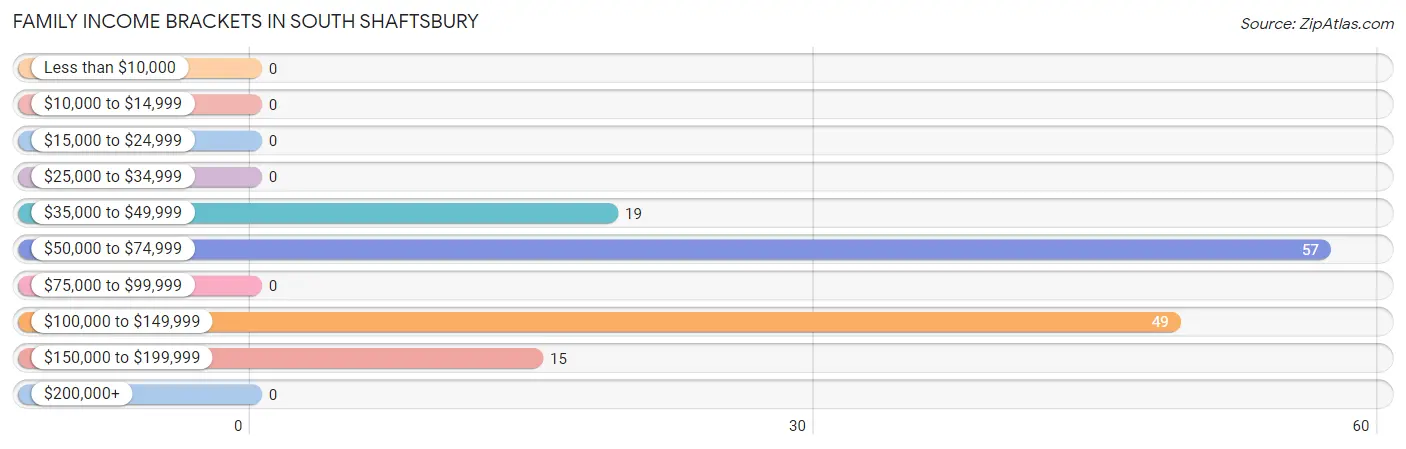
| Income Bracket | # Families | % Families |
| Less than $10,000 | 0 | 0.0% |
| $10,000 to $14,999 | 0 | 0.0% |
| $15,000 to $24,999 | 0 | 0.0% |
| $25,000 to $34,999 | 0 | 0.0% |
| $35,000 to $49,999 | 19 | 13.6% |
| $50,000 to $74,999 | 57 | 40.7% |
| $75,000 to $99,999 | 0 | 0.0% |
| $100,000 to $149,999 | 49 | 35.0% |
| $150,000 to $199,999 | 15 | 10.7% |
| $200,000+ | 0 | 0.0% |
Family Income by Famaliy Size in South Shaftsbury
2-person families (94 | 67.1%) account for the highest median family income in South Shaftsbury with $101,071 per family, while 2-person families (94 | 67.1%) have the highest median income of $50,536 per family member.
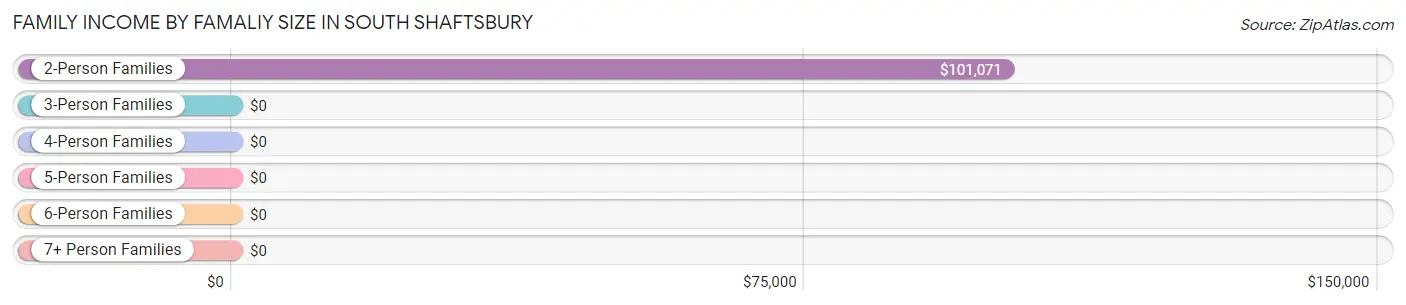
| Income Bracket | # Families | Median Income |
| 2-Person Families | 94 (67.1%) | $101,071 |
| 3-Person Families | 41 (29.3%) | $0 |
| 4-Person Families | 5 (3.6%) | $0 |
| 5-Person Families | 0 (0.0%) | $0 |
| 6-Person Families | 0 (0.0%) | $0 |
| 7+ Person Families | 0 (0.0%) | $0 |
| Total | 140 (100.0%) | $0 |
Family Income by Number of Earners in South Shaftsbury
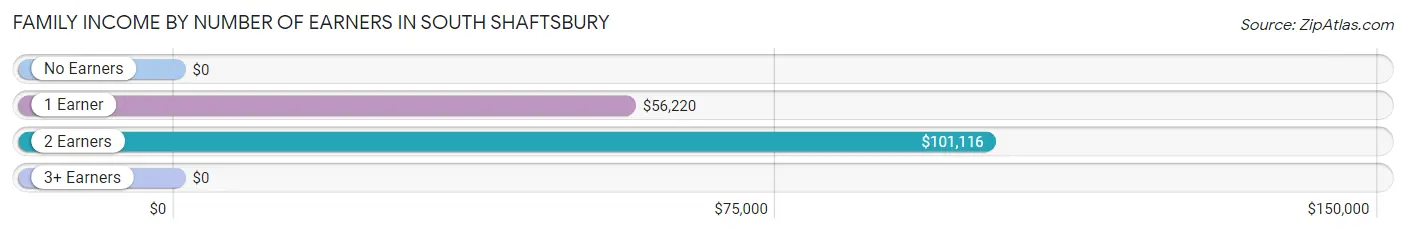
| Number of Earners | # Families | Median Income |
| No Earners | 0 (0.0%) | $0 |
| 1 Earner | 72 (51.4%) | $56,220 |
| 2 Earners | 63 (45.0%) | $101,116 |
| 3+ Earners | 5 (3.6%) | $0 |
| Total | 140 (100.0%) | $0 |
Household Income in South Shaftsbury
Household Income Brackets in South Shaftsbury
With 72 households falling in the category, the $50,000 to $74,999 income range is the most frequent in South Shaftsbury, accounting for 39.3% of all households.
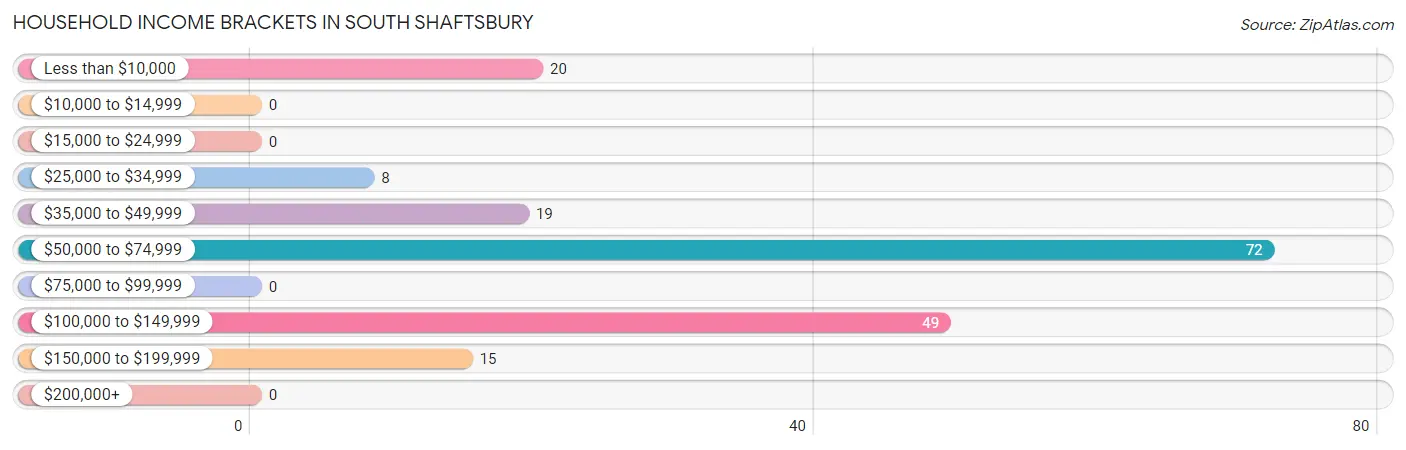
| Income Bracket | # Households | % Households |
| Less than $10,000 | 20 | 10.9% |
| $10,000 to $14,999 | 0 | 0.0% |
| $15,000 to $24,999 | 0 | 0.0% |
| $25,000 to $34,999 | 8 | 4.4% |
| $35,000 to $49,999 | 19 | 10.4% |
| $50,000 to $74,999 | 72 | 39.3% |
| $75,000 to $99,999 | 0 | 0.0% |
| $100,000 to $149,999 | 49 | 26.8% |
| $150,000 to $199,999 | 15 | 8.2% |
| $200,000+ | 0 | 0.0% |
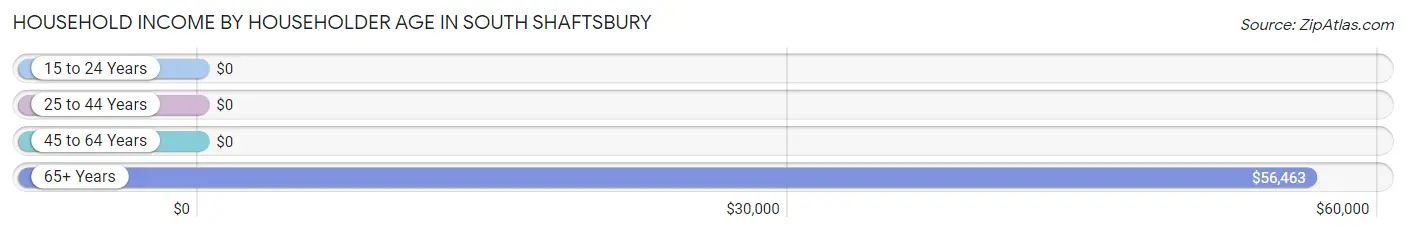
Household Income by Householder Age in South Shaftsbury
The median household income in South Shaftsbury is $56,738, with the highest median household income of $56,463 found in the 65+ years age bracket for the primary householder. A total of 104 households (56.8%) fall into this category. Meanwhile, the 15 to 24 years age bracket for the primary householder has the lowest median household income of $0, with 19 households (10.4%) in this group.
| Income Bracket | # Households | Median Income |
| 15 to 24 Years | 19 (10.4%) | $0 |
| 25 to 44 Years | 16 (8.7%) | $0 |
| 45 to 64 Years | 44 (24.0%) | $0 |
| 65+ Years | 104 (56.8%) | $56,463 |
| Total | 183 (100.0%) | $56,738 |
Poverty in South Shaftsbury
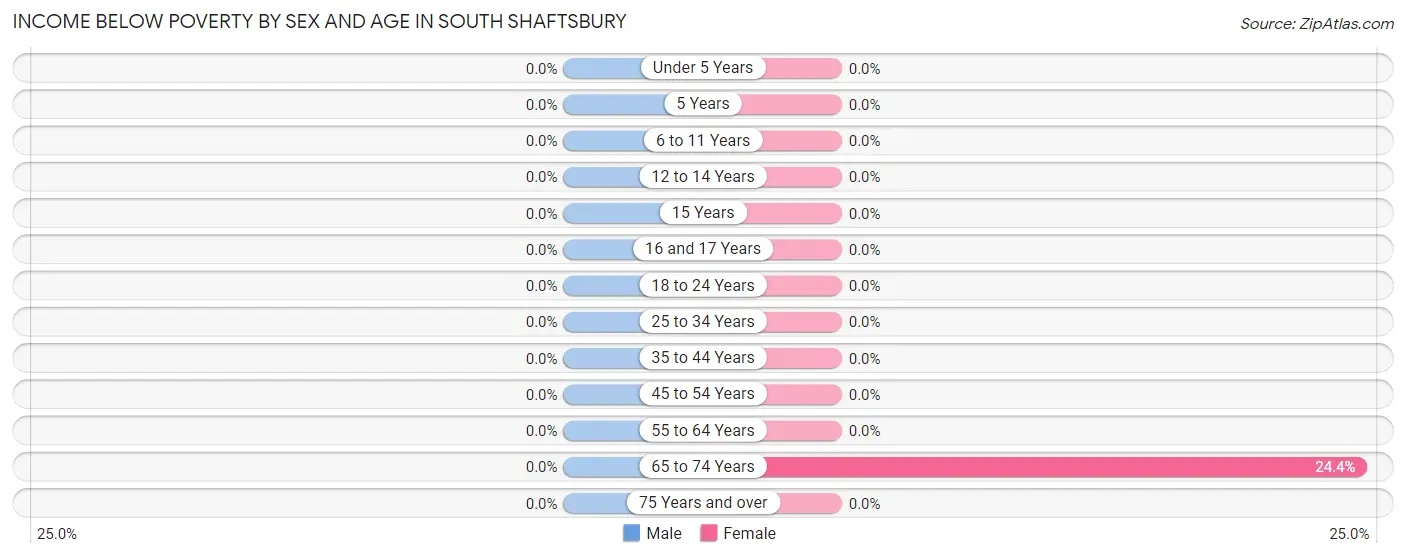
Income Below Poverty by Sex and Age in South Shaftsbury
| Age Bracket | Male | Female |
| Under 5 Years | 0 (0.0%) | 0 (0.0%) |
| 5 Years | 0 (0.0%) | 0 (0.0%) |
| 6 to 11 Years | 0 (0.0%) | 0 (0.0%) |
| 12 to 14 Years | 0 (0.0%) | 0 (0.0%) |
| 15 Years | 0 (0.0%) | 0 (0.0%) |
| 16 and 17 Years | 0 (0.0%) | 0 (0.0%) |
| 18 to 24 Years | 0 (0.0%) | 0 (0.0%) |
| 25 to 34 Years | 0 (0.0%) | 0 (0.0%) |
| 35 to 44 Years | 0 (0.0%) | 0 (0.0%) |
| 45 to 54 Years | 0 (0.0%) | 0 (0.0%) |
| 55 to 64 Years | 0 (0.0%) | 0 (0.0%) |
| 65 to 74 Years | 0 (0.0%) | 20 (24.4%) |
| 75 Years and over | 0 (0.0%) | 0 (0.0%) |
| Total | 0 (0.0%) | 20 (10.5%) |
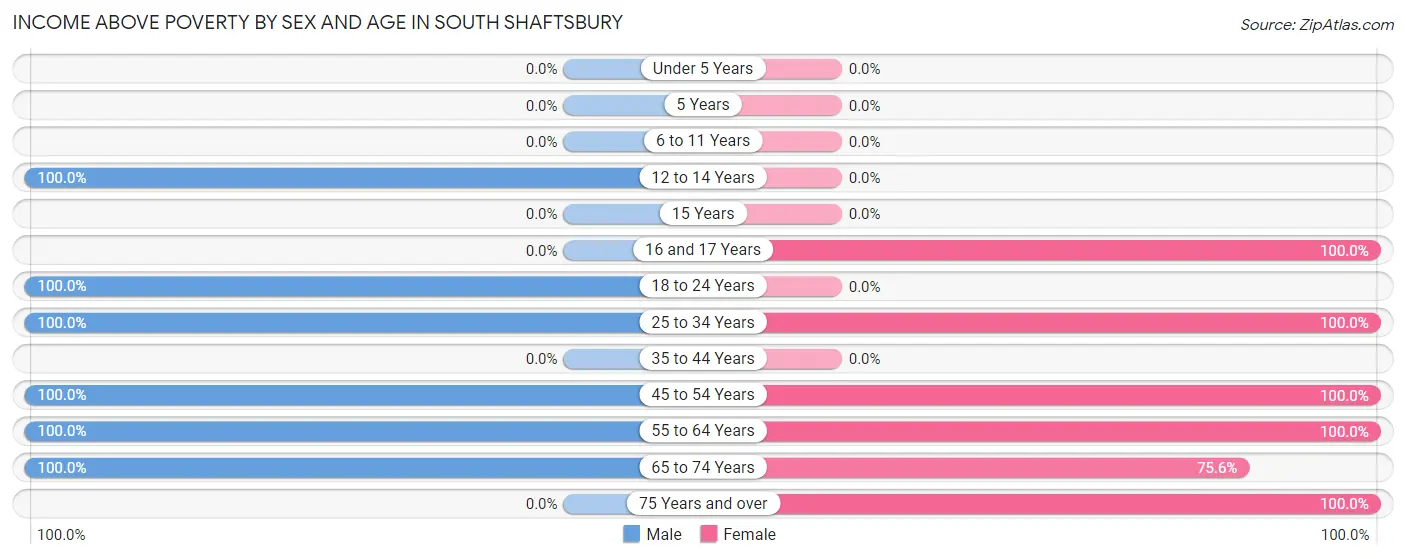
Income Above Poverty by Sex and Age in South Shaftsbury
According to the poverty statistics in South Shaftsbury, males aged 12 to 14 years and females aged 16 and 17 years are the age groups that are most secure financially, with 100.0% of males and 100.0% of females in these age groups living above the poverty line.
| Age Bracket | Male | Female |
| Under 5 Years | 0 (0.0%) | 0 (0.0%) |
| 5 Years | 0 (0.0%) | 0 (0.0%) |
| 6 to 11 Years | 0 (0.0%) | 0 (0.0%) |
| 12 to 14 Years | 42 (100.0%) | 0 (0.0%) |
| 15 Years | 0 (0.0%) | 0 (0.0%) |
| 16 and 17 Years | 0 (0.0%) | 9 (100.0%) |
| 18 to 24 Years | 39 (100.0%) | 0 (0.0%) |
| 25 to 34 Years | 16 (100.0%) | 20 (100.0%) |
| 35 to 44 Years | 0 (0.0%) | 0 (0.0%) |
| 45 to 54 Years | 32 (100.0%) | 37 (100.0%) |
| 55 to 64 Years | 42 (100.0%) | 28 (100.0%) |
| 65 to 74 Years | 65 (100.0%) | 62 (75.6%) |
| 75 Years and over | 0 (0.0%) | 15 (100.0%) |
| Total | 236 (100.0%) | 171 (89.5%) |
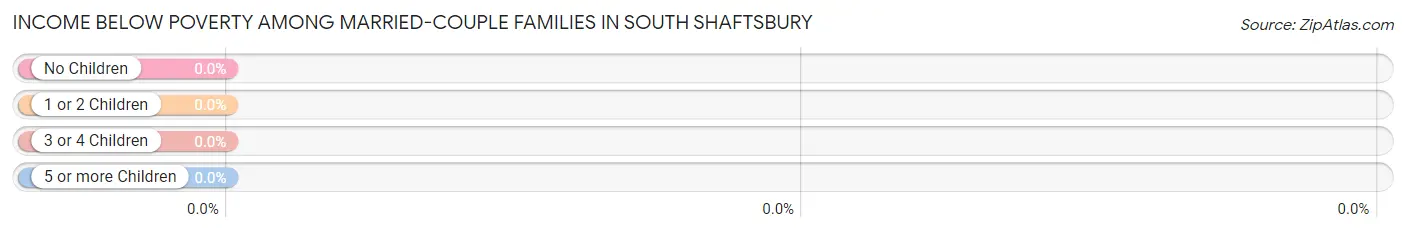
Income Below Poverty Among Married-Couple Families in South Shaftsbury
| Children | Above Poverty | Below Poverty |
| No Children | 75 (100.0%) | 0 (0.0%) |
| 1 or 2 Children | 46 (100.0%) | 0 (0.0%) |
| 3 or 4 Children | 0 (0.0%) | 0 (0.0%) |
| 5 or more Children | 0 (0.0%) | 0 (0.0%) |
| Total | 121 (100.0%) | 0 (0.0%) |
Income Below Poverty Among Single-Parent Households in South Shaftsbury
| Children | Single Father | Single Mother |
| No Children | 0 (0.0%) | 0 (0.0%) |
| 1 or 2 Children | 0 (0.0%) | 0 (0.0%) |
| 3 or 4 Children | 0 (0.0%) | 0 (0.0%) |
| 5 or more Children | 0 (0.0%) | 0 (0.0%) |
| Total | 0 (0.0%) | 0 (0.0%) |
Income Below Poverty Among Married-Couple vs Single-Parent Households in South Shaftsbury
| Children | Married-Couple Families | Single-Parent Households |
| No Children | 0 (0.0%) | 0 (0.0%) |
| 1 or 2 Children | 0 (0.0%) | 0 (0.0%) |
| 3 or 4 Children | 0 (0.0%) | 0 (0.0%) |
| 5 or more Children | 0 (0.0%) | 0 (0.0%) |
| Total | 0 (0.0%) | 0 (0.0%) |
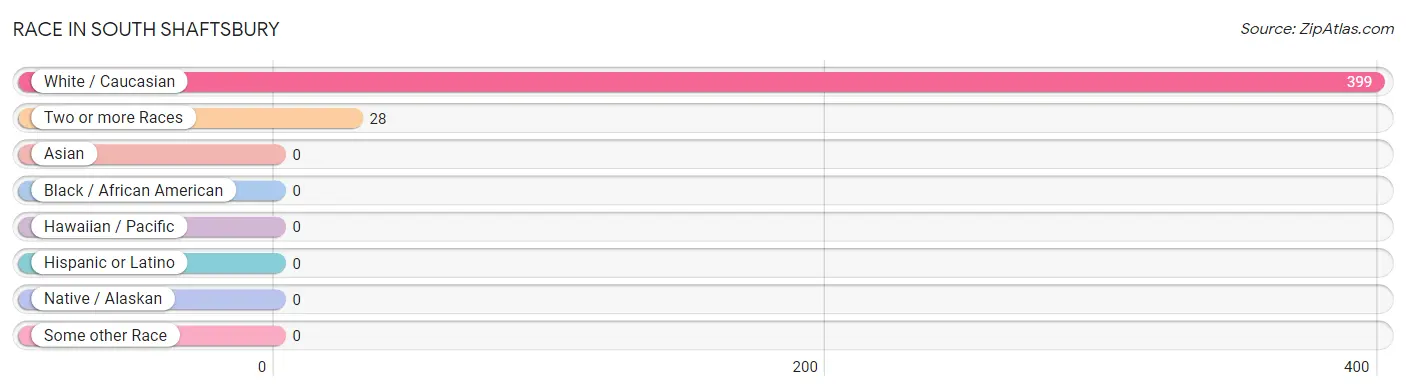
Race in South Shaftsbury
The most populous races in South Shaftsbury are White / Caucasian (399 | 93.4%), and Two or more Races (28 | 6.6%).
| Race | # Population | % Population |
| Asian | 0 | 0.0% |
| Black / African American | 0 | 0.0% |
| Hawaiian / Pacific | 0 | 0.0% |
| Hispanic or Latino | 0 | 0.0% |
| Native / Alaskan | 0 | 0.0% |
| White / Caucasian | 399 | 93.4% |
| Two or more Races | 28 | 6.6% |
| Some other Race | 0 | 0.0% |
| Total | 427 | 100.0% |
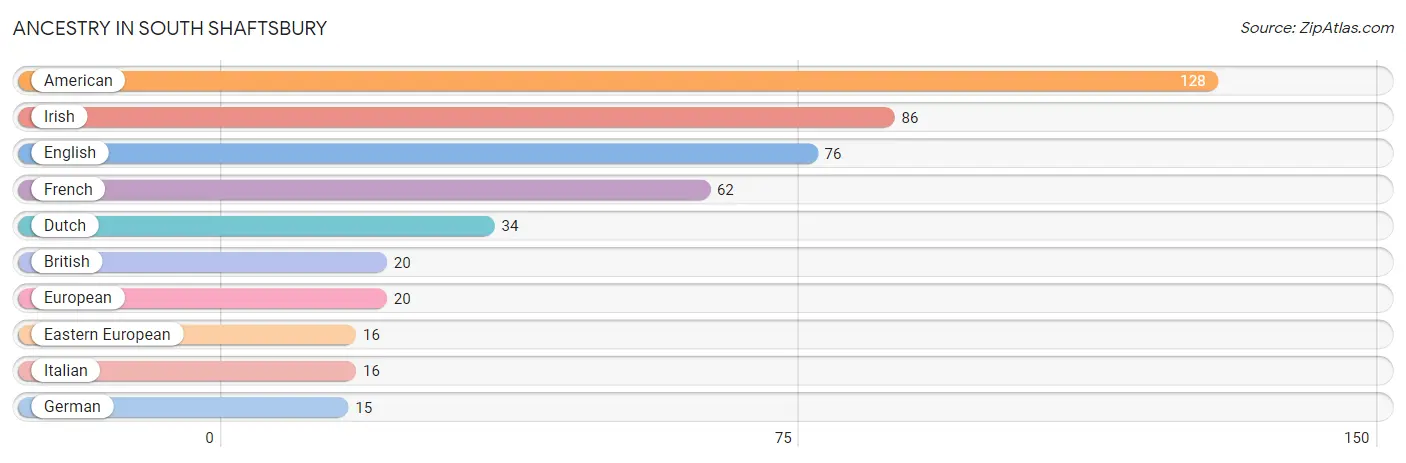
Ancestry in South Shaftsbury
The most populous ancestries reported in South Shaftsbury are American (128 | 30.0%), Irish (86 | 20.1%), English (76 | 17.8%), French (62 | 14.5%), and Dutch (34 | 8.0%), together accounting for 90.4% of all South Shaftsbury residents.
| Ancestry | # Population | % Population |
| American | 128 | 30.0% |
| British | 20 | 4.7% |
| Dutch | 34 | 8.0% |
| Eastern European | 16 | 3.7% |
| English | 76 | 17.8% |
| European | 20 | 4.7% |
| French | 62 | 14.5% |
| German | 15 | 3.5% |
| Irish | 86 | 20.1% |
| Italian | 16 | 3.7% | View All 10 Rows |
Immigrants in South Shaftsbury

| Immigration Origin | # Population | % Population | View All 0 Rows |
Sex and Age in South Shaftsbury
Sex and Age in South Shaftsbury
The most populous age groups in South Shaftsbury are 65 to 69 Years (65 | 27.5%) for men and 65 to 69 Years (62 | 32.5%) for women.
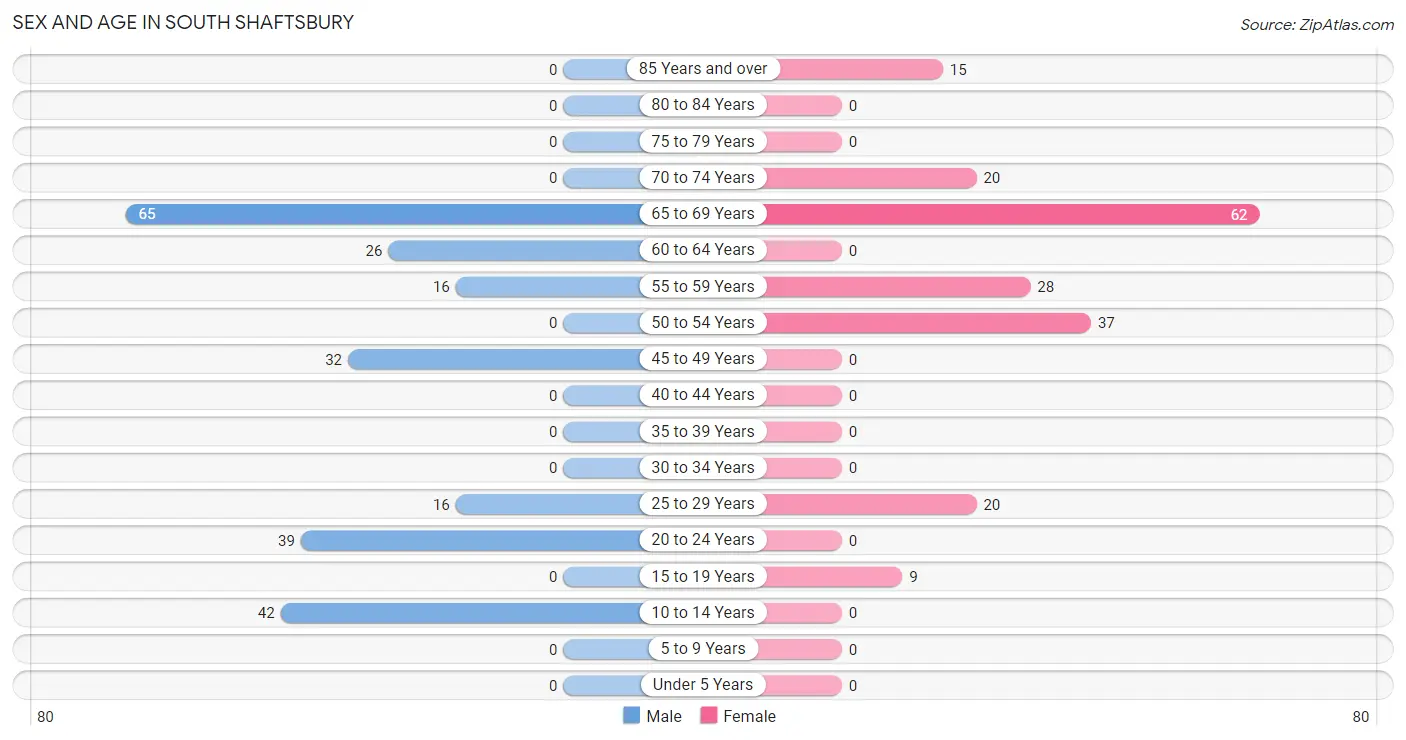
| Age Bracket | Male | Female |
| Under 5 Years | 0 (0.0%) | 0 (0.0%) |
| 5 to 9 Years | 0 (0.0%) | 0 (0.0%) |
| 10 to 14 Years | 42 (17.8%) | 0 (0.0%) |
| 15 to 19 Years | 0 (0.0%) | 9 (4.7%) |
| 20 to 24 Years | 39 (16.5%) | 0 (0.0%) |
| 25 to 29 Years | 16 (6.8%) | 20 (10.5%) |
| 30 to 34 Years | 0 (0.0%) | 0 (0.0%) |
| 35 to 39 Years | 0 (0.0%) | 0 (0.0%) |
| 40 to 44 Years | 0 (0.0%) | 0 (0.0%) |
| 45 to 49 Years | 32 (13.6%) | 0 (0.0%) |
| 50 to 54 Years | 0 (0.0%) | 37 (19.4%) |
| 55 to 59 Years | 16 (6.8%) | 28 (14.7%) |
| 60 to 64 Years | 26 (11.0%) | 0 (0.0%) |
| 65 to 69 Years | 65 (27.5%) | 62 (32.5%) |
| 70 to 74 Years | 0 (0.0%) | 20 (10.5%) |
| 75 to 79 Years | 0 (0.0%) | 0 (0.0%) |
| 80 to 84 Years | 0 (0.0%) | 0 (0.0%) |
| 85 Years and over | 0 (0.0%) | 15 (7.9%) |
| Total | 236 (100.0%) | 191 (100.0%) |
Families and Households in South Shaftsbury
Median Family Size in South Shaftsbury
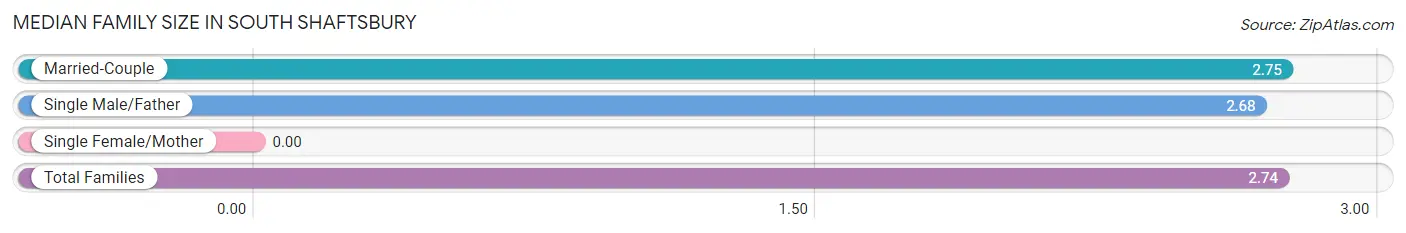
| Family Type | # Families | Family Size |
| Married-Couple | 121 (86.4%) | 2.75 |
| Single Male/Father | 19 (13.6%) | 2.68 |
| Single Female/Mother | 0 (0.0%) | - |
| Total Families | 140 (100.0%) | 2.74 |
Median Household Size in South Shaftsbury
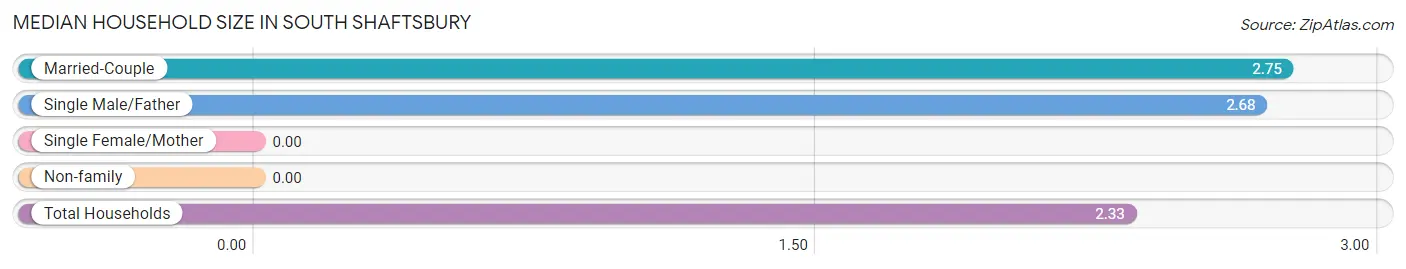
| Household Type | # Households | Household Size |
| Married-Couple | 121 (66.1%) | 2.75 |
| Single Male/Father | 19 (10.4%) | 2.68 |
| Single Female/Mother | 0 (0.0%) | - |
| Non-family | 43 (23.5%) | - |
| Total Households | 183 (100.0%) | 2.33 |
Household Size by Marriage Status in South Shaftsbury
Out of a total of 183 households in South Shaftsbury, 140 (76.5%) are family households, while 43 (23.5%) are nonfamily households. The most numerous type of family households are 2-person households, comprising 94, and the most common type of nonfamily households are 1-person households, comprising 43.
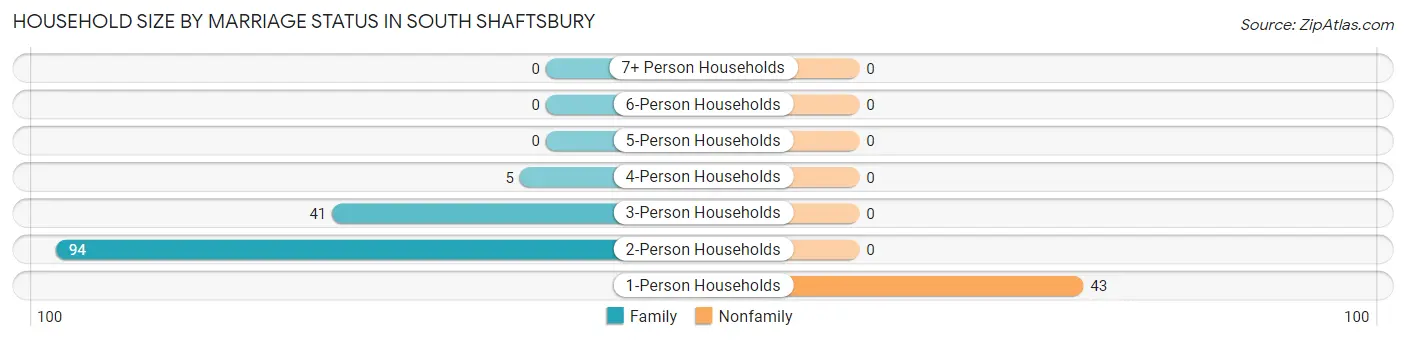
| Household Size | Family Households | Nonfamily Households |
| 1-Person Households | - | 43 (23.5%) |
| 2-Person Households | 94 (51.4%) | 0 (0.0%) |
| 3-Person Households | 41 (22.4%) | 0 (0.0%) |
| 4-Person Households | 5 (2.7%) | 0 (0.0%) |
| 5-Person Households | 0 (0.0%) | 0 (0.0%) |
| 6-Person Households | 0 (0.0%) | 0 (0.0%) |
| 7+ Person Households | 0 (0.0%) | 0 (0.0%) |
| Total | 140 (76.5%) | 43 (23.5%) |
Female Fertility in South Shaftsbury
Fertility by Age in South Shaftsbury
Average fertility rate in South Shaftsbury is 310.0 births per 1,000 women. Women in the age bracket of 15 to 19 years have the highest fertility rate with 1,000.0 births per 1,000 women. Women in the age bracket of 15 to 19 years acount for 100.0% of all women with births.
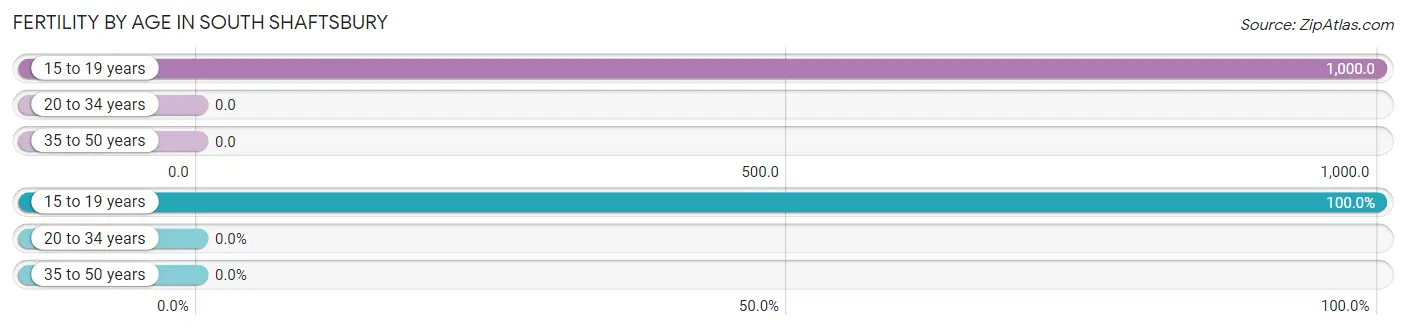
| Age Bracket | Women with Births | Births / 1,000 Women |
| 15 to 19 years | 9 (100.0%) | 1,000.0 |
| 20 to 34 years | 0 (0.0%) | 0.0 |
| 35 to 50 years | 0 (0.0%) | 0.0 |
| Total | 9 (100.0%) | 310.0 |
Fertility by Age by Marriage Status in South Shaftsbury
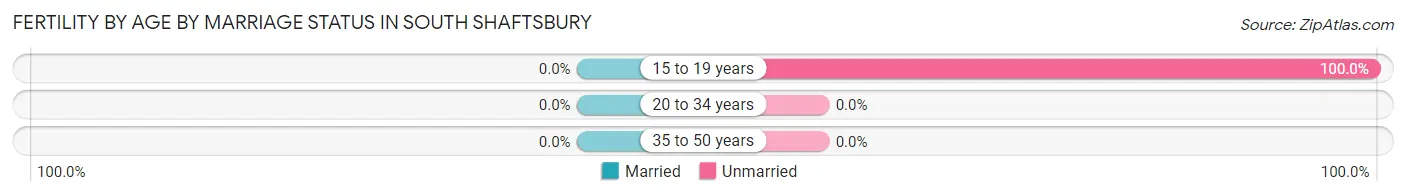
| Age Bracket | Married | Unmarried |
| 15 to 19 years | 0 (0.0%) | 9 (100.0%) |
| 20 to 34 years | 0 (0.0%) | 0 (0.0%) |
| 35 to 50 years | 0 (0.0%) | 0 (0.0%) |
| Total | 0 (0.0%) | 9 (100.0%) |
Fertility by Education in South Shaftsbury
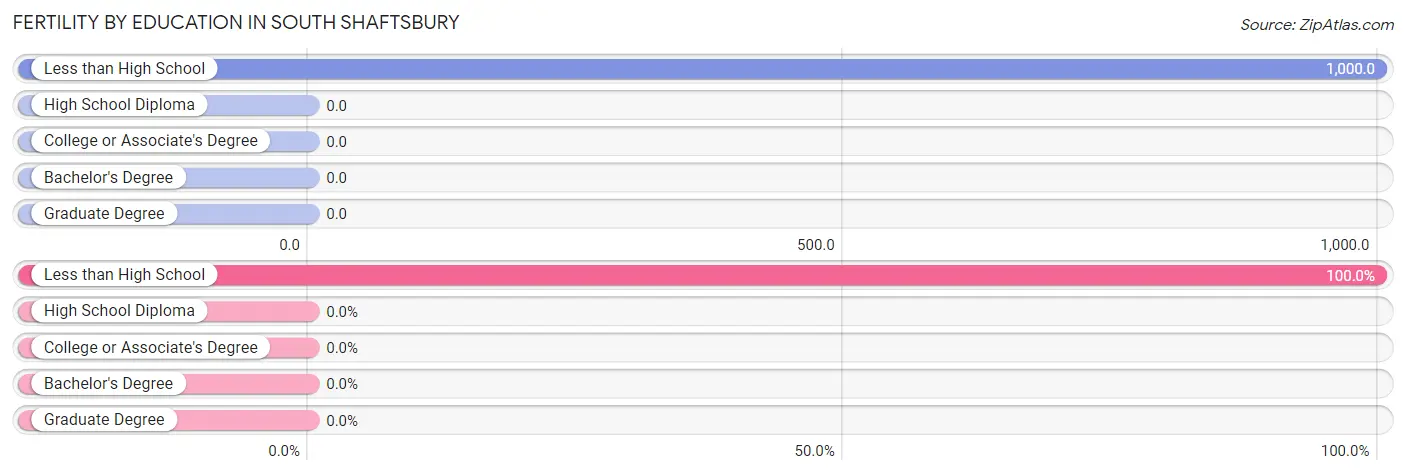
| Educational Attainment | Women with Births | Births / 1,000 Women |
| Less than High School | 9 (100.0%) | 1,000.0 |
| High School Diploma | 0 (0.0%) | 0.0 |
| College or Associate's Degree | 0 (0.0%) | 0.0 |
| Bachelor's Degree | 0 (0.0%) | 0.0 |
| Graduate Degree | 0 (0.0%) | 0.0 |
| Total | 9 (100.0%) | 310.0 |
Fertility by Education by Marriage Status in South Shaftsbury
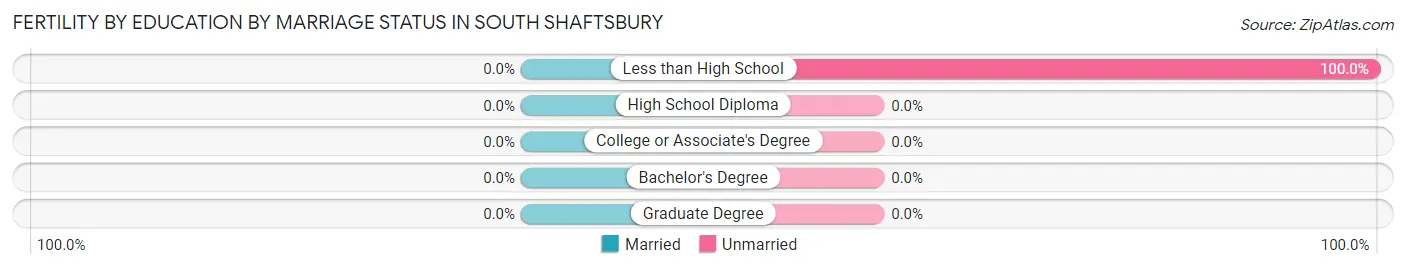
| Educational Attainment | Married | Unmarried |
| Less than High School | 0 (0.0%) | 9 (100.0%) |
| High School Diploma | 0 (0.0%) | 0 (0.0%) |
| College or Associate's Degree | 0 (0.0%) | 0 (0.0%) |
| Bachelor's Degree | 0 (0.0%) | 0 (0.0%) |
| Graduate Degree | 0 (0.0%) | 0 (0.0%) |
| Total | 0 (0.0%) | 9 (100.0%) |
Employment Characteristics in South Shaftsbury
Employment by Class of Employer in South Shaftsbury
Among the 263 employed individuals in South Shaftsbury, private company employees (179 | 68.1%), self-employed (not incorporated) (41 | 15.6%), and not-for-profit organizations (28 | 10.6%) make up the most common classes of employment.
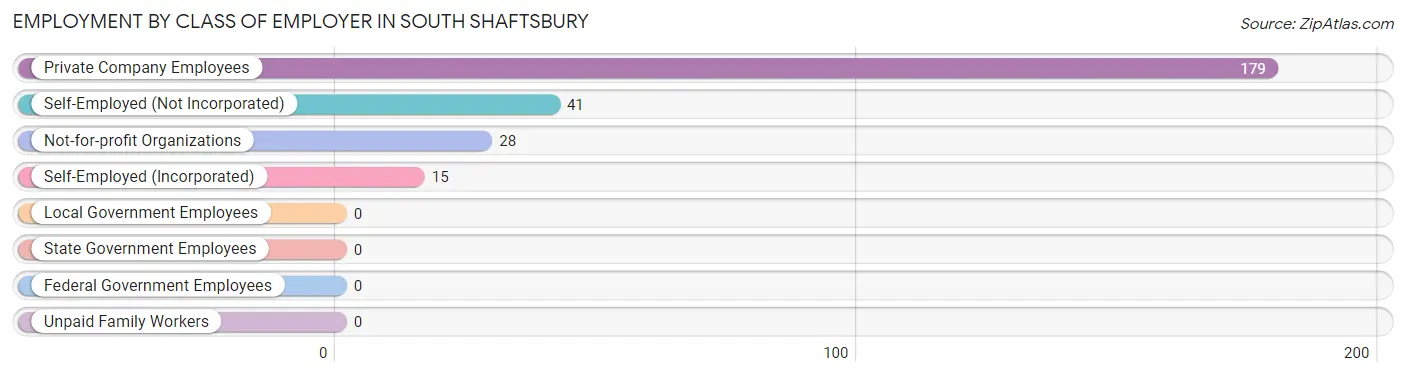
| Employer Class | # Employees | % Employees |
| Private Company Employees | 179 | 68.1% |
| Self-Employed (Incorporated) | 15 | 5.7% |
| Self-Employed (Not Incorporated) | 41 | 15.6% |
| Not-for-profit Organizations | 28 | 10.6% |
| Local Government Employees | 0 | 0.0% |
| State Government Employees | 0 | 0.0% |
| Federal Government Employees | 0 | 0.0% |
| Unpaid Family Workers | 0 | 0.0% |
| Total | 263 | 100.0% |
Employment Status by Age in South Shaftsbury
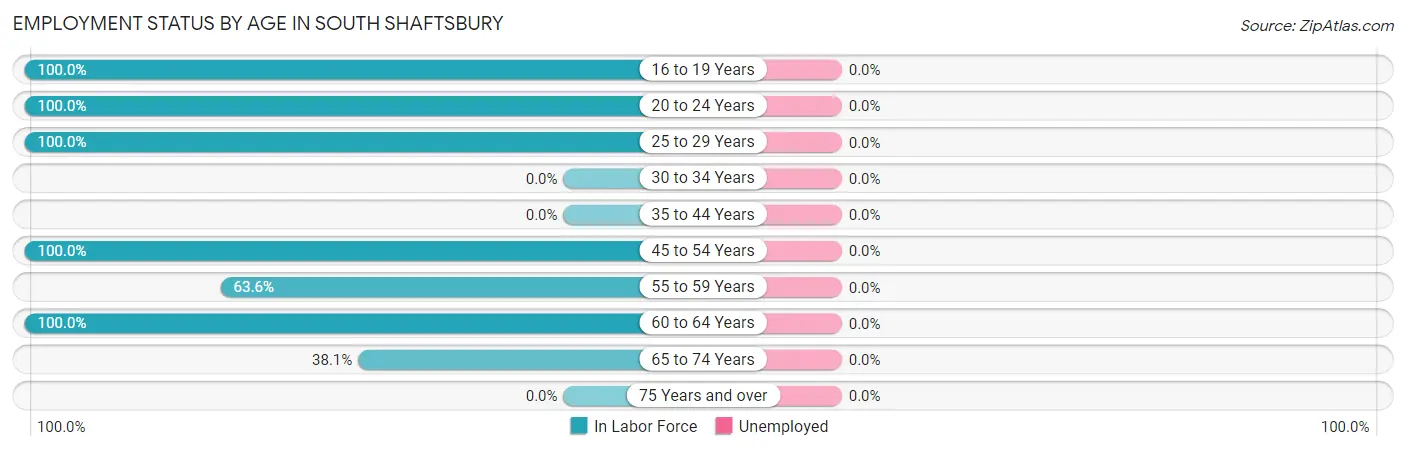
| Age Bracket | In Labor Force | Unemployed |
| 16 to 19 Years | 9 (100.0%) | 0 (0.0%) |
| 20 to 24 Years | 39 (100.0%) | 0 (0.0%) |
| 25 to 29 Years | 36 (100.0%) | 0 (0.0%) |
| 30 to 34 Years | 0 (0.0%) | 0 (0.0%) |
| 35 to 44 Years | 0 (0.0%) | 0 (0.0%) |
| 45 to 54 Years | 69 (100.0%) | 0 (0.0%) |
| 55 to 59 Years | 28 (63.6%) | 0 (0.0%) |
| 60 to 64 Years | 26 (100.0%) | 0 (0.0%) |
| 65 to 74 Years | 56 (38.1%) | 0 (0.0%) |
| 75 Years and over | 0 (0.0%) | 0 (0.0%) |
| Total | 263 (68.3%) | 0 (0.0%) |
Employment Status by Educational Attainment in South Shaftsbury
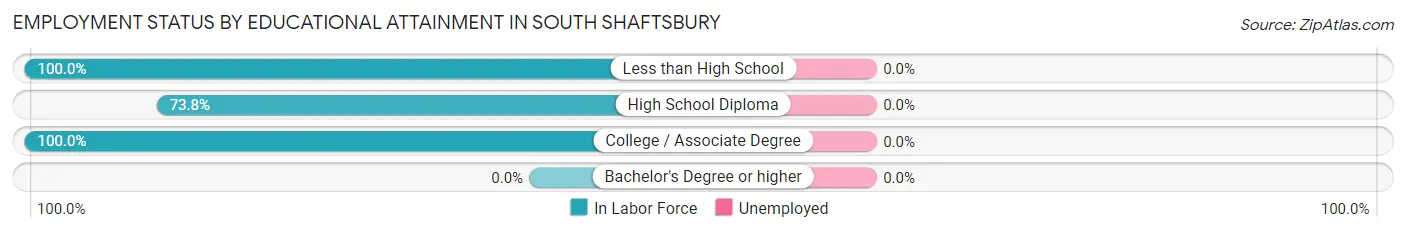
| Educational Attainment | In Labor Force | Unemployed |
| Less than High School | 34 (100.0%) | 0 (0.0%) |
| High School Diploma | 45 (73.8%) | 0 (0.0%) |
| College / Associate Degree | 80 (100.0%) | 0 (0.0%) |
| Bachelor's Degree or higher | 0 (0.0%) | 0 (0.0%) |
| Total | 159 (90.9%) | 0 (0.0%) |
Employment Occupations by Sex in South Shaftsbury
Management, Business, Science and Arts Occupations
The most common Management, Business, Science and Arts occupations in South Shaftsbury are Business & Financial (43 | 16.4%), Management (41 | 15.6%), Computers, Engineering & Science (16 | 6.1%), and Computers & Mathematics (16 | 6.1%).
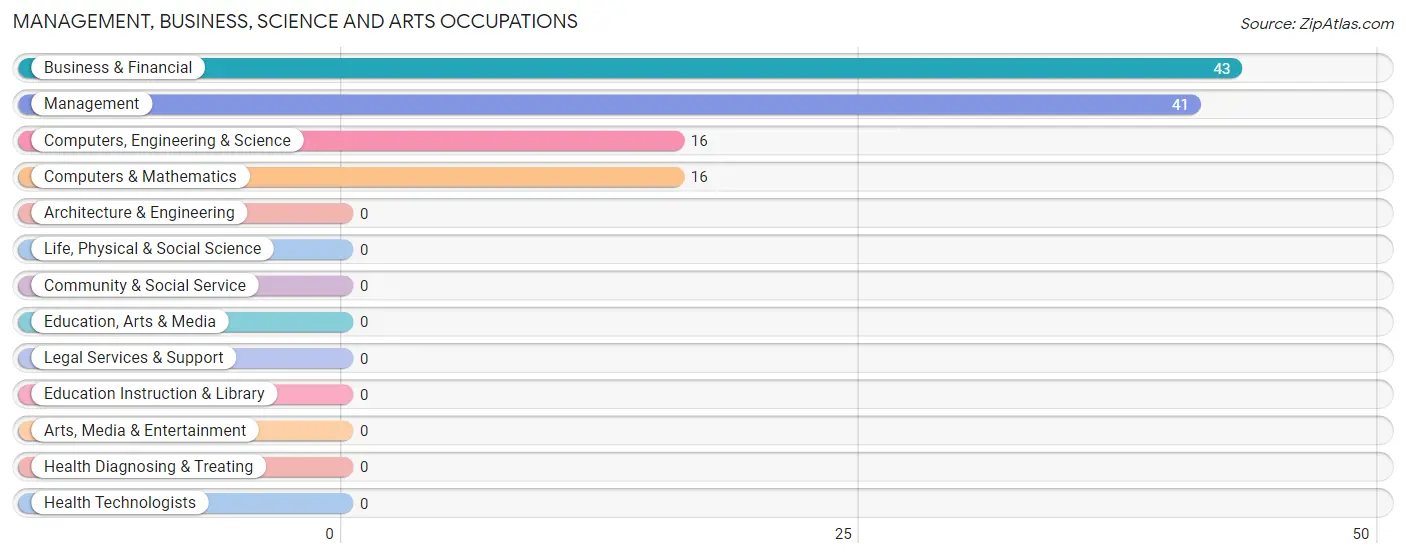
Management, Business, Science and Arts Occupations by Sex
Within the Management, Business, Science and Arts occupations in South Shaftsbury, the most male-oriented occupations are Computers, Engineering & Science (100.0%), Computers & Mathematics (100.0%), and Business & Financial (34.9%), while the most female-oriented occupations are Management (100.0%), and Business & Financial (65.1%).
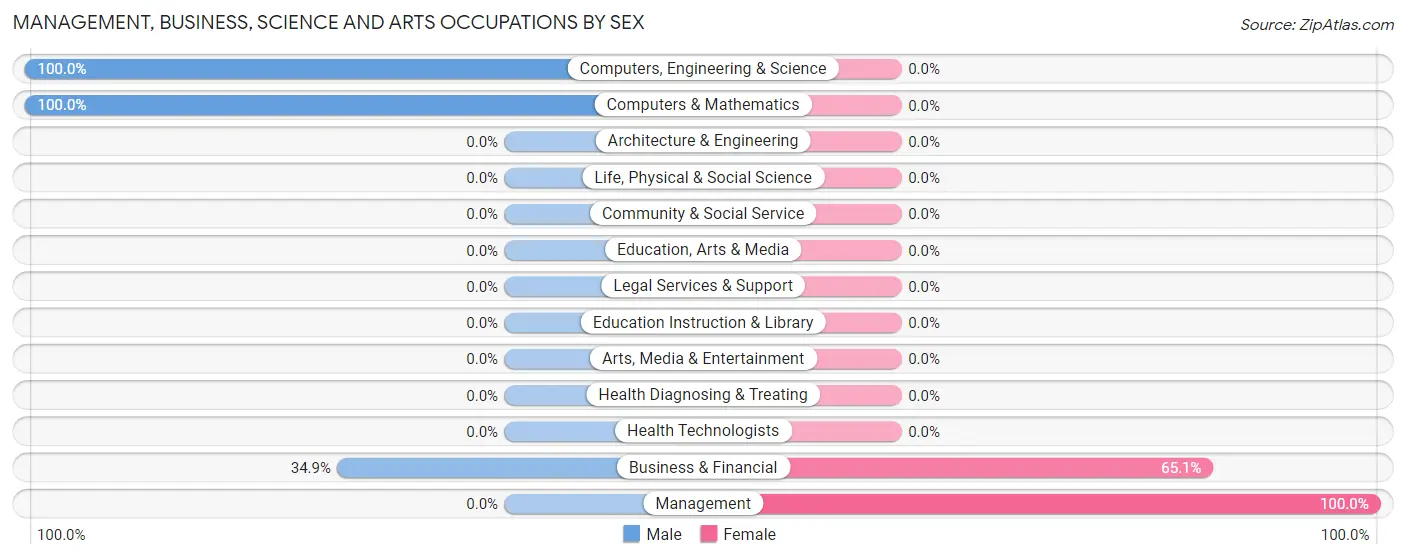
| Occupation | Male | Female |
| Management | 0 (0.0%) | 41 (100.0%) |
| Business & Financial | 15 (34.9%) | 28 (65.1%) |
| Computers, Engineering & Science | 16 (100.0%) | 0 (0.0%) |
| Computers & Mathematics | 16 (100.0%) | 0 (0.0%) |
| Architecture & Engineering | 0 (0.0%) | 0 (0.0%) |
| Life, Physical & Social Science | 0 (0.0%) | 0 (0.0%) |
| Community & Social Service | 0 (0.0%) | 0 (0.0%) |
| Education, Arts & Media | 0 (0.0%) | 0 (0.0%) |
| Legal Services & Support | 0 (0.0%) | 0 (0.0%) |
| Education Instruction & Library | 0 (0.0%) | 0 (0.0%) |
| Arts, Media & Entertainment | 0 (0.0%) | 0 (0.0%) |
| Health Diagnosing & Treating | 0 (0.0%) | 0 (0.0%) |
| Health Technologists | 0 (0.0%) | 0 (0.0%) |
| Total (Category) | 31 (31.0%) | 69 (69.0%) |
| Total (Overall) | 128 (48.7%) | 135 (51.3%) |
Services Occupations
The most common Services occupations in South Shaftsbury are Healthcare Support (19 | 7.2%), and Cleaning & Maintenance (19 | 7.2%).
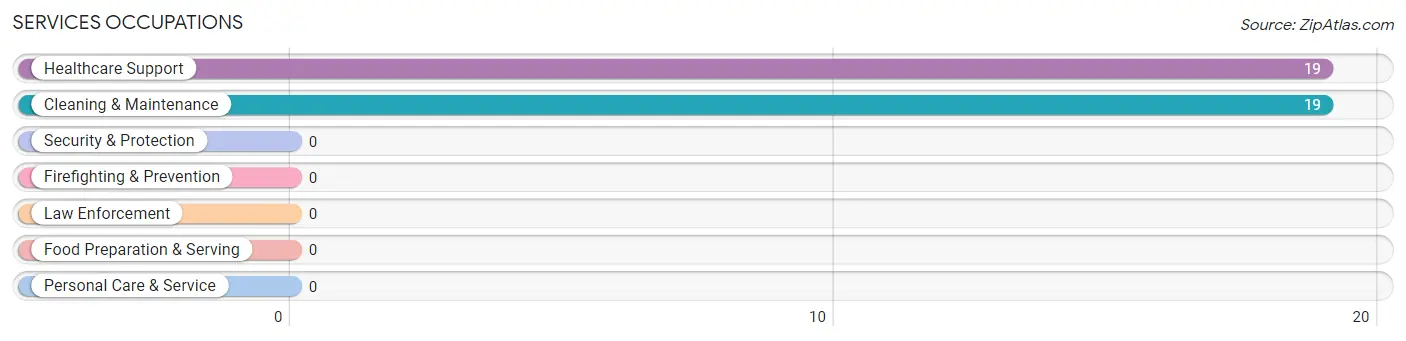
Services Occupations by Sex
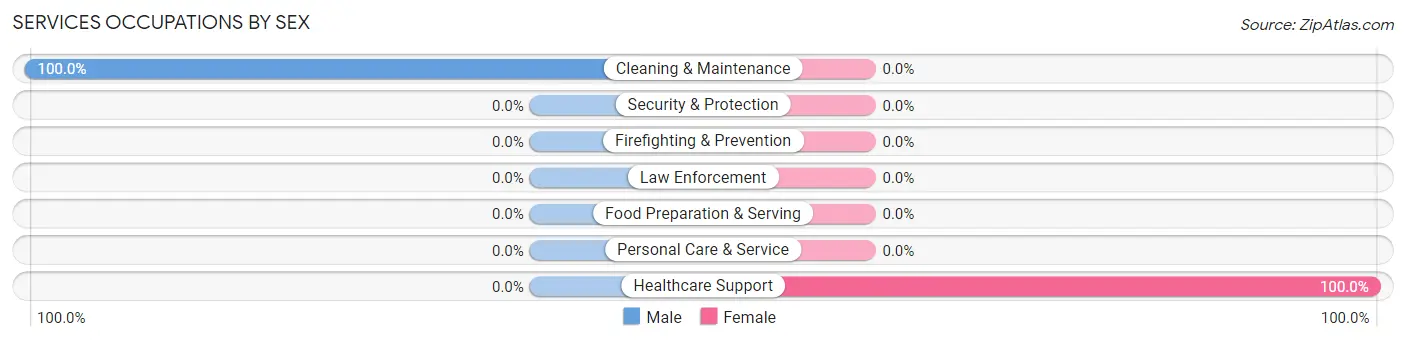
| Occupation | Male | Female |
| Healthcare Support | 0 (0.0%) | 19 (100.0%) |
| Security & Protection | 0 (0.0%) | 0 (0.0%) |
| Firefighting & Prevention | 0 (0.0%) | 0 (0.0%) |
| Law Enforcement | 0 (0.0%) | 0 (0.0%) |
| Food Preparation & Serving | 0 (0.0%) | 0 (0.0%) |
| Cleaning & Maintenance | 19 (100.0%) | 0 (0.0%) |
| Personal Care & Service | 0 (0.0%) | 0 (0.0%) |
| Total (Category) | 19 (50.0%) | 19 (50.0%) |
| Total (Overall) | 128 (48.7%) | 135 (51.3%) |
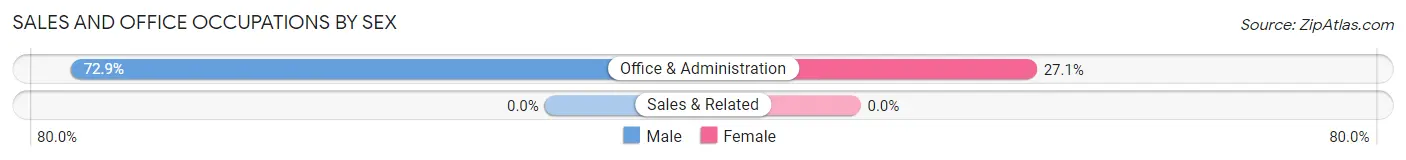
Sales and Office Occupations
The most common Sales and Office occupations in South Shaftsbury are , and Office & Administration (107 | 40.7%).
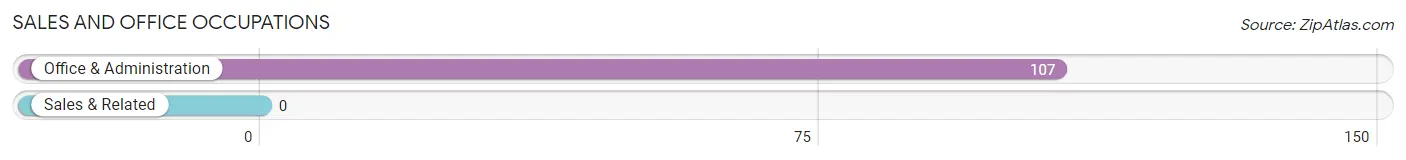
Sales and Office Occupations by Sex
| Occupation | Male | Female |
| Sales & Related | 0 (0.0%) | 0 (0.0%) |
| Office & Administration | 78 (72.9%) | 29 (27.1%) |
| Total (Category) | 78 (72.9%) | 29 (27.1%) |
| Total (Overall) | 128 (48.7%) | 135 (51.3%) |
Natural Resources, Construction and Maintenance Occupations
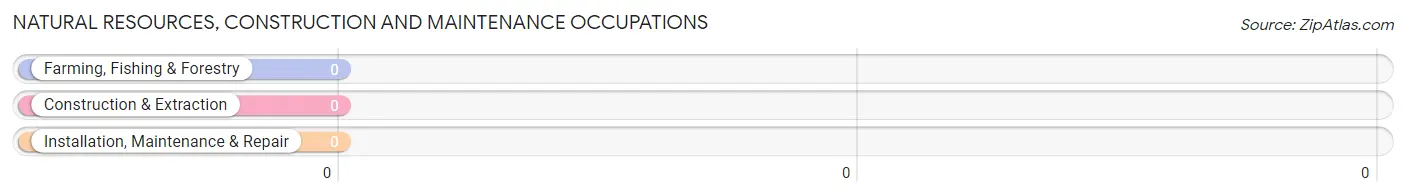
Natural Resources, Construction and Maintenance Occupations by Sex
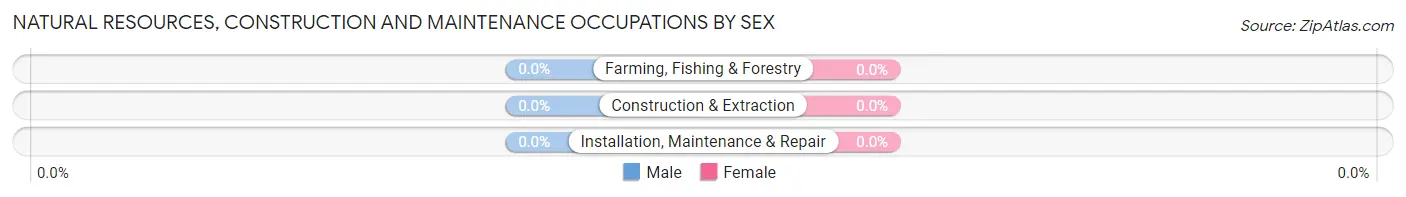
| Occupation | Male | Female |
| Farming, Fishing & Forestry | 0 (0.0%) | 0 (0.0%) |
| Construction & Extraction | 0 (0.0%) | 0 (0.0%) |
| Installation, Maintenance & Repair | 0 (0.0%) | 0 (0.0%) |
| Total (Category) | 0 (0.0%) | 0 (0.0%) |
| Total (Overall) | 128 (48.7%) | 135 (51.3%) |
Production, Transportation and Moving Occupations
The most common Production, Transportation and Moving occupations in South Shaftsbury are , and Material Moving (18 | 6.8%).
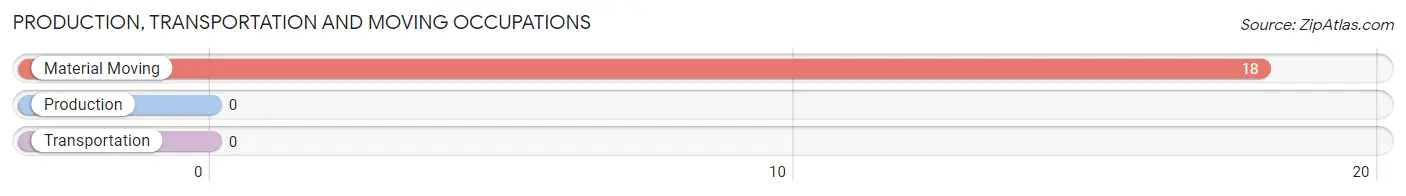
Production, Transportation and Moving Occupations by Sex
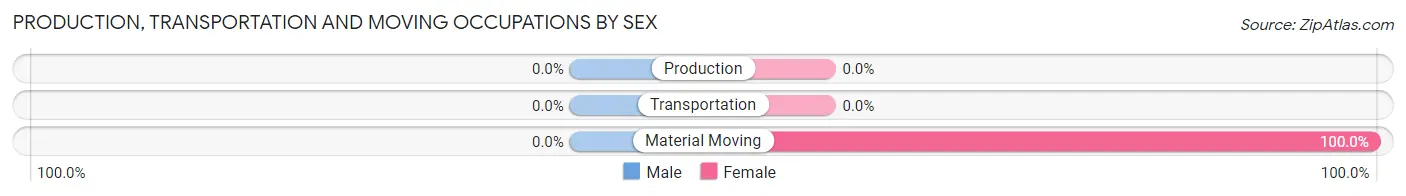
| Occupation | Male | Female |
| Production | 0 (0.0%) | 0 (0.0%) |
| Transportation | 0 (0.0%) | 0 (0.0%) |
| Material Moving | 0 (0.0%) | 18 (100.0%) |
| Total (Category) | 0 (0.0%) | 18 (100.0%) |
| Total (Overall) | 128 (48.7%) | 135 (51.3%) |
Employment Industries by Sex in South Shaftsbury
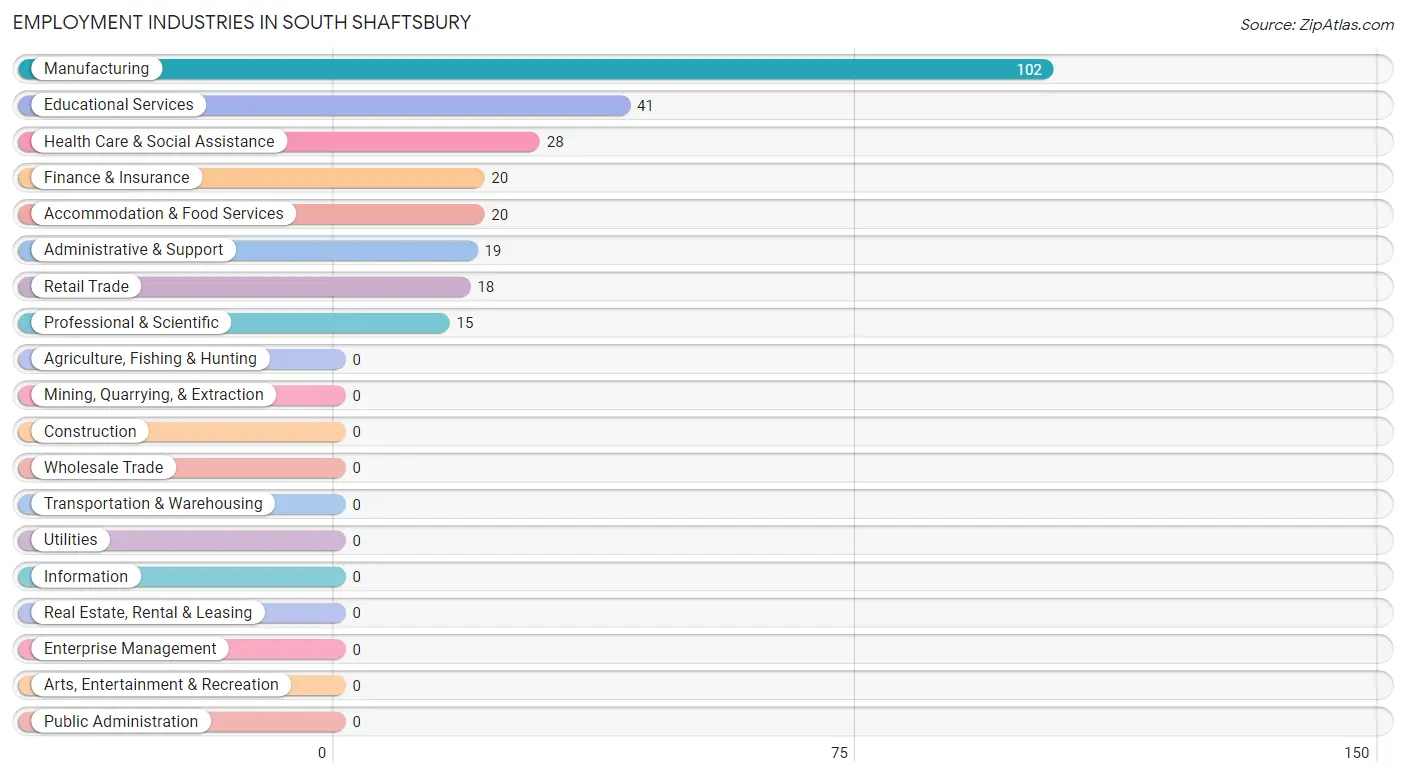
Employment Industries in South Shaftsbury
The major employment industries in South Shaftsbury include Manufacturing (102 | 38.8%), Educational Services (41 | 15.6%), Health Care & Social Assistance (28 | 10.6%), Finance & Insurance (20 | 7.6%), and Accommodation & Food Services (20 | 7.6%).
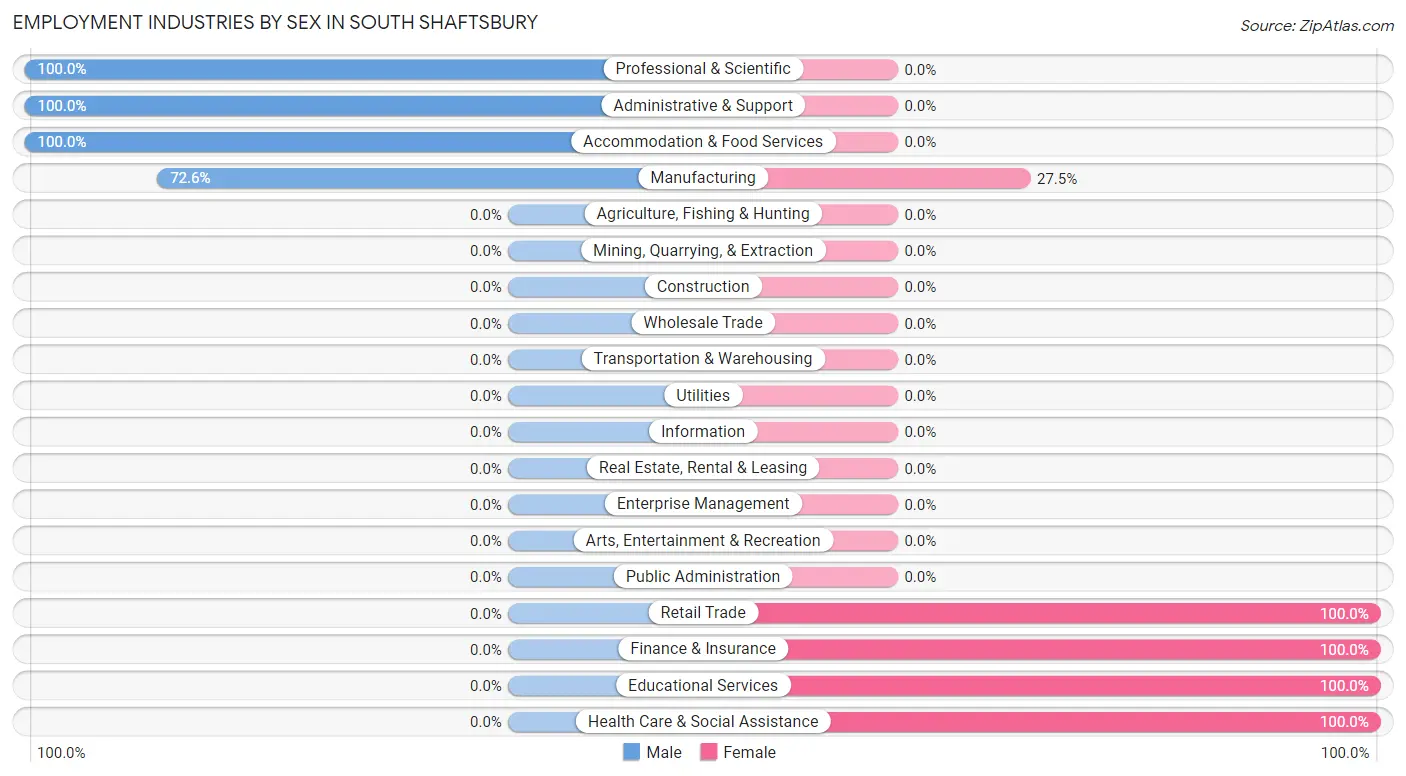
Employment Industries by Sex in South Shaftsbury
The South Shaftsbury industries that see more men than women are Professional & Scientific (100.0%), Administrative & Support (100.0%), and Accommodation & Food Services (100.0%), whereas the industries that tend to have a higher number of women are Retail Trade (100.0%), Finance & Insurance (100.0%), and Educational Services (100.0%).
| Industry | Male | Female |
| Agriculture, Fishing & Hunting | 0 (0.0%) | 0 (0.0%) |
| Mining, Quarrying, & Extraction | 0 (0.0%) | 0 (0.0%) |
| Construction | 0 (0.0%) | 0 (0.0%) |
| Manufacturing | 74 (72.6%) | 28 (27.5%) |
| Wholesale Trade | 0 (0.0%) | 0 (0.0%) |
| Retail Trade | 0 (0.0%) | 18 (100.0%) |
| Transportation & Warehousing | 0 (0.0%) | 0 (0.0%) |
| Utilities | 0 (0.0%) | 0 (0.0%) |
| Information | 0 (0.0%) | 0 (0.0%) |
| Finance & Insurance | 0 (0.0%) | 20 (100.0%) |
| Real Estate, Rental & Leasing | 0 (0.0%) | 0 (0.0%) |
| Professional & Scientific | 15 (100.0%) | 0 (0.0%) |
| Enterprise Management | 0 (0.0%) | 0 (0.0%) |
| Administrative & Support | 19 (100.0%) | 0 (0.0%) |
| Educational Services | 0 (0.0%) | 41 (100.0%) |
| Health Care & Social Assistance | 0 (0.0%) | 28 (100.0%) |
| Arts, Entertainment & Recreation | 0 (0.0%) | 0 (0.0%) |
| Accommodation & Food Services | 20 (100.0%) | 0 (0.0%) |
| Public Administration | 0 (0.0%) | 0 (0.0%) |
| Total | 128 (48.7%) | 135 (51.3%) |
Education in South Shaftsbury
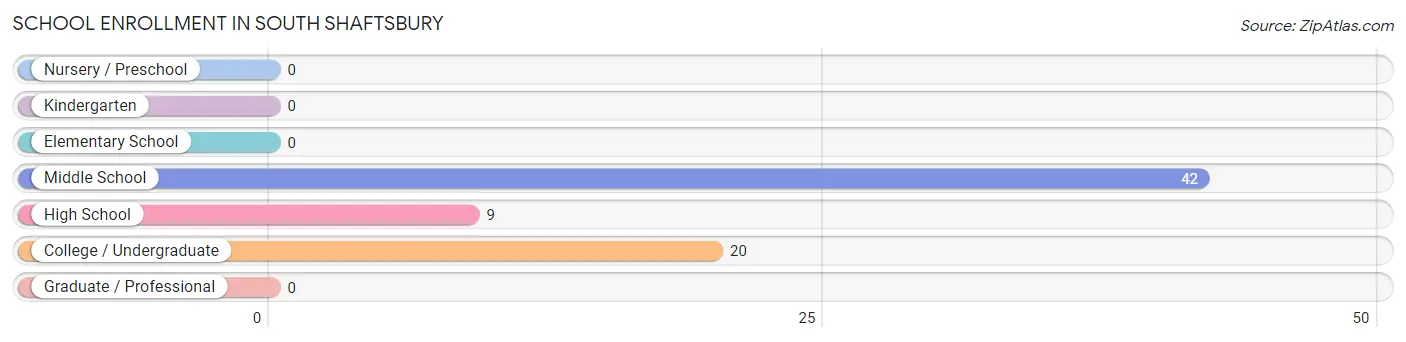
School Enrollment in South Shaftsbury
The most common levels of schooling among the 71 students in South Shaftsbury are middle school (42 | 59.2%), college / undergraduate (20 | 28.2%), and high school (9 | 12.7%).
| School Level | # Students | % Students |
| Nursery / Preschool | 0 | 0.0% |
| Kindergarten | 0 | 0.0% |
| Elementary School | 0 | 0.0% |
| Middle School | 42 | 59.2% |
| High School | 9 | 12.7% |
| College / Undergraduate | 20 | 28.2% |
| Graduate / Professional | 0 | 0.0% |
| Total | 71 | 100.0% |
School Enrollment by Age by Funding Source in South Shaftsbury
Out of a total of 71 students who are enrolled in schools in South Shaftsbury, 9 (12.7%) attend a private institution, while the remaining 62 (87.3%) are enrolled in public schools. The age group of 15 to 17 year olds has the highest likelihood of being enrolled in private schools, with 9 (100.0% in the age bracket) enrolled. Conversely, the age group of 10 to 14 year olds has the lowest likelihood of being enrolled in a private school, with 42 (100.0% in the age bracket) attending a public institution.
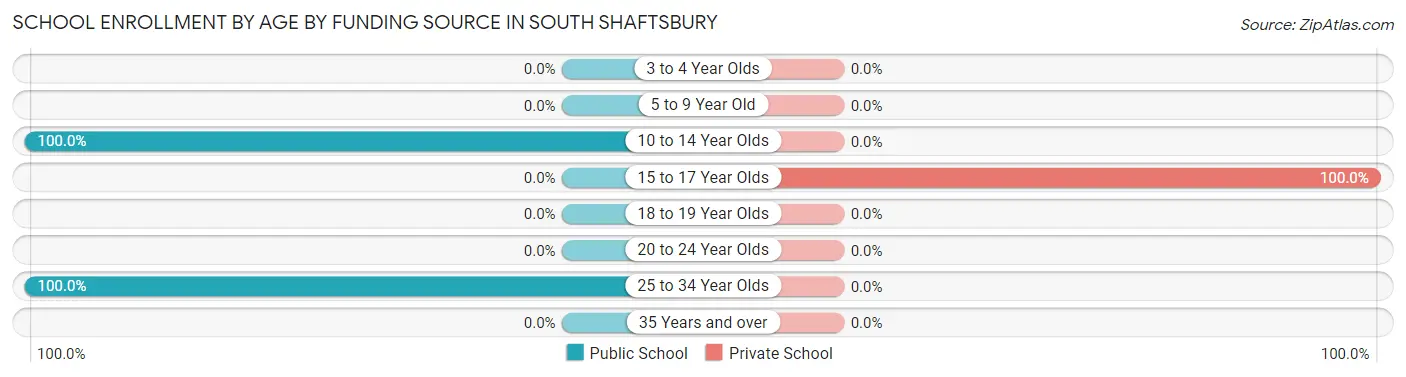
| Age Bracket | Public School | Private School |
| 3 to 4 Year Olds | 0 (0.0%) | 0 (0.0%) |
| 5 to 9 Year Old | 0 (0.0%) | 0 (0.0%) |
| 10 to 14 Year Olds | 42 (100.0%) | 0 (0.0%) |
| 15 to 17 Year Olds | 0 (0.0%) | 9 (100.0%) |
| 18 to 19 Year Olds | 0 (0.0%) | 0 (0.0%) |
| 20 to 24 Year Olds | 0 (0.0%) | 0 (0.0%) |
| 25 to 34 Year Olds | 20 (100.0%) | 0 (0.0%) |
| 35 Years and over | 0 (0.0%) | 0 (0.0%) |
| Total | 62 (87.3%) | 9 (12.7%) |
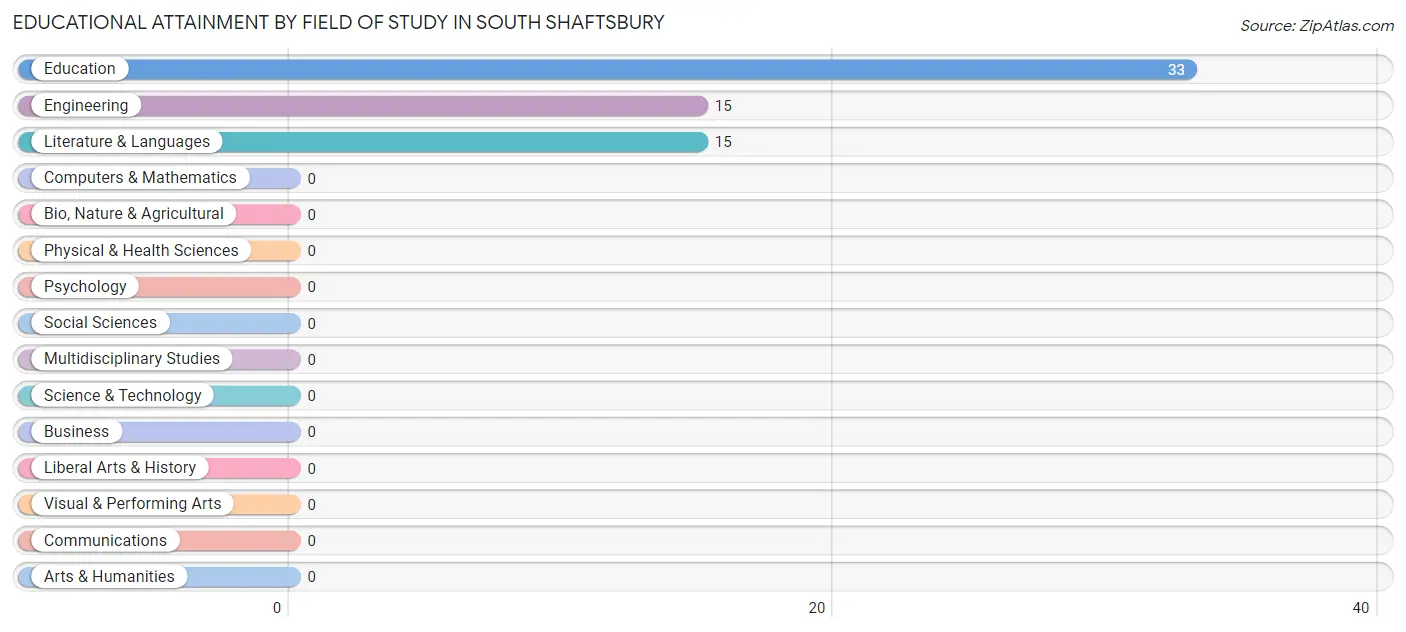
Educational Attainment by Field of Study in South Shaftsbury
Education (33 | 52.4%), engineering (15 | 23.8%), and literature & languages (15 | 23.8%) are the most common fields of study among 63 individuals in South Shaftsbury who have obtained a bachelor's degree or higher.
| Field of Study | # Graduates | % Graduates |
| Computers & Mathematics | 0 | 0.0% |
| Bio, Nature & Agricultural | 0 | 0.0% |
| Physical & Health Sciences | 0 | 0.0% |
| Psychology | 0 | 0.0% |
| Social Sciences | 0 | 0.0% |
| Engineering | 15 | 23.8% |
| Multidisciplinary Studies | 0 | 0.0% |
| Science & Technology | 0 | 0.0% |
| Business | 0 | 0.0% |
| Education | 33 | 52.4% |
| Literature & Languages | 15 | 23.8% |
| Liberal Arts & History | 0 | 0.0% |
| Visual & Performing Arts | 0 | 0.0% |
| Communications | 0 | 0.0% |
| Arts & Humanities | 0 | 0.0% |
| Total | 63 | 100.0% |
Transportation & Commute in South Shaftsbury
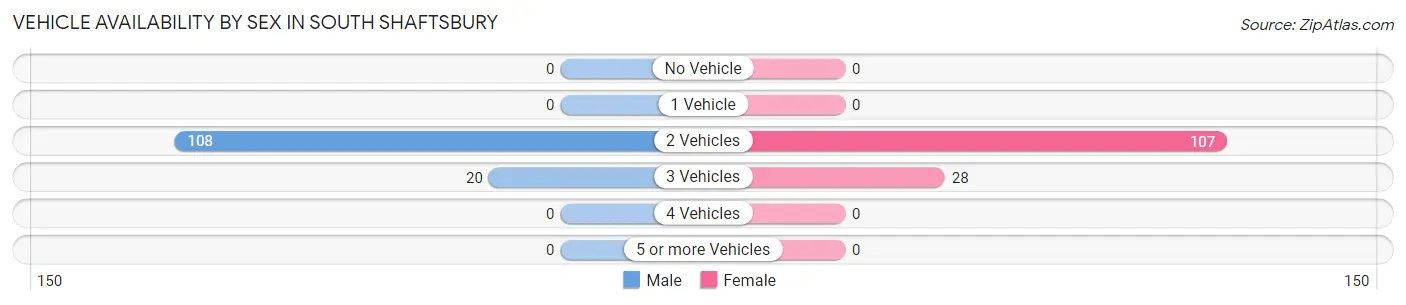
Vehicle Availability by Sex in South Shaftsbury
The most prevalent vehicle ownership categories in South Shaftsbury are males with 2 vehicles (108, accounting for 84.4%) and females with 2 vehicles (107, making up 80.0%).
| Vehicles Available | Male | Female |
| No Vehicle | 0 (0.0%) | 0 (0.0%) |
| 1 Vehicle | 0 (0.0%) | 0 (0.0%) |
| 2 Vehicles | 108 (84.4%) | 107 (79.3%) |
| 3 Vehicles | 20 (15.6%) | 28 (20.7%) |
| 4 Vehicles | 0 (0.0%) | 0 (0.0%) |
| 5 or more Vehicles | 0 (0.0%) | 0 (0.0%) |
| Total | 128 (100.0%) | 135 (100.0%) |
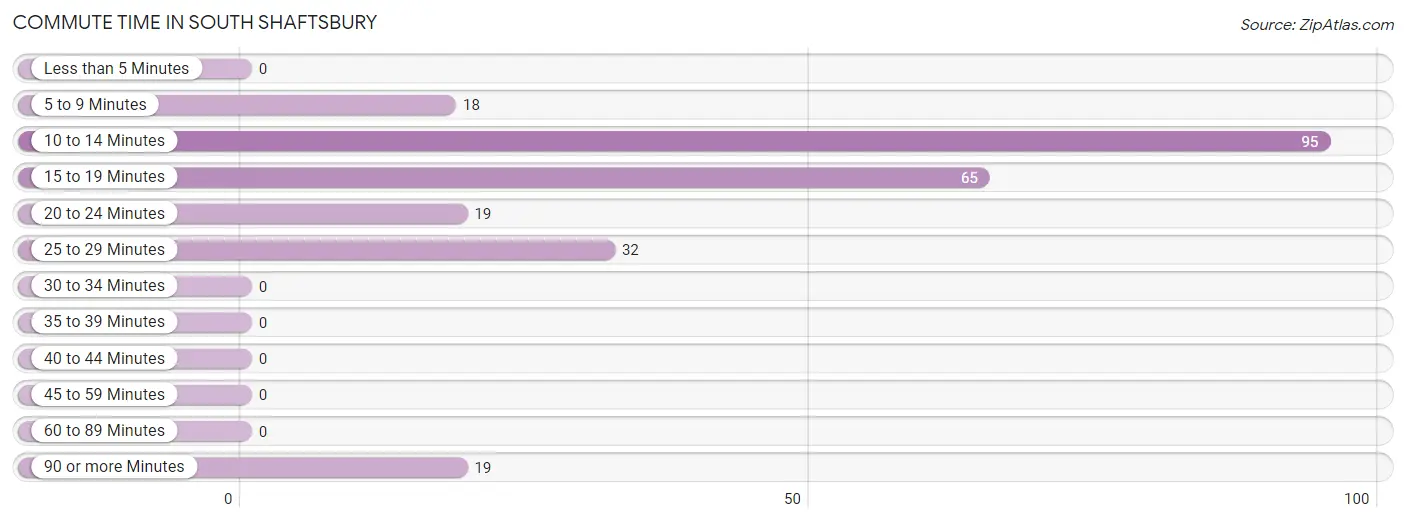
Commute Time in South Shaftsbury
The most frequently occuring commute durations in South Shaftsbury are 10 to 14 minutes (95 commuters, 38.3%), 15 to 19 minutes (65 commuters, 26.2%), and 25 to 29 minutes (32 commuters, 12.9%).
| Commute Time | # Commuters | % Commuters |
| Less than 5 Minutes | 0 | 0.0% |
| 5 to 9 Minutes | 18 | 7.3% |
| 10 to 14 Minutes | 95 | 38.3% |
| 15 to 19 Minutes | 65 | 26.2% |
| 20 to 24 Minutes | 19 | 7.7% |
| 25 to 29 Minutes | 32 | 12.9% |
| 30 to 34 Minutes | 0 | 0.0% |
| 35 to 39 Minutes | 0 | 0.0% |
| 40 to 44 Minutes | 0 | 0.0% |
| 45 to 59 Minutes | 0 | 0.0% |
| 60 to 89 Minutes | 0 | 0.0% |
| 90 or more Minutes | 19 | 7.7% |
Commute Time by Sex in South Shaftsbury
The most common commute times in South Shaftsbury are 15 to 19 minutes (36 commuters, 31.9%) for males and 10 to 14 minutes (69 commuters, 51.1%) for females.
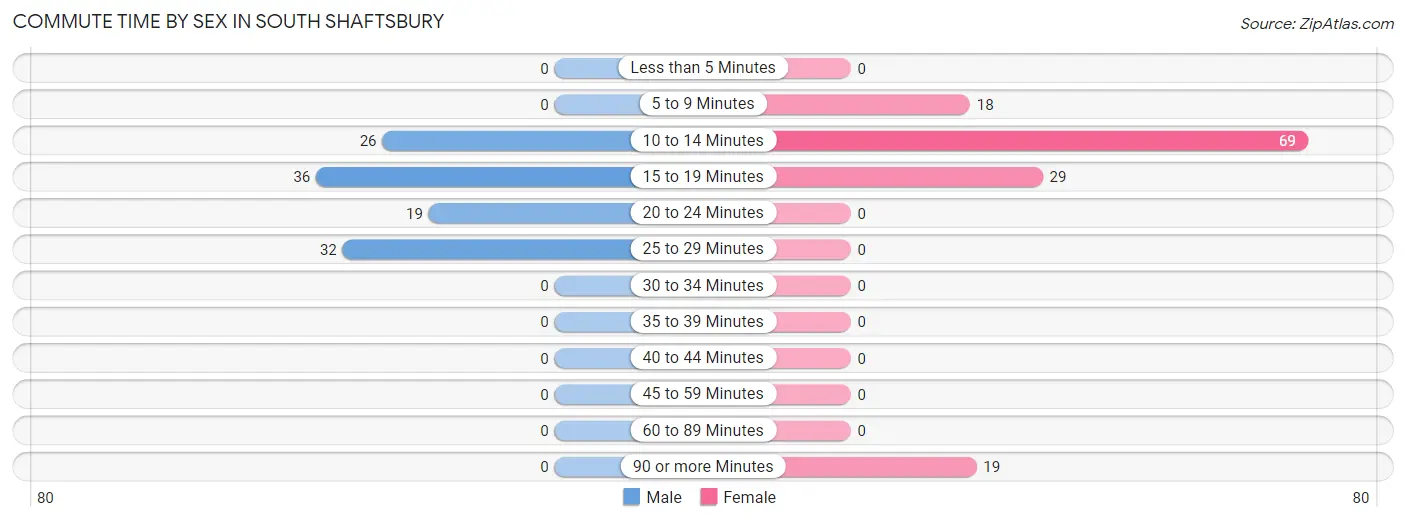
| Commute Time | Male | Female |
| Less than 5 Minutes | 0 (0.0%) | 0 (0.0%) |
| 5 to 9 Minutes | 0 (0.0%) | 18 (13.3%) |
| 10 to 14 Minutes | 26 (23.0%) | 69 (51.1%) |
| 15 to 19 Minutes | 36 (31.9%) | 29 (21.5%) |
| 20 to 24 Minutes | 19 (16.8%) | 0 (0.0%) |
| 25 to 29 Minutes | 32 (28.3%) | 0 (0.0%) |
| 30 to 34 Minutes | 0 (0.0%) | 0 (0.0%) |
| 35 to 39 Minutes | 0 (0.0%) | 0 (0.0%) |
| 40 to 44 Minutes | 0 (0.0%) | 0 (0.0%) |
| 45 to 59 Minutes | 0 (0.0%) | 0 (0.0%) |
| 60 to 89 Minutes | 0 (0.0%) | 0 (0.0%) |
| 90 or more Minutes | 0 (0.0%) | 19 (14.1%) |
Time of Departure to Work by Sex in South Shaftsbury
The most frequent times of departure to work in South Shaftsbury are 6:30 AM to 6:59 AM (42, 37.2%) for males and 9:00 AM to 9:59 AM (41, 30.4%) for females.
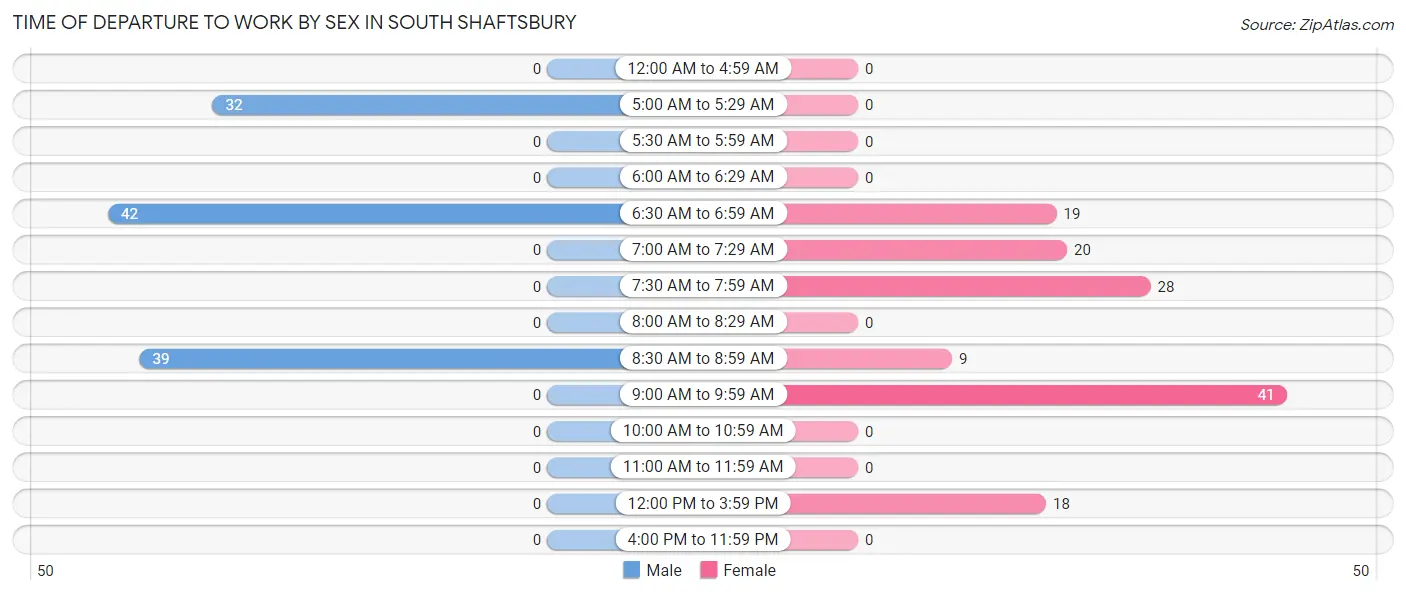
| Time of Departure | Male | Female |
| 12:00 AM to 4:59 AM | 0 (0.0%) | 0 (0.0%) |
| 5:00 AM to 5:29 AM | 32 (28.3%) | 0 (0.0%) |
| 5:30 AM to 5:59 AM | 0 (0.0%) | 0 (0.0%) |
| 6:00 AM to 6:29 AM | 0 (0.0%) | 0 (0.0%) |
| 6:30 AM to 6:59 AM | 42 (37.2%) | 19 (14.1%) |
| 7:00 AM to 7:29 AM | 0 (0.0%) | 20 (14.8%) |
| 7:30 AM to 7:59 AM | 0 (0.0%) | 28 (20.7%) |
| 8:00 AM to 8:29 AM | 0 (0.0%) | 0 (0.0%) |
| 8:30 AM to 8:59 AM | 39 (34.5%) | 9 (6.7%) |
| 9:00 AM to 9:59 AM | 0 (0.0%) | 41 (30.4%) |
| 10:00 AM to 10:59 AM | 0 (0.0%) | 0 (0.0%) |
| 11:00 AM to 11:59 AM | 0 (0.0%) | 0 (0.0%) |
| 12:00 PM to 3:59 PM | 0 (0.0%) | 18 (13.3%) |
| 4:00 PM to 11:59 PM | 0 (0.0%) | 0 (0.0%) |
| Total | 113 (100.0%) | 135 (100.0%) |
Housing Occupancy in South Shaftsbury
Occupancy by Ownership in South Shaftsbury
Of the total 183 dwellings in South Shaftsbury, owner-occupied units account for 159 (86.9%), while renter-occupied units make up 24 (13.1%).
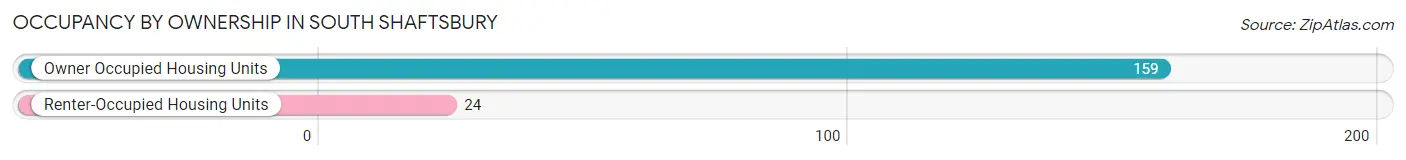
| Occupancy | # Housing Units | % Housing Units |
| Owner Occupied Housing Units | 159 | 86.9% |
| Renter-Occupied Housing Units | 24 | 13.1% |
| Total Occupied Housing Units | 183 | 100.0% |
Occupancy by Household Size in South Shaftsbury
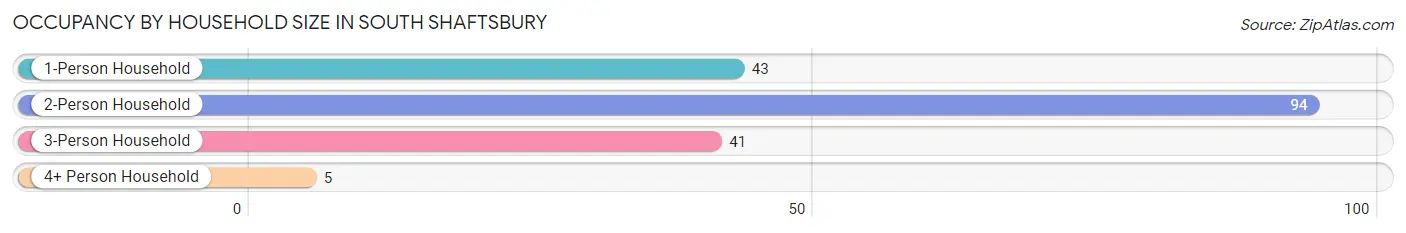
| Household Size | # Housing Units | % Housing Units |
| 1-Person Household | 43 | 23.5% |
| 2-Person Household | 94 | 51.4% |
| 3-Person Household | 41 | 22.4% |
| 4+ Person Household | 5 | 2.7% |
| Total Housing Units | 183 | 100.0% |
Occupancy by Ownership by Household Size in South Shaftsbury
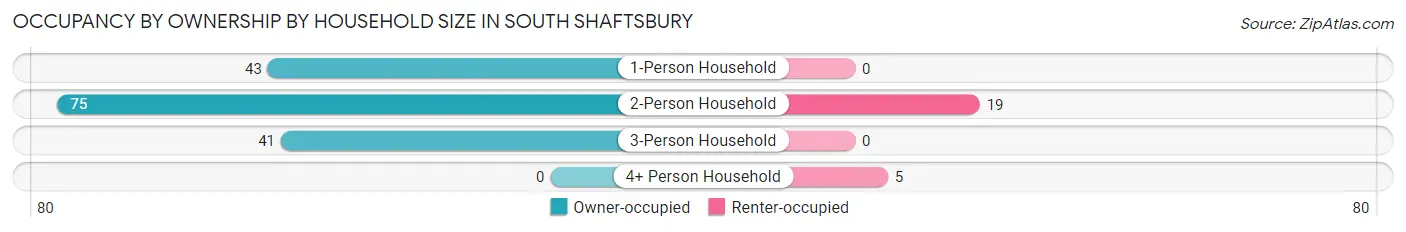
| Household Size | Owner-occupied | Renter-occupied |
| 1-Person Household | 43 (100.0%) | 0 (0.0%) |
| 2-Person Household | 75 (79.8%) | 19 (20.2%) |
| 3-Person Household | 41 (100.0%) | 0 (0.0%) |
| 4+ Person Household | 0 (0.0%) | 5 (100.0%) |
| Total Housing Units | 159 (86.9%) | 24 (13.1%) |
Occupancy by Educational Attainment in South Shaftsbury
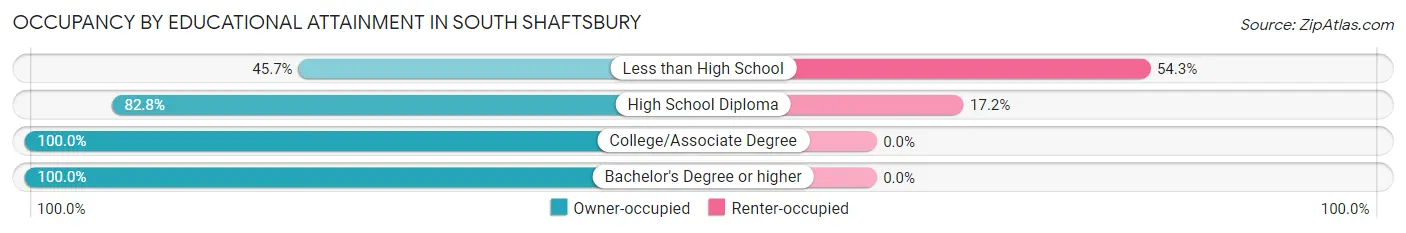
| Household Size | Owner-occupied | Renter-occupied |
| Less than High School | 16 (45.7%) | 19 (54.3%) |
| High School Diploma | 24 (82.8%) | 5 (17.2%) |
| College/Associate Degree | 69 (100.0%) | 0 (0.0%) |
| Bachelor's Degree or higher | 50 (100.0%) | 0 (0.0%) |
Occupancy by Age of Householder in South Shaftsbury
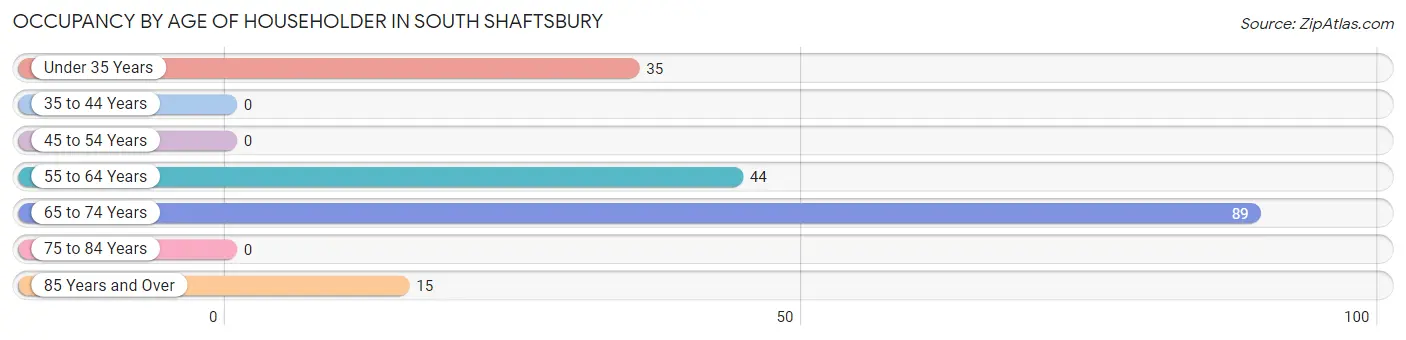
| Age Bracket | # Households | % Households |
| Under 35 Years | 35 | 19.1% |
| 35 to 44 Years | 0 | 0.0% |
| 45 to 54 Years | 0 | 0.0% |
| 55 to 64 Years | 44 | 24.0% |
| 65 to 74 Years | 89 | 48.6% |
| 75 to 84 Years | 0 | 0.0% |
| 85 Years and Over | 15 | 8.2% |
| Total | 183 | 100.0% |
Housing Finances in South Shaftsbury
Median Income by Occupancy in South Shaftsbury
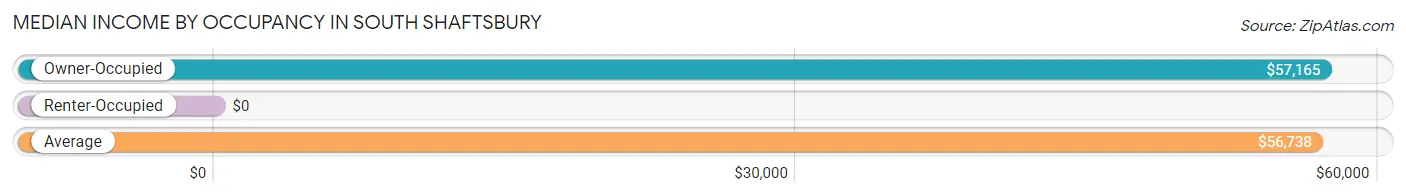
| Occupancy Type | # Households | Median Income |
| Owner-Occupied | 159 (86.9%) | $57,165 |
| Renter-Occupied | 24 (13.1%) | $0 |
| Average | 183 (100.0%) | $56,738 |
Occupancy by Householder Income Bracket in South Shaftsbury
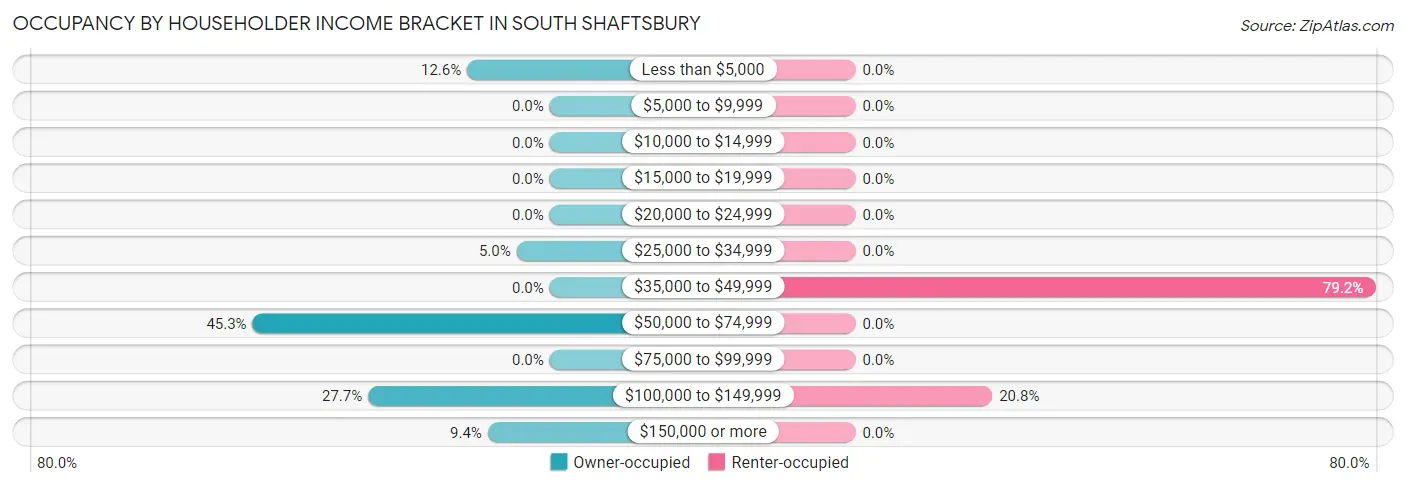
| Income Bracket | Owner-occupied | Renter-occupied |
| Less than $5,000 | 20 (12.6%) | 0 (0.0%) |
| $5,000 to $9,999 | 0 (0.0%) | 0 (0.0%) |
| $10,000 to $14,999 | 0 (0.0%) | 0 (0.0%) |
| $15,000 to $19,999 | 0 (0.0%) | 0 (0.0%) |
| $20,000 to $24,999 | 0 (0.0%) | 0 (0.0%) |
| $25,000 to $34,999 | 8 (5.0%) | 0 (0.0%) |
| $35,000 to $49,999 | 0 (0.0%) | 19 (79.2%) |
| $50,000 to $74,999 | 72 (45.3%) | 0 (0.0%) |
| $75,000 to $99,999 | 0 (0.0%) | 0 (0.0%) |
| $100,000 to $149,999 | 44 (27.7%) | 5 (20.8%) |
| $150,000 or more | 15 (9.4%) | 0 (0.0%) |
| Total | 159 (100.0%) | 24 (100.0%) |
Monthly Housing Cost Tiers in South Shaftsbury
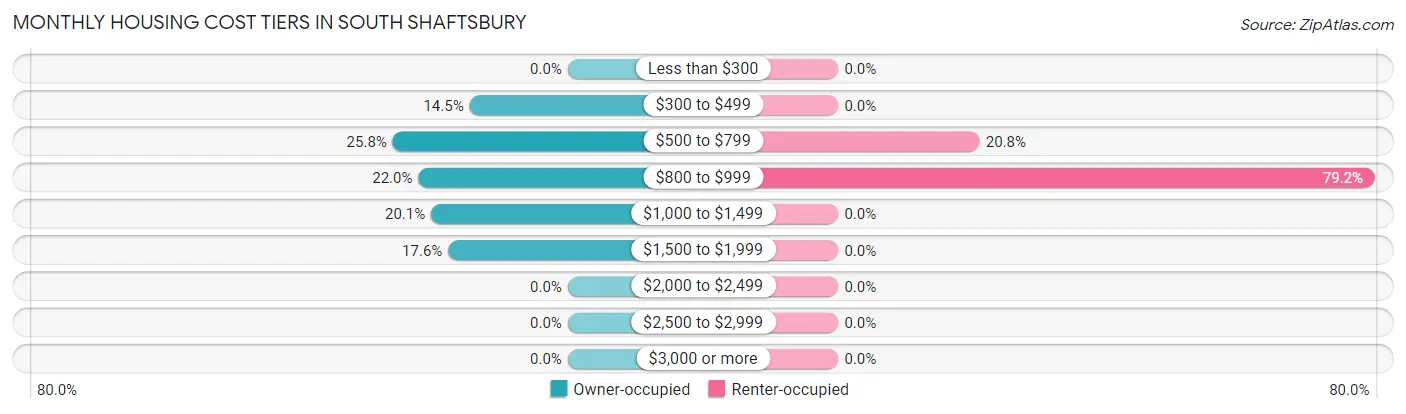
| Monthly Cost | Owner-occupied | Renter-occupied |
| Less than $300 | 0 (0.0%) | 0 (0.0%) |
| $300 to $499 | 23 (14.5%) | 0 (0.0%) |
| $500 to $799 | 41 (25.8%) | 5 (20.8%) |
| $800 to $999 | 35 (22.0%) | 19 (79.2%) |
| $1,000 to $1,499 | 32 (20.1%) | 0 (0.0%) |
| $1,500 to $1,999 | 28 (17.6%) | 0 (0.0%) |
| $2,000 to $2,499 | 0 (0.0%) | 0 (0.0%) |
| $2,500 to $2,999 | 0 (0.0%) | 0 (0.0%) |
| $3,000 or more | 0 (0.0%) | 0 (0.0%) |
| Total | 159 (100.0%) | 24 (100.0%) |
Physical Housing Characteristics in South Shaftsbury
Housing Structures in South Shaftsbury
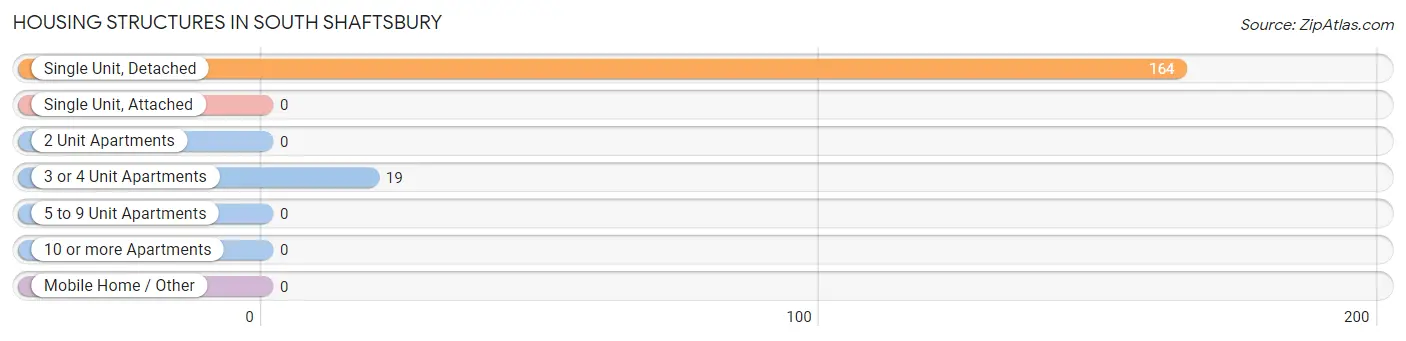
| Structure Type | # Housing Units | % Housing Units |
| Single Unit, Detached | 164 | 89.6% |
| Single Unit, Attached | 0 | 0.0% |
| 2 Unit Apartments | 0 | 0.0% |
| 3 or 4 Unit Apartments | 19 | 10.4% |
| 5 to 9 Unit Apartments | 0 | 0.0% |
| 10 or more Apartments | 0 | 0.0% |
| Mobile Home / Other | 0 | 0.0% |
| Total | 183 | 100.0% |
Housing Structures by Occupancy in South Shaftsbury
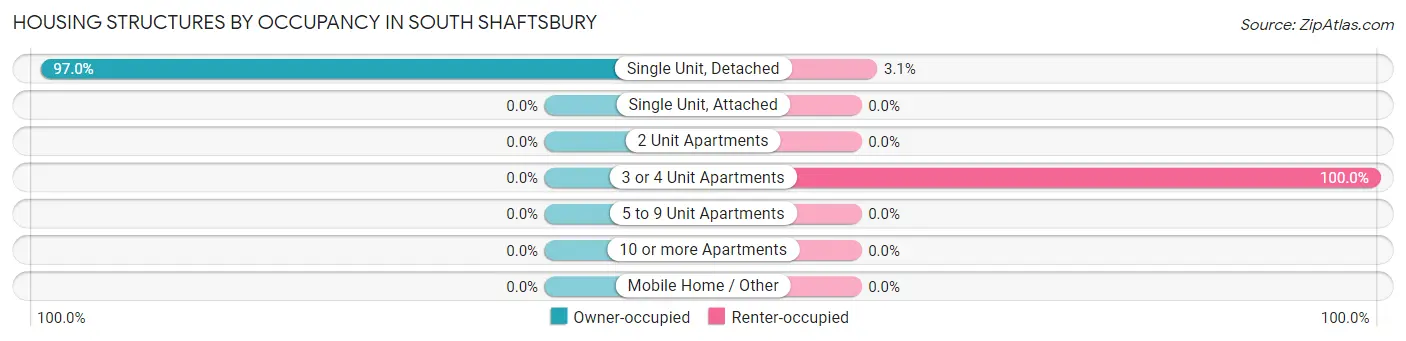
| Structure Type | Owner-occupied | Renter-occupied |
| Single Unit, Detached | 159 (97.0%) | 5 (3.0%) |
| Single Unit, Attached | 0 (0.0%) | 0 (0.0%) |
| 2 Unit Apartments | 0 (0.0%) | 0 (0.0%) |
| 3 or 4 Unit Apartments | 0 (0.0%) | 19 (100.0%) |
| 5 to 9 Unit Apartments | 0 (0.0%) | 0 (0.0%) |
| 10 or more Apartments | 0 (0.0%) | 0 (0.0%) |
| Mobile Home / Other | 0 (0.0%) | 0 (0.0%) |
| Total | 159 (86.9%) | 24 (13.1%) |
Housing Structures by Number of Rooms in South Shaftsbury
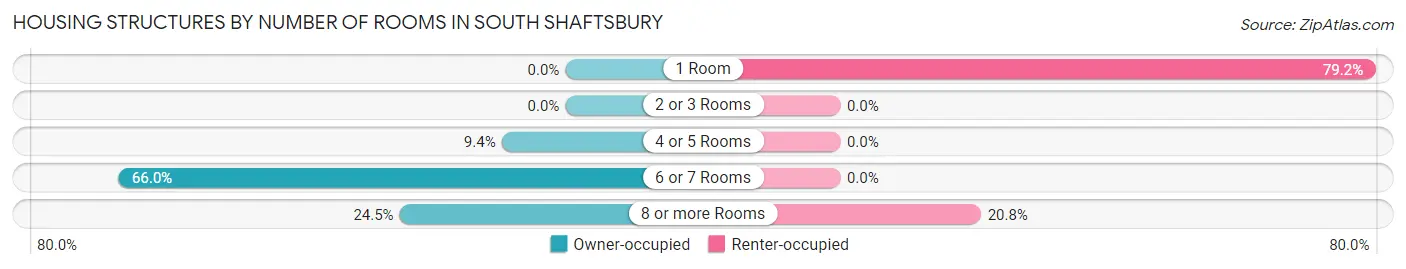
| Number of Rooms | Owner-occupied | Renter-occupied |
| 1 Room | 0 (0.0%) | 19 (79.2%) |
| 2 or 3 Rooms | 0 (0.0%) | 0 (0.0%) |
| 4 or 5 Rooms | 15 (9.4%) | 0 (0.0%) |
| 6 or 7 Rooms | 105 (66.0%) | 0 (0.0%) |
| 8 or more Rooms | 39 (24.5%) | 5 (20.8%) |
| Total | 159 (100.0%) | 24 (100.0%) |
Housing Structure by Heating Type in South Shaftsbury
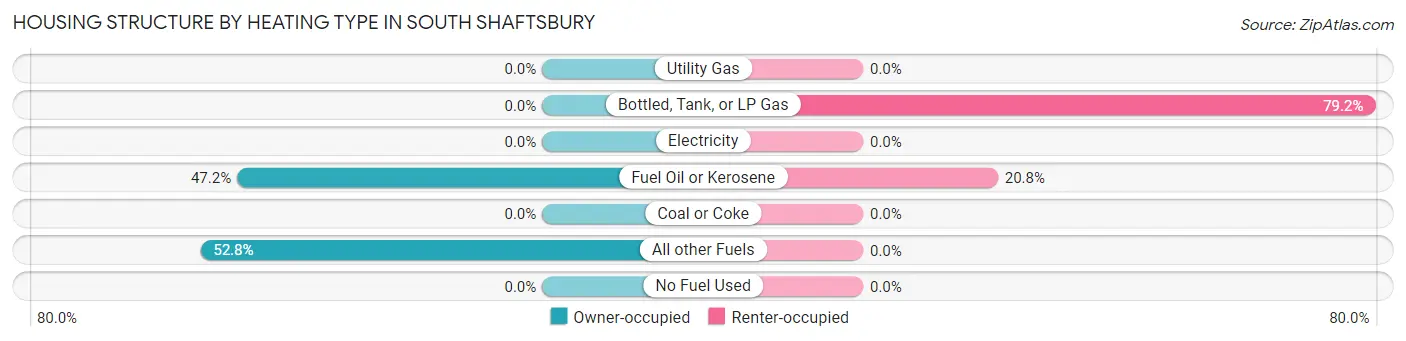
| Heating Type | Owner-occupied | Renter-occupied |
| Utility Gas | 0 (0.0%) | 0 (0.0%) |
| Bottled, Tank, or LP Gas | 0 (0.0%) | 19 (79.2%) |
| Electricity | 0 (0.0%) | 0 (0.0%) |
| Fuel Oil or Kerosene | 75 (47.2%) | 5 (20.8%) |
| Coal or Coke | 0 (0.0%) | 0 (0.0%) |
| All other Fuels | 84 (52.8%) | 0 (0.0%) |
| No Fuel Used | 0 (0.0%) | 0 (0.0%) |
| Total | 159 (100.0%) | 24 (100.0%) |
Household Vehicle Usage in South Shaftsbury
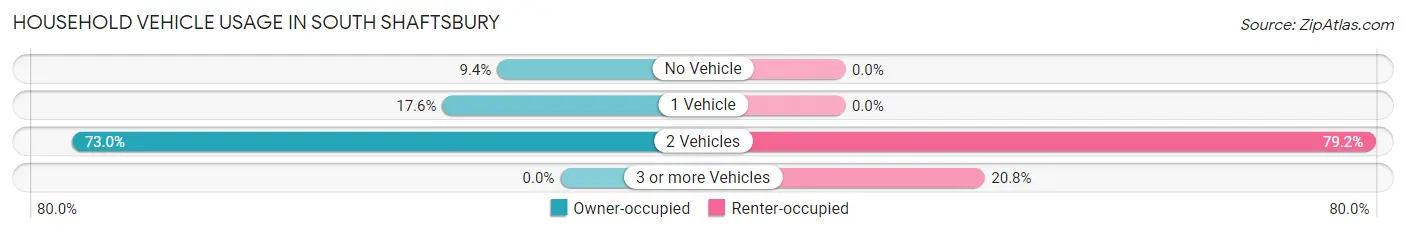
| Vehicles per Household | Owner-occupied | Renter-occupied |
| No Vehicle | 15 (9.4%) | 0 (0.0%) |
| 1 Vehicle | 28 (17.6%) | 0 (0.0%) |
| 2 Vehicles | 116 (73.0%) | 19 (79.2%) |
| 3 or more Vehicles | 0 (0.0%) | 5 (20.8%) |
| Total | 159 (100.0%) | 24 (100.0%) |
Real Estate & Mortgages in South Shaftsbury
Real Estate and Mortgage Overview in South Shaftsbury
| Characteristic | Without Mortgage | With Mortgage |
| Housing Units | 79 | 80 |
| Median Property Value | $229,900 | $143,800 |
| Median Household Income | $56,921 | $0 |
| Monthly Housing Costs | $640 | $0 |
| Real Estate Taxes | $3,402 | $0 |
Property Value by Mortgage Status in South Shaftsbury
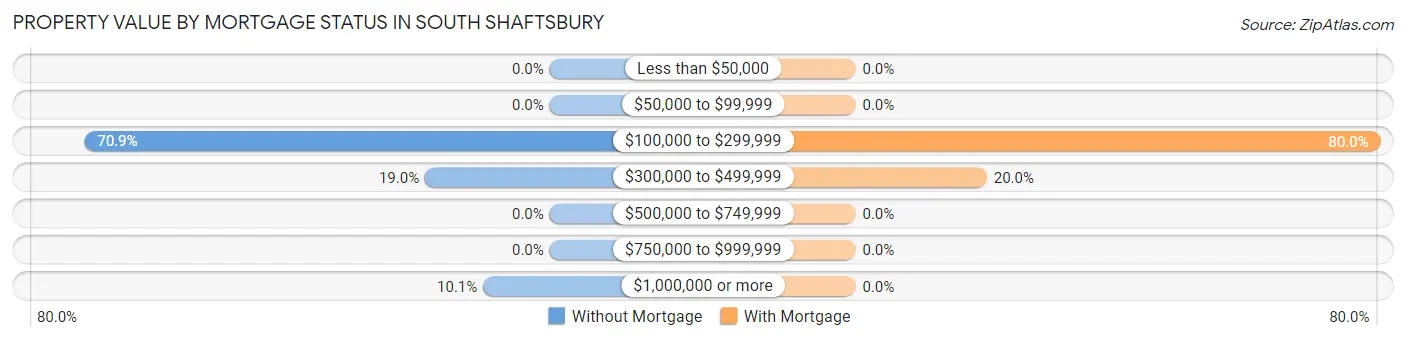
| Property Value | Without Mortgage | With Mortgage |
| Less than $50,000 | 0 (0.0%) | 0 (0.0%) |
| $50,000 to $99,999 | 0 (0.0%) | 0 (0.0%) |
| $100,000 to $299,999 | 56 (70.9%) | 64 (80.0%) |
| $300,000 to $499,999 | 15 (19.0%) | 16 (20.0%) |
| $500,000 to $749,999 | 0 (0.0%) | 0 (0.0%) |
| $750,000 to $999,999 | 0 (0.0%) | 0 (0.0%) |
| $1,000,000 or more | 8 (10.1%) | 0 (0.0%) |
| Total | 79 (100.0%) | 80 (100.0%) |
Household Income by Mortgage Status in South Shaftsbury
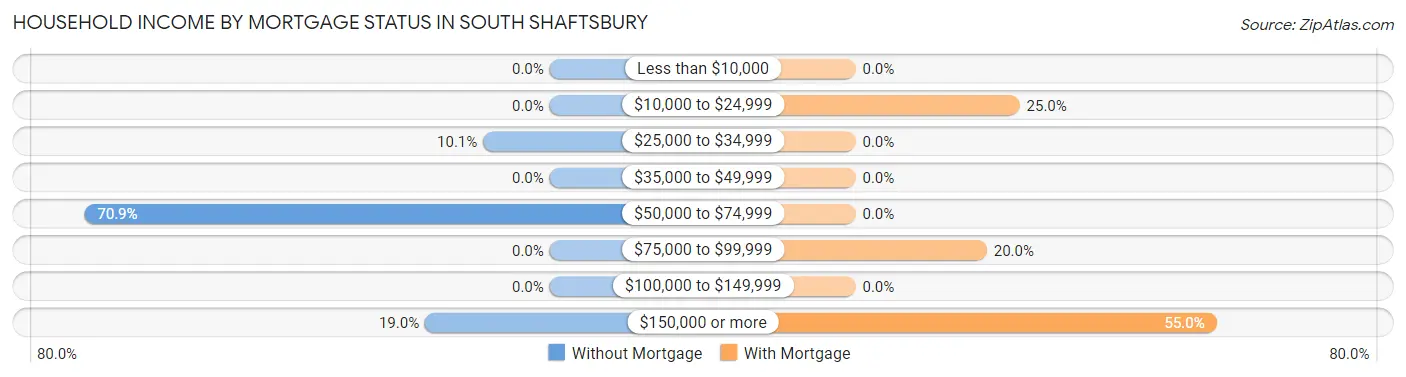
| Household Income | Without Mortgage | With Mortgage |
| Less than $10,000 | 0 (0.0%) | 0 (0.0%) |
| $10,000 to $24,999 | 0 (0.0%) | 20 (25.0%) |
| $25,000 to $34,999 | 8 (10.1%) | 0 (0.0%) |
| $35,000 to $49,999 | 0 (0.0%) | 0 (0.0%) |
| $50,000 to $74,999 | 56 (70.9%) | 0 (0.0%) |
| $75,000 to $99,999 | 0 (0.0%) | 16 (20.0%) |
| $100,000 to $149,999 | 0 (0.0%) | 0 (0.0%) |
| $150,000 or more | 15 (19.0%) | 44 (55.0%) |
| Total | 79 (100.0%) | 80 (100.0%) |
Property Value to Household Income Ratio in South Shaftsbury
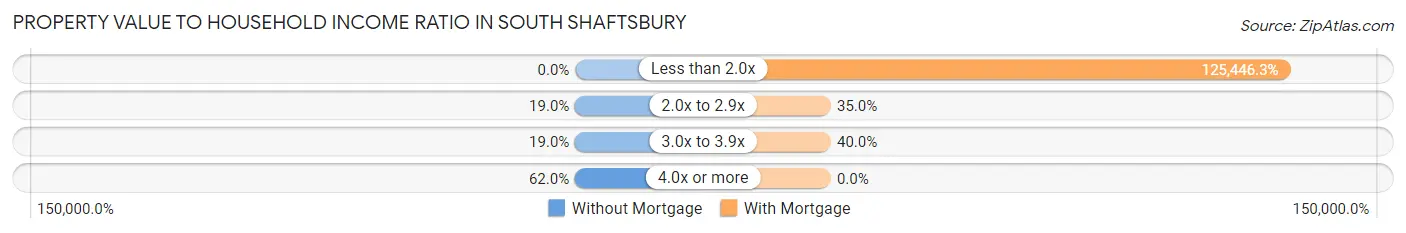
| Value-to-Income Ratio | Without Mortgage | With Mortgage |
| Less than 2.0x | 0 (0.0%) | 100,357 (125,446.3%) |
| 2.0x to 2.9x | 15 (19.0%) | 28 (35.0%) |
| 3.0x to 3.9x | 15 (19.0%) | 32 (40.0%) |
| 4.0x or more | 49 (62.0%) | 0 (0.0%) |
| Total | 79 (100.0%) | 80 (100.0%) |
Real Estate Taxes by Mortgage Status in South Shaftsbury
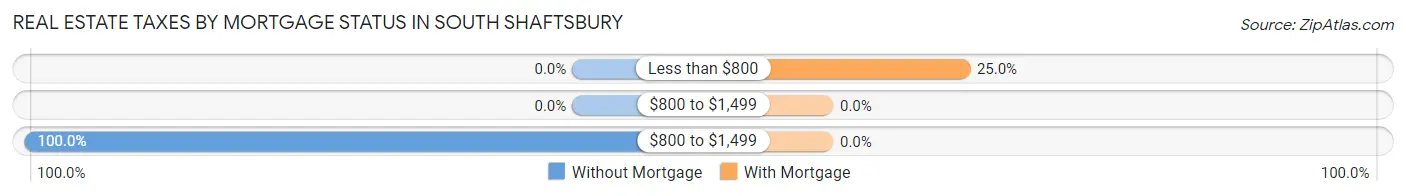
| Property Taxes | Without Mortgage | With Mortgage |
| Less than $800 | 0 (0.0%) | 20 (25.0%) |
| $800 to $1,499 | 0 (0.0%) | 0 (0.0%) |
| $800 to $1,499 | 79 (100.0%) | 0 (0.0%) |
| Total | 79 (100.0%) | 80 (100.0%) |
Health & Disability in South Shaftsbury
Health Insurance Coverage by Age in South Shaftsbury
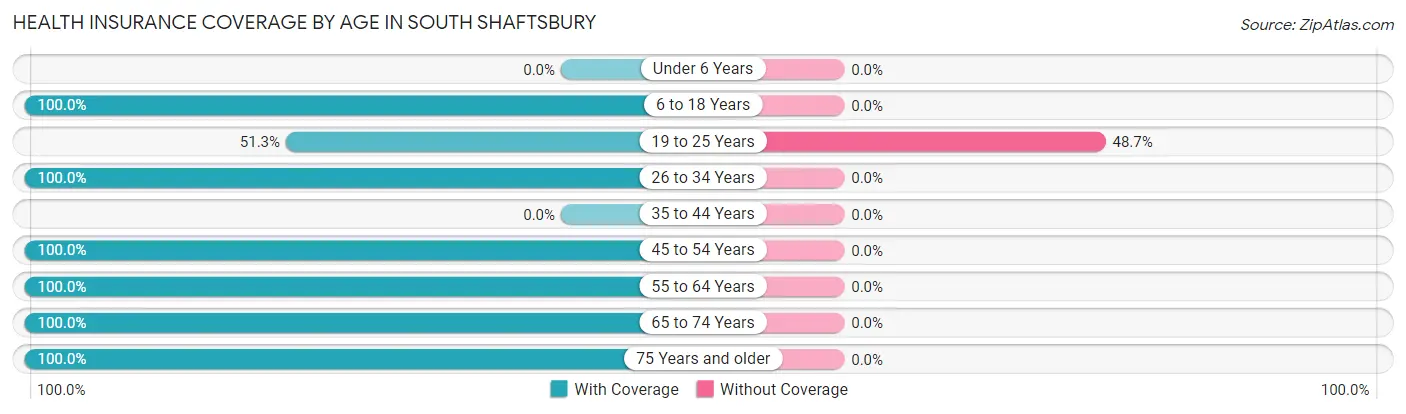
| Age Bracket | With Coverage | Without Coverage |
| Under 6 Years | 0 (0.0%) | 0 (0.0%) |
| 6 to 18 Years | 51 (100.0%) | 0 (0.0%) |
| 19 to 25 Years | 20 (51.3%) | 19 (48.7%) |
| 26 to 34 Years | 36 (100.0%) | 0 (0.0%) |
| 35 to 44 Years | 0 (0.0%) | 0 (0.0%) |
| 45 to 54 Years | 69 (100.0%) | 0 (0.0%) |
| 55 to 64 Years | 70 (100.0%) | 0 (0.0%) |
| 65 to 74 Years | 147 (100.0%) | 0 (0.0%) |
| 75 Years and older | 15 (100.0%) | 0 (0.0%) |
| Total | 408 (95.6%) | 19 (4.4%) |
Health Insurance Coverage by Citizenship Status in South Shaftsbury
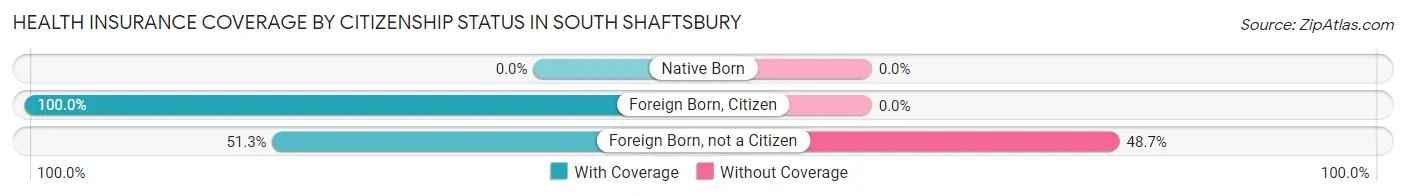
| Citizenship Status | With Coverage | Without Coverage |
| Native Born | 0 (0.0%) | 0 (0.0%) |
| Foreign Born, Citizen | 51 (100.0%) | 0 (0.0%) |
| Foreign Born, not a Citizen | 20 (51.3%) | 19 (48.7%) |
Health Insurance Coverage by Household Income in South Shaftsbury
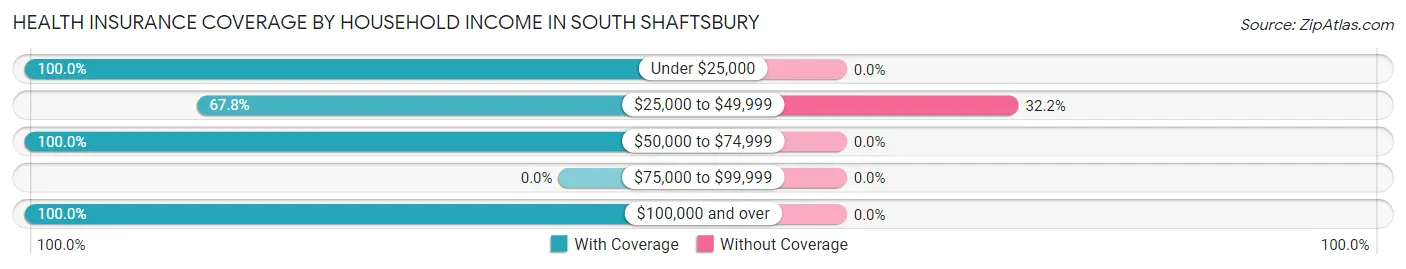
| Household Income | With Coverage | Without Coverage |
| Under $25,000 | 20 (100.0%) | 0 (0.0%) |
| $25,000 to $49,999 | 40 (67.8%) | 19 (32.2%) |
| $50,000 to $74,999 | 177 (100.0%) | 0 (0.0%) |
| $75,000 to $99,999 | 0 (0.0%) | 0 (0.0%) |
| $100,000 and over | 171 (100.0%) | 0 (0.0%) |
Public vs Private Health Insurance Coverage by Age in South Shaftsbury
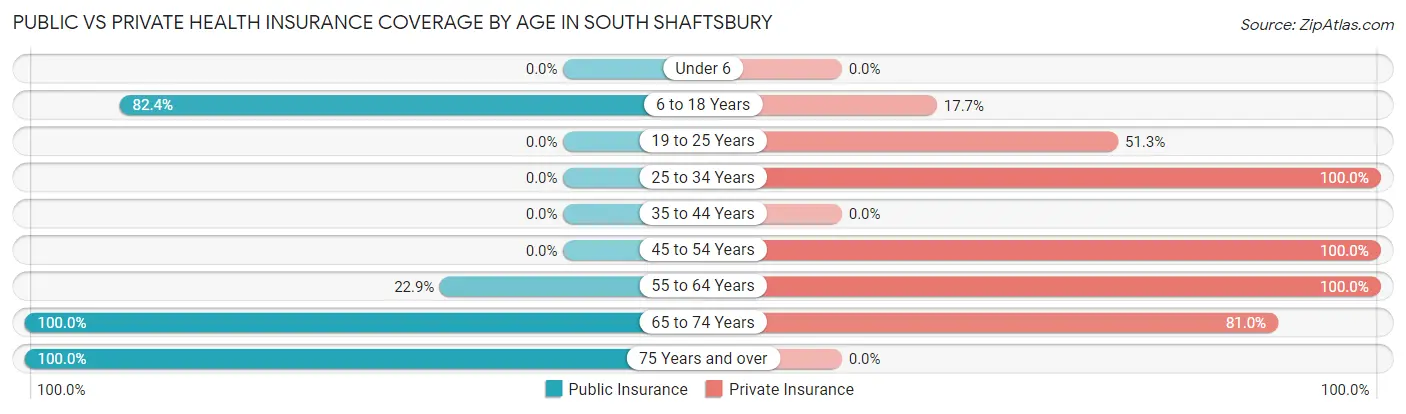
| Age Bracket | Public Insurance | Private Insurance |
| Under 6 | 0 (0.0%) | 0 (0.0%) |
| 6 to 18 Years | 42 (82.4%) | 9 (17.6%) |
| 19 to 25 Years | 0 (0.0%) | 20 (51.3%) |
| 25 to 34 Years | 0 (0.0%) | 36 (100.0%) |
| 35 to 44 Years | 0 (0.0%) | 0 (0.0%) |
| 45 to 54 Years | 0 (0.0%) | 69 (100.0%) |
| 55 to 64 Years | 16 (22.9%) | 70 (100.0%) |
| 65 to 74 Years | 147 (100.0%) | 119 (80.9%) |
| 75 Years and over | 15 (100.0%) | 0 (0.0%) |
| Total | 220 (51.5%) | 323 (75.6%) |
Disability Status by Sex by Age in South Shaftsbury
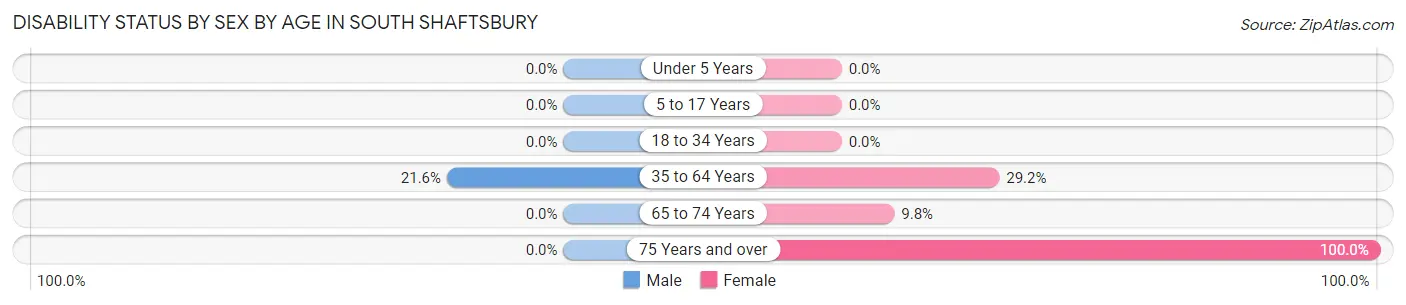
| Age Bracket | Male | Female |
| Under 5 Years | 0 (0.0%) | 0 (0.0%) |
| 5 to 17 Years | 0 (0.0%) | 0 (0.0%) |
| 18 to 34 Years | 0 (0.0%) | 0 (0.0%) |
| 35 to 64 Years | 16 (21.6%) | 19 (29.2%) |
| 65 to 74 Years | 0 (0.0%) | 8 (9.8%) |
| 75 Years and over | 0 (0.0%) | 15 (100.0%) |
Disability Class by Sex by Age in South Shaftsbury
Disability Class: Hearing Difficulty
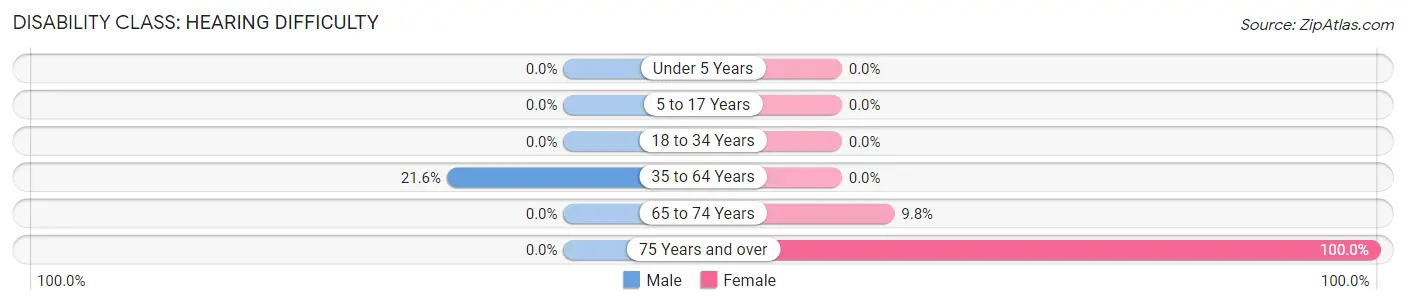
| Age Bracket | Male | Female |
| Under 5 Years | 0 (0.0%) | 0 (0.0%) |
| 5 to 17 Years | 0 (0.0%) | 0 (0.0%) |
| 18 to 34 Years | 0 (0.0%) | 0 (0.0%) |
| 35 to 64 Years | 16 (21.6%) | 0 (0.0%) |
| 65 to 74 Years | 0 (0.0%) | 8 (9.8%) |
| 75 Years and over | 0 (0.0%) | 15 (100.0%) |
Disability Class: Vision Difficulty
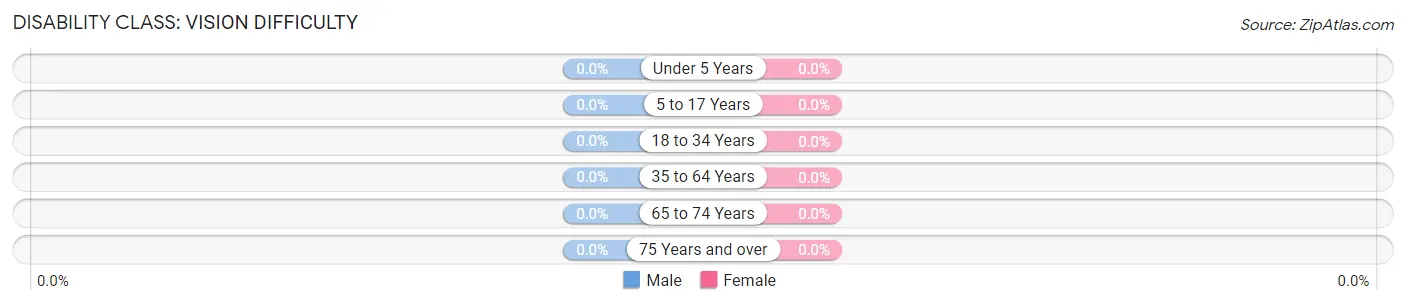
| Age Bracket | Male | Female |
| Under 5 Years | 0 (0.0%) | 0 (0.0%) |
| 5 to 17 Years | 0 (0.0%) | 0 (0.0%) |
| 18 to 34 Years | 0 (0.0%) | 0 (0.0%) |
| 35 to 64 Years | 0 (0.0%) | 0 (0.0%) |
| 65 to 74 Years | 0 (0.0%) | 0 (0.0%) |
| 75 Years and over | 0 (0.0%) | 0 (0.0%) |
Disability Class: Cognitive Difficulty
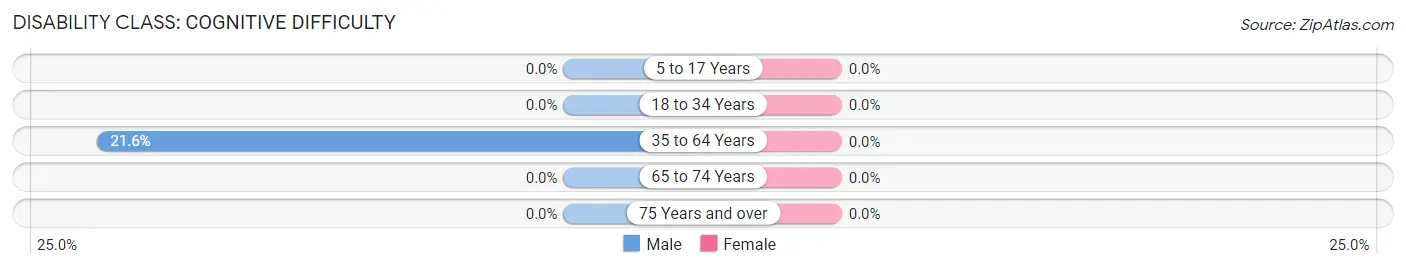
| Age Bracket | Male | Female |
| 5 to 17 Years | 0 (0.0%) | 0 (0.0%) |
| 18 to 34 Years | 0 (0.0%) | 0 (0.0%) |
| 35 to 64 Years | 16 (21.6%) | 0 (0.0%) |
| 65 to 74 Years | 0 (0.0%) | 0 (0.0%) |
| 75 Years and over | 0 (0.0%) | 0 (0.0%) |
Disability Class: Ambulatory Difficulty
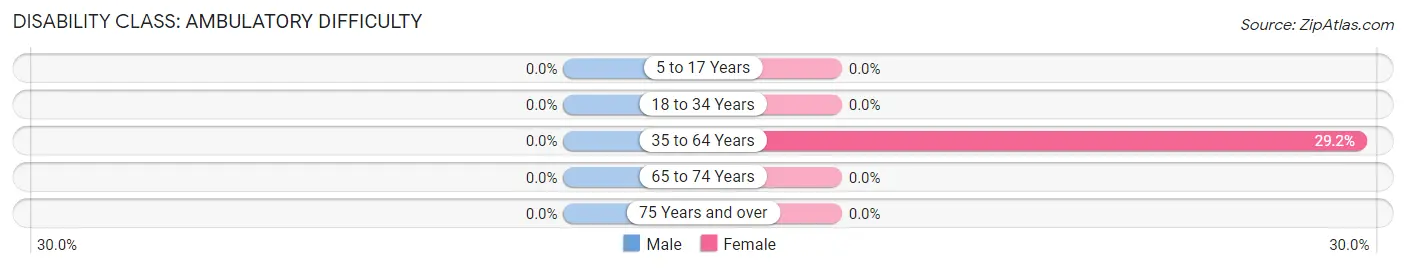
| Age Bracket | Male | Female |
| 5 to 17 Years | 0 (0.0%) | 0 (0.0%) |
| 18 to 34 Years | 0 (0.0%) | 0 (0.0%) |
| 35 to 64 Years | 0 (0.0%) | 19 (29.2%) |
| 65 to 74 Years | 0 (0.0%) | 0 (0.0%) |
| 75 Years and over | 0 (0.0%) | 0 (0.0%) |
Disability Class: Self-Care Difficulty
| Age Bracket | Male | Female |
| 5 to 17 Years | 0 (0.0%) | 0 (0.0%) |
| 18 to 34 Years | 0 (0.0%) | 0 (0.0%) |
| 35 to 64 Years | 0 (0.0%) | 0 (0.0%) |
| 65 to 74 Years | 0 (0.0%) | 0 (0.0%) |
| 75 Years and over | 0 (0.0%) | 0 (0.0%) |
Technology Access in South Shaftsbury
Computing Device Access in South Shaftsbury
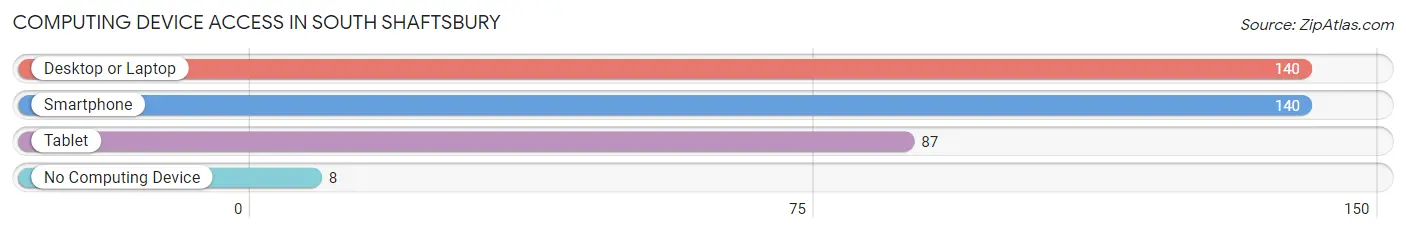
| Device Type | # Households | % Households |
| Desktop or Laptop | 140 | 76.5% |
| Smartphone | 140 | 76.5% |
| Tablet | 87 | 47.5% |
| No Computing Device | 8 | 4.4% |
| Total | 183 | 100.0% |
Internet Access in South Shaftsbury
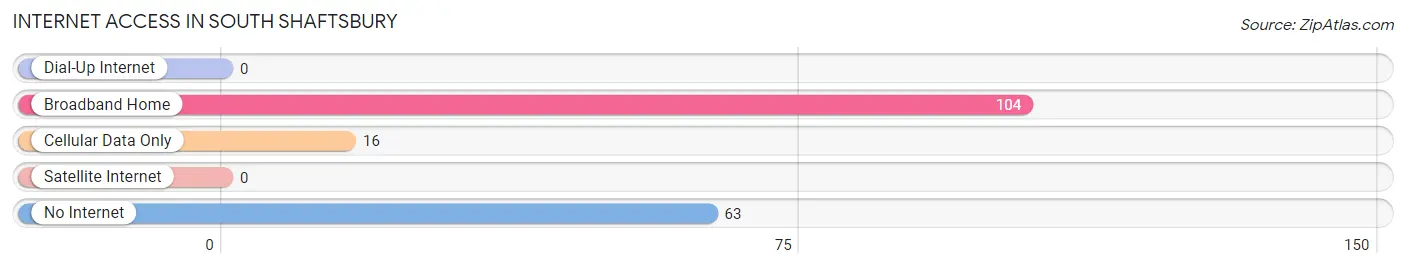
| Internet Type | # Households | % Households |
| Dial-Up Internet | 0 | 0.0% |
| Broadband Home | 104 | 56.8% |
| Cellular Data Only | 16 | 8.7% |
| Satellite Internet | 0 | 0.0% |
| No Internet | 63 | 34.4% |
| Total | 183 | 100.0% |
South Shaftsbury Summary
Shaftsbury is a town located in Bennington County, Vermont, United States. It is situated in the southwestern corner of the state, and is bordered by the towns of Arlington, Rupert, and Woodford. The town was chartered in 1761 and was named after the Earl of Shaftesbury. As of the 2010 census, the town had a total population of 2,686.
History
The area that is now Shaftsbury was originally inhabited by the Abenaki Native American tribe. The first European settlers arrived in the area in the late 1750s, and the town was officially chartered in 1761. The town was named after the Earl of Shaftesbury, Anthony Ashley Cooper.
The town was an agricultural community for much of its history, and the town's economy was largely based on dairy farming. In the late 19th century, the town was home to several small industries, including a sawmill, a gristmill, and a tannery.
Geography
Shaftsbury is located in southwestern Vermont, in Bennington County. It is bordered by the towns of Arlington to the north, Rupert to the east, and Woodford to the south and west. The town is situated in the Taconic Mountains, and is home to several small mountains, including Bald Mountain, which has an elevation of 1,945 feet.
The town is drained by the Batten Kill, which flows through the town from north to south. The town is home to several small lakes, including Lake Paran, which is located in the northern part of the town.
Economy
The economy of Shaftsbury is largely based on agriculture and tourism. The town is home to several small farms, which produce dairy products, vegetables, and fruits. The town is also home to several small businesses, including restaurants, retail stores, and lodging establishments.
The town is also home to several small manufacturing companies, including a furniture manufacturer and a plastics manufacturer. The town is also home to several small technology companies, including a software development company and a web design company.
Demographics
As of the 2010 census, there were 2,686 people, 1,093 households, and 745 families residing in the town. The population density was 79.3 people per square mile (30.6/km2). There were 1,179 housing units at an average density of 34.3 per square mile (13.2/km2). The racial makeup of the town was 97.2% White, 0.4% African American, 0.2% Native American, 0.4% Asian, 0.1% Pacific Islander, 0.4% from other races, and 1.3% from two or more races. Hispanic or Latino of any race were 1.3% of the population.
There were 1,093 households, out of which 32.2% had children under the age of 18 living with them, 54.2% were married couples living together, 9.7% had a female householder with no husband present, and 31.2% were non-families. 25.2% of all households were made up of individuals, and 10.2% had someone living alone who was 65 years of age or older. The average household size was 2.45 and the average family size was 2.93.
In the town, the population was spread out, with 24.2% under the age of 18, 6.2% from 18 to 24, 28.2% from 25 to 44, 27.2% from 45 to 64, and 14.2% who were 65 years of age or older. The median age was 40 years. For every 100 females, there were 97.2 males. For every 100 females age 18 and over, there were 94.2 males.
The median income for a household in the town was $45,938, and the median income for a family was $51,964. Males had a median income of $36,944 versus $27,917 for females. The per capita income for the town was $22,945. About 4.2% of families and 6.2% of the population were below the poverty line, including 8.2% of those under age 18 and 5.2% of those age 65 or over.
Common Questions
What is Per Capita Income in South Shaftsbury?
Per Capita income in South Shaftsbury is $35,543.
What is the Median Household income in South Shaftsbury?
Median Household Income in South Shaftsbury is $56,738.
What is Income or Wage Gap in South Shaftsbury?
Income or Wage Gap in South Shaftsbury is 1.3%.
Women in South Shaftsbury earn 98.7 cents for every dollar earned by a man.
What is Inequality or Gini Index in South Shaftsbury?
Inequality or Gini Index in South Shaftsbury is 0.34.
What is the Total Population of South Shaftsbury?
Total Population of South Shaftsbury is 427.
What is the Total Male Population of South Shaftsbury?
Total Male Population of South Shaftsbury is 236.
What is the Total Female Population of South Shaftsbury?
Total Female Population of South Shaftsbury is 191.
What is the Ratio of Males per 100 Females in South Shaftsbury?
There are 123.56 Males per 100 Females in South Shaftsbury.
What is the Ratio of Females per 100 Males in South Shaftsbury?
There are 80.93 Females per 100 Males in South Shaftsbury.
What is the Median Population Age in South Shaftsbury?
Median Population Age in South Shaftsbury is 59.4 Years.
What is the Average Family Size in South Shaftsbury
Average Family Size in South Shaftsbury is 2.7 People.
What is the Average Household Size in South Shaftsbury
Average Household Size in South Shaftsbury is 2.3 People.
How Large is the Labor Force in South Shaftsbury?
There are 263 People in the Labor Forcein in South Shaftsbury.
What is the Percentage of People in the Labor Force in South Shaftsbury?
68.3% of People are in the Labor Force in South Shaftsbury.