Island Pond, VT Map & Demographics
Island Pond Map
Island Pond Overview
$37,118
PER CAPITA INCOME
$60,781
AVG FAMILY INCOME
$44,559
AVG HOUSEHOLD INCOME
4.5%
WAGE / INCOME GAP [ % ]
95.5¢/ $1
WAGE / INCOME GAP [ $ ]
0.53
INEQUALITY / GINI INDEX
759
TOTAL POPULATION
340
MALE POPULATION
419
FEMALE POPULATION
81.15
MALES / 100 FEMALES
123.24
FEMALES / 100 MALES
52.0
MEDIAN AGE
2.7
AVG FAMILY SIZE
2.0
AVG HOUSEHOLD SIZE
316
LABOR FORCE [ PEOPLE ]
47.6%
PERCENT IN LABOR FORCE
Island Pond Zip Codes
Income in Island Pond
Income Overview in Island Pond
Per Capita Income in Island Pond is $37,118, while median incomes of families and households are $60,781 and $44,559 respectively.
| Characteristic | Number | Measure |
| Per Capita Income | 759 | $37,118 |
| Median Family Income | 191 | $60,781 |
| Mean Family Income | 191 | $69,438 |
| Median Household Income | 374 | $44,559 |
| Mean Household Income | 374 | $76,089 |
| Income Deficit | 191 | $0 |
| Wage / Income Gap (%) | 759 | 4.50% |
| Wage / Income Gap ($) | 759 | 95.50¢ per $1 |
| Gini / Inequality Index | 759 | 0.53 |
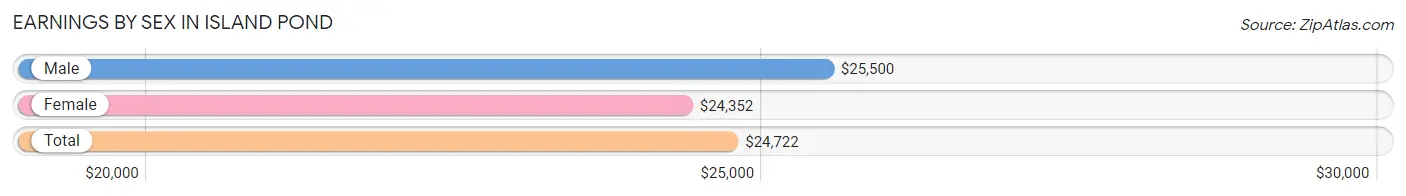
Earnings by Sex in Island Pond
Average Earnings in Island Pond are $24,722, $25,500 for men and $24,352 for women, a difference of 4.5%.
| Sex | Number | Average Earnings |
| Male | 146 (41.2%) | $25,500 |
| Female | 208 (58.8%) | $24,352 |
| Total | 354 (100.0%) | $24,722 |
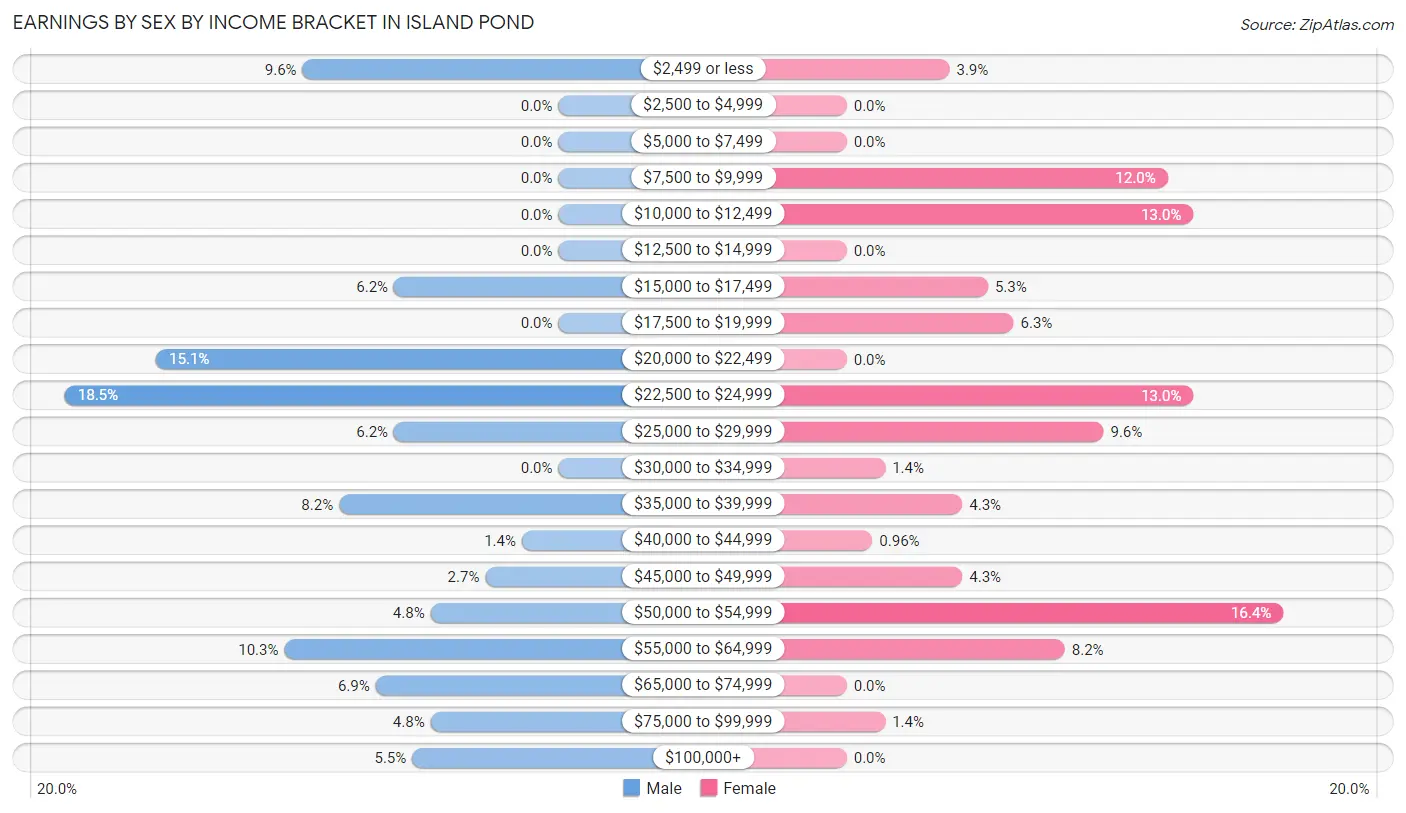
Earnings by Sex by Income Bracket in Island Pond
The most common earnings brackets in Island Pond are $22,500 to $24,999 for men (27 | 18.5%) and $50,000 to $54,999 for women (34 | 16.4%).
| Income | Male | Female |
| $2,499 or less | 14 (9.6%) | 8 (3.8%) |
| $2,500 to $4,999 | 0 (0.0%) | 0 (0.0%) |
| $5,000 to $7,499 | 0 (0.0%) | 0 (0.0%) |
| $7,500 to $9,999 | 0 (0.0%) | 25 (12.0%) |
| $10,000 to $12,499 | 0 (0.0%) | 27 (13.0%) |
| $12,500 to $14,999 | 0 (0.0%) | 0 (0.0%) |
| $15,000 to $17,499 | 9 (6.2%) | 11 (5.3%) |
| $17,500 to $19,999 | 0 (0.0%) | 13 (6.2%) |
| $20,000 to $22,499 | 22 (15.1%) | 0 (0.0%) |
| $22,500 to $24,999 | 27 (18.5%) | 27 (13.0%) |
| $25,000 to $29,999 | 9 (6.2%) | 20 (9.6%) |
| $30,000 to $34,999 | 0 (0.0%) | 3 (1.4%) |
| $35,000 to $39,999 | 12 (8.2%) | 9 (4.3%) |
| $40,000 to $44,999 | 2 (1.4%) | 2 (1.0%) |
| $45,000 to $49,999 | 4 (2.7%) | 9 (4.3%) |
| $50,000 to $54,999 | 7 (4.8%) | 34 (16.4%) |
| $55,000 to $64,999 | 15 (10.3%) | 17 (8.2%) |
| $65,000 to $74,999 | 10 (6.9%) | 0 (0.0%) |
| $75,000 to $99,999 | 7 (4.8%) | 3 (1.4%) |
| $100,000+ | 8 (5.5%) | 0 (0.0%) |
| Total | 146 (100.0%) | 208 (100.0%) |
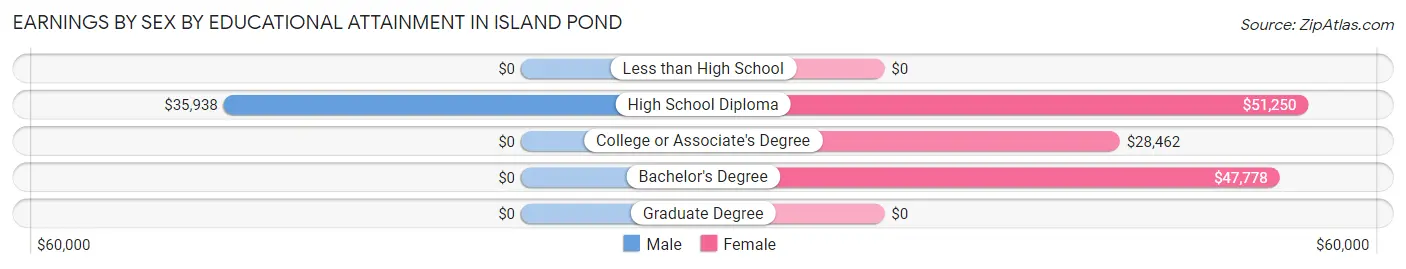
Earnings by Sex by Educational Attainment in Island Pond
Average earnings in Island Pond are $24,769 for men and $28,813 for women, a difference of 14.0%. Men with an educational attainment of high school diploma enjoy the highest average annual earnings of $35,938, while those with high school diploma education earn the least with $35,938. Women with an educational attainment of high school diploma earn the most with the average annual earnings of $51,250, while those with college or associate's degree education have the smallest earnings of $28,462.
| Educational Attainment | Male Income | Female Income |
| Less than High School | - | - |
| High School Diploma | $35,938 | $51,250 |
| College or Associate's Degree | - | - |
| Bachelor's Degree | - | - |
| Graduate Degree | - | - |
| Total | $24,769 | $28,813 |
Family Income in Island Pond
Family Income Brackets in Island Pond
According to the Island Pond family income data, there are 57 families falling into the $75,000 to $99,999 income range, which is the most common income bracket and makes up 29.8% of all families.
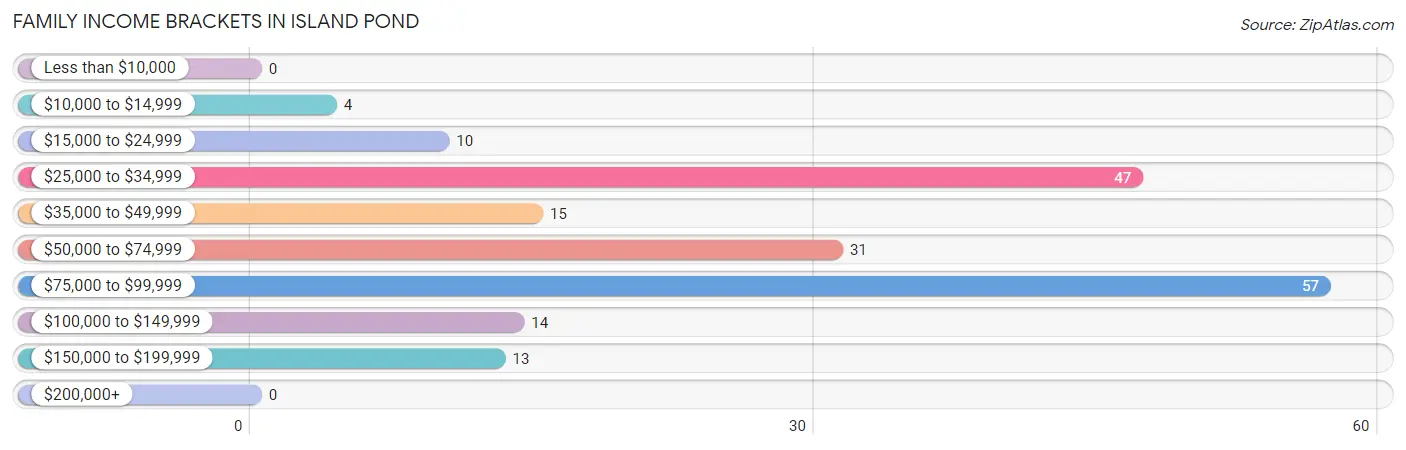
| Income Bracket | # Families | % Families |
| Less than $10,000 | 0 | 0.0% |
| $10,000 to $14,999 | 4 | 2.1% |
| $15,000 to $24,999 | 10 | 5.2% |
| $25,000 to $34,999 | 47 | 24.6% |
| $35,000 to $49,999 | 15 | 7.9% |
| $50,000 to $74,999 | 31 | 16.2% |
| $75,000 to $99,999 | 57 | 29.8% |
| $100,000 to $149,999 | 14 | 7.3% |
| $150,000 to $199,999 | 13 | 6.8% |
| $200,000+ | 0 | 0.0% |
Family Income by Famaliy Size in Island Pond
3-person families (49 | 25.7%) account for the highest median family income in Island Pond with $98,147 per family, while 3-person families (49 | 25.7%) have the highest median income of $32,716 per family member.
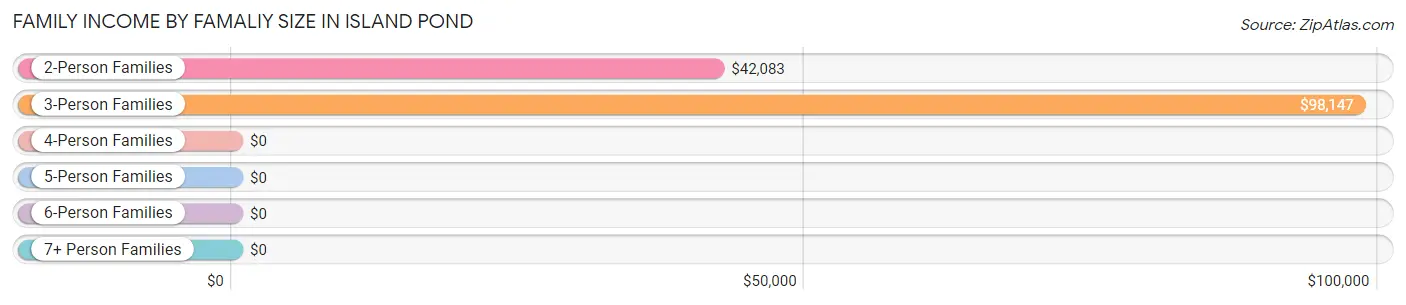
| Income Bracket | # Families | Median Income |
| 2-Person Families | 93 (48.7%) | $42,083 |
| 3-Person Families | 49 (25.7%) | $98,147 |
| 4-Person Families | 47 (24.6%) | $0 |
| 5-Person Families | 0 (0.0%) | $0 |
| 6-Person Families | 2 (1.1%) | $0 |
| 7+ Person Families | 0 (0.0%) | $0 |
| Total | 191 (100.0%) | $60,781 |
Family Income by Number of Earners in Island Pond
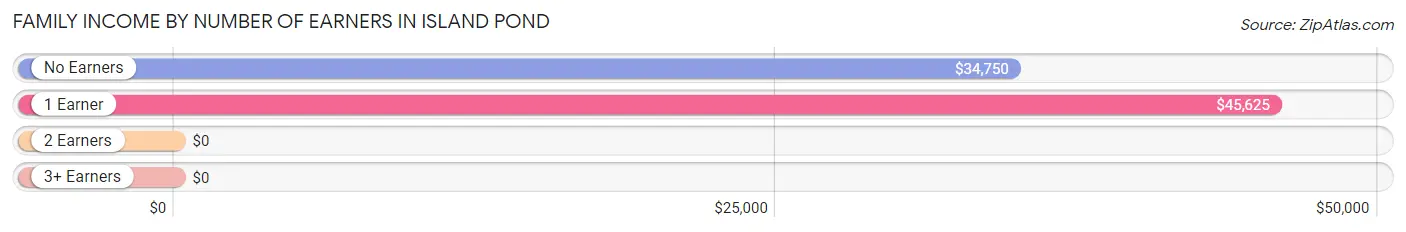
| Number of Earners | # Families | Median Income |
| No Earners | 31 (16.2%) | $34,750 |
| 1 Earner | 79 (41.4%) | $45,625 |
| 2 Earners | 52 (27.2%) | $0 |
| 3+ Earners | 29 (15.2%) | $0 |
| Total | 191 (100.0%) | $60,781 |
Household Income in Island Pond
Household Income Brackets in Island Pond
With 78 households falling in the category, the $75,000 to $99,999 income range is the most frequent in Island Pond, accounting for 20.9% of all households. In contrast, only 8 households (2.1%) fall into the less than $10,000 income bracket, making it the least populous group.
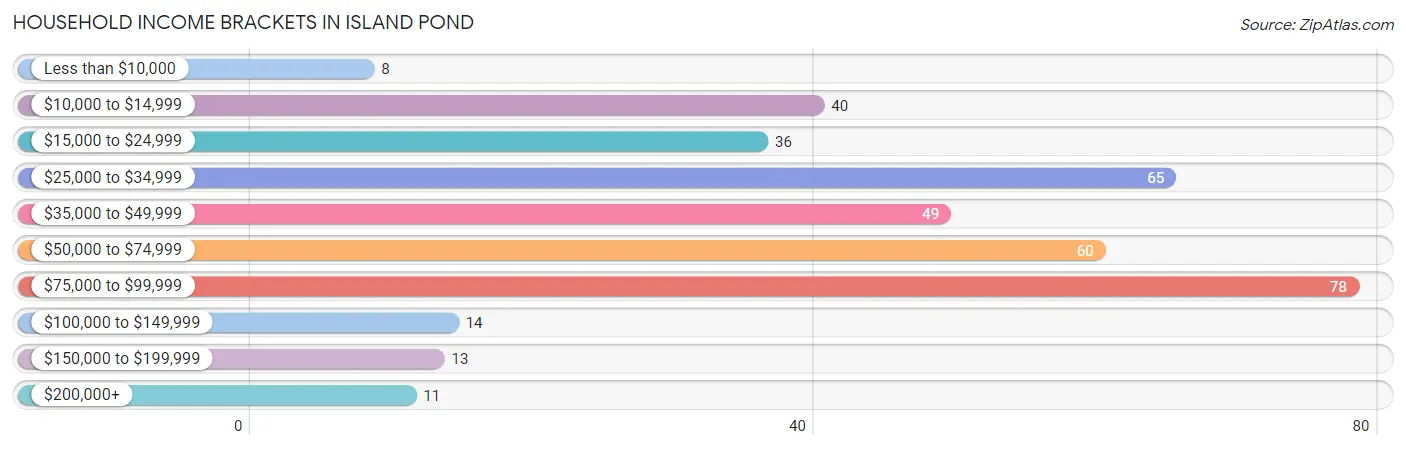
| Income Bracket | # Households | % Households |
| Less than $10,000 | 8 | 2.1% |
| $10,000 to $14,999 | 40 | 10.7% |
| $15,000 to $24,999 | 36 | 9.6% |
| $25,000 to $34,999 | 65 | 17.4% |
| $35,000 to $49,999 | 49 | 13.1% |
| $50,000 to $74,999 | 60 | 16.0% |
| $75,000 to $99,999 | 78 | 20.9% |
| $100,000 to $149,999 | 14 | 3.7% |
| $150,000 to $199,999 | 13 | 3.5% |
| $200,000+ | 11 | 2.9% |
Household Income by Householder Age in Island Pond
The median household income in Island Pond is $44,559, with the highest median household income of $63,889 found in the 45 to 64 years age bracket for the primary householder. A total of 110 households (29.4%) fall into this category. Meanwhile, the 15 to 24 years age bracket for the primary householder has the lowest median household income of $0, with 33 households (8.8%) in this group.
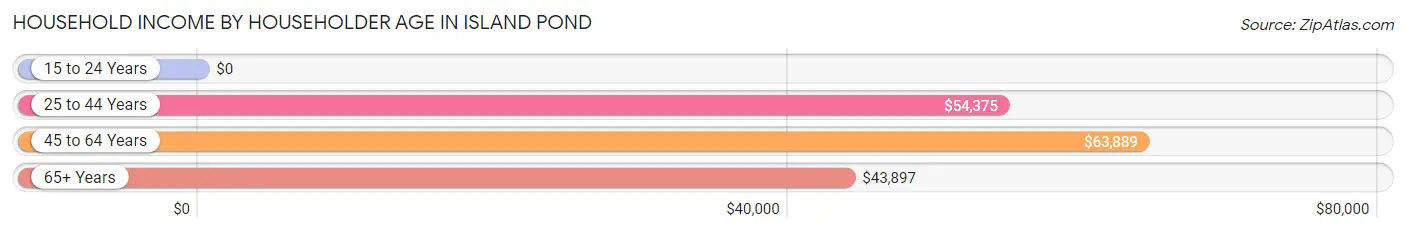
| Income Bracket | # Households | Median Income |
| 15 to 24 Years | 33 (8.8%) | $0 |
| 25 to 44 Years | 45 (12.0%) | $54,375 |
| 45 to 64 Years | 110 (29.4%) | $63,889 |
| 65+ Years | 186 (49.7%) | $43,897 |
| Total | 374 (100.0%) | $44,559 |
Poverty in Island Pond
Income Below Poverty by Sex and Age in Island Pond
With 12.1% poverty level for males and 15.0% for females among the residents of Island Pond, 18 to 24 year old males and 18 to 24 year old females are the most vulnerable to poverty, with 22 males (68.8%) and 30 females (57.7%) in their respective age groups living below the poverty level.
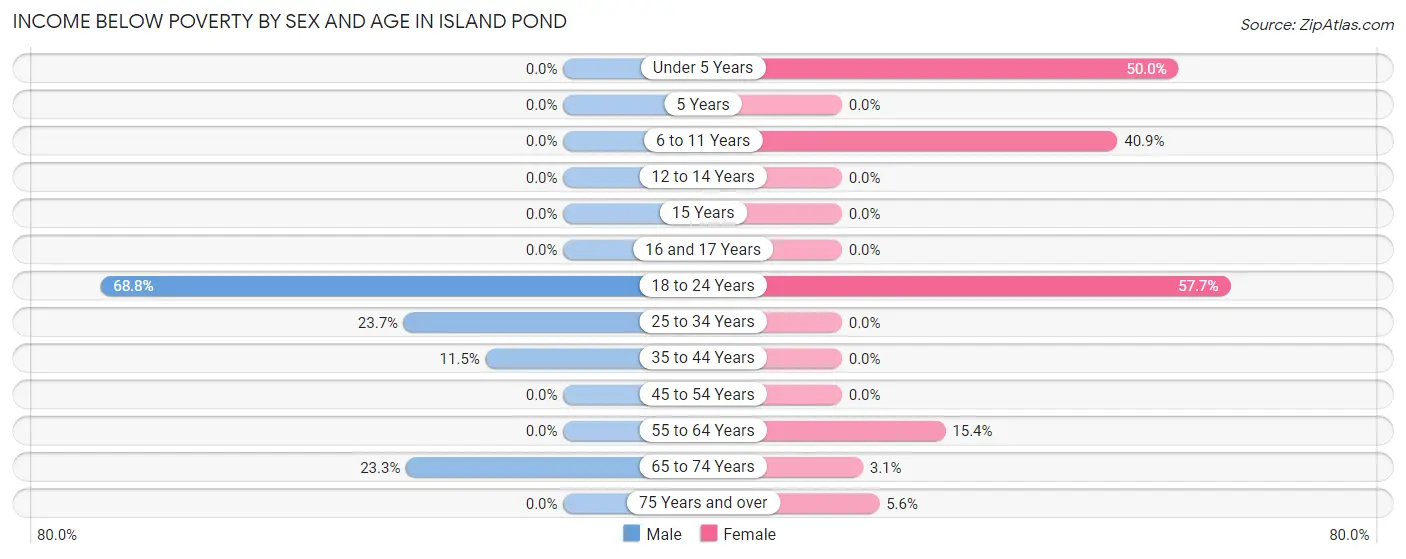
| Age Bracket | Male | Female |
| Under 5 Years | 0 (0.0%) | 8 (50.0%) |
| 5 Years | 0 (0.0%) | 0 (0.0%) |
| 6 to 11 Years | 0 (0.0%) | 9 (40.9%) |
| 12 to 14 Years | 0 (0.0%) | 0 (0.0%) |
| 15 Years | 0 (0.0%) | 0 (0.0%) |
| 16 and 17 Years | 0 (0.0%) | 0 (0.0%) |
| 18 to 24 Years | 22 (68.8%) | 30 (57.7%) |
| 25 to 34 Years | 9 (23.7%) | 0 (0.0%) |
| 35 to 44 Years | 3 (11.5%) | 0 (0.0%) |
| 45 to 54 Years | 0 (0.0%) | 0 (0.0%) |
| 55 to 64 Years | 0 (0.0%) | 10 (15.4%) |
| 65 to 74 Years | 7 (23.3%) | 2 (3.1%) |
| 75 Years and over | 0 (0.0%) | 4 (5.6%) |
| Total | 41 (12.1%) | 63 (15.0%) |
Income Above Poverty by Sex and Age in Island Pond
According to the poverty statistics in Island Pond, males aged under 5 years and females aged 12 to 14 years are the age groups that are most secure financially, with 100.0% of males and 100.0% of females in these age groups living above the poverty line.
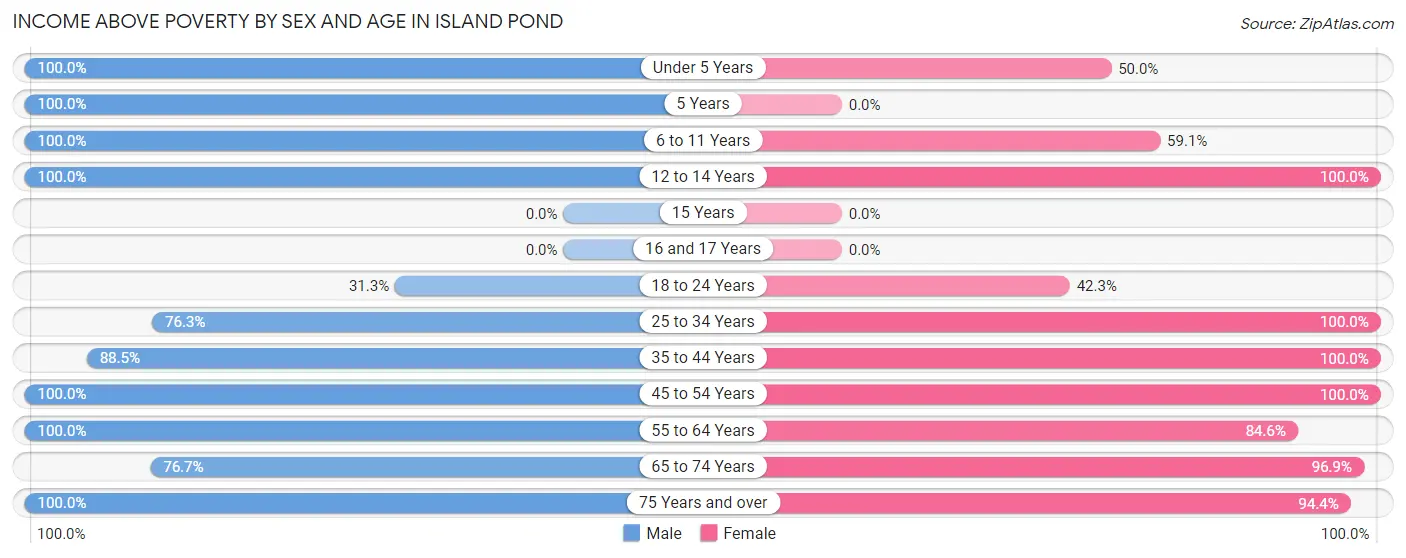
| Age Bracket | Male | Female |
| Under 5 Years | 4 (100.0%) | 8 (50.0%) |
| 5 Years | 14 (100.0%) | 0 (0.0%) |
| 6 to 11 Years | 23 (100.0%) | 13 (59.1%) |
| 12 to 14 Years | 14 (100.0%) | 2 (100.0%) |
| 15 Years | 0 (0.0%) | 0 (0.0%) |
| 16 and 17 Years | 0 (0.0%) | 0 (0.0%) |
| 18 to 24 Years | 10 (31.2%) | 22 (42.3%) |
| 25 to 34 Years | 29 (76.3%) | 21 (100.0%) |
| 35 to 44 Years | 23 (88.5%) | 61 (100.0%) |
| 45 to 54 Years | 52 (100.0%) | 44 (100.0%) |
| 55 to 64 Years | 43 (100.0%) | 55 (84.6%) |
| 65 to 74 Years | 23 (76.7%) | 62 (96.9%) |
| 75 Years and over | 64 (100.0%) | 68 (94.4%) |
| Total | 299 (87.9%) | 356 (85.0%) |
Income Below Poverty Among Married-Couple Families in Island Pond
The poverty statistics for married-couple families in Island Pond show that 12.8% or 16 of the total 125 families live below the poverty line. Families with 1 or 2 children have the highest poverty rate of 100.0%, comprising of 12 families. On the other hand, families with 3 or 4 children have the lowest poverty rate of 0.0%, which includes 0 families.
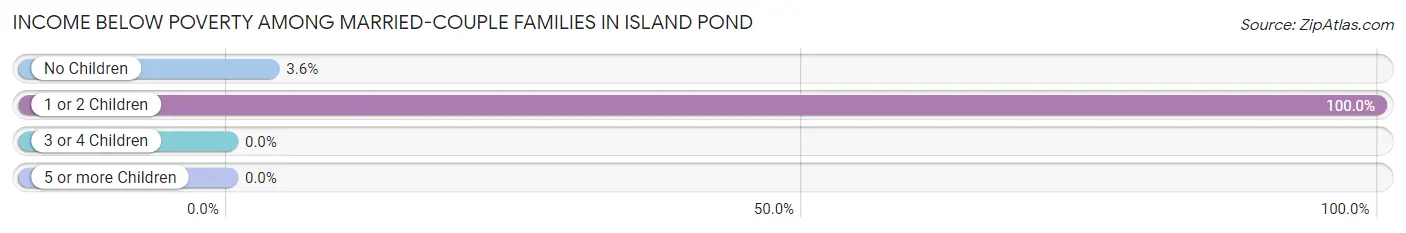
| Children | Above Poverty | Below Poverty |
| No Children | 107 (96.4%) | 4 (3.6%) |
| 1 or 2 Children | 0 (0.0%) | 12 (100.0%) |
| 3 or 4 Children | 2 (100.0%) | 0 (0.0%) |
| 5 or more Children | 0 (0.0%) | 0 (0.0%) |
| Total | 109 (87.2%) | 16 (12.8%) |
Income Below Poverty Among Single-Parent Households in Island Pond
| Children | Single Father | Single Mother |
| No Children | 0 (0.0%) | 0 (0.0%) |
| 1 or 2 Children | 0 (0.0%) | 0 (0.0%) |
| 3 or 4 Children | 0 (0.0%) | 0 (0.0%) |
| 5 or more Children | 0 (0.0%) | 0 (0.0%) |
| Total | 0 (0.0%) | 0 (0.0%) |
Income Below Poverty Among Married-Couple vs Single-Parent Households in Island Pond
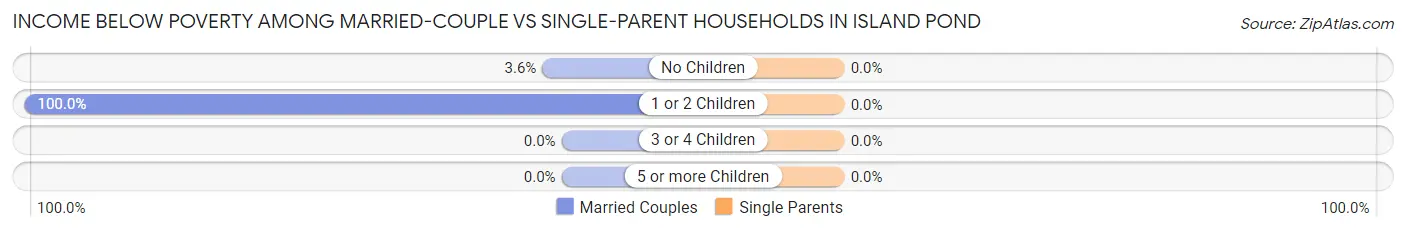
| Children | Married-Couple Families | Single-Parent Households |
| No Children | 4 (3.6%) | 0 (0.0%) |
| 1 or 2 Children | 12 (100.0%) | 0 (0.0%) |
| 3 or 4 Children | 0 (0.0%) | 0 (0.0%) |
| 5 or more Children | 0 (0.0%) | 0 (0.0%) |
| Total | 16 (12.8%) | 0 (0.0%) |
Race in Island Pond
The most populous races in Island Pond are White / Caucasian (739 | 97.4%), Hispanic or Latino (40 | 5.3%), and Two or more Races (20 | 2.6%).
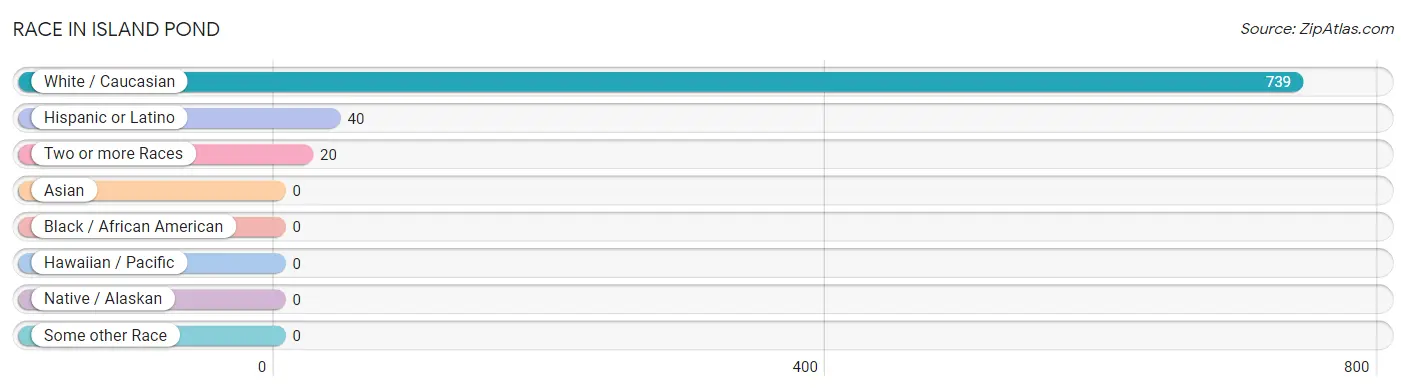
| Race | # Population | % Population |
| Asian | 0 | 0.0% |
| Black / African American | 0 | 0.0% |
| Hawaiian / Pacific | 0 | 0.0% |
| Hispanic or Latino | 40 | 5.3% |
| Native / Alaskan | 0 | 0.0% |
| White / Caucasian | 739 | 97.4% |
| Two or more Races | 20 | 2.6% |
| Some other Race | 0 | 0.0% |
| Total | 759 | 100.0% |
Ancestry in Island Pond
The most populous ancestries reported in Island Pond are Irish (125 | 16.5%), English (109 | 14.4%), French Canadian (78 | 10.3%), French (75 | 9.9%), and Italian (54 | 7.1%), together accounting for 58.1% of all Island Pond residents.
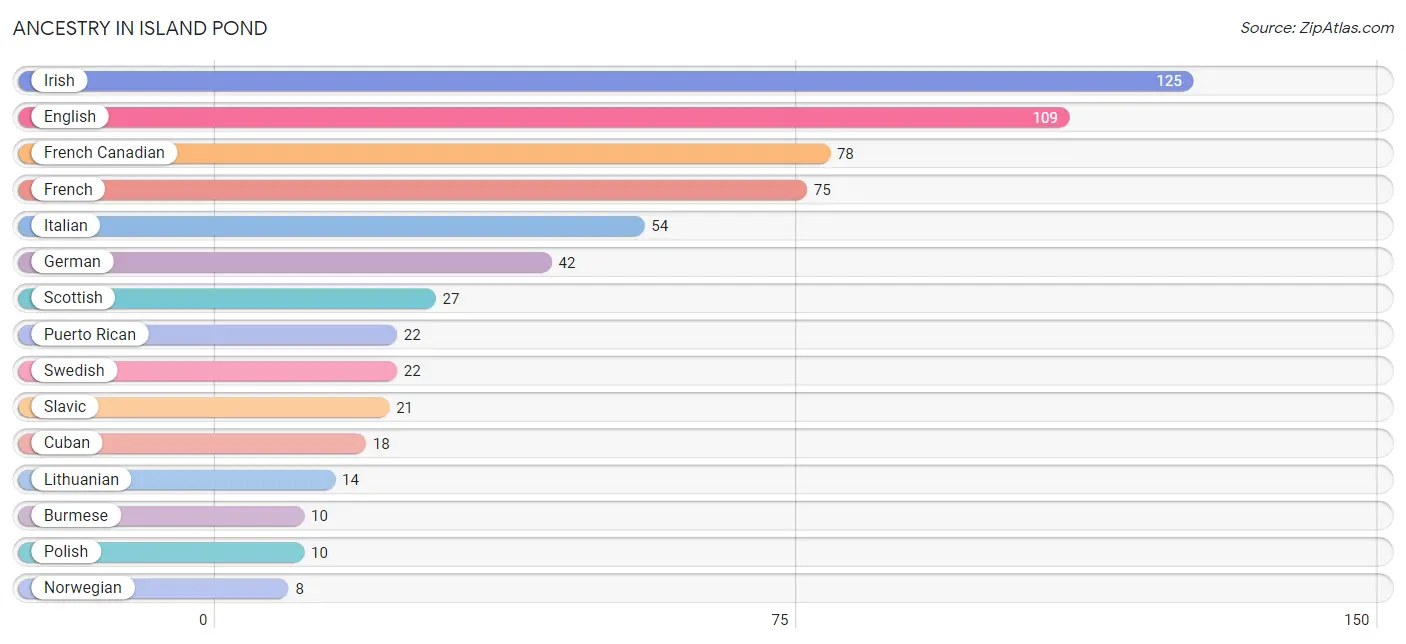
| Ancestry | # Population | % Population |
| American | 6 | 0.8% |
| Burmese | 10 | 1.3% |
| Cuban | 18 | 2.4% |
| Danish | 4 | 0.5% |
| English | 109 | 14.4% |
| French | 75 | 9.9% |
| French Canadian | 78 | 10.3% |
| German | 42 | 5.5% |
| Irish | 125 | 16.5% |
| Italian | 54 | 7.1% |
| Lithuanian | 14 | 1.8% |
| Norwegian | 8 | 1.1% |
| Polish | 10 | 1.3% |
| Puerto Rican | 22 | 2.9% |
| Scotch-Irish | 2 | 0.3% |
| Scottish | 27 | 3.6% |
| Slavic | 21 | 2.8% |
| Swedish | 22 | 2.9% |
| Swiss | 4 | 0.5% | View All 19 Rows |
Immigrants in Island Pond

| Immigration Origin | # Population | % Population | View All 0 Rows |
Sex and Age in Island Pond
Sex and Age in Island Pond
The most populous age groups in Island Pond are 85 Years and over (39 | 11.5%) for men and 60 to 64 Years (46 | 11.0%) for women.
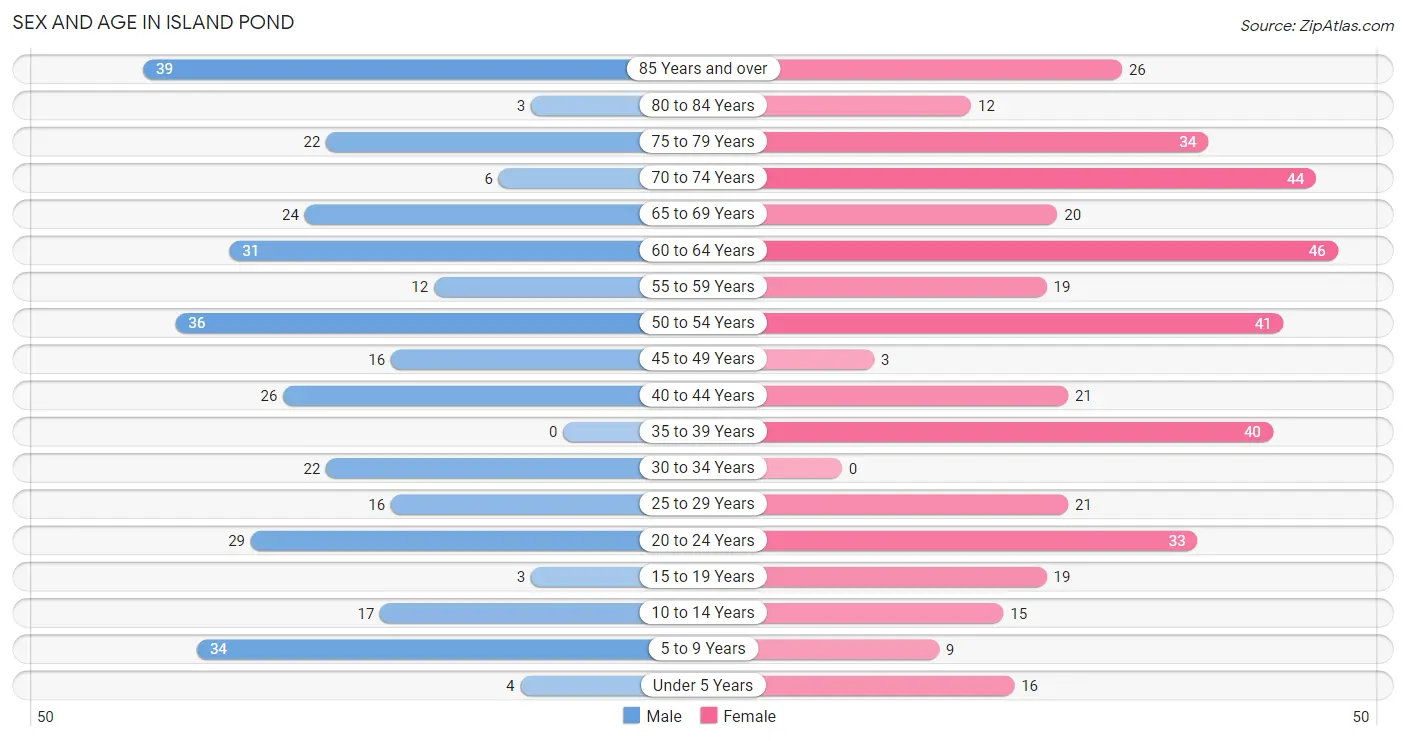
| Age Bracket | Male | Female |
| Under 5 Years | 4 (1.2%) | 16 (3.8%) |
| 5 to 9 Years | 34 (10.0%) | 9 (2.1%) |
| 10 to 14 Years | 17 (5.0%) | 15 (3.6%) |
| 15 to 19 Years | 3 (0.9%) | 19 (4.5%) |
| 20 to 24 Years | 29 (8.5%) | 33 (7.9%) |
| 25 to 29 Years | 16 (4.7%) | 21 (5.0%) |
| 30 to 34 Years | 22 (6.5%) | 0 (0.0%) |
| 35 to 39 Years | 0 (0.0%) | 40 (9.6%) |
| 40 to 44 Years | 26 (7.6%) | 21 (5.0%) |
| 45 to 49 Years | 16 (4.7%) | 3 (0.7%) |
| 50 to 54 Years | 36 (10.6%) | 41 (9.8%) |
| 55 to 59 Years | 12 (3.5%) | 19 (4.5%) |
| 60 to 64 Years | 31 (9.1%) | 46 (11.0%) |
| 65 to 69 Years | 24 (7.1%) | 20 (4.8%) |
| 70 to 74 Years | 6 (1.8%) | 44 (10.5%) |
| 75 to 79 Years | 22 (6.5%) | 34 (8.1%) |
| 80 to 84 Years | 3 (0.9%) | 12 (2.9%) |
| 85 Years and over | 39 (11.5%) | 26 (6.2%) |
| Total | 340 (100.0%) | 419 (100.0%) |
Families and Households in Island Pond
Median Family Size in Island Pond
The median family size in Island Pond is 2.72 persons per family, with single female/mother families (61 | 31.9%) accounting for the largest median family size of 3.33 persons per family. On the other hand, married-couple families (125 | 65.4%) represent the smallest median family size with 2.43 persons per family.
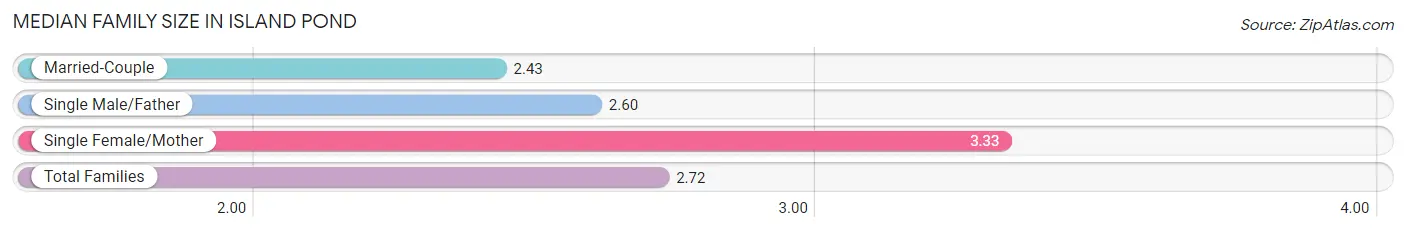
| Family Type | # Families | Family Size |
| Married-Couple | 125 (65.4%) | 2.43 |
| Single Male/Father | 5 (2.6%) | 2.60 |
| Single Female/Mother | 61 (31.9%) | 3.33 |
| Total Families | 191 (100.0%) | 2.72 |
Median Household Size in Island Pond
The median household size in Island Pond is 2.01 persons per household, with single female/mother households (61 | 16.3%) accounting for the largest median household size of 3.36 persons per household. non-family households (183 | 48.9%) represent the smallest median household size with 1.23 persons per household.

| Household Type | # Households | Household Size |
| Married-Couple | 125 (33.4%) | 2.46 |
| Single Male/Father | 5 (1.3%) | 2.60 |
| Single Female/Mother | 61 (16.3%) | 3.36 |
| Non-family | 183 (48.9%) | 1.23 |
| Total Households | 374 (100.0%) | 2.01 |
Household Size by Marriage Status in Island Pond
Out of a total of 374 households in Island Pond, 191 (51.1%) are family households, while 183 (48.9%) are nonfamily households. The most numerous type of family households are 2-person households, comprising 90, and the most common type of nonfamily households are 1-person households, comprising 145.
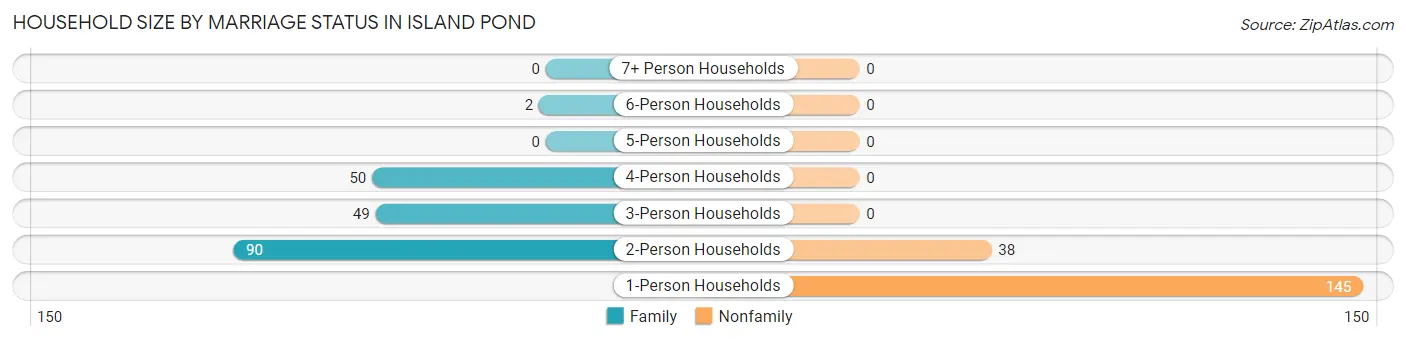
| Household Size | Family Households | Nonfamily Households |
| 1-Person Households | - | 145 (38.8%) |
| 2-Person Households | 90 (24.1%) | 38 (10.2%) |
| 3-Person Households | 49 (13.1%) | 0 (0.0%) |
| 4-Person Households | 50 (13.4%) | 0 (0.0%) |
| 5-Person Households | 0 (0.0%) | 0 (0.0%) |
| 6-Person Households | 2 (0.5%) | 0 (0.0%) |
| 7+ Person Households | 0 (0.0%) | 0 (0.0%) |
| Total | 191 (51.1%) | 183 (48.9%) |
Female Fertility in Island Pond
Fertility by Age in Island Pond
Average fertility rate in Island Pond is 72.0 births per 1,000 women. Women in the age bracket of 20 to 34 years have the highest fertility rate with 222.0 births per 1,000 women. Women in the age bracket of 20 to 34 years acount for 100.0% of all women with births.
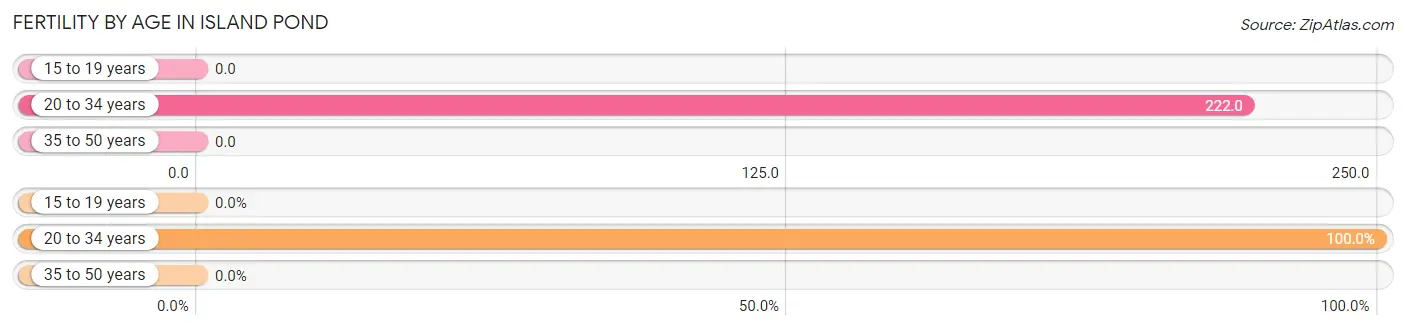
| Age Bracket | Women with Births | Births / 1,000 Women |
| 15 to 19 years | 0 (0.0%) | 0.0 |
| 20 to 34 years | 12 (100.0%) | 222.0 |
| 35 to 50 years | 0 (0.0%) | 0.0 |
| Total | 12 (100.0%) | 72.0 |
Fertility by Age by Marriage Status in Island Pond
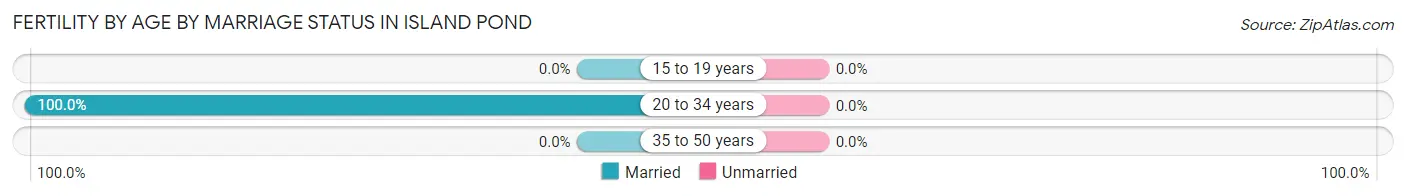
| Age Bracket | Married | Unmarried |
| 15 to 19 years | 0 (0.0%) | 0 (0.0%) |
| 20 to 34 years | 12 (100.0%) | 0 (0.0%) |
| 35 to 50 years | 0 (0.0%) | 0 (0.0%) |
| Total | 12 (100.0%) | 0 (0.0%) |
Fertility by Education in Island Pond
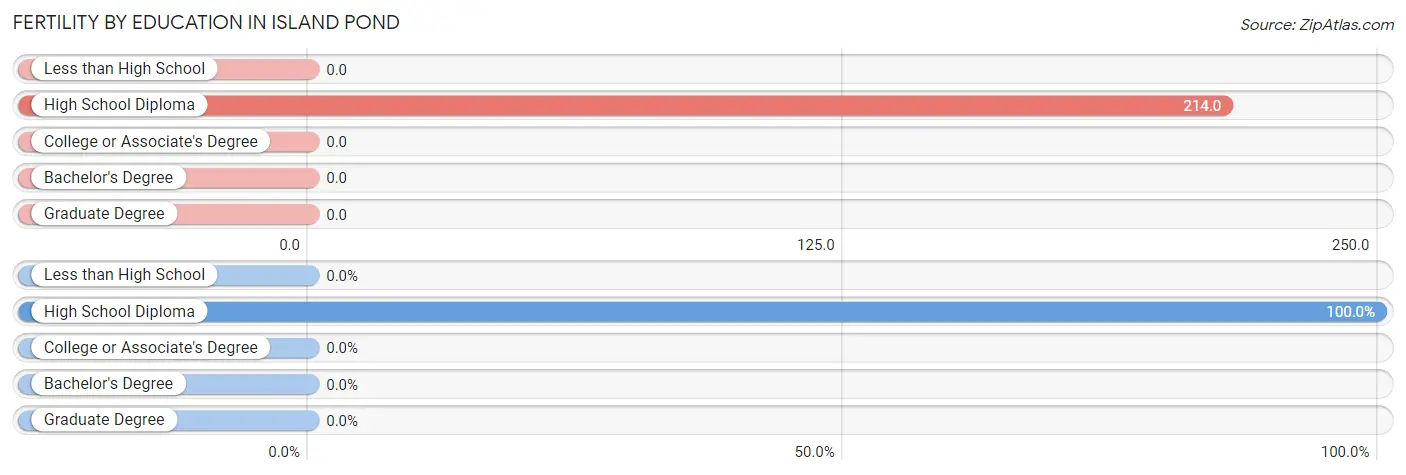
| Educational Attainment | Women with Births | Births / 1,000 Women |
| Less than High School | 0 (0.0%) | 0.0 |
| High School Diploma | 12 (100.0%) | 214.0 |
| College or Associate's Degree | 0 (0.0%) | 0.0 |
| Bachelor's Degree | 0 (0.0%) | 0.0 |
| Graduate Degree | 0 (0.0%) | 0.0 |
| Total | 12 (100.0%) | 72.0 |
Fertility by Education by Marriage Status in Island Pond
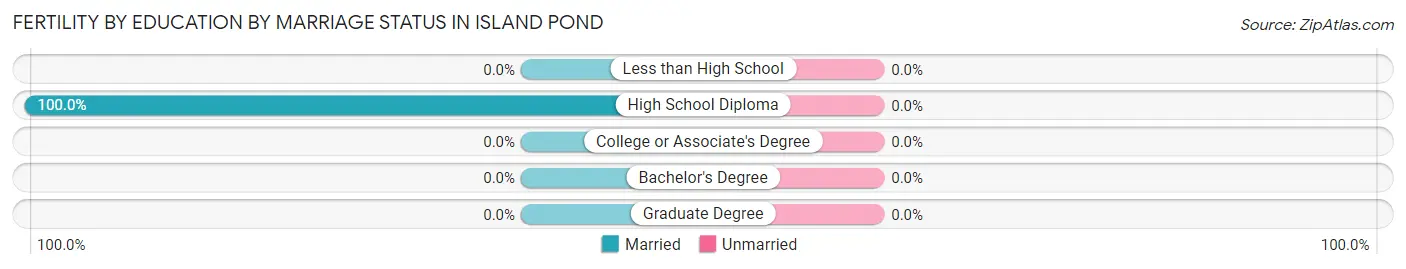
| Educational Attainment | Married | Unmarried |
| Less than High School | 0 (0.0%) | 0 (0.0%) |
| High School Diploma | 12 (100.0%) | 0 (0.0%) |
| College or Associate's Degree | 0 (0.0%) | 0 (0.0%) |
| Bachelor's Degree | 0 (0.0%) | 0 (0.0%) |
| Graduate Degree | 0 (0.0%) | 0 (0.0%) |
| Total | 12 (100.0%) | 0 (0.0%) |
Employment Characteristics in Island Pond
Employment by Class of Employer in Island Pond
Among the 316 employed individuals in Island Pond, private company employees (138 | 43.7%), local government employees (59 | 18.7%), and not-for-profit organizations (50 | 15.8%) make up the most common classes of employment.
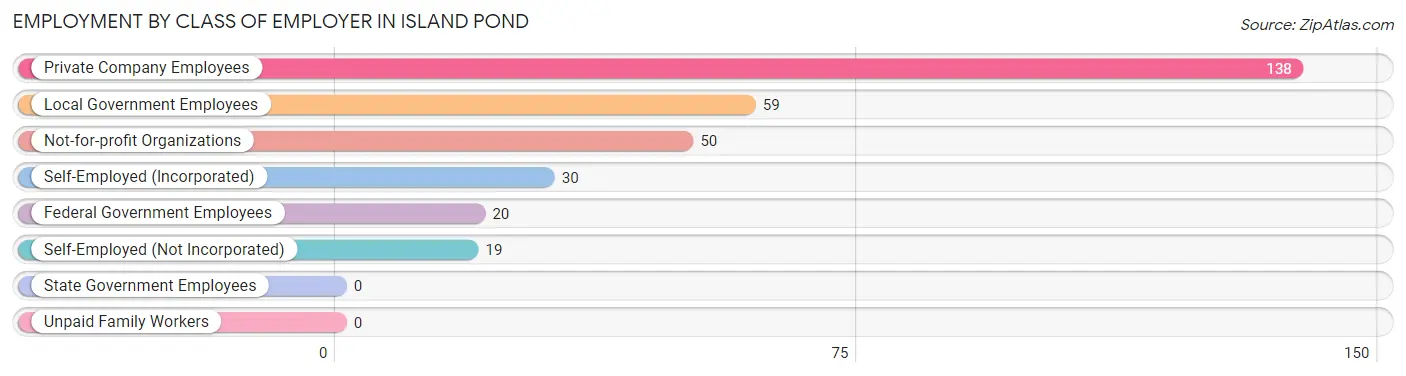
| Employer Class | # Employees | % Employees |
| Private Company Employees | 138 | 43.7% |
| Self-Employed (Incorporated) | 30 | 9.5% |
| Self-Employed (Not Incorporated) | 19 | 6.0% |
| Not-for-profit Organizations | 50 | 15.8% |
| Local Government Employees | 59 | 18.7% |
| State Government Employees | 0 | 0.0% |
| Federal Government Employees | 20 | 6.3% |
| Unpaid Family Workers | 0 | 0.0% |
| Total | 316 | 100.0% |
Employment Status by Age in Island Pond
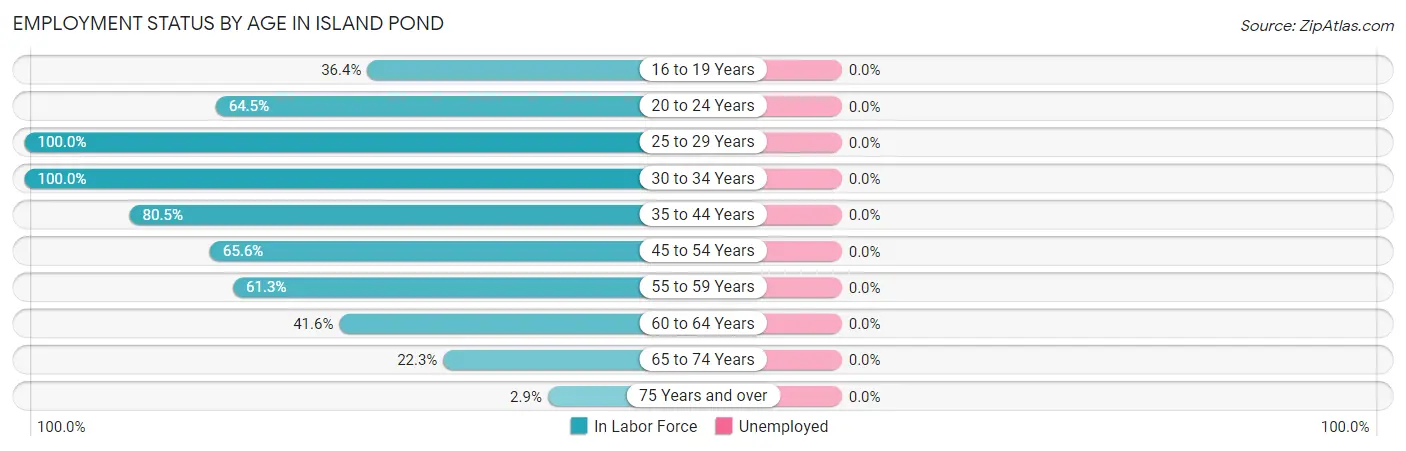
| Age Bracket | In Labor Force | Unemployed |
| 16 to 19 Years | 8 (36.4%) | 0 (0.0%) |
| 20 to 24 Years | 40 (64.5%) | 0 (0.0%) |
| 25 to 29 Years | 37 (100.0%) | 0 (0.0%) |
| 30 to 34 Years | 22 (100.0%) | 0 (0.0%) |
| 35 to 44 Years | 70 (80.5%) | 0 (0.0%) |
| 45 to 54 Years | 63 (65.6%) | 0 (0.0%) |
| 55 to 59 Years | 19 (61.3%) | 0 (0.0%) |
| 60 to 64 Years | 32 (41.6%) | 0 (0.0%) |
| 65 to 74 Years | 21 (22.3%) | 0 (0.0%) |
| 75 Years and over | 4 (2.9%) | 0 (0.0%) |
| Total | 316 (47.6%) | 0 (0.0%) |
Employment Status by Educational Attainment in Island Pond
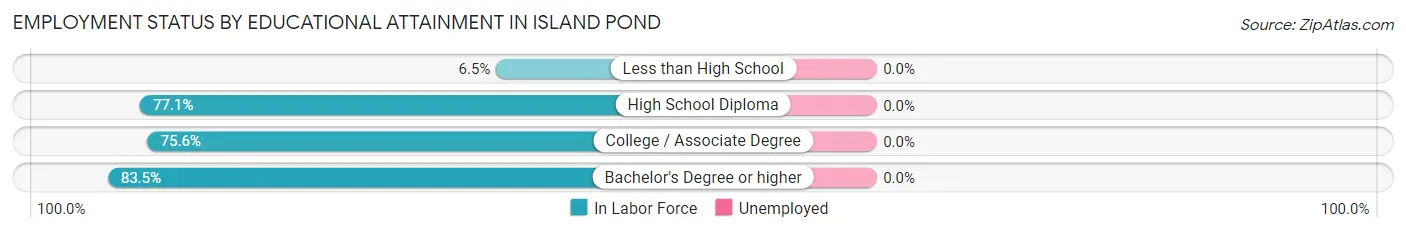
| Educational Attainment | In Labor Force | Unemployed |
| Less than High School | 3 (6.5%) | 0 (0.0%) |
| High School Diploma | 84 (77.1%) | 0 (0.0%) |
| College / Associate Degree | 65 (75.6%) | 0 (0.0%) |
| Bachelor's Degree or higher | 91 (83.5%) | 0 (0.0%) |
| Total | 243 (69.4%) | 0 (0.0%) |
Employment Occupations by Sex in Island Pond
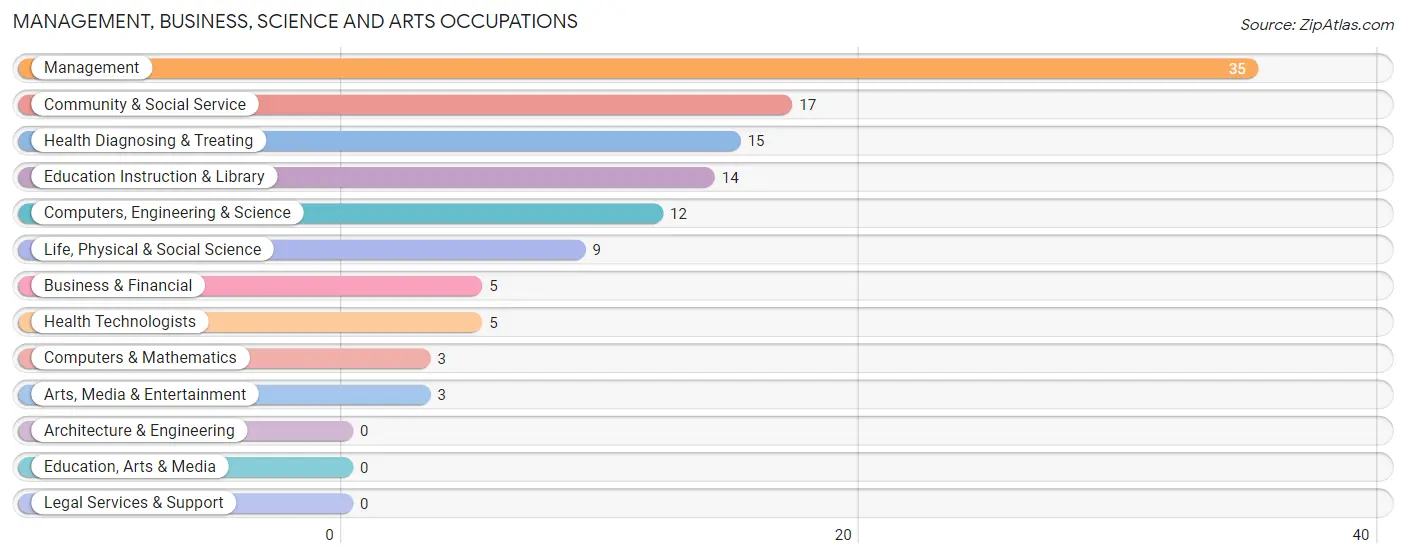
Management, Business, Science and Arts Occupations
The most common Management, Business, Science and Arts occupations in Island Pond are Management (35 | 11.1%), Community & Social Service (17 | 5.4%), Health Diagnosing & Treating (15 | 4.8%), Education Instruction & Library (14 | 4.4%), and Computers, Engineering & Science (12 | 3.8%).
Management, Business, Science and Arts Occupations by Sex
Within the Management, Business, Science and Arts occupations in Island Pond, the most male-oriented occupations are Business & Financial (100.0%), Computers & Mathematics (100.0%), and Arts, Media & Entertainment (100.0%), while the most female-oriented occupations are Life, Physical & Social Science (100.0%), Education Instruction & Library (100.0%), and Health Technologists (100.0%).
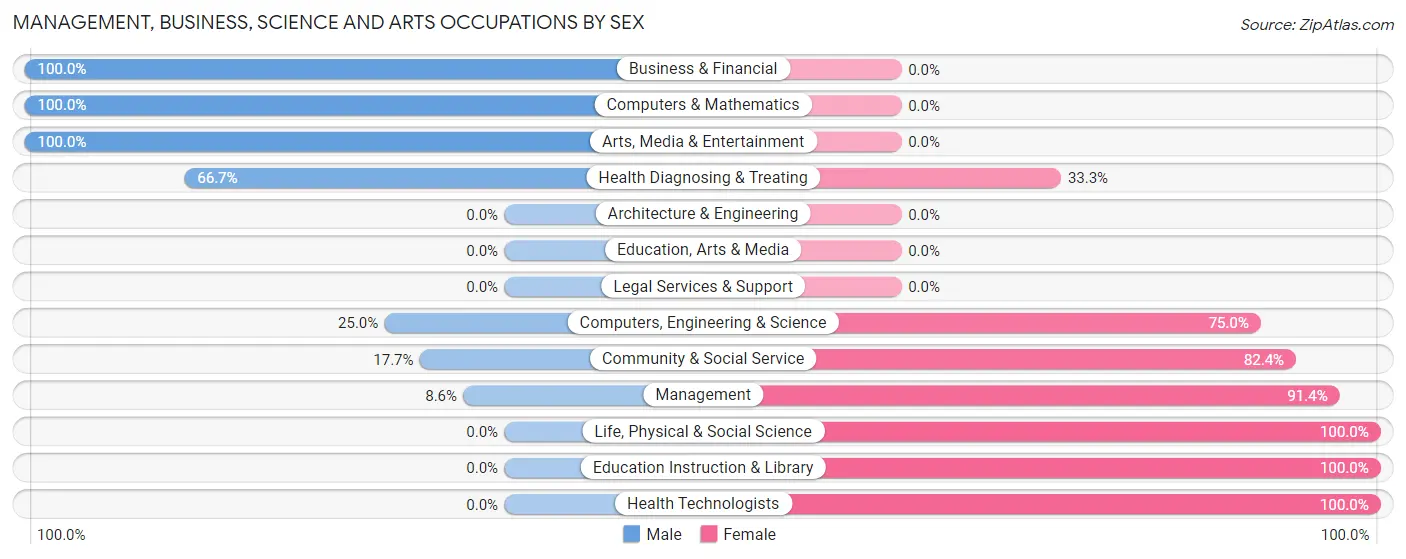
| Occupation | Male | Female |
| Management | 3 (8.6%) | 32 (91.4%) |
| Business & Financial | 5 (100.0%) | 0 (0.0%) |
| Computers, Engineering & Science | 3 (25.0%) | 9 (75.0%) |
| Computers & Mathematics | 3 (100.0%) | 0 (0.0%) |
| Architecture & Engineering | 0 (0.0%) | 0 (0.0%) |
| Life, Physical & Social Science | 0 (0.0%) | 9 (100.0%) |
| Community & Social Service | 3 (17.6%) | 14 (82.4%) |
| Education, Arts & Media | 0 (0.0%) | 0 (0.0%) |
| Legal Services & Support | 0 (0.0%) | 0 (0.0%) |
| Education Instruction & Library | 0 (0.0%) | 14 (100.0%) |
| Arts, Media & Entertainment | 3 (100.0%) | 0 (0.0%) |
| Health Diagnosing & Treating | 10 (66.7%) | 5 (33.3%) |
| Health Technologists | 0 (0.0%) | 5 (100.0%) |
| Total (Category) | 24 (28.6%) | 60 (71.4%) |
| Total (Overall) | 108 (34.2%) | 208 (65.8%) |
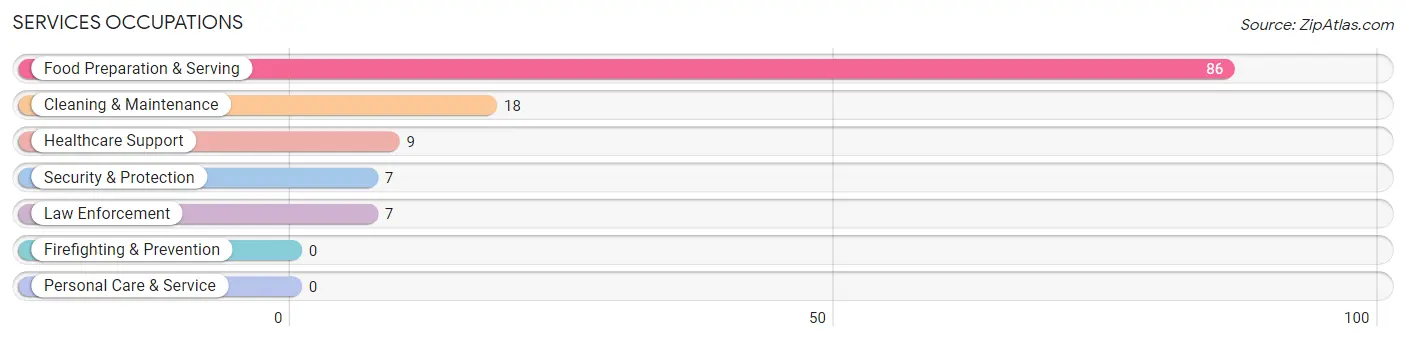
Services Occupations
The most common Services occupations in Island Pond are Food Preparation & Serving (86 | 27.2%), Cleaning & Maintenance (18 | 5.7%), Healthcare Support (9 | 2.9%), Security & Protection (7 | 2.2%), and Law Enforcement (7 | 2.2%).
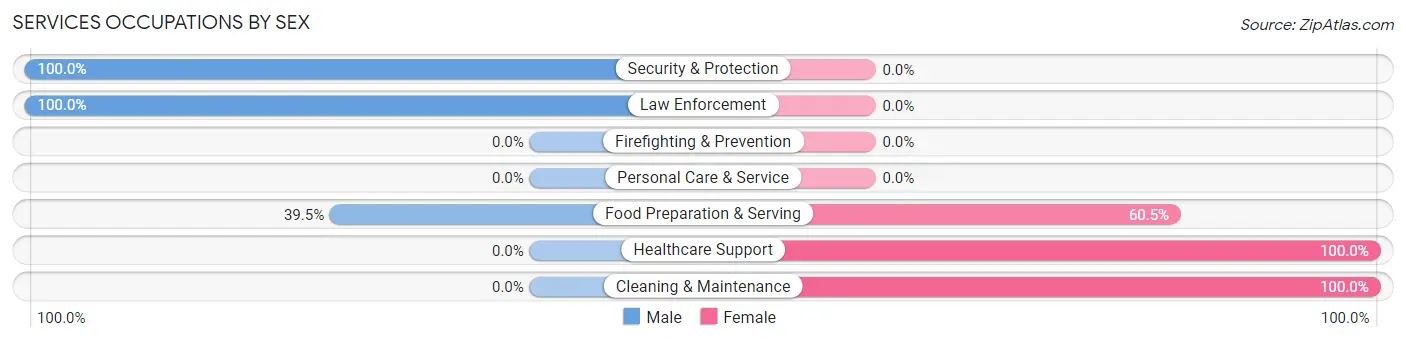
Services Occupations by Sex
Within the Services occupations in Island Pond, the most male-oriented occupations are Security & Protection (100.0%), Law Enforcement (100.0%), and Food Preparation & Serving (39.5%), while the most female-oriented occupations are Healthcare Support (100.0%), Cleaning & Maintenance (100.0%), and Food Preparation & Serving (60.5%).
| Occupation | Male | Female |
| Healthcare Support | 0 (0.0%) | 9 (100.0%) |
| Security & Protection | 7 (100.0%) | 0 (0.0%) |
| Firefighting & Prevention | 0 (0.0%) | 0 (0.0%) |
| Law Enforcement | 7 (100.0%) | 0 (0.0%) |
| Food Preparation & Serving | 34 (39.5%) | 52 (60.5%) |
| Cleaning & Maintenance | 0 (0.0%) | 18 (100.0%) |
| Personal Care & Service | 0 (0.0%) | 0 (0.0%) |
| Total (Category) | 41 (34.2%) | 79 (65.8%) |
| Total (Overall) | 108 (34.2%) | 208 (65.8%) |
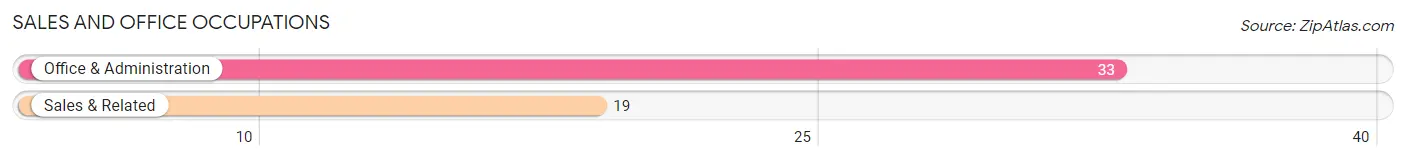
Sales and Office Occupations
The most common Sales and Office occupations in Island Pond are Office & Administration (33 | 10.4%), and Sales & Related (19 | 6.0%).
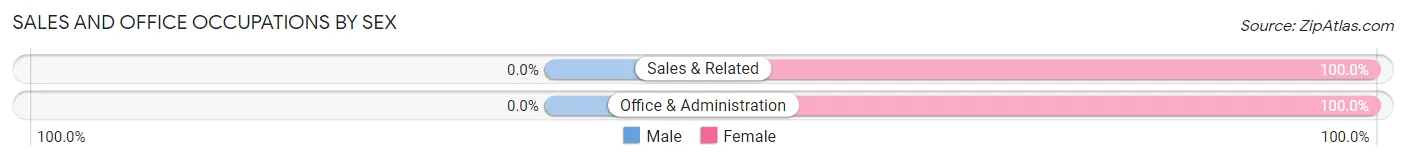
Sales and Office Occupations by Sex
| Occupation | Male | Female |
| Sales & Related | 0 (0.0%) | 19 (100.0%) |
| Office & Administration | 0 (0.0%) | 33 (100.0%) |
| Total (Category) | 0 (0.0%) | 52 (100.0%) |
| Total (Overall) | 108 (34.2%) | 208 (65.8%) |
Natural Resources, Construction and Maintenance Occupations
The most common Natural Resources, Construction and Maintenance occupations in Island Pond are , and Construction & Extraction (19 | 6.0%).
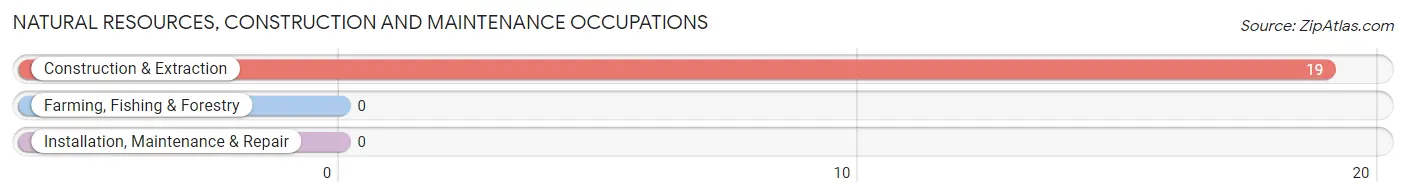
Natural Resources, Construction and Maintenance Occupations by Sex
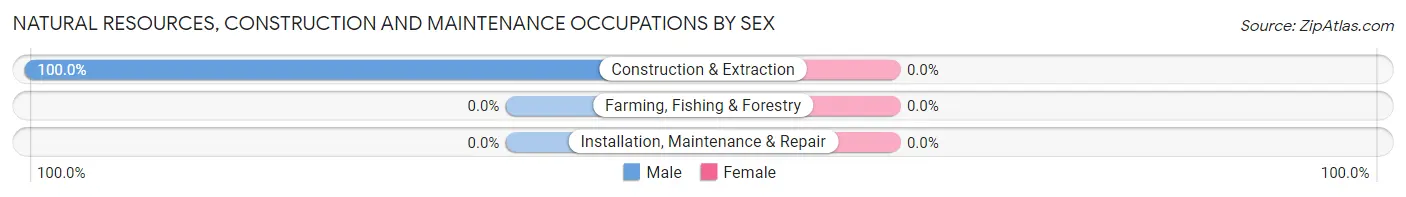
| Occupation | Male | Female |
| Farming, Fishing & Forestry | 0 (0.0%) | 0 (0.0%) |
| Construction & Extraction | 19 (100.0%) | 0 (0.0%) |
| Installation, Maintenance & Repair | 0 (0.0%) | 0 (0.0%) |
| Total (Category) | 19 (100.0%) | 0 (0.0%) |
| Total (Overall) | 108 (34.2%) | 208 (65.8%) |
Production, Transportation and Moving Occupations
The most common Production, Transportation and Moving occupations in Island Pond are Material Moving (21 | 6.7%), Transportation (13 | 4.1%), and Production (7 | 2.2%).
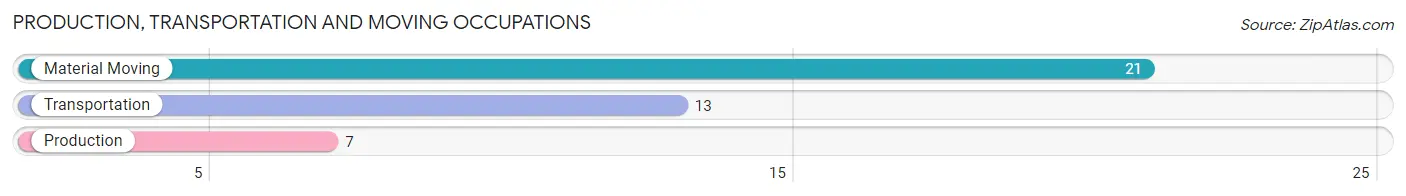
Production, Transportation and Moving Occupations by Sex
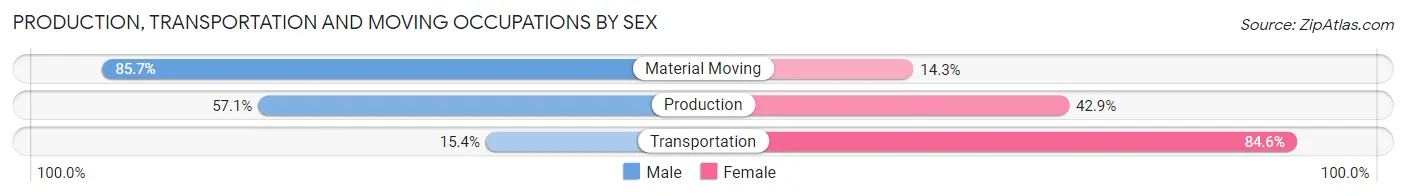
| Occupation | Male | Female |
| Production | 4 (57.1%) | 3 (42.9%) |
| Transportation | 2 (15.4%) | 11 (84.6%) |
| Material Moving | 18 (85.7%) | 3 (14.3%) |
| Total (Category) | 24 (58.5%) | 17 (41.5%) |
| Total (Overall) | 108 (34.2%) | 208 (65.8%) |
Employment Industries by Sex in Island Pond
Employment Industries in Island Pond
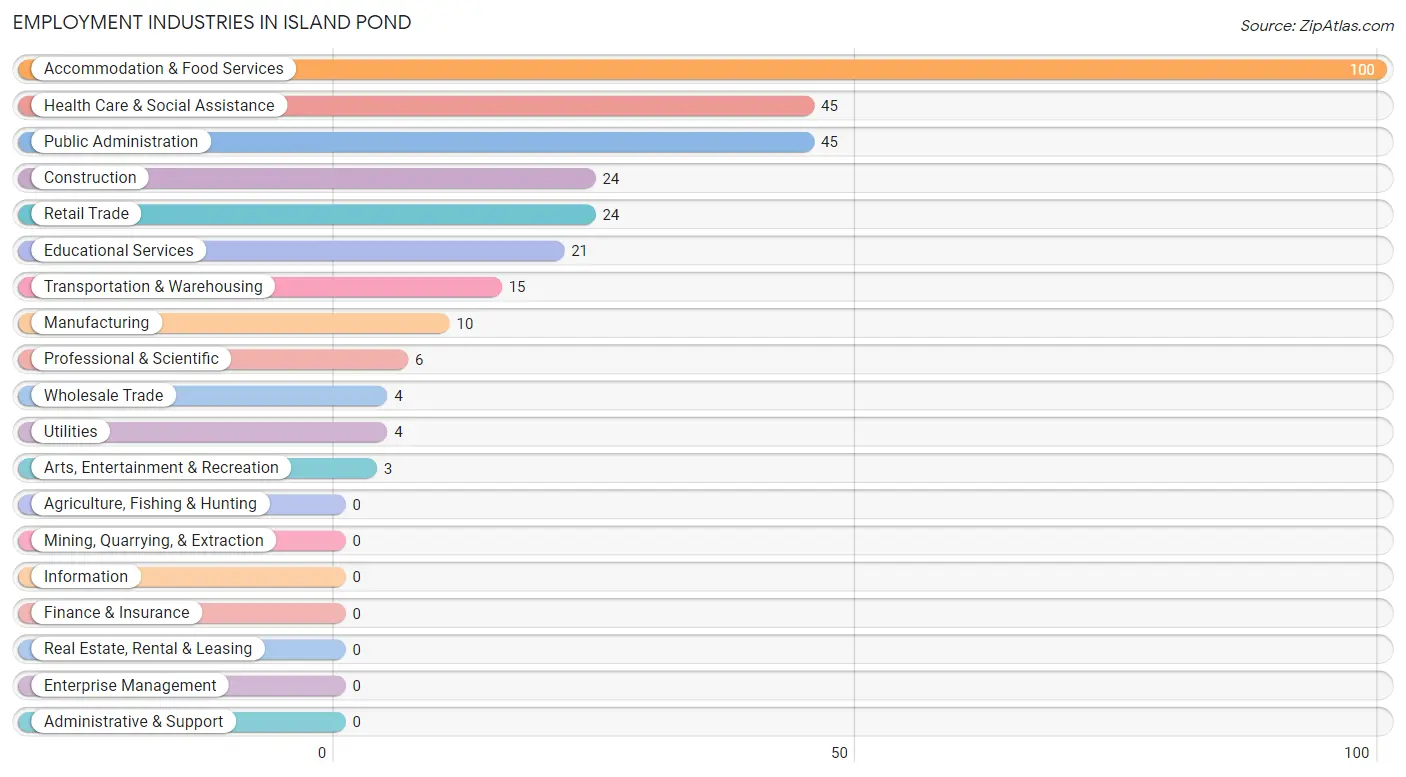
The major employment industries in Island Pond include Accommodation & Food Services (100 | 31.7%), Health Care & Social Assistance (45 | 14.2%), Public Administration (45 | 14.2%), Construction (24 | 7.6%), and Retail Trade (24 | 7.6%).
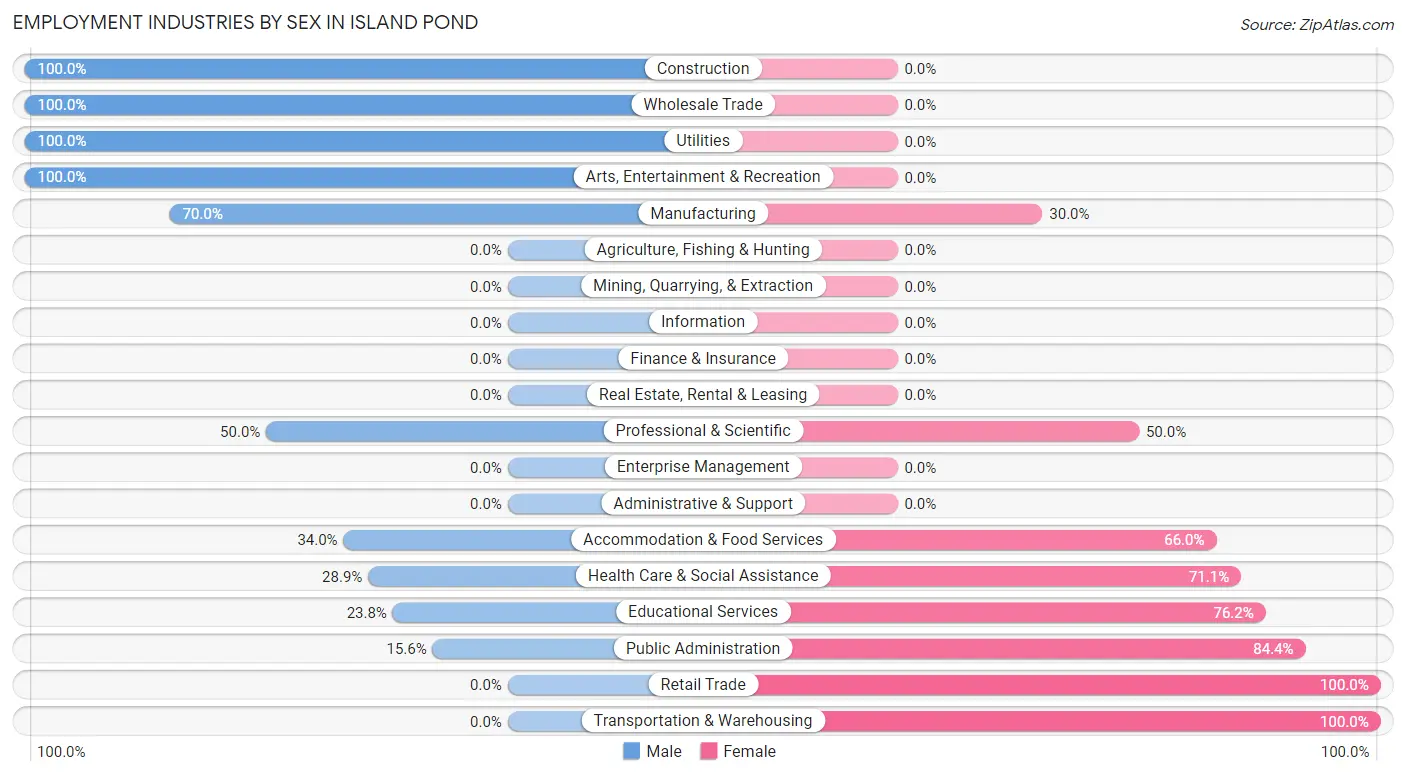
Employment Industries by Sex in Island Pond
The Island Pond industries that see more men than women are Construction (100.0%), Wholesale Trade (100.0%), and Utilities (100.0%), whereas the industries that tend to have a higher number of women are Retail Trade (100.0%), Transportation & Warehousing (100.0%), and Public Administration (84.4%).
| Industry | Male | Female |
| Agriculture, Fishing & Hunting | 0 (0.0%) | 0 (0.0%) |
| Mining, Quarrying, & Extraction | 0 (0.0%) | 0 (0.0%) |
| Construction | 24 (100.0%) | 0 (0.0%) |
| Manufacturing | 7 (70.0%) | 3 (30.0%) |
| Wholesale Trade | 4 (100.0%) | 0 (0.0%) |
| Retail Trade | 0 (0.0%) | 24 (100.0%) |
| Transportation & Warehousing | 0 (0.0%) | 15 (100.0%) |
| Utilities | 4 (100.0%) | 0 (0.0%) |
| Information | 0 (0.0%) | 0 (0.0%) |
| Finance & Insurance | 0 (0.0%) | 0 (0.0%) |
| Real Estate, Rental & Leasing | 0 (0.0%) | 0 (0.0%) |
| Professional & Scientific | 3 (50.0%) | 3 (50.0%) |
| Enterprise Management | 0 (0.0%) | 0 (0.0%) |
| Administrative & Support | 0 (0.0%) | 0 (0.0%) |
| Educational Services | 5 (23.8%) | 16 (76.2%) |
| Health Care & Social Assistance | 13 (28.9%) | 32 (71.1%) |
| Arts, Entertainment & Recreation | 3 (100.0%) | 0 (0.0%) |
| Accommodation & Food Services | 34 (34.0%) | 66 (66.0%) |
| Public Administration | 7 (15.6%) | 38 (84.4%) |
| Total | 108 (34.2%) | 208 (65.8%) |
Education in Island Pond
School Enrollment in Island Pond
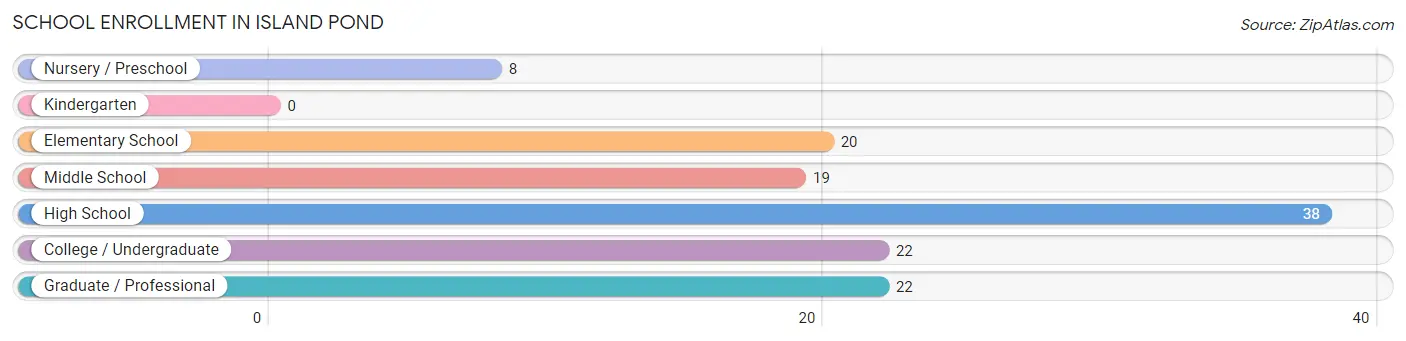
The most common levels of schooling among the 129 students in Island Pond are high school (38 | 29.5%), college / undergraduate (22 | 17.1%), and graduate / professional (22 | 17.1%).
| School Level | # Students | % Students |
| Nursery / Preschool | 8 | 6.2% |
| Kindergarten | 0 | 0.0% |
| Elementary School | 20 | 15.5% |
| Middle School | 19 | 14.7% |
| High School | 38 | 29.5% |
| College / Undergraduate | 22 | 17.1% |
| Graduate / Professional | 22 | 17.1% |
| Total | 129 | 100.0% |
School Enrollment by Age by Funding Source in Island Pond
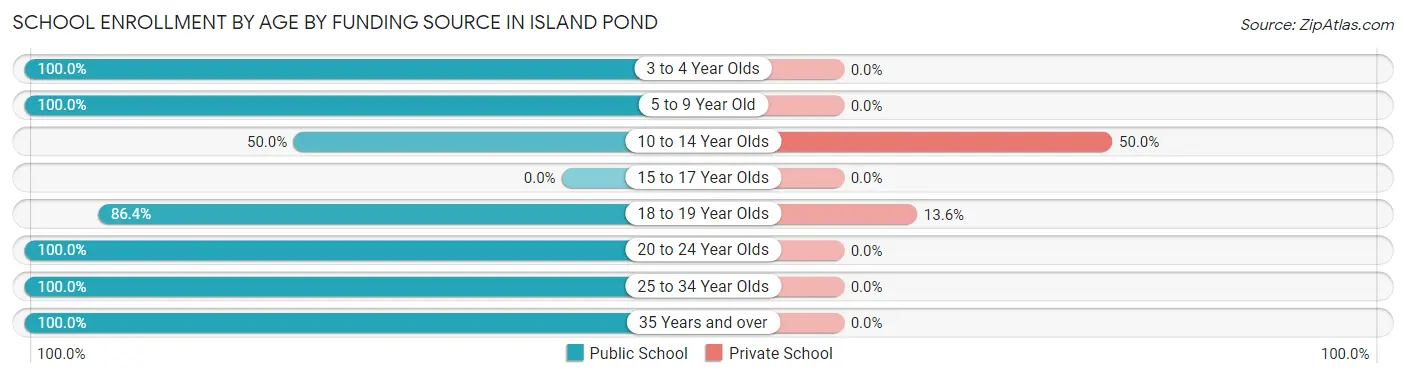
Out of a total of 129 students who are enrolled in schools in Island Pond, 19 (14.7%) attend a private institution, while the remaining 110 (85.3%) are enrolled in public schools. The age group of 10 to 14 year olds has the highest likelihood of being enrolled in private schools, with 16 (50.0% in the age bracket) enrolled. Conversely, the age group of 3 to 4 year olds has the lowest likelihood of being enrolled in a private school, with 8 (100.0% in the age bracket) attending a public institution.
| Age Bracket | Public School | Private School |
| 3 to 4 Year Olds | 8 (100.0%) | 0 (0.0%) |
| 5 to 9 Year Old | 20 (100.0%) | 0 (0.0%) |
| 10 to 14 Year Olds | 16 (50.0%) | 16 (50.0%) |
| 15 to 17 Year Olds | 0 (0.0%) | 0 (0.0%) |
| 18 to 19 Year Olds | 19 (86.4%) | 3 (13.6%) |
| 20 to 24 Year Olds | 22 (100.0%) | 0 (0.0%) |
| 25 to 34 Year Olds | 22 (100.0%) | 0 (0.0%) |
| 35 Years and over | 3 (100.0%) | 0 (0.0%) |
| Total | 110 (85.3%) | 19 (14.7%) |
Educational Attainment by Field of Study in Island Pond
Communications (42 | 23.6%), science & technology (39 | 21.9%), social sciences (33 | 18.5%), arts & humanities (13 | 7.3%), and psychology (11 | 6.2%) are the most common fields of study among 178 individuals in Island Pond who have obtained a bachelor's degree or higher.
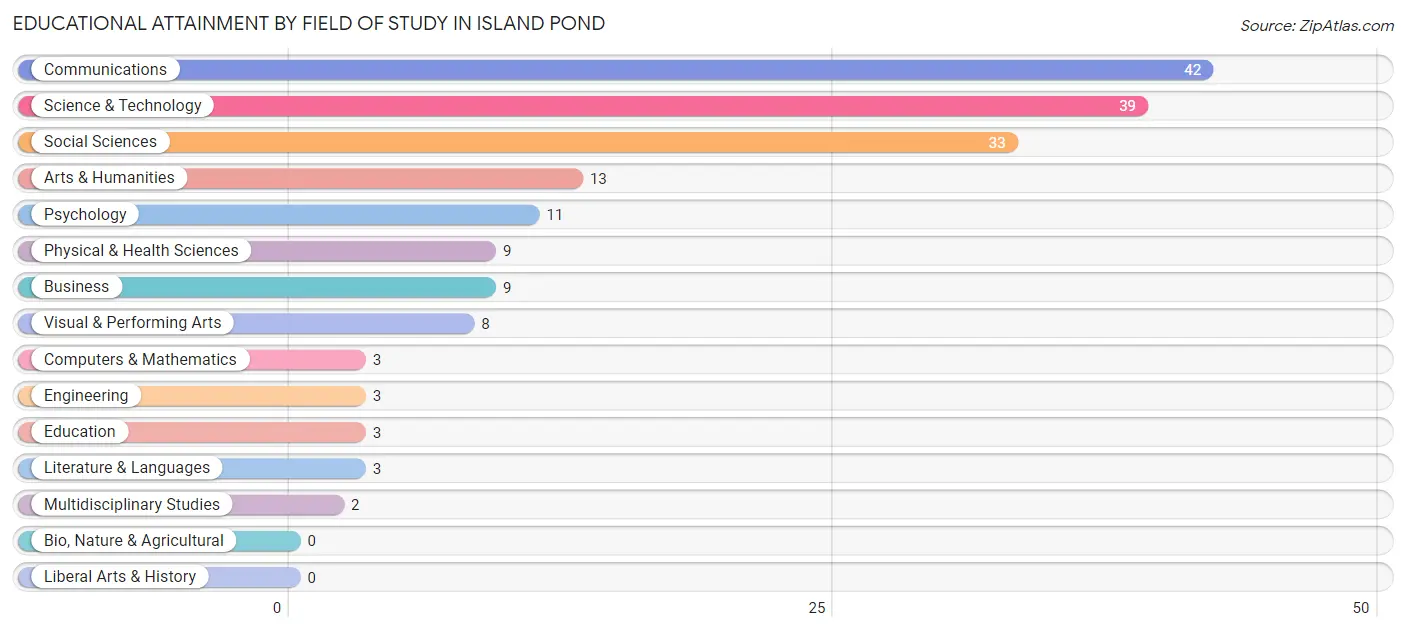
| Field of Study | # Graduates | % Graduates |
| Computers & Mathematics | 3 | 1.7% |
| Bio, Nature & Agricultural | 0 | 0.0% |
| Physical & Health Sciences | 9 | 5.1% |
| Psychology | 11 | 6.2% |
| Social Sciences | 33 | 18.5% |
| Engineering | 3 | 1.7% |
| Multidisciplinary Studies | 2 | 1.1% |
| Science & Technology | 39 | 21.9% |
| Business | 9 | 5.1% |
| Education | 3 | 1.7% |
| Literature & Languages | 3 | 1.7% |
| Liberal Arts & History | 0 | 0.0% |
| Visual & Performing Arts | 8 | 4.5% |
| Communications | 42 | 23.6% |
| Arts & Humanities | 13 | 7.3% |
| Total | 178 | 100.0% |
Transportation & Commute in Island Pond
Vehicle Availability by Sex in Island Pond
The most prevalent vehicle ownership categories in Island Pond are males with 3 vehicles (48, accounting for 46.2%) and females with 3 vehicles (60, making up 23.1%).
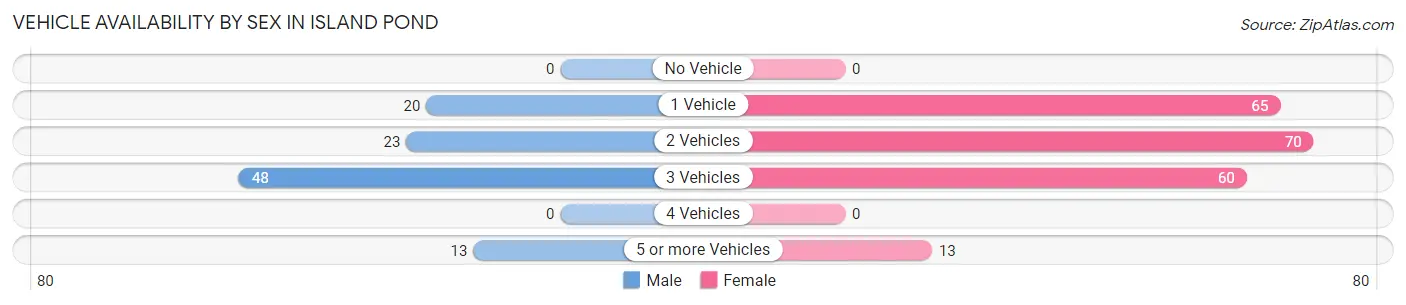
| Vehicles Available | Male | Female |
| No Vehicle | 0 (0.0%) | 0 (0.0%) |
| 1 Vehicle | 20 (19.2%) | 65 (31.2%) |
| 2 Vehicles | 23 (22.1%) | 70 (33.7%) |
| 3 Vehicles | 48 (46.2%) | 60 (28.8%) |
| 4 Vehicles | 0 (0.0%) | 0 (0.0%) |
| 5 or more Vehicles | 13 (12.5%) | 13 (6.2%) |
| Total | 104 (100.0%) | 208 (100.0%) |
Commute Time in Island Pond
The most frequently occuring commute durations in Island Pond are 30 to 34 minutes (72 commuters, 24.8%), less than 5 minutes (57 commuters, 19.7%), and 15 to 19 minutes (25 commuters, 8.6%).
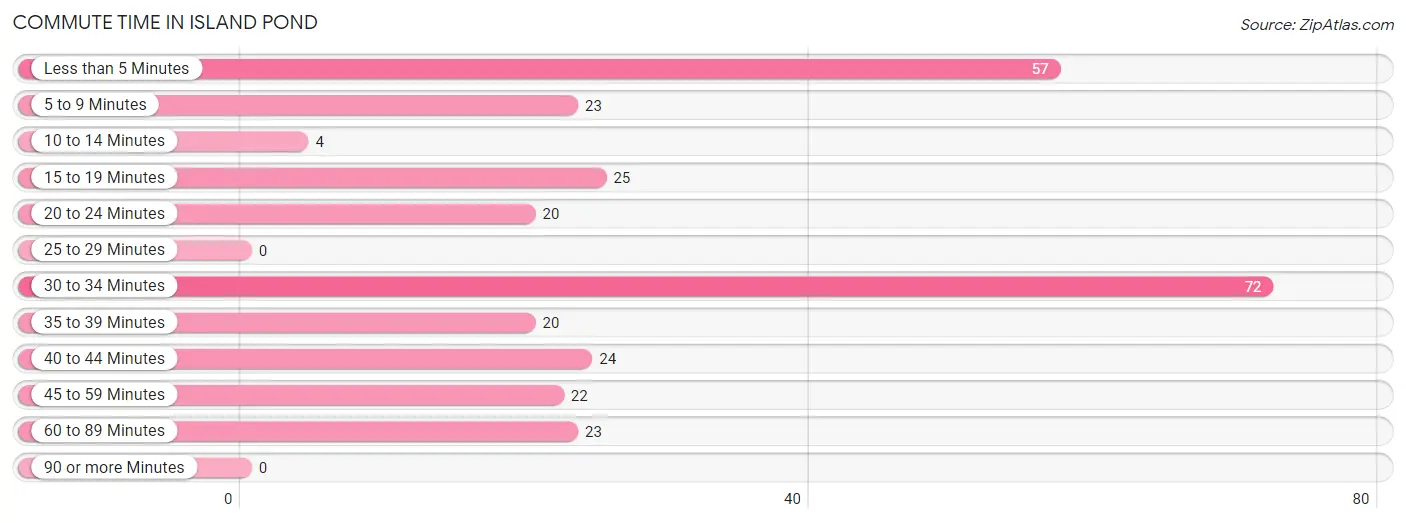
| Commute Time | # Commuters | % Commuters |
| Less than 5 Minutes | 57 | 19.7% |
| 5 to 9 Minutes | 23 | 7.9% |
| 10 to 14 Minutes | 4 | 1.4% |
| 15 to 19 Minutes | 25 | 8.6% |
| 20 to 24 Minutes | 20 | 6.9% |
| 25 to 29 Minutes | 0 | 0.0% |
| 30 to 34 Minutes | 72 | 24.8% |
| 35 to 39 Minutes | 20 | 6.9% |
| 40 to 44 Minutes | 24 | 8.3% |
| 45 to 59 Minutes | 22 | 7.6% |
| 60 to 89 Minutes | 23 | 7.9% |
| 90 or more Minutes | 0 | 0.0% |
Commute Time by Sex in Island Pond
The most common commute times in Island Pond are 40 to 44 minutes (24 commuters, 28.2%) for males and 30 to 34 minutes (65 commuters, 31.7%) for females.
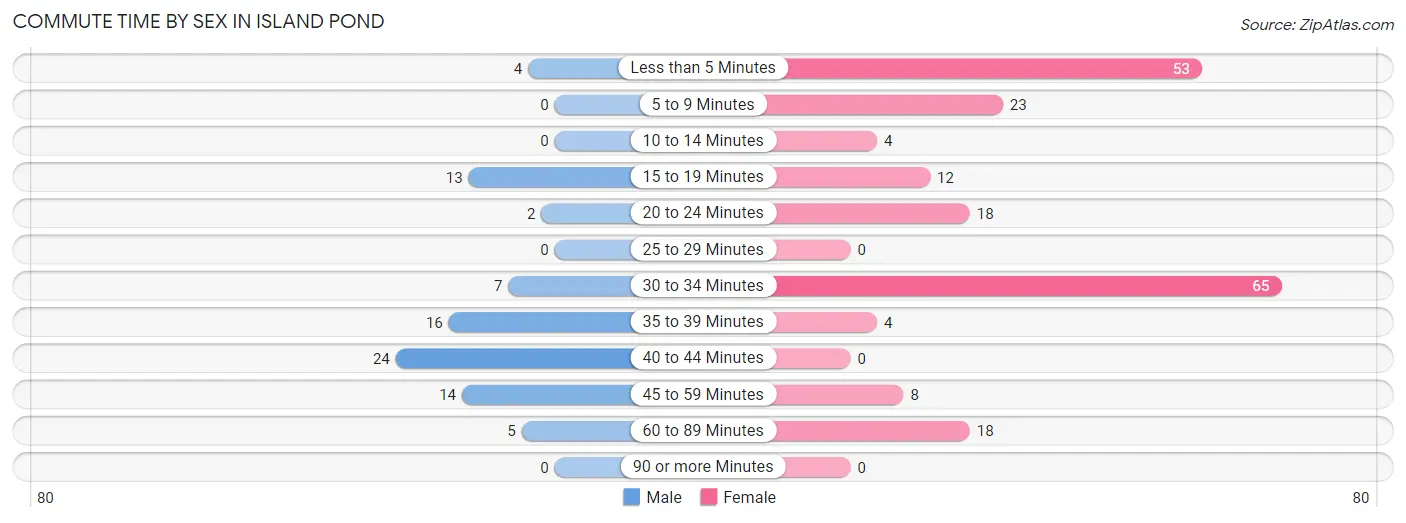
| Commute Time | Male | Female |
| Less than 5 Minutes | 4 (4.7%) | 53 (25.9%) |
| 5 to 9 Minutes | 0 (0.0%) | 23 (11.2%) |
| 10 to 14 Minutes | 0 (0.0%) | 4 (1.9%) |
| 15 to 19 Minutes | 13 (15.3%) | 12 (5.9%) |
| 20 to 24 Minutes | 2 (2.4%) | 18 (8.8%) |
| 25 to 29 Minutes | 0 (0.0%) | 0 (0.0%) |
| 30 to 34 Minutes | 7 (8.2%) | 65 (31.7%) |
| 35 to 39 Minutes | 16 (18.8%) | 4 (1.9%) |
| 40 to 44 Minutes | 24 (28.2%) | 0 (0.0%) |
| 45 to 59 Minutes | 14 (16.5%) | 8 (3.9%) |
| 60 to 89 Minutes | 5 (5.9%) | 18 (8.8%) |
| 90 or more Minutes | 0 (0.0%) | 0 (0.0%) |
Time of Departure to Work by Sex in Island Pond
The most frequent times of departure to work in Island Pond are 10:00 AM to 10:59 AM (22, 25.9%) for males and 12:00 PM to 3:59 PM (51, 24.9%) for females.
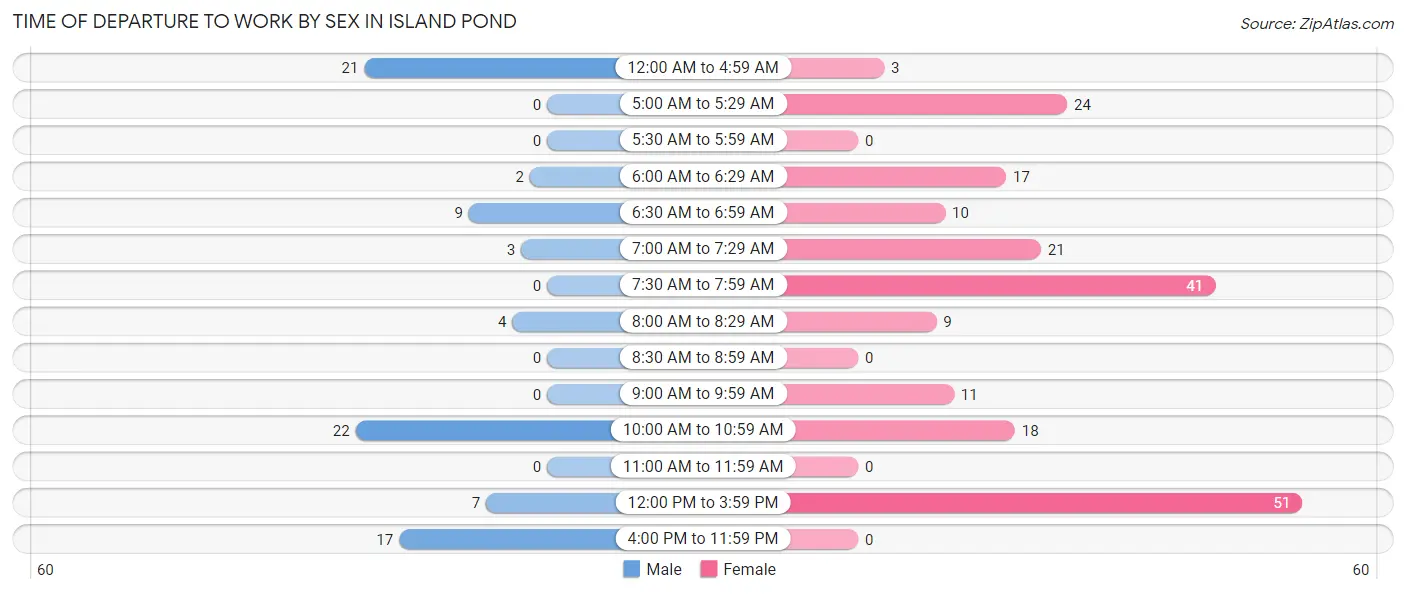
| Time of Departure | Male | Female |
| 12:00 AM to 4:59 AM | 21 (24.7%) | 3 (1.5%) |
| 5:00 AM to 5:29 AM | 0 (0.0%) | 24 (11.7%) |
| 5:30 AM to 5:59 AM | 0 (0.0%) | 0 (0.0%) |
| 6:00 AM to 6:29 AM | 2 (2.4%) | 17 (8.3%) |
| 6:30 AM to 6:59 AM | 9 (10.6%) | 10 (4.9%) |
| 7:00 AM to 7:29 AM | 3 (3.5%) | 21 (10.2%) |
| 7:30 AM to 7:59 AM | 0 (0.0%) | 41 (20.0%) |
| 8:00 AM to 8:29 AM | 4 (4.7%) | 9 (4.4%) |
| 8:30 AM to 8:59 AM | 0 (0.0%) | 0 (0.0%) |
| 9:00 AM to 9:59 AM | 0 (0.0%) | 11 (5.4%) |
| 10:00 AM to 10:59 AM | 22 (25.9%) | 18 (8.8%) |
| 11:00 AM to 11:59 AM | 0 (0.0%) | 0 (0.0%) |
| 12:00 PM to 3:59 PM | 7 (8.2%) | 51 (24.9%) |
| 4:00 PM to 11:59 PM | 17 (20.0%) | 0 (0.0%) |
| Total | 85 (100.0%) | 205 (100.0%) |
Housing Occupancy in Island Pond
Occupancy by Ownership in Island Pond
Of the total 374 dwellings in Island Pond, owner-occupied units account for 191 (51.1%), while renter-occupied units make up 183 (48.9%).
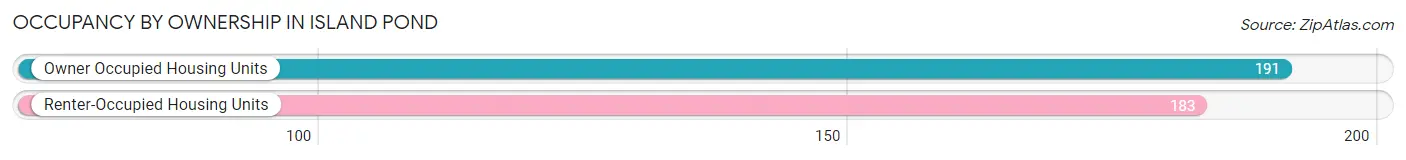
| Occupancy | # Housing Units | % Housing Units |
| Owner Occupied Housing Units | 191 | 51.1% |
| Renter-Occupied Housing Units | 183 | 48.9% |
| Total Occupied Housing Units | 374 | 100.0% |
Occupancy by Household Size in Island Pond
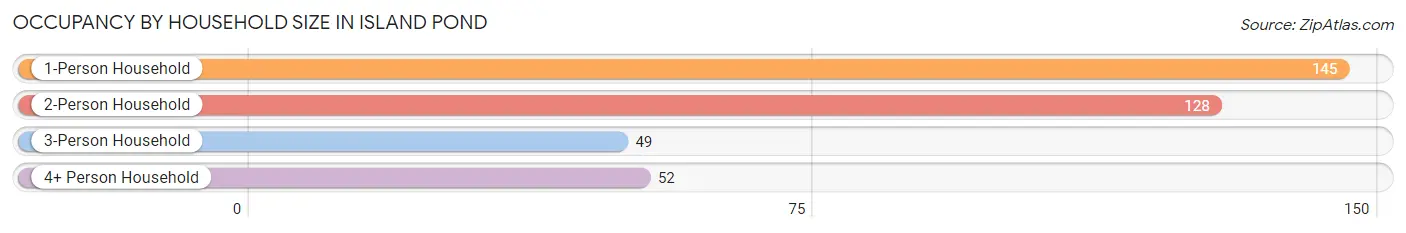
| Household Size | # Housing Units | % Housing Units |
| 1-Person Household | 145 | 38.8% |
| 2-Person Household | 128 | 34.2% |
| 3-Person Household | 49 | 13.1% |
| 4+ Person Household | 52 | 13.9% |
| Total Housing Units | 374 | 100.0% |
Occupancy by Ownership by Household Size in Island Pond
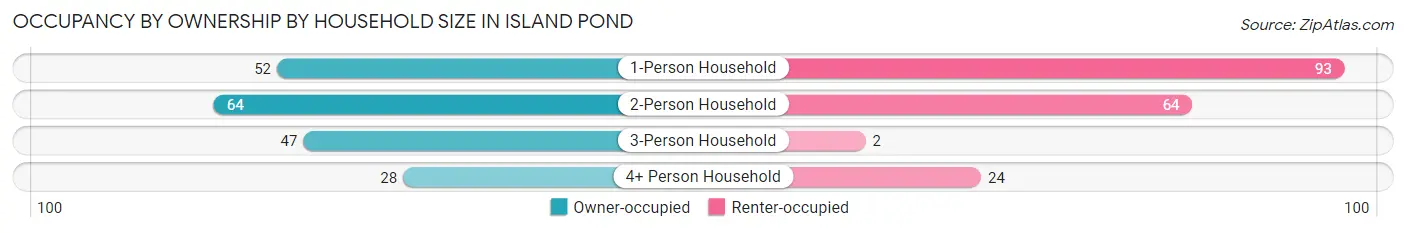
| Household Size | Owner-occupied | Renter-occupied |
| 1-Person Household | 52 (35.9%) | 93 (64.1%) |
| 2-Person Household | 64 (50.0%) | 64 (50.0%) |
| 3-Person Household | 47 (95.9%) | 2 (4.1%) |
| 4+ Person Household | 28 (53.8%) | 24 (46.2%) |
| Total Housing Units | 191 (51.1%) | 183 (48.9%) |
Occupancy by Educational Attainment in Island Pond
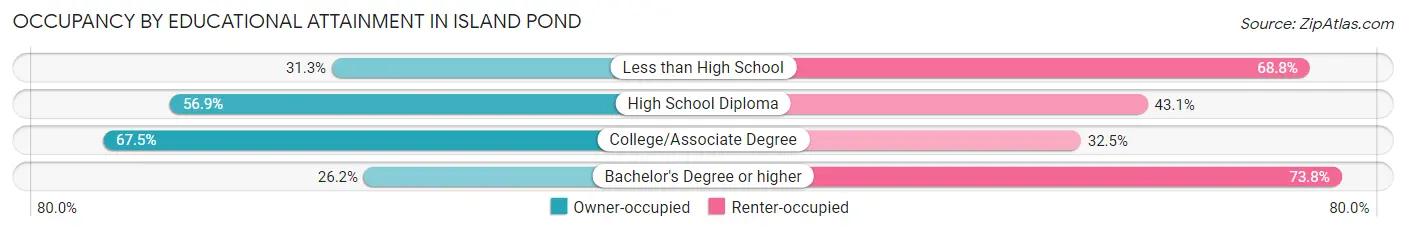
| Household Size | Owner-occupied | Renter-occupied |
| Less than High School | 10 (31.2%) | 22 (68.8%) |
| High School Diploma | 82 (56.9%) | 62 (43.1%) |
| College/Associate Degree | 77 (67.5%) | 37 (32.5%) |
| Bachelor's Degree or higher | 22 (26.2%) | 62 (73.8%) |
Occupancy by Age of Householder in Island Pond
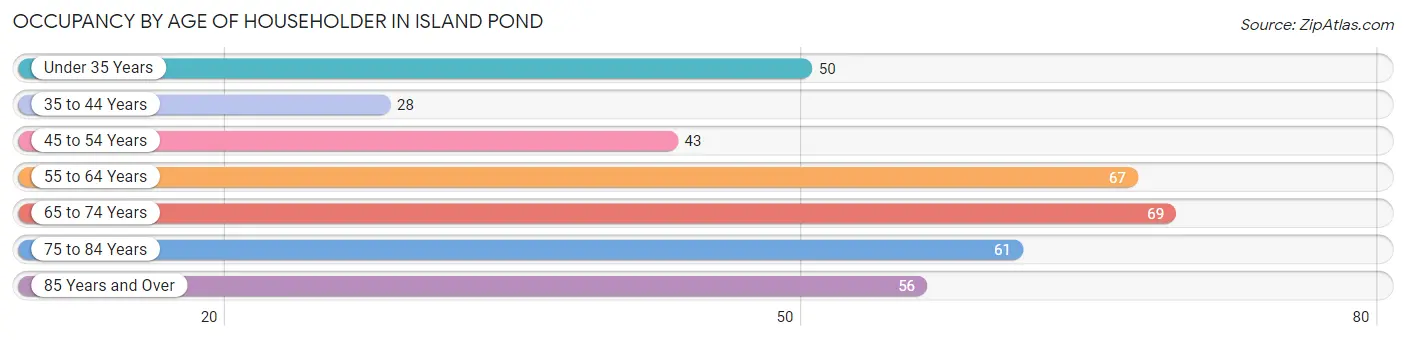
| Age Bracket | # Households | % Households |
| Under 35 Years | 50 | 13.4% |
| 35 to 44 Years | 28 | 7.5% |
| 45 to 54 Years | 43 | 11.5% |
| 55 to 64 Years | 67 | 17.9% |
| 65 to 74 Years | 69 | 18.4% |
| 75 to 84 Years | 61 | 16.3% |
| 85 Years and Over | 56 | 15.0% |
| Total | 374 | 100.0% |
Housing Finances in Island Pond
Median Income by Occupancy in Island Pond
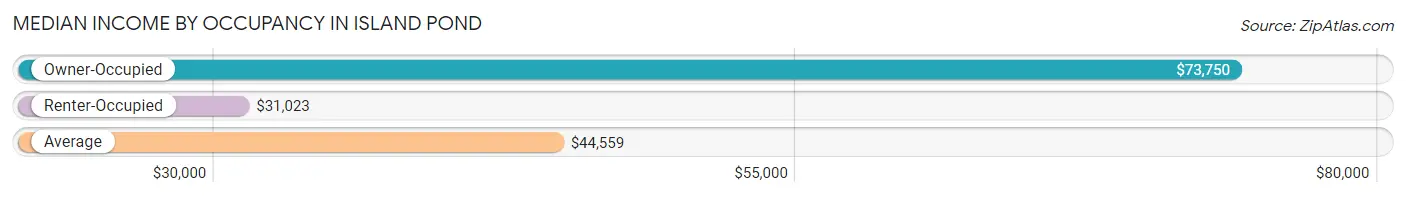
| Occupancy Type | # Households | Median Income |
| Owner-Occupied | 191 (51.1%) | $73,750 |
| Renter-Occupied | 183 (48.9%) | $31,023 |
| Average | 374 (100.0%) | $44,559 |
Occupancy by Householder Income Bracket in Island Pond
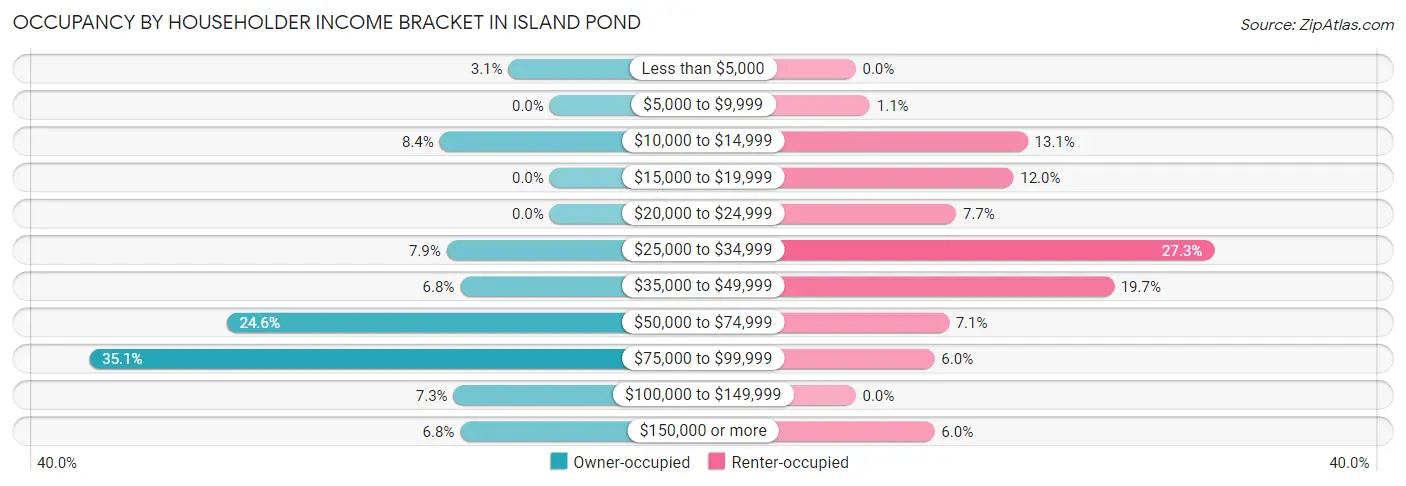
| Income Bracket | Owner-occupied | Renter-occupied |
| Less than $5,000 | 6 (3.1%) | 0 (0.0%) |
| $5,000 to $9,999 | 0 (0.0%) | 2 (1.1%) |
| $10,000 to $14,999 | 16 (8.4%) | 24 (13.1%) |
| $15,000 to $19,999 | 0 (0.0%) | 22 (12.0%) |
| $20,000 to $24,999 | 0 (0.0%) | 14 (7.6%) |
| $25,000 to $34,999 | 15 (7.9%) | 50 (27.3%) |
| $35,000 to $49,999 | 13 (6.8%) | 36 (19.7%) |
| $50,000 to $74,999 | 47 (24.6%) | 13 (7.1%) |
| $75,000 to $99,999 | 67 (35.1%) | 11 (6.0%) |
| $100,000 to $149,999 | 14 (7.3%) | 0 (0.0%) |
| $150,000 or more | 13 (6.8%) | 11 (6.0%) |
| Total | 191 (100.0%) | 183 (100.0%) |
Monthly Housing Cost Tiers in Island Pond
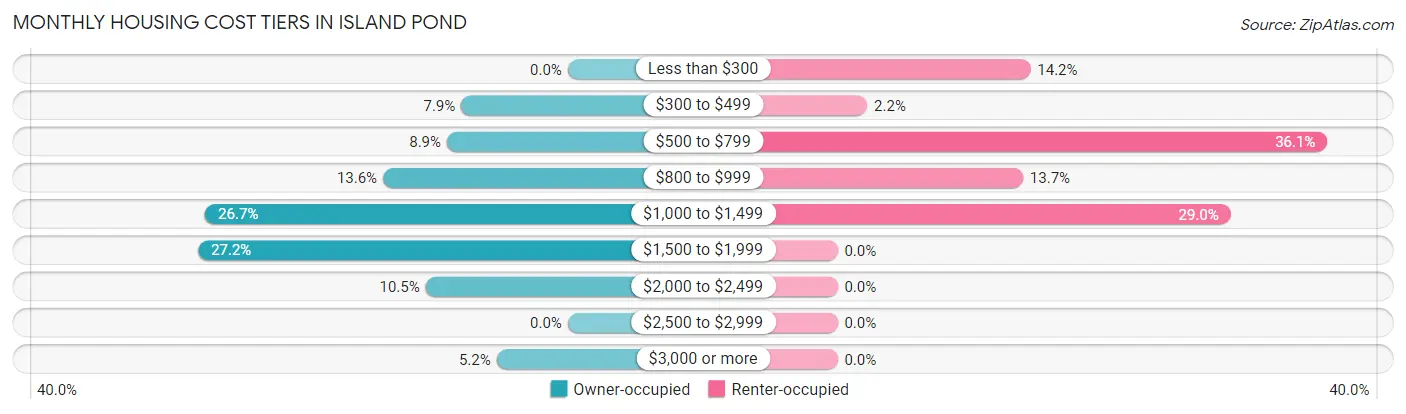
| Monthly Cost | Owner-occupied | Renter-occupied |
| Less than $300 | 0 (0.0%) | 26 (14.2%) |
| $300 to $499 | 15 (7.9%) | 4 (2.2%) |
| $500 to $799 | 17 (8.9%) | 66 (36.1%) |
| $800 to $999 | 26 (13.6%) | 25 (13.7%) |
| $1,000 to $1,499 | 51 (26.7%) | 53 (29.0%) |
| $1,500 to $1,999 | 52 (27.2%) | 0 (0.0%) |
| $2,000 to $2,499 | 20 (10.5%) | 0 (0.0%) |
| $2,500 to $2,999 | 0 (0.0%) | 0 (0.0%) |
| $3,000 or more | 10 (5.2%) | 0 (0.0%) |
| Total | 191 (100.0%) | 183 (100.0%) |
Physical Housing Characteristics in Island Pond
Housing Structures in Island Pond
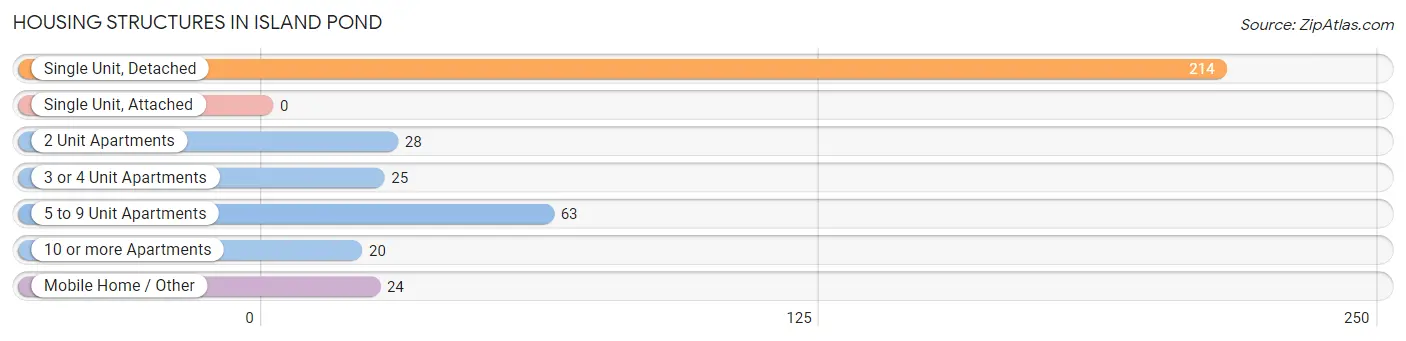
| Structure Type | # Housing Units | % Housing Units |
| Single Unit, Detached | 214 | 57.2% |
| Single Unit, Attached | 0 | 0.0% |
| 2 Unit Apartments | 28 | 7.5% |
| 3 or 4 Unit Apartments | 25 | 6.7% |
| 5 to 9 Unit Apartments | 63 | 16.8% |
| 10 or more Apartments | 20 | 5.3% |
| Mobile Home / Other | 24 | 6.4% |
| Total | 374 | 100.0% |
Housing Structures by Occupancy in Island Pond
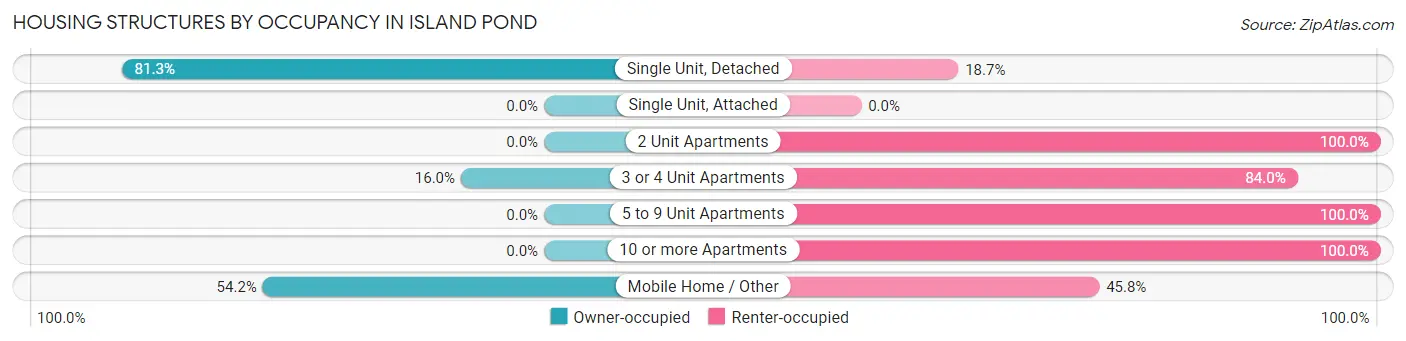
| Structure Type | Owner-occupied | Renter-occupied |
| Single Unit, Detached | 174 (81.3%) | 40 (18.7%) |
| Single Unit, Attached | 0 (0.0%) | 0 (0.0%) |
| 2 Unit Apartments | 0 (0.0%) | 28 (100.0%) |
| 3 or 4 Unit Apartments | 4 (16.0%) | 21 (84.0%) |
| 5 to 9 Unit Apartments | 0 (0.0%) | 63 (100.0%) |
| 10 or more Apartments | 0 (0.0%) | 20 (100.0%) |
| Mobile Home / Other | 13 (54.2%) | 11 (45.8%) |
| Total | 191 (51.1%) | 183 (48.9%) |
Housing Structures by Number of Rooms in Island Pond
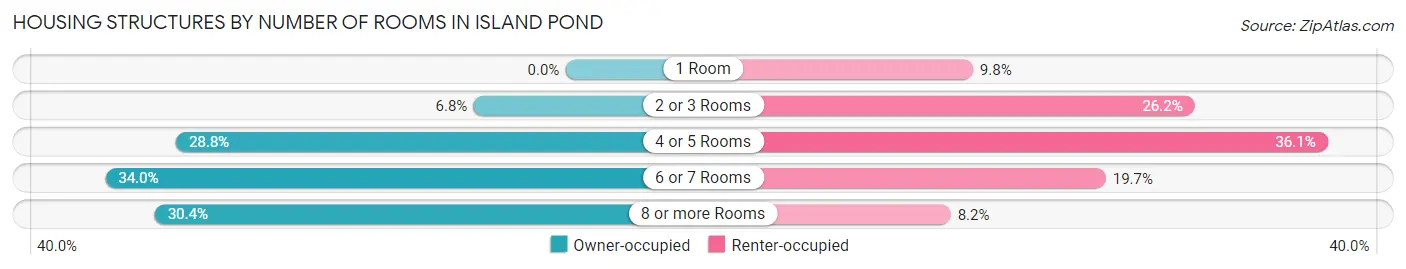
| Number of Rooms | Owner-occupied | Renter-occupied |
| 1 Room | 0 (0.0%) | 18 (9.8%) |
| 2 or 3 Rooms | 13 (6.8%) | 48 (26.2%) |
| 4 or 5 Rooms | 55 (28.8%) | 66 (36.1%) |
| 6 or 7 Rooms | 65 (34.0%) | 36 (19.7%) |
| 8 or more Rooms | 58 (30.4%) | 15 (8.2%) |
| Total | 191 (100.0%) | 183 (100.0%) |
Housing Structure by Heating Type in Island Pond
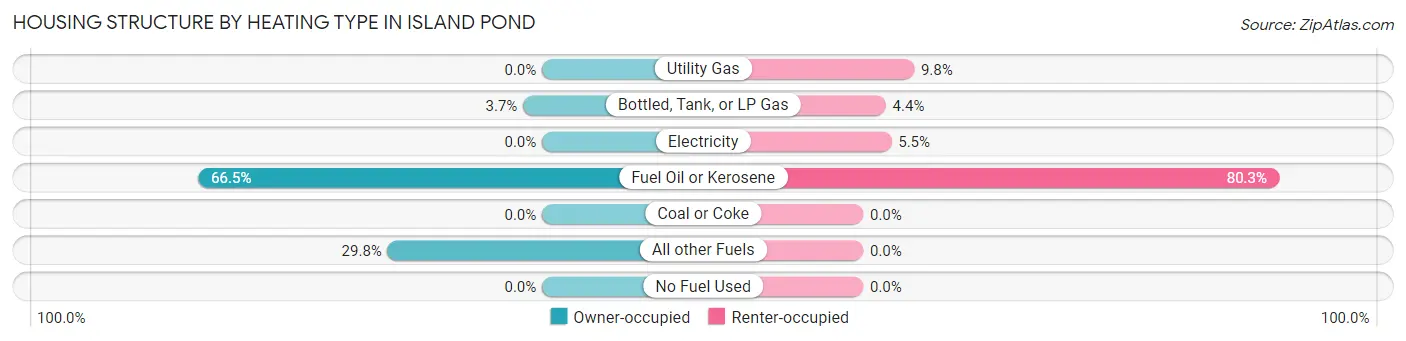
| Heating Type | Owner-occupied | Renter-occupied |
| Utility Gas | 0 (0.0%) | 18 (9.8%) |
| Bottled, Tank, or LP Gas | 7 (3.7%) | 8 (4.4%) |
| Electricity | 0 (0.0%) | 10 (5.5%) |
| Fuel Oil or Kerosene | 127 (66.5%) | 147 (80.3%) |
| Coal or Coke | 0 (0.0%) | 0 (0.0%) |
| All other Fuels | 57 (29.8%) | 0 (0.0%) |
| No Fuel Used | 0 (0.0%) | 0 (0.0%) |
| Total | 191 (100.0%) | 183 (100.0%) |
Household Vehicle Usage in Island Pond
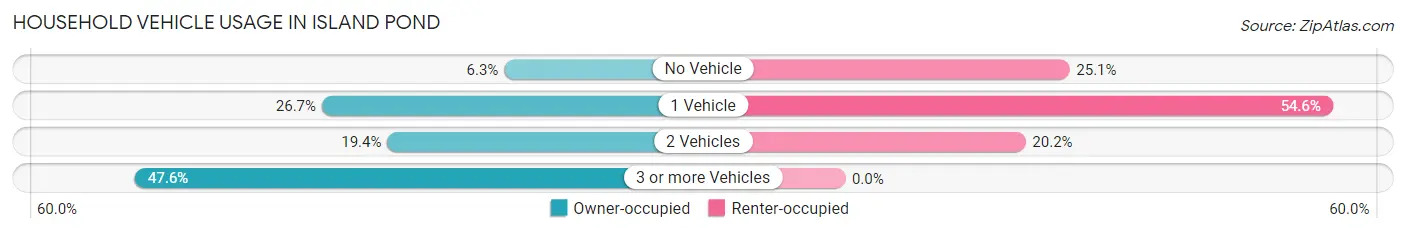
| Vehicles per Household | Owner-occupied | Renter-occupied |
| No Vehicle | 12 (6.3%) | 46 (25.1%) |
| 1 Vehicle | 51 (26.7%) | 100 (54.6%) |
| 2 Vehicles | 37 (19.4%) | 37 (20.2%) |
| 3 or more Vehicles | 91 (47.6%) | 0 (0.0%) |
| Total | 191 (100.0%) | 183 (100.0%) |
Real Estate & Mortgages in Island Pond
Real Estate and Mortgage Overview in Island Pond
| Characteristic | Without Mortgage | With Mortgage |
| Housing Units | 58 | 133 |
| Median Property Value | - | - |
| Median Household Income | $61,250 | $2 |
| Monthly Housing Costs | $817 | $6 |
| Real Estate Taxes | $1,438 | $4 |
Property Value by Mortgage Status in Island Pond
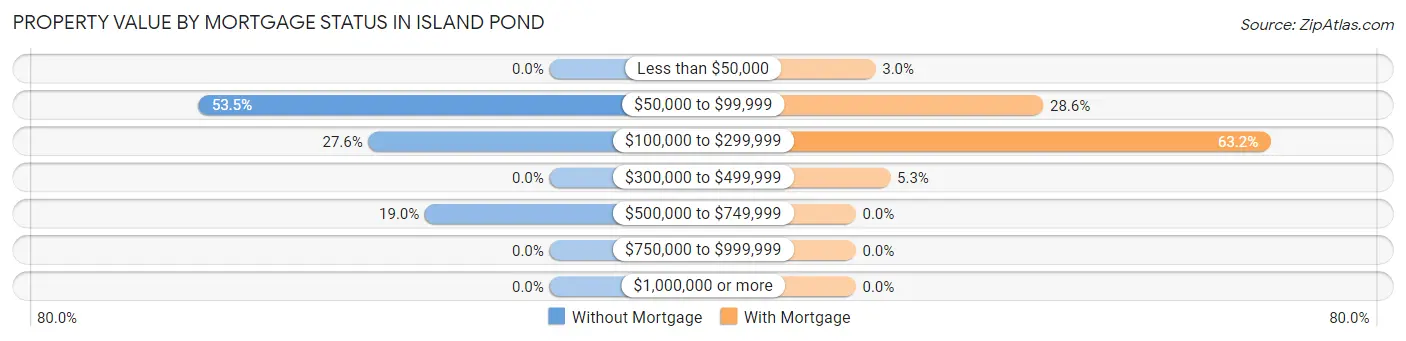
| Property Value | Without Mortgage | With Mortgage |
| Less than $50,000 | 0 (0.0%) | 4 (3.0%) |
| $50,000 to $99,999 | 31 (53.4%) | 38 (28.6%) |
| $100,000 to $299,999 | 16 (27.6%) | 84 (63.2%) |
| $300,000 to $499,999 | 0 (0.0%) | 7 (5.3%) |
| $500,000 to $749,999 | 11 (19.0%) | 0 (0.0%) |
| $750,000 to $999,999 | 0 (0.0%) | 0 (0.0%) |
| $1,000,000 or more | 0 (0.0%) | 0 (0.0%) |
| Total | 58 (100.0%) | 133 (100.0%) |
Household Income by Mortgage Status in Island Pond
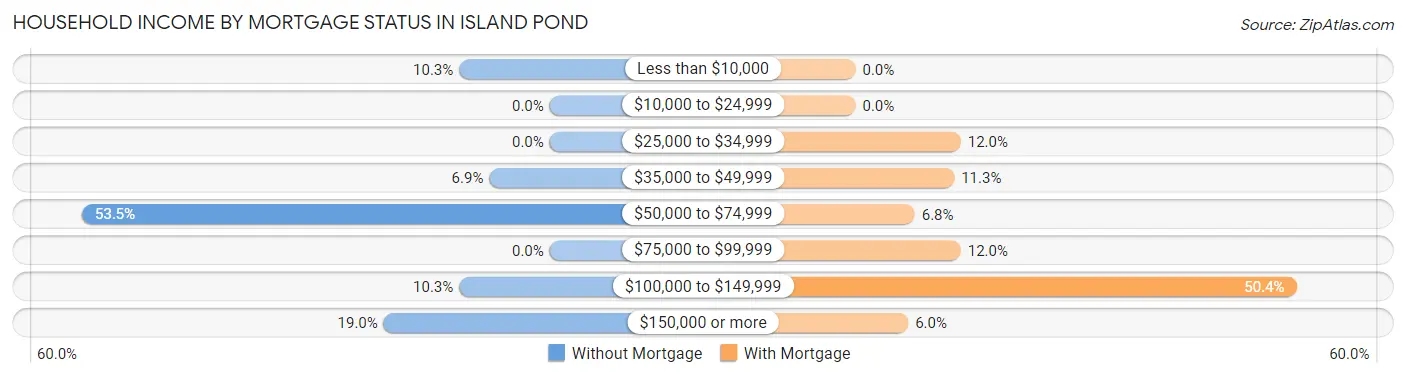
| Household Income | Without Mortgage | With Mortgage |
| Less than $10,000 | 6 (10.3%) | 0 (0.0%) |
| $10,000 to $24,999 | 0 (0.0%) | 0 (0.0%) |
| $25,000 to $34,999 | 0 (0.0%) | 16 (12.0%) |
| $35,000 to $49,999 | 4 (6.9%) | 15 (11.3%) |
| $50,000 to $74,999 | 31 (53.4%) | 9 (6.8%) |
| $75,000 to $99,999 | 0 (0.0%) | 16 (12.0%) |
| $100,000 to $149,999 | 6 (10.3%) | 67 (50.4%) |
| $150,000 or more | 11 (19.0%) | 8 (6.0%) |
| Total | 58 (100.0%) | 133 (100.0%) |
Property Value to Household Income Ratio in Island Pond
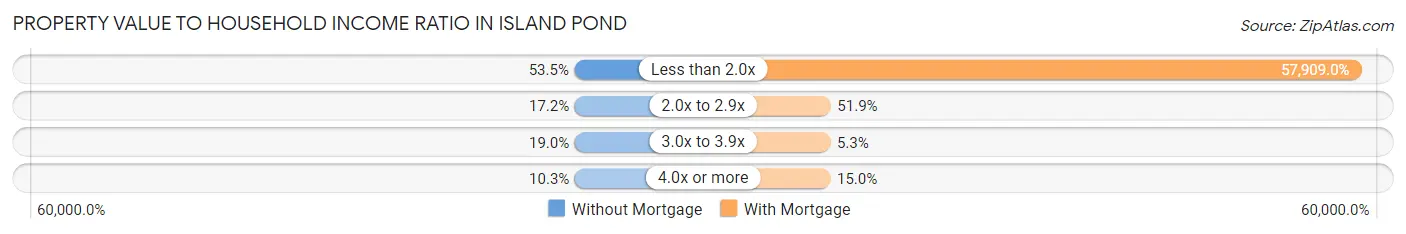
| Value-to-Income Ratio | Without Mortgage | With Mortgage |
| Less than 2.0x | 31 (53.4%) | 77,019 (57,909.0%) |
| 2.0x to 2.9x | 10 (17.2%) | 69 (51.9%) |
| 3.0x to 3.9x | 11 (19.0%) | 7 (5.3%) |
| 4.0x or more | 6 (10.3%) | 20 (15.0%) |
| Total | 58 (100.0%) | 133 (100.0%) |
Real Estate Taxes by Mortgage Status in Island Pond
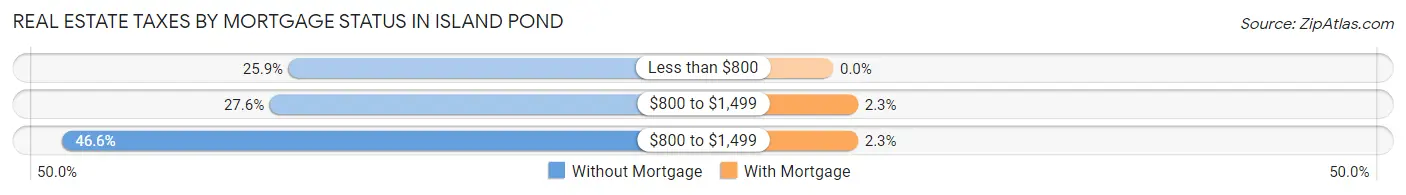
| Property Taxes | Without Mortgage | With Mortgage |
| Less than $800 | 15 (25.9%) | 0 (0.0%) |
| $800 to $1,499 | 16 (27.6%) | 3 (2.3%) |
| $800 to $1,499 | 27 (46.6%) | 3 (2.3%) |
| Total | 58 (100.0%) | 133 (100.0%) |
Health & Disability in Island Pond
Health Insurance Coverage by Age in Island Pond
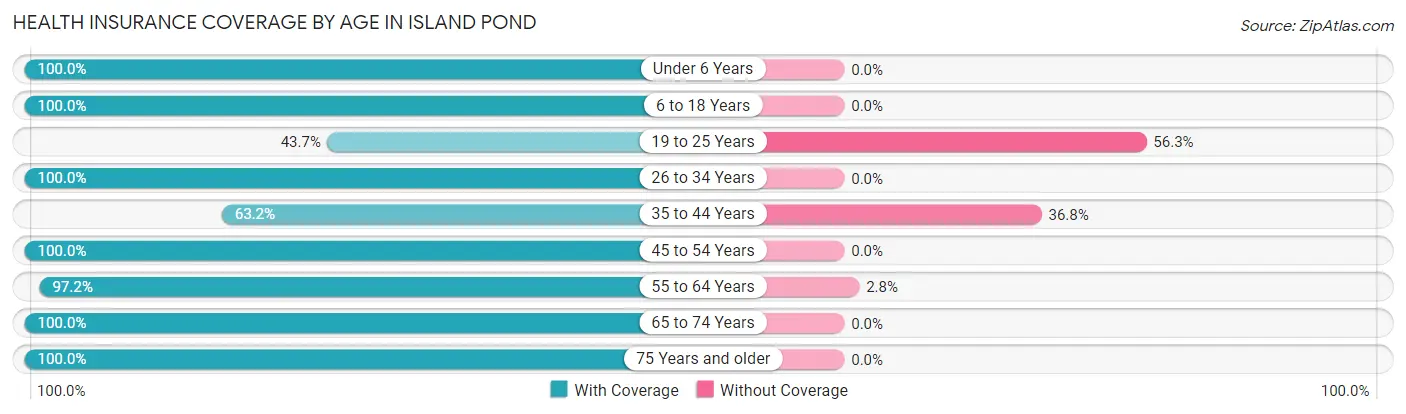
| Age Bracket | With Coverage | Without Coverage |
| Under 6 Years | 34 (100.0%) | 0 (0.0%) |
| 6 to 18 Years | 83 (100.0%) | 0 (0.0%) |
| 19 to 25 Years | 31 (43.7%) | 40 (56.3%) |
| 26 to 34 Years | 50 (100.0%) | 0 (0.0%) |
| 35 to 44 Years | 55 (63.2%) | 32 (36.8%) |
| 45 to 54 Years | 96 (100.0%) | 0 (0.0%) |
| 55 to 64 Years | 105 (97.2%) | 3 (2.8%) |
| 65 to 74 Years | 94 (100.0%) | 0 (0.0%) |
| 75 Years and older | 136 (100.0%) | 0 (0.0%) |
| Total | 684 (90.1%) | 75 (9.9%) |
Health Insurance Coverage by Citizenship Status in Island Pond
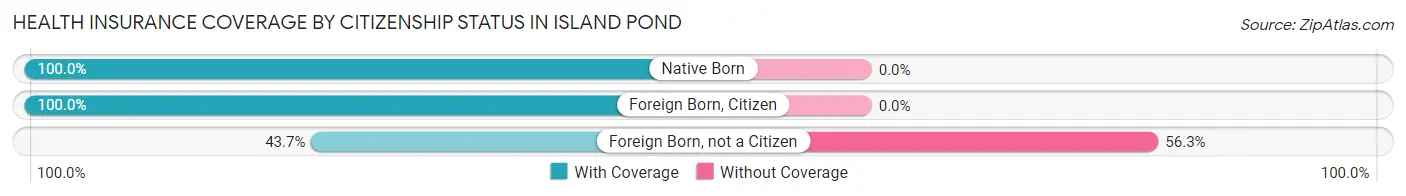
| Citizenship Status | With Coverage | Without Coverage |
| Native Born | 34 (100.0%) | 0 (0.0%) |
| Foreign Born, Citizen | 83 (100.0%) | 0 (0.0%) |
| Foreign Born, not a Citizen | 31 (43.7%) | 40 (56.3%) |
Health Insurance Coverage by Household Income in Island Pond
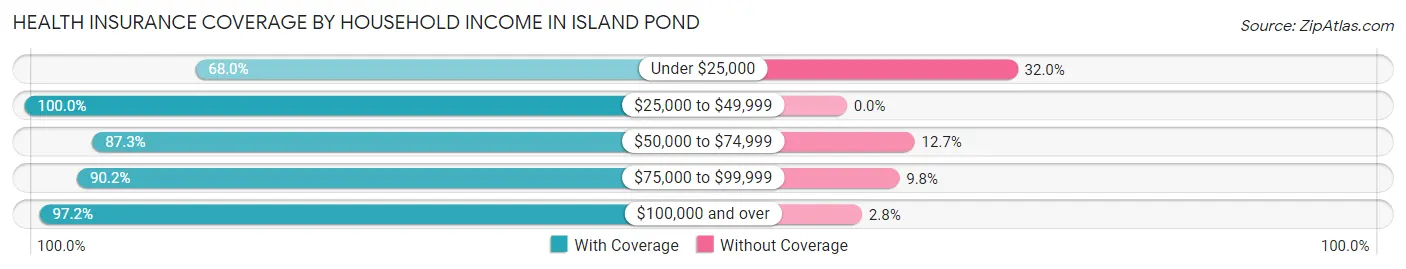
| Household Income | With Coverage | Without Coverage |
| Under $25,000 | 85 (68.0%) | 40 (32.0%) |
| $25,000 to $49,999 | 229 (100.0%) | 0 (0.0%) |
| $50,000 to $74,999 | 103 (87.3%) | 15 (12.7%) |
| $75,000 to $99,999 | 156 (90.2%) | 17 (9.8%) |
| $100,000 and over | 103 (97.2%) | 3 (2.8%) |
Public vs Private Health Insurance Coverage by Age in Island Pond
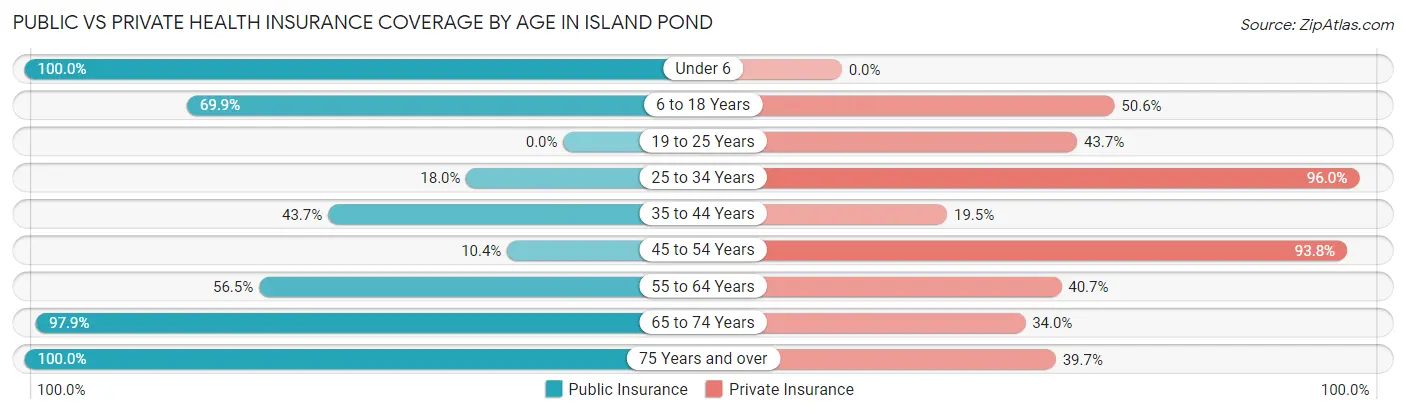
| Age Bracket | Public Insurance | Private Insurance |
| Under 6 | 34 (100.0%) | 0 (0.0%) |
| 6 to 18 Years | 58 (69.9%) | 42 (50.6%) |
| 19 to 25 Years | 0 (0.0%) | 31 (43.7%) |
| 25 to 34 Years | 9 (18.0%) | 48 (96.0%) |
| 35 to 44 Years | 38 (43.7%) | 17 (19.5%) |
| 45 to 54 Years | 10 (10.4%) | 90 (93.8%) |
| 55 to 64 Years | 61 (56.5%) | 44 (40.7%) |
| 65 to 74 Years | 92 (97.9%) | 32 (34.0%) |
| 75 Years and over | 136 (100.0%) | 54 (39.7%) |
| Total | 438 (57.7%) | 358 (47.2%) |
Disability Status by Sex by Age in Island Pond
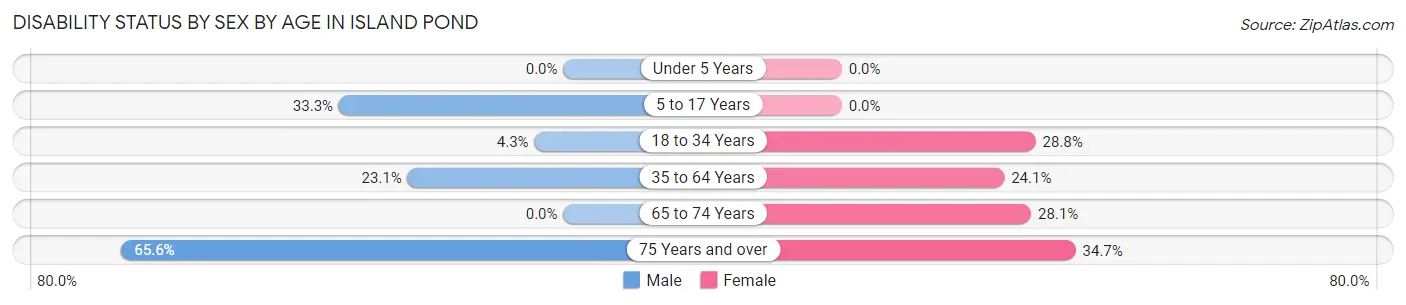
| Age Bracket | Male | Female |
| Under 5 Years | 0 (0.0%) | 0 (0.0%) |
| 5 to 17 Years | 17 (33.3%) | 0 (0.0%) |
| 18 to 34 Years | 3 (4.3%) | 21 (28.8%) |
| 35 to 64 Years | 28 (23.1%) | 41 (24.1%) |
| 65 to 74 Years | 0 (0.0%) | 18 (28.1%) |
| 75 Years and over | 42 (65.6%) | 25 (34.7%) |
Disability Class by Sex by Age in Island Pond
Disability Class: Hearing Difficulty
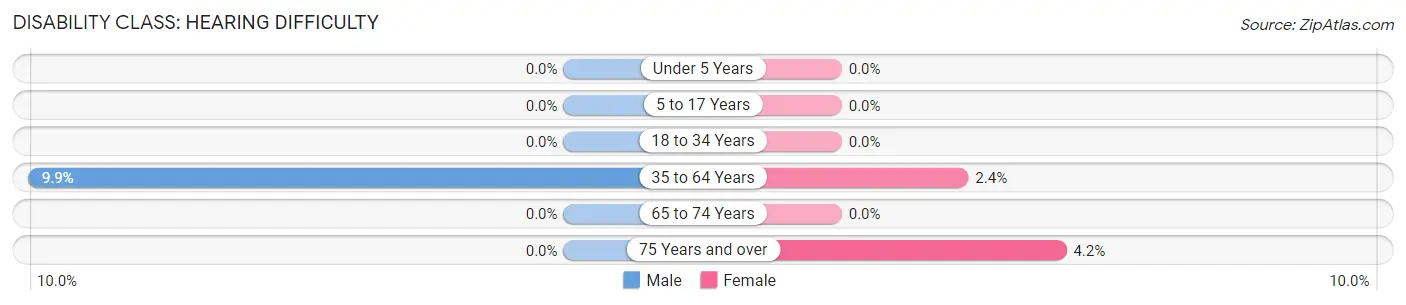
| Age Bracket | Male | Female |
| Under 5 Years | 0 (0.0%) | 0 (0.0%) |
| 5 to 17 Years | 0 (0.0%) | 0 (0.0%) |
| 18 to 34 Years | 0 (0.0%) | 0 (0.0%) |
| 35 to 64 Years | 12 (9.9%) | 4 (2.4%) |
| 65 to 74 Years | 0 (0.0%) | 0 (0.0%) |
| 75 Years and over | 0 (0.0%) | 3 (4.2%) |
Disability Class: Vision Difficulty
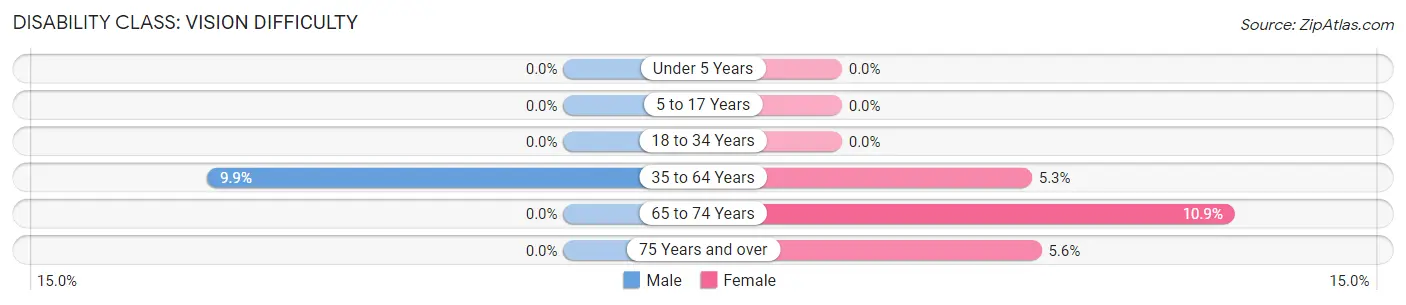
| Age Bracket | Male | Female |
| Under 5 Years | 0 (0.0%) | 0 (0.0%) |
| 5 to 17 Years | 0 (0.0%) | 0 (0.0%) |
| 18 to 34 Years | 0 (0.0%) | 0 (0.0%) |
| 35 to 64 Years | 12 (9.9%) | 9 (5.3%) |
| 65 to 74 Years | 0 (0.0%) | 7 (10.9%) |
| 75 Years and over | 0 (0.0%) | 4 (5.6%) |
Disability Class: Cognitive Difficulty
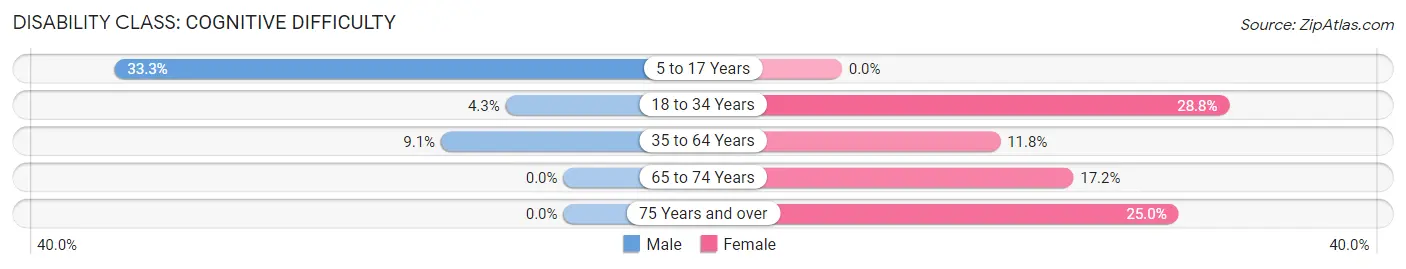
| Age Bracket | Male | Female |
| 5 to 17 Years | 17 (33.3%) | 0 (0.0%) |
| 18 to 34 Years | 3 (4.3%) | 21 (28.8%) |
| 35 to 64 Years | 11 (9.1%) | 20 (11.8%) |
| 65 to 74 Years | 0 (0.0%) | 11 (17.2%) |
| 75 Years and over | 0 (0.0%) | 18 (25.0%) |
Disability Class: Ambulatory Difficulty
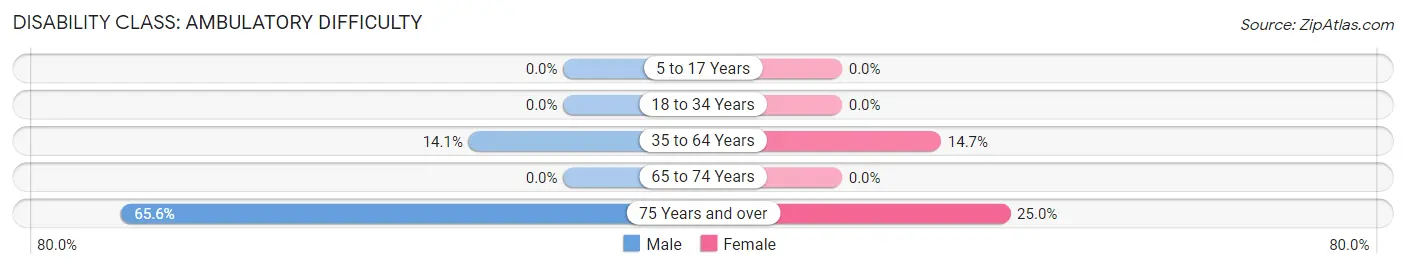
| Age Bracket | Male | Female |
| 5 to 17 Years | 0 (0.0%) | 0 (0.0%) |
| 18 to 34 Years | 0 (0.0%) | 0 (0.0%) |
| 35 to 64 Years | 17 (14.1%) | 25 (14.7%) |
| 65 to 74 Years | 0 (0.0%) | 0 (0.0%) |
| 75 Years and over | 42 (65.6%) | 18 (25.0%) |
Disability Class: Self-Care Difficulty
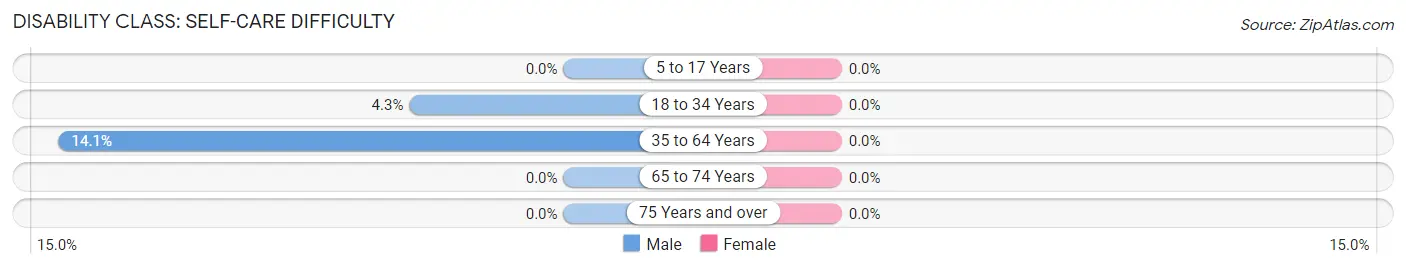
| Age Bracket | Male | Female |
| 5 to 17 Years | 0 (0.0%) | 0 (0.0%) |
| 18 to 34 Years | 3 (4.3%) | 0 (0.0%) |
| 35 to 64 Years | 17 (14.1%) | 0 (0.0%) |
| 65 to 74 Years | 0 (0.0%) | 0 (0.0%) |
| 75 Years and over | 0 (0.0%) | 0 (0.0%) |
Technology Access in Island Pond
Computing Device Access in Island Pond
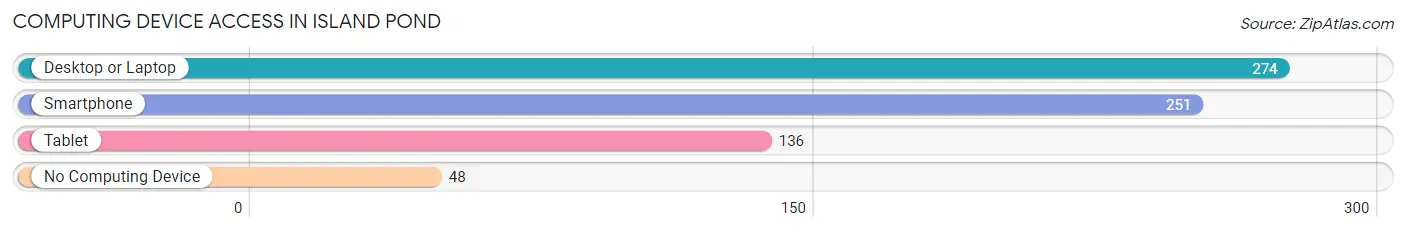
| Device Type | # Households | % Households |
| Desktop or Laptop | 274 | 73.3% |
| Smartphone | 251 | 67.1% |
| Tablet | 136 | 36.4% |
| No Computing Device | 48 | 12.8% |
| Total | 374 | 100.0% |
Internet Access in Island Pond
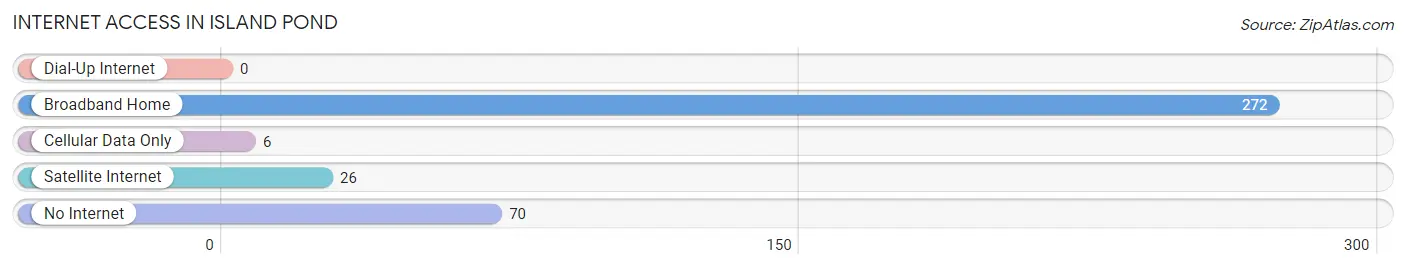
| Internet Type | # Households | % Households |
| Dial-Up Internet | 0 | 0.0% |
| Broadband Home | 272 | 72.7% |
| Cellular Data Only | 6 | 1.6% |
| Satellite Internet | 26 | 7.0% |
| No Internet | 70 | 18.7% |
| Total | 374 | 100.0% |
Island Pond Summary
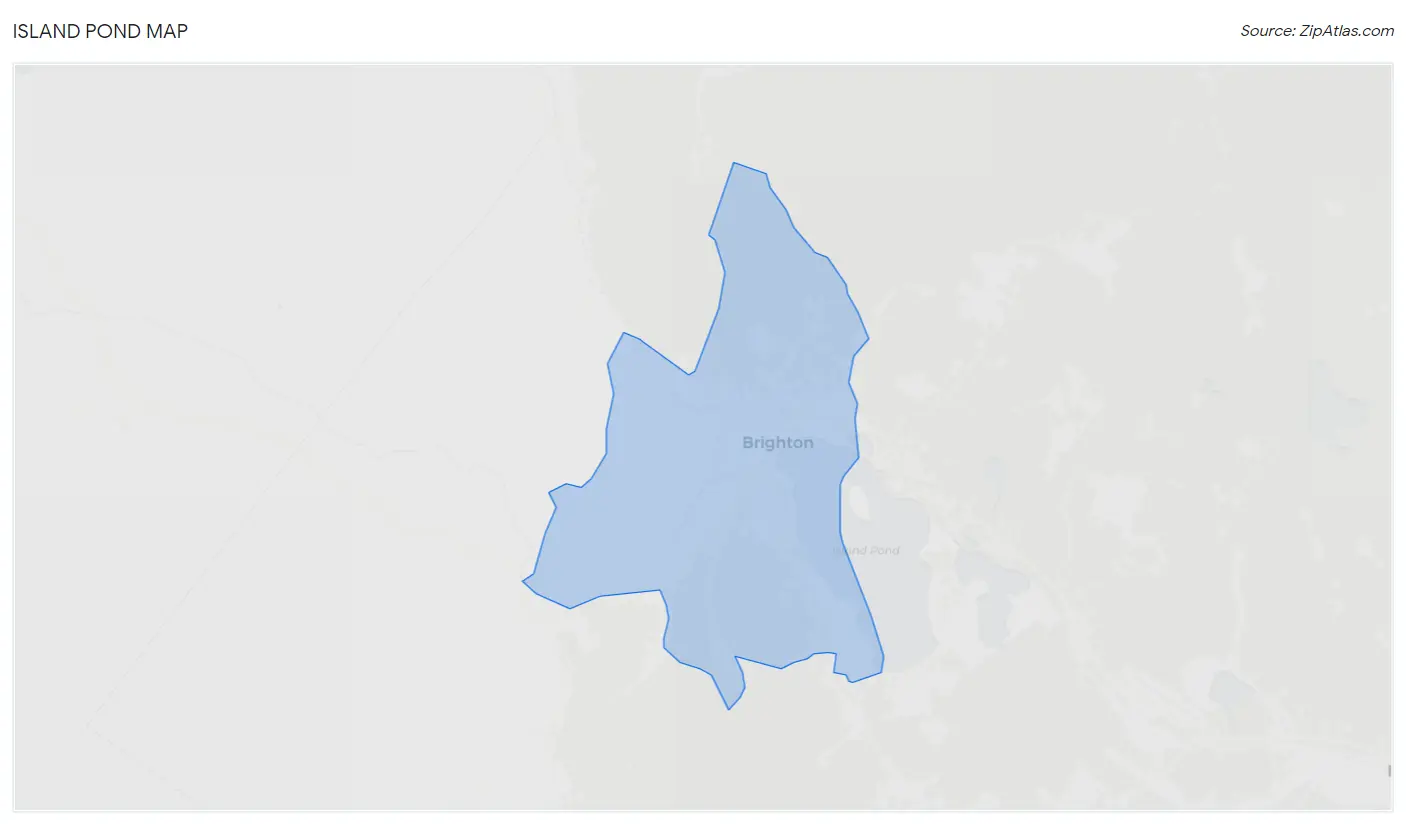
Island Pond is a small town located in the northeastern corner of Vermont, in the United States. It is situated in the town of Brighton, in Essex County, and is bordered by the towns of Ferdinand, Bloomfield, and Norton. The town has a population of approximately 1,000 people, and is located in the heart of the Northeast Kingdom, a region of Vermont known for its rural beauty and outdoor recreation opportunities.
Geography
Island Pond is located in the northeastern corner of Vermont, in the town of Brighton. It is bordered by the towns of Ferdinand, Bloomfield, and Norton. The town is situated in the heart of the Northeast Kingdom, a region of Vermont known for its rural beauty and outdoor recreation opportunities. The town is located in the Connecticut River Valley, and is surrounded by the Green Mountains to the west and the White Mountains to the east. The town is situated at an elevation of 1,000 feet, and is located approximately 30 miles from the Canadian border.
The town is home to Island Pond, a small lake located in the center of town. The lake is a popular destination for fishing, swimming, and boating. The lake is fed by the Clyde River, which flows through the town and empties into the Connecticut River. The town is also home to several small streams, including the Clyde, the Island, and the Norton.
Economy
The economy of Island Pond is largely based on tourism and outdoor recreation. The town is home to several small businesses, including restaurants, lodging, and retail stores. The town is also home to several small farms, which produce a variety of products, including dairy, beef, and maple syrup. The town is also home to several logging operations, which provide timber for the local lumber industry.
The town is also home to several small manufacturing companies, which produce a variety of products, including furniture, clothing, and paper products. The town is also home to several small businesses, which provide services, such as auto repair, plumbing, and electrical work.
Demographics
As of the 2010 census, the population of Island Pond was 1,000 people. The town is predominantly white, with approximately 95% of the population identifying as white. The town is also home to a small Hispanic population, with approximately 4% of the population identifying as Hispanic or Latino. The town is also home to a small African American population, with approximately 1% of the population identifying as African American.
The median household income in Island Pond is approximately $41,000, and the median home value is approximately $125,000. The town is home to a large number of retirees, with approximately 25% of the population over the age of 65. The town is also home to a large number of families, with approximately 40% of the population under the age of 18.
Conclusion
Island Pond is a small town located in the northeastern corner of Vermont, in the United States. It is situated in the town of Brighton, in Essex County, and is bordered by the towns of Ferdinand, Bloomfield, and Norton. The town has a population of approximately 1,000 people, and is located in the heart of the Northeast Kingdom, a region of Vermont known for its rural beauty and outdoor recreation opportunities. The economy of Island Pond is largely based on tourism and outdoor recreation, and the town is home to several small businesses, farms, and manufacturing companies. The town is predominantly white, with a small Hispanic and African American population. The median household income in Island Pond is approximately $41,000, and the median home value is approximately $125,000.
Common Questions
What is Per Capita Income in Island Pond?
Per Capita income in Island Pond is $37,118.
What is the Median Family Income in Island Pond?
Median Family Income in Island Pond is $60,781.
What is the Median Household income in Island Pond?
Median Household Income in Island Pond is $44,559.
What is Income or Wage Gap in Island Pond?
Income or Wage Gap in Island Pond is 4.5%.
Women in Island Pond earn 95.5 cents for every dollar earned by a man.
What is Inequality or Gini Index in Island Pond?
Inequality or Gini Index in Island Pond is 0.53.
What is the Total Population of Island Pond?
Total Population of Island Pond is 759.
What is the Total Male Population of Island Pond?
Total Male Population of Island Pond is 340.
What is the Total Female Population of Island Pond?
Total Female Population of Island Pond is 419.
What is the Ratio of Males per 100 Females in Island Pond?
There are 81.15 Males per 100 Females in Island Pond.
What is the Ratio of Females per 100 Males in Island Pond?
There are 123.24 Females per 100 Males in Island Pond.
What is the Median Population Age in Island Pond?
Median Population Age in Island Pond is 52.0 Years.
What is the Average Family Size in Island Pond
Average Family Size in Island Pond is 2.7 People.
What is the Average Household Size in Island Pond
Average Household Size in Island Pond is 2.0 People.
How Large is the Labor Force in Island Pond?
There are 316 People in the Labor Forcein in Island Pond.
What is the Percentage of People in the Labor Force in Island Pond?
47.6% of People are in the Labor Force in Island Pond.