Richmond, VT Map & Demographics
Richmond Map
Richmond Overview
$50,444
PER CAPITA INCOME
$119,545
AVG FAMILY INCOME
$59,960
AVG HOUSEHOLD INCOME
35.7%
WAGE / INCOME GAP [ % ]
64.3¢/ $1
WAGE / INCOME GAP [ $ ]
0.36
INEQUALITY / GINI INDEX
689
TOTAL POPULATION
335
MALE POPULATION
354
FEMALE POPULATION
94.63
MALES / 100 FEMALES
105.67
FEMALES / 100 MALES
35.8
MEDIAN AGE
2.6
AVG FAMILY SIZE
2.1
AVG HOUSEHOLD SIZE
462
LABOR FORCE [ PEOPLE ]
84.9%
PERCENT IN LABOR FORCE
Richmond Zip Codes
Richmond Area Codes
Income in Richmond
Income Overview in Richmond
Per Capita Income in Richmond is $50,444, while median incomes of families and households are $119,545 and $59,960 respectively.
| Characteristic | Number | Measure |
| Per Capita Income | 689 | $50,444 |
| Median Family Income | 172 | $119,545 |
| Mean Family Income | 172 | $115,990 |
| Median Household Income | 330 | $59,960 |
| Mean Household Income | 330 | $91,292 |
| Income Deficit | 172 | $0 |
| Wage / Income Gap (%) | 689 | 35.70% |
| Wage / Income Gap ($) | 689 | 64.30¢ per $1 |
| Gini / Inequality Index | 689 | 0.36 |
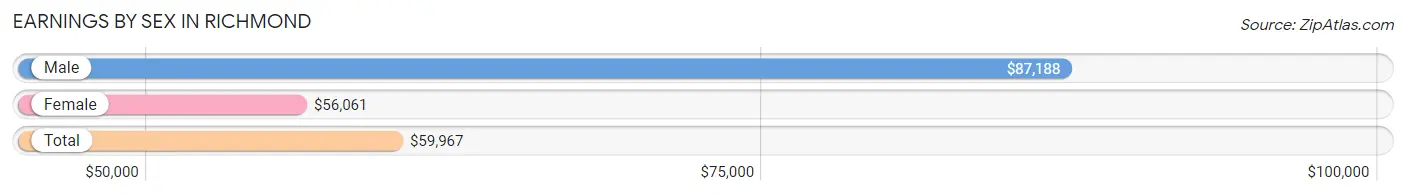
Earnings by Sex in Richmond
Average Earnings in Richmond are $59,967, $87,188 for men and $56,061 for women, a difference of 35.7%.
| Sex | Number | Average Earnings |
| Male | 197 (40.3%) | $87,188 |
| Female | 292 (59.7%) | $56,061 |
| Total | 489 (100.0%) | $59,967 |
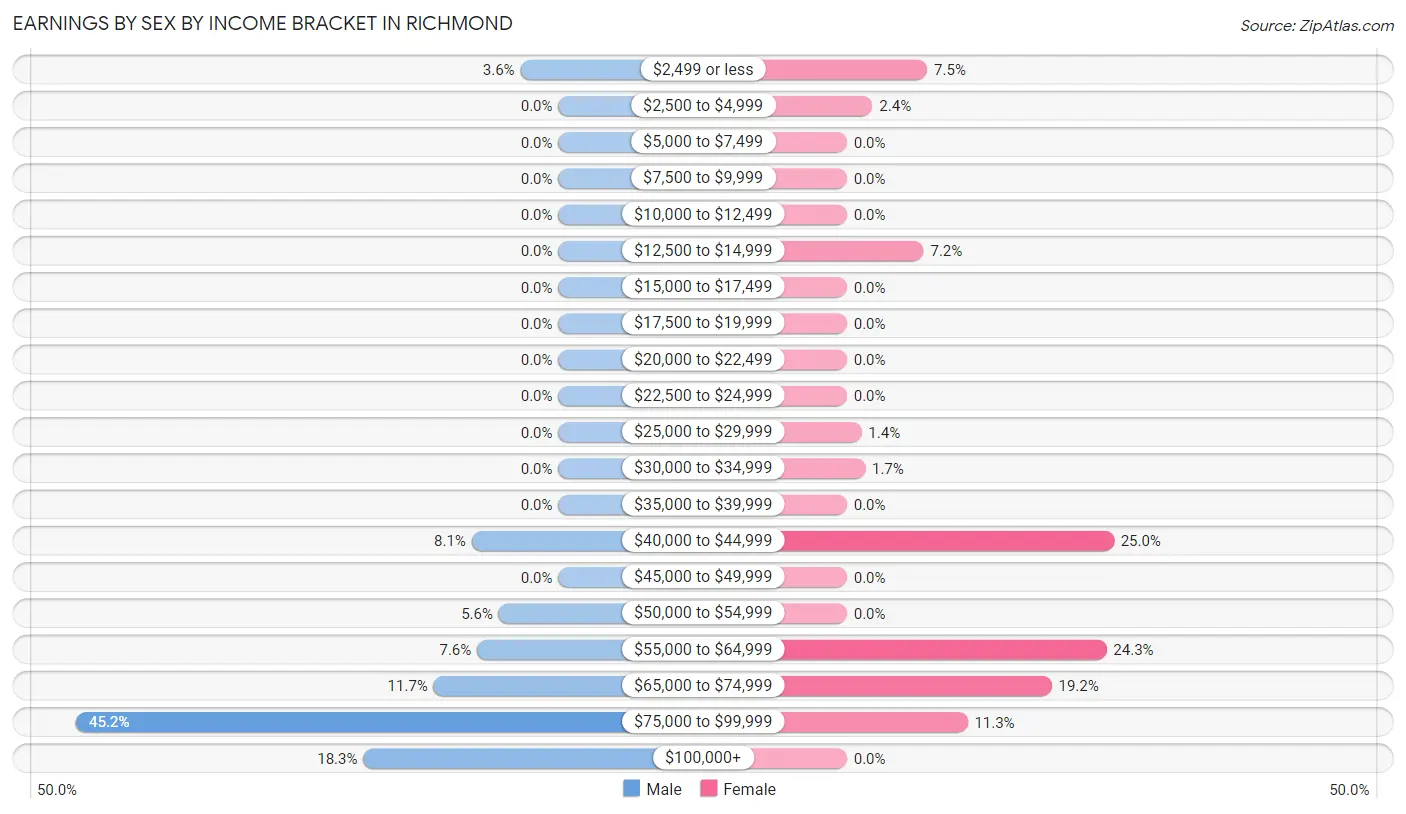
Earnings by Sex by Income Bracket in Richmond
The most common earnings brackets in Richmond are $75,000 to $99,999 for men (89 | 45.2%) and $40,000 to $44,999 for women (73 | 25.0%).
| Income | Male | Female |
| $2,499 or less | 7 (3.5%) | 22 (7.5%) |
| $2,500 to $4,999 | 0 (0.0%) | 7 (2.4%) |
| $5,000 to $7,499 | 0 (0.0%) | 0 (0.0%) |
| $7,500 to $9,999 | 0 (0.0%) | 0 (0.0%) |
| $10,000 to $12,499 | 0 (0.0%) | 0 (0.0%) |
| $12,500 to $14,999 | 0 (0.0%) | 21 (7.2%) |
| $15,000 to $17,499 | 0 (0.0%) | 0 (0.0%) |
| $17,500 to $19,999 | 0 (0.0%) | 0 (0.0%) |
| $20,000 to $22,499 | 0 (0.0%) | 0 (0.0%) |
| $22,500 to $24,999 | 0 (0.0%) | 0 (0.0%) |
| $25,000 to $29,999 | 0 (0.0%) | 4 (1.4%) |
| $30,000 to $34,999 | 0 (0.0%) | 5 (1.7%) |
| $35,000 to $39,999 | 0 (0.0%) | 0 (0.0%) |
| $40,000 to $44,999 | 16 (8.1%) | 73 (25.0%) |
| $45,000 to $49,999 | 0 (0.0%) | 0 (0.0%) |
| $50,000 to $54,999 | 11 (5.6%) | 0 (0.0%) |
| $55,000 to $64,999 | 15 (7.6%) | 71 (24.3%) |
| $65,000 to $74,999 | 23 (11.7%) | 56 (19.2%) |
| $75,000 to $99,999 | 89 (45.2%) | 33 (11.3%) |
| $100,000+ | 36 (18.3%) | 0 (0.0%) |
| Total | 197 (100.0%) | 292 (100.0%) |
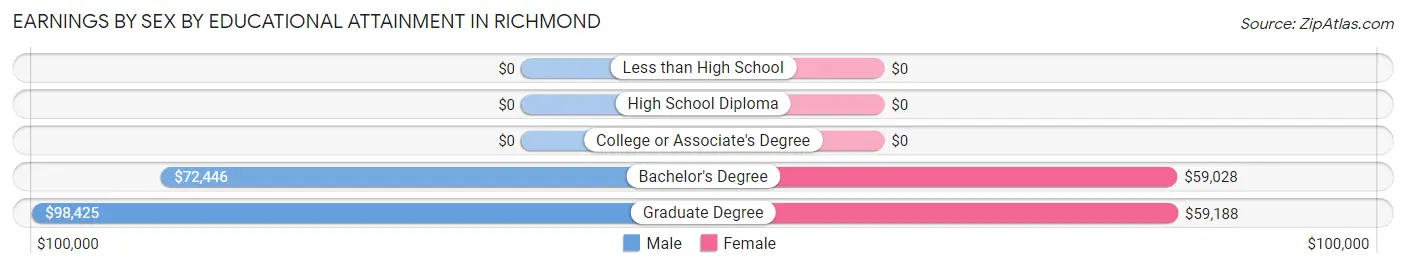
Earnings by Sex by Educational Attainment in Richmond
Average earnings in Richmond are $90,625 for men and $56,591 for women, a difference of 37.6%. Men with an educational attainment of graduate degree enjoy the highest average annual earnings of $98,425, while those with bachelor's degree education earn the least with $72,446. Women with an educational attainment of graduate degree earn the most with the average annual earnings of $59,188, while those with bachelor's degree education have the smallest earnings of $59,028.
| Educational Attainment | Male Income | Female Income |
| Less than High School | - | - |
| High School Diploma | - | - |
| College or Associate's Degree | - | - |
| Bachelor's Degree | $72,446 | $59,028 |
| Graduate Degree | $98,425 | $59,188 |
| Total | $90,625 | $56,591 |
Family Income in Richmond
Family Income Brackets in Richmond
According to the Richmond family income data, there are 88 families falling into the $100,000 to $149,999 income range, which is the most common income bracket and makes up 51.2% of all families.
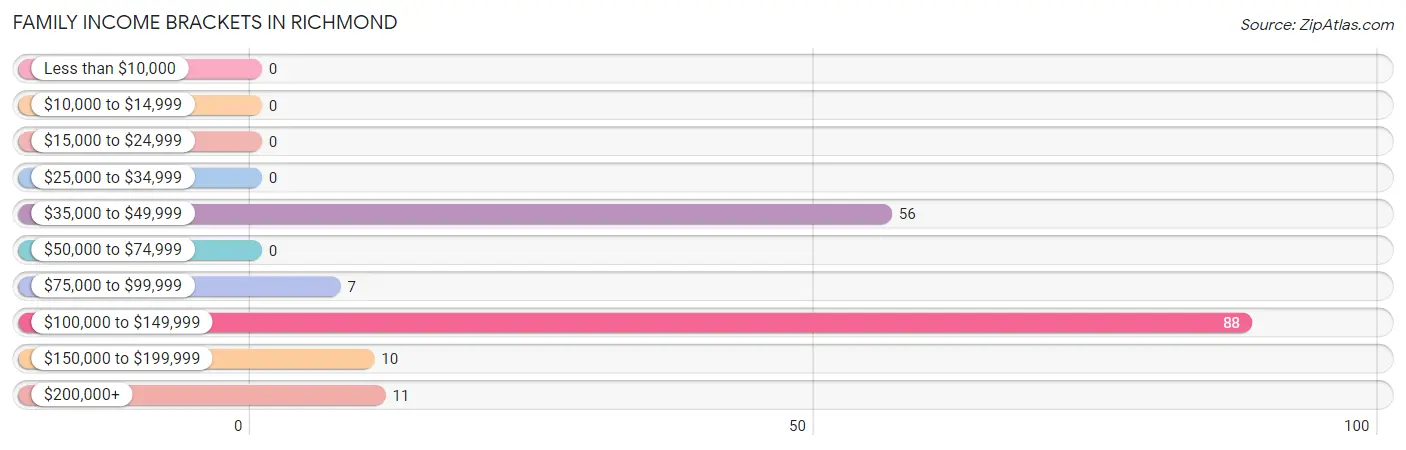
| Income Bracket | # Families | % Families |
| Less than $10,000 | 0 | 0.0% |
| $10,000 to $14,999 | 0 | 0.0% |
| $15,000 to $24,999 | 0 | 0.0% |
| $25,000 to $34,999 | 0 | 0.0% |
| $35,000 to $49,999 | 56 | 32.6% |
| $50,000 to $74,999 | 0 | 0.0% |
| $75,000 to $99,999 | 7 | 4.1% |
| $100,000 to $149,999 | 88 | 51.2% |
| $150,000 to $199,999 | 10 | 5.8% |
| $200,000+ | 11 | 6.4% |
Family Income by Famaliy Size in Richmond
4-person families (38 | 22.1%) account for the highest median family income in Richmond with $190,500 per family, while 4-person families (38 | 22.1%) have the highest median income of $47,625 per family member.
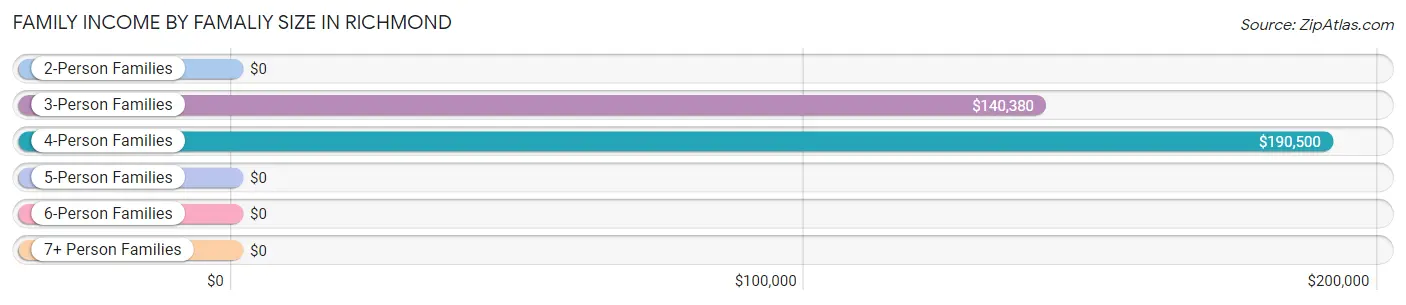
| Income Bracket | # Families | Median Income |
| 2-Person Families | 95 (55.2%) | $0 |
| 3-Person Families | 39 (22.7%) | $140,380 |
| 4-Person Families | 38 (22.1%) | $190,500 |
| 5-Person Families | 0 (0.0%) | $0 |
| 6-Person Families | 0 (0.0%) | $0 |
| 7+ Person Families | 0 (0.0%) | $0 |
| Total | 172 (100.0%) | $119,545 |
Family Income by Number of Earners in Richmond
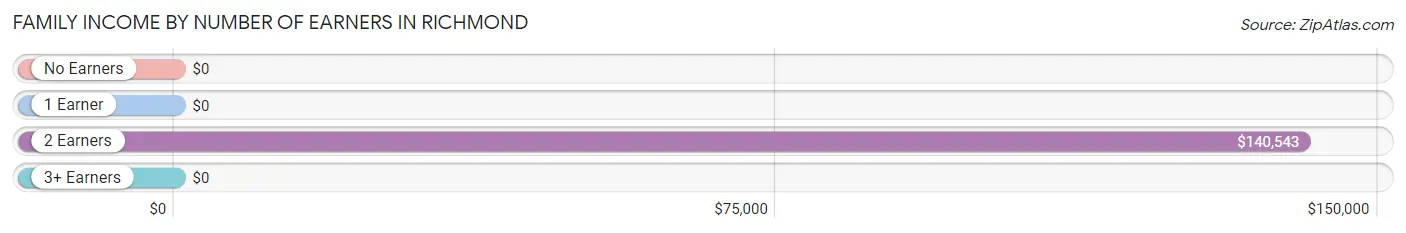
| Number of Earners | # Families | Median Income |
| No Earners | 0 (0.0%) | $0 |
| 1 Earner | 87 (50.6%) | $0 |
| 2 Earners | 78 (45.4%) | $140,543 |
| 3+ Earners | 7 (4.1%) | $0 |
| Total | 172 (100.0%) | $119,545 |
Household Income in Richmond
Household Income Brackets in Richmond
With 102 households falling in the category, the $100,000 to $149,999 income range is the most frequent in Richmond, accounting for 30.9% of all households.
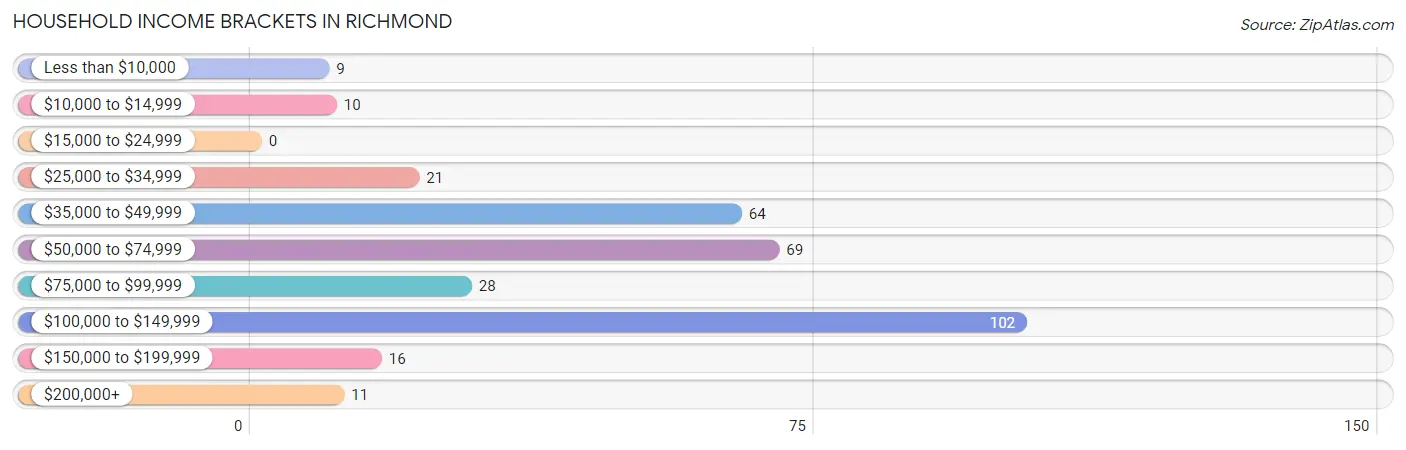
| Income Bracket | # Households | % Households |
| Less than $10,000 | 9 | 2.7% |
| $10,000 to $14,999 | 10 | 3.0% |
| $15,000 to $24,999 | 0 | 0.0% |
| $25,000 to $34,999 | 21 | 6.4% |
| $35,000 to $49,999 | 64 | 19.4% |
| $50,000 to $74,999 | 69 | 20.9% |
| $75,000 to $99,999 | 28 | 8.5% |
| $100,000 to $149,999 | 102 | 30.9% |
| $150,000 to $199,999 | 16 | 4.8% |
| $200,000+ | 11 | 3.3% |
Household Income by Householder Age in Richmond
The median household income in Richmond is $59,960, with the highest median household income of $118,026 found in the 25 to 44 years age bracket for the primary householder. A total of 124 households (37.6%) fall into this category.
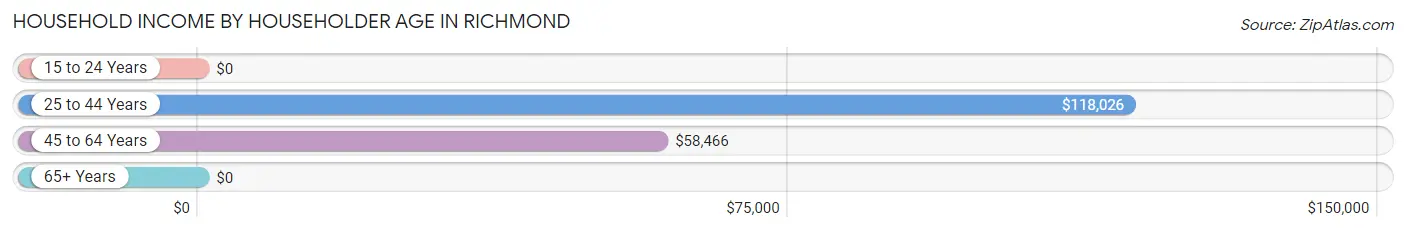
| Income Bracket | # Households | Median Income |
| 15 to 24 Years | 0 (0.0%) | $0 |
| 25 to 44 Years | 124 (37.6%) | $118,026 |
| 45 to 64 Years | 132 (40.0%) | $58,466 |
| 65+ Years | 74 (22.4%) | $0 |
| Total | 330 (100.0%) | $59,960 |
Poverty in Richmond
Income Below Poverty by Sex and Age in Richmond
With 3.9% poverty level for males and 5.4% for females among the residents of Richmond, 16 and 17 year old males and 75 year old and over females are the most vulnerable to poverty, with 7 males (100.0%) and 10 females (100.0%) in their respective age groups living below the poverty level.
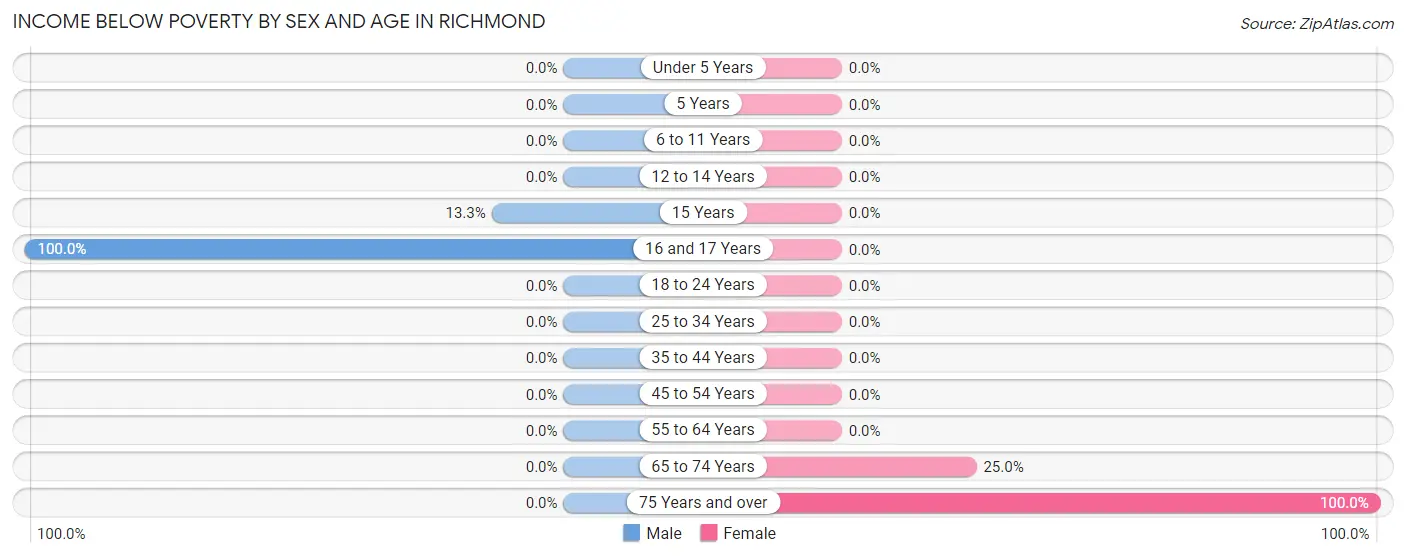
| Age Bracket | Male | Female |
| Under 5 Years | 0 (0.0%) | 0 (0.0%) |
| 5 Years | 0 (0.0%) | 0 (0.0%) |
| 6 to 11 Years | 0 (0.0%) | 0 (0.0%) |
| 12 to 14 Years | 0 (0.0%) | 0 (0.0%) |
| 15 Years | 6 (13.3%) | 0 (0.0%) |
| 16 and 17 Years | 7 (100.0%) | 0 (0.0%) |
| 18 to 24 Years | 0 (0.0%) | 0 (0.0%) |
| 25 to 34 Years | 0 (0.0%) | 0 (0.0%) |
| 35 to 44 Years | 0 (0.0%) | 0 (0.0%) |
| 45 to 54 Years | 0 (0.0%) | 0 (0.0%) |
| 55 to 64 Years | 0 (0.0%) | 0 (0.0%) |
| 65 to 74 Years | 0 (0.0%) | 9 (25.0%) |
| 75 Years and over | 0 (0.0%) | 10 (100.0%) |
| Total | 13 (3.9%) | 19 (5.4%) |
Income Above Poverty by Sex and Age in Richmond
According to the poverty statistics in Richmond, males aged under 5 years and females aged 5 years are the age groups that are most secure financially, with 100.0% of males and 100.0% of females in these age groups living above the poverty line.
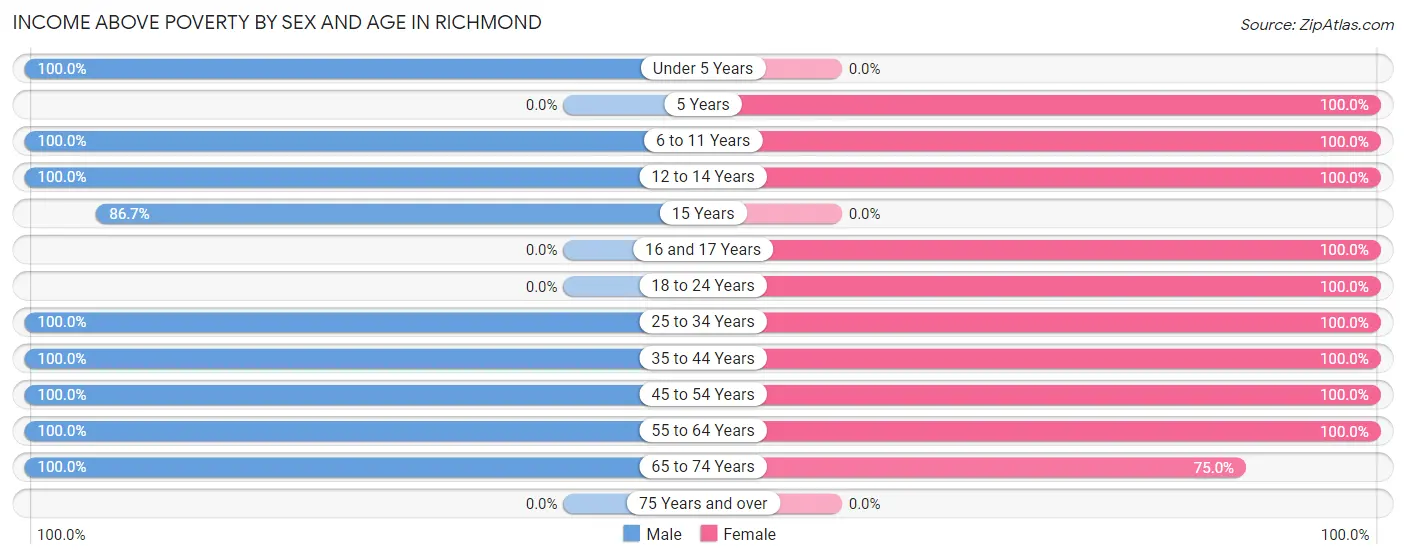
| Age Bracket | Male | Female |
| Under 5 Years | 33 (100.0%) | 0 (0.0%) |
| 5 Years | 0 (0.0%) | 7 (100.0%) |
| 6 to 11 Years | 28 (100.0%) | 21 (100.0%) |
| 12 to 14 Years | 9 (100.0%) | 2 (100.0%) |
| 15 Years | 39 (86.7%) | 0 (0.0%) |
| 16 and 17 Years | 0 (0.0%) | 12 (100.0%) |
| 18 to 24 Years | 0 (0.0%) | 7 (100.0%) |
| 25 to 34 Years | 94 (100.0%) | 48 (100.0%) |
| 35 to 44 Years | 49 (100.0%) | 71 (100.0%) |
| 45 to 54 Years | 35 (100.0%) | 73 (100.0%) |
| 55 to 64 Years | 7 (100.0%) | 67 (100.0%) |
| 65 to 74 Years | 28 (100.0%) | 27 (75.0%) |
| 75 Years and over | 0 (0.0%) | 0 (0.0%) |
| Total | 322 (96.1%) | 335 (94.6%) |
Income Below Poverty Among Married-Couple Families in Richmond

| Children | Above Poverty | Below Poverty |
| No Children | 34 (100.0%) | 0 (0.0%) |
| 1 or 2 Children | 77 (100.0%) | 0 (0.0%) |
| 3 or 4 Children | 0 (0.0%) | 0 (0.0%) |
| 5 or more Children | 0 (0.0%) | 0 (0.0%) |
| Total | 111 (100.0%) | 0 (0.0%) |
Income Below Poverty Among Single-Parent Households in Richmond
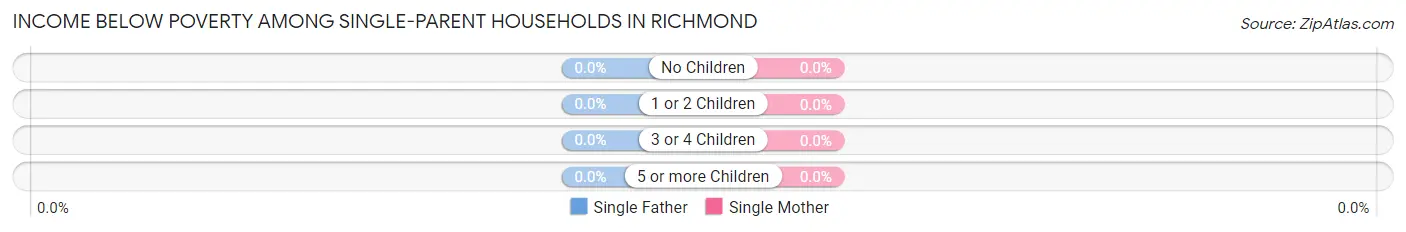
| Children | Single Father | Single Mother |
| No Children | 0 (0.0%) | 0 (0.0%) |
| 1 or 2 Children | 0 (0.0%) | 0 (0.0%) |
| 3 or 4 Children | 0 (0.0%) | 0 (0.0%) |
| 5 or more Children | 0 (0.0%) | 0 (0.0%) |
| Total | 0 (0.0%) | 0 (0.0%) |
Income Below Poverty Among Married-Couple vs Single-Parent Households in Richmond
| Children | Married-Couple Families | Single-Parent Households |
| No Children | 0 (0.0%) | 0 (0.0%) |
| 1 or 2 Children | 0 (0.0%) | 0 (0.0%) |
| 3 or 4 Children | 0 (0.0%) | 0 (0.0%) |
| 5 or more Children | 0 (0.0%) | 0 (0.0%) |
| Total | 0 (0.0%) | 0 (0.0%) |
Race in Richmond
The most populous races in Richmond are White / Caucasian (633 | 91.9%), Asian (50 | 7.3%), and Hispanic or Latino (7 | 1.0%).
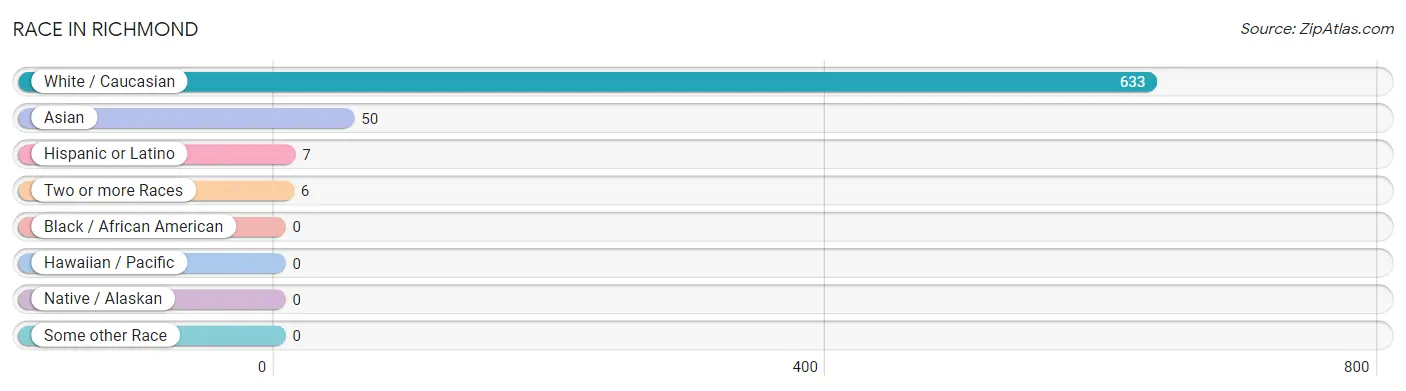
| Race | # Population | % Population |
| Asian | 50 | 7.3% |
| Black / African American | 0 | 0.0% |
| Hawaiian / Pacific | 0 | 0.0% |
| Hispanic or Latino | 7 | 1.0% |
| Native / Alaskan | 0 | 0.0% |
| White / Caucasian | 633 | 91.9% |
| Two or more Races | 6 | 0.9% |
| Some other Race | 0 | 0.0% |
| Total | 689 | 100.0% |
Ancestry in Richmond
The most populous ancestries reported in Richmond are Irish (207 | 30.0%), English (169 | 24.5%), German (131 | 19.0%), French (94 | 13.6%), and French Canadian (83 | 12.0%), together accounting for 99.3% of all Richmond residents.
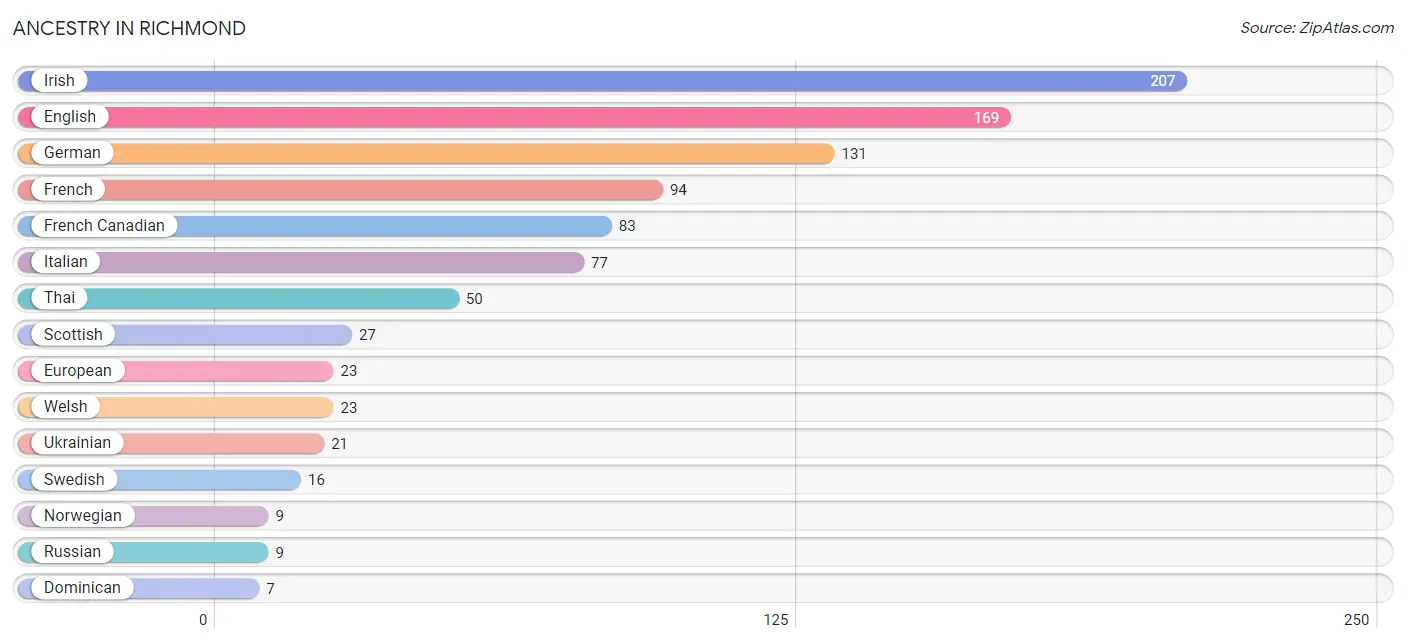
| Ancestry | # Population | % Population |
| American | 6 | 0.9% |
| Dominican | 7 | 1.0% |
| English | 169 | 24.5% |
| European | 23 | 3.3% |
| French | 94 | 13.6% |
| French Canadian | 83 | 12.0% |
| German | 131 | 19.0% |
| Irish | 207 | 30.0% |
| Italian | 77 | 11.2% |
| Norwegian | 9 | 1.3% |
| Russian | 9 | 1.3% |
| Scottish | 27 | 3.9% |
| Swedish | 16 | 2.3% |
| Thai | 50 | 7.3% |
| Ukrainian | 21 | 3.0% |
| Welsh | 23 | 3.3% | View All 16 Rows |
Immigrants in Richmond
The most numerous immigrant groups reported in Richmond came from Asia (50 | 7.3%), India (50 | 7.3%), and South Central Asia (50 | 7.3%), together accounting for 21.8% of all Richmond residents.
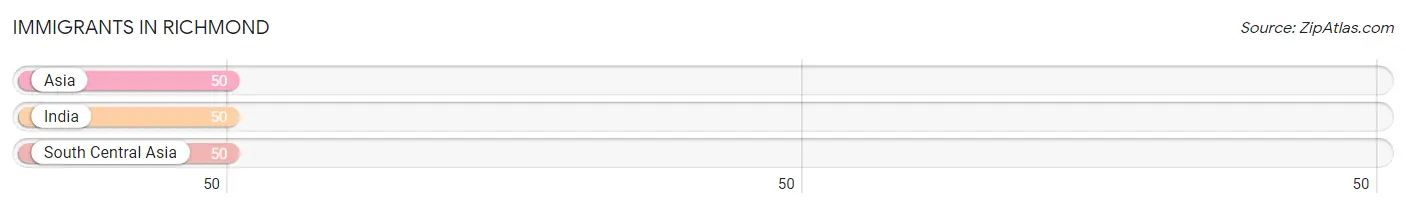
| Immigration Origin | # Population | % Population |
| Asia | 50 | 7.3% |
| India | 50 | 7.3% |
| South Central Asia | 50 | 7.3% | View All 3 Rows |
Sex and Age in Richmond
Sex and Age in Richmond
The most populous age groups in Richmond are 30 to 34 Years (84 | 25.1%) for men and 45 to 49 Years (64 | 18.1%) for women.
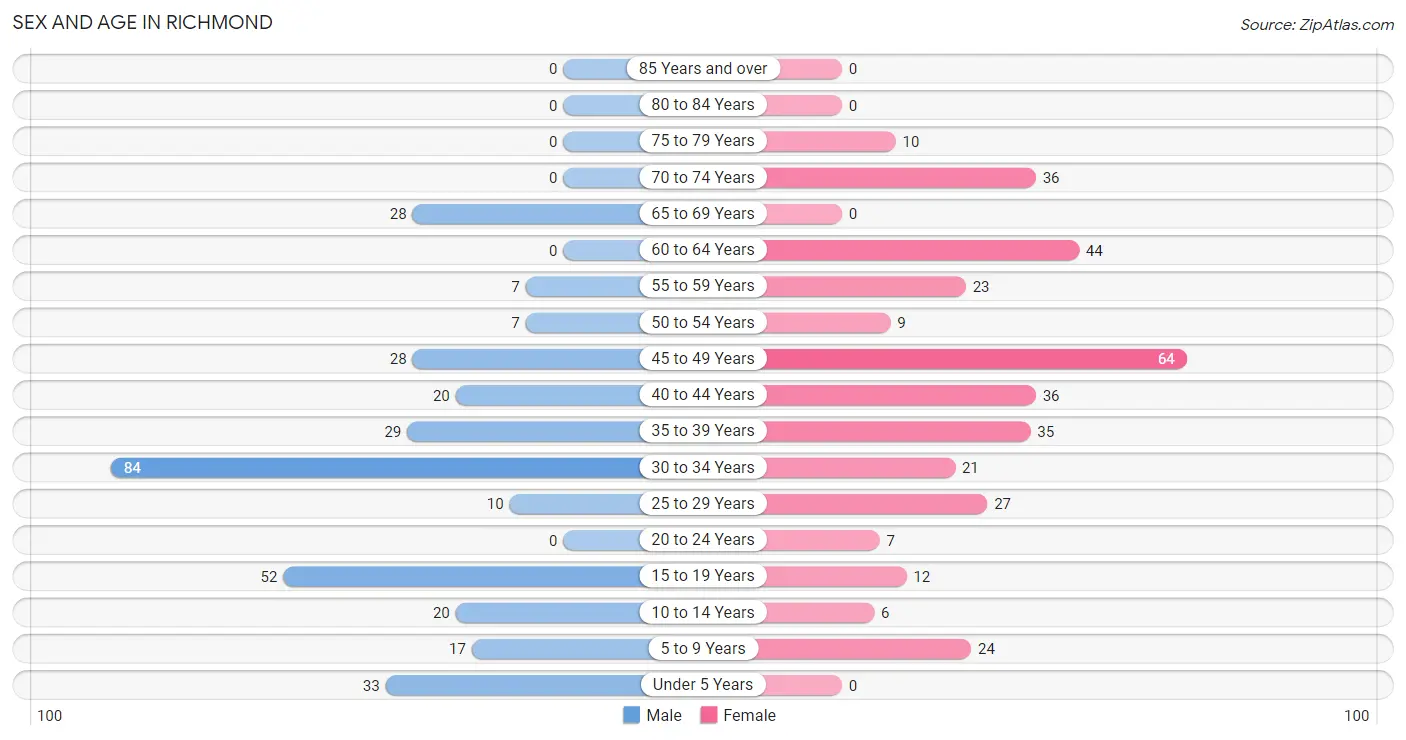
| Age Bracket | Male | Female |
| Under 5 Years | 33 (9.9%) | 0 (0.0%) |
| 5 to 9 Years | 17 (5.1%) | 24 (6.8%) |
| 10 to 14 Years | 20 (6.0%) | 6 (1.7%) |
| 15 to 19 Years | 52 (15.5%) | 12 (3.4%) |
| 20 to 24 Years | 0 (0.0%) | 7 (2.0%) |
| 25 to 29 Years | 10 (3.0%) | 27 (7.6%) |
| 30 to 34 Years | 84 (25.1%) | 21 (5.9%) |
| 35 to 39 Years | 29 (8.7%) | 35 (9.9%) |
| 40 to 44 Years | 20 (6.0%) | 36 (10.2%) |
| 45 to 49 Years | 28 (8.4%) | 64 (18.1%) |
| 50 to 54 Years | 7 (2.1%) | 9 (2.5%) |
| 55 to 59 Years | 7 (2.1%) | 23 (6.5%) |
| 60 to 64 Years | 0 (0.0%) | 44 (12.4%) |
| 65 to 69 Years | 28 (8.4%) | 0 (0.0%) |
| 70 to 74 Years | 0 (0.0%) | 36 (10.2%) |
| 75 to 79 Years | 0 (0.0%) | 10 (2.8%) |
| 80 to 84 Years | 0 (0.0%) | 0 (0.0%) |
| 85 Years and over | 0 (0.0%) | 0 (0.0%) |
| Total | 335 (100.0%) | 354 (100.0%) |
Families and Households in Richmond
Median Family Size in Richmond
The median family size in Richmond is 2.60 persons per family, with married-couple families (111 | 64.5%) accounting for the largest median family size of 3.05 persons per family. On the other hand, single female/mother families (56 | 32.6%) represent the smallest median family size with 1.73 persons per family.
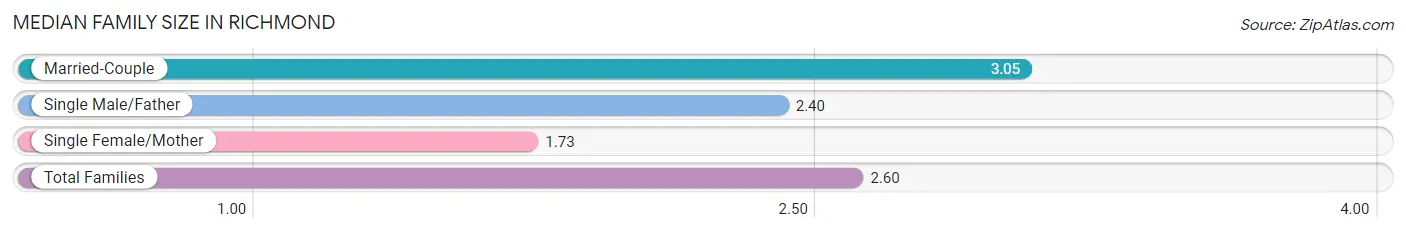
| Family Type | # Families | Family Size |
| Married-Couple | 111 (64.5%) | 3.05 |
| Single Male/Father | 5 (2.9%) | 2.40 |
| Single Female/Mother | 56 (32.6%) | 1.73 |
| Total Families | 172 (100.0%) | 2.60 |
Median Household Size in Richmond
The median household size in Richmond is 2.09 persons per household, with married-couple households (111 | 33.6%) accounting for the largest median household size of 3.21 persons per household. non-family households (158 | 47.9%) represent the smallest median household size with 1.42 persons per household.
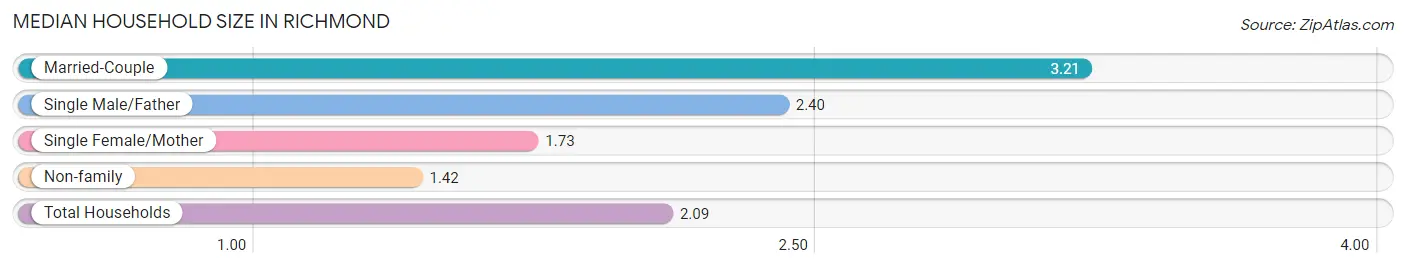
| Household Type | # Households | Household Size |
| Married-Couple | 111 (33.6%) | 3.21 |
| Single Male/Father | 5 (1.5%) | 2.40 |
| Single Female/Mother | 56 (17.0%) | 1.73 |
| Non-family | 158 (47.9%) | 1.42 |
| Total Households | 330 (100.0%) | 2.09 |
Household Size by Marriage Status in Richmond
Out of a total of 330 households in Richmond, 172 (52.1%) are family households, while 158 (47.9%) are nonfamily households. The most numerous type of family households are 2-person households, comprising 95, and the most common type of nonfamily households are 1-person households, comprising 135.
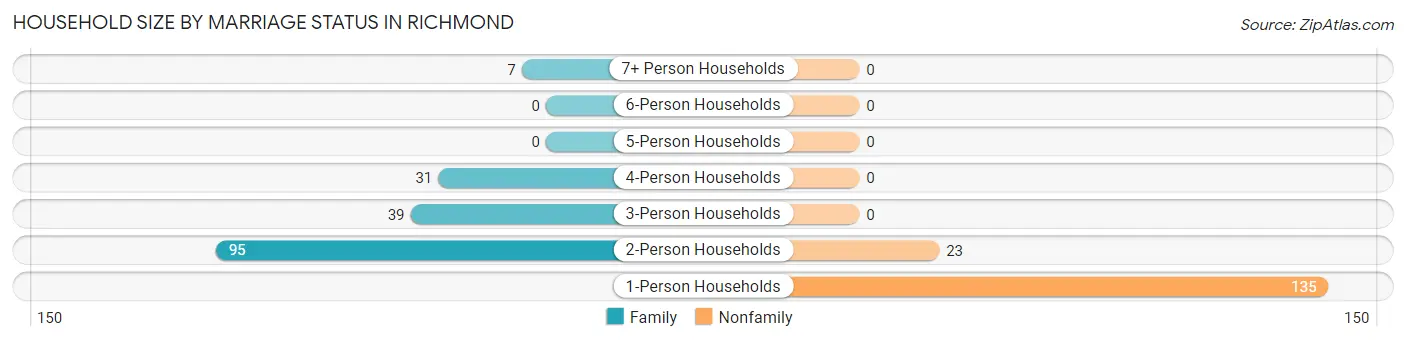
| Household Size | Family Households | Nonfamily Households |
| 1-Person Households | - | 135 (40.9%) |
| 2-Person Households | 95 (28.8%) | 23 (7.0%) |
| 3-Person Households | 39 (11.8%) | 0 (0.0%) |
| 4-Person Households | 31 (9.4%) | 0 (0.0%) |
| 5-Person Households | 0 (0.0%) | 0 (0.0%) |
| 6-Person Households | 0 (0.0%) | 0 (0.0%) |
| 7+ Person Households | 7 (2.1%) | 0 (0.0%) |
| Total | 172 (52.1%) | 158 (47.9%) |
Female Fertility in Richmond
Fertility by Age in Richmond
| Age Bracket | Women with Births | Births / 1,000 Women |
| 15 to 19 years | 0 (0.0%) | 0.0 |
| 20 to 34 years | 0 (0.0%) | 0.0 |
| 35 to 50 years | 0 (0.0%) | 0.0 |
| Total | 0 (0.0%) | 0.0 |
Fertility by Age by Marriage Status in Richmond
| Age Bracket | Married | Unmarried |
| 15 to 19 years | 0 (0.0%) | 0 (0.0%) |
| 20 to 34 years | 0 (0.0%) | 0 (0.0%) |
| 35 to 50 years | 0 (0.0%) | 0 (0.0%) |
| Total | 0 (0.0%) | 0 (0.0%) |
Fertility by Education in Richmond
| Educational Attainment | Women with Births | Births / 1,000 Women |
| Less than High School | 0 (0.0%) | 0.0 |
| High School Diploma | 0 (0.0%) | 0.0 |
| College or Associate's Degree | 0 (0.0%) | 0.0 |
| Bachelor's Degree | 0 (0.0%) | 0.0 |
| Graduate Degree | 0 (0.0%) | 0.0 |
| Total | 0 (0.0%) | 0.0 |
Fertility by Education by Marriage Status in Richmond
| Educational Attainment | Married | Unmarried |
| Less than High School | 0 (0.0%) | 0 (0.0%) |
| High School Diploma | 0 (0.0%) | 0 (0.0%) |
| College or Associate's Degree | 0 (0.0%) | 0 (0.0%) |
| Bachelor's Degree | 0 (0.0%) | 0 (0.0%) |
| Graduate Degree | 0 (0.0%) | 0 (0.0%) |
| Total | 0 (0.0%) | 0 (0.0%) |
Employment Characteristics in Richmond
Employment by Class of Employer in Richmond
Among the 446 employed individuals in Richmond, private company employees (194 | 43.5%), local government employees (86 | 19.3%), and self-employed (not incorporated) (71 | 15.9%) make up the most common classes of employment.
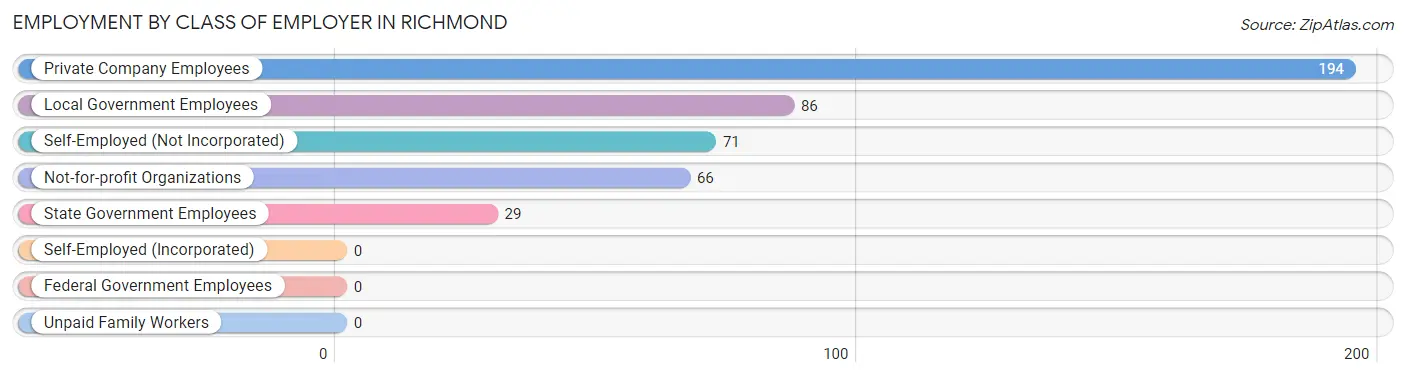
| Employer Class | # Employees | % Employees |
| Private Company Employees | 194 | 43.5% |
| Self-Employed (Incorporated) | 0 | 0.0% |
| Self-Employed (Not Incorporated) | 71 | 15.9% |
| Not-for-profit Organizations | 66 | 14.8% |
| Local Government Employees | 86 | 19.3% |
| State Government Employees | 29 | 6.5% |
| Federal Government Employees | 0 | 0.0% |
| Unpaid Family Workers | 0 | 0.0% |
| Total | 446 | 100.0% |
Employment Status by Age in Richmond
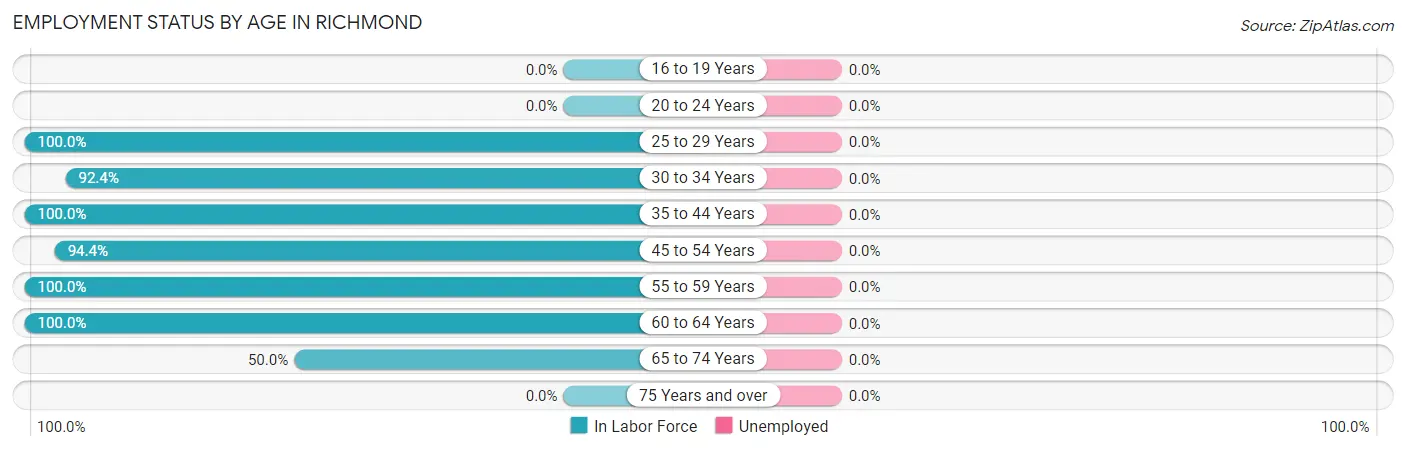
| Age Bracket | In Labor Force | Unemployed |
| 16 to 19 Years | 0 (0.0%) | 0 (0.0%) |
| 20 to 24 Years | 0 (0.0%) | 0 (0.0%) |
| 25 to 29 Years | 37 (100.0%) | 0 (0.0%) |
| 30 to 34 Years | 97 (92.4%) | 0 (0.0%) |
| 35 to 44 Years | 120 (100.0%) | 0 (0.0%) |
| 45 to 54 Years | 102 (94.4%) | 0 (0.0%) |
| 55 to 59 Years | 30 (100.0%) | 0 (0.0%) |
| 60 to 64 Years | 44 (100.0%) | 0 (0.0%) |
| 65 to 74 Years | 32 (50.0%) | 0 (0.0%) |
| 75 Years and over | 0 (0.0%) | 0 (0.0%) |
| Total | 462 (84.9%) | 0 (0.0%) |
Employment Status by Educational Attainment in Richmond
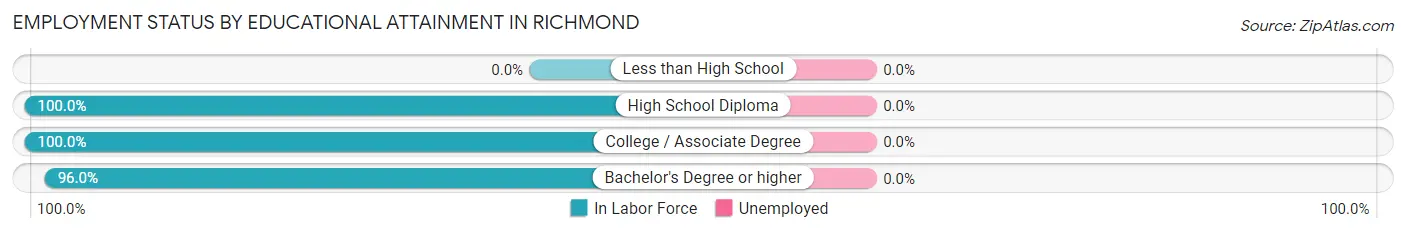
| Educational Attainment | In Labor Force | Unemployed |
| Less than High School | 0 (0.0%) | 0 (0.0%) |
| High School Diploma | 6 (100.0%) | 0 (0.0%) |
| College / Associate Degree | 88 (100.0%) | 0 (0.0%) |
| Bachelor's Degree or higher | 336 (96.0%) | 0 (0.0%) |
| Total | 430 (96.8%) | 0 (0.0%) |
Employment Occupations by Sex in Richmond
Management, Business, Science and Arts Occupations
The most common Management, Business, Science and Arts occupations in Richmond are Community & Social Service (121 | 26.2%), Education Instruction & Library (121 | 26.2%), Computers, Engineering & Science (105 | 22.7%), Management (86 | 18.6%), and Business & Financial (73 | 15.8%).
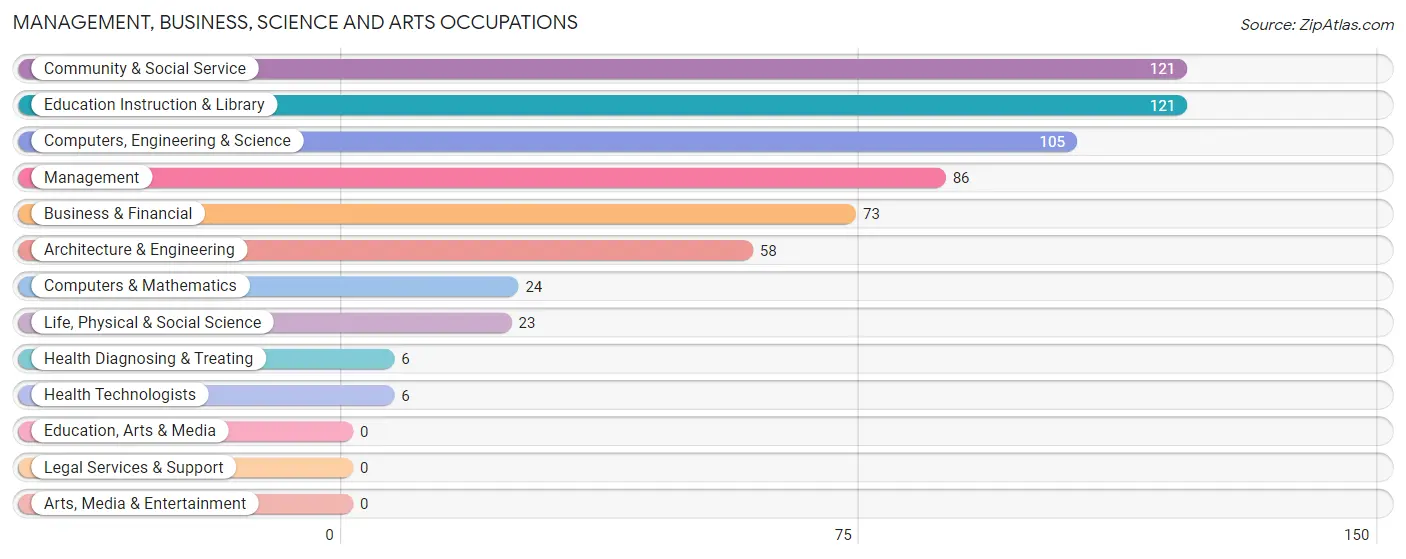
Management, Business, Science and Arts Occupations by Sex
Within the Management, Business, Science and Arts occupations in Richmond, the most male-oriented occupations are Architecture & Engineering (100.0%), Management (67.4%), and Computers, Engineering & Science (64.8%), while the most female-oriented occupations are Business & Financial (100.0%), Computers & Mathematics (100.0%), and Health Diagnosing & Treating (100.0%).
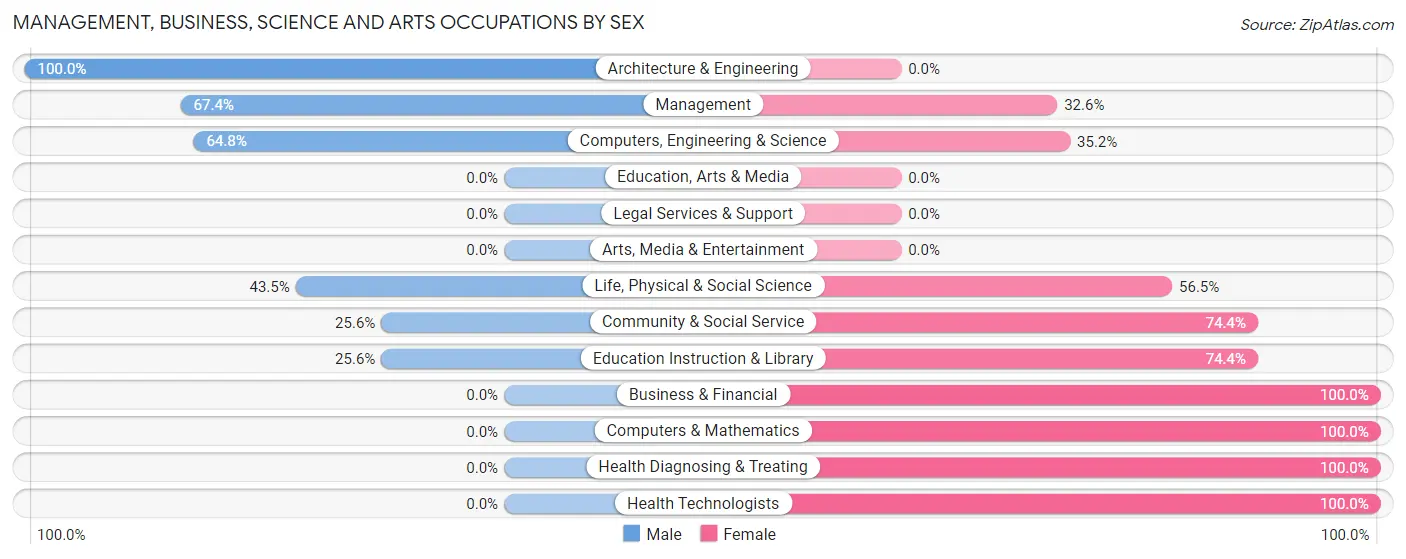
| Occupation | Male | Female |
| Management | 58 (67.4%) | 28 (32.6%) |
| Business & Financial | 0 (0.0%) | 73 (100.0%) |
| Computers, Engineering & Science | 68 (64.8%) | 37 (35.2%) |
| Computers & Mathematics | 0 (0.0%) | 24 (100.0%) |
| Architecture & Engineering | 58 (100.0%) | 0 (0.0%) |
| Life, Physical & Social Science | 10 (43.5%) | 13 (56.5%) |
| Community & Social Service | 31 (25.6%) | 90 (74.4%) |
| Education, Arts & Media | 0 (0.0%) | 0 (0.0%) |
| Legal Services & Support | 0 (0.0%) | 0 (0.0%) |
| Education Instruction & Library | 31 (25.6%) | 90 (74.4%) |
| Arts, Media & Entertainment | 0 (0.0%) | 0 (0.0%) |
| Health Diagnosing & Treating | 0 (0.0%) | 6 (100.0%) |
| Health Technologists | 0 (0.0%) | 6 (100.0%) |
| Total (Category) | 157 (40.2%) | 234 (59.9%) |
| Total (Overall) | 190 (41.1%) | 272 (58.9%) |
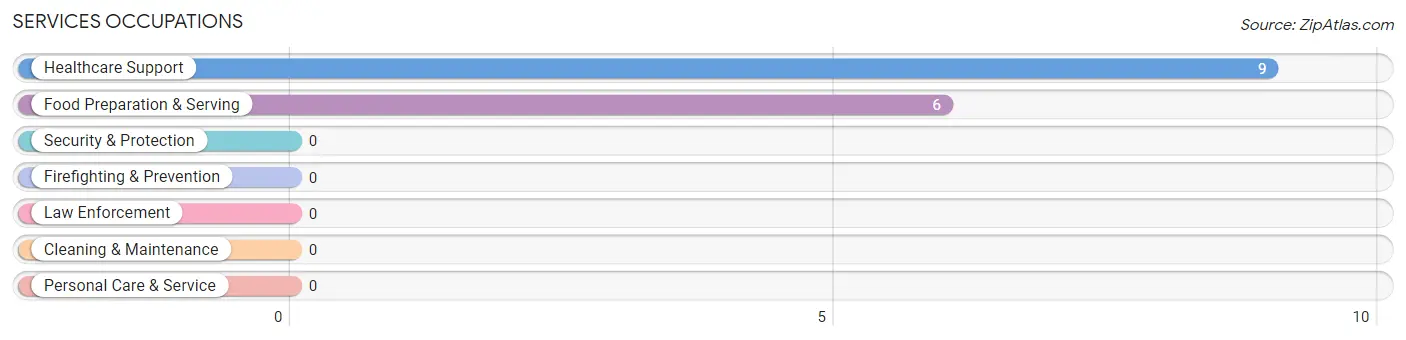
Services Occupations
The most common Services occupations in Richmond are Healthcare Support (9 | 1.9%), and Food Preparation & Serving (6 | 1.3%).
Services Occupations by Sex
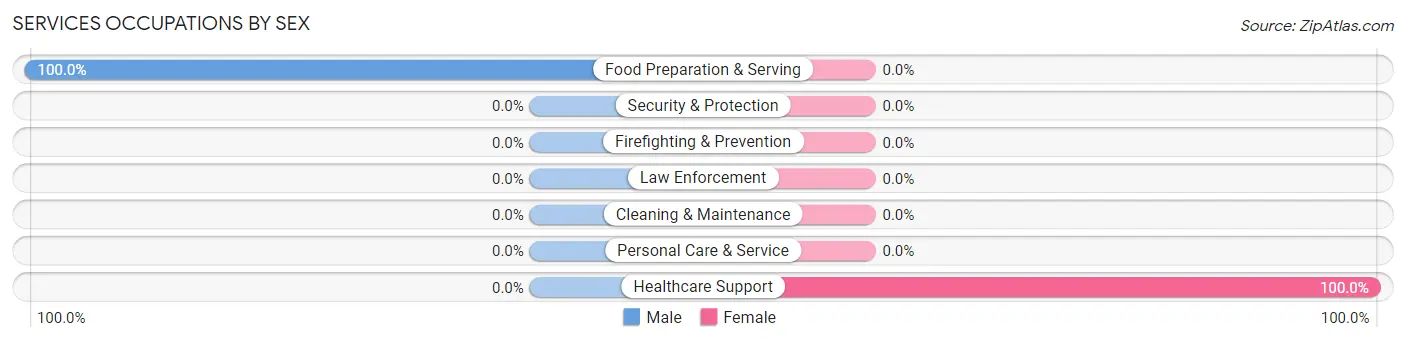
| Occupation | Male | Female |
| Healthcare Support | 0 (0.0%) | 9 (100.0%) |
| Security & Protection | 0 (0.0%) | 0 (0.0%) |
| Firefighting & Prevention | 0 (0.0%) | 0 (0.0%) |
| Law Enforcement | 0 (0.0%) | 0 (0.0%) |
| Food Preparation & Serving | 6 (100.0%) | 0 (0.0%) |
| Cleaning & Maintenance | 0 (0.0%) | 0 (0.0%) |
| Personal Care & Service | 0 (0.0%) | 0 (0.0%) |
| Total (Category) | 6 (40.0%) | 9 (60.0%) |
| Total (Overall) | 190 (41.1%) | 272 (58.9%) |
Sales and Office Occupations
The most common Sales and Office occupations in Richmond are Sales & Related (31 | 6.7%), and Office & Administration (5 | 1.1%).
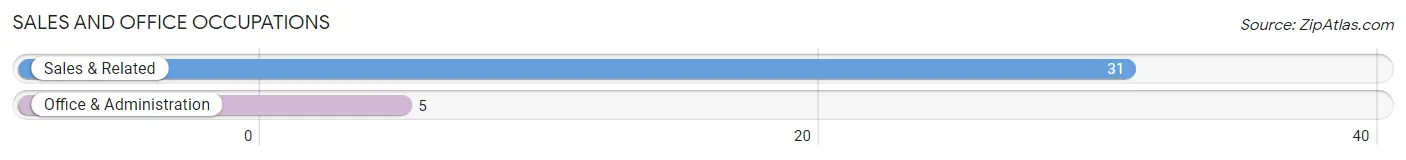
Sales and Office Occupations by Sex
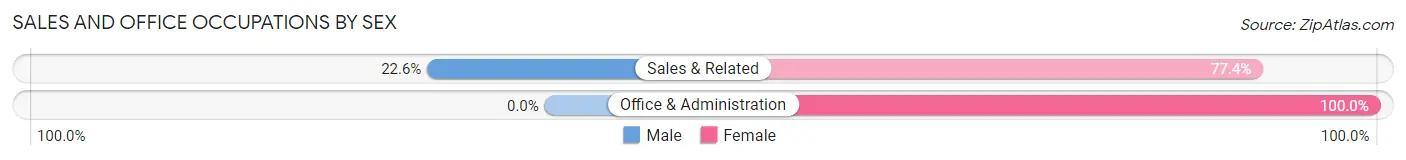
| Occupation | Male | Female |
| Sales & Related | 7 (22.6%) | 24 (77.4%) |
| Office & Administration | 0 (0.0%) | 5 (100.0%) |
| Total (Category) | 7 (19.4%) | 29 (80.6%) |
| Total (Overall) | 190 (41.1%) | 272 (58.9%) |
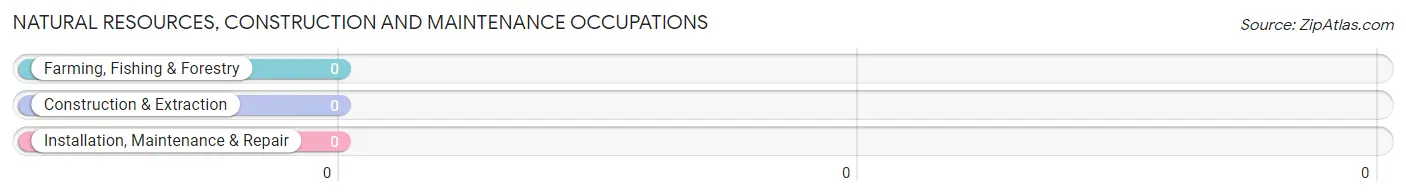
Natural Resources, Construction and Maintenance Occupations
Natural Resources, Construction and Maintenance Occupations by Sex
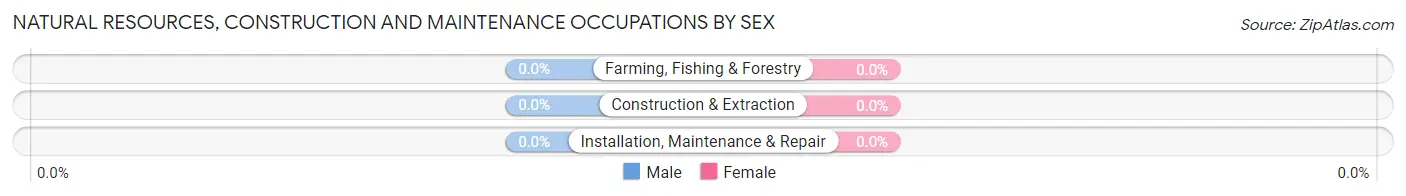
| Occupation | Male | Female |
| Farming, Fishing & Forestry | 0 (0.0%) | 0 (0.0%) |
| Construction & Extraction | 0 (0.0%) | 0 (0.0%) |
| Installation, Maintenance & Repair | 0 (0.0%) | 0 (0.0%) |
| Total (Category) | 0 (0.0%) | 0 (0.0%) |
| Total (Overall) | 190 (41.1%) | 272 (58.9%) |
Production, Transportation and Moving Occupations
The most common Production, Transportation and Moving occupations in Richmond are Transportation (12 | 2.6%), and Production (8 | 1.7%).
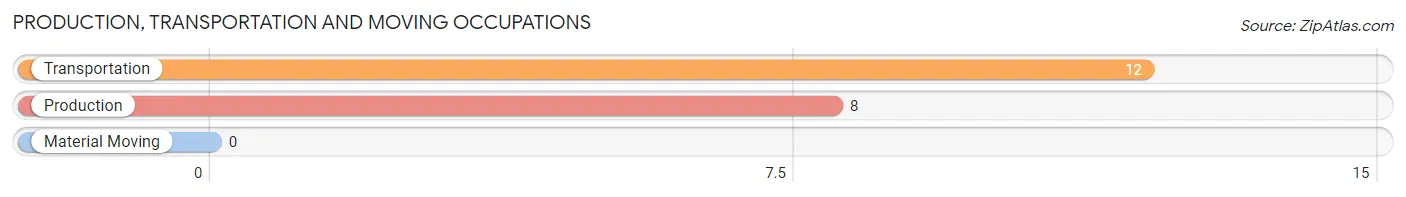
Production, Transportation and Moving Occupations by Sex
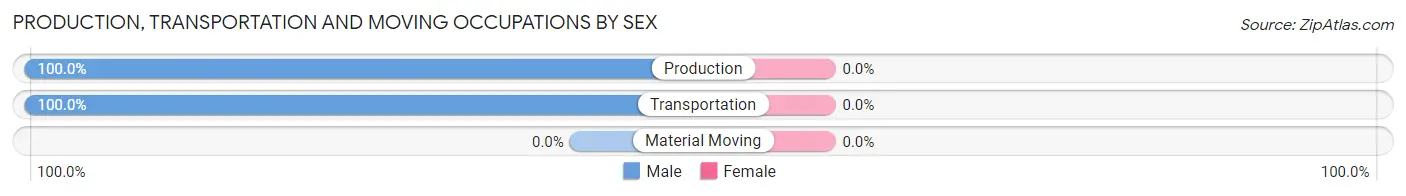
| Occupation | Male | Female |
| Production | 8 (100.0%) | 0 (0.0%) |
| Transportation | 12 (100.0%) | 0 (0.0%) |
| Material Moving | 0 (0.0%) | 0 (0.0%) |
| Total (Category) | 20 (100.0%) | 0 (0.0%) |
| Total (Overall) | 190 (41.1%) | 272 (58.9%) |
Employment Industries by Sex in Richmond
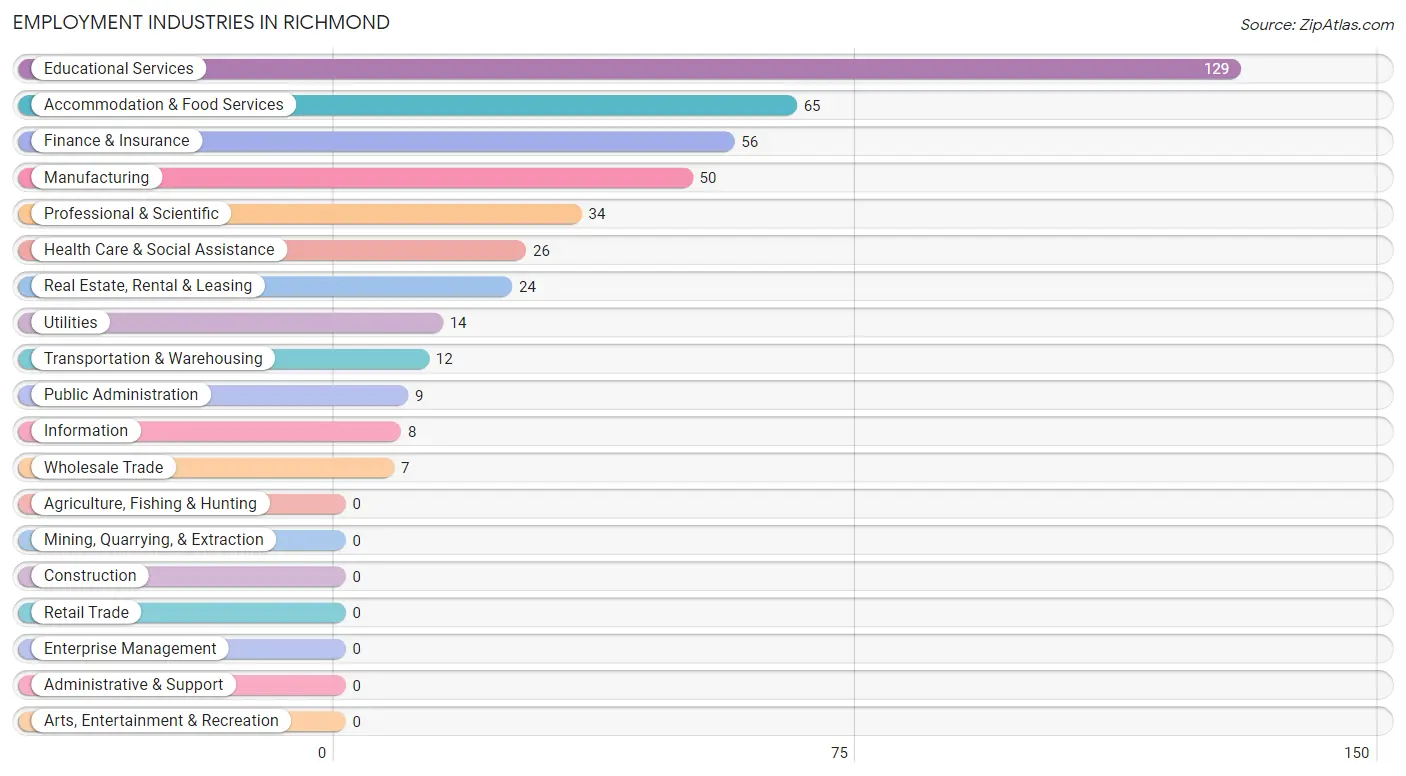
Employment Industries in Richmond
The major employment industries in Richmond include Educational Services (129 | 27.9%), Accommodation & Food Services (65 | 14.1%), Finance & Insurance (56 | 12.1%), Manufacturing (50 | 10.8%), and Professional & Scientific (34 | 7.4%).
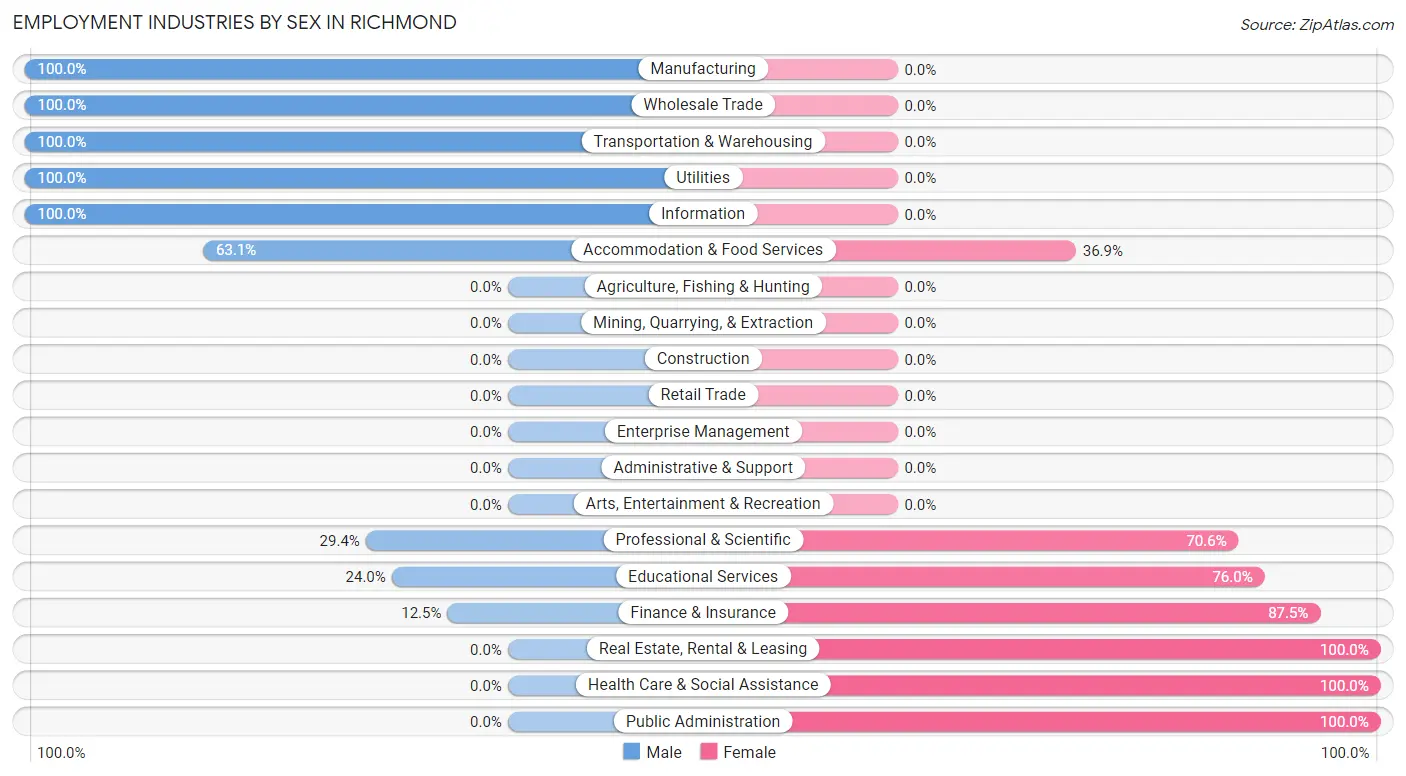
Employment Industries by Sex in Richmond
The Richmond industries that see more men than women are Manufacturing (100.0%), Wholesale Trade (100.0%), and Transportation & Warehousing (100.0%), whereas the industries that tend to have a higher number of women are Real Estate, Rental & Leasing (100.0%), Health Care & Social Assistance (100.0%), and Public Administration (100.0%).
| Industry | Male | Female |
| Agriculture, Fishing & Hunting | 0 (0.0%) | 0 (0.0%) |
| Mining, Quarrying, & Extraction | 0 (0.0%) | 0 (0.0%) |
| Construction | 0 (0.0%) | 0 (0.0%) |
| Manufacturing | 50 (100.0%) | 0 (0.0%) |
| Wholesale Trade | 7 (100.0%) | 0 (0.0%) |
| Retail Trade | 0 (0.0%) | 0 (0.0%) |
| Transportation & Warehousing | 12 (100.0%) | 0 (0.0%) |
| Utilities | 14 (100.0%) | 0 (0.0%) |
| Information | 8 (100.0%) | 0 (0.0%) |
| Finance & Insurance | 7 (12.5%) | 49 (87.5%) |
| Real Estate, Rental & Leasing | 0 (0.0%) | 24 (100.0%) |
| Professional & Scientific | 10 (29.4%) | 24 (70.6%) |
| Enterprise Management | 0 (0.0%) | 0 (0.0%) |
| Administrative & Support | 0 (0.0%) | 0 (0.0%) |
| Educational Services | 31 (24.0%) | 98 (76.0%) |
| Health Care & Social Assistance | 0 (0.0%) | 26 (100.0%) |
| Arts, Entertainment & Recreation | 0 (0.0%) | 0 (0.0%) |
| Accommodation & Food Services | 41 (63.1%) | 24 (36.9%) |
| Public Administration | 0 (0.0%) | 9 (100.0%) |
| Total | 190 (41.1%) | 272 (58.9%) |
Education in Richmond
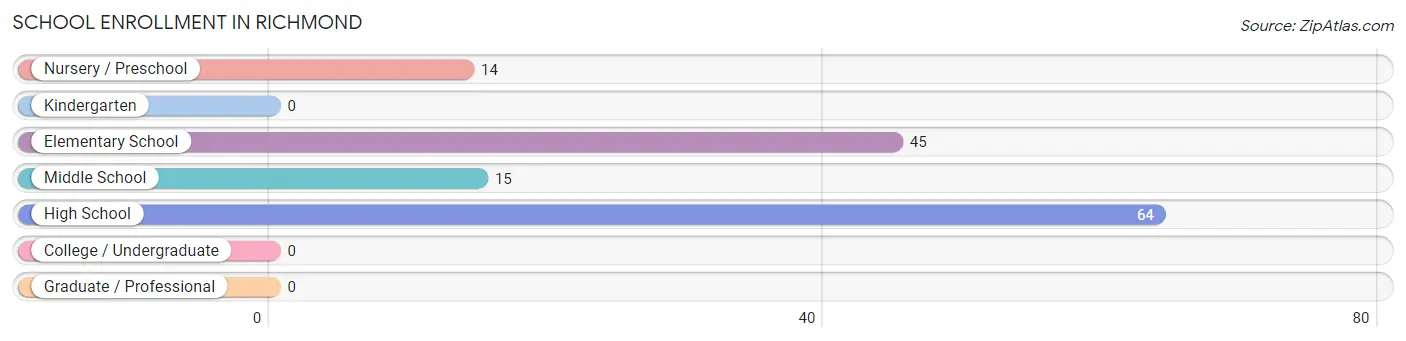
School Enrollment in Richmond
The most common levels of schooling among the 138 students in Richmond are high school (64 | 46.4%), elementary school (45 | 32.6%), and middle school (15 | 10.9%).
| School Level | # Students | % Students |
| Nursery / Preschool | 14 | 10.1% |
| Kindergarten | 0 | 0.0% |
| Elementary School | 45 | 32.6% |
| Middle School | 15 | 10.9% |
| High School | 64 | 46.4% |
| College / Undergraduate | 0 | 0.0% |
| Graduate / Professional | 0 | 0.0% |
| Total | 138 | 100.0% |
School Enrollment by Age by Funding Source in Richmond
Out of a total of 138 students who are enrolled in schools in Richmond, 21 (15.2%) attend a private institution, while the remaining 117 (84.8%) are enrolled in public schools. The age group of 3 to 4 year olds has the highest likelihood of being enrolled in private schools, with 14 (100.0% in the age bracket) enrolled. Conversely, the age group of 10 to 14 year olds has the lowest likelihood of being enrolled in a private school, with 26 (100.0% in the age bracket) attending a public institution.
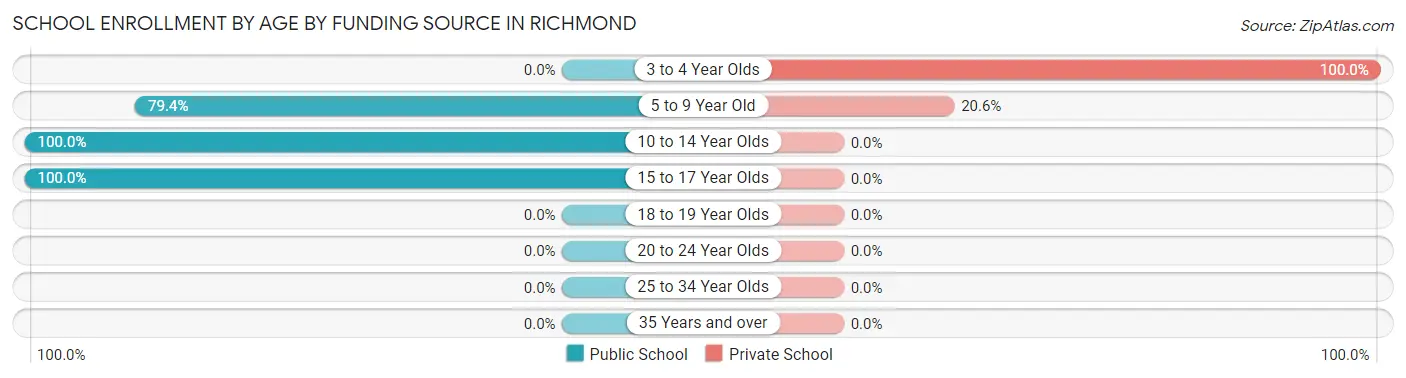
| Age Bracket | Public School | Private School |
| 3 to 4 Year Olds | 0 (0.0%) | 14 (100.0%) |
| 5 to 9 Year Old | 27 (79.4%) | 7 (20.6%) |
| 10 to 14 Year Olds | 26 (100.0%) | 0 (0.0%) |
| 15 to 17 Year Olds | 64 (100.0%) | 0 (0.0%) |
| 18 to 19 Year Olds | 0 (0.0%) | 0 (0.0%) |
| 20 to 24 Year Olds | 0 (0.0%) | 0 (0.0%) |
| 25 to 34 Year Olds | 0 (0.0%) | 0 (0.0%) |
| 35 Years and over | 0 (0.0%) | 0 (0.0%) |
| Total | 117 (84.8%) | 21 (15.2%) |
Educational Attainment by Field of Study in Richmond
Social sciences (106 | 24.2%), bio, nature & agricultural (67 | 15.3%), engineering (58 | 13.2%), physical & health sciences (42 | 9.6%), and psychology (38 | 8.7%) are the most common fields of study among 438 individuals in Richmond who have obtained a bachelor's degree or higher.
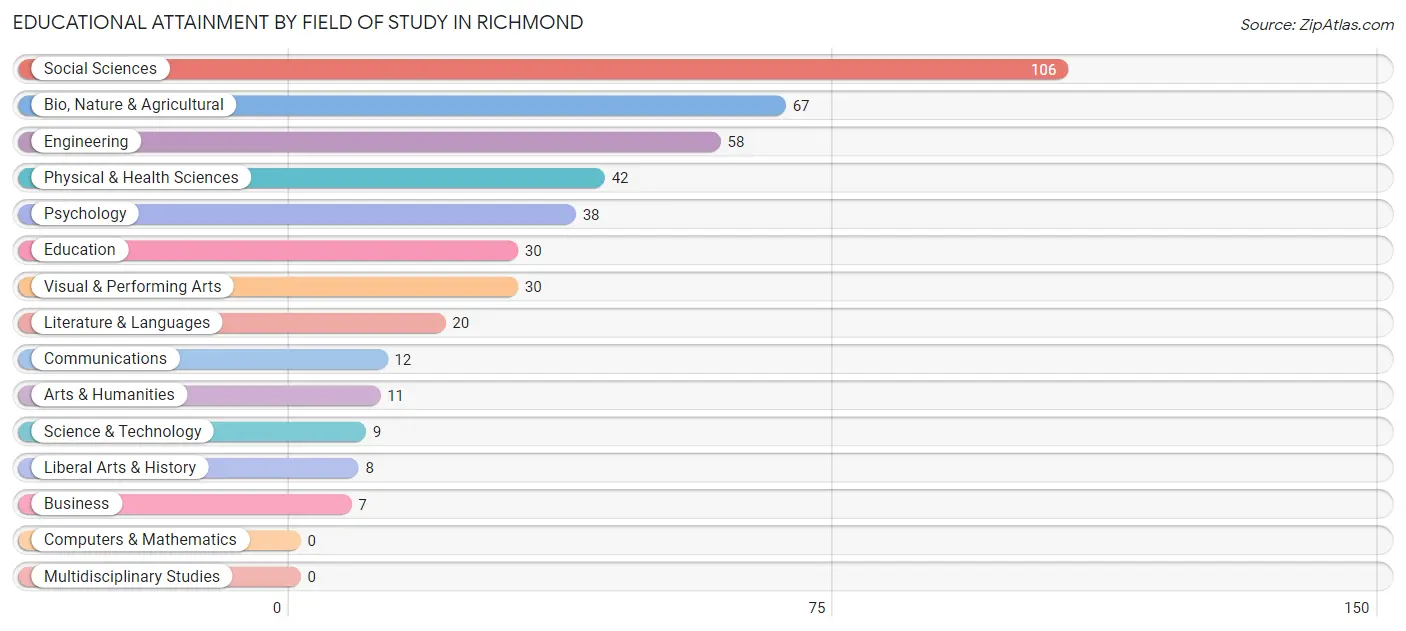
| Field of Study | # Graduates | % Graduates |
| Computers & Mathematics | 0 | 0.0% |
| Bio, Nature & Agricultural | 67 | 15.3% |
| Physical & Health Sciences | 42 | 9.6% |
| Psychology | 38 | 8.7% |
| Social Sciences | 106 | 24.2% |
| Engineering | 58 | 13.2% |
| Multidisciplinary Studies | 0 | 0.0% |
| Science & Technology | 9 | 2.1% |
| Business | 7 | 1.6% |
| Education | 30 | 6.9% |
| Literature & Languages | 20 | 4.6% |
| Liberal Arts & History | 8 | 1.8% |
| Visual & Performing Arts | 30 | 6.9% |
| Communications | 12 | 2.7% |
| Arts & Humanities | 11 | 2.5% |
| Total | 438 | 100.0% |
Transportation & Commute in Richmond
Vehicle Availability by Sex in Richmond
The most prevalent vehicle ownership categories in Richmond are males with 2 vehicles (148, accounting for 80.9%) and females with 2 vehicles (116, making up 56.3%).
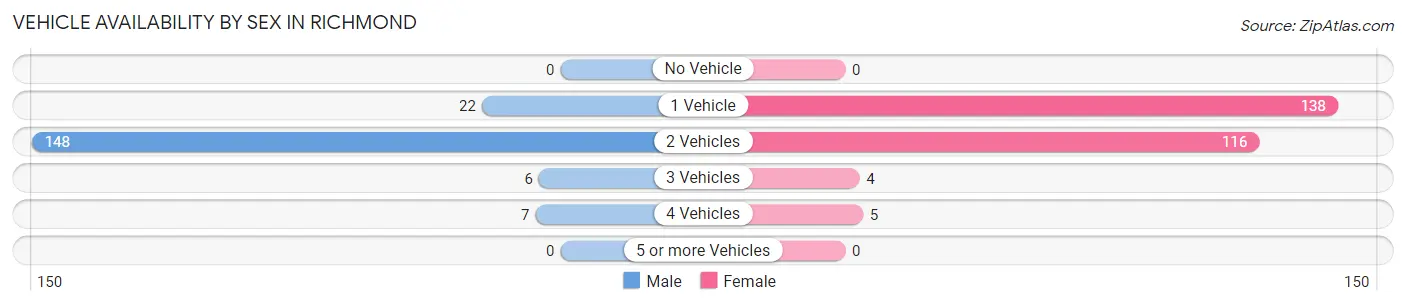
| Vehicles Available | Male | Female |
| No Vehicle | 0 (0.0%) | 0 (0.0%) |
| 1 Vehicle | 22 (12.0%) | 138 (52.5%) |
| 2 Vehicles | 148 (80.9%) | 116 (44.1%) |
| 3 Vehicles | 6 (3.3%) | 4 (1.5%) |
| 4 Vehicles | 7 (3.8%) | 5 (1.9%) |
| 5 or more Vehicles | 0 (0.0%) | 0 (0.0%) |
| Total | 183 (100.0%) | 263 (100.0%) |
Commute Time in Richmond
The most frequently occuring commute durations in Richmond are 20 to 24 minutes (128 commuters, 30.7%), 30 to 34 minutes (108 commuters, 25.9%), and 15 to 19 minutes (50 commuters, 12.0%).
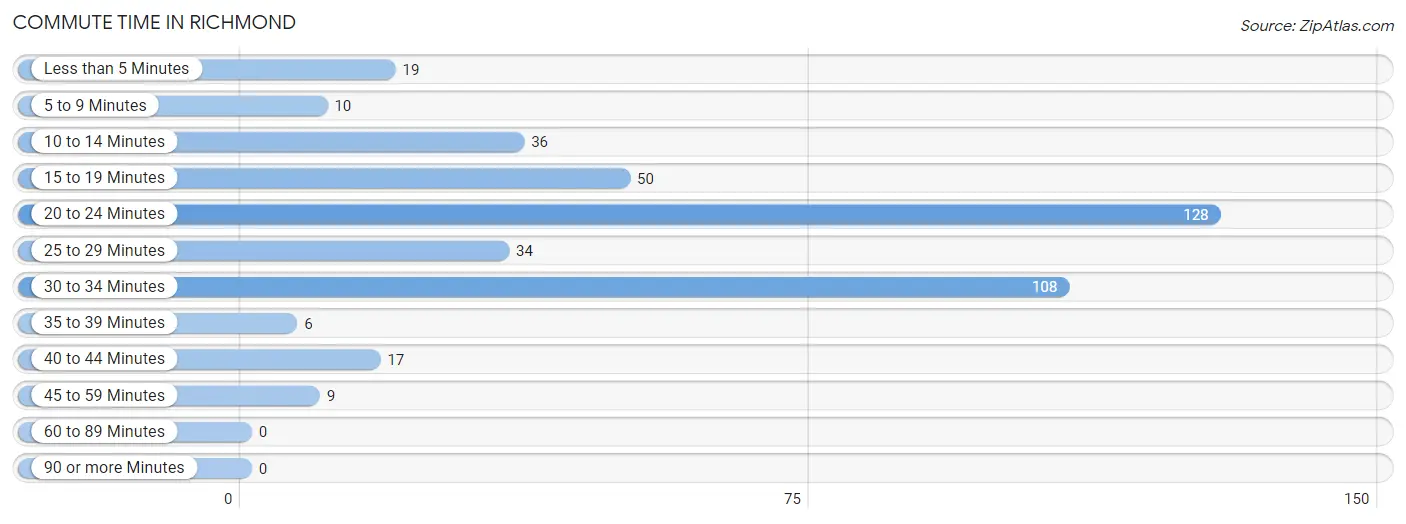
| Commute Time | # Commuters | % Commuters |
| Less than 5 Minutes | 19 | 4.6% |
| 5 to 9 Minutes | 10 | 2.4% |
| 10 to 14 Minutes | 36 | 8.6% |
| 15 to 19 Minutes | 50 | 12.0% |
| 20 to 24 Minutes | 128 | 30.7% |
| 25 to 29 Minutes | 34 | 8.2% |
| 30 to 34 Minutes | 108 | 25.9% |
| 35 to 39 Minutes | 6 | 1.4% |
| 40 to 44 Minutes | 17 | 4.1% |
| 45 to 59 Minutes | 9 | 2.2% |
| 60 to 89 Minutes | 0 | 0.0% |
| 90 or more Minutes | 0 | 0.0% |
Commute Time by Sex in Richmond
The most common commute times in Richmond are 15 to 19 minutes (50 commuters, 31.5%) for males and 20 to 24 minutes (111 commuters, 43.0%) for females.
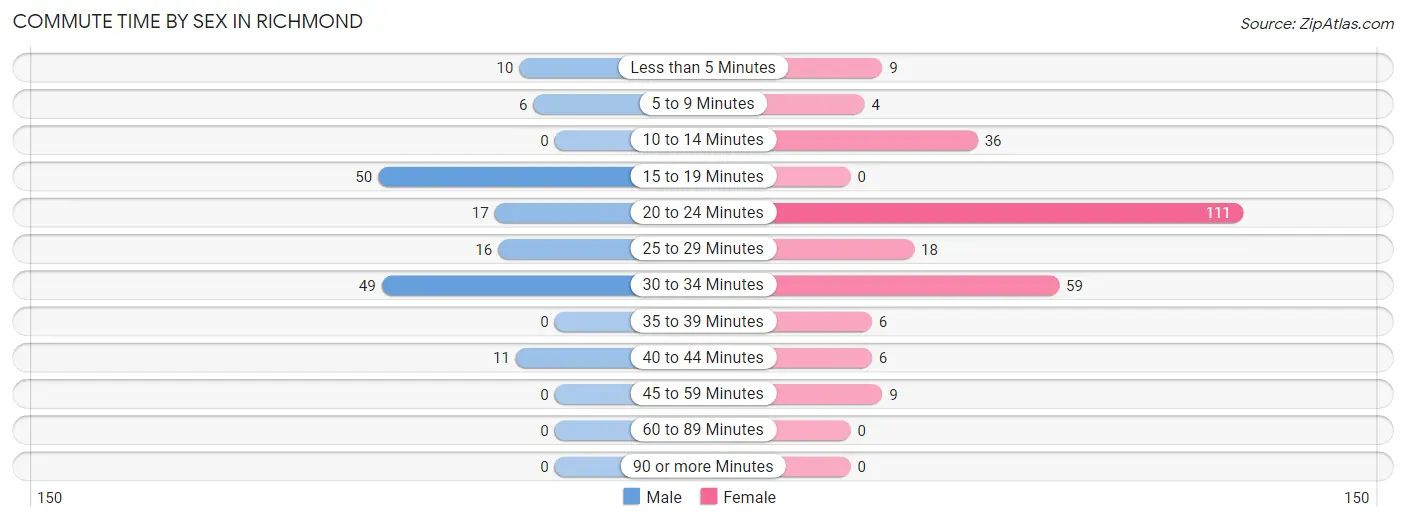
| Commute Time | Male | Female |
| Less than 5 Minutes | 10 (6.3%) | 9 (3.5%) |
| 5 to 9 Minutes | 6 (3.8%) | 4 (1.5%) |
| 10 to 14 Minutes | 0 (0.0%) | 36 (14.0%) |
| 15 to 19 Minutes | 50 (31.5%) | 0 (0.0%) |
| 20 to 24 Minutes | 17 (10.7%) | 111 (43.0%) |
| 25 to 29 Minutes | 16 (10.1%) | 18 (7.0%) |
| 30 to 34 Minutes | 49 (30.8%) | 59 (22.9%) |
| 35 to 39 Minutes | 0 (0.0%) | 6 (2.3%) |
| 40 to 44 Minutes | 11 (6.9%) | 6 (2.3%) |
| 45 to 59 Minutes | 0 (0.0%) | 9 (3.5%) |
| 60 to 89 Minutes | 0 (0.0%) | 0 (0.0%) |
| 90 or more Minutes | 0 (0.0%) | 0 (0.0%) |
Time of Departure to Work by Sex in Richmond
The most frequent times of departure to work in Richmond are 8:30 AM to 8:59 AM (62, 39.0%) for males and 7:30 AM to 7:59 AM (68, 26.4%) for females.
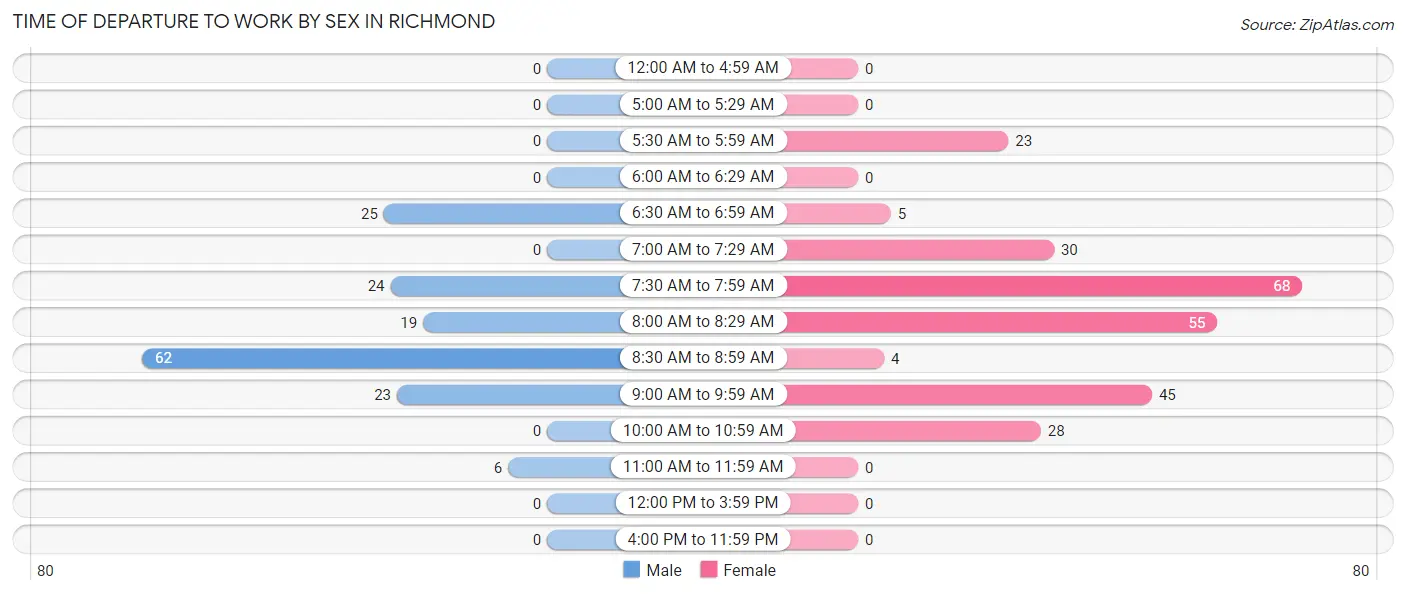
| Time of Departure | Male | Female |
| 12:00 AM to 4:59 AM | 0 (0.0%) | 0 (0.0%) |
| 5:00 AM to 5:29 AM | 0 (0.0%) | 0 (0.0%) |
| 5:30 AM to 5:59 AM | 0 (0.0%) | 23 (8.9%) |
| 6:00 AM to 6:29 AM | 0 (0.0%) | 0 (0.0%) |
| 6:30 AM to 6:59 AM | 25 (15.7%) | 5 (1.9%) |
| 7:00 AM to 7:29 AM | 0 (0.0%) | 30 (11.6%) |
| 7:30 AM to 7:59 AM | 24 (15.1%) | 68 (26.4%) |
| 8:00 AM to 8:29 AM | 19 (11.9%) | 55 (21.3%) |
| 8:30 AM to 8:59 AM | 62 (39.0%) | 4 (1.5%) |
| 9:00 AM to 9:59 AM | 23 (14.5%) | 45 (17.4%) |
| 10:00 AM to 10:59 AM | 0 (0.0%) | 28 (10.8%) |
| 11:00 AM to 11:59 AM | 6 (3.8%) | 0 (0.0%) |
| 12:00 PM to 3:59 PM | 0 (0.0%) | 0 (0.0%) |
| 4:00 PM to 11:59 PM | 0 (0.0%) | 0 (0.0%) |
| Total | 159 (100.0%) | 258 (100.0%) |
Housing Occupancy in Richmond
Occupancy by Ownership in Richmond
Of the total 330 dwellings in Richmond, owner-occupied units account for 159 (48.2%), while renter-occupied units make up 171 (51.8%).
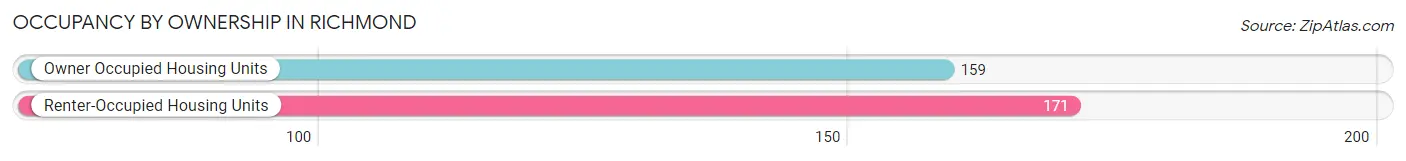
| Occupancy | # Housing Units | % Housing Units |
| Owner Occupied Housing Units | 159 | 48.2% |
| Renter-Occupied Housing Units | 171 | 51.8% |
| Total Occupied Housing Units | 330 | 100.0% |
Occupancy by Household Size in Richmond
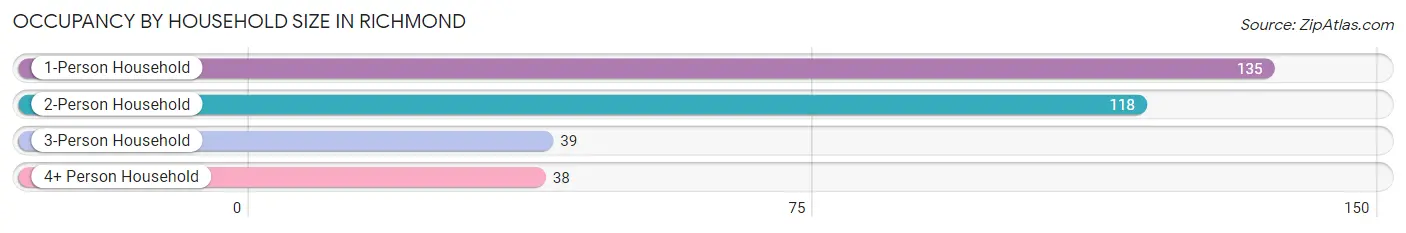
| Household Size | # Housing Units | % Housing Units |
| 1-Person Household | 135 | 40.9% |
| 2-Person Household | 118 | 35.8% |
| 3-Person Household | 39 | 11.8% |
| 4+ Person Household | 38 | 11.5% |
| Total Housing Units | 330 | 100.0% |
Occupancy by Ownership by Household Size in Richmond
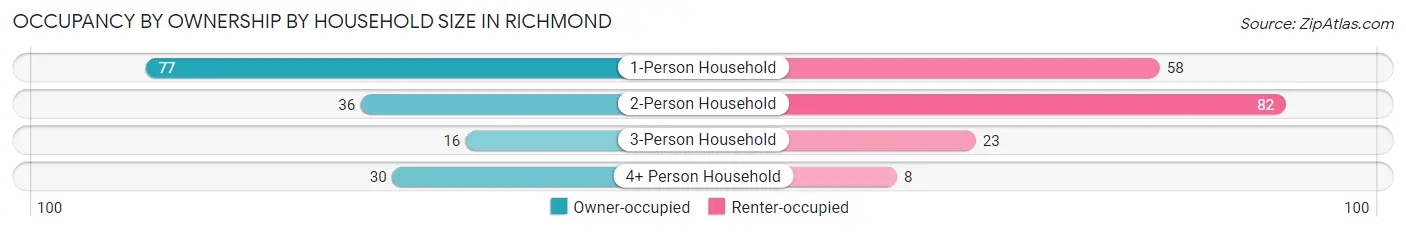
| Household Size | Owner-occupied | Renter-occupied |
| 1-Person Household | 77 (57.0%) | 58 (43.0%) |
| 2-Person Household | 36 (30.5%) | 82 (69.5%) |
| 3-Person Household | 16 (41.0%) | 23 (59.0%) |
| 4+ Person Household | 30 (78.9%) | 8 (21.0%) |
| Total Housing Units | 159 (48.2%) | 171 (51.8%) |
Occupancy by Educational Attainment in Richmond
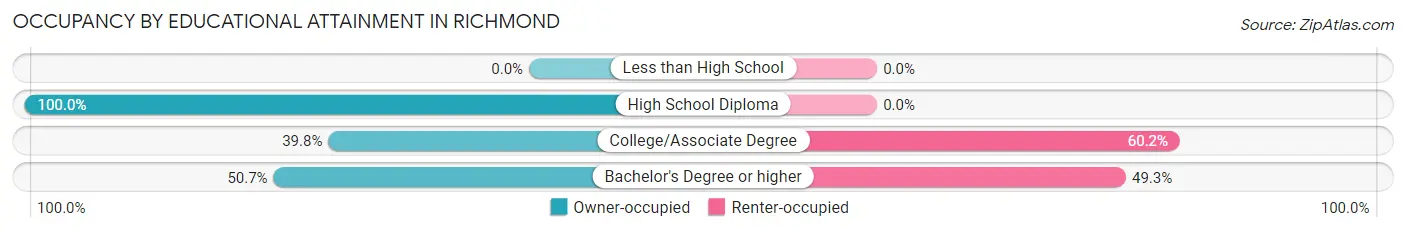
| Household Size | Owner-occupied | Renter-occupied |
| Less than High School | 0 (0.0%) | 0 (0.0%) |
| High School Diploma | 5 (100.0%) | 0 (0.0%) |
| College/Associate Degree | 39 (39.8%) | 59 (60.2%) |
| Bachelor's Degree or higher | 115 (50.7%) | 112 (49.3%) |
Occupancy by Age of Householder in Richmond
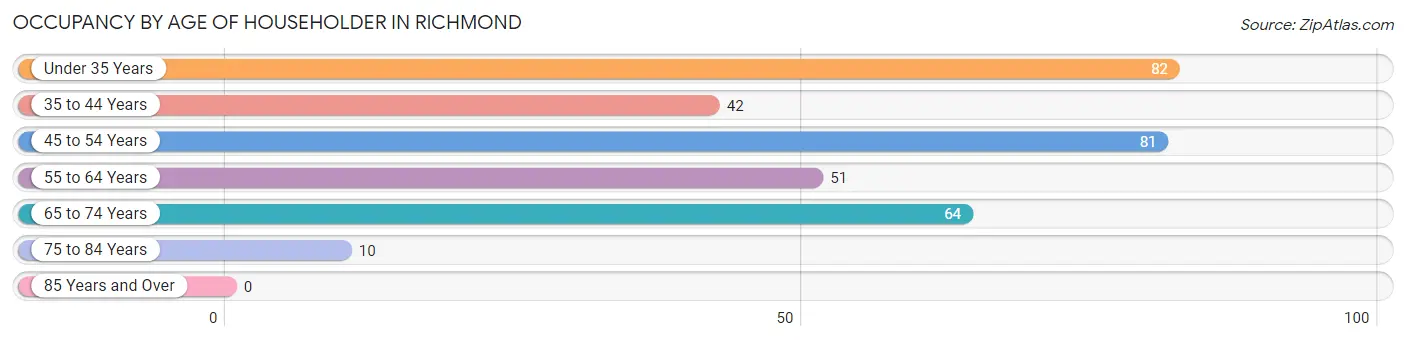
| Age Bracket | # Households | % Households |
| Under 35 Years | 82 | 24.8% |
| 35 to 44 Years | 42 | 12.7% |
| 45 to 54 Years | 81 | 24.5% |
| 55 to 64 Years | 51 | 15.4% |
| 65 to 74 Years | 64 | 19.4% |
| 75 to 84 Years | 10 | 3.0% |
| 85 Years and Over | 0 | 0.0% |
| Total | 330 | 100.0% |
Housing Finances in Richmond
Median Income by Occupancy in Richmond
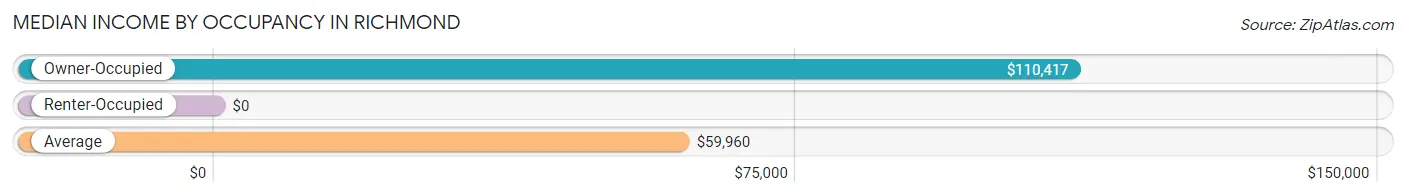
| Occupancy Type | # Households | Median Income |
| Owner-Occupied | 159 (48.2%) | $110,417 |
| Renter-Occupied | 171 (51.8%) | $0 |
| Average | 330 (100.0%) | $59,960 |
Occupancy by Householder Income Bracket in Richmond
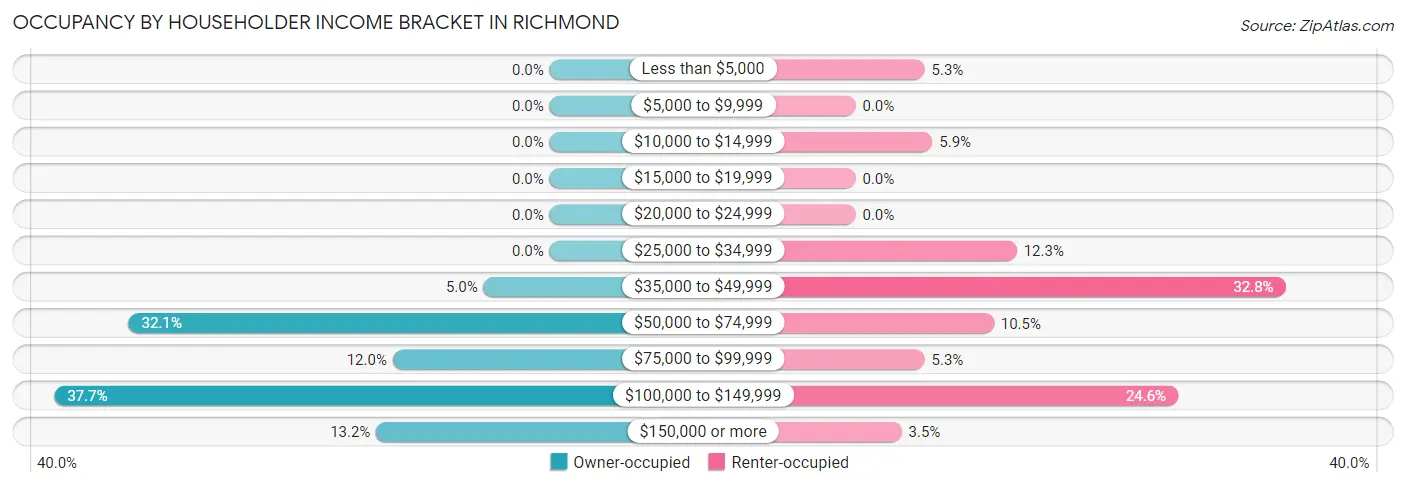
| Income Bracket | Owner-occupied | Renter-occupied |
| Less than $5,000 | 0 (0.0%) | 9 (5.3%) |
| $5,000 to $9,999 | 0 (0.0%) | 0 (0.0%) |
| $10,000 to $14,999 | 0 (0.0%) | 10 (5.9%) |
| $15,000 to $19,999 | 0 (0.0%) | 0 (0.0%) |
| $20,000 to $24,999 | 0 (0.0%) | 0 (0.0%) |
| $25,000 to $34,999 | 0 (0.0%) | 21 (12.3%) |
| $35,000 to $49,999 | 8 (5.0%) | 56 (32.8%) |
| $50,000 to $74,999 | 51 (32.1%) | 18 (10.5%) |
| $75,000 to $99,999 | 19 (11.9%) | 9 (5.3%) |
| $100,000 to $149,999 | 60 (37.7%) | 42 (24.6%) |
| $150,000 or more | 21 (13.2%) | 6 (3.5%) |
| Total | 159 (100.0%) | 171 (100.0%) |
Monthly Housing Cost Tiers in Richmond
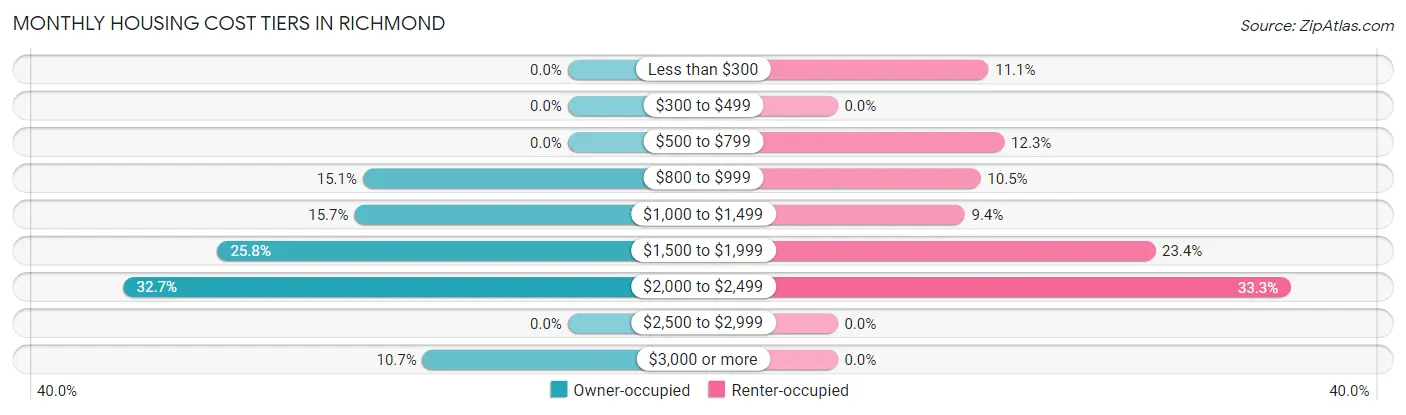
| Monthly Cost | Owner-occupied | Renter-occupied |
| Less than $300 | 0 (0.0%) | 19 (11.1%) |
| $300 to $499 | 0 (0.0%) | 0 (0.0%) |
| $500 to $799 | 0 (0.0%) | 21 (12.3%) |
| $800 to $999 | 24 (15.1%) | 18 (10.5%) |
| $1,000 to $1,499 | 25 (15.7%) | 16 (9.4%) |
| $1,500 to $1,999 | 41 (25.8%) | 40 (23.4%) |
| $2,000 to $2,499 | 52 (32.7%) | 57 (33.3%) |
| $2,500 to $2,999 | 0 (0.0%) | 0 (0.0%) |
| $3,000 or more | 17 (10.7%) | 0 (0.0%) |
| Total | 159 (100.0%) | 171 (100.0%) |
Physical Housing Characteristics in Richmond
Housing Structures in Richmond
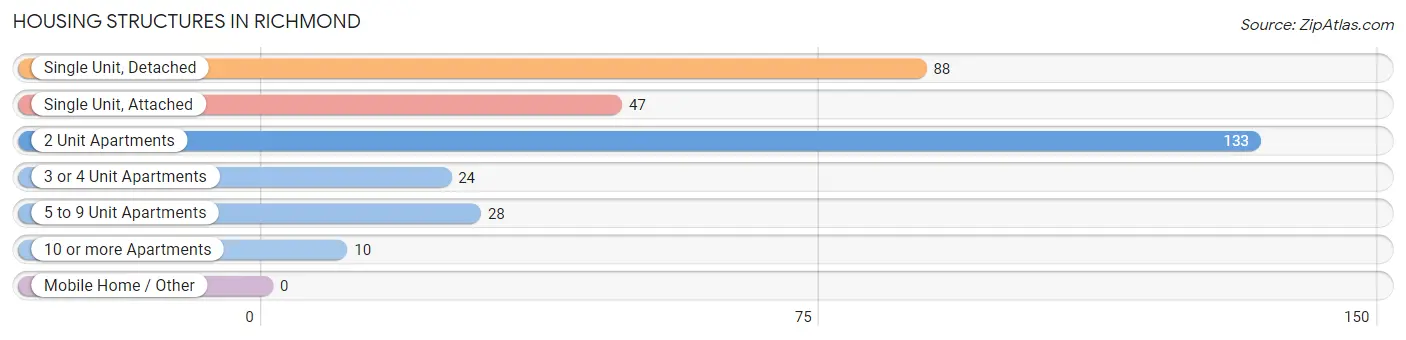
| Structure Type | # Housing Units | % Housing Units |
| Single Unit, Detached | 88 | 26.7% |
| Single Unit, Attached | 47 | 14.2% |
| 2 Unit Apartments | 133 | 40.3% |
| 3 or 4 Unit Apartments | 24 | 7.3% |
| 5 to 9 Unit Apartments | 28 | 8.5% |
| 10 or more Apartments | 10 | 3.0% |
| Mobile Home / Other | 0 | 0.0% |
| Total | 330 | 100.0% |
Housing Structures by Occupancy in Richmond
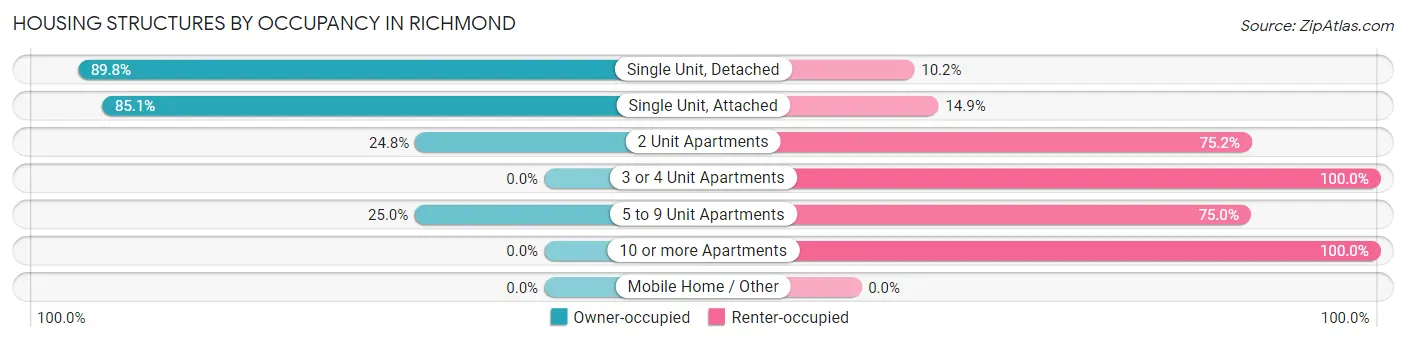
| Structure Type | Owner-occupied | Renter-occupied |
| Single Unit, Detached | 79 (89.8%) | 9 (10.2%) |
| Single Unit, Attached | 40 (85.1%) | 7 (14.9%) |
| 2 Unit Apartments | 33 (24.8%) | 100 (75.2%) |
| 3 or 4 Unit Apartments | 0 (0.0%) | 24 (100.0%) |
| 5 to 9 Unit Apartments | 7 (25.0%) | 21 (75.0%) |
| 10 or more Apartments | 0 (0.0%) | 10 (100.0%) |
| Mobile Home / Other | 0 (0.0%) | 0 (0.0%) |
| Total | 159 (48.2%) | 171 (51.8%) |
Housing Structures by Number of Rooms in Richmond
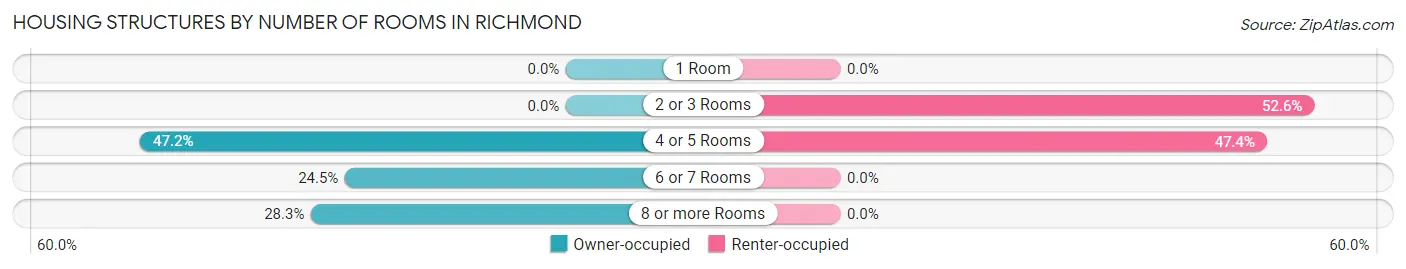
| Number of Rooms | Owner-occupied | Renter-occupied |
| 1 Room | 0 (0.0%) | 0 (0.0%) |
| 2 or 3 Rooms | 0 (0.0%) | 90 (52.6%) |
| 4 or 5 Rooms | 75 (47.2%) | 81 (47.4%) |
| 6 or 7 Rooms | 39 (24.5%) | 0 (0.0%) |
| 8 or more Rooms | 45 (28.3%) | 0 (0.0%) |
| Total | 159 (100.0%) | 171 (100.0%) |
Housing Structure by Heating Type in Richmond
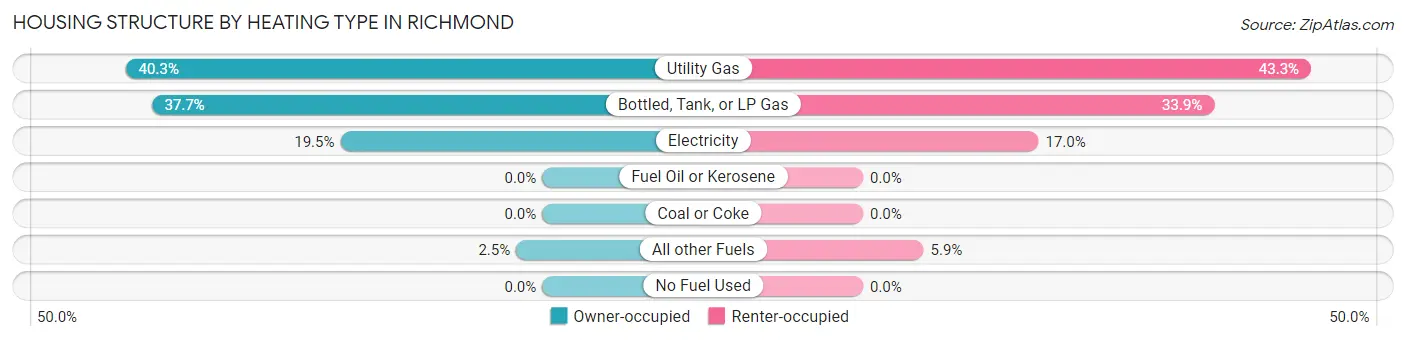
| Heating Type | Owner-occupied | Renter-occupied |
| Utility Gas | 64 (40.3%) | 74 (43.3%) |
| Bottled, Tank, or LP Gas | 60 (37.7%) | 58 (33.9%) |
| Electricity | 31 (19.5%) | 29 (17.0%) |
| Fuel Oil or Kerosene | 0 (0.0%) | 0 (0.0%) |
| Coal or Coke | 0 (0.0%) | 0 (0.0%) |
| All other Fuels | 4 (2.5%) | 10 (5.9%) |
| No Fuel Used | 0 (0.0%) | 0 (0.0%) |
| Total | 159 (100.0%) | 171 (100.0%) |
Household Vehicle Usage in Richmond
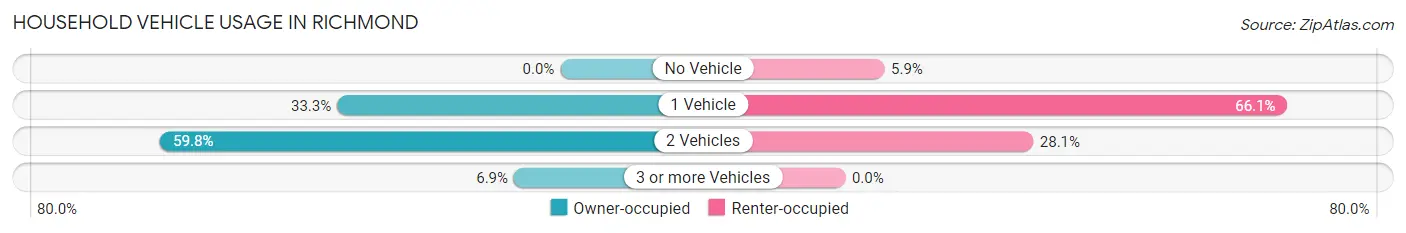
| Vehicles per Household | Owner-occupied | Renter-occupied |
| No Vehicle | 0 (0.0%) | 10 (5.9%) |
| 1 Vehicle | 53 (33.3%) | 113 (66.1%) |
| 2 Vehicles | 95 (59.8%) | 48 (28.1%) |
| 3 or more Vehicles | 11 (6.9%) | 0 (0.0%) |
| Total | 159 (100.0%) | 171 (100.0%) |
Real Estate & Mortgages in Richmond
Real Estate and Mortgage Overview in Richmond
| Characteristic | Without Mortgage | With Mortgage |
| Housing Units | 24 | 135 |
| Median Property Value | - | - |
| Median Household Income | - | - |
| Monthly Housing Costs | - | - |
| Real Estate Taxes | - | - |
Property Value by Mortgage Status in Richmond
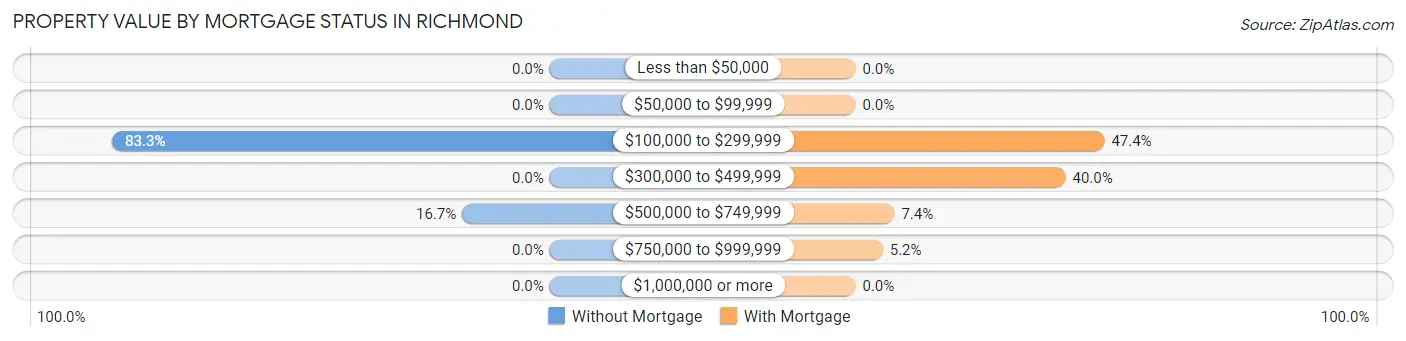
| Property Value | Without Mortgage | With Mortgage |
| Less than $50,000 | 0 (0.0%) | 0 (0.0%) |
| $50,000 to $99,999 | 0 (0.0%) | 0 (0.0%) |
| $100,000 to $299,999 | 20 (83.3%) | 64 (47.4%) |
| $300,000 to $499,999 | 0 (0.0%) | 54 (40.0%) |
| $500,000 to $749,999 | 4 (16.7%) | 10 (7.4%) |
| $750,000 to $999,999 | 0 (0.0%) | 7 (5.2%) |
| $1,000,000 or more | 0 (0.0%) | 0 (0.0%) |
| Total | 24 (100.0%) | 135 (100.0%) |
Household Income by Mortgage Status in Richmond
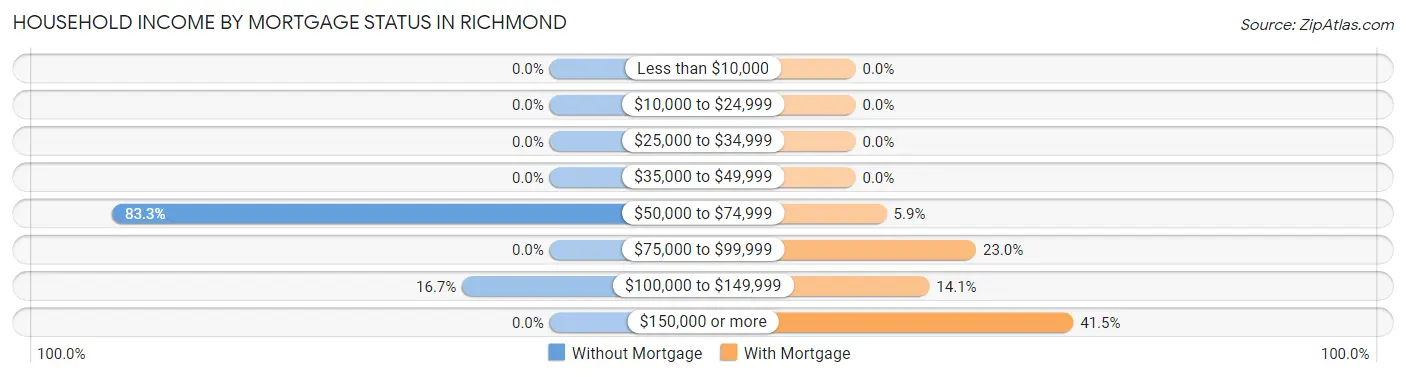
| Household Income | Without Mortgage | With Mortgage |
| Less than $10,000 | 0 (0.0%) | 0 (0.0%) |
| $10,000 to $24,999 | 0 (0.0%) | 0 (0.0%) |
| $25,000 to $34,999 | 0 (0.0%) | 0 (0.0%) |
| $35,000 to $49,999 | 0 (0.0%) | 0 (0.0%) |
| $50,000 to $74,999 | 20 (83.3%) | 8 (5.9%) |
| $75,000 to $99,999 | 0 (0.0%) | 31 (23.0%) |
| $100,000 to $149,999 | 4 (16.7%) | 19 (14.1%) |
| $150,000 or more | 0 (0.0%) | 56 (41.5%) |
| Total | 24 (100.0%) | 135 (100.0%) |
Property Value to Household Income Ratio in Richmond
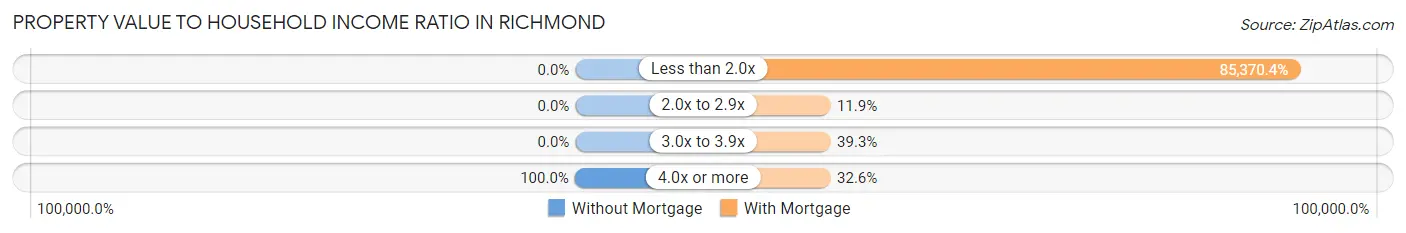
| Value-to-Income Ratio | Without Mortgage | With Mortgage |
| Less than 2.0x | 0 (0.0%) | 115,250 (85,370.4%) |
| 2.0x to 2.9x | 0 (0.0%) | 16 (11.8%) |
| 3.0x to 3.9x | 0 (0.0%) | 53 (39.3%) |
| 4.0x or more | 24 (100.0%) | 44 (32.6%) |
| Total | 24 (100.0%) | 135 (100.0%) |
Real Estate Taxes by Mortgage Status in Richmond
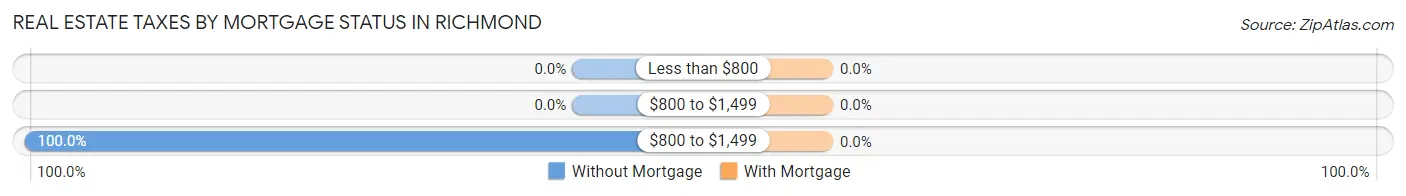
| Property Taxes | Without Mortgage | With Mortgage |
| Less than $800 | 0 (0.0%) | 0 (0.0%) |
| $800 to $1,499 | 0 (0.0%) | 0 (0.0%) |
| $800 to $1,499 | 24 (100.0%) | 0 (0.0%) |
| Total | 24 (100.0%) | 135 (100.0%) |
Health & Disability in Richmond
Health Insurance Coverage by Age in Richmond
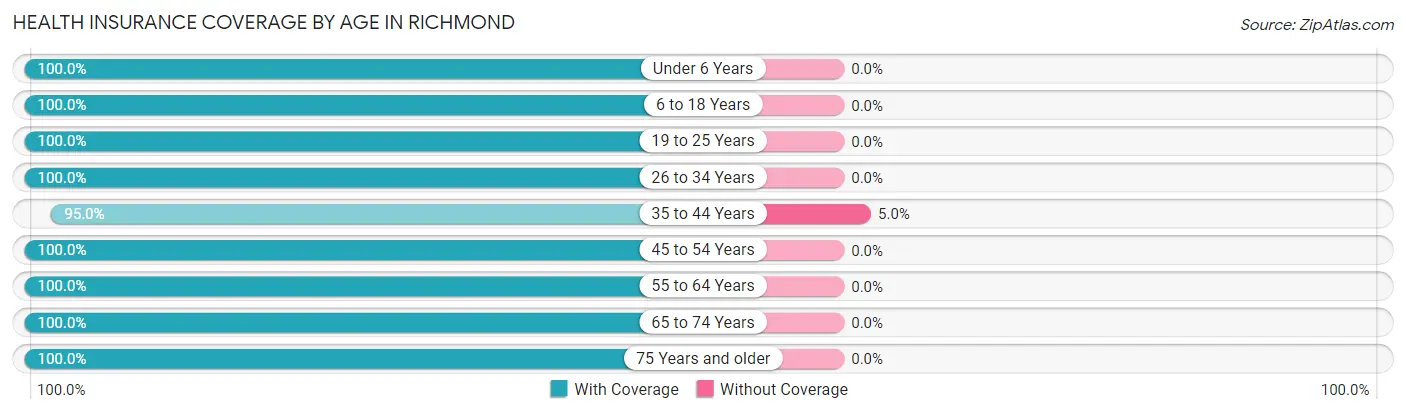
| Age Bracket | With Coverage | Without Coverage |
| Under 6 Years | 40 (100.0%) | 0 (0.0%) |
| 6 to 18 Years | 124 (100.0%) | 0 (0.0%) |
| 19 to 25 Years | 7 (100.0%) | 0 (0.0%) |
| 26 to 34 Years | 142 (100.0%) | 0 (0.0%) |
| 35 to 44 Years | 114 (95.0%) | 6 (5.0%) |
| 45 to 54 Years | 108 (100.0%) | 0 (0.0%) |
| 55 to 64 Years | 74 (100.0%) | 0 (0.0%) |
| 65 to 74 Years | 64 (100.0%) | 0 (0.0%) |
| 75 Years and older | 10 (100.0%) | 0 (0.0%) |
| Total | 683 (99.1%) | 6 (0.9%) |
Health Insurance Coverage by Citizenship Status in Richmond
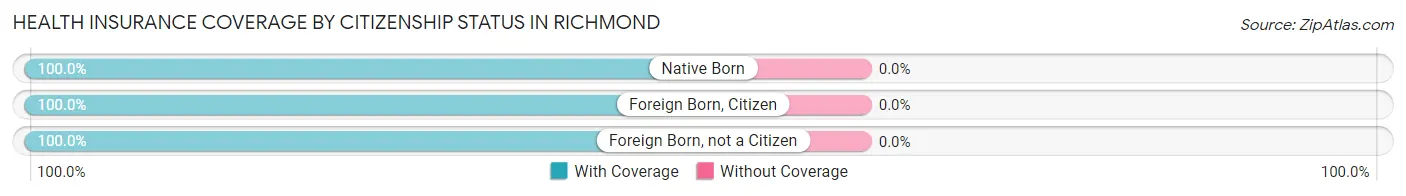
| Citizenship Status | With Coverage | Without Coverage |
| Native Born | 40 (100.0%) | 0 (0.0%) |
| Foreign Born, Citizen | 124 (100.0%) | 0 (0.0%) |
| Foreign Born, not a Citizen | 7 (100.0%) | 0 (0.0%) |
Health Insurance Coverage by Household Income in Richmond
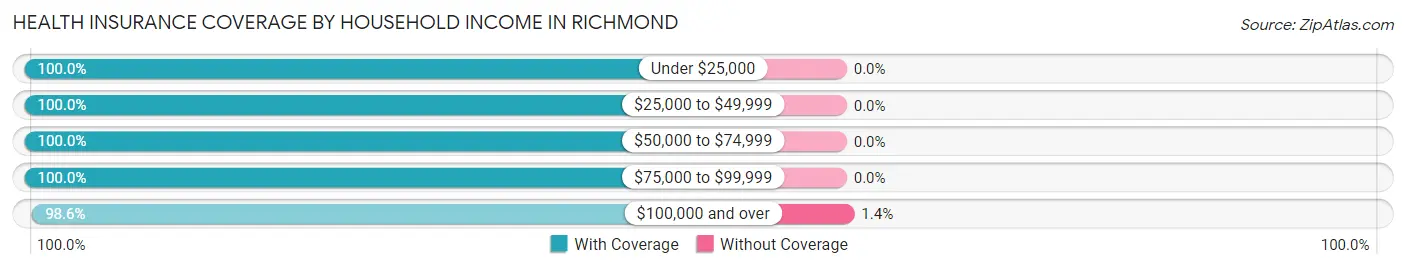
| Household Income | With Coverage | Without Coverage |
| Under $25,000 | 19 (100.0%) | 0 (0.0%) |
| $25,000 to $49,999 | 126 (100.0%) | 0 (0.0%) |
| $50,000 to $74,999 | 69 (100.0%) | 0 (0.0%) |
| $75,000 to $99,999 | 54 (100.0%) | 0 (0.0%) |
| $100,000 and over | 415 (98.6%) | 6 (1.4%) |
Public vs Private Health Insurance Coverage by Age in Richmond
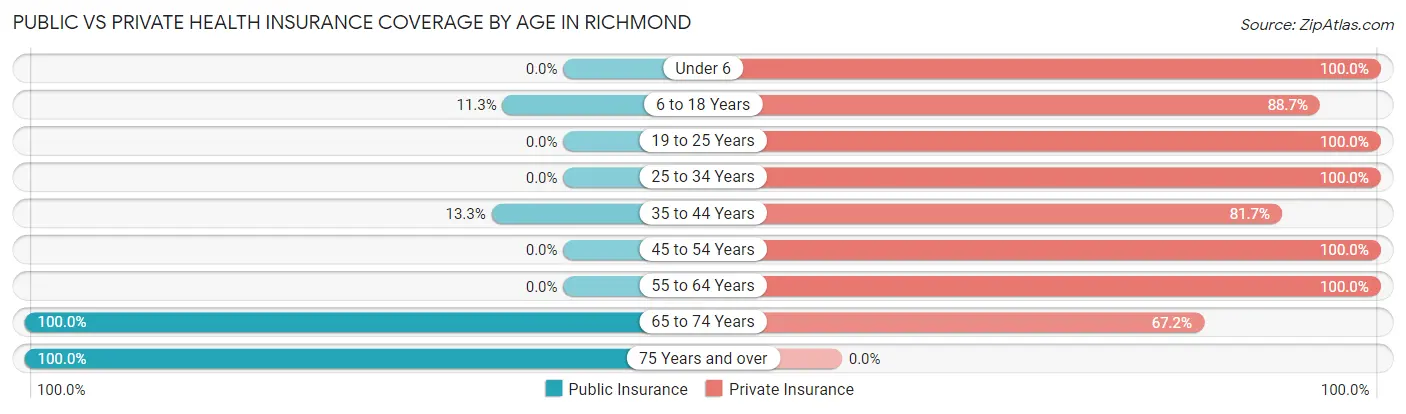
| Age Bracket | Public Insurance | Private Insurance |
| Under 6 | 0 (0.0%) | 40 (100.0%) |
| 6 to 18 Years | 14 (11.3%) | 110 (88.7%) |
| 19 to 25 Years | 0 (0.0%) | 7 (100.0%) |
| 25 to 34 Years | 0 (0.0%) | 142 (100.0%) |
| 35 to 44 Years | 16 (13.3%) | 98 (81.7%) |
| 45 to 54 Years | 0 (0.0%) | 108 (100.0%) |
| 55 to 64 Years | 0 (0.0%) | 74 (100.0%) |
| 65 to 74 Years | 64 (100.0%) | 43 (67.2%) |
| 75 Years and over | 10 (100.0%) | 0 (0.0%) |
| Total | 104 (15.1%) | 622 (90.3%) |
Disability Status by Sex by Age in Richmond
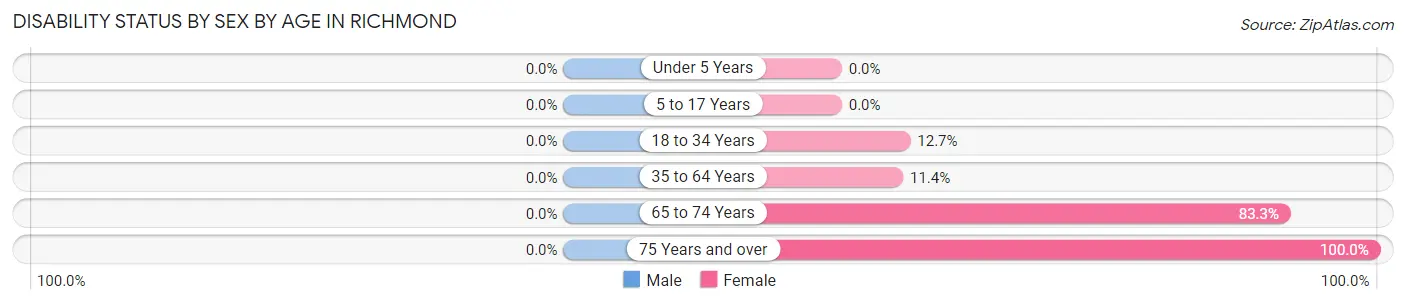
| Age Bracket | Male | Female |
| Under 5 Years | 0 (0.0%) | 0 (0.0%) |
| 5 to 17 Years | 0 (0.0%) | 0 (0.0%) |
| 18 to 34 Years | 0 (0.0%) | 7 (12.7%) |
| 35 to 64 Years | 0 (0.0%) | 24 (11.4%) |
| 65 to 74 Years | 0 (0.0%) | 30 (83.3%) |
| 75 Years and over | 0 (0.0%) | 10 (100.0%) |
Disability Class by Sex by Age in Richmond
Disability Class: Hearing Difficulty
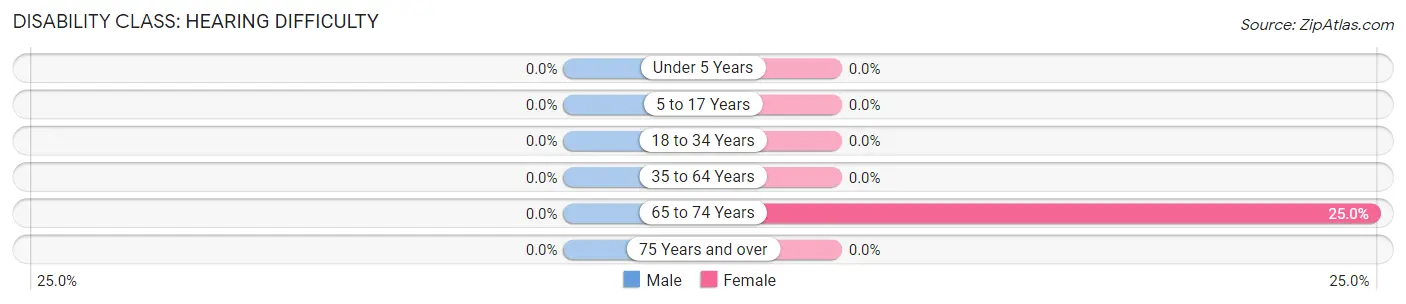
| Age Bracket | Male | Female |
| Under 5 Years | 0 (0.0%) | 0 (0.0%) |
| 5 to 17 Years | 0 (0.0%) | 0 (0.0%) |
| 18 to 34 Years | 0 (0.0%) | 0 (0.0%) |
| 35 to 64 Years | 0 (0.0%) | 0 (0.0%) |
| 65 to 74 Years | 0 (0.0%) | 9 (25.0%) |
| 75 Years and over | 0 (0.0%) | 0 (0.0%) |
Disability Class: Vision Difficulty
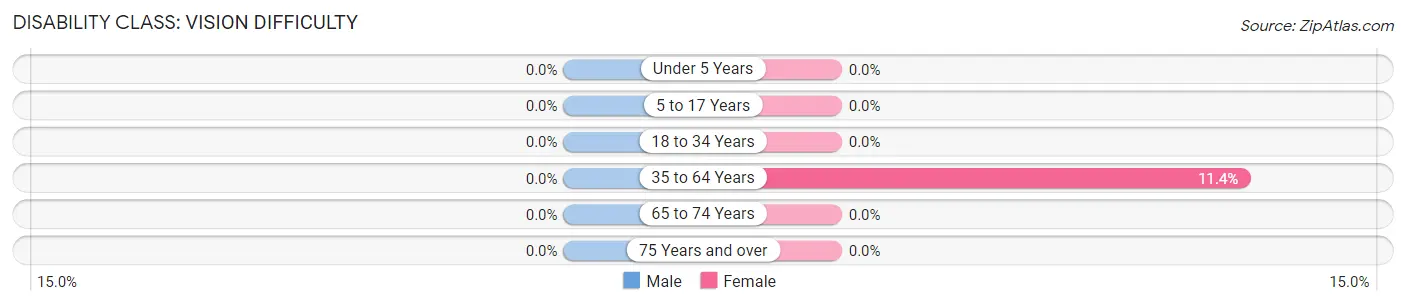
| Age Bracket | Male | Female |
| Under 5 Years | 0 (0.0%) | 0 (0.0%) |
| 5 to 17 Years | 0 (0.0%) | 0 (0.0%) |
| 18 to 34 Years | 0 (0.0%) | 0 (0.0%) |
| 35 to 64 Years | 0 (0.0%) | 24 (11.4%) |
| 65 to 74 Years | 0 (0.0%) | 0 (0.0%) |
| 75 Years and over | 0 (0.0%) | 0 (0.0%) |
Disability Class: Cognitive Difficulty
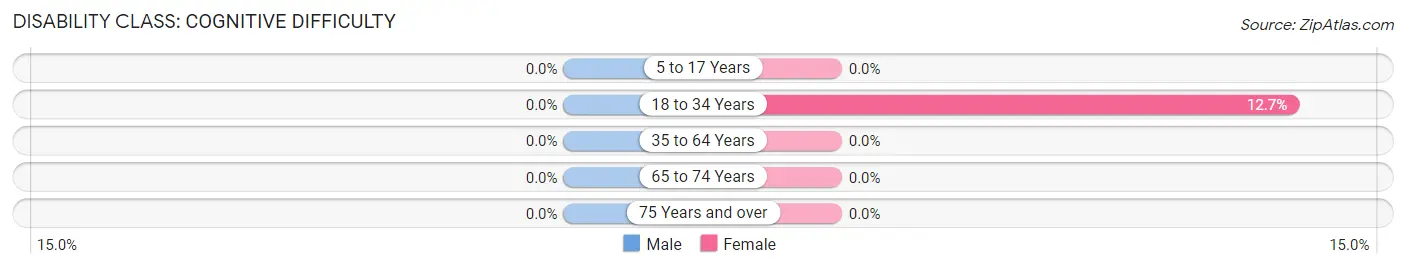
| Age Bracket | Male | Female |
| 5 to 17 Years | 0 (0.0%) | 0 (0.0%) |
| 18 to 34 Years | 0 (0.0%) | 7 (12.7%) |
| 35 to 64 Years | 0 (0.0%) | 0 (0.0%) |
| 65 to 74 Years | 0 (0.0%) | 0 (0.0%) |
| 75 Years and over | 0 (0.0%) | 0 (0.0%) |
Disability Class: Ambulatory Difficulty
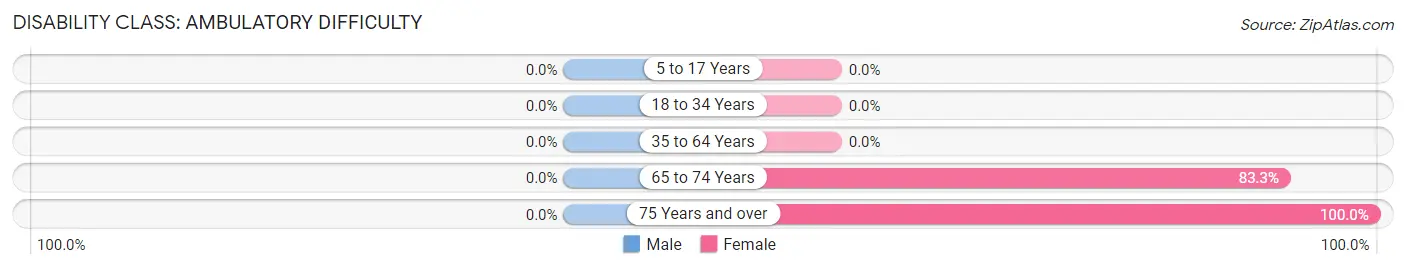
| Age Bracket | Male | Female |
| 5 to 17 Years | 0 (0.0%) | 0 (0.0%) |
| 18 to 34 Years | 0 (0.0%) | 0 (0.0%) |
| 35 to 64 Years | 0 (0.0%) | 0 (0.0%) |
| 65 to 74 Years | 0 (0.0%) | 30 (83.3%) |
| 75 Years and over | 0 (0.0%) | 10 (100.0%) |
Disability Class: Self-Care Difficulty
| Age Bracket | Male | Female |
| 5 to 17 Years | 0 (0.0%) | 0 (0.0%) |
| 18 to 34 Years | 0 (0.0%) | 0 (0.0%) |
| 35 to 64 Years | 0 (0.0%) | 0 (0.0%) |
| 65 to 74 Years | 0 (0.0%) | 0 (0.0%) |
| 75 Years and over | 0 (0.0%) | 0 (0.0%) |
Technology Access in Richmond
Computing Device Access in Richmond
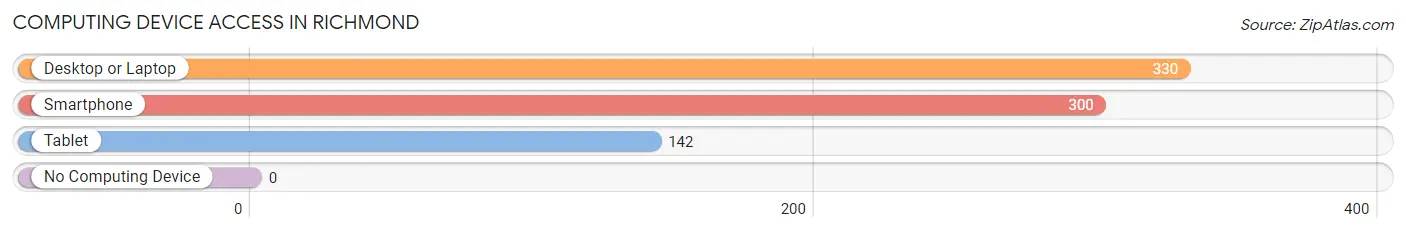
| Device Type | # Households | % Households |
| Desktop or Laptop | 330 | 100.0% |
| Smartphone | 300 | 90.9% |
| Tablet | 142 | 43.0% |
| No Computing Device | 0 | 0.0% |
| Total | 330 | 100.0% |
Internet Access in Richmond
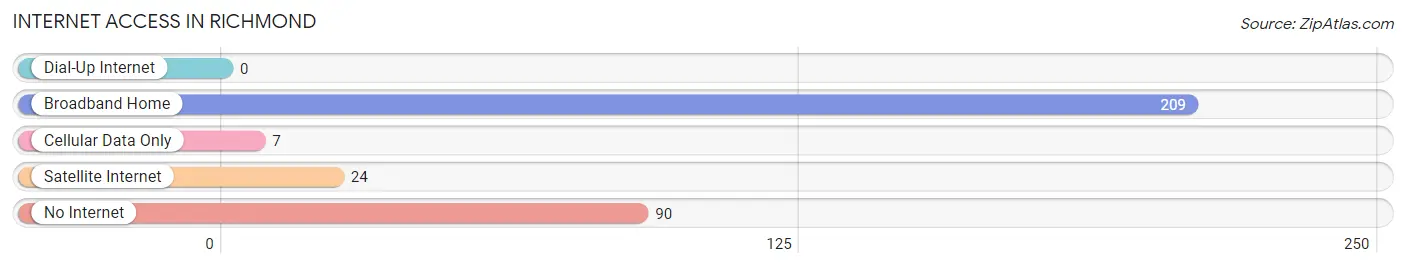
| Internet Type | # Households | % Households |
| Dial-Up Internet | 0 | 0.0% |
| Broadband Home | 209 | 63.3% |
| Cellular Data Only | 7 | 2.1% |
| Satellite Internet | 24 | 7.3% |
| No Internet | 90 | 27.3% |
| Total | 330 | 100.0% |
Richmond Summary
Richmond, Vermont is a small town located in Chittenden County, in the northwestern part of the state. It is situated on the Winooski River, and is bordered by the towns of Bolton, Jericho, Underhill, and Williston. The town has a population of 4,081 as of the 2010 census, and is part of the Burlington-South Burlington metropolitan area.
History
Richmond was first settled in 1775 by a group of settlers from Massachusetts. The town was originally known as “Pocock”, after the first settler, John Pocock. The town was renamed “Richmond” in 1790, after the Duke of Richmond, who was a British nobleman. The town was incorporated in 1794.
In the 19th century, Richmond was an agricultural community, with a variety of crops being grown, including wheat, corn, potatoes, and hay. The town also had several mills, including a sawmill, gristmill, and a woolen mill.
In the late 19th century, Richmond began to develop as a tourist destination, with several hotels and resorts being built in the area. The town also became a popular summer retreat for wealthy families from New York City and Boston.
Geography
Richmond is located in northwestern Vermont, in Chittenden County. The town is situated on the Winooski River, and is bordered by the towns of Bolton, Jericho, Underhill, and Williston. The town has a total area of 24.2 square miles, of which 24.1 square miles is land and 0.1 square miles is water.
The town is located in the Green Mountains, and is home to several mountains, including Mount Hunger, Mount Tom, and Mount Mansfield. The highest point in the town is the summit of Mount Hunger, which has an elevation of 2,890 feet.
Economy
Richmond’s economy is largely based on tourism and agriculture. The town is home to several ski resorts, including Bolton Valley Resort, Sugarbush Resort, and Stowe Mountain Resort. The town also has several farms, which produce a variety of crops, including apples, corn, hay, and potatoes.
The town is also home to several businesses, including a brewery, a winery, and several restaurants. The town also has several retail stores, including a grocery store, a hardware store, and a pharmacy.
Demographics
As of the 2010 census, Richmond had a population of 4,081. The racial makeup of the town was 97.2% White, 0.7% African American, 0.3% Native American, 0.4% Asian, 0.1% Pacific Islander, 0.2% from other races, and 1.1% from two or more races. Hispanic or Latino of any race were 1.2% of the population.
The median household income in Richmond was $60,938, and the median family income was $71,250. The per capita income for the town was $30,945. About 4.2% of families and 5.7% of the population were below the poverty line, including 6.3% of those under age 18 and 4.2% of those age 65 or over.
Common Questions
What is Per Capita Income in Richmond?
Per Capita income in Richmond is $50,444.
What is the Median Family Income in Richmond?
Median Family Income in Richmond is $119,545.
What is the Median Household income in Richmond?
Median Household Income in Richmond is $59,960.
What is Income or Wage Gap in Richmond?
Income or Wage Gap in Richmond is 35.7%.
Women in Richmond earn 64.3 cents for every dollar earned by a man.
What is Inequality or Gini Index in Richmond?
Inequality or Gini Index in Richmond is 0.36.
What is the Total Population of Richmond?
Total Population of Richmond is 689.
What is the Total Male Population of Richmond?
Total Male Population of Richmond is 335.
What is the Total Female Population of Richmond?
Total Female Population of Richmond is 354.
What is the Ratio of Males per 100 Females in Richmond?
There are 94.63 Males per 100 Females in Richmond.
What is the Ratio of Females per 100 Males in Richmond?
There are 105.67 Females per 100 Males in Richmond.
What is the Median Population Age in Richmond?
Median Population Age in Richmond is 35.8 Years.
What is the Average Family Size in Richmond
Average Family Size in Richmond is 2.6 People.
What is the Average Household Size in Richmond
Average Household Size in Richmond is 2.1 People.
How Large is the Labor Force in Richmond?
There are 462 People in the Labor Forcein in Richmond.
What is the Percentage of People in the Labor Force in Richmond?
84.9% of People are in the Labor Force in Richmond.