Manchester, VT Map & Demographics
Manchester Map
Manchester Overview
$37,105
PER CAPITA INCOME
$88,000
AVG FAMILY INCOME
$33,750
AVG HOUSEHOLD INCOME
0.58
INEQUALITY / GINI INDEX
703
TOTAL POPULATION
323
MALE POPULATION
380
FEMALE POPULATION
85.00
MALES / 100 FEMALES
117.65
FEMALES / 100 MALES
63.8
MEDIAN AGE
2.9
AVG FAMILY SIZE
1.8
AVG HOUSEHOLD SIZE
220
LABOR FORCE [ PEOPLE ]
32.4%
PERCENT IN LABOR FORCE
Manchester Zip Codes
Manchester Area Codes
Income in Manchester
Income Overview in Manchester
Per Capita Income in Manchester is $37,105, while median incomes of families and households are $88,000 and $33,750 respectively.
| Characteristic | Number | Measure |
| Per Capita Income | 703 | $37,105 |
| Median Family Income | 138 | $88,000 |
| Mean Family Income | 138 | $113,207 |
| Median Household Income | 370 | $33,750 |
| Mean Household Income | 370 | $67,738 |
| Income Deficit | 138 | $0 |
| Wage / Income Gap (%) | 703 | 0.00% |
| Wage / Income Gap ($) | 703 | 100.00¢ per $1 |
| Gini / Inequality Index | 703 | 0.58 |
Earnings by Sex in Manchester
| Sex | Number | Average Earnings |
| Male | 121 (51.0%) | $0 |
| Female | 116 (48.9%) | $0 |
| Total | 237 (100.0%) | $0 |
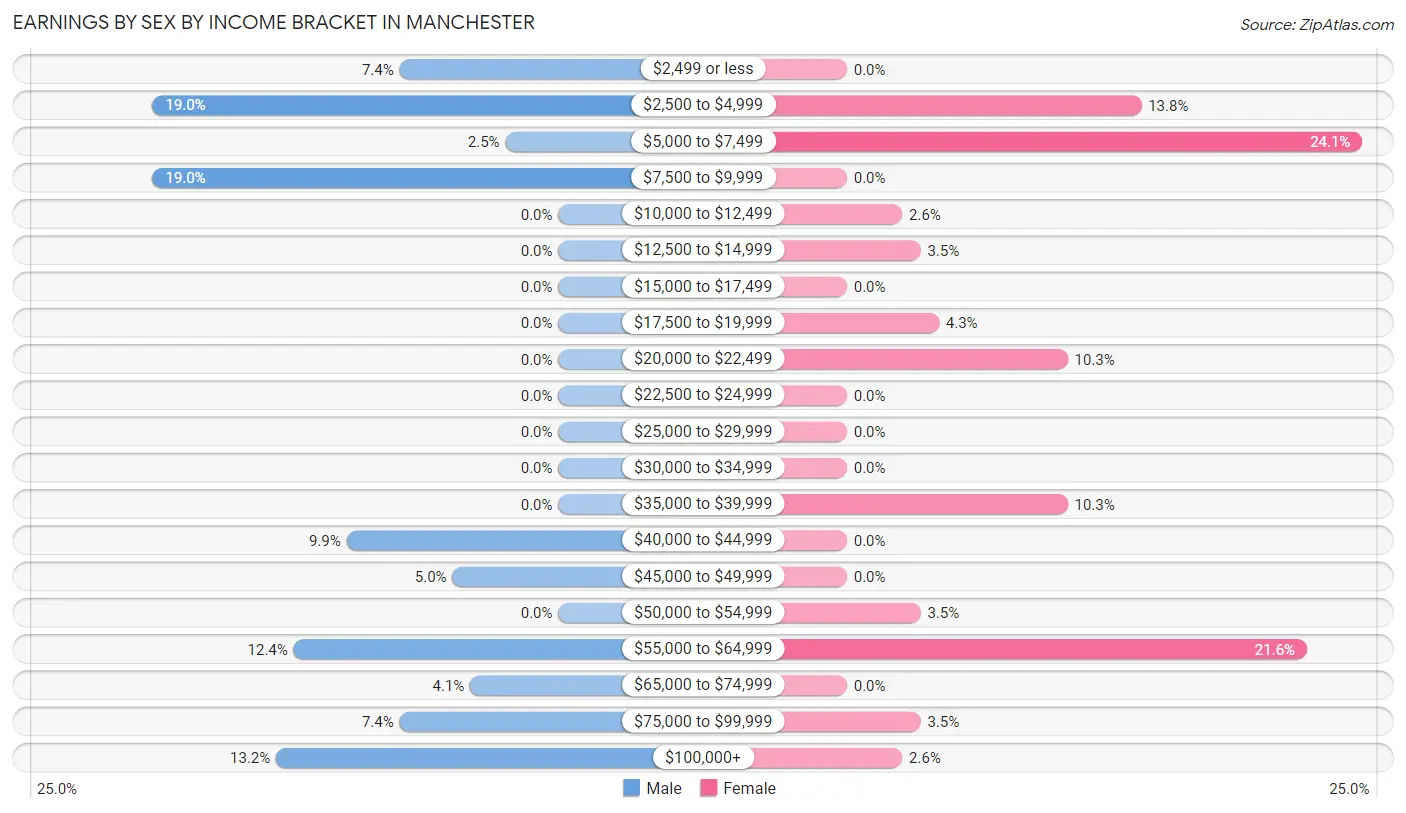
Earnings by Sex by Income Bracket in Manchester
The most common earnings brackets in Manchester are $2,500 to $4,999 for men (23 | 19.0%) and $5,000 to $7,499 for women (28 | 24.1%).
| Income | Male | Female |
| $2,499 or less | 9 (7.4%) | 0 (0.0%) |
| $2,500 to $4,999 | 23 (19.0%) | 16 (13.8%) |
| $5,000 to $7,499 | 3 (2.5%) | 28 (24.1%) |
| $7,500 to $9,999 | 23 (19.0%) | 0 (0.0%) |
| $10,000 to $12,499 | 0 (0.0%) | 3 (2.6%) |
| $12,500 to $14,999 | 0 (0.0%) | 4 (3.5%) |
| $15,000 to $17,499 | 0 (0.0%) | 0 (0.0%) |
| $17,500 to $19,999 | 0 (0.0%) | 5 (4.3%) |
| $20,000 to $22,499 | 0 (0.0%) | 12 (10.3%) |
| $22,500 to $24,999 | 0 (0.0%) | 0 (0.0%) |
| $25,000 to $29,999 | 0 (0.0%) | 0 (0.0%) |
| $30,000 to $34,999 | 0 (0.0%) | 0 (0.0%) |
| $35,000 to $39,999 | 0 (0.0%) | 12 (10.3%) |
| $40,000 to $44,999 | 12 (9.9%) | 0 (0.0%) |
| $45,000 to $49,999 | 6 (5.0%) | 0 (0.0%) |
| $50,000 to $54,999 | 0 (0.0%) | 4 (3.5%) |
| $55,000 to $64,999 | 15 (12.4%) | 25 (21.5%) |
| $65,000 to $74,999 | 5 (4.1%) | 0 (0.0%) |
| $75,000 to $99,999 | 9 (7.4%) | 4 (3.5%) |
| $100,000+ | 16 (13.2%) | 3 (2.6%) |
| Total | 121 (100.0%) | 116 (100.0%) |
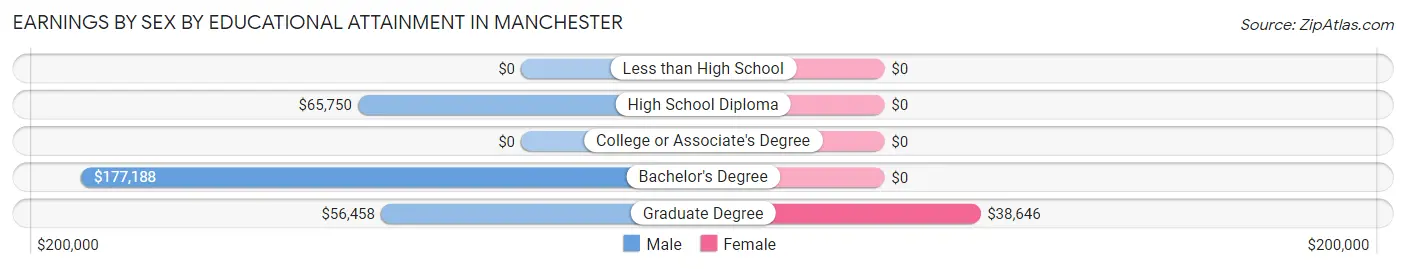
Earnings by Sex by Educational Attainment in Manchester
| Educational Attainment | Male Income | Female Income |
| Less than High School | - | - |
| High School Diploma | $65,750 | $0 |
| College or Associate's Degree | - | - |
| Bachelor's Degree | $177,188 | $0 |
| Graduate Degree | $56,458 | $38,646 |
| Total | $62,917 | $0 |
Family Income in Manchester
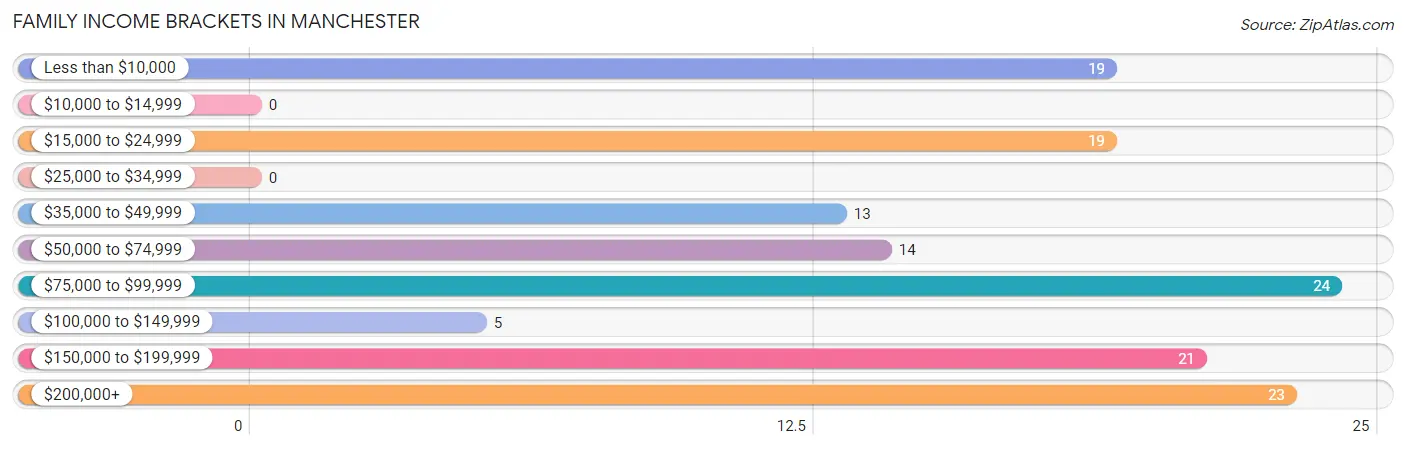
Family Income Brackets in Manchester
According to the Manchester family income data, there are 24 families falling into the $75,000 to $99,999 income range, which is the most common income bracket and makes up 17.4% of all families.
| Income Bracket | # Families | % Families |
| Less than $10,000 | 19 | 13.8% |
| $10,000 to $14,999 | 0 | 0.0% |
| $15,000 to $24,999 | 19 | 13.8% |
| $25,000 to $34,999 | 0 | 0.0% |
| $35,000 to $49,999 | 13 | 9.4% |
| $50,000 to $74,999 | 14 | 10.1% |
| $75,000 to $99,999 | 24 | 17.4% |
| $100,000 to $149,999 | 5 | 3.6% |
| $150,000 to $199,999 | 21 | 15.2% |
| $200,000+ | 23 | 16.7% |
Family Income by Famaliy Size in Manchester
| Income Bracket | # Families | Median Income |
| 2-Person Families | 108 (78.3%) | $0 |
| 3-Person Families | 9 (6.5%) | $0 |
| 4-Person Families | 15 (10.9%) | $0 |
| 5-Person Families | 6 (4.3%) | $0 |
| 6-Person Families | 0 (0.0%) | $0 |
| 7+ Person Families | 0 (0.0%) | $0 |
| Total | 138 (100.0%) | $88,000 |
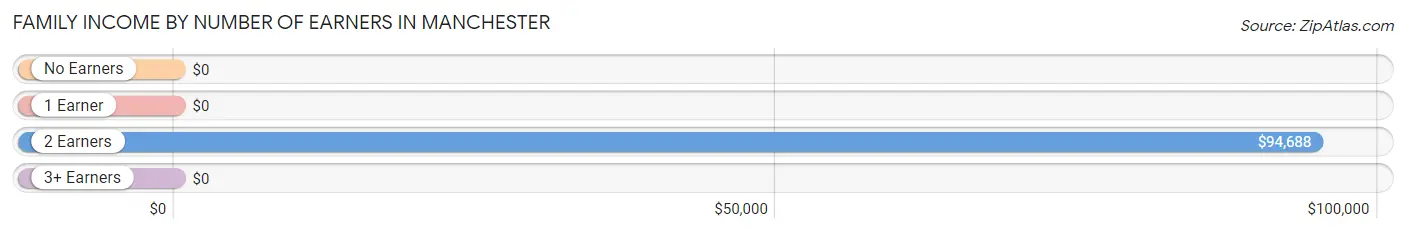
Family Income by Number of Earners in Manchester
| Number of Earners | # Families | Median Income |
| No Earners | 73 (52.9%) | $0 |
| 1 Earner | 24 (17.4%) | $0 |
| 2 Earners | 29 (21.0%) | $94,688 |
| 3+ Earners | 12 (8.7%) | $0 |
| Total | 138 (100.0%) | $88,000 |
Household Income in Manchester
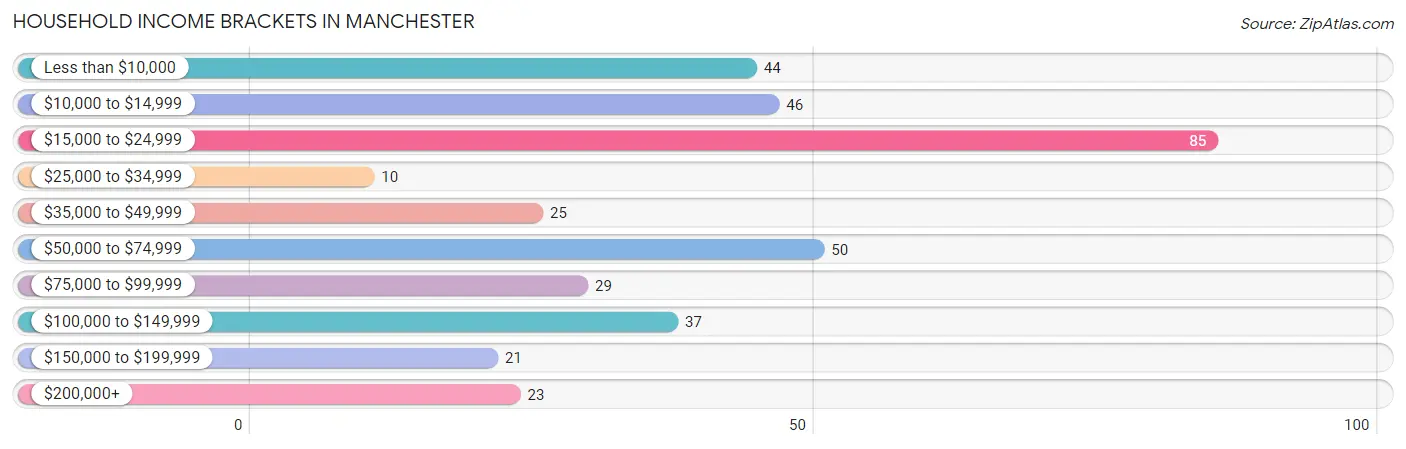
Household Income Brackets in Manchester
With 85 households falling in the category, the $15,000 to $24,999 income range is the most frequent in Manchester, accounting for 23.0% of all households. In contrast, only 10 households (2.7%) fall into the $25,000 to $34,999 income bracket, making it the least populous group.
| Income Bracket | # Households | % Households |
| Less than $10,000 | 44 | 11.9% |
| $10,000 to $14,999 | 46 | 12.4% |
| $15,000 to $24,999 | 85 | 23.0% |
| $25,000 to $34,999 | 10 | 2.7% |
| $35,000 to $49,999 | 25 | 6.8% |
| $50,000 to $74,999 | 50 | 13.5% |
| $75,000 to $99,999 | 29 | 7.8% |
| $100,000 to $149,999 | 37 | 10.0% |
| $150,000 to $199,999 | 21 | 5.7% |
| $200,000+ | 23 | 6.2% |
Household Income by Householder Age in Manchester
The median household income in Manchester is $33,750, with the highest median household income of $69,050 found in the 45 to 64 years age bracket for the primary householder. A total of 117 households (31.6%) fall into this category.
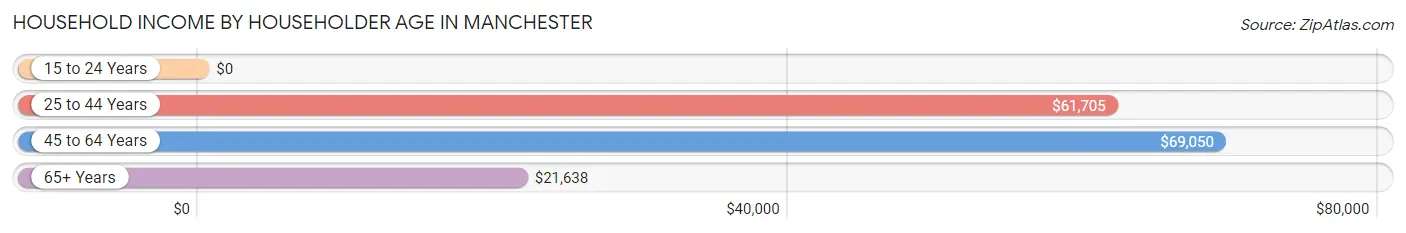
| Income Bracket | # Households | Median Income |
| 15 to 24 Years | 0 (0.0%) | $0 |
| 25 to 44 Years | 21 (5.7%) | $61,705 |
| 45 to 64 Years | 117 (31.6%) | $69,050 |
| 65+ Years | 232 (62.7%) | $21,638 |
| Total | 370 (100.0%) | $33,750 |
Poverty in Manchester
Income Below Poverty by Sex and Age in Manchester
With 26.3% poverty level for males and 15.7% for females among the residents of Manchester, 55 to 64 year old males and 75 year old and over females are the most vulnerable to poverty, with 50 males (74.6%) and 26 females (17.4%) in their respective age groups living below the poverty level.
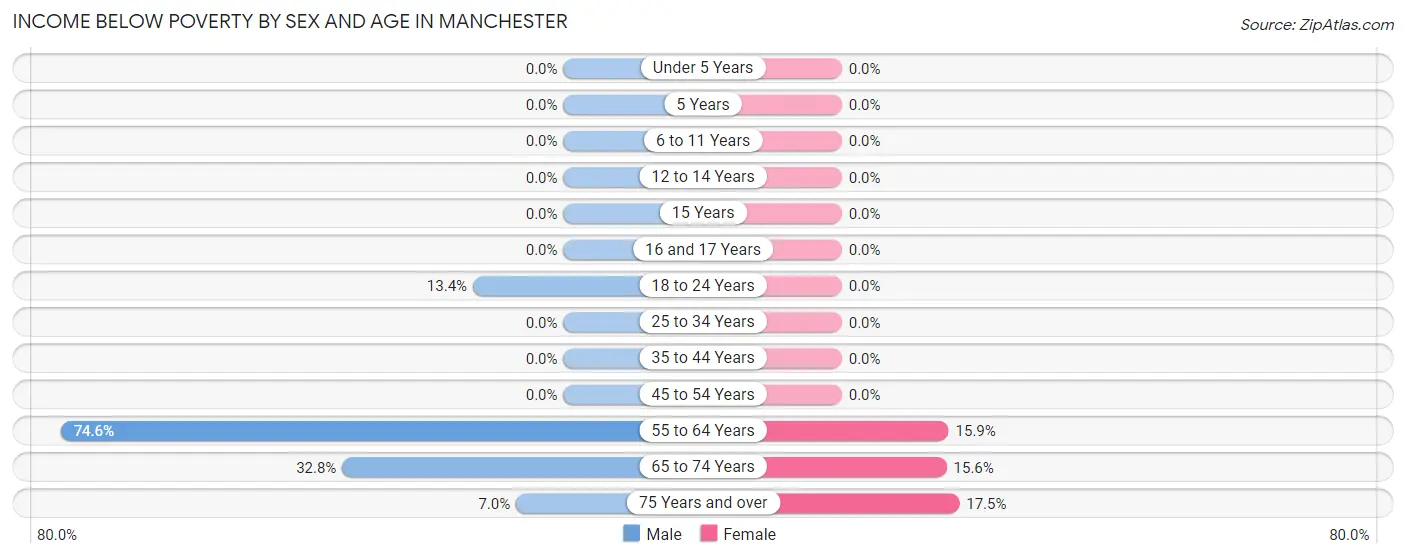
| Age Bracket | Male | Female |
| Under 5 Years | 0 (0.0%) | 0 (0.0%) |
| 5 Years | 0 (0.0%) | 0 (0.0%) |
| 6 to 11 Years | 0 (0.0%) | 0 (0.0%) |
| 12 to 14 Years | 0 (0.0%) | 0 (0.0%) |
| 15 Years | 0 (0.0%) | 0 (0.0%) |
| 16 and 17 Years | 0 (0.0%) | 0 (0.0%) |
| 18 to 24 Years | 9 (13.4%) | 0 (0.0%) |
| 25 to 34 Years | 0 (0.0%) | 0 (0.0%) |
| 35 to 44 Years | 0 (0.0%) | 0 (0.0%) |
| 45 to 54 Years | 0 (0.0%) | 0 (0.0%) |
| 55 to 64 Years | 50 (74.6%) | 23 (15.9%) |
| 65 to 74 Years | 22 (32.8%) | 7 (15.6%) |
| 75 Years and over | 4 (7.0%) | 26 (17.4%) |
| Total | 85 (26.3%) | 56 (15.7%) |
Income Above Poverty by Sex and Age in Manchester
According to the poverty statistics in Manchester, males aged under 5 years and females aged 35 to 44 years are the age groups that are most secure financially, with 100.0% of males and 100.0% of females in these age groups living above the poverty line.
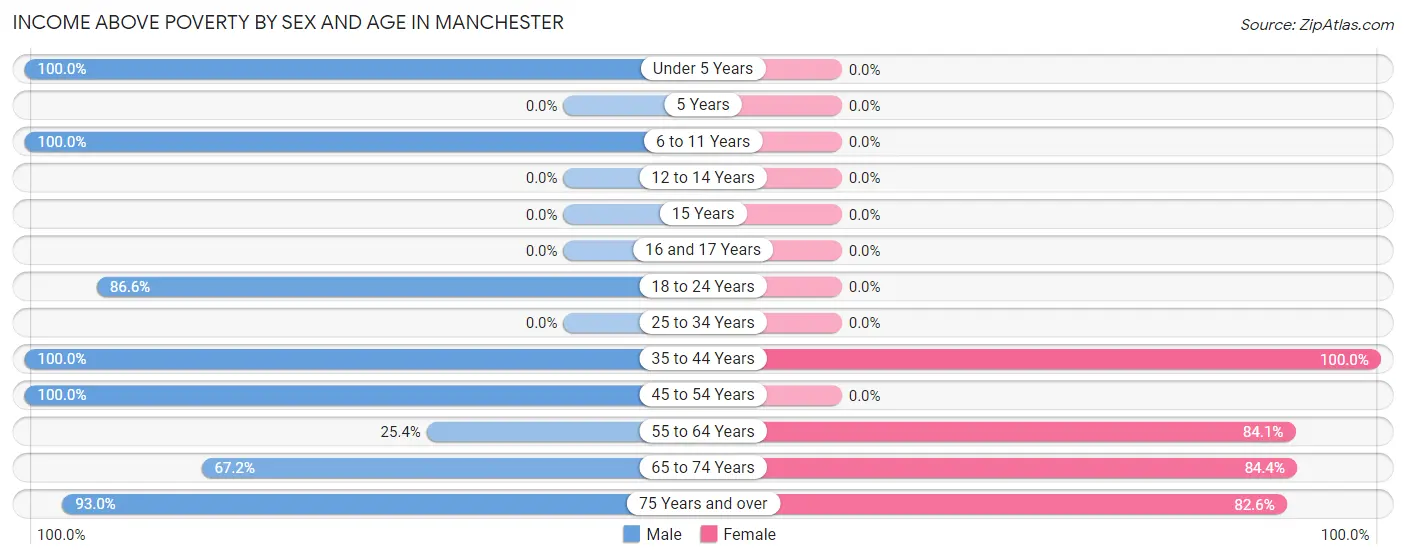
| Age Bracket | Male | Female |
| Under 5 Years | 6 (100.0%) | 0 (0.0%) |
| 5 Years | 0 (0.0%) | 0 (0.0%) |
| 6 to 11 Years | 19 (100.0%) | 0 (0.0%) |
| 12 to 14 Years | 0 (0.0%) | 0 (0.0%) |
| 15 Years | 0 (0.0%) | 0 (0.0%) |
| 16 and 17 Years | 0 (0.0%) | 0 (0.0%) |
| 18 to 24 Years | 58 (86.6%) | 0 (0.0%) |
| 25 to 34 Years | 0 (0.0%) | 0 (0.0%) |
| 35 to 44 Years | 21 (100.0%) | 18 (100.0%) |
| 45 to 54 Years | 19 (100.0%) | 0 (0.0%) |
| 55 to 64 Years | 17 (25.4%) | 122 (84.1%) |
| 65 to 74 Years | 45 (67.2%) | 38 (84.4%) |
| 75 Years and over | 53 (93.0%) | 123 (82.6%) |
| Total | 238 (73.7%) | 301 (84.3%) |
Income Below Poverty Among Married-Couple Families in Manchester
The poverty statistics for married-couple families in Manchester show that 16.1% or 19 of the total 118 families live below the poverty line. Families with no children have the highest poverty rate of 17.4%, comprising of 19 families. On the other hand, families with 1 or 2 children have the lowest poverty rate of 0.0%, which includes 0 families.
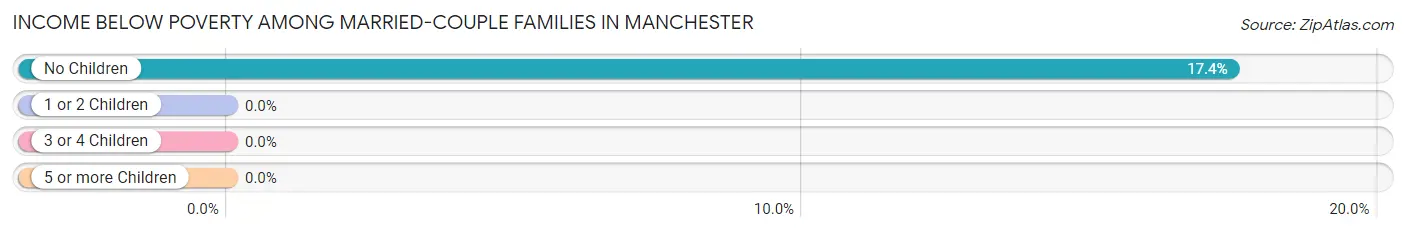
| Children | Above Poverty | Below Poverty |
| No Children | 90 (82.6%) | 19 (17.4%) |
| 1 or 2 Children | 3 (100.0%) | 0 (0.0%) |
| 3 or 4 Children | 6 (100.0%) | 0 (0.0%) |
| 5 or more Children | 0 (0.0%) | 0 (0.0%) |
| Total | 99 (83.9%) | 19 (16.1%) |
Income Below Poverty Among Single-Parent Households in Manchester
| Children | Single Father | Single Mother |
| No Children | 0 (0.0%) | 0 (0.0%) |
| 1 or 2 Children | 0 (0.0%) | 0 (0.0%) |
| 3 or 4 Children | 0 (0.0%) | 0 (0.0%) |
| 5 or more Children | 0 (0.0%) | 0 (0.0%) |
| Total | 0 (0.0%) | 0 (0.0%) |
Income Below Poverty Among Married-Couple vs Single-Parent Households in Manchester
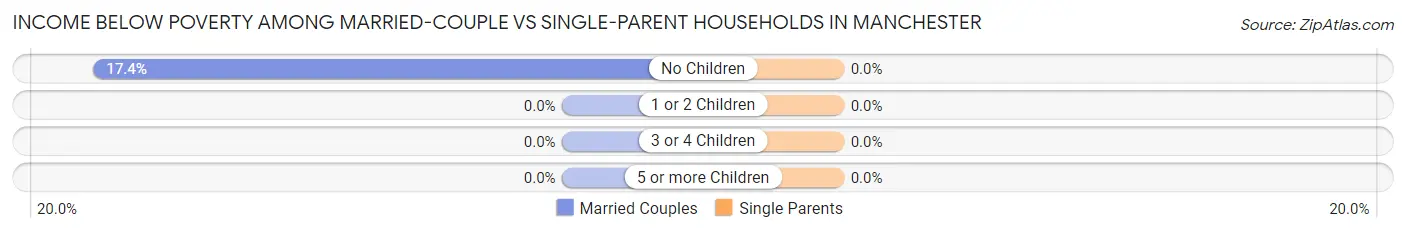
| Children | Married-Couple Families | Single-Parent Households |
| No Children | 19 (17.4%) | 0 (0.0%) |
| 1 or 2 Children | 0 (0.0%) | 0 (0.0%) |
| 3 or 4 Children | 0 (0.0%) | 0 (0.0%) |
| 5 or more Children | 0 (0.0%) | 0 (0.0%) |
| Total | 19 (16.1%) | 0 (0.0%) |
Race in Manchester
The most populous races in Manchester are White / Caucasian (652 | 92.7%), Hispanic or Latino (43 | 6.1%), and Some other Race (31 | 4.4%).
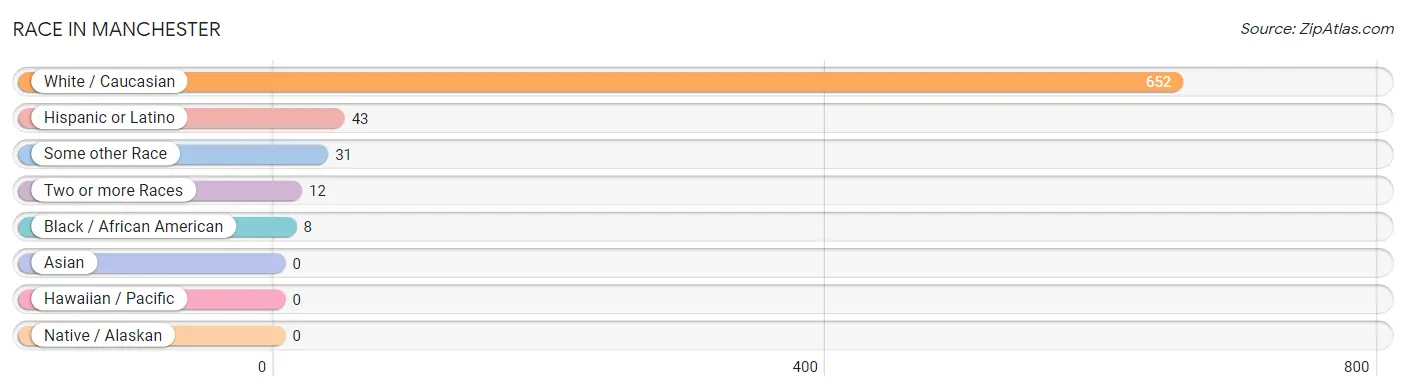
| Race | # Population | % Population |
| Asian | 0 | 0.0% |
| Black / African American | 8 | 1.1% |
| Hawaiian / Pacific | 0 | 0.0% |
| Hispanic or Latino | 43 | 6.1% |
| Native / Alaskan | 0 | 0.0% |
| White / Caucasian | 652 | 92.7% |
| Two or more Races | 12 | 1.7% |
| Some other Race | 31 | 4.4% |
| Total | 703 | 100.0% |
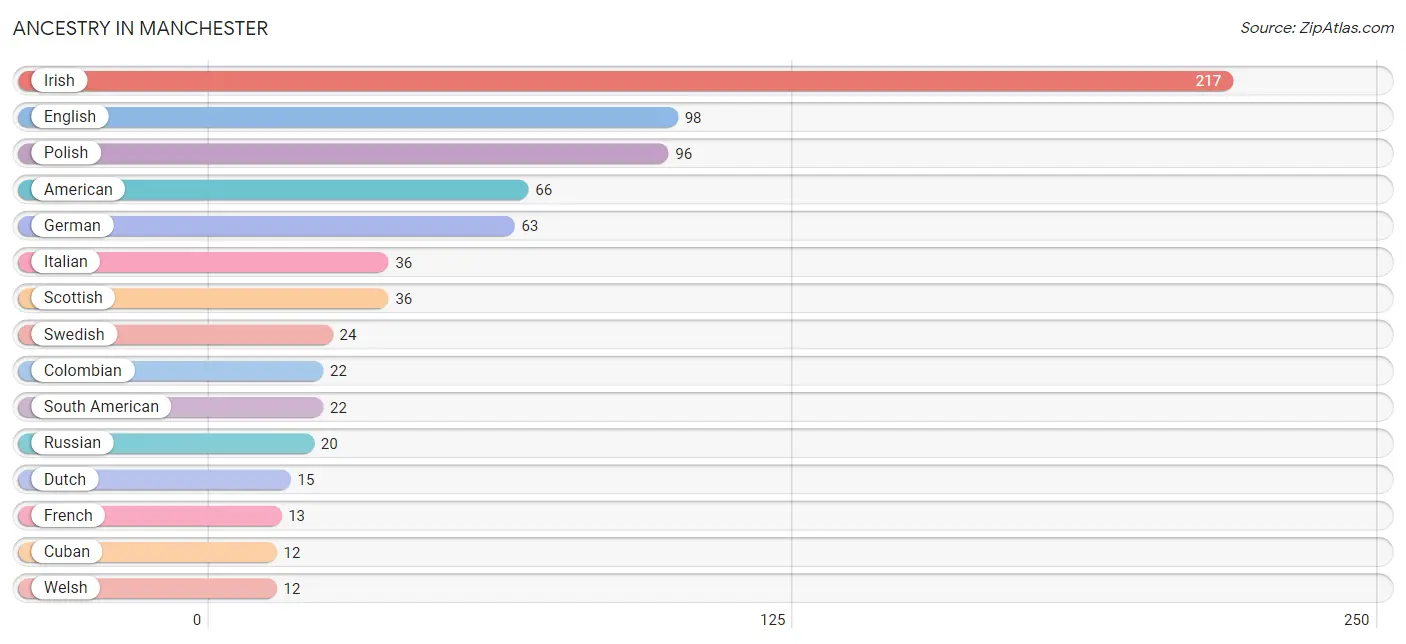
Ancestry in Manchester
The most populous ancestries reported in Manchester are Irish (217 | 30.9%), English (98 | 13.9%), Polish (96 | 13.7%), American (66 | 9.4%), and German (63 | 9.0%), together accounting for 76.8% of all Manchester residents.
| Ancestry | # Population | % Population |
| American | 66 | 9.4% |
| Austrian | 6 | 0.9% |
| British | 11 | 1.6% |
| Celtic | 3 | 0.4% |
| Central American | 9 | 1.3% |
| Colombian | 22 | 3.1% |
| Cuban | 12 | 1.7% |
| Danish | 5 | 0.7% |
| Dutch | 15 | 2.1% |
| Eastern European | 7 | 1.0% |
| English | 98 | 13.9% |
| Finnish | 4 | 0.6% |
| French | 13 | 1.8% |
| French Canadian | 6 | 0.9% |
| German | 63 | 9.0% |
| Honduran | 9 | 1.3% |
| Irish | 217 | 30.9% |
| Italian | 36 | 5.1% |
| Nigerian | 8 | 1.1% |
| Polish | 96 | 13.7% |
| Russian | 20 | 2.8% |
| Scotch-Irish | 8 | 1.1% |
| Scottish | 36 | 5.1% |
| South American | 22 | 3.1% |
| Subsaharan African | 8 | 1.1% |
| Swedish | 24 | 3.4% |
| Welsh | 12 | 1.7% | View All 27 Rows |
Immigrants in Manchester
The most numerous immigrant groups reported in Manchester came from Europe (20 | 2.8%), Central America (13 | 1.8%), Latin America (13 | 1.8%), England (12 | 1.7%), and Northern Europe (12 | 1.7%), together accounting for 10.0% of all Manchester residents.
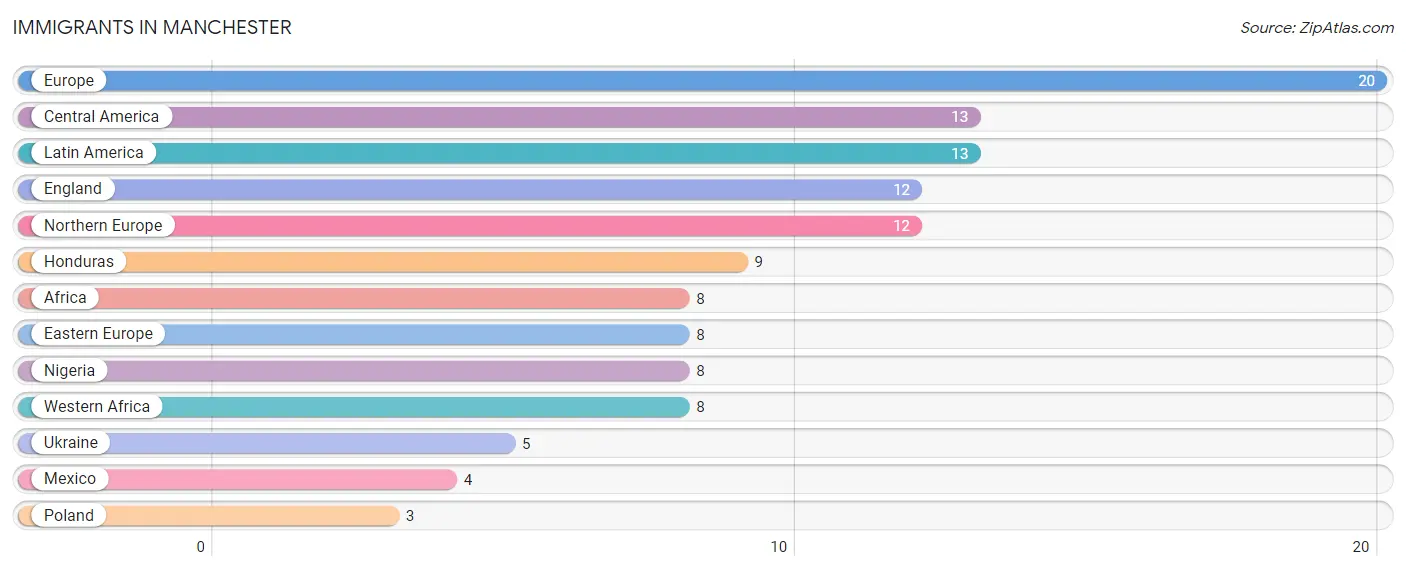
| Immigration Origin | # Population | % Population |
| Africa | 8 | 1.1% |
| Central America | 13 | 1.8% |
| Eastern Europe | 8 | 1.1% |
| England | 12 | 1.7% |
| Europe | 20 | 2.8% |
| Honduras | 9 | 1.3% |
| Latin America | 13 | 1.8% |
| Mexico | 4 | 0.6% |
| Nigeria | 8 | 1.1% |
| Northern Europe | 12 | 1.7% |
| Poland | 3 | 0.4% |
| Ukraine | 5 | 0.7% |
| Western Africa | 8 | 1.1% | View All 13 Rows |
Sex and Age in Manchester
Sex and Age in Manchester
The most populous age groups in Manchester are 15 to 19 Years (52 | 16.1%) for men and 60 to 64 Years (113 | 29.7%) for women.
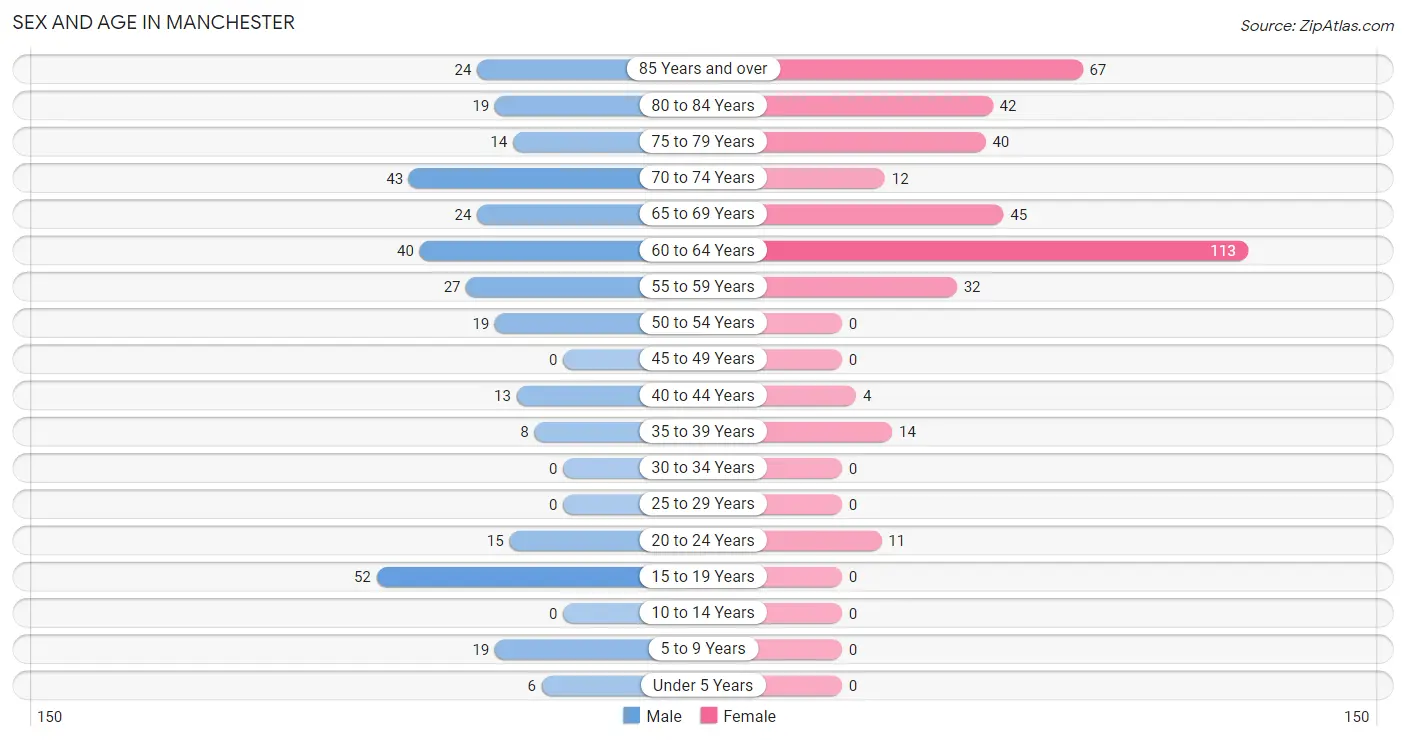
| Age Bracket | Male | Female |
| Under 5 Years | 6 (1.9%) | 0 (0.0%) |
| 5 to 9 Years | 19 (5.9%) | 0 (0.0%) |
| 10 to 14 Years | 0 (0.0%) | 0 (0.0%) |
| 15 to 19 Years | 52 (16.1%) | 0 (0.0%) |
| 20 to 24 Years | 15 (4.6%) | 11 (2.9%) |
| 25 to 29 Years | 0 (0.0%) | 0 (0.0%) |
| 30 to 34 Years | 0 (0.0%) | 0 (0.0%) |
| 35 to 39 Years | 8 (2.5%) | 14 (3.7%) |
| 40 to 44 Years | 13 (4.0%) | 4 (1.1%) |
| 45 to 49 Years | 0 (0.0%) | 0 (0.0%) |
| 50 to 54 Years | 19 (5.9%) | 0 (0.0%) |
| 55 to 59 Years | 27 (8.4%) | 32 (8.4%) |
| 60 to 64 Years | 40 (12.4%) | 113 (29.7%) |
| 65 to 69 Years | 24 (7.4%) | 45 (11.8%) |
| 70 to 74 Years | 43 (13.3%) | 12 (3.2%) |
| 75 to 79 Years | 14 (4.3%) | 40 (10.5%) |
| 80 to 84 Years | 19 (5.9%) | 42 (11.1%) |
| 85 Years and over | 24 (7.4%) | 67 (17.6%) |
| Total | 323 (100.0%) | 380 (100.0%) |
Families and Households in Manchester
Median Family Size in Manchester
The median family size in Manchester is 2.90 persons per family, with single female/mother families (14 | 10.1%) accounting for the largest median family size of 4.14 persons per family. On the other hand, single male/father families (6 | 4.3%) represent the smallest median family size with 2.67 persons per family.
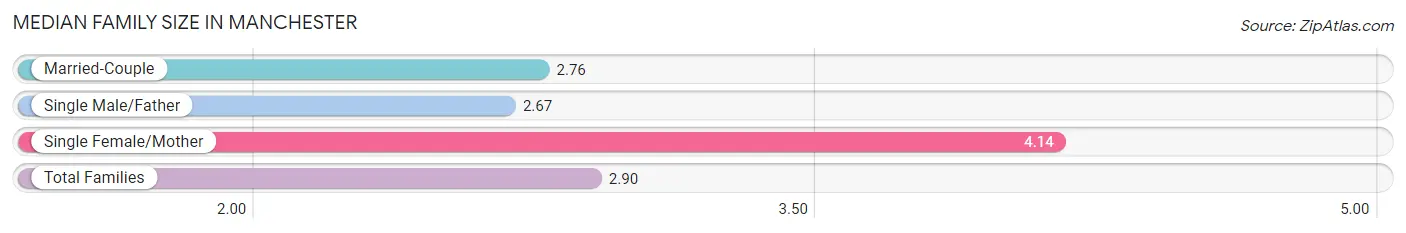
| Family Type | # Families | Family Size |
| Married-Couple | 118 (85.5%) | 2.76 |
| Single Male/Father | 6 (4.3%) | 2.67 |
| Single Female/Mother | 14 (10.1%) | 4.14 |
| Total Families | 138 (100.0%) | 2.90 |
Median Household Size in Manchester
The median household size in Manchester is 1.79 persons per household, with single female/mother households (14 | 3.8%) accounting for the largest median household size of 4.14 persons per household. non-family households (232 | 62.7%) represent the smallest median household size with 1.13 persons per household.
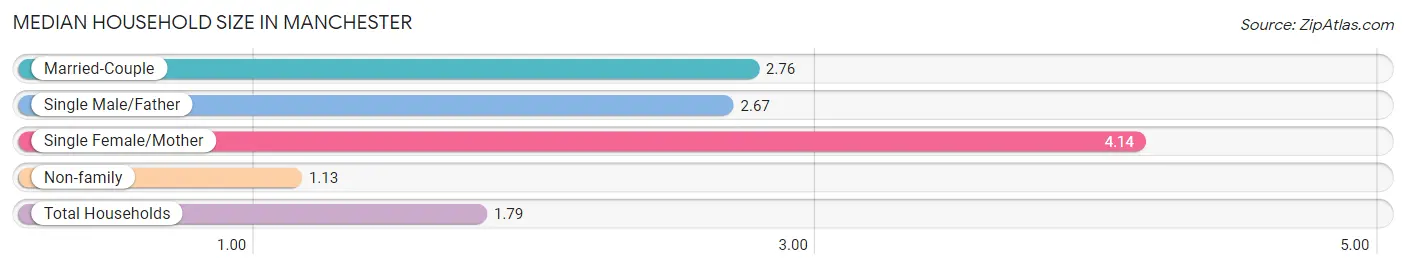
| Household Type | # Households | Household Size |
| Married-Couple | 118 (31.9%) | 2.76 |
| Single Male/Father | 6 (1.6%) | 2.67 |
| Single Female/Mother | 14 (3.8%) | 4.14 |
| Non-family | 232 (62.7%) | 1.13 |
| Total Households | 370 (100.0%) | 1.79 |
Household Size by Marriage Status in Manchester
Out of a total of 370 households in Manchester, 138 (37.3%) are family households, while 232 (62.7%) are nonfamily households. The most numerous type of family households are 2-person households, comprising 108, and the most common type of nonfamily households are 1-person households, comprising 198.
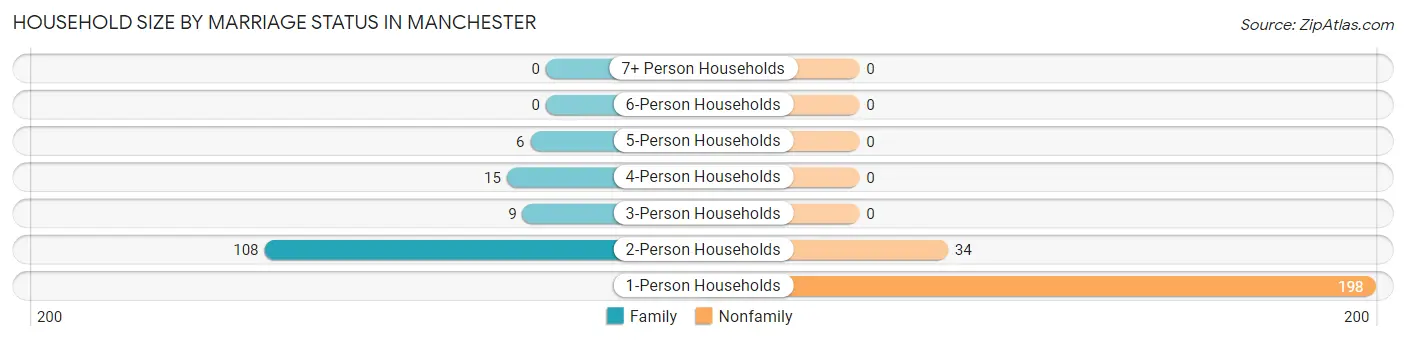
| Household Size | Family Households | Nonfamily Households |
| 1-Person Households | - | 198 (53.5%) |
| 2-Person Households | 108 (29.2%) | 34 (9.2%) |
| 3-Person Households | 9 (2.4%) | 0 (0.0%) |
| 4-Person Households | 15 (4.1%) | 0 (0.0%) |
| 5-Person Households | 6 (1.6%) | 0 (0.0%) |
| 6-Person Households | 0 (0.0%) | 0 (0.0%) |
| 7+ Person Households | 0 (0.0%) | 0 (0.0%) |
| Total | 138 (37.3%) | 232 (62.7%) |
Female Fertility in Manchester
Fertility by Age in Manchester
| Age Bracket | Women with Births | Births / 1,000 Women |
| 15 to 19 years | 0 (0.0%) | 0.0 |
| 20 to 34 years | 0 (0.0%) | 0.0 |
| 35 to 50 years | 0 (0.0%) | 0.0 |
| Total | 0 (0.0%) | 0.0 |
Fertility by Age by Marriage Status in Manchester
| Age Bracket | Married | Unmarried |
| 15 to 19 years | 0 (0.0%) | 0 (0.0%) |
| 20 to 34 years | 0 (0.0%) | 0 (0.0%) |
| 35 to 50 years | 0 (0.0%) | 0 (0.0%) |
| Total | 0 (0.0%) | 0 (0.0%) |
Fertility by Education in Manchester
| Educational Attainment | Women with Births | Births / 1,000 Women |
| Less than High School | 0 (0.0%) | 0.0 |
| High School Diploma | 0 (0.0%) | 0.0 |
| College or Associate's Degree | 0 (0.0%) | 0.0 |
| Bachelor's Degree | 0 (0.0%) | 0.0 |
| Graduate Degree | 0 (0.0%) | 0.0 |
| Total | 0 (0.0%) | 0.0 |
Fertility by Education by Marriage Status in Manchester
| Educational Attainment | Married | Unmarried |
| Less than High School | 0 (0.0%) | 0 (0.0%) |
| High School Diploma | 0 (0.0%) | 0 (0.0%) |
| College or Associate's Degree | 0 (0.0%) | 0 (0.0%) |
| Bachelor's Degree | 0 (0.0%) | 0 (0.0%) |
| Graduate Degree | 0 (0.0%) | 0 (0.0%) |
| Total | 0 (0.0%) | 0 (0.0%) |
Employment Characteristics in Manchester
Employment by Class of Employer in Manchester
Among the 179 employed individuals in Manchester, private company employees (128 | 71.5%), self-employed (incorporated) (23 | 12.9%), and not-for-profit organizations (12 | 6.7%) make up the most common classes of employment.
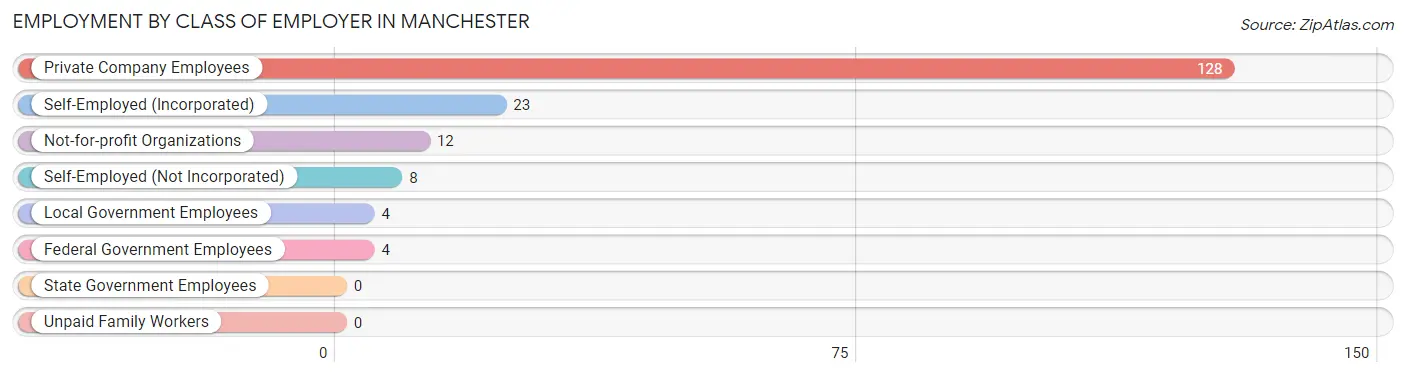
| Employer Class | # Employees | % Employees |
| Private Company Employees | 128 | 71.5% |
| Self-Employed (Incorporated) | 23 | 12.9% |
| Self-Employed (Not Incorporated) | 8 | 4.5% |
| Not-for-profit Organizations | 12 | 6.7% |
| Local Government Employees | 4 | 2.2% |
| State Government Employees | 0 | 0.0% |
| Federal Government Employees | 4 | 2.2% |
| Unpaid Family Workers | 0 | 0.0% |
| Total | 179 | 100.0% |
Employment Status by Age in Manchester
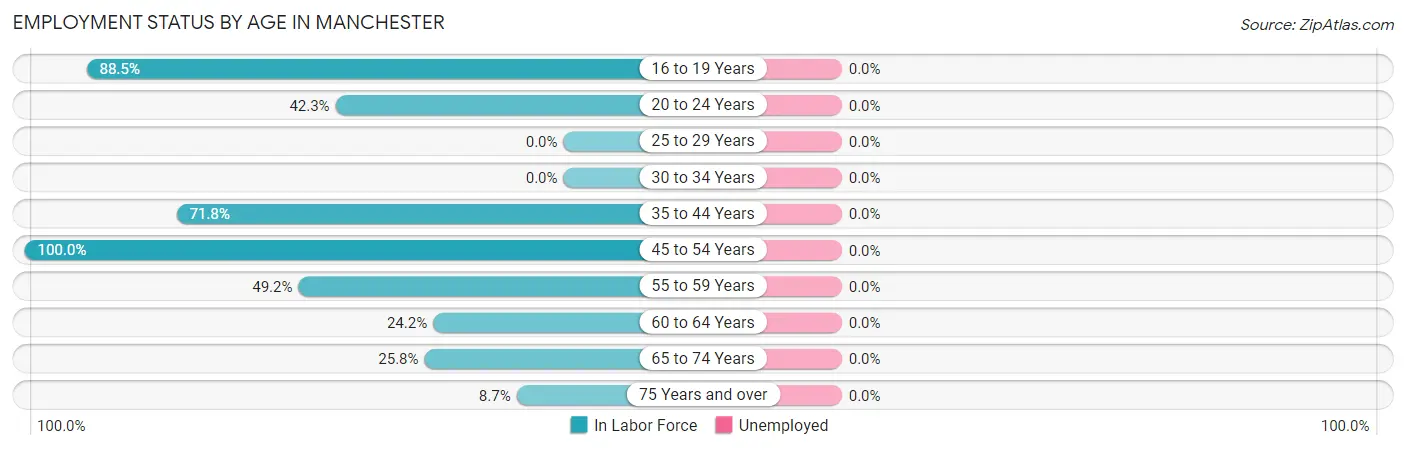
| Age Bracket | In Labor Force | Unemployed |
| 16 to 19 Years | 46 (88.5%) | 0 (0.0%) |
| 20 to 24 Years | 11 (42.3%) | 0 (0.0%) |
| 25 to 29 Years | 0 (0.0%) | 0 (0.0%) |
| 30 to 34 Years | 0 (0.0%) | 0 (0.0%) |
| 35 to 44 Years | 28 (71.8%) | 0 (0.0%) |
| 45 to 54 Years | 19 (100.0%) | 0 (0.0%) |
| 55 to 59 Years | 29 (49.2%) | 0 (0.0%) |
| 60 to 64 Years | 37 (24.2%) | 0 (0.0%) |
| 65 to 74 Years | 32 (25.8%) | 0 (0.0%) |
| 75 Years and over | 18 (8.7%) | 0 (0.0%) |
| Total | 220 (32.4%) | 0 (0.0%) |
Employment Status by Educational Attainment in Manchester
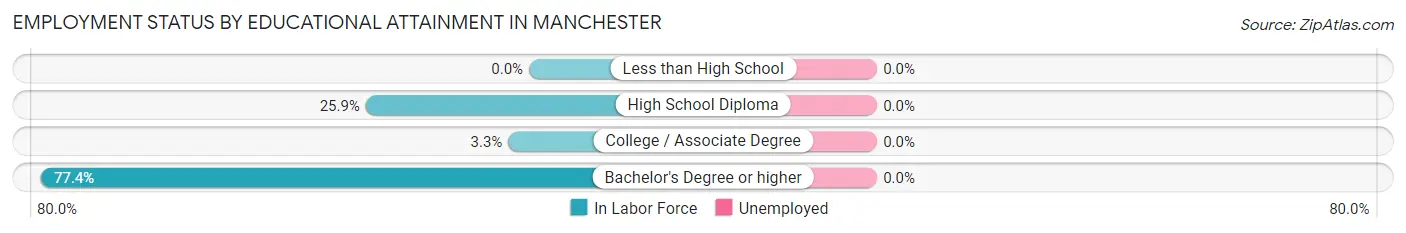
| Educational Attainment | In Labor Force | Unemployed |
| Less than High School | 0 (0.0%) | 0 (0.0%) |
| High School Diploma | 14 (25.9%) | 0 (0.0%) |
| College / Associate Degree | 3 (3.3%) | 0 (0.0%) |
| Bachelor's Degree or higher | 96 (77.4%) | 0 (0.0%) |
| Total | 113 (41.9%) | 0 (0.0%) |
Employment Occupations by Sex in Manchester
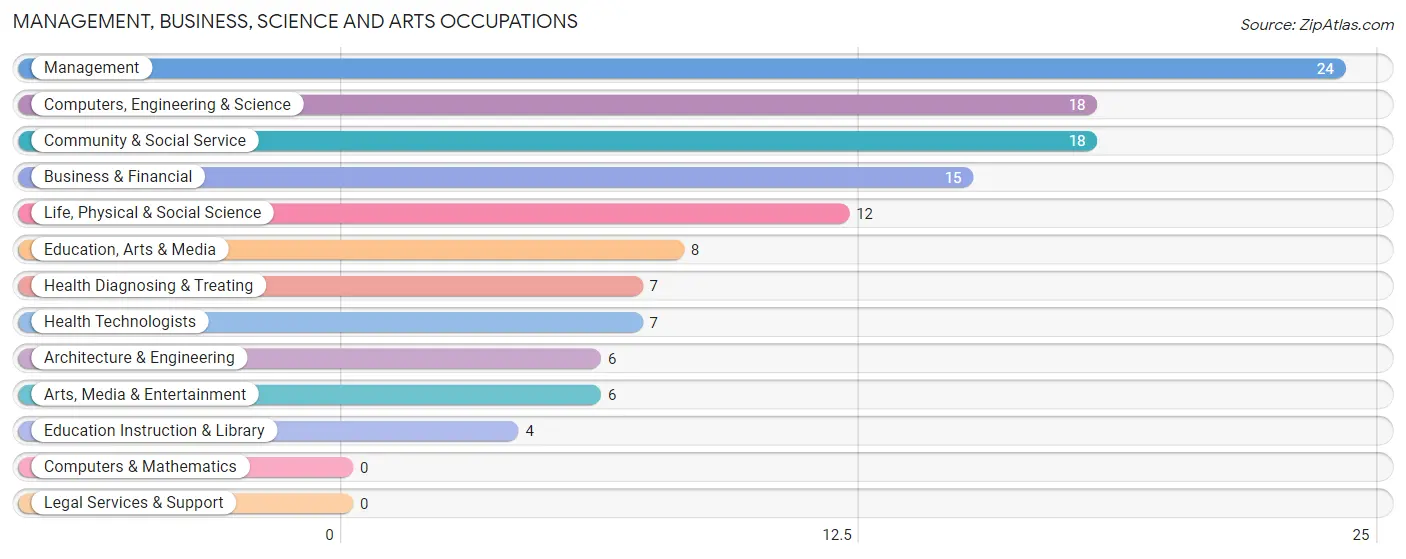
Management, Business, Science and Arts Occupations
The most common Management, Business, Science and Arts occupations in Manchester are Management (24 | 10.9%), Computers, Engineering & Science (18 | 8.2%), Community & Social Service (18 | 8.2%), Business & Financial (15 | 6.8%), and Life, Physical & Social Science (12 | 5.4%).
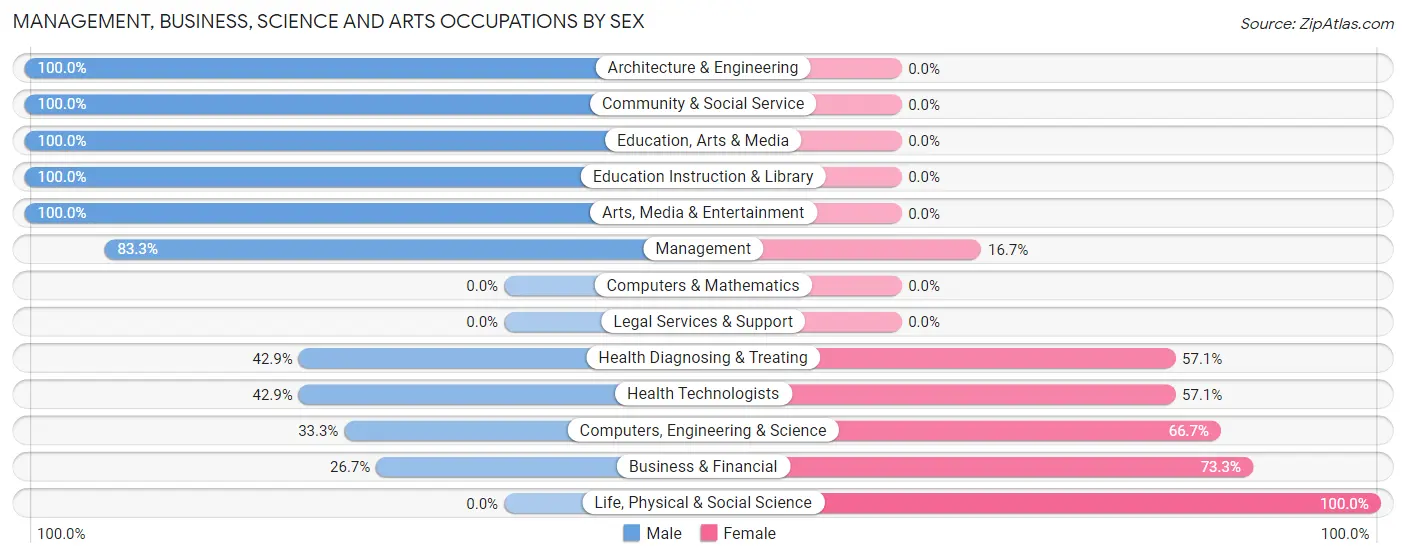
Management, Business, Science and Arts Occupations by Sex
Within the Management, Business, Science and Arts occupations in Manchester, the most male-oriented occupations are Architecture & Engineering (100.0%), Community & Social Service (100.0%), and Education, Arts & Media (100.0%), while the most female-oriented occupations are Life, Physical & Social Science (100.0%), Business & Financial (73.3%), and Computers, Engineering & Science (66.7%).
| Occupation | Male | Female |
| Management | 20 (83.3%) | 4 (16.7%) |
| Business & Financial | 4 (26.7%) | 11 (73.3%) |
| Computers, Engineering & Science | 6 (33.3%) | 12 (66.7%) |
| Computers & Mathematics | 0 (0.0%) | 0 (0.0%) |
| Architecture & Engineering | 6 (100.0%) | 0 (0.0%) |
| Life, Physical & Social Science | 0 (0.0%) | 12 (100.0%) |
| Community & Social Service | 18 (100.0%) | 0 (0.0%) |
| Education, Arts & Media | 8 (100.0%) | 0 (0.0%) |
| Legal Services & Support | 0 (0.0%) | 0 (0.0%) |
| Education Instruction & Library | 4 (100.0%) | 0 (0.0%) |
| Arts, Media & Entertainment | 6 (100.0%) | 0 (0.0%) |
| Health Diagnosing & Treating | 3 (42.9%) | 4 (57.1%) |
| Health Technologists | 3 (42.9%) | 4 (57.1%) |
| Total (Category) | 51 (62.2%) | 31 (37.8%) |
| Total (Overall) | 116 (52.7%) | 104 (47.3%) |
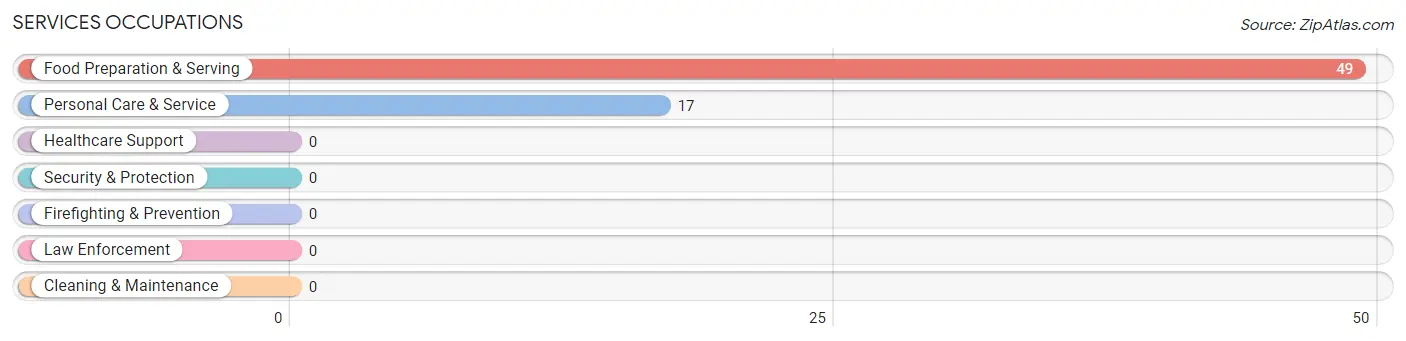
Services Occupations
The most common Services occupations in Manchester are Food Preparation & Serving (49 | 22.3%), and Personal Care & Service (17 | 7.7%).
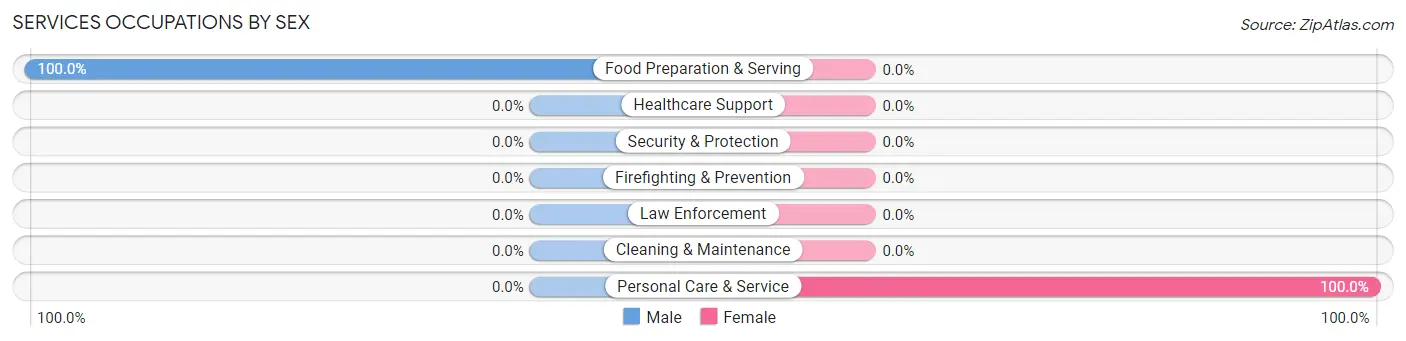
Services Occupations by Sex
| Occupation | Male | Female |
| Healthcare Support | 0 (0.0%) | 0 (0.0%) |
| Security & Protection | 0 (0.0%) | 0 (0.0%) |
| Firefighting & Prevention | 0 (0.0%) | 0 (0.0%) |
| Law Enforcement | 0 (0.0%) | 0 (0.0%) |
| Food Preparation & Serving | 49 (100.0%) | 0 (0.0%) |
| Cleaning & Maintenance | 0 (0.0%) | 0 (0.0%) |
| Personal Care & Service | 0 (0.0%) | 17 (100.0%) |
| Total (Category) | 49 (74.2%) | 17 (25.8%) |
| Total (Overall) | 116 (52.7%) | 104 (47.3%) |
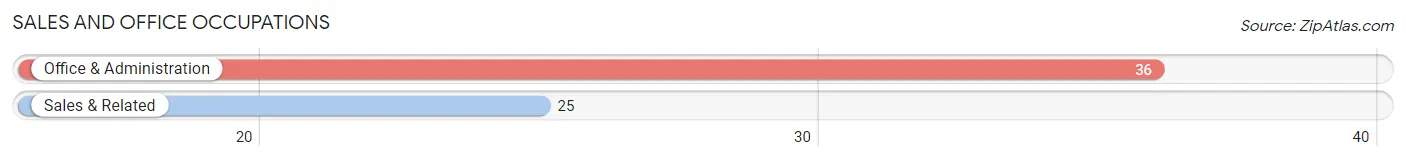
Sales and Office Occupations
The most common Sales and Office occupations in Manchester are Office & Administration (36 | 16.4%), and Sales & Related (25 | 11.4%).
Sales and Office Occupations by Sex
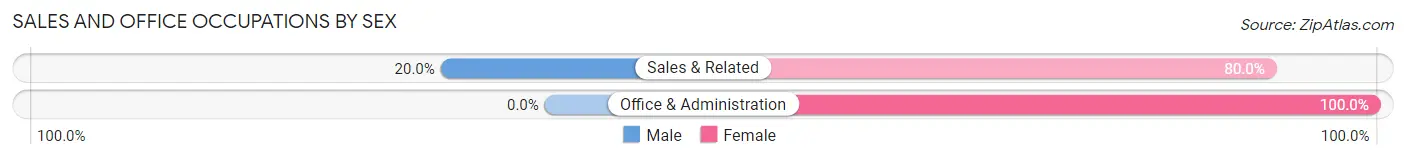
| Occupation | Male | Female |
| Sales & Related | 5 (20.0%) | 20 (80.0%) |
| Office & Administration | 0 (0.0%) | 36 (100.0%) |
| Total (Category) | 5 (8.2%) | 56 (91.8%) |
| Total (Overall) | 116 (52.7%) | 104 (47.3%) |
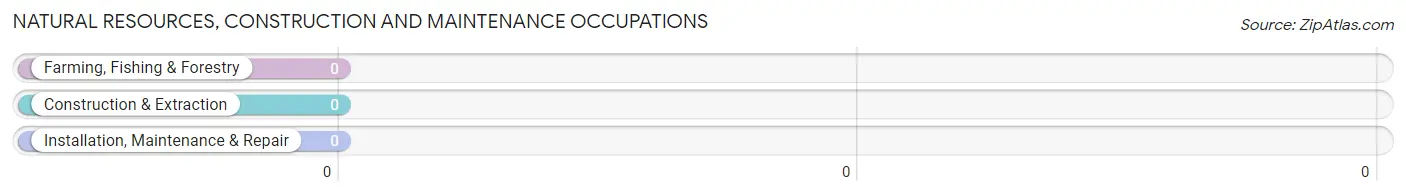
Natural Resources, Construction and Maintenance Occupations
Natural Resources, Construction and Maintenance Occupations by Sex
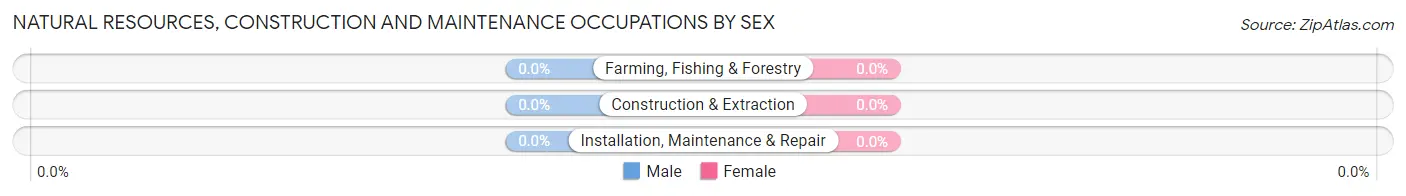
| Occupation | Male | Female |
| Farming, Fishing & Forestry | 0 (0.0%) | 0 (0.0%) |
| Construction & Extraction | 0 (0.0%) | 0 (0.0%) |
| Installation, Maintenance & Repair | 0 (0.0%) | 0 (0.0%) |
| Total (Category) | 0 (0.0%) | 0 (0.0%) |
| Total (Overall) | 116 (52.7%) | 104 (47.3%) |
Production, Transportation and Moving Occupations
The most common Production, Transportation and Moving occupations in Manchester are Production (7 | 3.2%), and Transportation (4 | 1.8%).
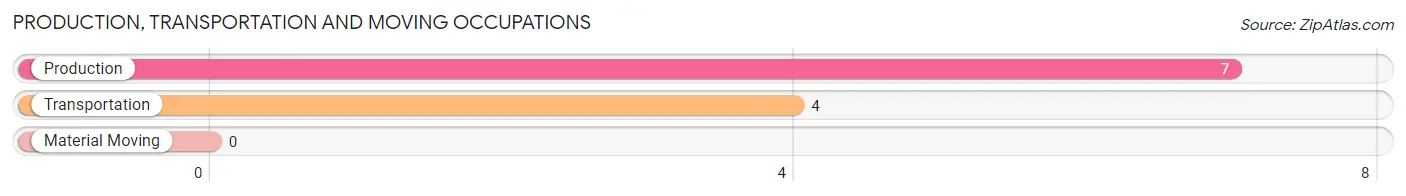
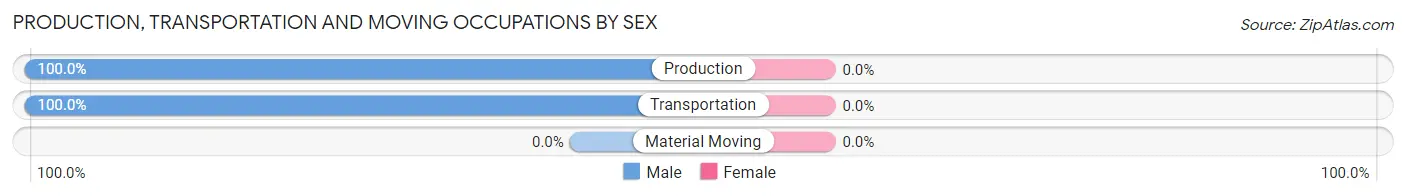
Production, Transportation and Moving Occupations by Sex
| Occupation | Male | Female |
| Production | 7 (100.0%) | 0 (0.0%) |
| Transportation | 4 (100.0%) | 0 (0.0%) |
| Material Moving | 0 (0.0%) | 0 (0.0%) |
| Total (Category) | 11 (100.0%) | 0 (0.0%) |
| Total (Overall) | 116 (52.7%) | 104 (47.3%) |
Employment Industries by Sex in Manchester
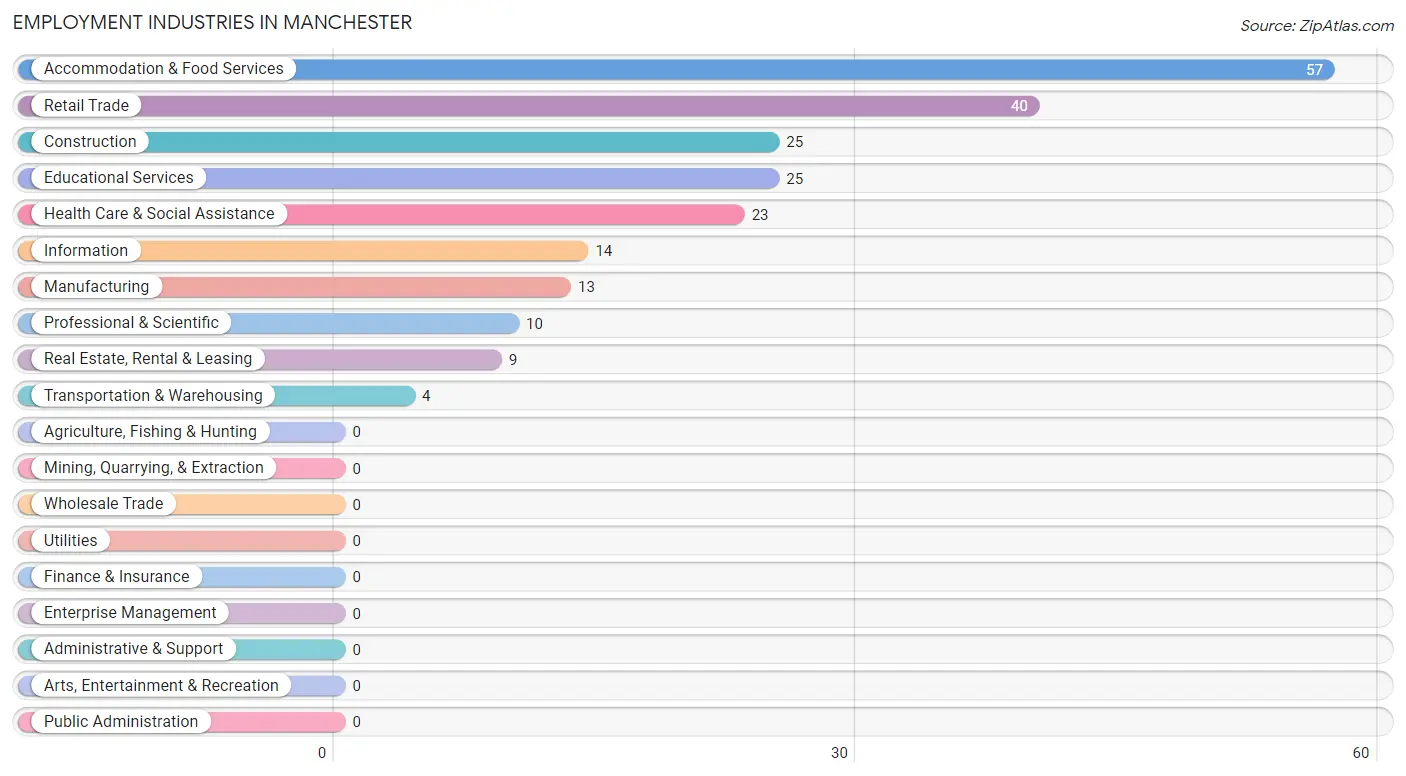
Employment Industries in Manchester
The major employment industries in Manchester include Accommodation & Food Services (57 | 25.9%), Retail Trade (40 | 18.2%), Construction (25 | 11.4%), Educational Services (25 | 11.4%), and Health Care & Social Assistance (23 | 10.4%).
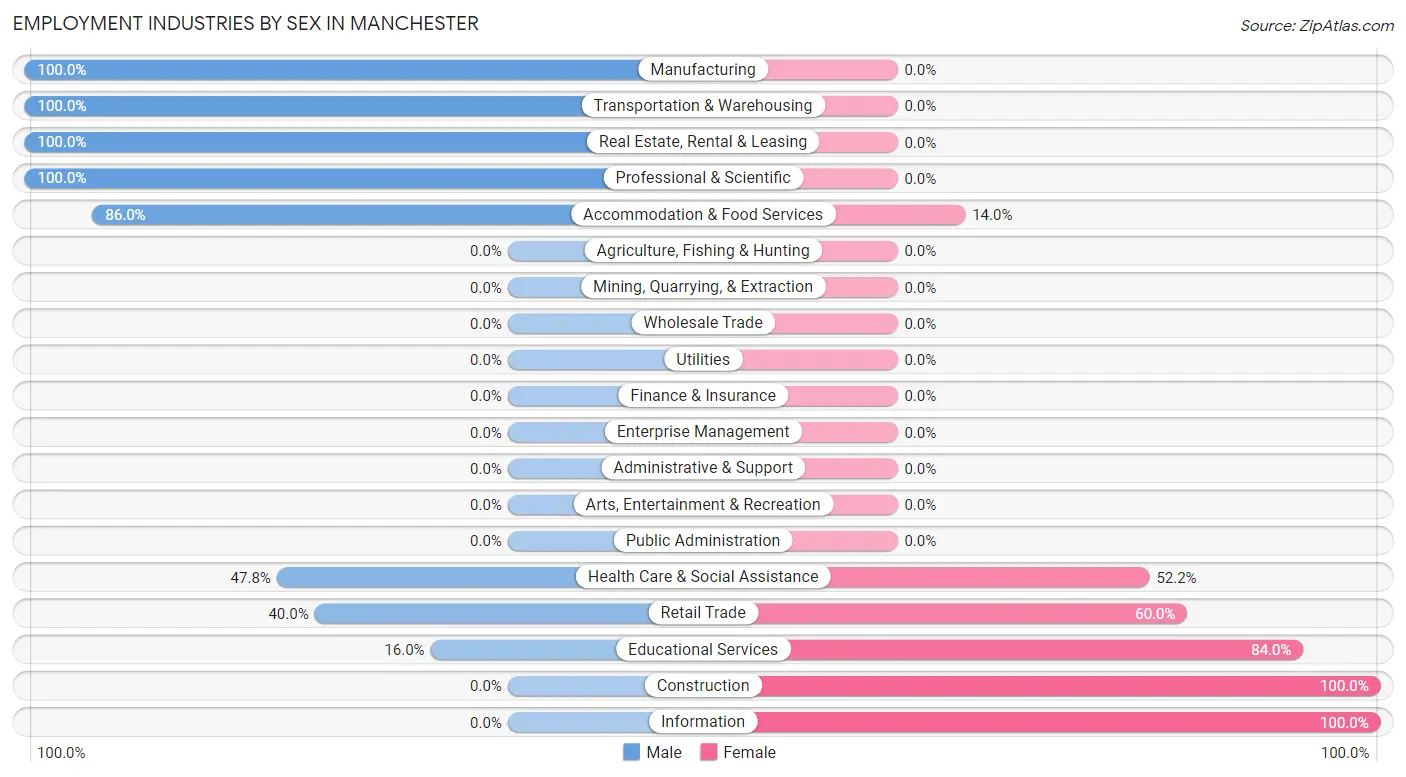
Employment Industries by Sex in Manchester
The Manchester industries that see more men than women are Manufacturing (100.0%), Transportation & Warehousing (100.0%), and Real Estate, Rental & Leasing (100.0%), whereas the industries that tend to have a higher number of women are Construction (100.0%), Information (100.0%), and Educational Services (84.0%).
| Industry | Male | Female |
| Agriculture, Fishing & Hunting | 0 (0.0%) | 0 (0.0%) |
| Mining, Quarrying, & Extraction | 0 (0.0%) | 0 (0.0%) |
| Construction | 0 (0.0%) | 25 (100.0%) |
| Manufacturing | 13 (100.0%) | 0 (0.0%) |
| Wholesale Trade | 0 (0.0%) | 0 (0.0%) |
| Retail Trade | 16 (40.0%) | 24 (60.0%) |
| Transportation & Warehousing | 4 (100.0%) | 0 (0.0%) |
| Utilities | 0 (0.0%) | 0 (0.0%) |
| Information | 0 (0.0%) | 14 (100.0%) |
| Finance & Insurance | 0 (0.0%) | 0 (0.0%) |
| Real Estate, Rental & Leasing | 9 (100.0%) | 0 (0.0%) |
| Professional & Scientific | 10 (100.0%) | 0 (0.0%) |
| Enterprise Management | 0 (0.0%) | 0 (0.0%) |
| Administrative & Support | 0 (0.0%) | 0 (0.0%) |
| Educational Services | 4 (16.0%) | 21 (84.0%) |
| Health Care & Social Assistance | 11 (47.8%) | 12 (52.2%) |
| Arts, Entertainment & Recreation | 0 (0.0%) | 0 (0.0%) |
| Accommodation & Food Services | 49 (86.0%) | 8 (14.0%) |
| Public Administration | 0 (0.0%) | 0 (0.0%) |
| Total | 116 (52.7%) | 104 (47.3%) |
Education in Manchester
School Enrollment in Manchester
The most common levels of schooling among the 91 students in Manchester are college / undergraduate (45 | 49.4%), high school (23 | 25.3%), and elementary school (11 | 12.1%).
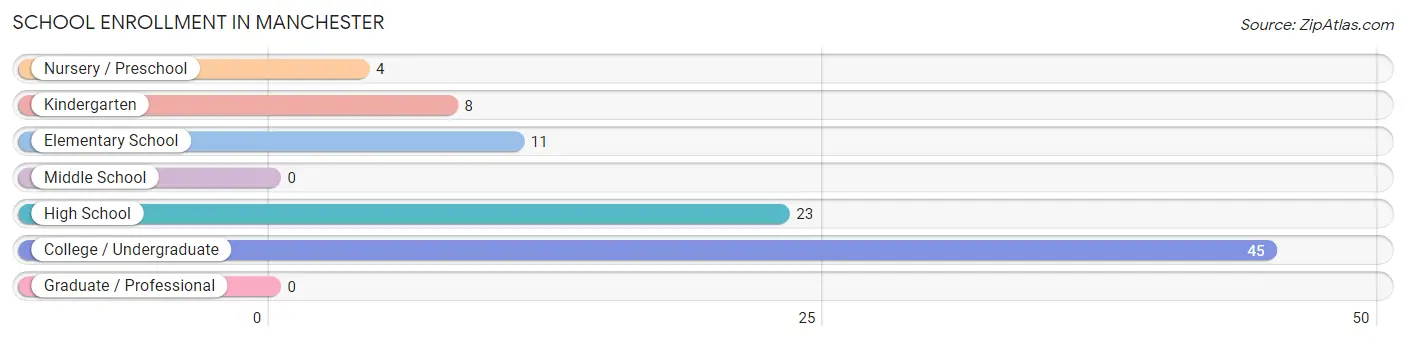
| School Level | # Students | % Students |
| Nursery / Preschool | 4 | 4.4% |
| Kindergarten | 8 | 8.8% |
| Elementary School | 11 | 12.1% |
| Middle School | 0 | 0.0% |
| High School | 23 | 25.3% |
| College / Undergraduate | 45 | 49.4% |
| Graduate / Professional | 0 | 0.0% |
| Total | 91 | 100.0% |
School Enrollment by Age by Funding Source in Manchester
Out of a total of 91 students who are enrolled in schools in Manchester, 15 (16.5%) attend a private institution, while the remaining 76 (83.5%) are enrolled in public schools. The age group of 3 to 4 year olds has the highest likelihood of being enrolled in private schools, with 4 (100.0% in the age bracket) enrolled. Conversely, the age group of 5 to 9 year old has the lowest likelihood of being enrolled in a private school, with 19 (100.0% in the age bracket) attending a public institution.
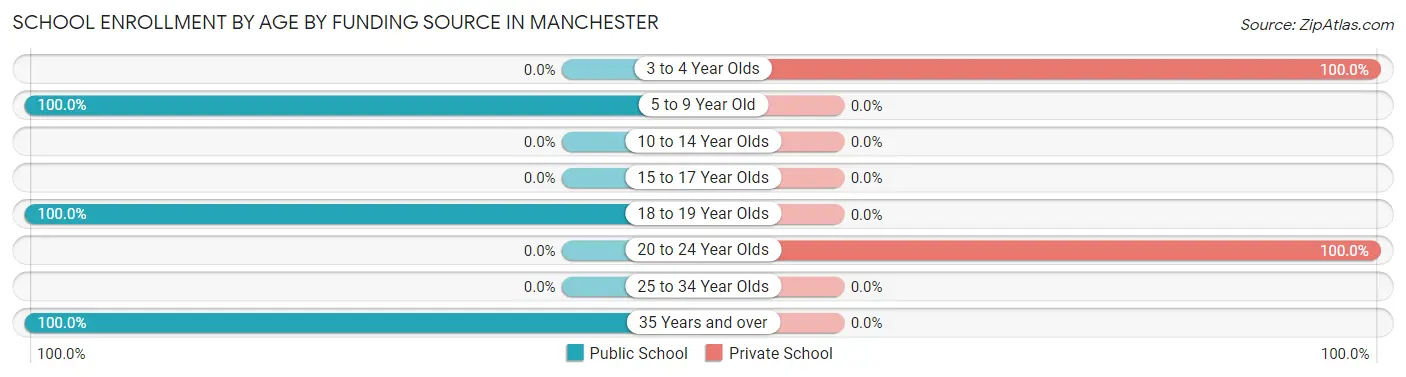
| Age Bracket | Public School | Private School |
| 3 to 4 Year Olds | 0 (0.0%) | 4 (100.0%) |
| 5 to 9 Year Old | 19 (100.0%) | 0 (0.0%) |
| 10 to 14 Year Olds | 0 (0.0%) | 0 (0.0%) |
| 15 to 17 Year Olds | 0 (0.0%) | 0 (0.0%) |
| 18 to 19 Year Olds | 52 (100.0%) | 0 (0.0%) |
| 20 to 24 Year Olds | 0 (0.0%) | 11 (100.0%) |
| 25 to 34 Year Olds | 0 (0.0%) | 0 (0.0%) |
| 35 Years and over | 5 (100.0%) | 0 (0.0%) |
| Total | 76 (83.5%) | 15 (16.5%) |
Educational Attainment by Field of Study in Manchester
Social sciences (43 | 13.4%), liberal arts & history (37 | 11.5%), bio, nature & agricultural (36 | 11.2%), business (33 | 10.2%), and education (33 | 10.2%) are the most common fields of study among 322 individuals in Manchester who have obtained a bachelor's degree or higher.
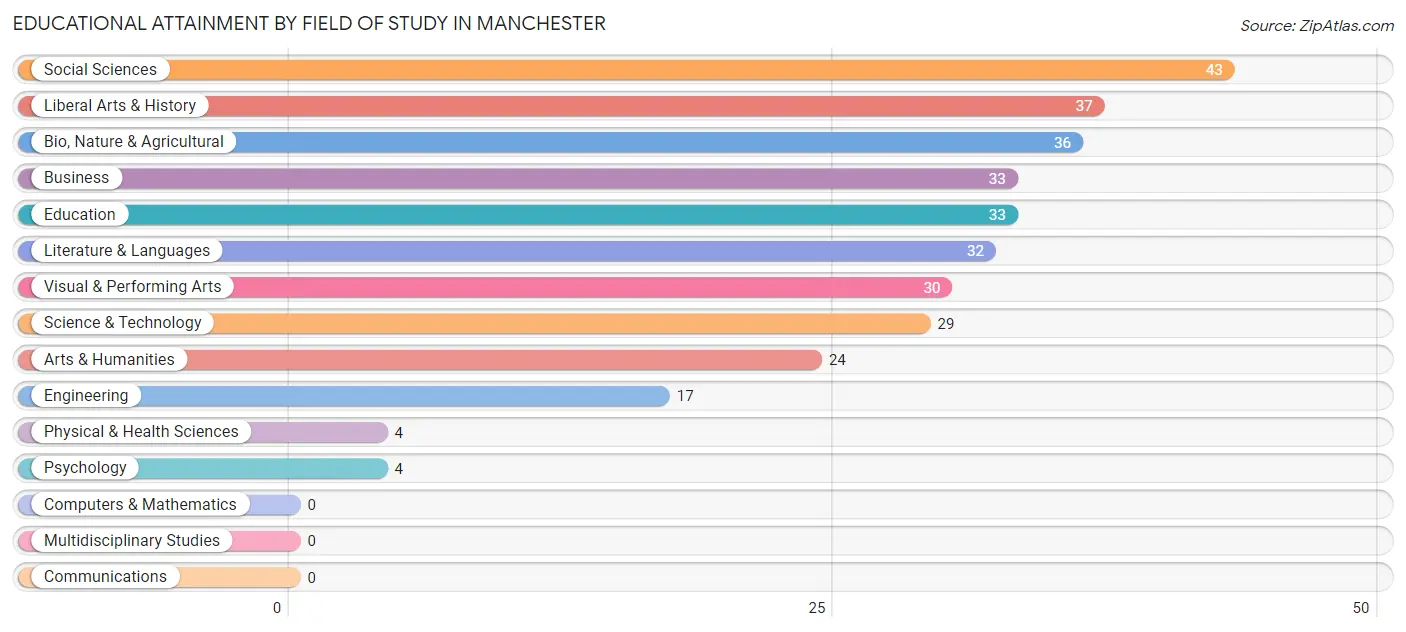
| Field of Study | # Graduates | % Graduates |
| Computers & Mathematics | 0 | 0.0% |
| Bio, Nature & Agricultural | 36 | 11.2% |
| Physical & Health Sciences | 4 | 1.2% |
| Psychology | 4 | 1.2% |
| Social Sciences | 43 | 13.4% |
| Engineering | 17 | 5.3% |
| Multidisciplinary Studies | 0 | 0.0% |
| Science & Technology | 29 | 9.0% |
| Business | 33 | 10.2% |
| Education | 33 | 10.2% |
| Literature & Languages | 32 | 9.9% |
| Liberal Arts & History | 37 | 11.5% |
| Visual & Performing Arts | 30 | 9.3% |
| Communications | 0 | 0.0% |
| Arts & Humanities | 24 | 7.4% |
| Total | 322 | 100.0% |
Transportation & Commute in Manchester
Vehicle Availability by Sex in Manchester
The most prevalent vehicle ownership categories in Manchester are males with 4 vehicles (32, accounting for 40.5%) and females with 4 vehicles (0, making up 39.5%).
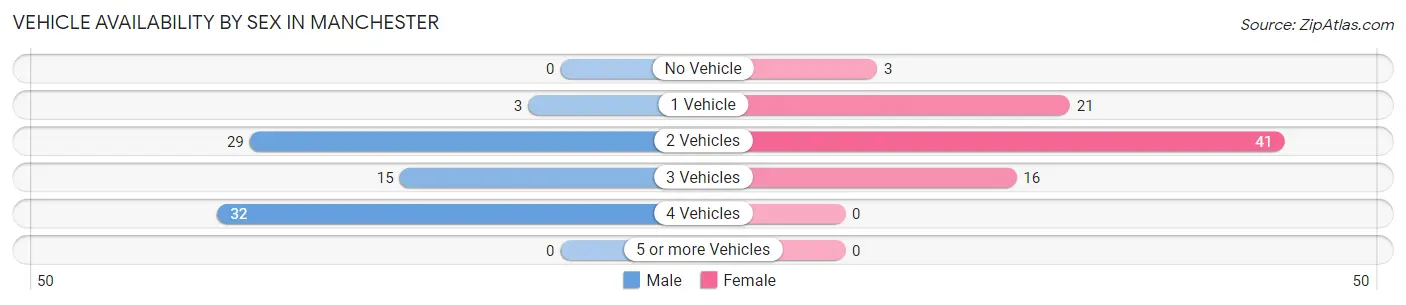
| Vehicles Available | Male | Female |
| No Vehicle | 0 (0.0%) | 3 (3.7%) |
| 1 Vehicle | 3 (3.8%) | 21 (25.9%) |
| 2 Vehicles | 29 (36.7%) | 41 (50.6%) |
| 3 Vehicles | 15 (19.0%) | 16 (19.8%) |
| 4 Vehicles | 32 (40.5%) | 0 (0.0%) |
| 5 or more Vehicles | 0 (0.0%) | 0 (0.0%) |
| Total | 79 (100.0%) | 81 (100.0%) |
Commute Time in Manchester
The most frequently occuring commute durations in Manchester are 5 to 9 minutes (42 commuters, 37.8%), 10 to 14 minutes (38 commuters, 34.2%), and 20 to 24 minutes (8 commuters, 7.2%).
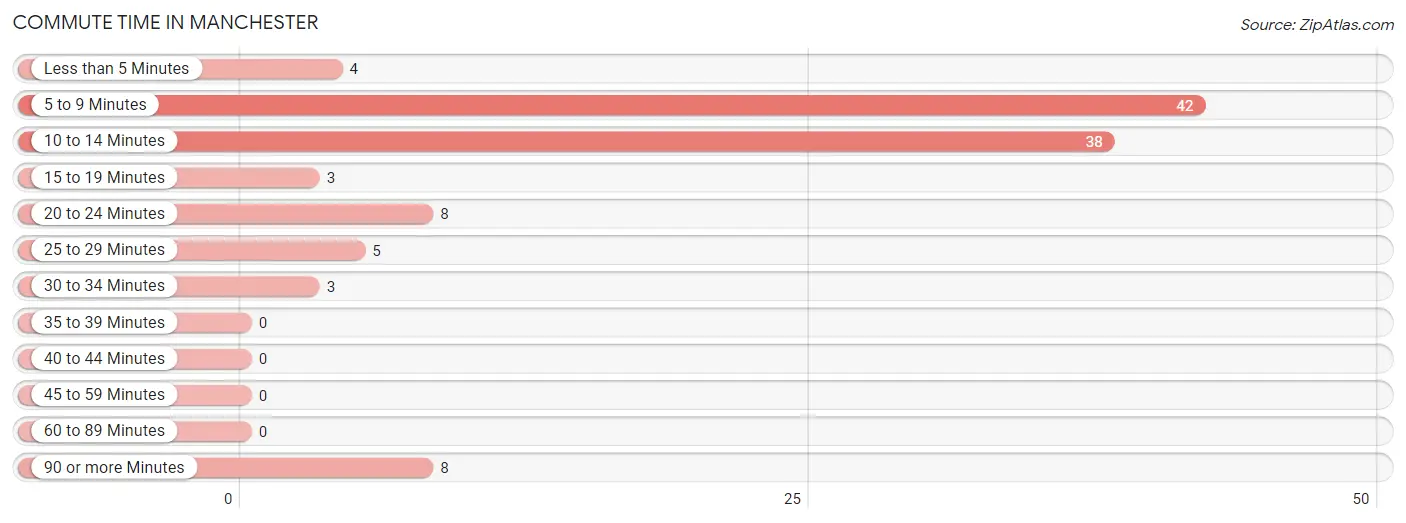
| Commute Time | # Commuters | % Commuters |
| Less than 5 Minutes | 4 | 3.6% |
| 5 to 9 Minutes | 42 | 37.8% |
| 10 to 14 Minutes | 38 | 34.2% |
| 15 to 19 Minutes | 3 | 2.7% |
| 20 to 24 Minutes | 8 | 7.2% |
| 25 to 29 Minutes | 5 | 4.5% |
| 30 to 34 Minutes | 3 | 2.7% |
| 35 to 39 Minutes | 0 | 0.0% |
| 40 to 44 Minutes | 0 | 0.0% |
| 45 to 59 Minutes | 0 | 0.0% |
| 60 to 89 Minutes | 0 | 0.0% |
| 90 or more Minutes | 8 | 7.2% |
Commute Time by Sex in Manchester
The most common commute times in Manchester are 5 to 9 minutes (19 commuters, 34.5%) for males and 10 to 14 minutes (29 commuters, 51.8%) for females.
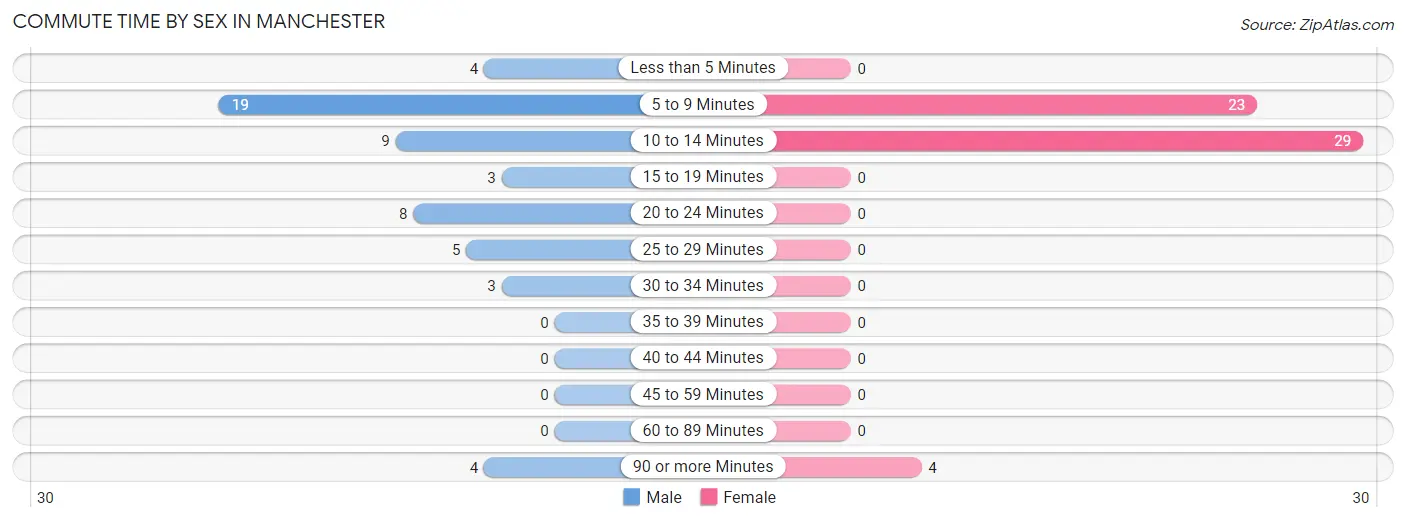
| Commute Time | Male | Female |
| Less than 5 Minutes | 4 (7.3%) | 0 (0.0%) |
| 5 to 9 Minutes | 19 (34.5%) | 23 (41.1%) |
| 10 to 14 Minutes | 9 (16.4%) | 29 (51.8%) |
| 15 to 19 Minutes | 3 (5.4%) | 0 (0.0%) |
| 20 to 24 Minutes | 8 (14.5%) | 0 (0.0%) |
| 25 to 29 Minutes | 5 (9.1%) | 0 (0.0%) |
| 30 to 34 Minutes | 3 (5.4%) | 0 (0.0%) |
| 35 to 39 Minutes | 0 (0.0%) | 0 (0.0%) |
| 40 to 44 Minutes | 0 (0.0%) | 0 (0.0%) |
| 45 to 59 Minutes | 0 (0.0%) | 0 (0.0%) |
| 60 to 89 Minutes | 0 (0.0%) | 0 (0.0%) |
| 90 or more Minutes | 4 (7.3%) | 4 (7.1%) |
Time of Departure to Work by Sex in Manchester
The most frequent times of departure to work in Manchester are 8:00 AM to 8:29 AM (18, 32.7%) for males and 10:00 AM to 10:59 AM (34, 60.7%) for females.
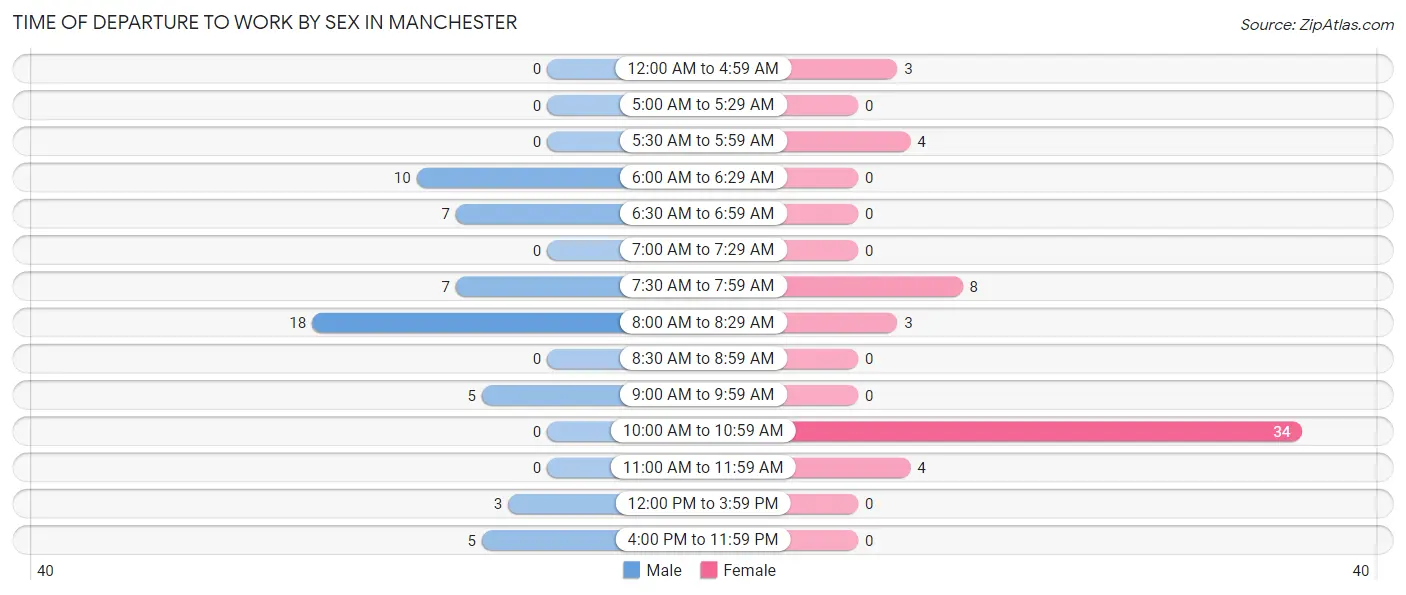
| Time of Departure | Male | Female |
| 12:00 AM to 4:59 AM | 0 (0.0%) | 3 (5.4%) |
| 5:00 AM to 5:29 AM | 0 (0.0%) | 0 (0.0%) |
| 5:30 AM to 5:59 AM | 0 (0.0%) | 4 (7.1%) |
| 6:00 AM to 6:29 AM | 10 (18.2%) | 0 (0.0%) |
| 6:30 AM to 6:59 AM | 7 (12.7%) | 0 (0.0%) |
| 7:00 AM to 7:29 AM | 0 (0.0%) | 0 (0.0%) |
| 7:30 AM to 7:59 AM | 7 (12.7%) | 8 (14.3%) |
| 8:00 AM to 8:29 AM | 18 (32.7%) | 3 (5.4%) |
| 8:30 AM to 8:59 AM | 0 (0.0%) | 0 (0.0%) |
| 9:00 AM to 9:59 AM | 5 (9.1%) | 0 (0.0%) |
| 10:00 AM to 10:59 AM | 0 (0.0%) | 34 (60.7%) |
| 11:00 AM to 11:59 AM | 0 (0.0%) | 4 (7.1%) |
| 12:00 PM to 3:59 PM | 3 (5.4%) | 0 (0.0%) |
| 4:00 PM to 11:59 PM | 5 (9.1%) | 0 (0.0%) |
| Total | 55 (100.0%) | 56 (100.0%) |
Housing Occupancy in Manchester
Occupancy by Ownership in Manchester
Of the total 370 dwellings in Manchester, owner-occupied units account for 167 (45.1%), while renter-occupied units make up 203 (54.9%).
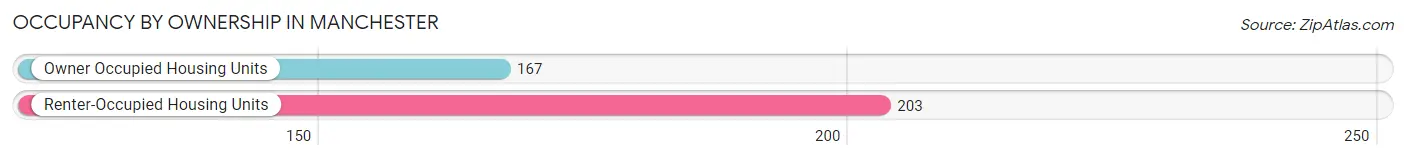
| Occupancy | # Housing Units | % Housing Units |
| Owner Occupied Housing Units | 167 | 45.1% |
| Renter-Occupied Housing Units | 203 | 54.9% |
| Total Occupied Housing Units | 370 | 100.0% |
Occupancy by Household Size in Manchester
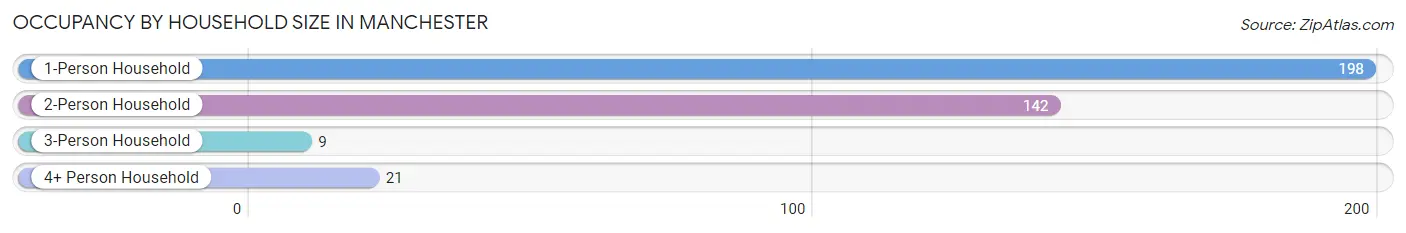
| Household Size | # Housing Units | % Housing Units |
| 1-Person Household | 198 | 53.5% |
| 2-Person Household | 142 | 38.4% |
| 3-Person Household | 9 | 2.4% |
| 4+ Person Household | 21 | 5.7% |
| Total Housing Units | 370 | 100.0% |
Occupancy by Ownership by Household Size in Manchester
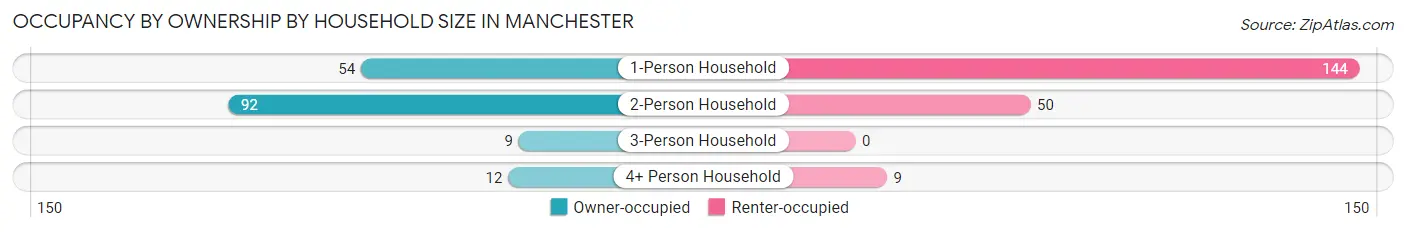
| Household Size | Owner-occupied | Renter-occupied |
| 1-Person Household | 54 (27.3%) | 144 (72.7%) |
| 2-Person Household | 92 (64.8%) | 50 (35.2%) |
| 3-Person Household | 9 (100.0%) | 0 (0.0%) |
| 4+ Person Household | 12 (57.1%) | 9 (42.9%) |
| Total Housing Units | 167 (45.1%) | 203 (54.9%) |
Occupancy by Educational Attainment in Manchester
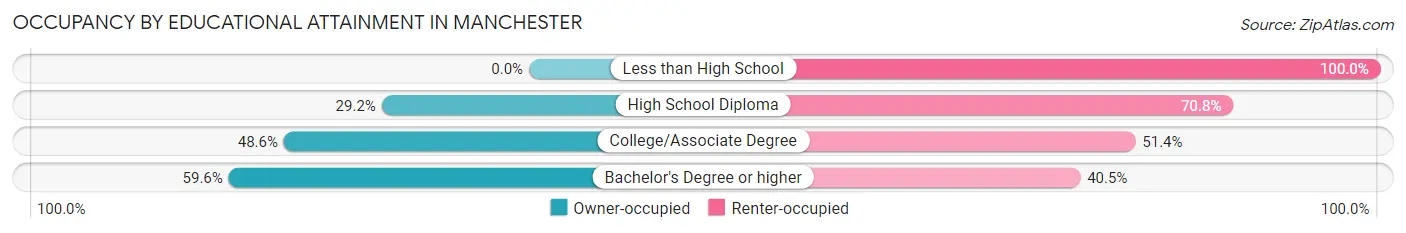
| Household Size | Owner-occupied | Renter-occupied |
| Less than High School | 0 (0.0%) | 31 (100.0%) |
| High School Diploma | 26 (29.2%) | 63 (70.8%) |
| College/Associate Degree | 35 (48.6%) | 37 (51.4%) |
| Bachelor's Degree or higher | 106 (59.6%) | 72 (40.5%) |
Occupancy by Age of Householder in Manchester
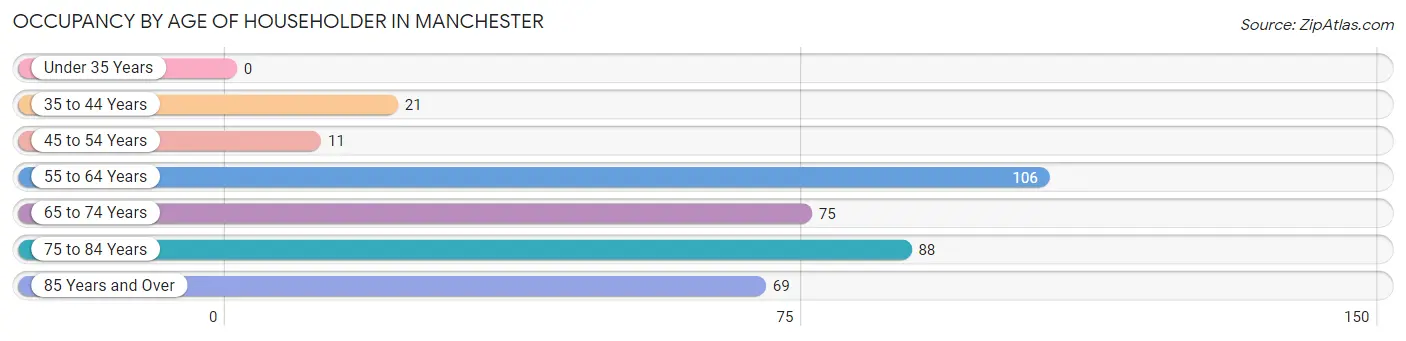
| Age Bracket | # Households | % Households |
| Under 35 Years | 0 | 0.0% |
| 35 to 44 Years | 21 | 5.7% |
| 45 to 54 Years | 11 | 3.0% |
| 55 to 64 Years | 106 | 28.6% |
| 65 to 74 Years | 75 | 20.3% |
| 75 to 84 Years | 88 | 23.8% |
| 85 Years and Over | 69 | 18.6% |
| Total | 370 | 100.0% |
Housing Finances in Manchester
Median Income by Occupancy in Manchester
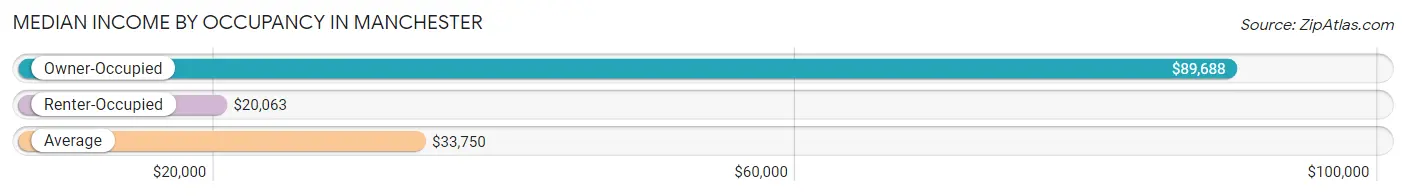
| Occupancy Type | # Households | Median Income |
| Owner-Occupied | 167 (45.1%) | $89,688 |
| Renter-Occupied | 203 (54.9%) | $20,063 |
| Average | 370 (100.0%) | $33,750 |
Occupancy by Householder Income Bracket in Manchester
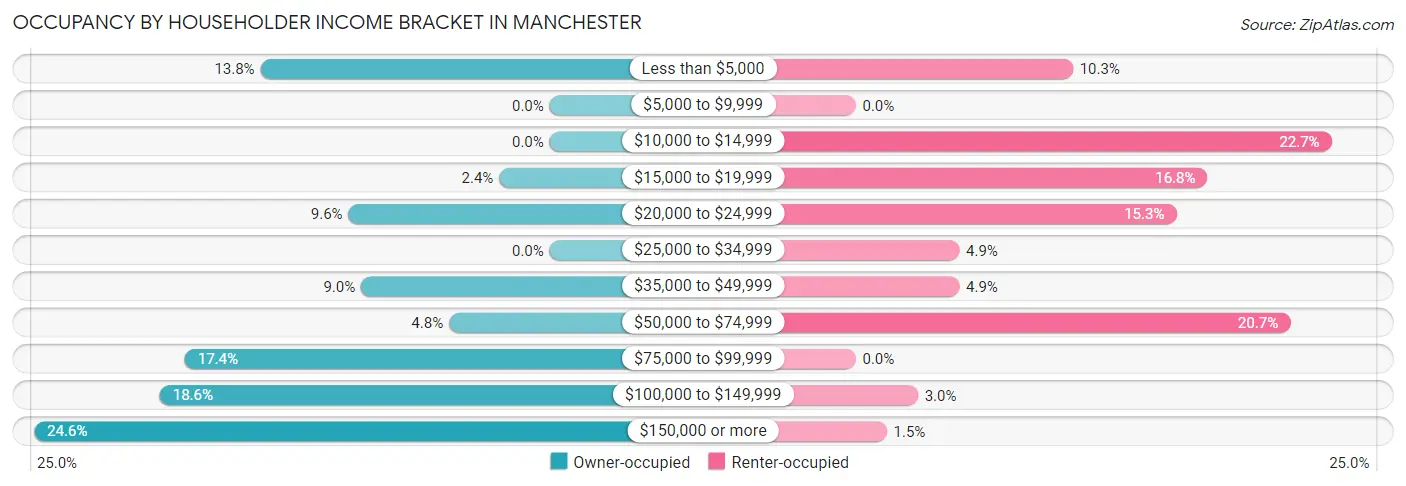
| Income Bracket | Owner-occupied | Renter-occupied |
| Less than $5,000 | 23 (13.8%) | 21 (10.3%) |
| $5,000 to $9,999 | 0 (0.0%) | 0 (0.0%) |
| $10,000 to $14,999 | 0 (0.0%) | 46 (22.7%) |
| $15,000 to $19,999 | 4 (2.4%) | 34 (16.8%) |
| $20,000 to $24,999 | 16 (9.6%) | 31 (15.3%) |
| $25,000 to $34,999 | 0 (0.0%) | 10 (4.9%) |
| $35,000 to $49,999 | 15 (9.0%) | 10 (4.9%) |
| $50,000 to $74,999 | 8 (4.8%) | 42 (20.7%) |
| $75,000 to $99,999 | 29 (17.4%) | 0 (0.0%) |
| $100,000 to $149,999 | 31 (18.6%) | 6 (3.0%) |
| $150,000 or more | 41 (24.5%) | 3 (1.5%) |
| Total | 167 (100.0%) | 203 (100.0%) |
Monthly Housing Cost Tiers in Manchester
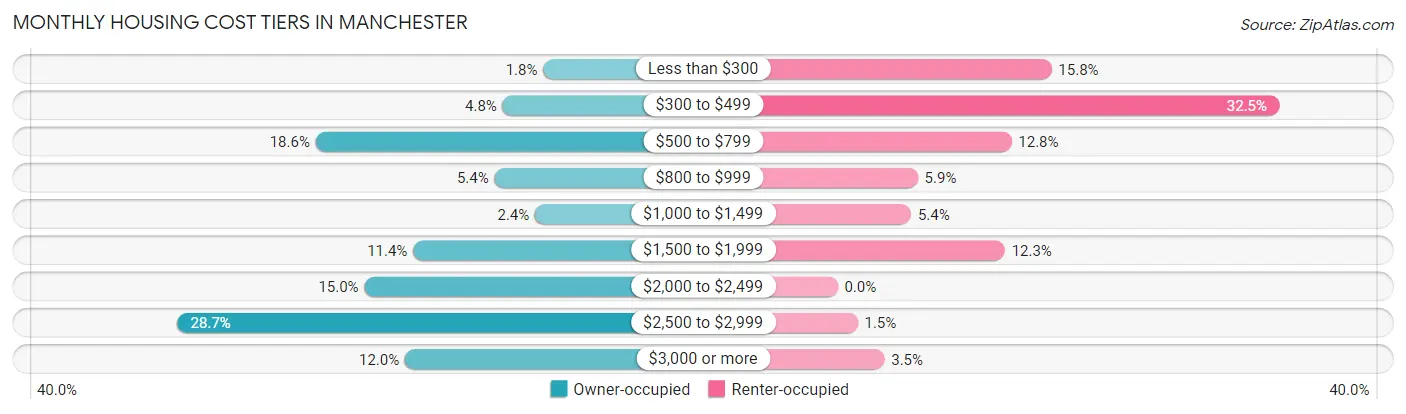
| Monthly Cost | Owner-occupied | Renter-occupied |
| Less than $300 | 3 (1.8%) | 32 (15.8%) |
| $300 to $499 | 8 (4.8%) | 66 (32.5%) |
| $500 to $799 | 31 (18.6%) | 26 (12.8%) |
| $800 to $999 | 9 (5.4%) | 12 (5.9%) |
| $1,000 to $1,499 | 4 (2.4%) | 11 (5.4%) |
| $1,500 to $1,999 | 19 (11.4%) | 25 (12.3%) |
| $2,000 to $2,499 | 25 (15.0%) | 0 (0.0%) |
| $2,500 to $2,999 | 48 (28.7%) | 3 (1.5%) |
| $3,000 or more | 20 (12.0%) | 7 (3.5%) |
| Total | 167 (100.0%) | 203 (100.0%) |
Physical Housing Characteristics in Manchester
Housing Structures in Manchester
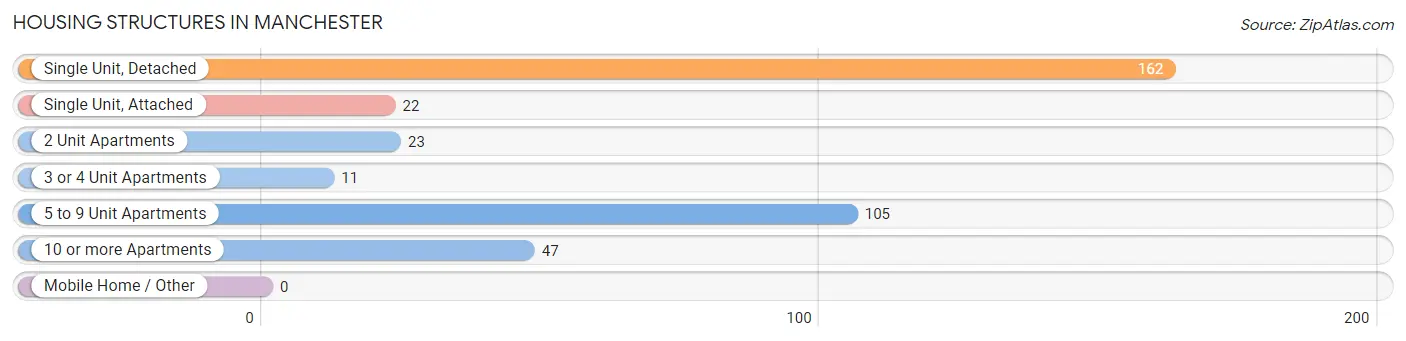
| Structure Type | # Housing Units | % Housing Units |
| Single Unit, Detached | 162 | 43.8% |
| Single Unit, Attached | 22 | 5.9% |
| 2 Unit Apartments | 23 | 6.2% |
| 3 or 4 Unit Apartments | 11 | 3.0% |
| 5 to 9 Unit Apartments | 105 | 28.4% |
| 10 or more Apartments | 47 | 12.7% |
| Mobile Home / Other | 0 | 0.0% |
| Total | 370 | 100.0% |
Housing Structures by Occupancy in Manchester
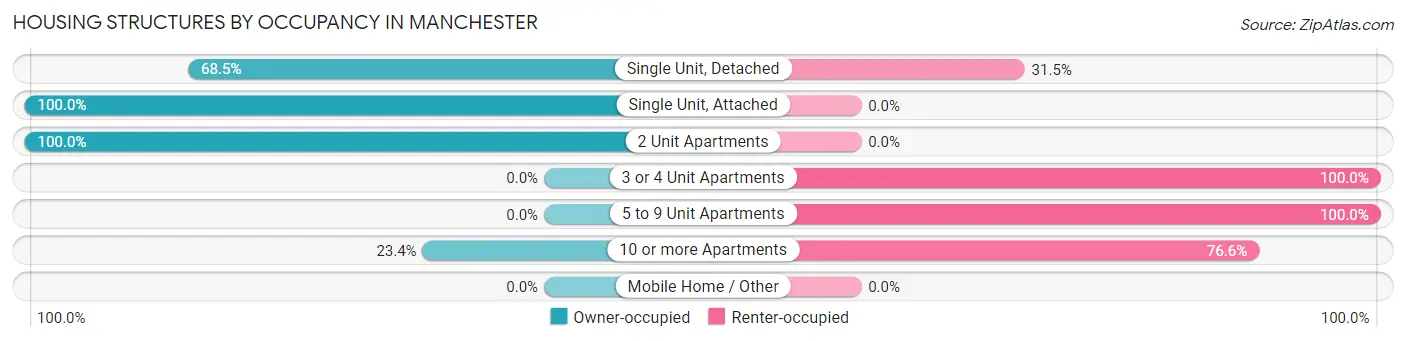
| Structure Type | Owner-occupied | Renter-occupied |
| Single Unit, Detached | 111 (68.5%) | 51 (31.5%) |
| Single Unit, Attached | 22 (100.0%) | 0 (0.0%) |
| 2 Unit Apartments | 23 (100.0%) | 0 (0.0%) |
| 3 or 4 Unit Apartments | 0 (0.0%) | 11 (100.0%) |
| 5 to 9 Unit Apartments | 0 (0.0%) | 105 (100.0%) |
| 10 or more Apartments | 11 (23.4%) | 36 (76.6%) |
| Mobile Home / Other | 0 (0.0%) | 0 (0.0%) |
| Total | 167 (45.1%) | 203 (54.9%) |
Housing Structures by Number of Rooms in Manchester
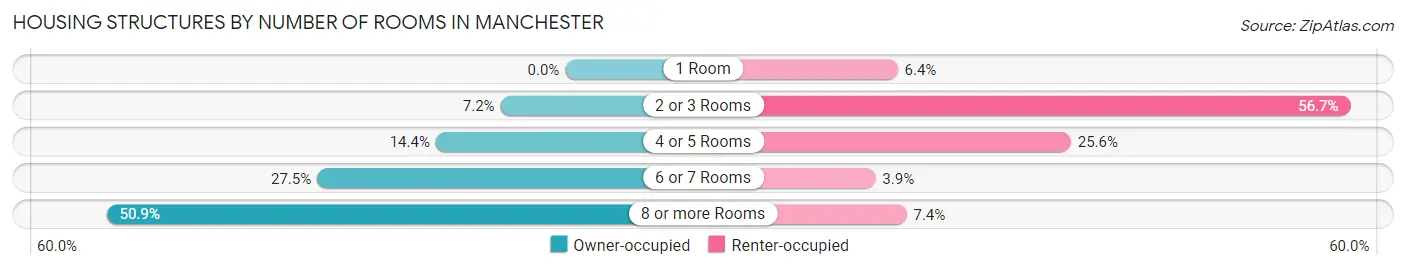
| Number of Rooms | Owner-occupied | Renter-occupied |
| 1 Room | 0 (0.0%) | 13 (6.4%) |
| 2 or 3 Rooms | 12 (7.2%) | 115 (56.7%) |
| 4 or 5 Rooms | 24 (14.4%) | 52 (25.6%) |
| 6 or 7 Rooms | 46 (27.5%) | 8 (3.9%) |
| 8 or more Rooms | 85 (50.9%) | 15 (7.4%) |
| Total | 167 (100.0%) | 203 (100.0%) |
Housing Structure by Heating Type in Manchester
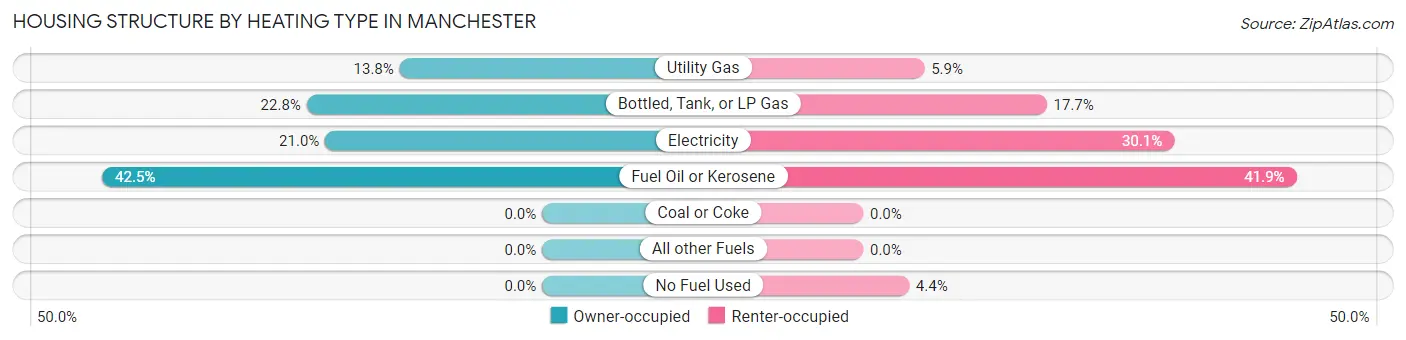
| Heating Type | Owner-occupied | Renter-occupied |
| Utility Gas | 23 (13.8%) | 12 (5.9%) |
| Bottled, Tank, or LP Gas | 38 (22.8%) | 36 (17.7%) |
| Electricity | 35 (21.0%) | 61 (30.0%) |
| Fuel Oil or Kerosene | 71 (42.5%) | 85 (41.9%) |
| Coal or Coke | 0 (0.0%) | 0 (0.0%) |
| All other Fuels | 0 (0.0%) | 0 (0.0%) |
| No Fuel Used | 0 (0.0%) | 9 (4.4%) |
| Total | 167 (100.0%) | 203 (100.0%) |
Household Vehicle Usage in Manchester
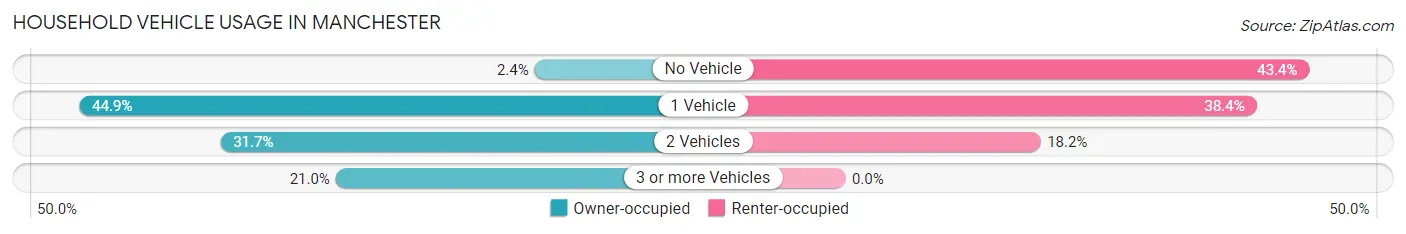
| Vehicles per Household | Owner-occupied | Renter-occupied |
| No Vehicle | 4 (2.4%) | 88 (43.3%) |
| 1 Vehicle | 75 (44.9%) | 78 (38.4%) |
| 2 Vehicles | 53 (31.7%) | 37 (18.2%) |
| 3 or more Vehicles | 35 (21.0%) | 0 (0.0%) |
| Total | 167 (100.0%) | 203 (100.0%) |
Real Estate & Mortgages in Manchester
Real Estate and Mortgage Overview in Manchester
| Characteristic | Without Mortgage | With Mortgage |
| Housing Units | 63 | 104 |
| Median Property Value | $438,600 | $457,500 |
| Median Household Income | - | - |
| Monthly Housing Costs | $654 | $20 |
| Real Estate Taxes | $3,750 | $0 |
Property Value by Mortgage Status in Manchester
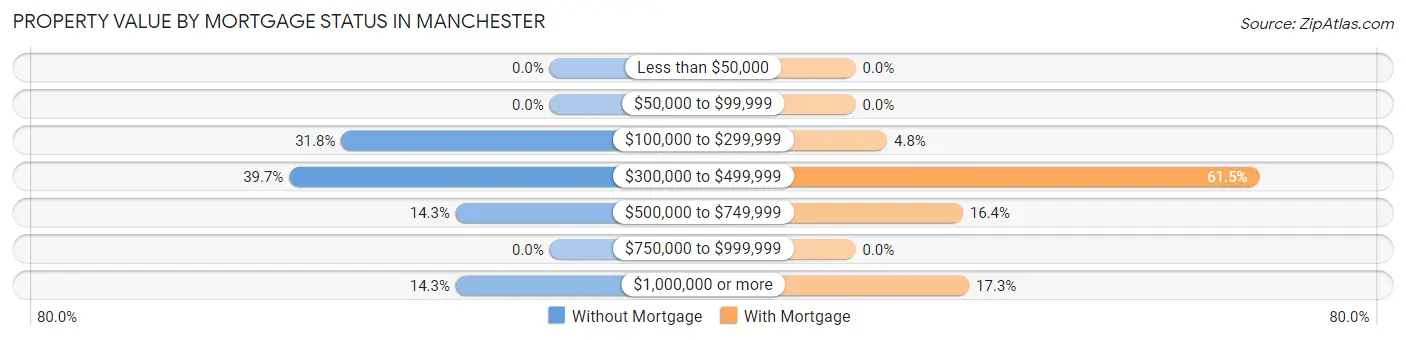
| Property Value | Without Mortgage | With Mortgage |
| Less than $50,000 | 0 (0.0%) | 0 (0.0%) |
| $50,000 to $99,999 | 0 (0.0%) | 0 (0.0%) |
| $100,000 to $299,999 | 20 (31.8%) | 5 (4.8%) |
| $300,000 to $499,999 | 25 (39.7%) | 64 (61.5%) |
| $500,000 to $749,999 | 9 (14.3%) | 17 (16.4%) |
| $750,000 to $999,999 | 0 (0.0%) | 0 (0.0%) |
| $1,000,000 or more | 9 (14.3%) | 18 (17.3%) |
| Total | 63 (100.0%) | 104 (100.0%) |
Household Income by Mortgage Status in Manchester
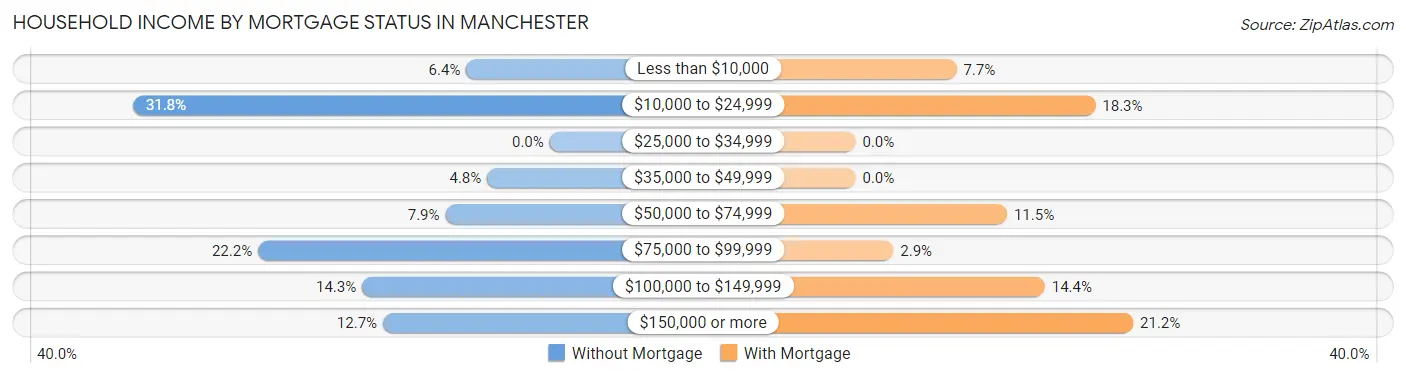
| Household Income | Without Mortgage | With Mortgage |
| Less than $10,000 | 4 (6.4%) | 8 (7.7%) |
| $10,000 to $24,999 | 20 (31.8%) | 19 (18.3%) |
| $25,000 to $34,999 | 0 (0.0%) | 0 (0.0%) |
| $35,000 to $49,999 | 3 (4.8%) | 0 (0.0%) |
| $50,000 to $74,999 | 5 (7.9%) | 12 (11.5%) |
| $75,000 to $99,999 | 14 (22.2%) | 3 (2.9%) |
| $100,000 to $149,999 | 9 (14.3%) | 15 (14.4%) |
| $150,000 or more | 8 (12.7%) | 22 (21.1%) |
| Total | 63 (100.0%) | 104 (100.0%) |
Property Value to Household Income Ratio in Manchester
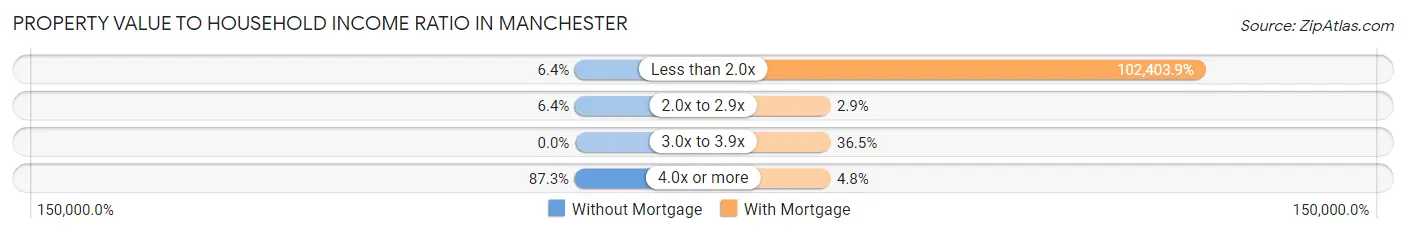
| Value-to-Income Ratio | Without Mortgage | With Mortgage |
| Less than 2.0x | 4 (6.4%) | 106,500 (102,403.9%) |
| 2.0x to 2.9x | 4 (6.4%) | 3 (2.9%) |
| 3.0x to 3.9x | 0 (0.0%) | 38 (36.5%) |
| 4.0x or more | 55 (87.3%) | 5 (4.8%) |
| Total | 63 (100.0%) | 104 (100.0%) |
Real Estate Taxes by Mortgage Status in Manchester
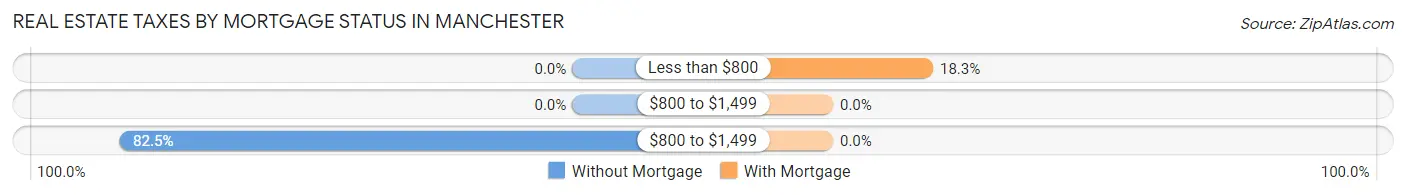
| Property Taxes | Without Mortgage | With Mortgage |
| Less than $800 | 0 (0.0%) | 19 (18.3%) |
| $800 to $1,499 | 0 (0.0%) | 0 (0.0%) |
| $800 to $1,499 | 52 (82.5%) | 0 (0.0%) |
| Total | 63 (100.0%) | 104 (100.0%) |
Health & Disability in Manchester
Health Insurance Coverage by Age in Manchester
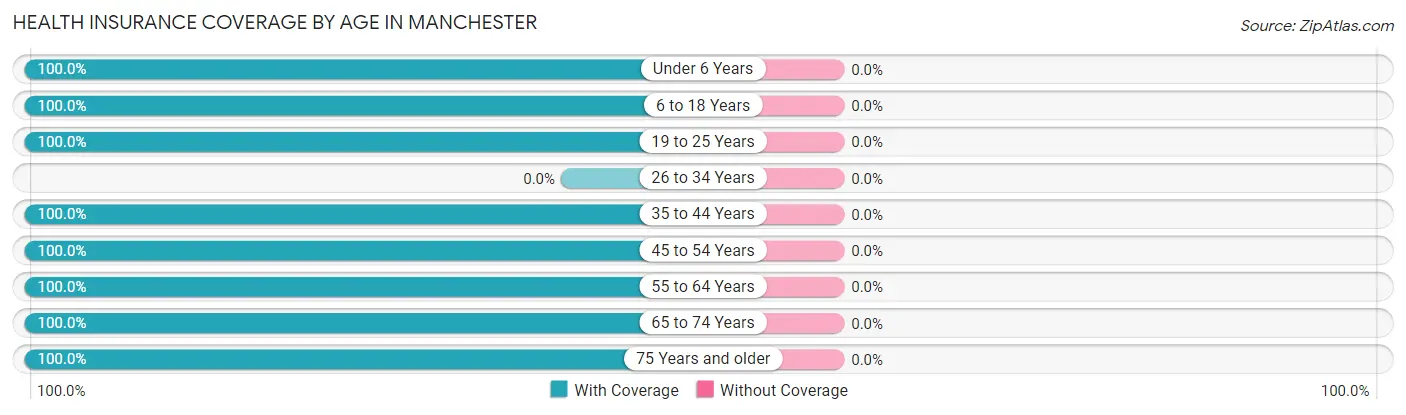
| Age Bracket | With Coverage | Without Coverage |
| Under 6 Years | 6 (100.0%) | 0 (0.0%) |
| 6 to 18 Years | 71 (100.0%) | 0 (0.0%) |
| 19 to 25 Years | 26 (100.0%) | 0 (0.0%) |
| 26 to 34 Years | 0 (0.0%) | 0 (0.0%) |
| 35 to 44 Years | 39 (100.0%) | 0 (0.0%) |
| 45 to 54 Years | 19 (100.0%) | 0 (0.0%) |
| 55 to 64 Years | 212 (100.0%) | 0 (0.0%) |
| 65 to 74 Years | 112 (100.0%) | 0 (0.0%) |
| 75 Years and older | 206 (100.0%) | 0 (0.0%) |
| Total | 691 (100.0%) | 0 (0.0%) |
Health Insurance Coverage by Citizenship Status in Manchester
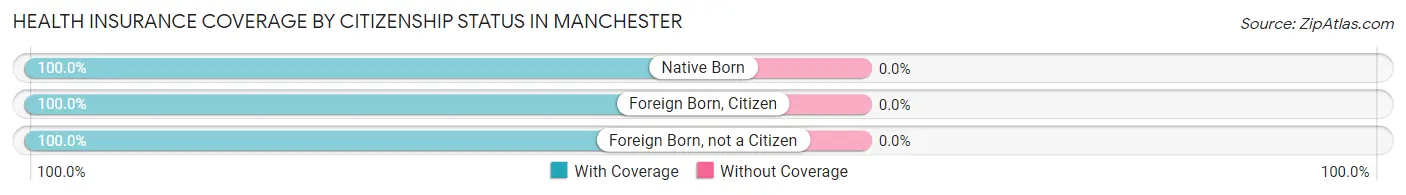
| Citizenship Status | With Coverage | Without Coverage |
| Native Born | 6 (100.0%) | 0 (0.0%) |
| Foreign Born, Citizen | 71 (100.0%) | 0 (0.0%) |
| Foreign Born, not a Citizen | 26 (100.0%) | 0 (0.0%) |
Health Insurance Coverage by Household Income in Manchester
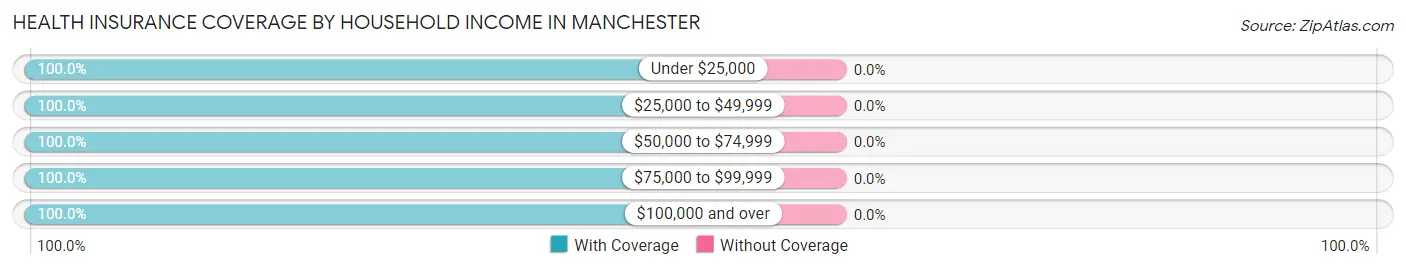
| Household Income | With Coverage | Without Coverage |
| Under $25,000 | 214 (100.0%) | 0 (0.0%) |
| $25,000 to $49,999 | 48 (100.0%) | 0 (0.0%) |
| $50,000 to $74,999 | 103 (100.0%) | 0 (0.0%) |
| $75,000 to $99,999 | 87 (100.0%) | 0 (0.0%) |
| $100,000 and over | 211 (100.0%) | 0 (0.0%) |
Public vs Private Health Insurance Coverage by Age in Manchester
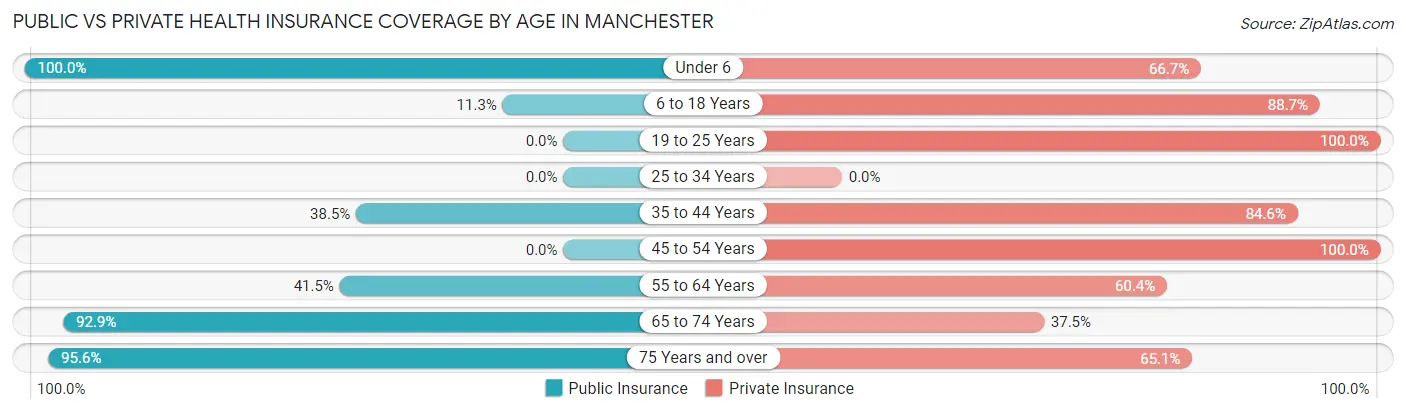
| Age Bracket | Public Insurance | Private Insurance |
| Under 6 | 6 (100.0%) | 4 (66.7%) |
| 6 to 18 Years | 8 (11.3%) | 63 (88.7%) |
| 19 to 25 Years | 0 (0.0%) | 26 (100.0%) |
| 25 to 34 Years | 0 (0.0%) | 0 (0.0%) |
| 35 to 44 Years | 15 (38.5%) | 33 (84.6%) |
| 45 to 54 Years | 0 (0.0%) | 19 (100.0%) |
| 55 to 64 Years | 88 (41.5%) | 128 (60.4%) |
| 65 to 74 Years | 104 (92.9%) | 42 (37.5%) |
| 75 Years and over | 197 (95.6%) | 134 (65.0%) |
| Total | 418 (60.5%) | 449 (65.0%) |
Disability Status by Sex by Age in Manchester
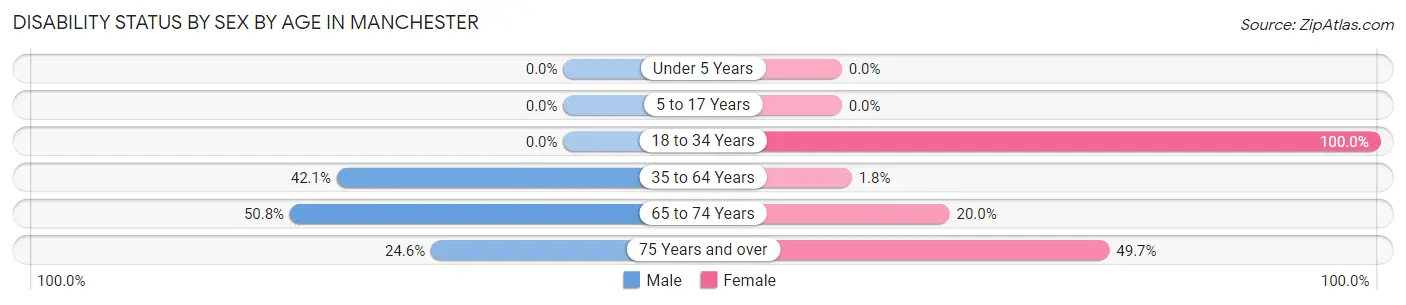
| Age Bracket | Male | Female |
| Under 5 Years | 0 (0.0%) | 0 (0.0%) |
| 5 to 17 Years | 0 (0.0%) | 0 (0.0%) |
| 18 to 34 Years | 0 (0.0%) | 11 (100.0%) |
| 35 to 64 Years | 45 (42.1%) | 3 (1.8%) |
| 65 to 74 Years | 34 (50.7%) | 9 (20.0%) |
| 75 Years and over | 14 (24.6%) | 74 (49.7%) |
Disability Class by Sex by Age in Manchester
Disability Class: Hearing Difficulty
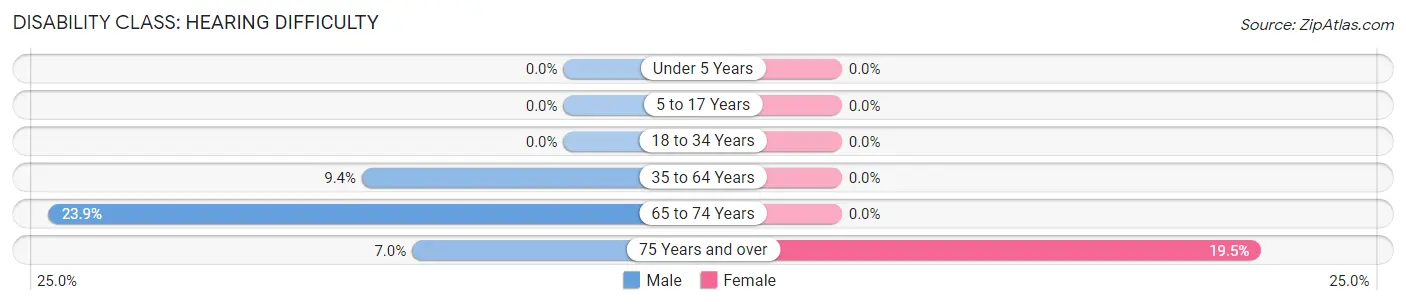
| Age Bracket | Male | Female |
| Under 5 Years | 0 (0.0%) | 0 (0.0%) |
| 5 to 17 Years | 0 (0.0%) | 0 (0.0%) |
| 18 to 34 Years | 0 (0.0%) | 0 (0.0%) |
| 35 to 64 Years | 10 (9.3%) | 0 (0.0%) |
| 65 to 74 Years | 16 (23.9%) | 0 (0.0%) |
| 75 Years and over | 4 (7.0%) | 29 (19.5%) |
Disability Class: Vision Difficulty
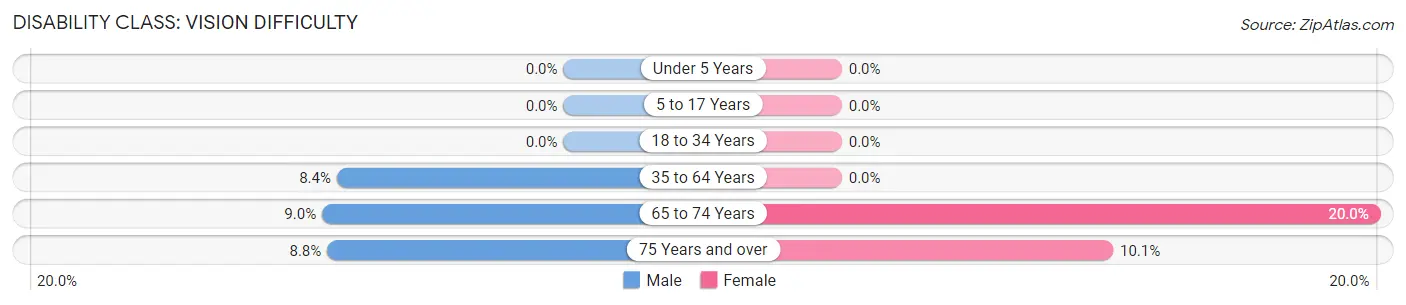
| Age Bracket | Male | Female |
| Under 5 Years | 0 (0.0%) | 0 (0.0%) |
| 5 to 17 Years | 0 (0.0%) | 0 (0.0%) |
| 18 to 34 Years | 0 (0.0%) | 0 (0.0%) |
| 35 to 64 Years | 9 (8.4%) | 0 (0.0%) |
| 65 to 74 Years | 6 (9.0%) | 9 (20.0%) |
| 75 Years and over | 5 (8.8%) | 15 (10.1%) |
Disability Class: Cognitive Difficulty
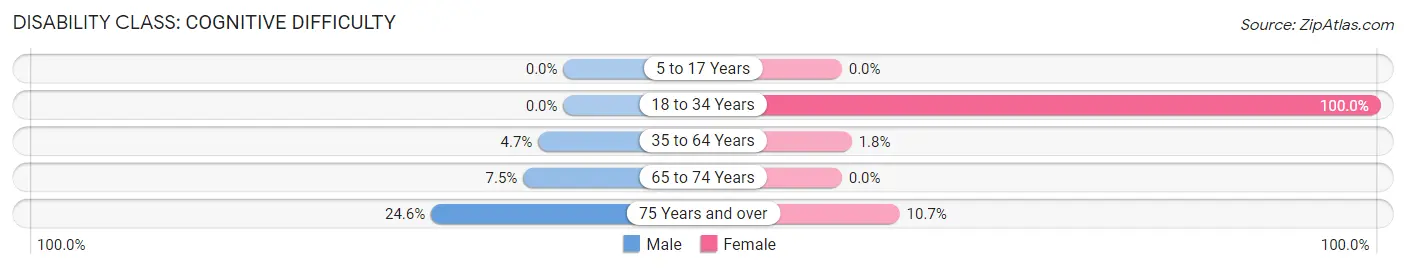
| Age Bracket | Male | Female |
| 5 to 17 Years | 0 (0.0%) | 0 (0.0%) |
| 18 to 34 Years | 0 (0.0%) | 11 (100.0%) |
| 35 to 64 Years | 5 (4.7%) | 3 (1.8%) |
| 65 to 74 Years | 5 (7.5%) | 0 (0.0%) |
| 75 Years and over | 14 (24.6%) | 16 (10.7%) |
Disability Class: Ambulatory Difficulty
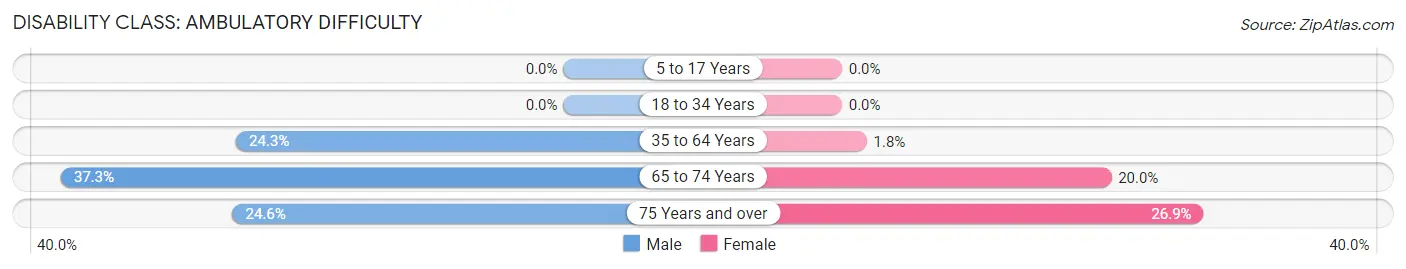
| Age Bracket | Male | Female |
| 5 to 17 Years | 0 (0.0%) | 0 (0.0%) |
| 18 to 34 Years | 0 (0.0%) | 0 (0.0%) |
| 35 to 64 Years | 26 (24.3%) | 3 (1.8%) |
| 65 to 74 Years | 25 (37.3%) | 9 (20.0%) |
| 75 Years and over | 14 (24.6%) | 40 (26.9%) |
Disability Class: Self-Care Difficulty
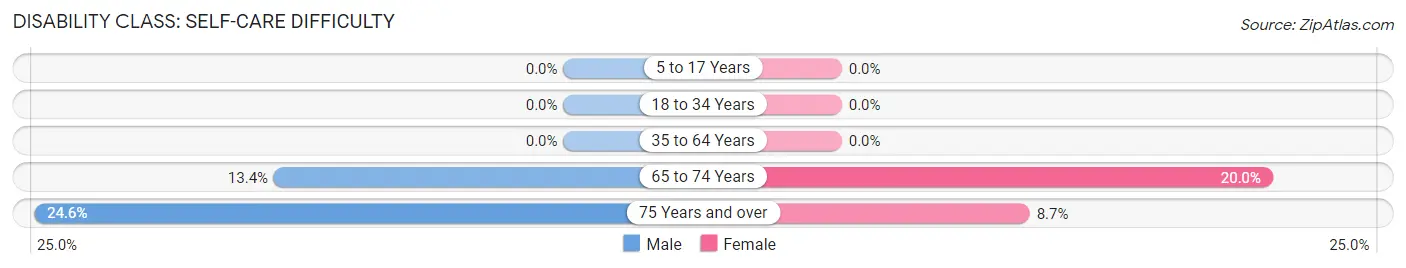
| Age Bracket | Male | Female |
| 5 to 17 Years | 0 (0.0%) | 0 (0.0%) |
| 18 to 34 Years | 0 (0.0%) | 0 (0.0%) |
| 35 to 64 Years | 0 (0.0%) | 0 (0.0%) |
| 65 to 74 Years | 9 (13.4%) | 9 (20.0%) |
| 75 Years and over | 14 (24.6%) | 13 (8.7%) |
Technology Access in Manchester
Computing Device Access in Manchester
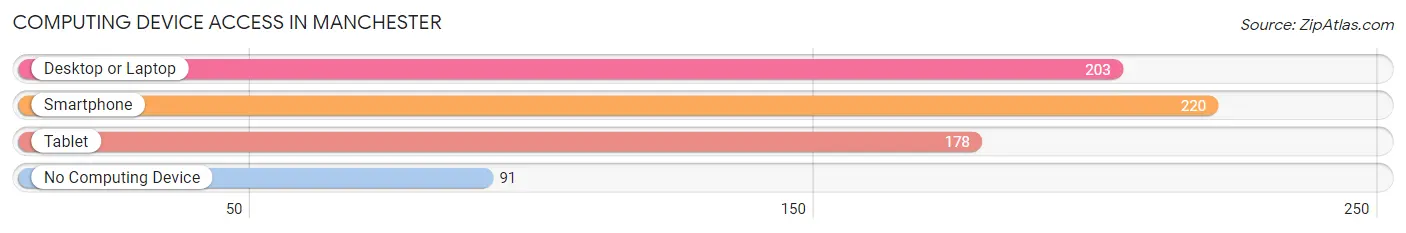
| Device Type | # Households | % Households |
| Desktop or Laptop | 203 | 54.9% |
| Smartphone | 220 | 59.5% |
| Tablet | 178 | 48.1% |
| No Computing Device | 91 | 24.6% |
| Total | 370 | 100.0% |
Internet Access in Manchester
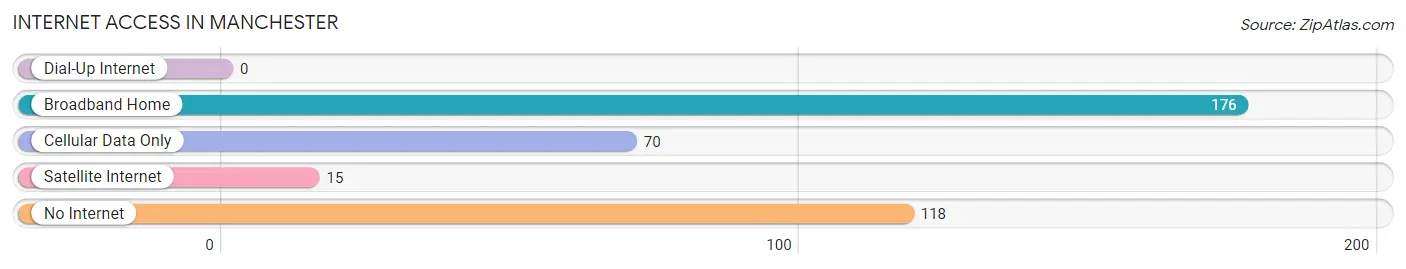
| Internet Type | # Households | % Households |
| Dial-Up Internet | 0 | 0.0% |
| Broadband Home | 176 | 47.6% |
| Cellular Data Only | 70 | 18.9% |
| Satellite Internet | 15 | 4.1% |
| No Internet | 118 | 31.9% |
| Total | 370 | 100.0% |
Manchester Summary
Manchester, Vermont is a small town located in the Green Mountains of the state of Vermont. It is situated in the southwestern corner of the state, just north of the Massachusetts border. The town is home to about 4,000 people and is the largest town in Bennington County.
History
Manchester was first settled in 1761 by a group of settlers from Massachusetts. The town was originally called Manchester-by-the-Sea, but the name was changed to Manchester in 1807. The town was incorporated in 1823.
Manchester was an important stop on the stagecoach route between Boston and Montreal. The town was also a popular summer resort destination for wealthy families from the Northeast. The town was home to several grand hotels, including the Equinox House, which was built in 1853 and is now a National Historic Landmark.
Geography
Manchester is located in the southwestern corner of Vermont, just north of the Massachusetts border. The town is situated in the Green Mountains, with the highest point in the town being the summit of Equinox Mountain at 3,848 feet. The town is drained by the Batten Kill, which flows through the center of town.
The town is bordered by the towns of Dorset to the north, Sunderland to the east, and Arlington to the south. The town is also bordered by the state of Massachusetts to the west.
Economy
Manchester is a popular tourist destination, with many visitors coming to the town to enjoy the natural beauty of the Green Mountains. The town is home to several ski resorts, including Bromley Mountain, Stratton Mountain, and Magic Mountain. The town is also home to the Manchester Designer Outlets, which is a popular shopping destination.
The town is also home to several manufacturing companies, including the Manchester Mills, which produces textiles, and the Manchester Machine Company, which produces machine parts.
Demographics
As of the 2010 census, the population of Manchester was 4,180. The racial makeup of the town was 95.3% White, 0.7% African American, 0.3% Native American, 0.7% Asian, 0.1% Pacific Islander, 0.7% from other races, and 2.1% from two or more races. Hispanic or Latino of any race were 2.2% of the population.
The median household income in Manchester was $50,977, and the median family income was $62,813. The per capita income for the town was $30,945. About 8.3% of families and 11.2% of the population were below the poverty line, including 15.2% of those under age 18 and 5.2% of those age 65 or over.
Common Questions
What is Per Capita Income in Manchester?
Per Capita income in Manchester is $37,105.
What is the Median Family Income in Manchester?
Median Family Income in Manchester is $88,000.
What is the Median Household income in Manchester?
Median Household Income in Manchester is $33,750.
What is Inequality or Gini Index in Manchester?
Inequality or Gini Index in Manchester is 0.58.
What is the Total Population of Manchester?
Total Population of Manchester is 703.
What is the Total Male Population of Manchester?
Total Male Population of Manchester is 323.
What is the Total Female Population of Manchester?
Total Female Population of Manchester is 380.
What is the Ratio of Males per 100 Females in Manchester?
There are 85.00 Males per 100 Females in Manchester.
What is the Ratio of Females per 100 Males in Manchester?
There are 117.65 Females per 100 Males in Manchester.
What is the Median Population Age in Manchester?
Median Population Age in Manchester is 63.8 Years.
What is the Average Family Size in Manchester
Average Family Size in Manchester is 2.9 People.
What is the Average Household Size in Manchester
Average Household Size in Manchester is 1.8 People.
How Large is the Labor Force in Manchester?
There are 220 People in the Labor Forcein in Manchester.
What is the Percentage of People in the Labor Force in Manchester?
32.4% of People are in the Labor Force in Manchester.