Alamo, TX Map & Demographics
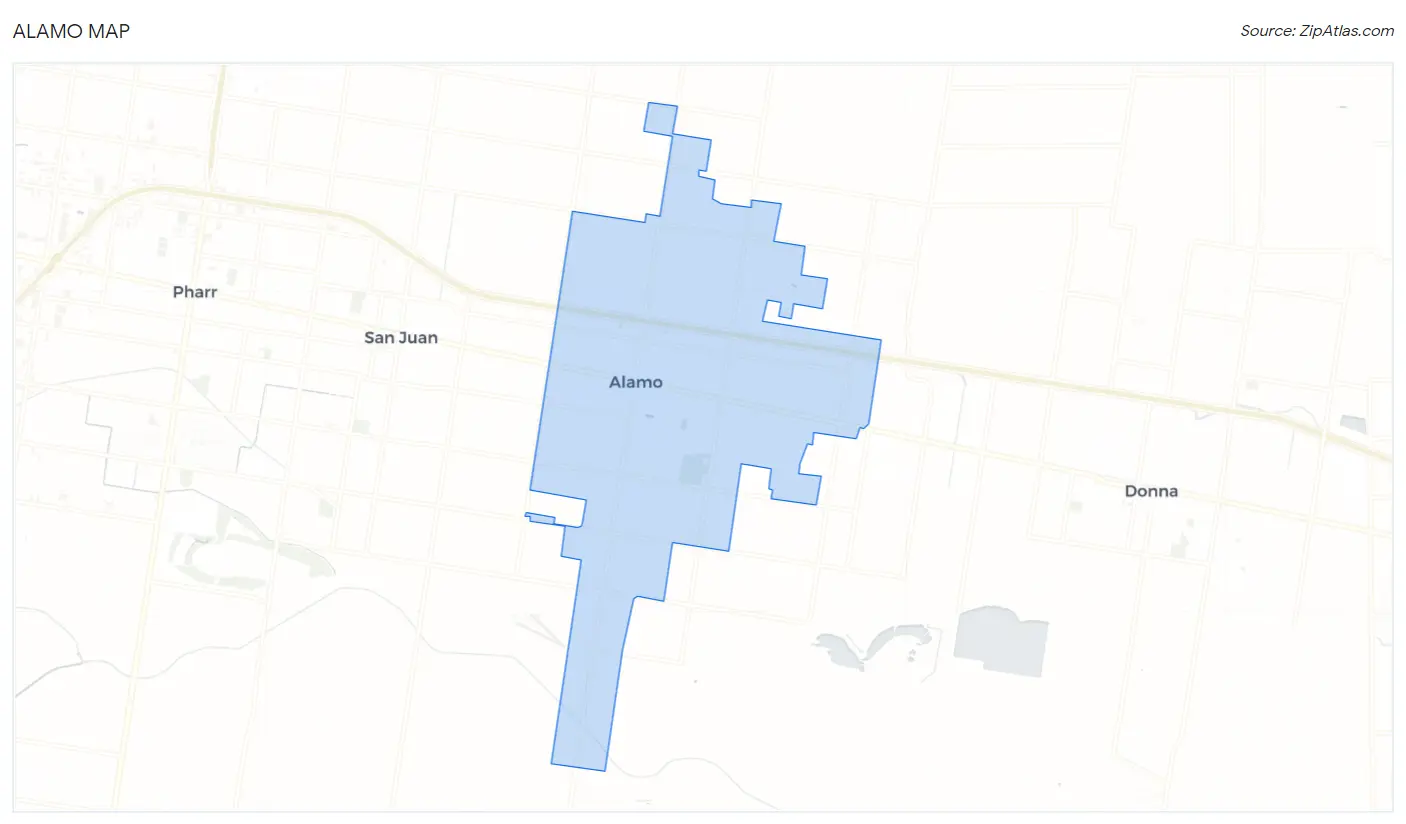
Alamo Map
Alamo Overview
$19,402
PER CAPITA INCOME
$55,187
AVG FAMILY INCOME
$47,398
AVG HOUSEHOLD INCOME
34.8%
WAGE / INCOME GAP [ % ]
65.2¢/ $1
WAGE / INCOME GAP [ $ ]
$9,694
FAMILY INCOME DEFICIT
0.46
INEQUALITY / GINI INDEX
19,811
TOTAL POPULATION
9,619
MALE POPULATION
10,192
FEMALE POPULATION
94.38
MALES / 100 FEMALES
105.96
FEMALES / 100 MALES
30.1
MEDIAN AGE
3.9
AVG FAMILY SIZE
3.3
AVG HOUSEHOLD SIZE
7,503
LABOR FORCE [ PEOPLE ]
53.5%
PERCENT IN LABOR FORCE
9.4%
UNEMPLOYMENT RATE
Alamo Zip Codes
Alamo Area Codes
Income in Alamo
Income Overview in Alamo
Per Capita Income in Alamo is $19,402, while median incomes of families and households are $55,187 and $47,398 respectively.
| Characteristic | Number | Measure |
| Per Capita Income | 19,811 | $19,402 |
| Median Family Income | 4,566 | $55,187 |
| Mean Family Income | 4,566 | $70,732 |
| Median Household Income | 5,993 | $47,398 |
| Mean Household Income | 5,993 | $62,424 |
| Income Deficit | 4,566 | $9,694 |
| Wage / Income Gap (%) | 19,811 | 34.76% |
| Wage / Income Gap ($) | 19,811 | 65.24¢ per $1 |
| Gini / Inequality Index | 19,811 | 0.46 |
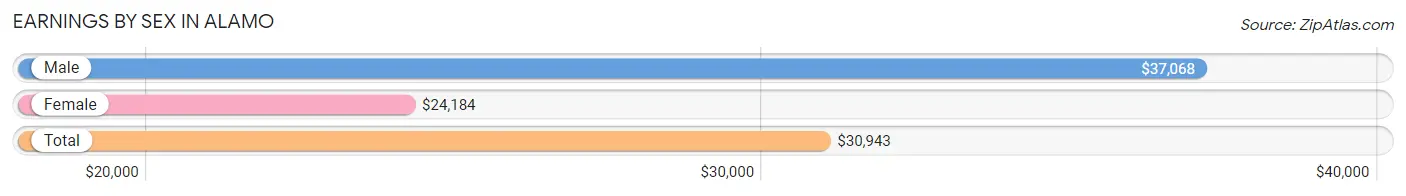
Earnings by Sex in Alamo
Average Earnings in Alamo are $30,943, $37,068 for men and $24,184 for women, a difference of 34.8%.
| Sex | Number | Average Earnings |
| Male | 4,284 (55.3%) | $37,068 |
| Female | 3,463 (44.7%) | $24,184 |
| Total | 7,747 (100.0%) | $30,943 |
Earnings by Sex by Income Bracket in Alamo
The most common earnings brackets in Alamo are $35,000 to $39,999 for men (509 | 11.9%) and $55,000 to $64,999 for women (314 | 9.1%).
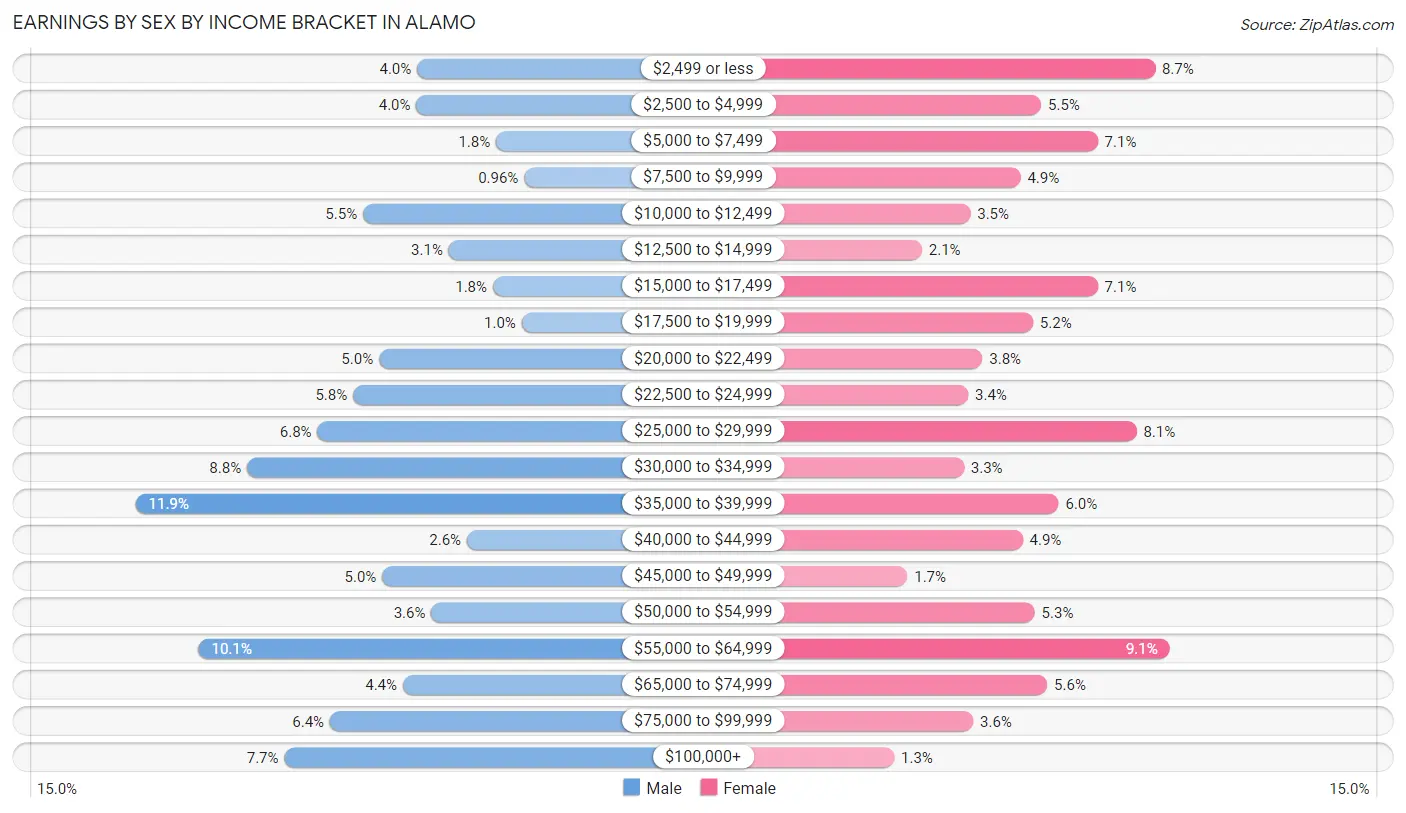
| Income | Male | Female |
| $2,499 or less | 170 (4.0%) | 300 (8.7%) |
| $2,500 to $4,999 | 171 (4.0%) | 189 (5.5%) |
| $5,000 to $7,499 | 75 (1.8%) | 244 (7.0%) |
| $7,500 to $9,999 | 41 (1.0%) | 169 (4.9%) |
| $10,000 to $12,499 | 235 (5.5%) | 120 (3.5%) |
| $12,500 to $14,999 | 132 (3.1%) | 73 (2.1%) |
| $15,000 to $17,499 | 79 (1.8%) | 244 (7.0%) |
| $17,500 to $19,999 | 44 (1.0%) | 181 (5.2%) |
| $20,000 to $22,499 | 216 (5.0%) | 132 (3.8%) |
| $22,500 to $24,999 | 247 (5.8%) | 118 (3.4%) |
| $25,000 to $29,999 | 290 (6.8%) | 282 (8.1%) |
| $30,000 to $34,999 | 375 (8.7%) | 114 (3.3%) |
| $35,000 to $39,999 | 509 (11.9%) | 206 (5.9%) |
| $40,000 to $44,999 | 110 (2.6%) | 171 (4.9%) |
| $45,000 to $49,999 | 212 (5.0%) | 59 (1.7%) |
| $50,000 to $54,999 | 153 (3.6%) | 183 (5.3%) |
| $55,000 to $64,999 | 433 (10.1%) | 314 (9.1%) |
| $65,000 to $74,999 | 187 (4.4%) | 195 (5.6%) |
| $75,000 to $99,999 | 275 (6.4%) | 123 (3.5%) |
| $100,000+ | 330 (7.7%) | 46 (1.3%) |
| Total | 4,284 (100.0%) | 3,463 (100.0%) |
Earnings by Sex by Educational Attainment in Alamo
Average earnings in Alamo are $38,242 for men and $30,885 for women, a difference of 19.2%. Men with an educational attainment of bachelor's degree enjoy the highest average annual earnings of $49,819, while those with less than high school education earn the least with $29,949. Women with an educational attainment of graduate degree earn the most with the average annual earnings of $58,355, while those with less than high school education have the smallest earnings of $15,662.
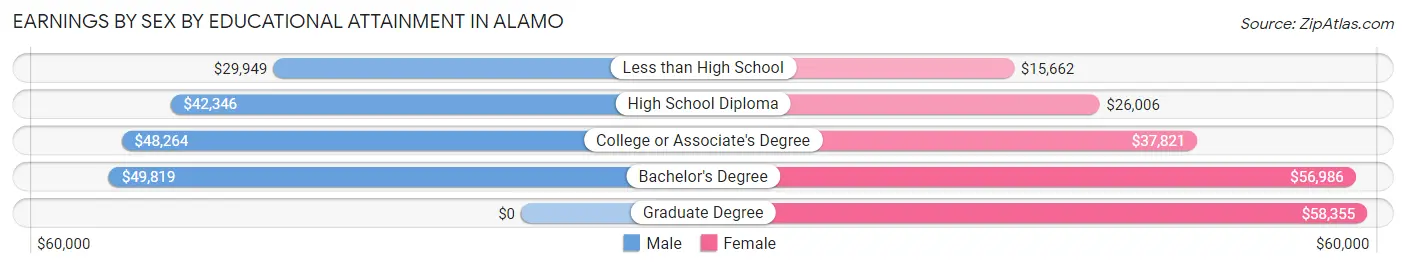
| Educational Attainment | Male Income | Female Income |
| Less than High School | $29,949 | $15,662 |
| High School Diploma | $42,346 | $26,006 |
| College or Associate's Degree | $48,264 | $37,821 |
| Bachelor's Degree | $49,819 | $56,986 |
| Graduate Degree | - | - |
| Total | $38,242 | $30,885 |
Family Income in Alamo
Family Income Brackets in Alamo
According to the Alamo family income data, there are 767 families falling into the $50,000 to $74,999 income range, which is the most common income bracket and makes up 16.8% of all families. Conversely, the $200,000+ income bracket is the least frequent group with only 123 families (2.7%) belonging to this category.
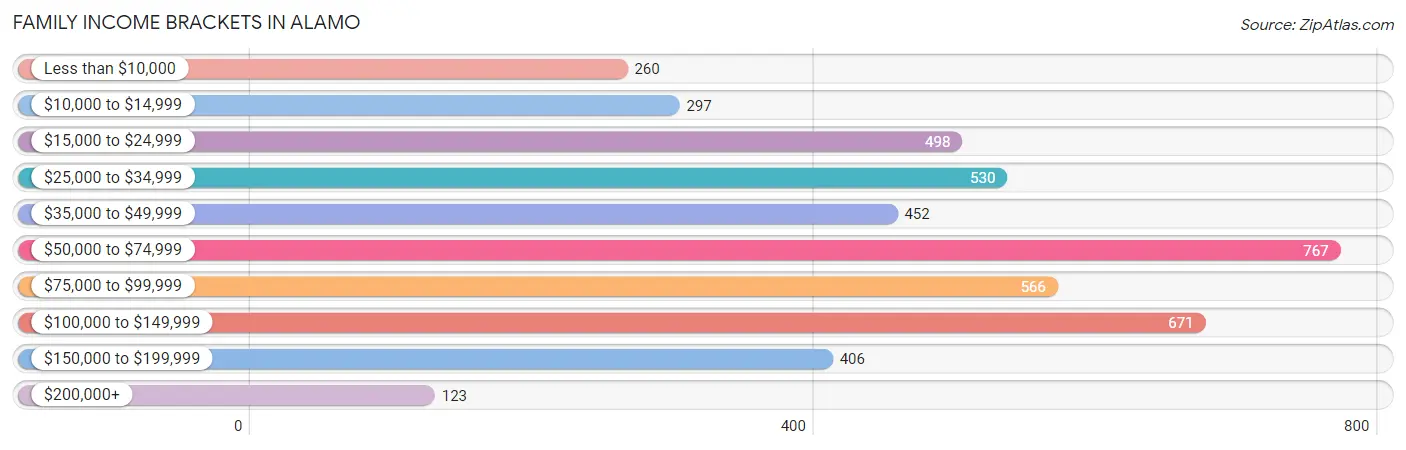
| Income Bracket | # Families | % Families |
| Less than $10,000 | 260 | 5.7% |
| $10,000 to $14,999 | 297 | 6.5% |
| $15,000 to $24,999 | 498 | 10.9% |
| $25,000 to $34,999 | 530 | 11.6% |
| $35,000 to $49,999 | 452 | 9.9% |
| $50,000 to $74,999 | 767 | 16.8% |
| $75,000 to $99,999 | 566 | 12.4% |
| $100,000 to $149,999 | 671 | 14.7% |
| $150,000 to $199,999 | 406 | 8.9% |
| $200,000+ | 123 | 2.7% |
Family Income by Famaliy Size in Alamo
7+ person families (340 | 7.4%) account for the highest median family income in Alamo with $167,913 per family, while 7+ person families (340 | 7.4%) have the highest median income of $23,988 per family member.
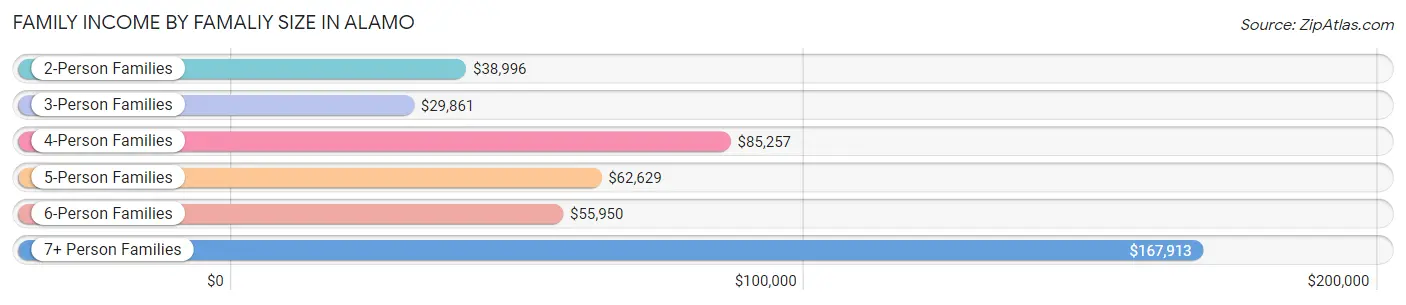
| Income Bracket | # Families | Median Income |
| 2-Person Families | 1,639 (35.9%) | $38,996 |
| 3-Person Families | 946 (20.7%) | $29,861 |
| 4-Person Families | 581 (12.7%) | $85,257 |
| 5-Person Families | 611 (13.4%) | $62,629 |
| 6-Person Families | 449 (9.8%) | $55,950 |
| 7+ Person Families | 340 (7.4%) | $167,913 |
| Total | 4,566 (100.0%) | $55,187 |
Family Income by Number of Earners in Alamo
The median family income in Alamo is $55,187, with families comprising 3+ earners (661) having the highest median family income of $149,561, while families with no earners (1,219) have the lowest median family income of $24,943, accounting for 14.5% and 26.7% of families, respectively.
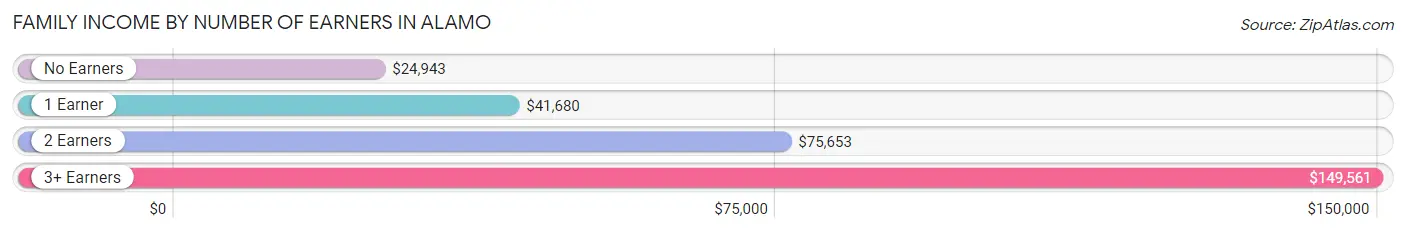
| Number of Earners | # Families | Median Income |
| No Earners | 1,219 (26.7%) | $24,943 |
| 1 Earner | 1,303 (28.5%) | $41,680 |
| 2 Earners | 1,383 (30.3%) | $75,653 |
| 3+ Earners | 661 (14.5%) | $149,561 |
| Total | 4,566 (100.0%) | $55,187 |
Household Income in Alamo
Household Income Brackets in Alamo
With 977 households falling in the category, the $50,000 to $74,999 income range is the most frequent in Alamo, accounting for 16.3% of all households. In contrast, only 126 households (2.1%) fall into the $200,000+ income bracket, making it the least populous group.
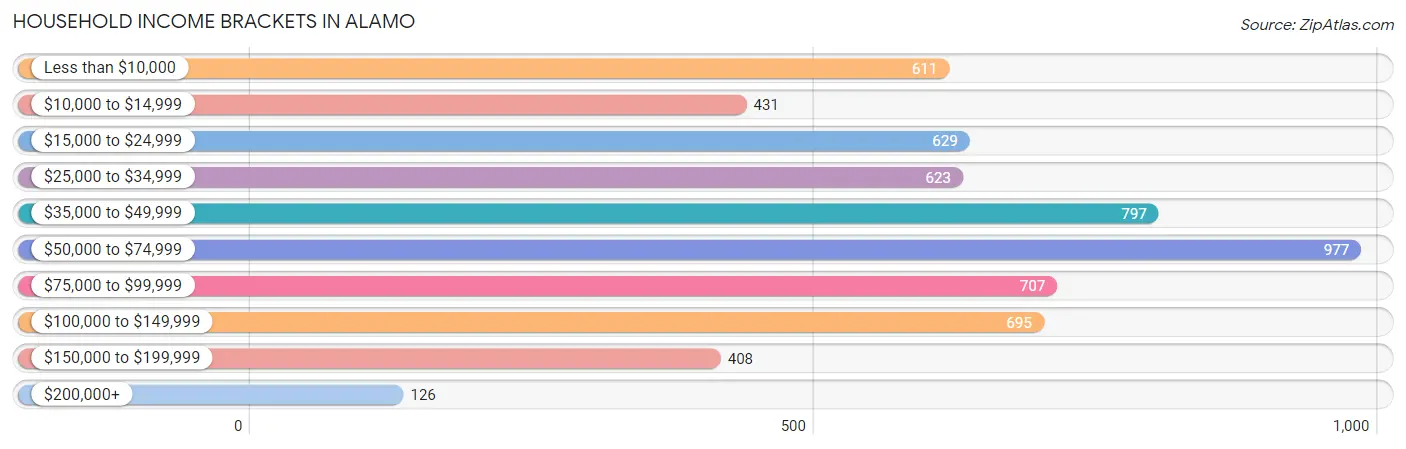
| Income Bracket | # Households | % Households |
| Less than $10,000 | 611 | 10.2% |
| $10,000 to $14,999 | 431 | 7.2% |
| $15,000 to $24,999 | 629 | 10.5% |
| $25,000 to $34,999 | 623 | 10.4% |
| $35,000 to $49,999 | 797 | 13.3% |
| $50,000 to $74,999 | 977 | 16.3% |
| $75,000 to $99,999 | 707 | 11.8% |
| $100,000 to $149,999 | 695 | 11.6% |
| $150,000 to $199,999 | 408 | 6.8% |
| $200,000+ | 126 | 2.1% |
Household Income by Householder Age in Alamo
The median household income in Alamo is $47,398, with the highest median household income of $56,698 found in the 25 to 44 years age bracket for the primary householder. A total of 1,603 households (26.8%) fall into this category. Meanwhile, the 15 to 24 years age bracket for the primary householder has the lowest median household income of $12,786, with 384 households (6.4%) in this group.
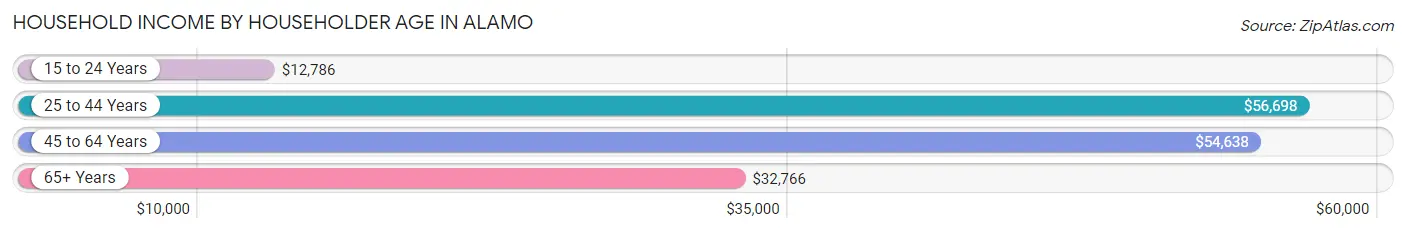
| Income Bracket | # Households | Median Income |
| 15 to 24 Years | 384 (6.4%) | $12,786 |
| 25 to 44 Years | 1,603 (26.8%) | $56,698 |
| 45 to 64 Years | 2,245 (37.5%) | $54,638 |
| 65+ Years | 1,761 (29.4%) | $32,766 |
| Total | 5,993 (100.0%) | $47,398 |
Poverty in Alamo
Income Below Poverty by Sex and Age in Alamo
With 20.7% poverty level for males and 27.3% for females among the residents of Alamo, 6 to 11 year old males and 15 year old females are the most vulnerable to poverty, with 387 males (36.9%) and 88 females (77.2%) in their respective age groups living below the poverty level.
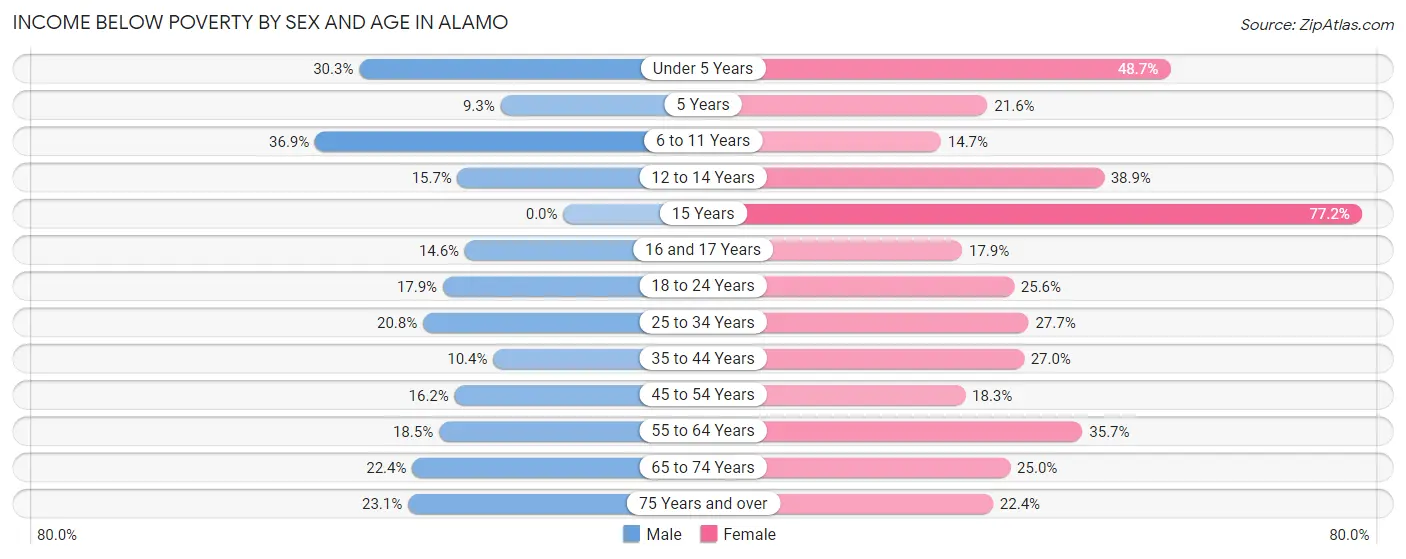
| Age Bracket | Male | Female |
| Under 5 Years | 267 (30.3%) | 423 (48.7%) |
| 5 Years | 21 (9.3%) | 48 (21.6%) |
| 6 to 11 Years | 387 (36.9%) | 190 (14.7%) |
| 12 to 14 Years | 99 (15.7%) | 154 (38.9%) |
| 15 Years | 0 (0.0%) | 88 (77.2%) |
| 16 and 17 Years | 51 (14.6%) | 40 (17.9%) |
| 18 to 24 Years | 182 (17.9%) | 336 (25.6%) |
| 25 to 34 Years | 236 (20.8%) | 347 (27.7%) |
| 35 to 44 Years | 94 (10.4%) | 228 (27.0%) |
| 45 to 54 Years | 142 (16.2%) | 191 (18.3%) |
| 55 to 64 Years | 176 (18.5%) | 349 (35.7%) |
| 65 to 74 Years | 172 (22.4%) | 224 (25.0%) |
| 75 Years and over | 166 (23.1%) | 164 (22.4%) |
| Total | 1,993 (20.7%) | 2,782 (27.3%) |
Income Above Poverty by Sex and Age in Alamo
According to the poverty statistics in Alamo, males aged 15 years and females aged 6 to 11 years are the age groups that are most secure financially, with 100.0% of males and 85.3% of females in these age groups living above the poverty line.
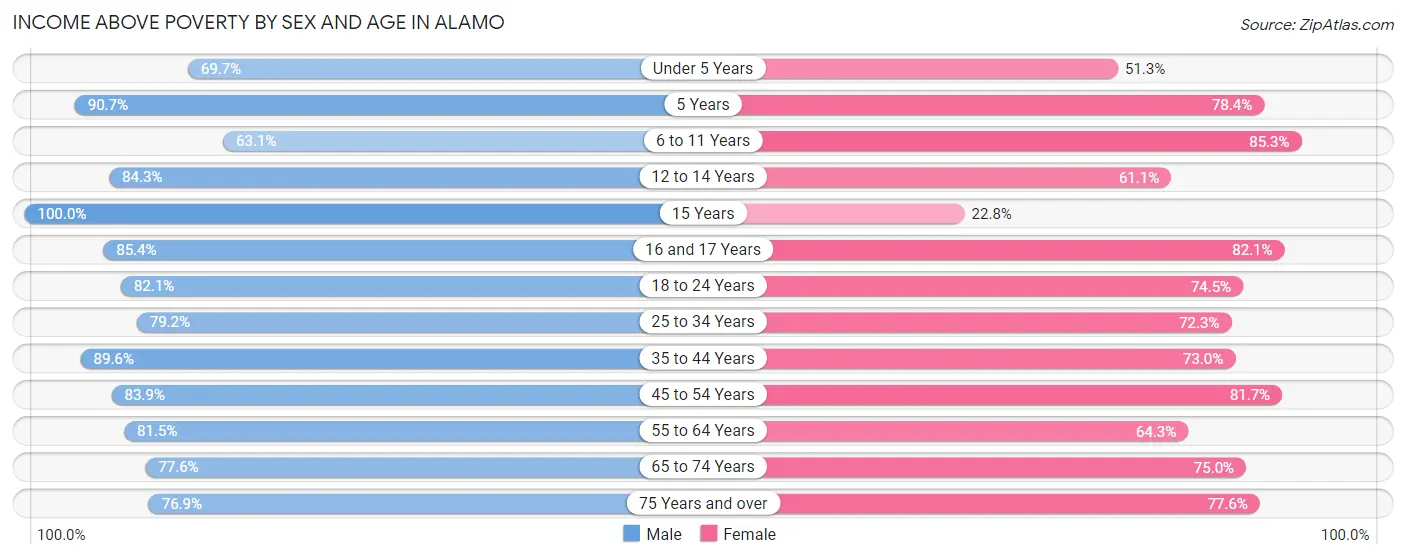
| Age Bracket | Male | Female |
| Under 5 Years | 614 (69.7%) | 445 (51.3%) |
| 5 Years | 204 (90.7%) | 174 (78.4%) |
| 6 to 11 Years | 663 (63.1%) | 1,102 (85.3%) |
| 12 to 14 Years | 532 (84.3%) | 242 (61.1%) |
| 15 Years | 108 (100.0%) | 26 (22.8%) |
| 16 and 17 Years | 298 (85.4%) | 184 (82.1%) |
| 18 to 24 Years | 836 (82.1%) | 979 (74.5%) |
| 25 to 34 Years | 897 (79.2%) | 905 (72.3%) |
| 35 to 44 Years | 810 (89.6%) | 616 (73.0%) |
| 45 to 54 Years | 737 (83.9%) | 852 (81.7%) |
| 55 to 64 Years | 777 (81.5%) | 628 (64.3%) |
| 65 to 74 Years | 595 (77.6%) | 672 (75.0%) |
| 75 Years and over | 554 (76.9%) | 567 (77.6%) |
| Total | 7,625 (79.3%) | 7,392 (72.7%) |
Income Below Poverty Among Married-Couple Families in Alamo
The poverty statistics for married-couple families in Alamo show that 18.4% or 571 of the total 3,101 families live below the poverty line. Families with 3 or 4 children have the highest poverty rate of 23.4%, comprising of 132 families. On the other hand, families with 5 or more children have the lowest poverty rate of 0.0%, which includes 0 families.
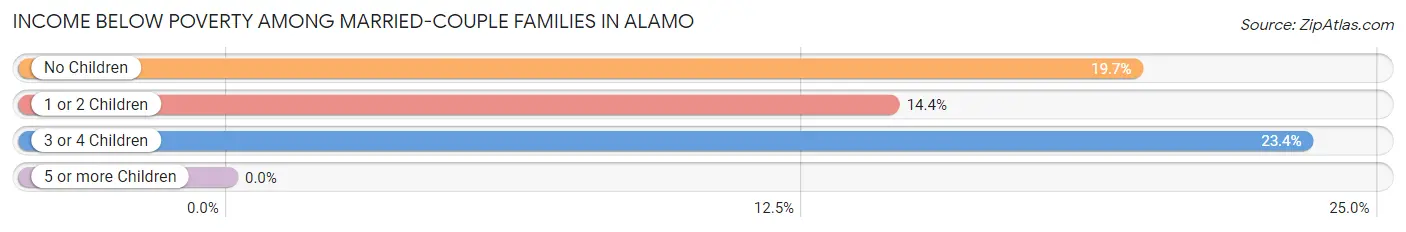
| Children | Above Poverty | Below Poverty |
| No Children | 1,333 (80.3%) | 327 (19.7%) |
| 1 or 2 Children | 666 (85.6%) | 112 (14.4%) |
| 3 or 4 Children | 432 (76.6%) | 132 (23.4%) |
| 5 or more Children | 99 (100.0%) | 0 (0.0%) |
| Total | 2,530 (81.6%) | 571 (18.4%) |
Income Below Poverty Among Single-Parent Households in Alamo
According to the poverty data in Alamo, 14.2% or 35 single-father households and 41.6% or 507 single-mother households are living below the poverty line. Among single-father households, those with 3 or 4 children have the highest poverty rate, with 9 households (26.5%) experiencing poverty. Likewise, among single-mother households, those with 1 or 2 children have the highest poverty rate, with 303 households (48.2%) falling below the poverty line.
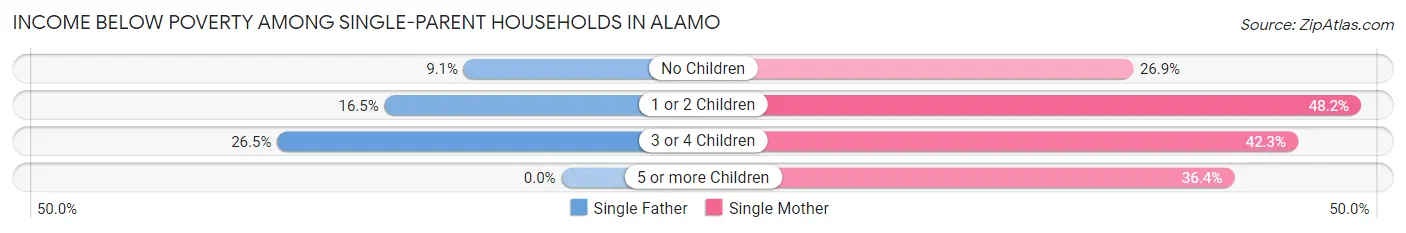
| Children | Single Father | Single Mother |
| No Children | 11 (9.1%) | 73 (26.9%) |
| 1 or 2 Children | 15 (16.5%) | 303 (48.2%) |
| 3 or 4 Children | 9 (26.5%) | 107 (42.3%) |
| 5 or more Children | 0 (0.0%) | 24 (36.4%) |
| Total | 35 (14.2%) | 507 (41.6%) |
Income Below Poverty Among Married-Couple vs Single-Parent Households in Alamo
The poverty data for Alamo shows that 571 of the married-couple family households (18.4%) and 542 of the single-parent households (37.0%) are living below the poverty level. Within the married-couple family households, those with 3 or 4 children have the highest poverty rate, with 132 households (23.4%) falling below the poverty line. Among the single-parent households, those with 1 or 2 children have the highest poverty rate, with 318 household (44.2%) living below poverty.
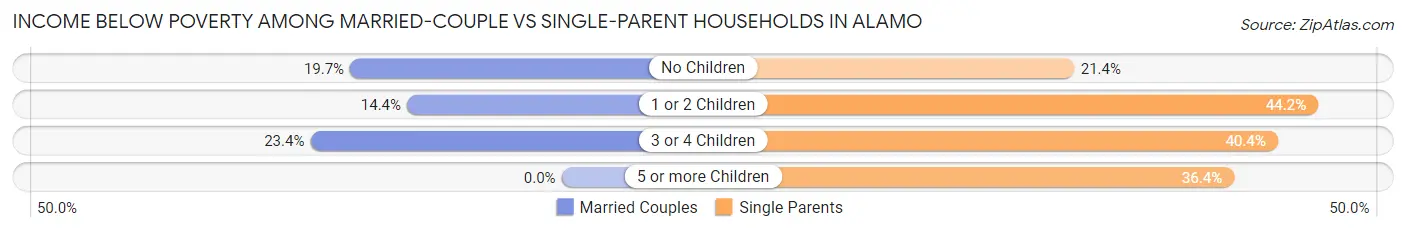
| Children | Married-Couple Families | Single-Parent Households |
| No Children | 327 (19.7%) | 84 (21.4%) |
| 1 or 2 Children | 112 (14.4%) | 318 (44.2%) |
| 3 or 4 Children | 132 (23.4%) | 116 (40.4%) |
| 5 or more Children | 0 (0.0%) | 24 (36.4%) |
| Total | 571 (18.4%) | 542 (37.0%) |
Race in Alamo
The most populous races in Alamo are Hispanic or Latino (17,062 | 86.1%), White / Caucasian (12,875 | 65.0%), and Two or more Races (5,726 | 28.9%).
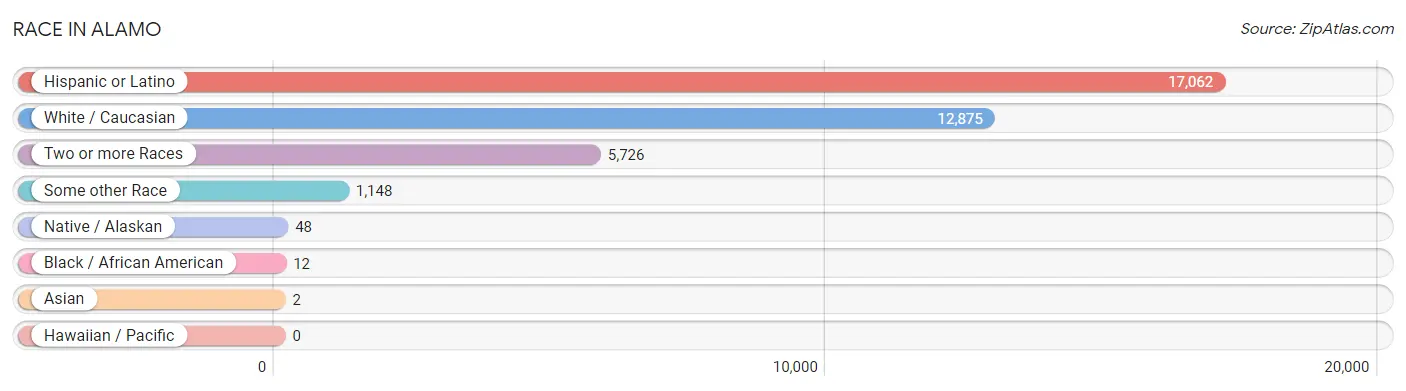
| Race | # Population | % Population |
| Asian | 2 | 0.0% |
| Black / African American | 12 | 0.1% |
| Hawaiian / Pacific | 0 | 0.0% |
| Hispanic or Latino | 17,062 | 86.1% |
| Native / Alaskan | 48 | 0.2% |
| White / Caucasian | 12,875 | 65.0% |
| Two or more Races | 5,726 | 28.9% |
| Some other Race | 1,148 | 5.8% |
| Total | 19,811 | 100.0% |
Ancestry in Alamo
The most populous ancestries reported in Alamo are Mexican (16,744 | 84.5%), German (910 | 4.6%), Irish (263 | 1.3%), English (259 | 1.3%), and Scottish (184 | 0.9%), together accounting for 92.7% of all Alamo residents.
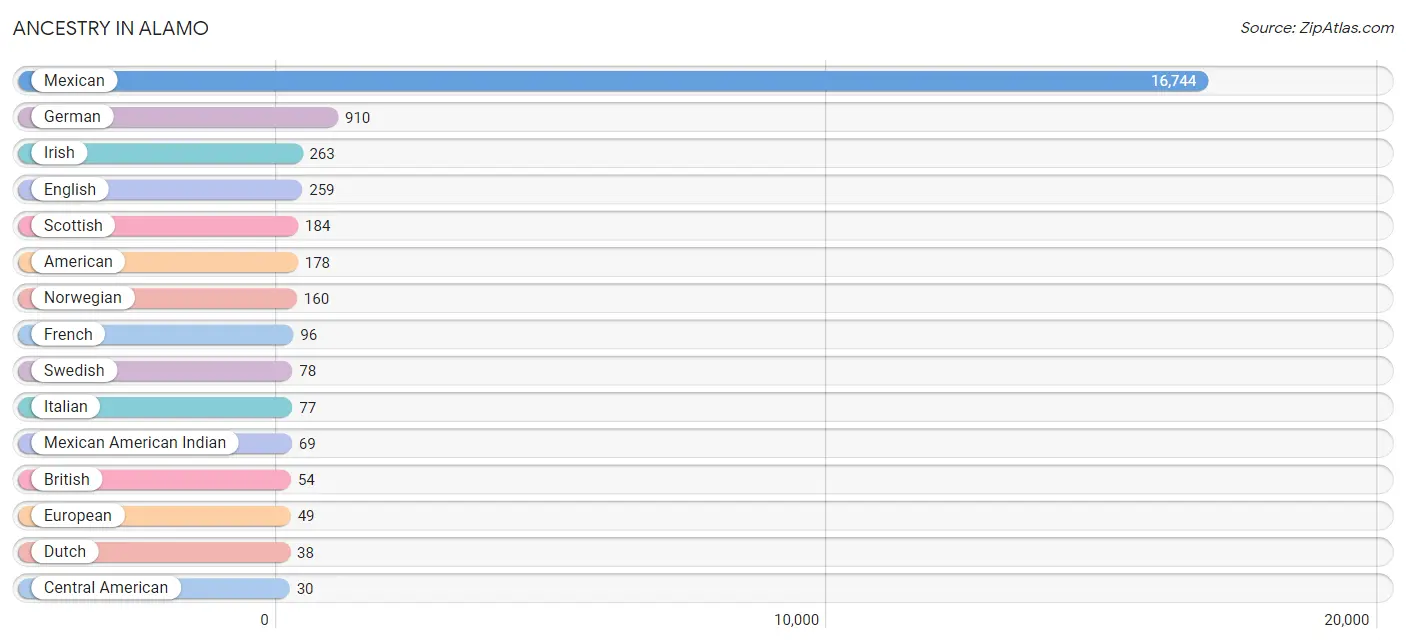
| Ancestry | # Population | % Population |
| American | 178 | 0.9% |
| British | 54 | 0.3% |
| Central American | 30 | 0.2% |
| Czech | 28 | 0.1% |
| Czechoslovakian | 22 | 0.1% |
| Danish | 17 | 0.1% |
| Dutch | 38 | 0.2% |
| English | 259 | 1.3% |
| European | 49 | 0.3% |
| French | 96 | 0.5% |
| German | 910 | 4.6% |
| Honduran | 30 | 0.2% |
| Irish | 263 | 1.3% |
| Italian | 77 | 0.4% |
| Korean | 3 | 0.0% |
| Lithuanian | 8 | 0.0% |
| Mexican | 16,744 | 84.5% |
| Mexican American Indian | 69 | 0.4% |
| Northern European | 5 | 0.0% |
| Norwegian | 160 | 0.8% |
| Peruvian | 4 | 0.0% |
| Polish | 8 | 0.0% |
| Puerto Rican | 16 | 0.1% |
| Scandinavian | 8 | 0.0% |
| Scotch-Irish | 14 | 0.1% |
| Scottish | 184 | 0.9% |
| South American | 4 | 0.0% |
| Swedish | 78 | 0.4% |
| Swiss | 19 | 0.1% |
| Welsh | 7 | 0.0% | View All 30 Rows |
Immigrants in Alamo
The most numerous immigrant groups reported in Alamo came from Latin America (4,245 | 21.4%), Central America (4,234 | 21.4%), Mexico (4,204 | 21.2%), Europe (54 | 0.3%), and Germany (41 | 0.2%), together accounting for 64.5% of all Alamo residents.
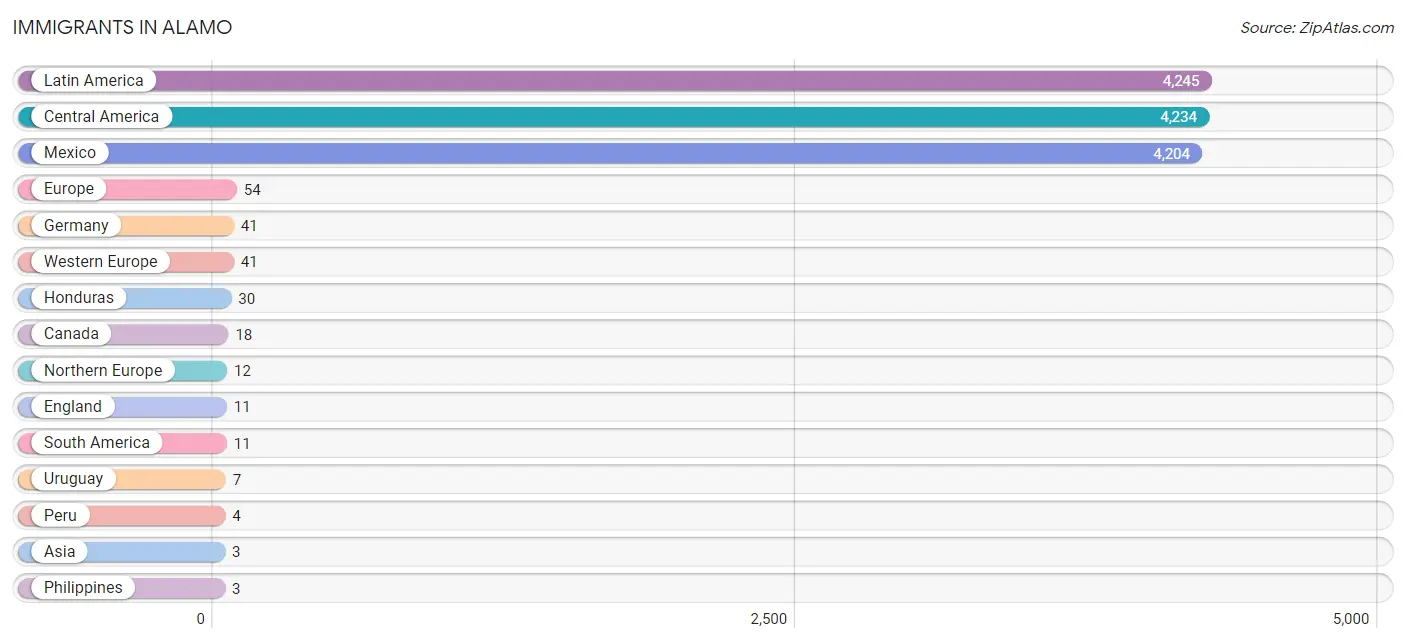
| Immigration Origin | # Population | % Population |
| Asia | 3 | 0.0% |
| Canada | 18 | 0.1% |
| Central America | 4,234 | 21.4% |
| Eastern Europe | 1 | 0.0% |
| England | 11 | 0.1% |
| Europe | 54 | 0.3% |
| Germany | 41 | 0.2% |
| Honduras | 30 | 0.2% |
| Ireland | 1 | 0.0% |
| Latin America | 4,245 | 21.4% |
| Mexico | 4,204 | 21.2% |
| Northern Europe | 12 | 0.1% |
| Peru | 4 | 0.0% |
| Philippines | 3 | 0.0% |
| Poland | 1 | 0.0% |
| South America | 11 | 0.1% |
| South Eastern Asia | 3 | 0.0% |
| Uruguay | 7 | 0.0% |
| Western Europe | 41 | 0.2% | View All 19 Rows |
Sex and Age in Alamo
Sex and Age in Alamo
The most populous age groups in Alamo are 5 to 9 Years (956 | 9.9%) for men and 5 to 9 Years (1,202 | 11.8%) for women.
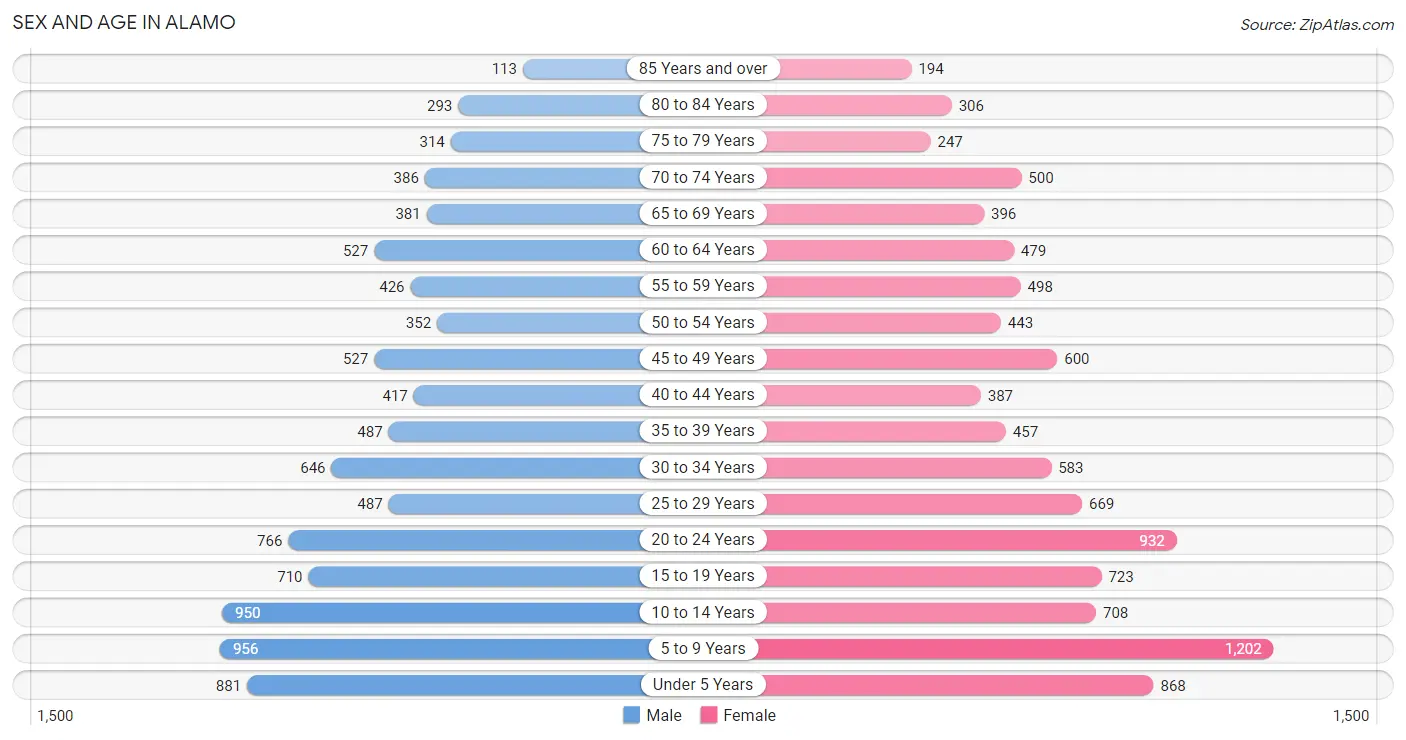
| Age Bracket | Male | Female |
| Under 5 Years | 881 (9.2%) | 868 (8.5%) |
| 5 to 9 Years | 956 (9.9%) | 1,202 (11.8%) |
| 10 to 14 Years | 950 (9.9%) | 708 (7.0%) |
| 15 to 19 Years | 710 (7.4%) | 723 (7.1%) |
| 20 to 24 Years | 766 (8.0%) | 932 (9.1%) |
| 25 to 29 Years | 487 (5.1%) | 669 (6.6%) |
| 30 to 34 Years | 646 (6.7%) | 583 (5.7%) |
| 35 to 39 Years | 487 (5.1%) | 457 (4.5%) |
| 40 to 44 Years | 417 (4.3%) | 387 (3.8%) |
| 45 to 49 Years | 527 (5.5%) | 600 (5.9%) |
| 50 to 54 Years | 352 (3.7%) | 443 (4.3%) |
| 55 to 59 Years | 426 (4.4%) | 498 (4.9%) |
| 60 to 64 Years | 527 (5.5%) | 479 (4.7%) |
| 65 to 69 Years | 381 (4.0%) | 396 (3.9%) |
| 70 to 74 Years | 386 (4.0%) | 500 (4.9%) |
| 75 to 79 Years | 314 (3.3%) | 247 (2.4%) |
| 80 to 84 Years | 293 (3.0%) | 306 (3.0%) |
| 85 Years and over | 113 (1.2%) | 194 (1.9%) |
| Total | 9,619 (100.0%) | 10,192 (100.0%) |
Families and Households in Alamo
Median Family Size in Alamo
The median family size in Alamo is 3.93 persons per family, with single female/mother families (1,219 | 26.7%) accounting for the largest median family size of 4.07 persons per family. On the other hand, single male/father families (246 | 5.4%) represent the smallest median family size with 3.67 persons per family.
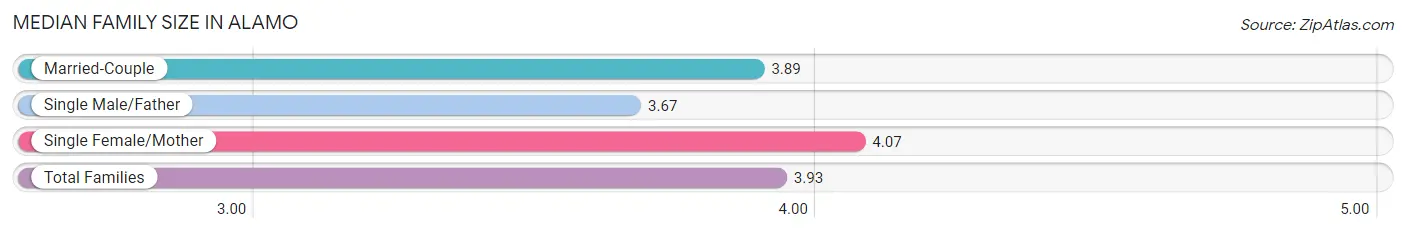
| Family Type | # Families | Family Size |
| Married-Couple | 3,101 (67.9%) | 3.89 |
| Single Male/Father | 246 (5.4%) | 3.67 |
| Single Female/Mother | 1,219 (26.7%) | 4.07 |
| Total Families | 4,566 (100.0%) | 3.93 |
Median Household Size in Alamo
The median household size in Alamo is 3.30 persons per household, with single female/mother households (1,219 | 20.3%) accounting for the largest median household size of 4.17 persons per household. non-family households (1,427 | 23.8%) represent the smallest median household size with 1.15 persons per household.
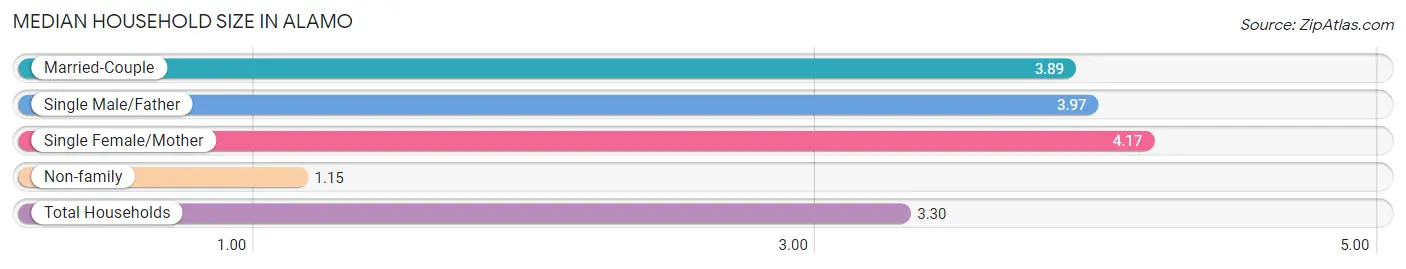
| Household Type | # Households | Household Size |
| Married-Couple | 3,101 (51.7%) | 3.89 |
| Single Male/Father | 246 (4.1%) | 3.97 |
| Single Female/Mother | 1,219 (20.3%) | 4.17 |
| Non-family | 1,427 (23.8%) | 1.15 |
| Total Households | 5,993 (100.0%) | 3.30 |
Household Size by Marriage Status in Alamo
Out of a total of 5,993 households in Alamo, 4,566 (76.2%) are family households, while 1,427 (23.8%) are nonfamily households. The most numerous type of family households are 2-person households, comprising 1,588, and the most common type of nonfamily households are 1-person households, comprising 1,220.
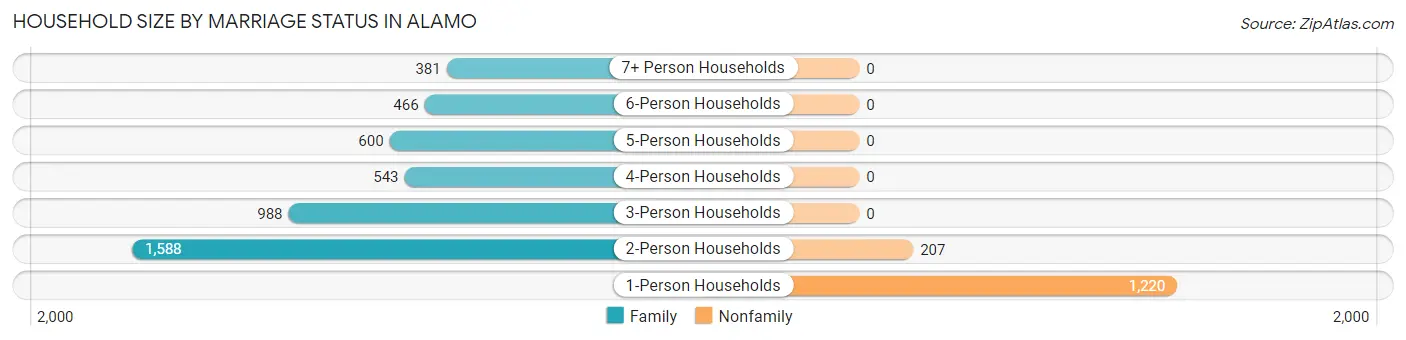
| Household Size | Family Households | Nonfamily Households |
| 1-Person Households | - | 1,220 (20.4%) |
| 2-Person Households | 1,588 (26.5%) | 207 (3.5%) |
| 3-Person Households | 988 (16.5%) | 0 (0.0%) |
| 4-Person Households | 543 (9.1%) | 0 (0.0%) |
| 5-Person Households | 600 (10.0%) | 0 (0.0%) |
| 6-Person Households | 466 (7.8%) | 0 (0.0%) |
| 7+ Person Households | 381 (6.4%) | 0 (0.0%) |
| Total | 4,566 (76.2%) | 1,427 (23.8%) |
Female Fertility in Alamo
Fertility by Age in Alamo
Average fertility rate in Alamo is 80.0 births per 1,000 women. Women in the age bracket of 20 to 34 years have the highest fertility rate with 151.0 births per 1,000 women. Women in the age bracket of 20 to 34 years acount for 91.9% of all women with births.
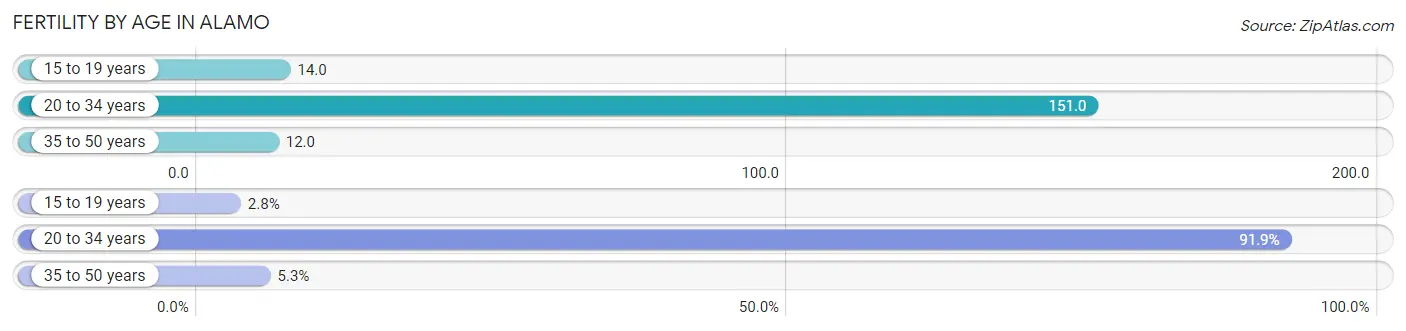
| Age Bracket | Women with Births | Births / 1,000 Women |
| 15 to 19 years | 10 (2.8%) | 14.0 |
| 20 to 34 years | 329 (91.9%) | 151.0 |
| 35 to 50 years | 19 (5.3%) | 12.0 |
| Total | 358 (100.0%) | 80.0 |
Fertility by Age by Marriage Status in Alamo
62.6% of women with births (358) in Alamo are married. The highest percentage of unmarried women with births falls into 15 to 19 years age bracket with 100.0% of them unmarried at the time of birth, while the lowest percentage of unmarried women with births belong to 35 to 50 years age bracket with 5.3% of them unmarried.
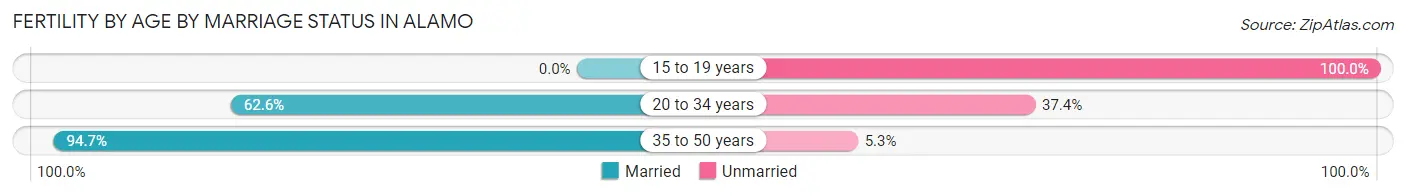
| Age Bracket | Married | Unmarried |
| 15 to 19 years | 0 (0.0%) | 10 (100.0%) |
| 20 to 34 years | 206 (62.6%) | 123 (37.4%) |
| 35 to 50 years | 18 (94.7%) | 1 (5.3%) |
| Total | 224 (62.6%) | 134 (37.4%) |
Fertility by Education in Alamo
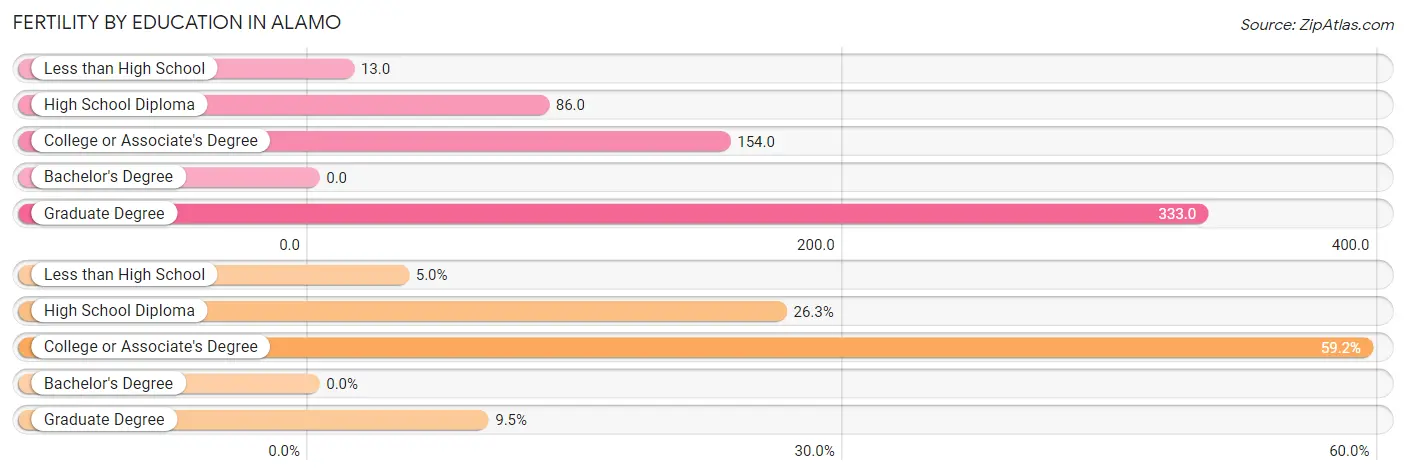
| Educational Attainment | Women with Births | Births / 1,000 Women |
| Less than High School | 18 (5.0%) | 13.0 |
| High School Diploma | 94 (26.3%) | 86.0 |
| College or Associate's Degree | 212 (59.2%) | 154.0 |
| Bachelor's Degree | 0 (0.0%) | 0.0 |
| Graduate Degree | 34 (9.5%) | 333.0 |
| Total | 358 (100.0%) | 80.0 |
Fertility by Education by Marriage Status in Alamo
37.4% of women with births in Alamo are unmarried. Women with the educational attainment of less than high school are most likely to be married with 100.0% of them married at childbirth, while women with the educational attainment of high school diploma are least likely to be married with 58.5% of them unmarried at childbirth.
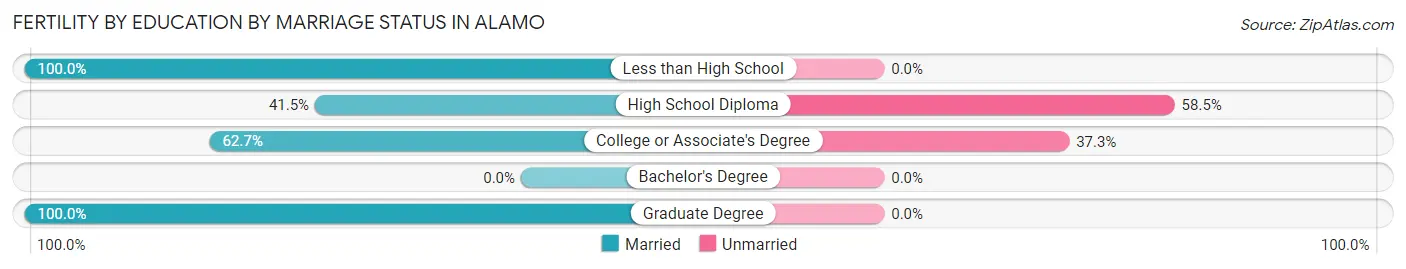
| Educational Attainment | Married | Unmarried |
| Less than High School | 18 (100.0%) | 0 (0.0%) |
| High School Diploma | 39 (41.5%) | 55 (58.5%) |
| College or Associate's Degree | 133 (62.7%) | 79 (37.3%) |
| Bachelor's Degree | 0 (0.0%) | 0 (0.0%) |
| Graduate Degree | 34 (100.0%) | 0 (0.0%) |
| Total | 224 (62.6%) | 134 (37.4%) |
Employment Characteristics in Alamo
Employment by Class of Employer in Alamo
Among the 6,555 employed individuals in Alamo, private company employees (4,604 | 70.2%), local government employees (612 | 9.3%), and self-employed (not incorporated) (486 | 7.4%) make up the most common classes of employment.
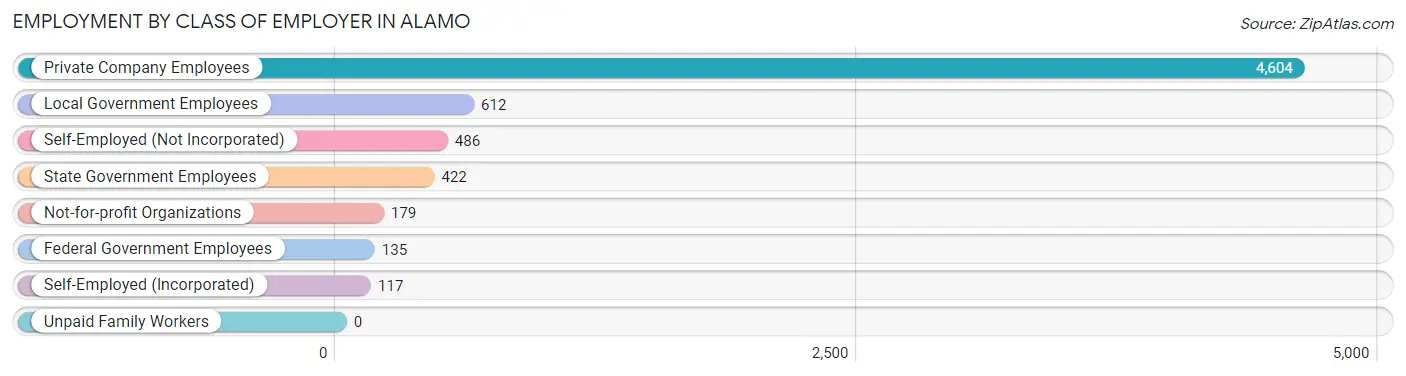
| Employer Class | # Employees | % Employees |
| Private Company Employees | 4,604 | 70.2% |
| Self-Employed (Incorporated) | 117 | 1.8% |
| Self-Employed (Not Incorporated) | 486 | 7.4% |
| Not-for-profit Organizations | 179 | 2.7% |
| Local Government Employees | 612 | 9.3% |
| State Government Employees | 422 | 6.4% |
| Federal Government Employees | 135 | 2.1% |
| Unpaid Family Workers | 0 | 0.0% |
| Total | 6,555 | 100.0% |
Employment Status by Age in Alamo
According to the labor force statistics for Alamo, out of the total population over 16 years of age (14,024), 53.5% or 7,503 individuals are in the labor force, with 9.4% or 705 of them unemployed. The age group with the highest labor force participation rate is 30 to 34 years, with 89.7% or 1,102 individuals in the labor force. Within the labor force, the 20 to 24 years age range has the highest percentage of unemployed individuals, with 20.2% or 262 of them being unemployed.
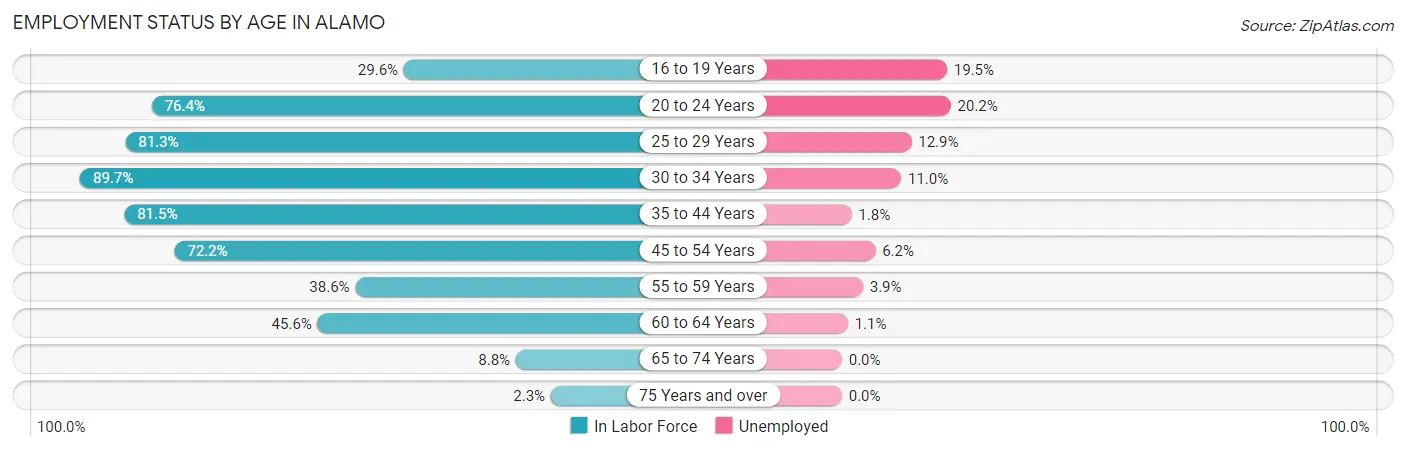
| Age Bracket | In Labor Force | Unemployed |
| 16 to 19 Years | 358 (29.6%) | 70 (19.5%) |
| 20 to 24 Years | 1,297 (76.4%) | 262 (20.2%) |
| 25 to 29 Years | 940 (81.3%) | 121 (12.9%) |
| 30 to 34 Years | 1,102 (89.7%) | 121 (11.0%) |
| 35 to 44 Years | 1,425 (81.5%) | 26 (1.8%) |
| 45 to 54 Years | 1,388 (72.2%) | 86 (6.2%) |
| 55 to 59 Years | 357 (38.6%) | 14 (3.9%) |
| 60 to 64 Years | 459 (45.6%) | 5 (1.1%) |
| 65 to 74 Years | 146 (8.8%) | 0 (0.0%) |
| 75 Years and over | 34 (2.3%) | 0 (0.0%) |
| Total | 7,503 (53.5%) | 705 (9.4%) |
Employment Status by Educational Attainment in Alamo
According to labor force statistics for Alamo, 71.0% of individuals (5,669) out of the total population between 25 and 64 years of age (7,985) are in the labor force, with 6.6% or 374 of them being unemployed. The group with the highest labor force participation rate are those with the educational attainment of bachelor's degree or higher, with 87.2% or 971 individuals in the labor force. Within the labor force, individuals with high school diploma education have the highest percentage of unemployment, with 8.5% or 120 of them being unemployed.
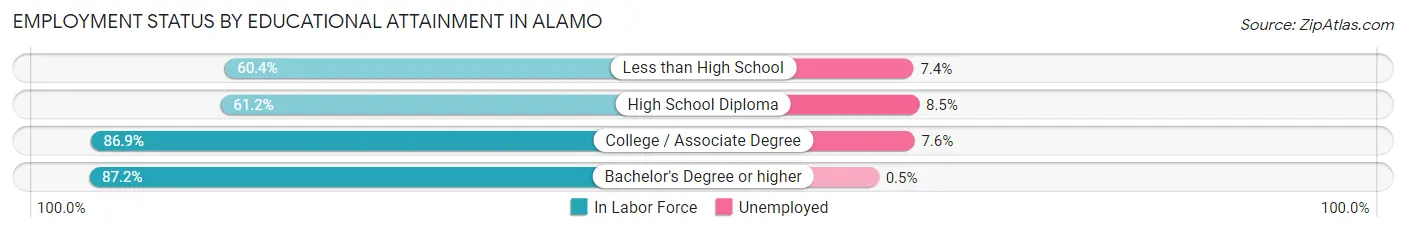
| Educational Attainment | In Labor Force | Unemployed |
| Less than High School | 1,550 (60.4%) | 190 (7.4%) |
| High School Diploma | 1,406 (61.2%) | 195 (8.5%) |
| College / Associate Degree | 1,746 (86.9%) | 153 (7.6%) |
| Bachelor's Degree or higher | 971 (87.2%) | 6 (0.5%) |
| Total | 5,669 (71.0%) | 527 (6.6%) |
Employment Occupations by Sex in Alamo
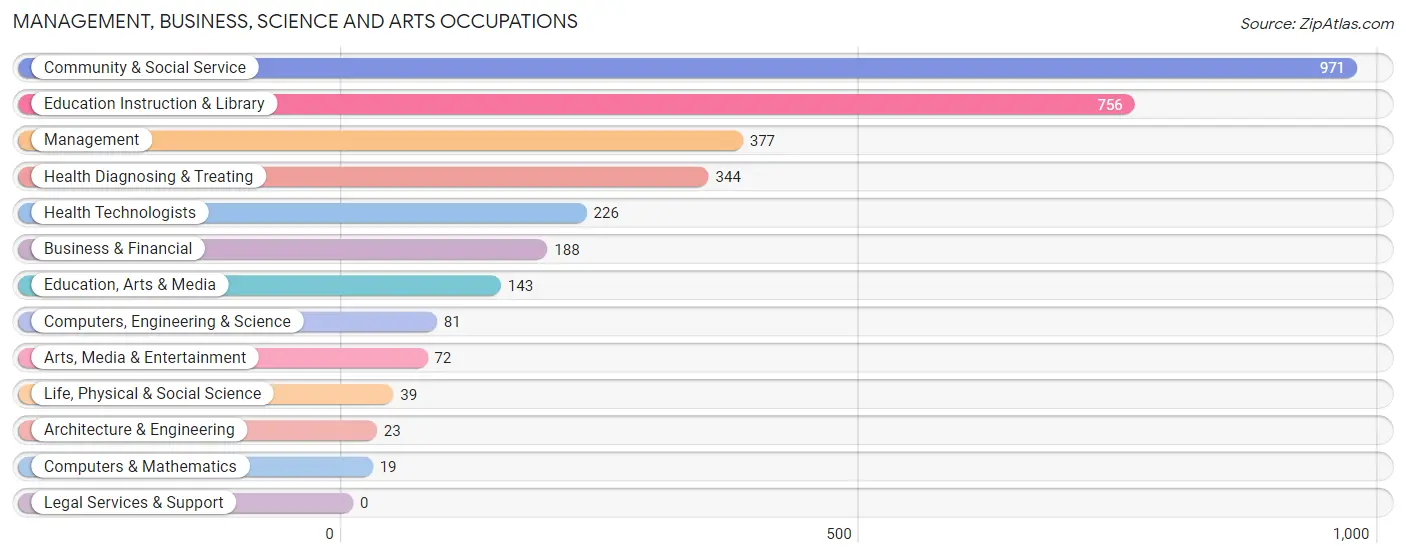
Management, Business, Science and Arts Occupations
The most common Management, Business, Science and Arts occupations in Alamo are Community & Social Service (971 | 14.3%), Education Instruction & Library (756 | 11.1%), Management (377 | 5.5%), Health Diagnosing & Treating (344 | 5.1%), and Health Technologists (226 | 3.3%).
Management, Business, Science and Arts Occupations by Sex
Within the Management, Business, Science and Arts occupations in Alamo, the most male-oriented occupations are Architecture & Engineering (100.0%), Management (72.7%), and Computers, Engineering & Science (45.7%), while the most female-oriented occupations are Computers & Mathematics (100.0%), Arts, Media & Entertainment (100.0%), and Health Technologists (81.9%).
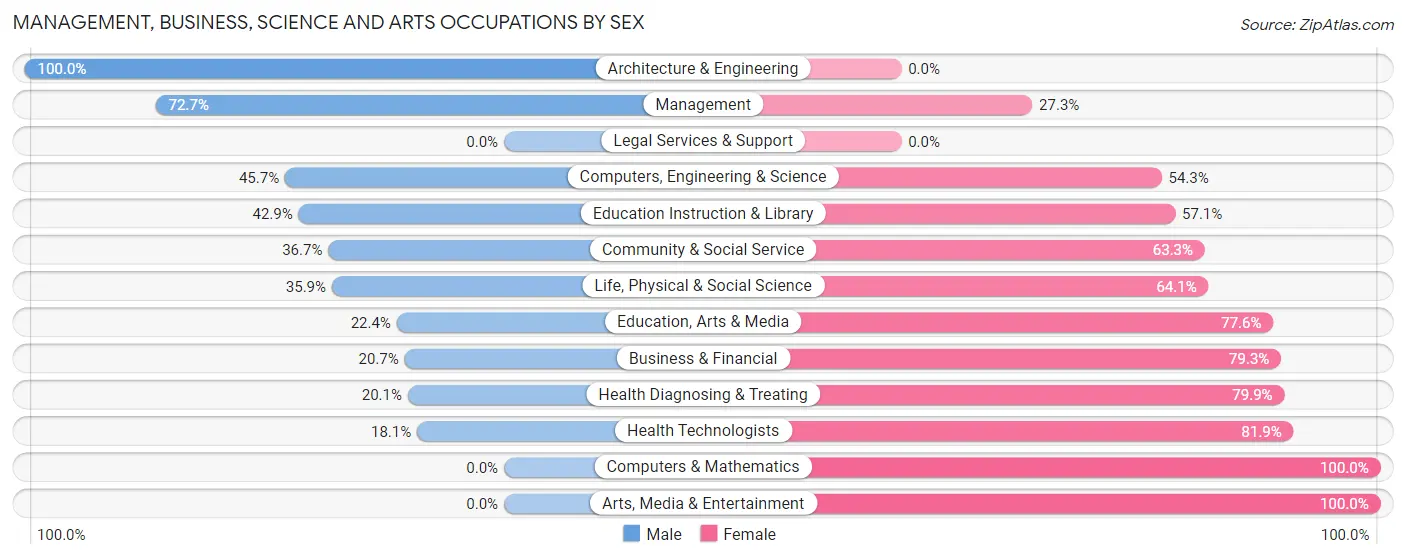
| Occupation | Male | Female |
| Management | 274 (72.7%) | 103 (27.3%) |
| Business & Financial | 39 (20.7%) | 149 (79.3%) |
| Computers, Engineering & Science | 37 (45.7%) | 44 (54.3%) |
| Computers & Mathematics | 0 (0.0%) | 19 (100.0%) |
| Architecture & Engineering | 23 (100.0%) | 0 (0.0%) |
| Life, Physical & Social Science | 14 (35.9%) | 25 (64.1%) |
| Community & Social Service | 356 (36.7%) | 615 (63.3%) |
| Education, Arts & Media | 32 (22.4%) | 111 (77.6%) |
| Legal Services & Support | 0 (0.0%) | 0 (0.0%) |
| Education Instruction & Library | 324 (42.9%) | 432 (57.1%) |
| Arts, Media & Entertainment | 0 (0.0%) | 72 (100.0%) |
| Health Diagnosing & Treating | 69 (20.1%) | 275 (79.9%) |
| Health Technologists | 41 (18.1%) | 185 (81.9%) |
| Total (Category) | 775 (39.5%) | 1,186 (60.5%) |
| Total (Overall) | 3,881 (57.0%) | 2,924 (43.0%) |
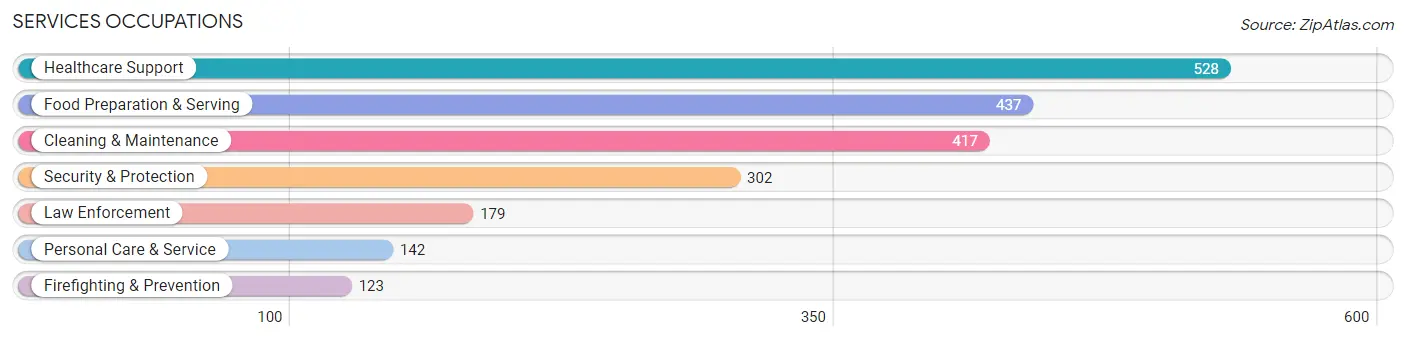
Services Occupations
The most common Services occupations in Alamo are Healthcare Support (528 | 7.8%), Food Preparation & Serving (437 | 6.4%), Cleaning & Maintenance (417 | 6.1%), Security & Protection (302 | 4.4%), and Law Enforcement (179 | 2.6%).
Services Occupations by Sex
Within the Services occupations in Alamo, the most male-oriented occupations are Firefighting & Prevention (100.0%), Security & Protection (93.0%), and Law Enforcement (88.3%), while the most female-oriented occupations are Personal Care & Service (100.0%), Healthcare Support (76.3%), and Food Preparation & Serving (53.1%).
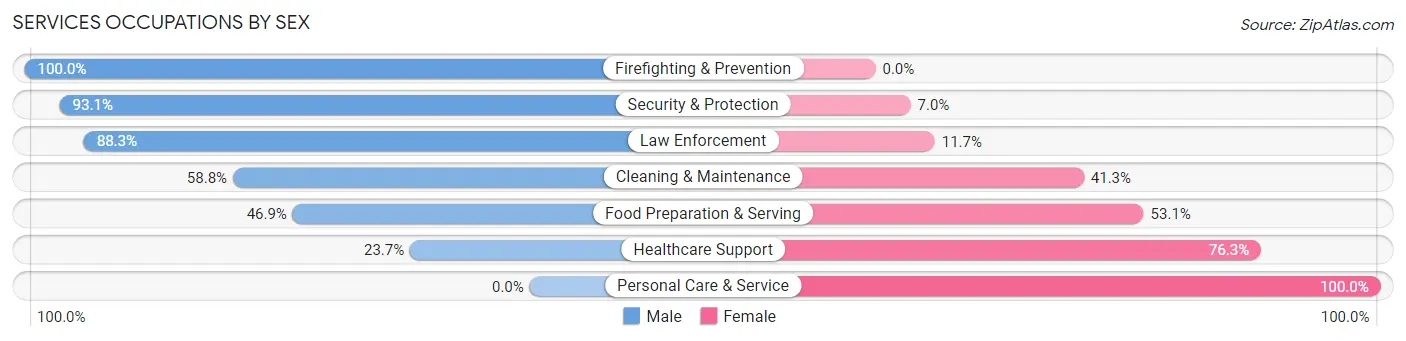
| Occupation | Male | Female |
| Healthcare Support | 125 (23.7%) | 403 (76.3%) |
| Security & Protection | 281 (93.0%) | 21 (7.0%) |
| Firefighting & Prevention | 123 (100.0%) | 0 (0.0%) |
| Law Enforcement | 158 (88.3%) | 21 (11.7%) |
| Food Preparation & Serving | 205 (46.9%) | 232 (53.1%) |
| Cleaning & Maintenance | 245 (58.8%) | 172 (41.2%) |
| Personal Care & Service | 0 (0.0%) | 142 (100.0%) |
| Total (Category) | 856 (46.9%) | 970 (53.1%) |
| Total (Overall) | 3,881 (57.0%) | 2,924 (43.0%) |
Sales and Office Occupations
The most common Sales and Office occupations in Alamo are Sales & Related (758 | 11.1%), and Office & Administration (401 | 5.9%).
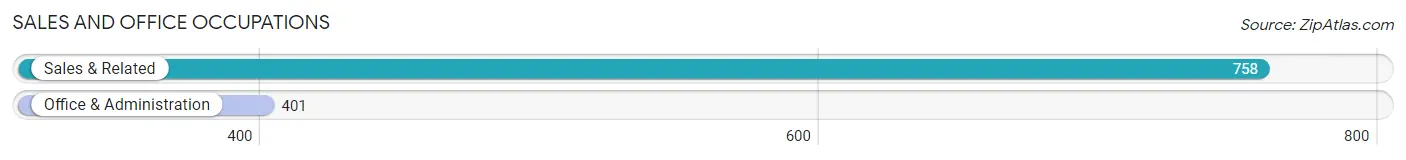
Sales and Office Occupations by Sex
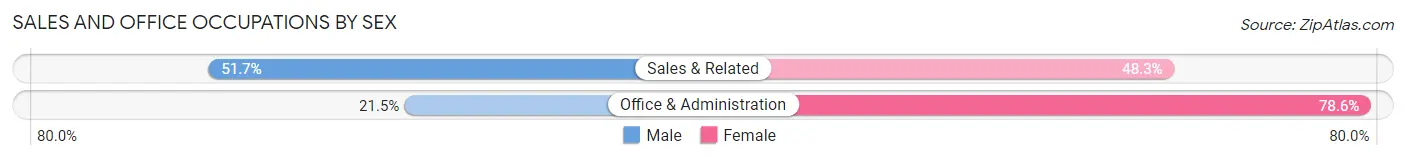
| Occupation | Male | Female |
| Sales & Related | 392 (51.7%) | 366 (48.3%) |
| Office & Administration | 86 (21.4%) | 315 (78.5%) |
| Total (Category) | 478 (41.2%) | 681 (58.8%) |
| Total (Overall) | 3,881 (57.0%) | 2,924 (43.0%) |
Natural Resources, Construction and Maintenance Occupations
The most common Natural Resources, Construction and Maintenance occupations in Alamo are Construction & Extraction (664 | 9.8%), Installation, Maintenance & Repair (444 | 6.5%), and Farming, Fishing & Forestry (75 | 1.1%).
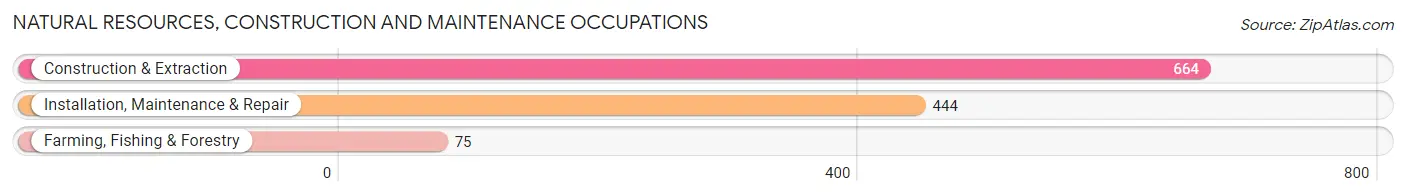
Natural Resources, Construction and Maintenance Occupations by Sex
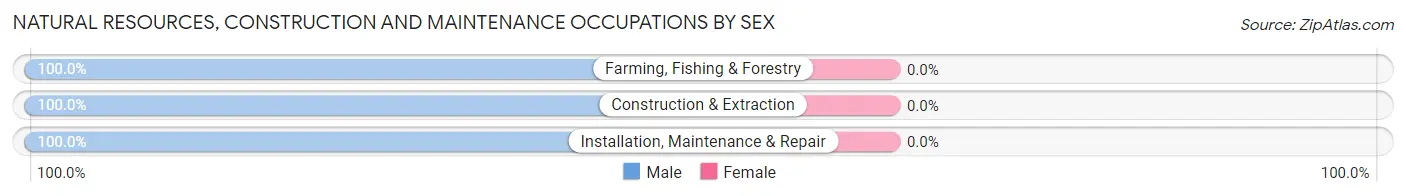
| Occupation | Male | Female |
| Farming, Fishing & Forestry | 75 (100.0%) | 0 (0.0%) |
| Construction & Extraction | 664 (100.0%) | 0 (0.0%) |
| Installation, Maintenance & Repair | 444 (100.0%) | 0 (0.0%) |
| Total (Category) | 1,183 (100.0%) | 0 (0.0%) |
| Total (Overall) | 3,881 (57.0%) | 2,924 (43.0%) |
Production, Transportation and Moving Occupations
The most common Production, Transportation and Moving occupations in Alamo are Transportation (241 | 3.5%), Production (240 | 3.5%), and Material Moving (195 | 2.9%).
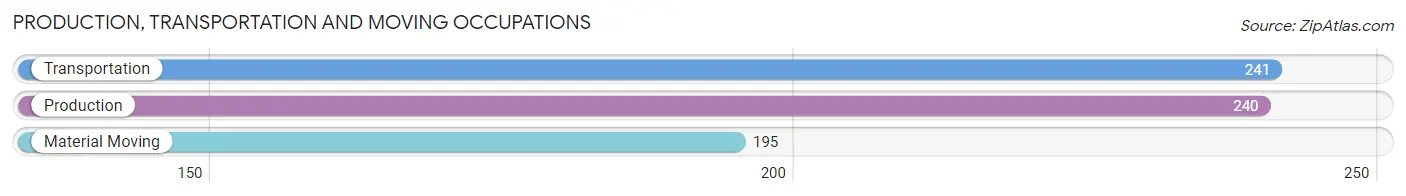
Production, Transportation and Moving Occupations by Sex
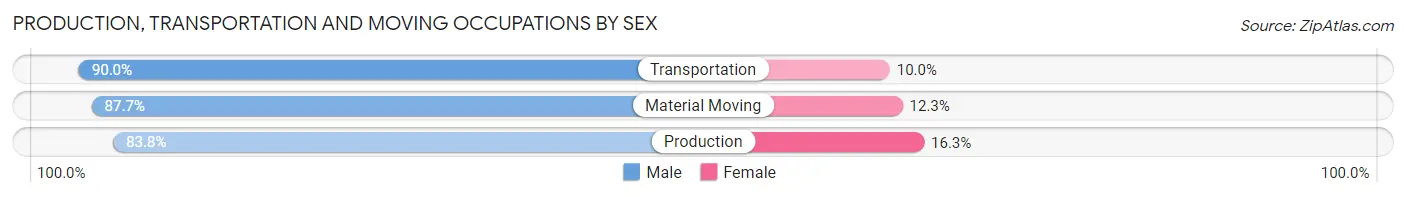
| Occupation | Male | Female |
| Production | 201 (83.8%) | 39 (16.3%) |
| Transportation | 217 (90.0%) | 24 (10.0%) |
| Material Moving | 171 (87.7%) | 24 (12.3%) |
| Total (Category) | 589 (87.1%) | 87 (12.9%) |
| Total (Overall) | 3,881 (57.0%) | 2,924 (43.0%) |
Employment Industries by Sex in Alamo
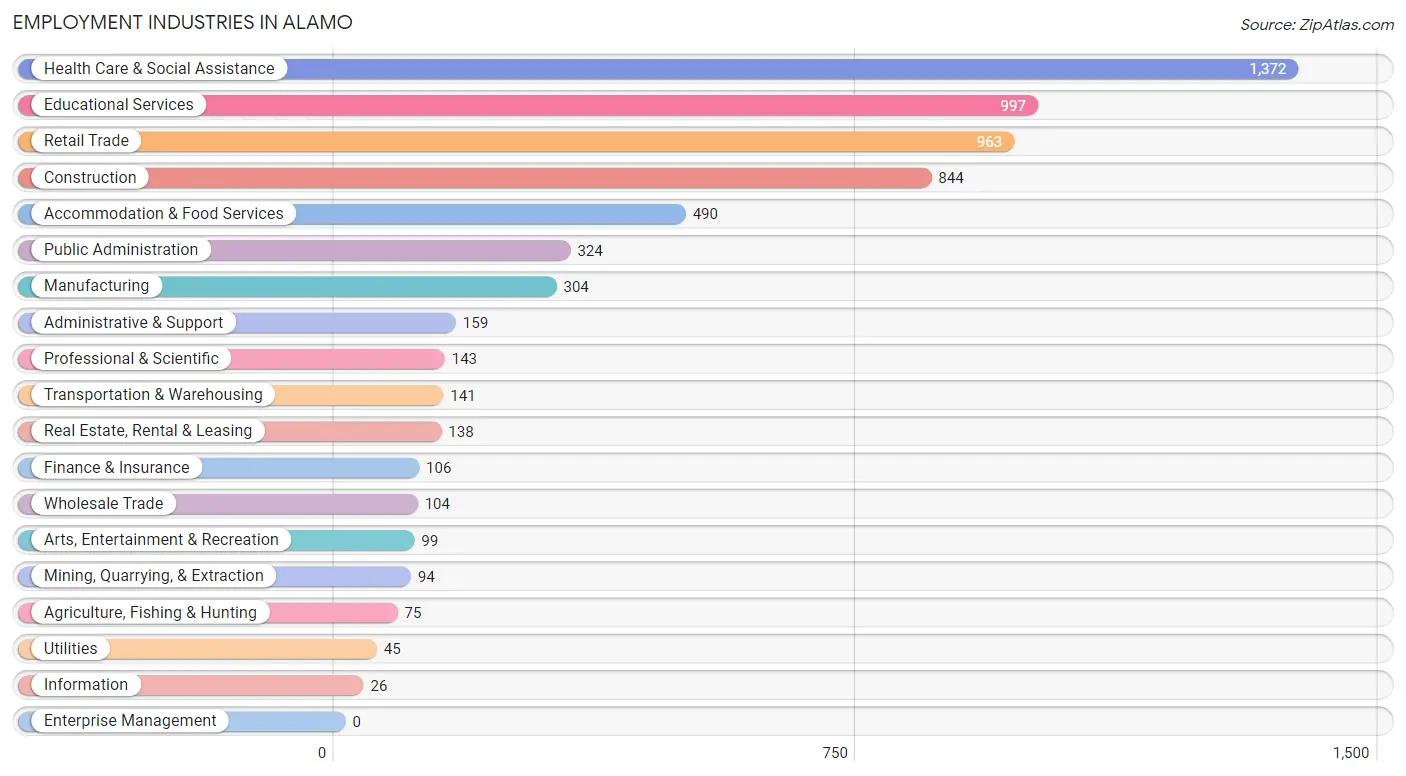
Employment Industries in Alamo
The major employment industries in Alamo include Health Care & Social Assistance (1,372 | 20.2%), Educational Services (997 | 14.6%), Retail Trade (963 | 14.1%), Construction (844 | 12.4%), and Accommodation & Food Services (490 | 7.2%).
Employment Industries by Sex in Alamo
The Alamo industries that see more men than women are Agriculture, Fishing & Hunting (100.0%), Wholesale Trade (100.0%), and Construction (99.2%), whereas the industries that tend to have a higher number of women are Finance & Insurance (77.4%), Health Care & Social Assistance (75.3%), and Professional & Scientific (65.0%).
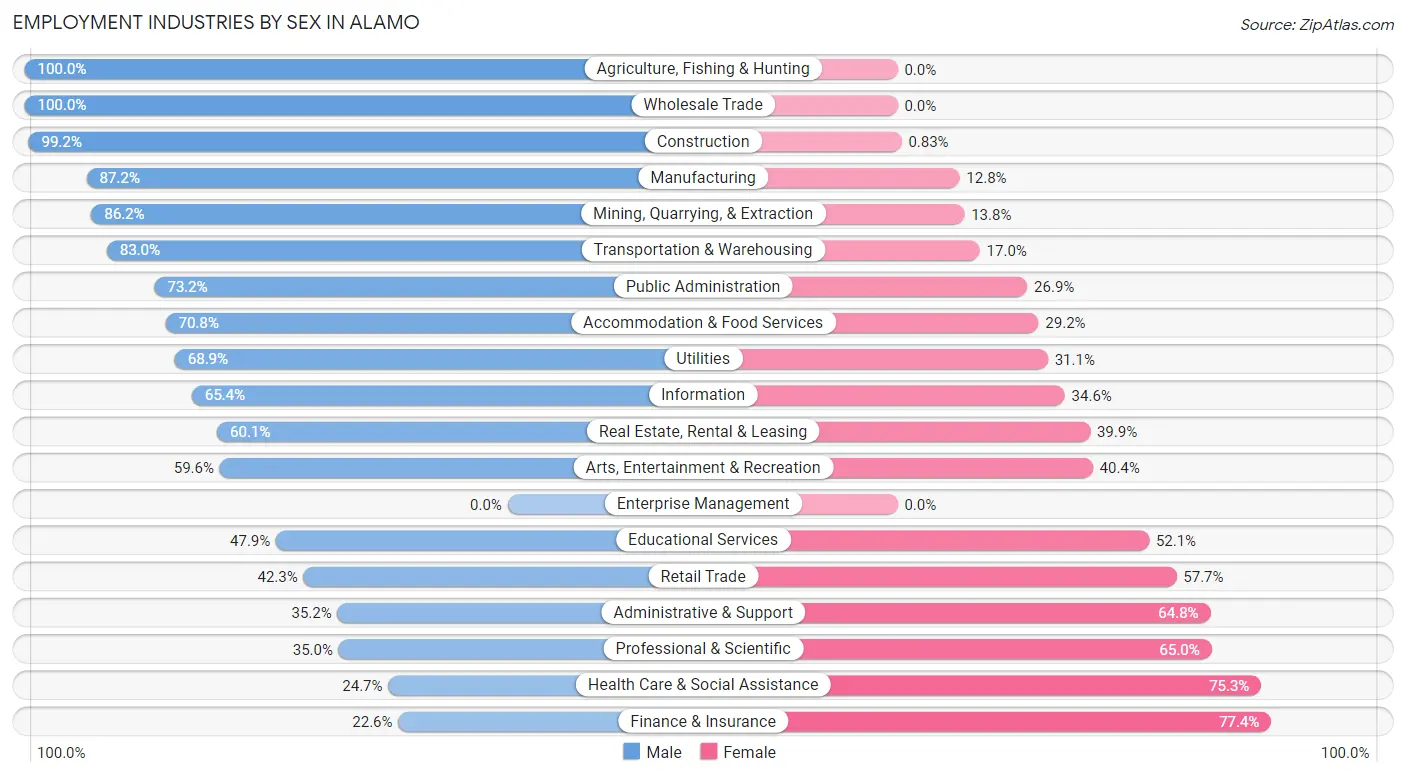
| Industry | Male | Female |
| Agriculture, Fishing & Hunting | 75 (100.0%) | 0 (0.0%) |
| Mining, Quarrying, & Extraction | 81 (86.2%) | 13 (13.8%) |
| Construction | 837 (99.2%) | 7 (0.8%) |
| Manufacturing | 265 (87.2%) | 39 (12.8%) |
| Wholesale Trade | 104 (100.0%) | 0 (0.0%) |
| Retail Trade | 407 (42.3%) | 556 (57.7%) |
| Transportation & Warehousing | 117 (83.0%) | 24 (17.0%) |
| Utilities | 31 (68.9%) | 14 (31.1%) |
| Information | 17 (65.4%) | 9 (34.6%) |
| Finance & Insurance | 24 (22.6%) | 82 (77.4%) |
| Real Estate, Rental & Leasing | 83 (60.1%) | 55 (39.9%) |
| Professional & Scientific | 50 (35.0%) | 93 (65.0%) |
| Enterprise Management | 0 (0.0%) | 0 (0.0%) |
| Administrative & Support | 56 (35.2%) | 103 (64.8%) |
| Educational Services | 478 (47.9%) | 519 (52.1%) |
| Health Care & Social Assistance | 339 (24.7%) | 1,033 (75.3%) |
| Arts, Entertainment & Recreation | 59 (59.6%) | 40 (40.4%) |
| Accommodation & Food Services | 347 (70.8%) | 143 (29.2%) |
| Public Administration | 237 (73.2%) | 87 (26.9%) |
| Total | 3,881 (57.0%) | 2,924 (43.0%) |
Education in Alamo
School Enrollment in Alamo
The most common levels of schooling among the 5,996 students in Alamo are elementary school (1,609 | 26.8%), middle school (1,335 | 22.3%), and high school (1,186 | 19.8%).
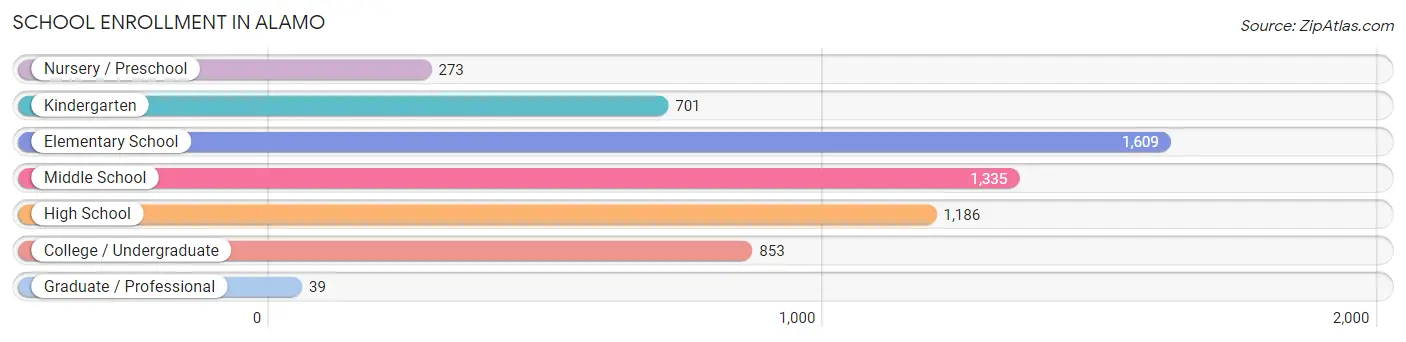
| School Level | # Students | % Students |
| Nursery / Preschool | 273 | 4.5% |
| Kindergarten | 701 | 11.7% |
| Elementary School | 1,609 | 26.8% |
| Middle School | 1,335 | 22.3% |
| High School | 1,186 | 19.8% |
| College / Undergraduate | 853 | 14.2% |
| Graduate / Professional | 39 | 0.6% |
| Total | 5,996 | 100.0% |
School Enrollment by Age by Funding Source in Alamo
Out of a total of 5,996 students who are enrolled in schools in Alamo, 108 (1.8%) attend a private institution, while the remaining 5,888 (98.2%) are enrolled in public schools. The age group of 35 years and over has the highest likelihood of being enrolled in private schools, with 39 (23.9% in the age bracket) enrolled. Conversely, the age group of 3 to 4 year olds has the lowest likelihood of being enrolled in a private school, with 367 (100.0% in the age bracket) attending a public institution.
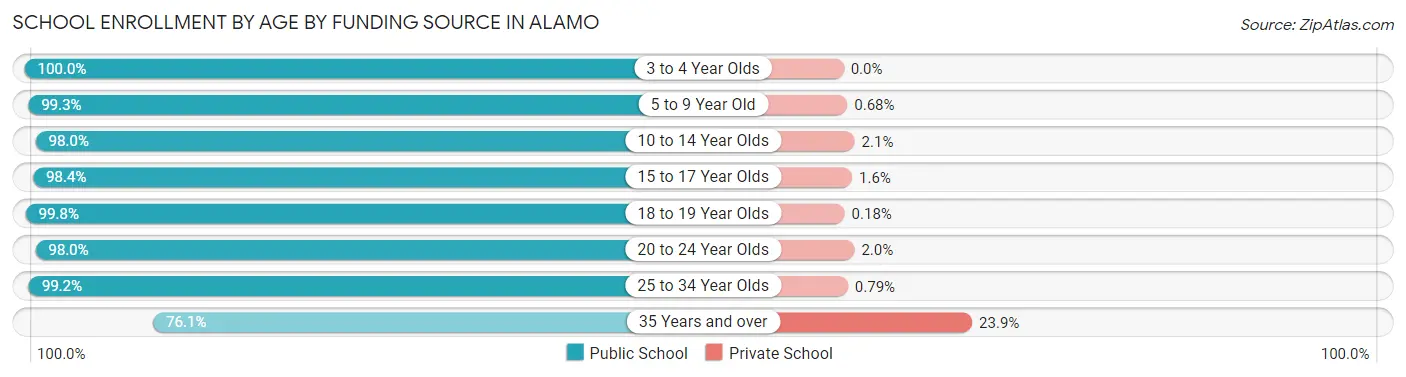
| Age Bracket | Public School | Private School |
| 3 to 4 Year Olds | 367 (100.0%) | 0 (0.0%) |
| 5 to 9 Year Old | 2,059 (99.3%) | 14 (0.7%) |
| 10 to 14 Year Olds | 1,528 (98.0%) | 32 (2.1%) |
| 15 to 17 Year Olds | 753 (98.4%) | 12 (1.6%) |
| 18 to 19 Year Olds | 542 (99.8%) | 1 (0.2%) |
| 20 to 24 Year Olds | 391 (98.0%) | 8 (2.0%) |
| 25 to 34 Year Olds | 125 (99.2%) | 1 (0.8%) |
| 35 Years and over | 124 (76.1%) | 39 (23.9%) |
| Total | 5,888 (98.2%) | 108 (1.8%) |
Educational Attainment by Field of Study in Alamo
Business (286 | 18.0%), education (265 | 16.7%), physical & health sciences (183 | 11.5%), multidisciplinary studies (162 | 10.2%), and science & technology (152 | 9.6%) are the most common fields of study among 1,587 individuals in Alamo who have obtained a bachelor's degree or higher.
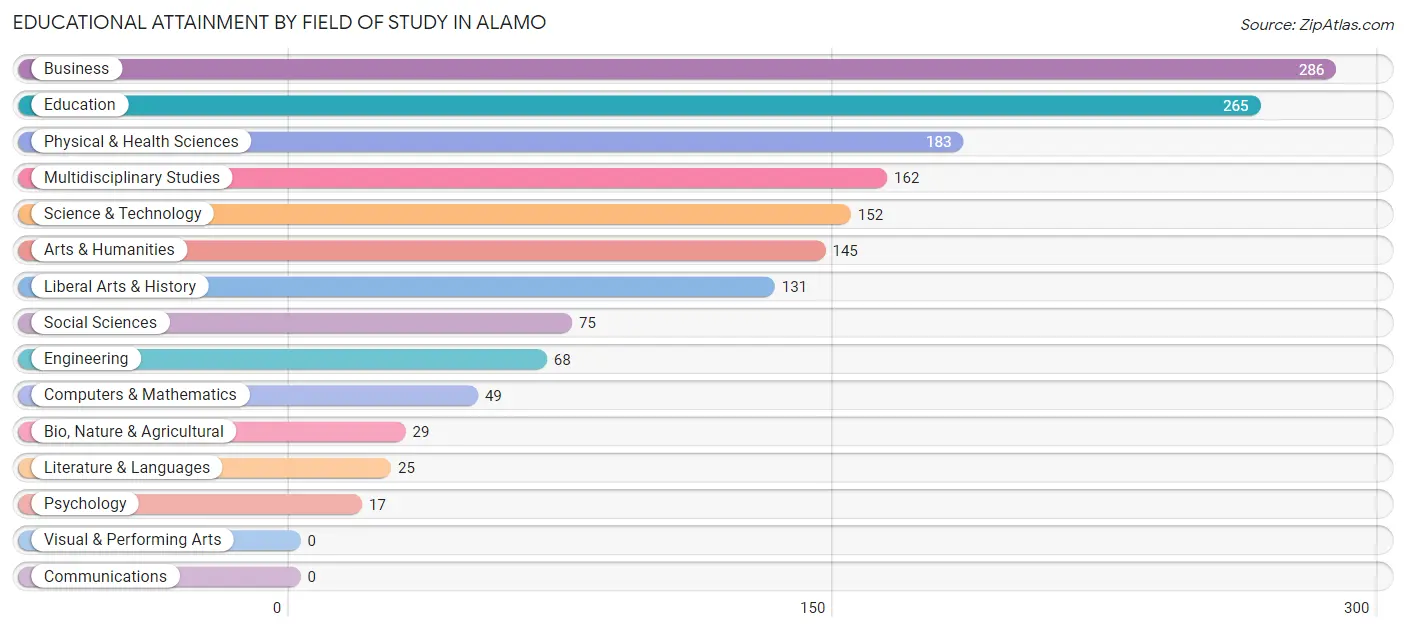
| Field of Study | # Graduates | % Graduates |
| Computers & Mathematics | 49 | 3.1% |
| Bio, Nature & Agricultural | 29 | 1.8% |
| Physical & Health Sciences | 183 | 11.5% |
| Psychology | 17 | 1.1% |
| Social Sciences | 75 | 4.7% |
| Engineering | 68 | 4.3% |
| Multidisciplinary Studies | 162 | 10.2% |
| Science & Technology | 152 | 9.6% |
| Business | 286 | 18.0% |
| Education | 265 | 16.7% |
| Literature & Languages | 25 | 1.6% |
| Liberal Arts & History | 131 | 8.3% |
| Visual & Performing Arts | 0 | 0.0% |
| Communications | 0 | 0.0% |
| Arts & Humanities | 145 | 9.1% |
| Total | 1,587 | 100.0% |
Transportation & Commute in Alamo
Vehicle Availability by Sex in Alamo
The most prevalent vehicle ownership categories in Alamo are males with 1 vehicle (1,118, accounting for 29.6%) and females with 1 vehicle (493, making up 40.4%).
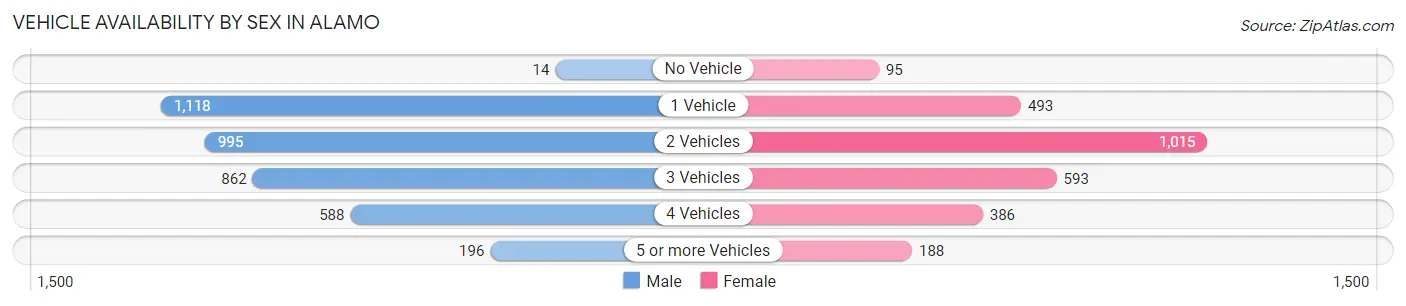
| Vehicles Available | Male | Female |
| No Vehicle | 14 (0.4%) | 95 (3.4%) |
| 1 Vehicle | 1,118 (29.6%) | 493 (17.8%) |
| 2 Vehicles | 995 (26.4%) | 1,015 (36.6%) |
| 3 Vehicles | 862 (22.9%) | 593 (21.4%) |
| 4 Vehicles | 588 (15.6%) | 386 (13.9%) |
| 5 or more Vehicles | 196 (5.2%) | 188 (6.8%) |
| Total | 3,773 (100.0%) | 2,770 (100.0%) |
Commute Time in Alamo
The most frequently occuring commute durations in Alamo are 20 to 24 minutes (1,655 commuters, 26.5%), 15 to 19 minutes (985 commuters, 15.8%), and 30 to 34 minutes (919 commuters, 14.7%).
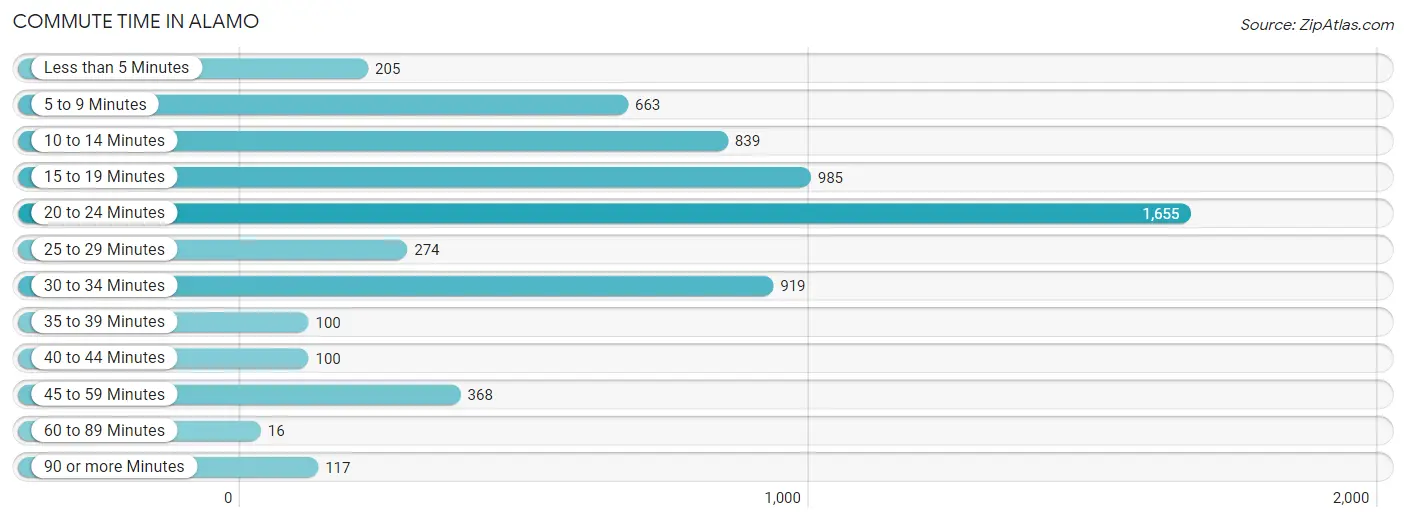
| Commute Time | # Commuters | % Commuters |
| Less than 5 Minutes | 205 | 3.3% |
| 5 to 9 Minutes | 663 | 10.6% |
| 10 to 14 Minutes | 839 | 13.4% |
| 15 to 19 Minutes | 985 | 15.8% |
| 20 to 24 Minutes | 1,655 | 26.5% |
| 25 to 29 Minutes | 274 | 4.4% |
| 30 to 34 Minutes | 919 | 14.7% |
| 35 to 39 Minutes | 100 | 1.6% |
| 40 to 44 Minutes | 100 | 1.6% |
| 45 to 59 Minutes | 368 | 5.9% |
| 60 to 89 Minutes | 16 | 0.3% |
| 90 or more Minutes | 117 | 1.9% |
Commute Time by Sex in Alamo
The most common commute times in Alamo are 20 to 24 minutes (1,043 commuters, 28.8%) for males and 20 to 24 minutes (612 commuters, 23.4%) for females.
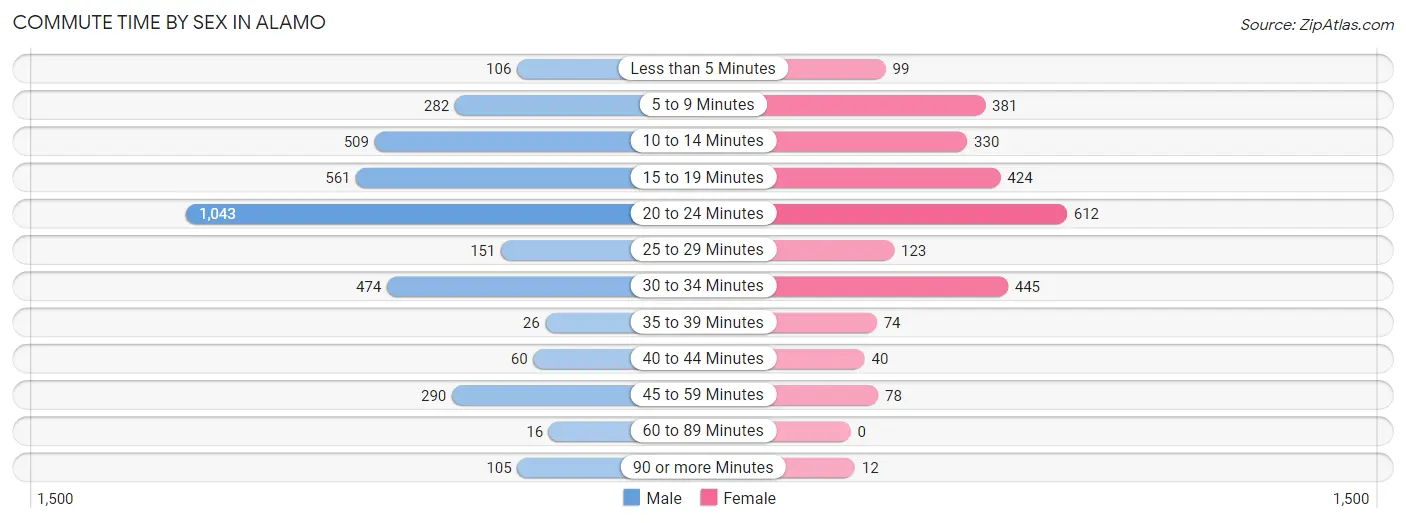
| Commute Time | Male | Female |
| Less than 5 Minutes | 106 (2.9%) | 99 (3.8%) |
| 5 to 9 Minutes | 282 (7.8%) | 381 (14.5%) |
| 10 to 14 Minutes | 509 (14.1%) | 330 (12.6%) |
| 15 to 19 Minutes | 561 (15.5%) | 424 (16.2%) |
| 20 to 24 Minutes | 1,043 (28.8%) | 612 (23.4%) |
| 25 to 29 Minutes | 151 (4.2%) | 123 (4.7%) |
| 30 to 34 Minutes | 474 (13.1%) | 445 (17.0%) |
| 35 to 39 Minutes | 26 (0.7%) | 74 (2.8%) |
| 40 to 44 Minutes | 60 (1.7%) | 40 (1.5%) |
| 45 to 59 Minutes | 290 (8.0%) | 78 (3.0%) |
| 60 to 89 Minutes | 16 (0.4%) | 0 (0.0%) |
| 90 or more Minutes | 105 (2.9%) | 12 (0.5%) |
Time of Departure to Work by Sex in Alamo
The most frequent times of departure to work in Alamo are 7:00 AM to 7:29 AM (874, 24.1%) for males and 7:00 AM to 7:29 AM (555, 21.2%) for females.
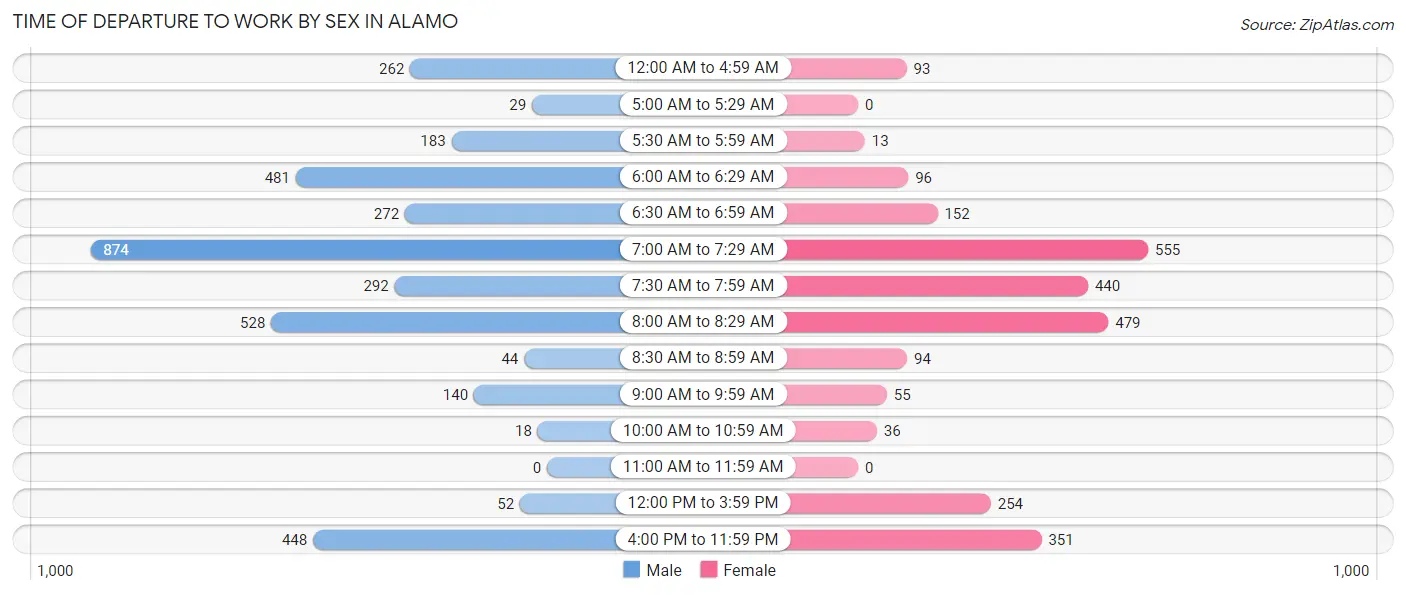
| Time of Departure | Male | Female |
| 12:00 AM to 4:59 AM | 262 (7.2%) | 93 (3.5%) |
| 5:00 AM to 5:29 AM | 29 (0.8%) | 0 (0.0%) |
| 5:30 AM to 5:59 AM | 183 (5.1%) | 13 (0.5%) |
| 6:00 AM to 6:29 AM | 481 (13.3%) | 96 (3.7%) |
| 6:30 AM to 6:59 AM | 272 (7.5%) | 152 (5.8%) |
| 7:00 AM to 7:29 AM | 874 (24.1%) | 555 (21.2%) |
| 7:30 AM to 7:59 AM | 292 (8.1%) | 440 (16.8%) |
| 8:00 AM to 8:29 AM | 528 (14.6%) | 479 (18.3%) |
| 8:30 AM to 8:59 AM | 44 (1.2%) | 94 (3.6%) |
| 9:00 AM to 9:59 AM | 140 (3.9%) | 55 (2.1%) |
| 10:00 AM to 10:59 AM | 18 (0.5%) | 36 (1.4%) |
| 11:00 AM to 11:59 AM | 0 (0.0%) | 0 (0.0%) |
| 12:00 PM to 3:59 PM | 52 (1.4%) | 254 (9.7%) |
| 4:00 PM to 11:59 PM | 448 (12.4%) | 351 (13.4%) |
| Total | 3,623 (100.0%) | 2,618 (100.0%) |
Housing Occupancy in Alamo
Occupancy by Ownership in Alamo
Of the total 5,993 dwellings in Alamo, owner-occupied units account for 4,265 (71.2%), while renter-occupied units make up 1,728 (28.8%).
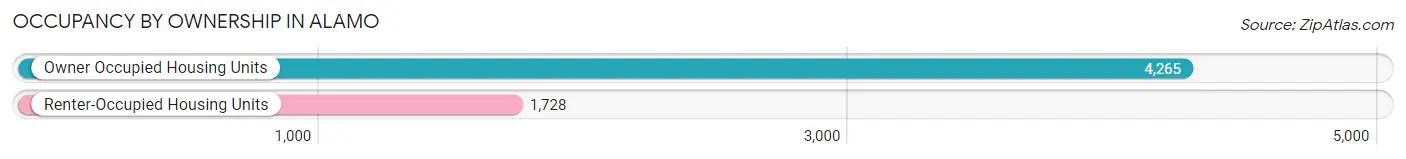
| Occupancy | # Housing Units | % Housing Units |
| Owner Occupied Housing Units | 4,265 | 71.2% |
| Renter-Occupied Housing Units | 1,728 | 28.8% |
| Total Occupied Housing Units | 5,993 | 100.0% |
Occupancy by Household Size in Alamo
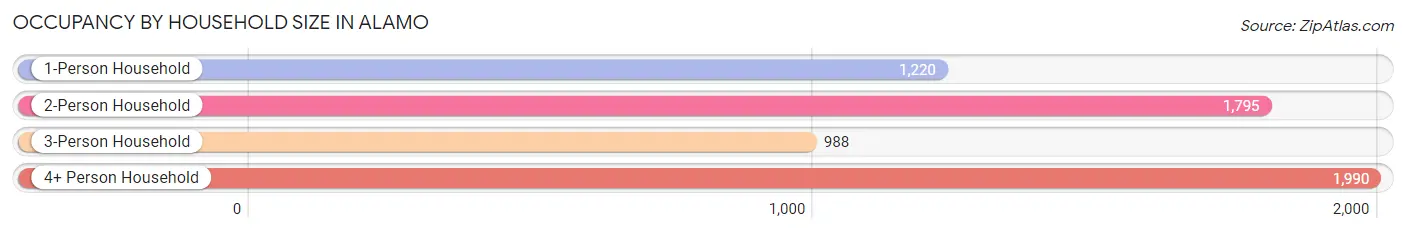
| Household Size | # Housing Units | % Housing Units |
| 1-Person Household | 1,220 | 20.4% |
| 2-Person Household | 1,795 | 29.9% |
| 3-Person Household | 988 | 16.5% |
| 4+ Person Household | 1,990 | 33.2% |
| Total Housing Units | 5,993 | 100.0% |
Occupancy by Ownership by Household Size in Alamo
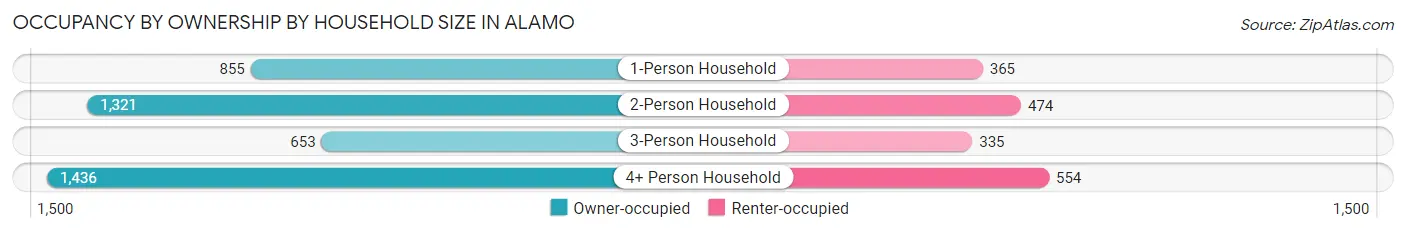
| Household Size | Owner-occupied | Renter-occupied |
| 1-Person Household | 855 (70.1%) | 365 (29.9%) |
| 2-Person Household | 1,321 (73.6%) | 474 (26.4%) |
| 3-Person Household | 653 (66.1%) | 335 (33.9%) |
| 4+ Person Household | 1,436 (72.2%) | 554 (27.8%) |
| Total Housing Units | 4,265 (71.2%) | 1,728 (28.8%) |
Occupancy by Educational Attainment in Alamo
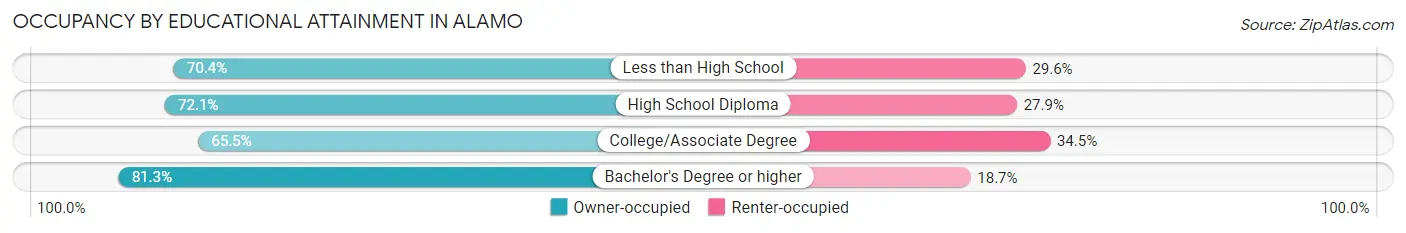
| Household Size | Owner-occupied | Renter-occupied |
| Less than High School | 1,420 (70.4%) | 597 (29.6%) |
| High School Diploma | 1,183 (72.1%) | 457 (27.9%) |
| College/Associate Degree | 987 (65.5%) | 519 (34.5%) |
| Bachelor's Degree or higher | 675 (81.3%) | 155 (18.7%) |
Occupancy by Age of Householder in Alamo
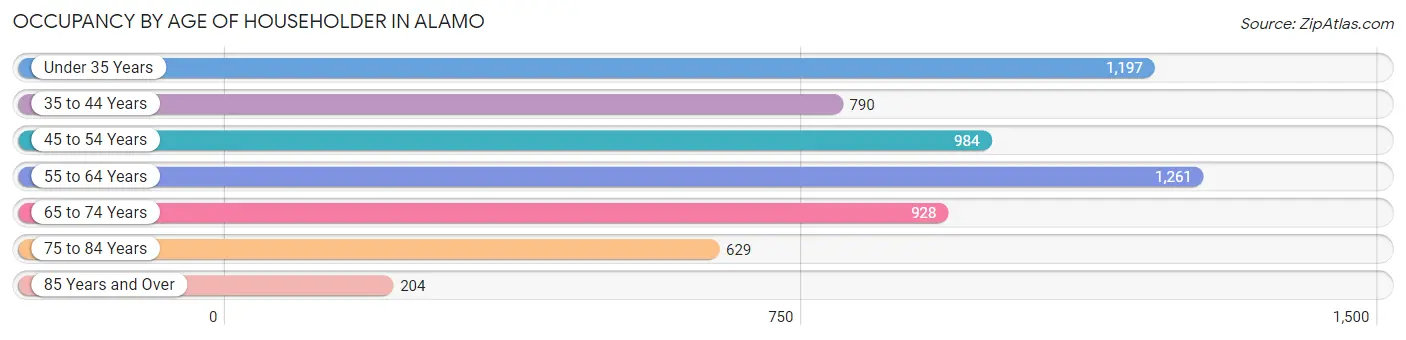
| Age Bracket | # Households | % Households |
| Under 35 Years | 1,197 | 20.0% |
| 35 to 44 Years | 790 | 13.2% |
| 45 to 54 Years | 984 | 16.4% |
| 55 to 64 Years | 1,261 | 21.0% |
| 65 to 74 Years | 928 | 15.5% |
| 75 to 84 Years | 629 | 10.5% |
| 85 Years and Over | 204 | 3.4% |
| Total | 5,993 | 100.0% |
Housing Finances in Alamo
Median Income by Occupancy in Alamo
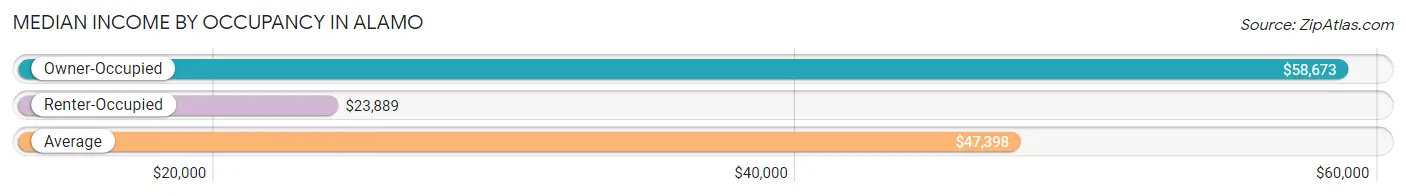
| Occupancy Type | # Households | Median Income |
| Owner-Occupied | 4,265 (71.2%) | $58,673 |
| Renter-Occupied | 1,728 (28.8%) | $23,889 |
| Average | 5,993 (100.0%) | $47,398 |
Occupancy by Householder Income Bracket in Alamo
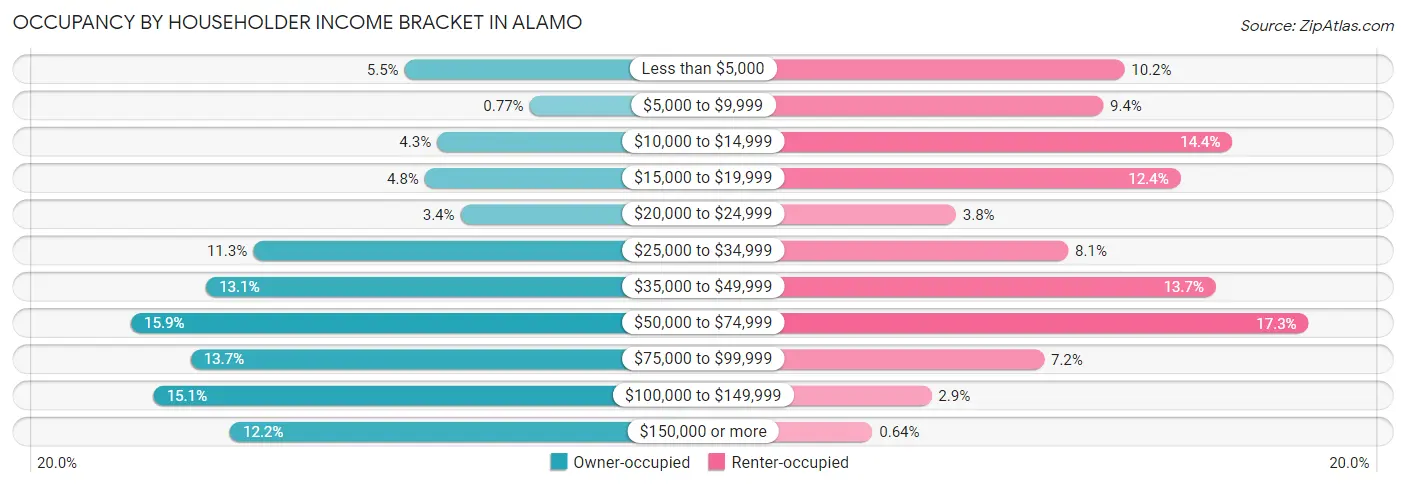
| Income Bracket | Owner-occupied | Renter-occupied |
| Less than $5,000 | 236 (5.5%) | 177 (10.2%) |
| $5,000 to $9,999 | 33 (0.8%) | 163 (9.4%) |
| $10,000 to $14,999 | 183 (4.3%) | 248 (14.3%) |
| $15,000 to $19,999 | 203 (4.8%) | 214 (12.4%) |
| $20,000 to $24,999 | 145 (3.4%) | 66 (3.8%) |
| $25,000 to $34,999 | 482 (11.3%) | 140 (8.1%) |
| $35,000 to $49,999 | 558 (13.1%) | 237 (13.7%) |
| $50,000 to $74,999 | 680 (15.9%) | 298 (17.2%) |
| $75,000 to $99,999 | 583 (13.7%) | 124 (7.2%) |
| $100,000 to $149,999 | 643 (15.1%) | 50 (2.9%) |
| $150,000 or more | 519 (12.2%) | 11 (0.6%) |
| Total | 4,265 (100.0%) | 1,728 (100.0%) |
Monthly Housing Cost Tiers in Alamo
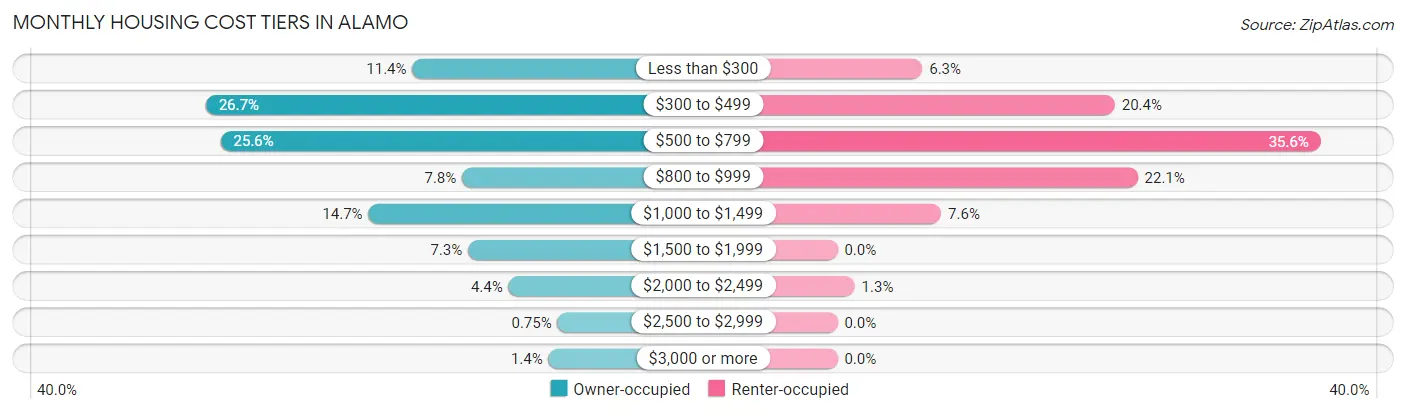
| Monthly Cost | Owner-occupied | Renter-occupied |
| Less than $300 | 488 (11.4%) | 108 (6.2%) |
| $300 to $499 | 1,137 (26.7%) | 353 (20.4%) |
| $500 to $799 | 1,091 (25.6%) | 615 (35.6%) |
| $800 to $999 | 332 (7.8%) | 382 (22.1%) |
| $1,000 to $1,499 | 626 (14.7%) | 132 (7.6%) |
| $1,500 to $1,999 | 313 (7.3%) | 0 (0.0%) |
| $2,000 to $2,499 | 186 (4.4%) | 22 (1.3%) |
| $2,500 to $2,999 | 32 (0.7%) | 0 (0.0%) |
| $3,000 or more | 60 (1.4%) | 0 (0.0%) |
| Total | 4,265 (100.0%) | 1,728 (100.0%) |
Physical Housing Characteristics in Alamo
Housing Structures in Alamo
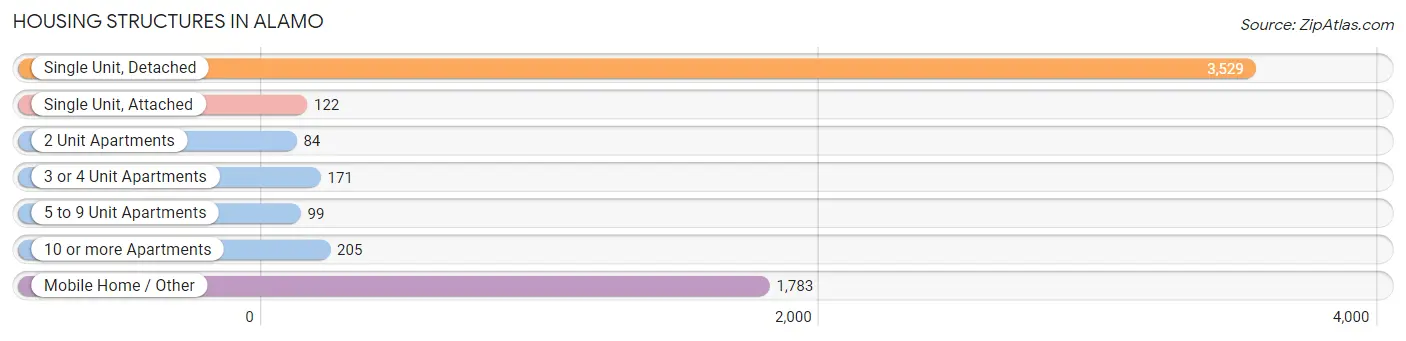
| Structure Type | # Housing Units | % Housing Units |
| Single Unit, Detached | 3,529 | 58.9% |
| Single Unit, Attached | 122 | 2.0% |
| 2 Unit Apartments | 84 | 1.4% |
| 3 or 4 Unit Apartments | 171 | 2.9% |
| 5 to 9 Unit Apartments | 99 | 1.7% |
| 10 or more Apartments | 205 | 3.4% |
| Mobile Home / Other | 1,783 | 29.7% |
| Total | 5,993 | 100.0% |
Housing Structures by Occupancy in Alamo
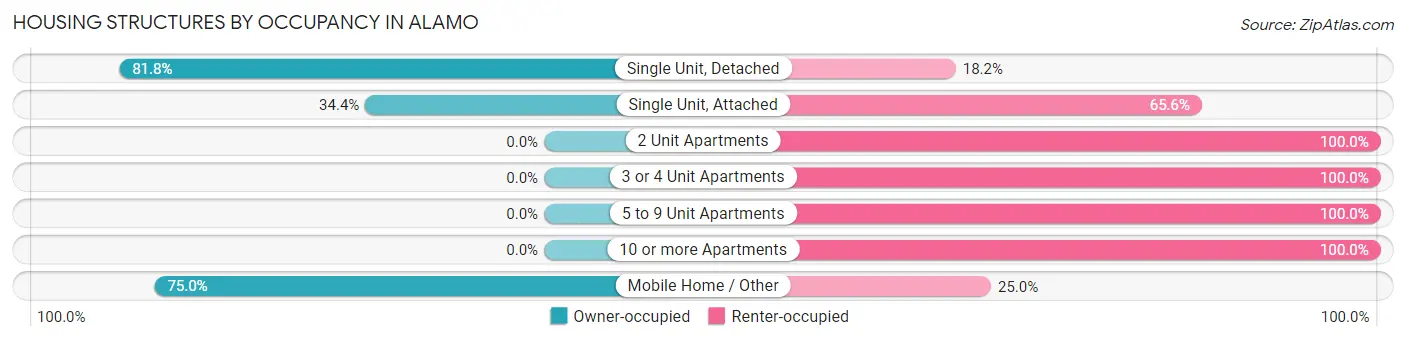
| Structure Type | Owner-occupied | Renter-occupied |
| Single Unit, Detached | 2,886 (81.8%) | 643 (18.2%) |
| Single Unit, Attached | 42 (34.4%) | 80 (65.6%) |
| 2 Unit Apartments | 0 (0.0%) | 84 (100.0%) |
| 3 or 4 Unit Apartments | 0 (0.0%) | 171 (100.0%) |
| 5 to 9 Unit Apartments | 0 (0.0%) | 99 (100.0%) |
| 10 or more Apartments | 0 (0.0%) | 205 (100.0%) |
| Mobile Home / Other | 1,337 (75.0%) | 446 (25.0%) |
| Total | 4,265 (71.2%) | 1,728 (28.8%) |
Housing Structures by Number of Rooms in Alamo
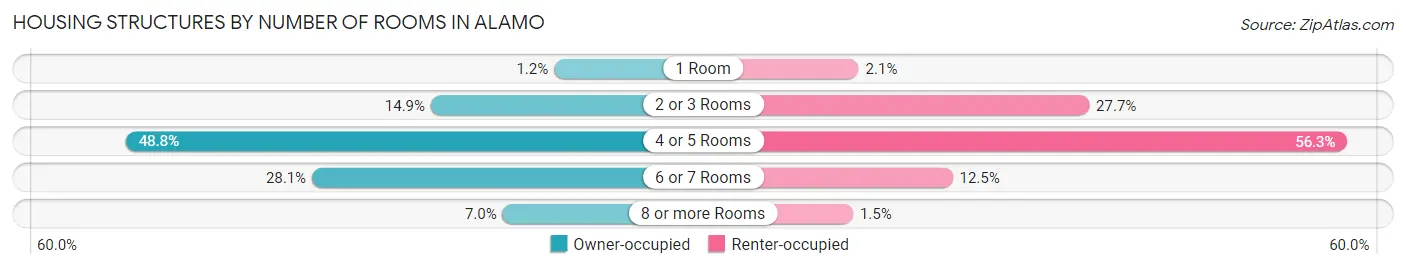
| Number of Rooms | Owner-occupied | Renter-occupied |
| 1 Room | 53 (1.2%) | 36 (2.1%) |
| 2 or 3 Rooms | 636 (14.9%) | 478 (27.7%) |
| 4 or 5 Rooms | 2,080 (48.8%) | 973 (56.3%) |
| 6 or 7 Rooms | 1,199 (28.1%) | 216 (12.5%) |
| 8 or more Rooms | 297 (7.0%) | 25 (1.5%) |
| Total | 4,265 (100.0%) | 1,728 (100.0%) |
Housing Structure by Heating Type in Alamo
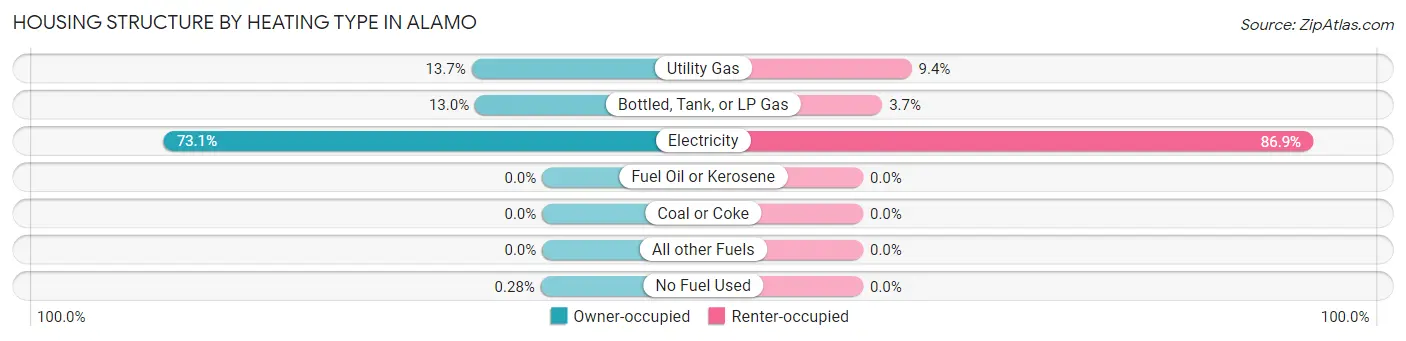
| Heating Type | Owner-occupied | Renter-occupied |
| Utility Gas | 582 (13.7%) | 162 (9.4%) |
| Bottled, Tank, or LP Gas | 553 (13.0%) | 64 (3.7%) |
| Electricity | 3,118 (73.1%) | 1,502 (86.9%) |
| Fuel Oil or Kerosene | 0 (0.0%) | 0 (0.0%) |
| Coal or Coke | 0 (0.0%) | 0 (0.0%) |
| All other Fuels | 0 (0.0%) | 0 (0.0%) |
| No Fuel Used | 12 (0.3%) | 0 (0.0%) |
| Total | 4,265 (100.0%) | 1,728 (100.0%) |
Household Vehicle Usage in Alamo
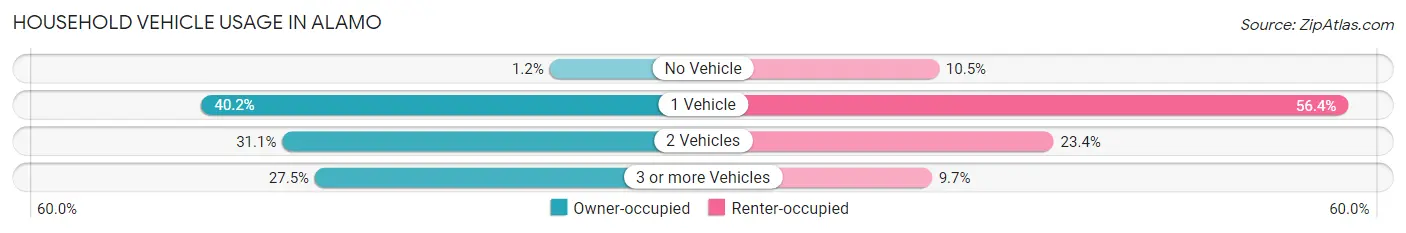
| Vehicles per Household | Owner-occupied | Renter-occupied |
| No Vehicle | 51 (1.2%) | 182 (10.5%) |
| 1 Vehicle | 1,714 (40.2%) | 974 (56.4%) |
| 2 Vehicles | 1,328 (31.1%) | 404 (23.4%) |
| 3 or more Vehicles | 1,172 (27.5%) | 168 (9.7%) |
| Total | 4,265 (100.0%) | 1,728 (100.0%) |
Real Estate & Mortgages in Alamo
Real Estate and Mortgage Overview in Alamo
| Characteristic | Without Mortgage | With Mortgage |
| Housing Units | 2,739 | 1,526 |
| Median Property Value | $62,300 | $144,900 |
| Median Household Income | $43,273 | $285 |
| Monthly Housing Costs | $454 | $60 |
| Real Estate Taxes | $1,501 | $36 |
Property Value by Mortgage Status in Alamo
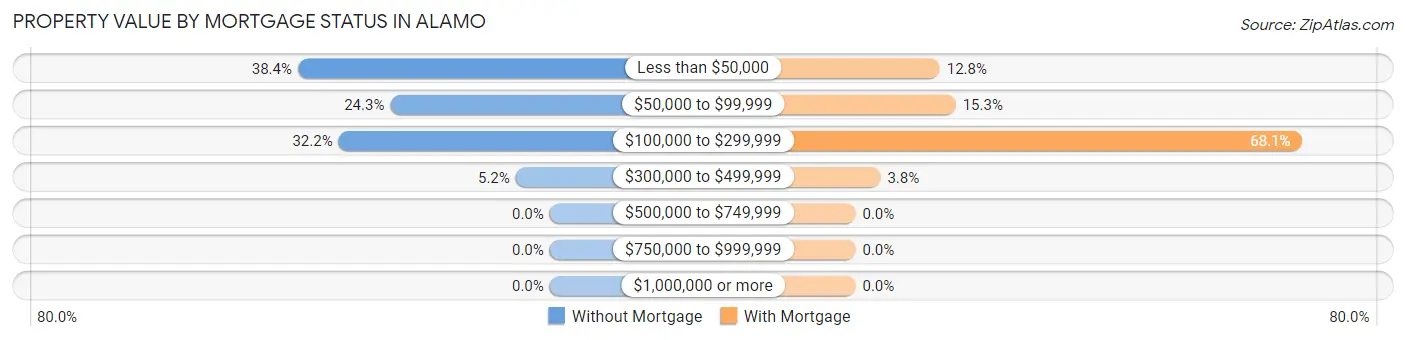
| Property Value | Without Mortgage | With Mortgage |
| Less than $50,000 | 1,051 (38.4%) | 196 (12.8%) |
| $50,000 to $99,999 | 665 (24.3%) | 233 (15.3%) |
| $100,000 to $299,999 | 881 (32.2%) | 1,039 (68.1%) |
| $300,000 to $499,999 | 142 (5.2%) | 58 (3.8%) |
| $500,000 to $749,999 | 0 (0.0%) | 0 (0.0%) |
| $750,000 to $999,999 | 0 (0.0%) | 0 (0.0%) |
| $1,000,000 or more | 0 (0.0%) | 0 (0.0%) |
| Total | 2,739 (100.0%) | 1,526 (100.0%) |
Household Income by Mortgage Status in Alamo
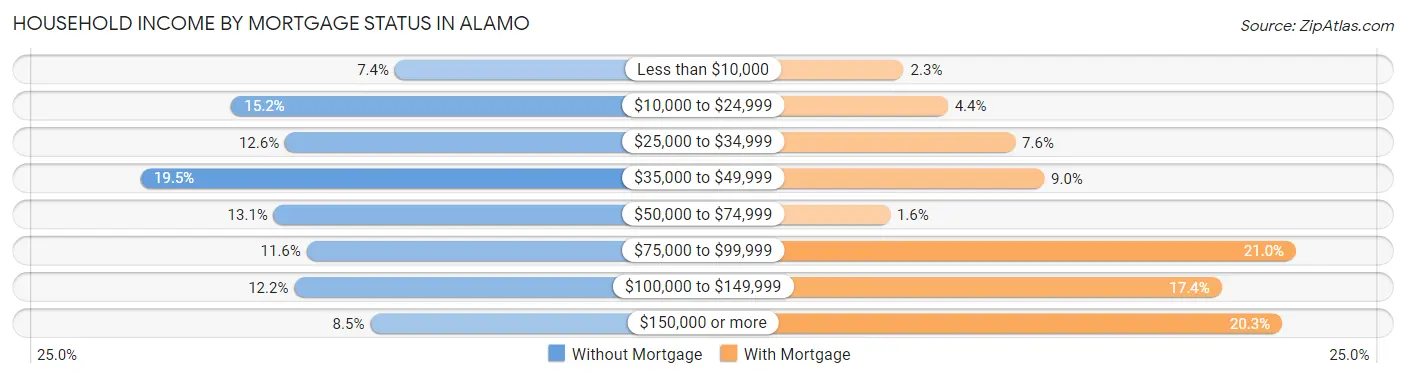
| Household Income | Without Mortgage | With Mortgage |
| Less than $10,000 | 202 (7.4%) | 35 (2.3%) |
| $10,000 to $24,999 | 415 (15.1%) | 67 (4.4%) |
| $25,000 to $34,999 | 345 (12.6%) | 116 (7.6%) |
| $35,000 to $49,999 | 533 (19.5%) | 137 (9.0%) |
| $50,000 to $74,999 | 360 (13.1%) | 25 (1.6%) |
| $75,000 to $99,999 | 317 (11.6%) | 320 (21.0%) |
| $100,000 to $149,999 | 333 (12.2%) | 266 (17.4%) |
| $150,000 or more | 234 (8.5%) | 310 (20.3%) |
| Total | 2,739 (100.0%) | 1,526 (100.0%) |
Property Value to Household Income Ratio in Alamo
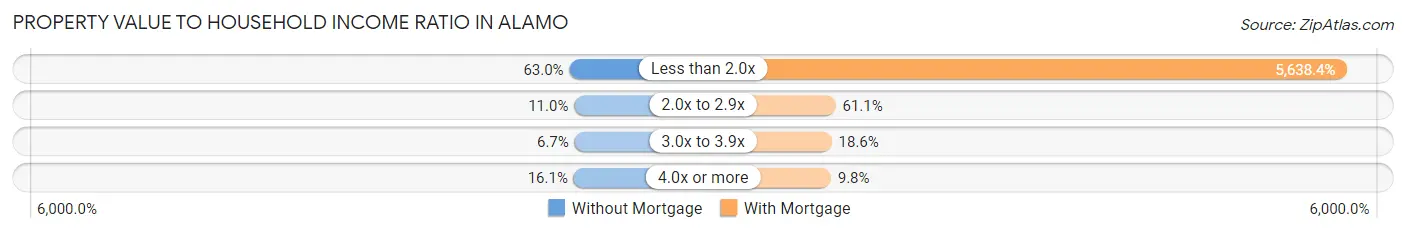
| Value-to-Income Ratio | Without Mortgage | With Mortgage |
| Less than 2.0x | 1,725 (63.0%) | 86,042 (5,638.4%) |
| 2.0x to 2.9x | 302 (11.0%) | 933 (61.1%) |
| 3.0x to 3.9x | 183 (6.7%) | 284 (18.6%) |
| 4.0x or more | 440 (16.1%) | 149 (9.8%) |
| Total | 2,739 (100.0%) | 1,526 (100.0%) |
Real Estate Taxes by Mortgage Status in Alamo
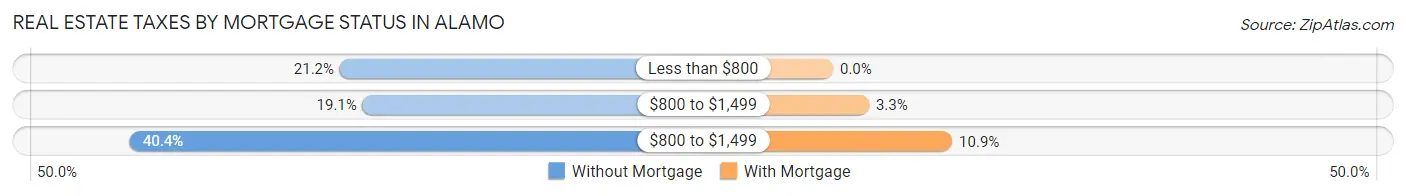
| Property Taxes | Without Mortgage | With Mortgage |
| Less than $800 | 581 (21.2%) | 0 (0.0%) |
| $800 to $1,499 | 524 (19.1%) | 50 (3.3%) |
| $800 to $1,499 | 1,106 (40.4%) | 166 (10.9%) |
| Total | 2,739 (100.0%) | 1,526 (100.0%) |
Health & Disability in Alamo
Health Insurance Coverage by Age in Alamo
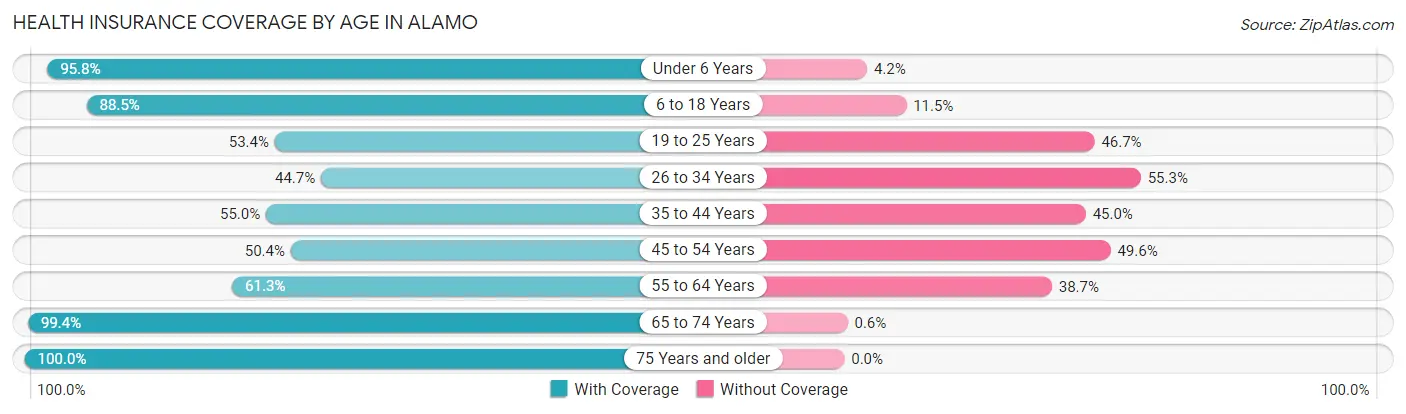
| Age Bracket | With Coverage | Without Coverage |
| Under 6 Years | 2,103 (95.8%) | 93 (4.2%) |
| 6 to 18 Years | 3,957 (88.5%) | 516 (11.5%) |
| 19 to 25 Years | 1,212 (53.3%) | 1,060 (46.7%) |
| 26 to 34 Years | 957 (44.7%) | 1,183 (55.3%) |
| 35 to 44 Years | 961 (55.0%) | 787 (45.0%) |
| 45 to 54 Years | 968 (50.4%) | 954 (49.6%) |
| 55 to 64 Years | 1,183 (61.3%) | 747 (38.7%) |
| 65 to 74 Years | 1,653 (99.4%) | 10 (0.6%) |
| 75 Years and older | 1,451 (100.0%) | 0 (0.0%) |
| Total | 14,445 (73.0%) | 5,350 (27.0%) |
Health Insurance Coverage by Citizenship Status in Alamo
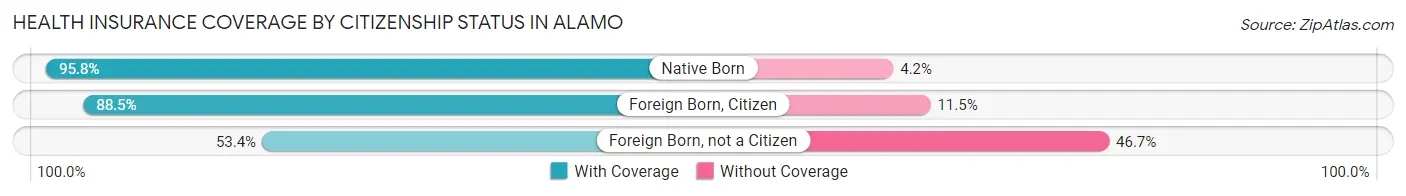
| Citizenship Status | With Coverage | Without Coverage |
| Native Born | 2,103 (95.8%) | 93 (4.2%) |
| Foreign Born, Citizen | 3,957 (88.5%) | 516 (11.5%) |
| Foreign Born, not a Citizen | 1,212 (53.3%) | 1,060 (46.7%) |
Health Insurance Coverage by Household Income in Alamo
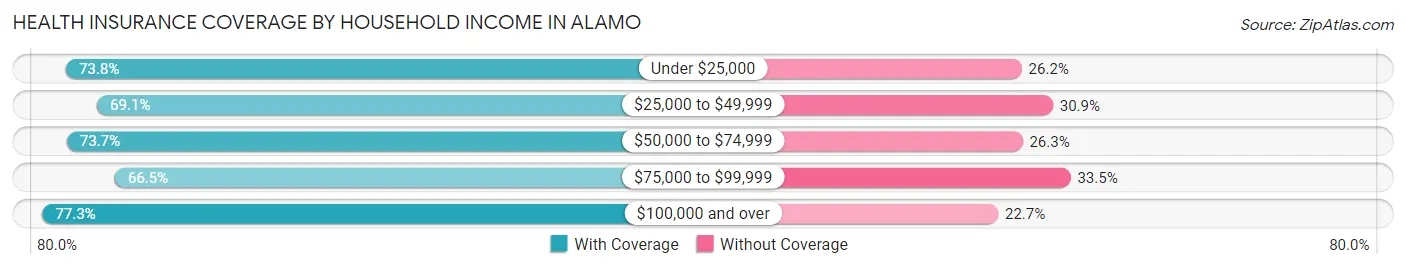
| Household Income | With Coverage | Without Coverage |
| Under $25,000 | 2,804 (73.8%) | 996 (26.2%) |
| $25,000 to $49,999 | 2,669 (69.1%) | 1,192 (30.9%) |
| $50,000 to $74,999 | 2,832 (73.7%) | 1,012 (26.3%) |
| $75,000 to $99,999 | 1,673 (66.5%) | 844 (33.5%) |
| $100,000 and over | 4,449 (77.3%) | 1,304 (22.7%) |
Public vs Private Health Insurance Coverage by Age in Alamo
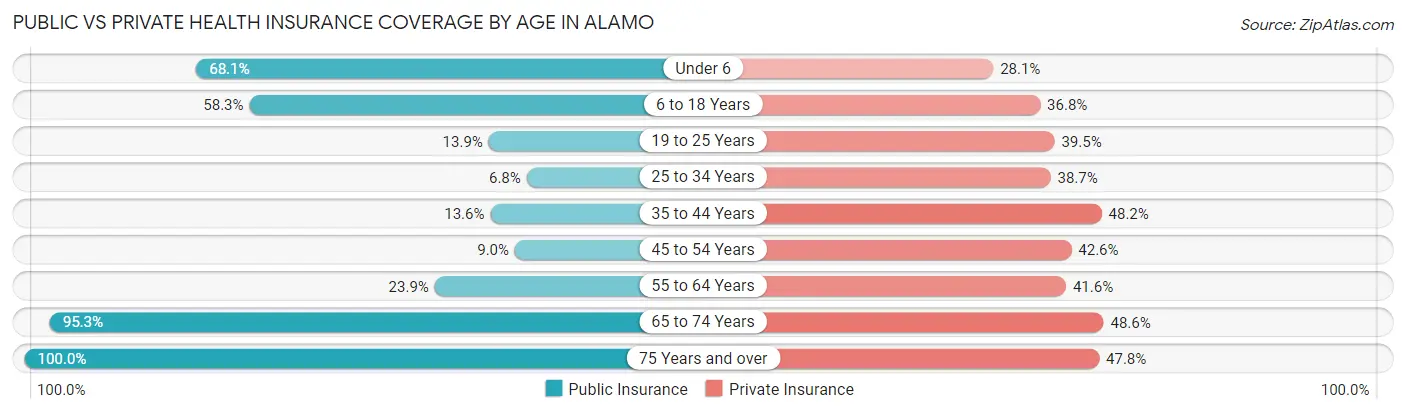
| Age Bracket | Public Insurance | Private Insurance |
| Under 6 | 1,496 (68.1%) | 617 (28.1%) |
| 6 to 18 Years | 2,607 (58.3%) | 1,647 (36.8%) |
| 19 to 25 Years | 315 (13.9%) | 897 (39.5%) |
| 25 to 34 Years | 146 (6.8%) | 829 (38.7%) |
| 35 to 44 Years | 237 (13.6%) | 843 (48.2%) |
| 45 to 54 Years | 173 (9.0%) | 819 (42.6%) |
| 55 to 64 Years | 461 (23.9%) | 803 (41.6%) |
| 65 to 74 Years | 1,585 (95.3%) | 808 (48.6%) |
| 75 Years and over | 1,451 (100.0%) | 693 (47.8%) |
| Total | 8,471 (42.8%) | 7,956 (40.2%) |
Disability Status by Sex by Age in Alamo
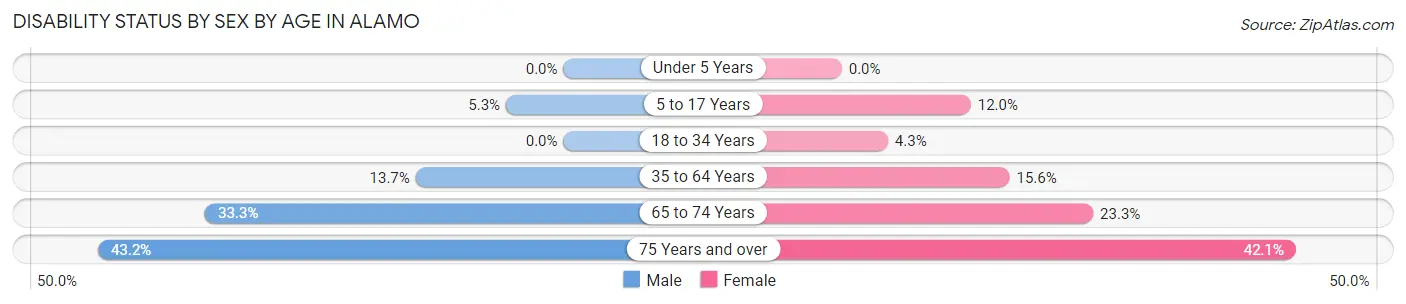
| Age Bracket | Male | Female |
| Under 5 Years | 0 (0.0%) | 0 (0.0%) |
| 5 to 17 Years | 126 (5.3%) | 269 (12.0%) |
| 18 to 34 Years | 0 (0.0%) | 110 (4.3%) |
| 35 to 64 Years | 375 (13.7%) | 446 (15.6%) |
| 65 to 74 Years | 255 (33.3%) | 209 (23.3%) |
| 75 Years and over | 311 (43.2%) | 308 (42.1%) |
Disability Class by Sex by Age in Alamo
Disability Class: Hearing Difficulty
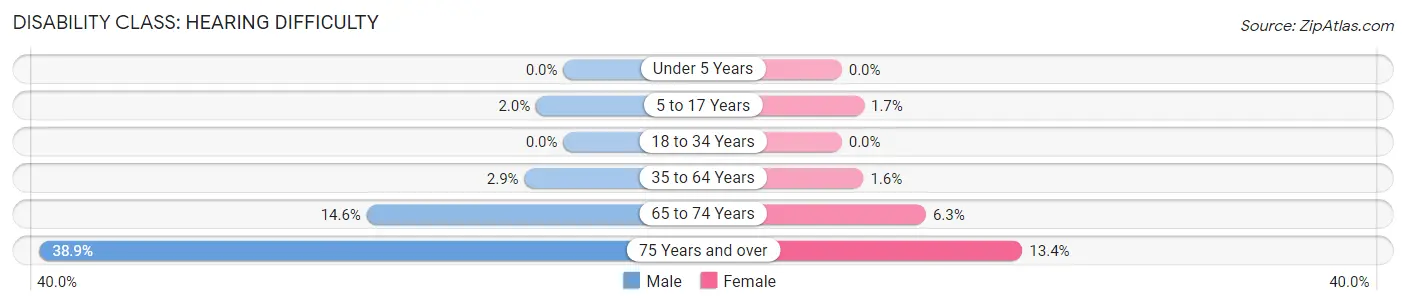
| Age Bracket | Male | Female |
| Under 5 Years | 0 (0.0%) | 0 (0.0%) |
| 5 to 17 Years | 48 (2.0%) | 37 (1.7%) |
| 18 to 34 Years | 0 (0.0%) | 0 (0.0%) |
| 35 to 64 Years | 79 (2.9%) | 46 (1.6%) |
| 65 to 74 Years | 112 (14.6%) | 56 (6.2%) |
| 75 Years and over | 280 (38.9%) | 98 (13.4%) |
Disability Class: Vision Difficulty
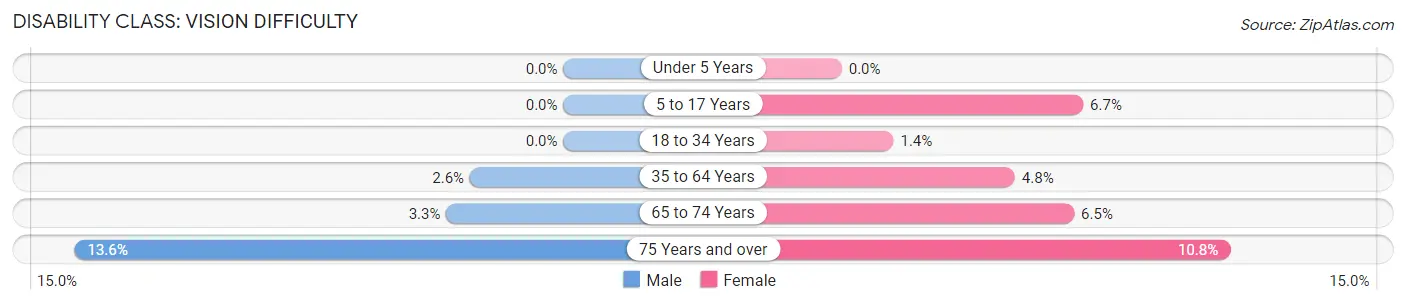
| Age Bracket | Male | Female |
| Under 5 Years | 0 (0.0%) | 0 (0.0%) |
| 5 to 17 Years | 0 (0.0%) | 151 (6.7%) |
| 18 to 34 Years | 0 (0.0%) | 37 (1.4%) |
| 35 to 64 Years | 71 (2.6%) | 138 (4.8%) |
| 65 to 74 Years | 25 (3.3%) | 58 (6.5%) |
| 75 Years and over | 98 (13.6%) | 79 (10.8%) |
Disability Class: Cognitive Difficulty
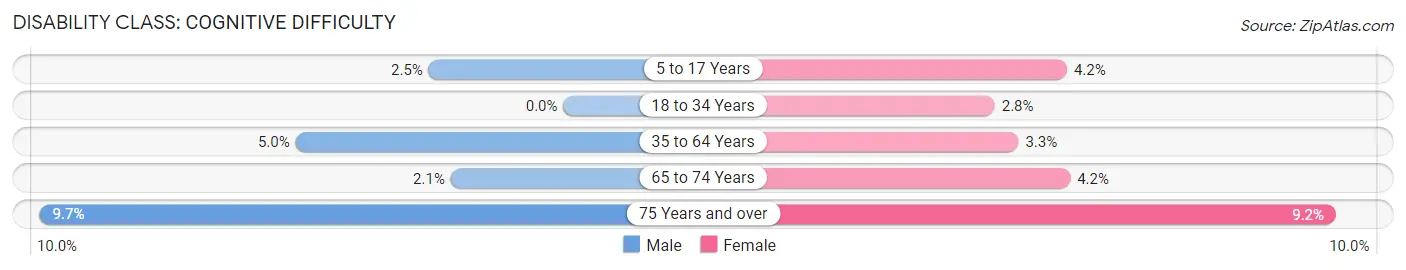
| Age Bracket | Male | Female |
| 5 to 17 Years | 59 (2.5%) | 94 (4.2%) |
| 18 to 34 Years | 0 (0.0%) | 73 (2.8%) |
| 35 to 64 Years | 136 (5.0%) | 94 (3.3%) |
| 65 to 74 Years | 16 (2.1%) | 38 (4.2%) |
| 75 Years and over | 70 (9.7%) | 67 (9.2%) |
Disability Class: Ambulatory Difficulty
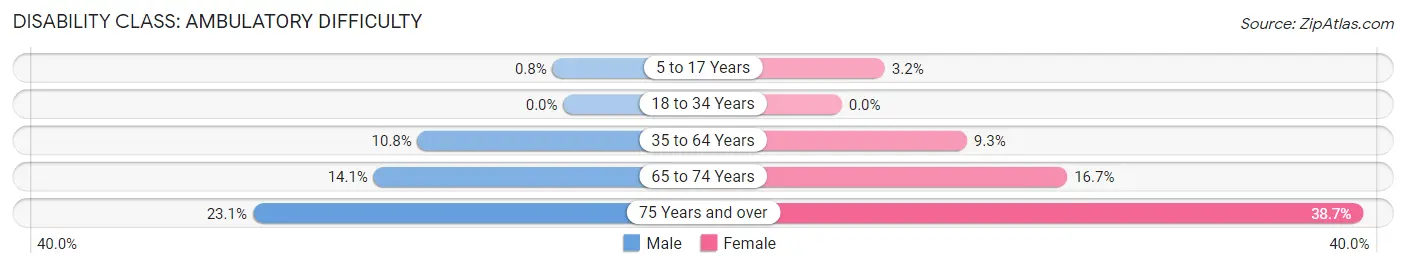
| Age Bracket | Male | Female |
| 5 to 17 Years | 19 (0.8%) | 72 (3.2%) |
| 18 to 34 Years | 0 (0.0%) | 0 (0.0%) |
| 35 to 64 Years | 296 (10.8%) | 266 (9.3%) |
| 65 to 74 Years | 108 (14.1%) | 150 (16.7%) |
| 75 Years and over | 166 (23.1%) | 283 (38.7%) |
Disability Class: Self-Care Difficulty
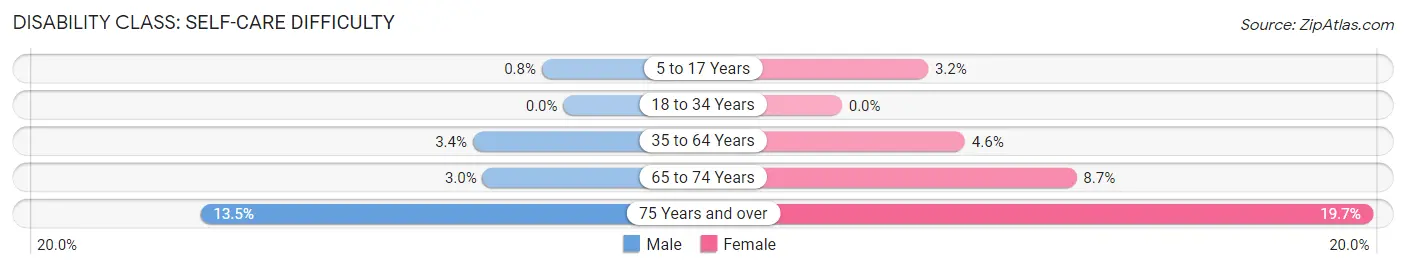
| Age Bracket | Male | Female |
| 5 to 17 Years | 19 (0.8%) | 72 (3.2%) |
| 18 to 34 Years | 0 (0.0%) | 0 (0.0%) |
| 35 to 64 Years | 92 (3.4%) | 131 (4.6%) |
| 65 to 74 Years | 23 (3.0%) | 78 (8.7%) |
| 75 Years and over | 97 (13.5%) | 144 (19.7%) |
Technology Access in Alamo
Computing Device Access in Alamo
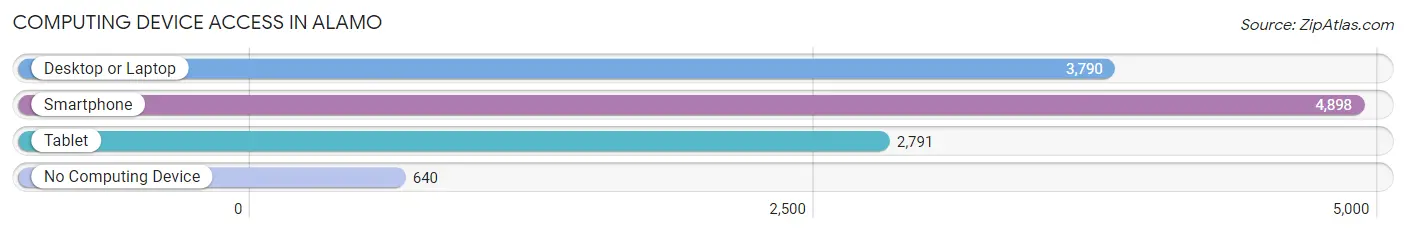
| Device Type | # Households | % Households |
| Desktop or Laptop | 3,790 | 63.2% |
| Smartphone | 4,898 | 81.7% |
| Tablet | 2,791 | 46.6% |
| No Computing Device | 640 | 10.7% |
| Total | 5,993 | 100.0% |
Internet Access in Alamo
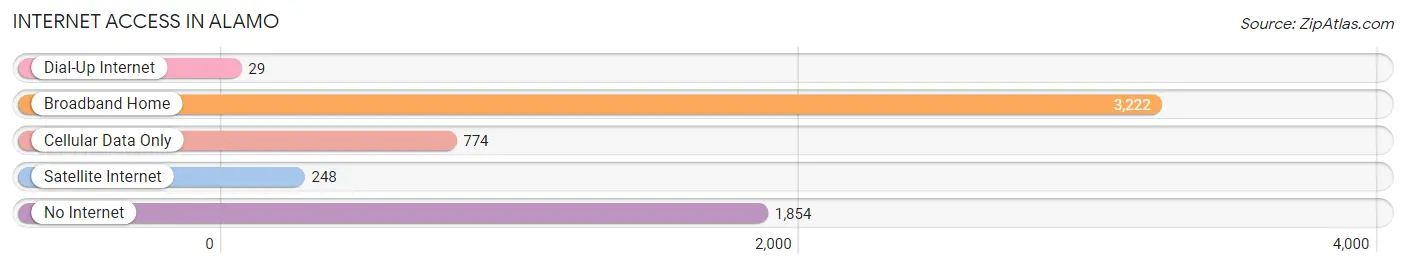
| Internet Type | # Households | % Households |
| Dial-Up Internet | 29 | 0.5% |
| Broadband Home | 3,222 | 53.8% |
| Cellular Data Only | 774 | 12.9% |
| Satellite Internet | 248 | 4.1% |
| No Internet | 1,854 | 30.9% |
| Total | 5,993 | 100.0% |
Alamo Summary
Alamo, Texas is a small town located in Hidalgo County, Texas. It is situated on the Rio Grande River, just south of the city of McAllen. The town was founded in 1848 and is named after the Alamo, the famous mission in San Antonio. The population of Alamo was estimated to be 8,945 in 2019.
Geography
Alamo is located in the Rio Grande Valley of South Texas, approximately 20 miles west of the Gulf of Mexico. The town is situated on the Rio Grande River, which forms the border between the United States and Mexico. The town is surrounded by agricultural land, with cotton, corn, and sorghum being the main crops. The climate in Alamo is subtropical, with hot summers and mild winters.
Economy
Alamo’s economy is largely based on agriculture, with cotton, corn, and sorghum being the main crops. The town is also home to several manufacturing companies, including a plastics factory and a furniture factory. The town is also home to a number of retail stores, restaurants, and other businesses.
Demographics
As of 2019, the population of Alamo was estimated to be 8,945. The population is predominantly Hispanic, with over 90% of the population identifying as Hispanic or Latino. The median household income in Alamo is $30,945, and the median age is 28.
History
Alamo was founded in 1848 by a group of settlers from the nearby town of Reynosa, Mexico. The town was named after the Alamo, the famous mission in San Antonio. The town grew rapidly in the late 19th century, and by the early 20th century, it had become a major agricultural center. The town was also home to a number of businesses, including a cotton gin, a furniture factory, and a plastics factory.
In the late 20th century, Alamo experienced a period of rapid growth, as the town became a popular destination for immigrants from Mexico and Central America. The population of Alamo has grown steadily since then, and the town is now home to a diverse population of people from all over the world.
Conclusion
Alamo, Texas is a small town located in Hidalgo County, Texas. It is situated on the Rio Grande River, just south of the city of McAllen. The town was founded in 1848 and is named after the Alamo, the famous mission in San Antonio. The population of Alamo was estimated to be 8,945 in 2019. The town’s economy is largely based on agriculture, with cotton, corn, and sorghum being the main crops. The population of Alamo is predominantly Hispanic, with over 90% of the population identifying as Hispanic or Latino. The town has experienced a period of rapid growth in recent years, as it has become a popular destination for immigrants from Mexico and Central America.
Common Questions
What is Per Capita Income in Alamo?
Per Capita income in Alamo is $19,402.
What is the Median Family Income in Alamo?
Median Family Income in Alamo is $55,187.
What is the Median Household income in Alamo?
Median Household Income in Alamo is $47,398.
What is Income or Wage Gap in Alamo?
Income or Wage Gap in Alamo is 34.8%.
Women in Alamo earn 65.2 cents for every dollar earned by a man.
What is Family Income Deficit in Alamo?
Family Income Deficit in Alamo is $9,694.
Families that are below poverty line in Alamo earn $9,694 less on average than the poverty threshold level.
What is Inequality or Gini Index in Alamo?
Inequality or Gini Index in Alamo is 0.46.
What is the Total Population of Alamo?
Total Population of Alamo is 19,811.
What is the Total Male Population of Alamo?
Total Male Population of Alamo is 9,619.
What is the Total Female Population of Alamo?
Total Female Population of Alamo is 10,192.
What is the Ratio of Males per 100 Females in Alamo?
There are 94.38 Males per 100 Females in Alamo.
What is the Ratio of Females per 100 Males in Alamo?
There are 105.96 Females per 100 Males in Alamo.
What is the Median Population Age in Alamo?
Median Population Age in Alamo is 30.1 Years.
What is the Average Family Size in Alamo
Average Family Size in Alamo is 3.9 People.
What is the Average Household Size in Alamo
Average Household Size in Alamo is 3.3 People.
How Large is the Labor Force in Alamo?
There are 7,503 People in the Labor Forcein in Alamo.
What is the Percentage of People in the Labor Force in Alamo?
53.5% of People are in the Labor Force in Alamo.
What is the Unemployment Rate in Alamo?
Unemployment Rate in Alamo is 9.4%.