Normangee, TX Map & Demographics
Normangee Map
Normangee Overview
$28,177
PER CAPITA INCOME
$44,242
AVG FAMILY INCOME
$44,621
AVG HOUSEHOLD INCOME
43.0%
WAGE / INCOME GAP [ % ]
57.0¢/ $1
WAGE / INCOME GAP [ $ ]
0.41
INEQUALITY / GINI INDEX
734
TOTAL POPULATION
381
MALE POPULATION
353
FEMALE POPULATION
107.93
MALES / 100 FEMALES
92.65
FEMALES / 100 MALES
54.6
MEDIAN AGE
2.6
AVG FAMILY SIZE
2.4
AVG HOUSEHOLD SIZE
360
LABOR FORCE [ PEOPLE ]
59.0%
PERCENT IN LABOR FORCE
6.9%
UNEMPLOYMENT RATE
Normangee Zip Codes
Normangee Area Codes
Income in Normangee
Income Overview in Normangee
Per Capita Income in Normangee is $28,177, while median incomes of families and households are $44,242 and $44,621 respectively.
| Characteristic | Number | Measure |
| Per Capita Income | 734 | $28,177 |
| Median Family Income | 246 | $44,242 |
| Mean Family Income | 246 | $76,003 |
| Median Household Income | 312 | $44,621 |
| Mean Household Income | 312 | $69,035 |
| Income Deficit | 246 | $0 |
| Wage / Income Gap (%) | 734 | 42.97% |
| Wage / Income Gap ($) | 734 | 57.03¢ per $1 |
| Gini / Inequality Index | 734 | 0.41 |
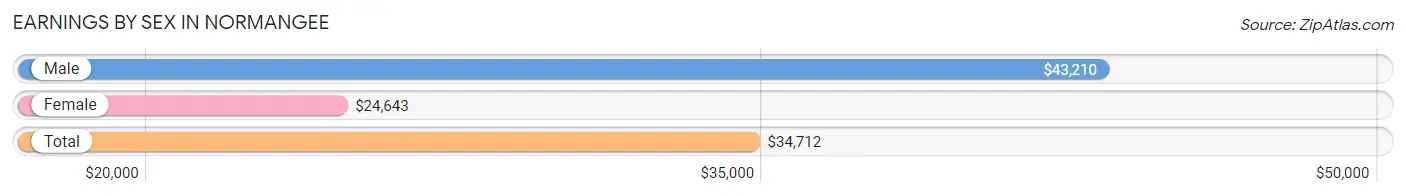
Earnings by Sex in Normangee
Average Earnings in Normangee are $34,712, $43,210 for men and $24,643 for women, a difference of 43.0%.
| Sex | Number | Average Earnings |
| Male | 242 (66.1%) | $43,210 |
| Female | 124 (33.9%) | $24,643 |
| Total | 366 (100.0%) | $34,712 |
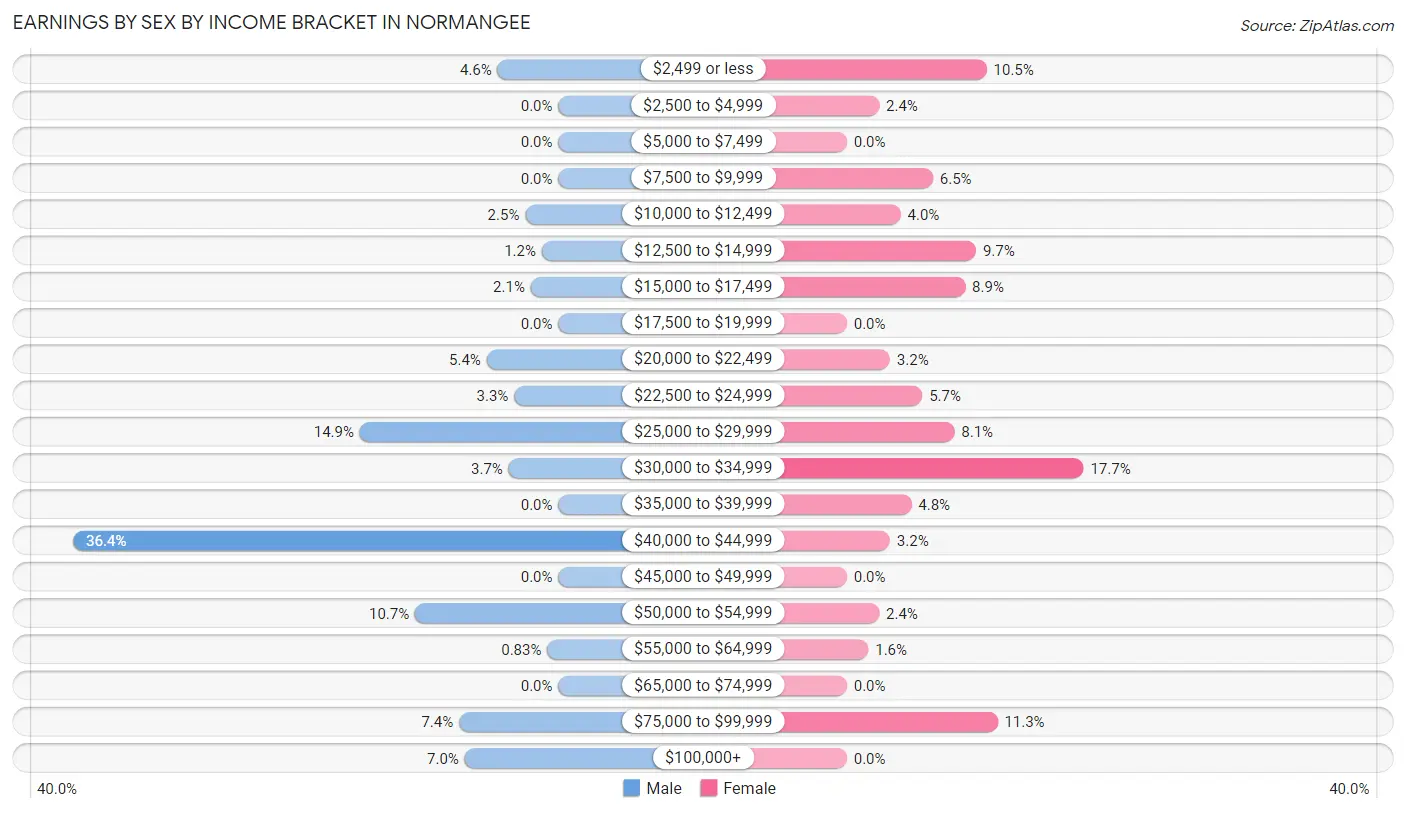
Earnings by Sex by Income Bracket in Normangee
The most common earnings brackets in Normangee are $40,000 to $44,999 for men (88 | 36.4%) and $30,000 to $34,999 for women (22 | 17.7%).
| Income | Male | Female |
| $2,499 or less | 11 (4.5%) | 13 (10.5%) |
| $2,500 to $4,999 | 0 (0.0%) | 3 (2.4%) |
| $5,000 to $7,499 | 0 (0.0%) | 0 (0.0%) |
| $7,500 to $9,999 | 0 (0.0%) | 8 (6.5%) |
| $10,000 to $12,499 | 6 (2.5%) | 5 (4.0%) |
| $12,500 to $14,999 | 3 (1.2%) | 12 (9.7%) |
| $15,000 to $17,499 | 5 (2.1%) | 11 (8.9%) |
| $17,500 to $19,999 | 0 (0.0%) | 0 (0.0%) |
| $20,000 to $22,499 | 13 (5.4%) | 4 (3.2%) |
| $22,500 to $24,999 | 8 (3.3%) | 7 (5.7%) |
| $25,000 to $29,999 | 36 (14.9%) | 10 (8.1%) |
| $30,000 to $34,999 | 9 (3.7%) | 22 (17.7%) |
| $35,000 to $39,999 | 0 (0.0%) | 6 (4.8%) |
| $40,000 to $44,999 | 88 (36.4%) | 4 (3.2%) |
| $45,000 to $49,999 | 0 (0.0%) | 0 (0.0%) |
| $50,000 to $54,999 | 26 (10.7%) | 3 (2.4%) |
| $55,000 to $64,999 | 2 (0.8%) | 2 (1.6%) |
| $65,000 to $74,999 | 0 (0.0%) | 0 (0.0%) |
| $75,000 to $99,999 | 18 (7.4%) | 14 (11.3%) |
| $100,000+ | 17 (7.0%) | 0 (0.0%) |
| Total | 242 (100.0%) | 124 (100.0%) |
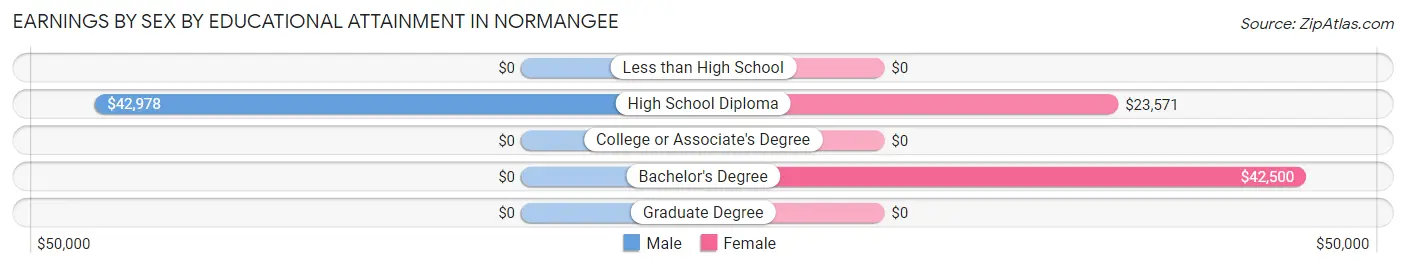
Earnings by Sex by Educational Attainment in Normangee
Average earnings in Normangee are $42,978 for men and $26,625 for women, a difference of 38.1%. Men with an educational attainment of high school diploma enjoy the highest average annual earnings of $42,978, while those with high school diploma education earn the least with $42,978. Women with an educational attainment of bachelor's degree earn the most with the average annual earnings of $42,500, while those with high school diploma education have the smallest earnings of $23,571.
| Educational Attainment | Male Income | Female Income |
| Less than High School | - | - |
| High School Diploma | $42,978 | $23,571 |
| College or Associate's Degree | - | - |
| Bachelor's Degree | - | - |
| Graduate Degree | - | - |
| Total | $42,978 | $26,625 |
Family Income in Normangee
Family Income Brackets in Normangee
According to the Normangee family income data, there are 108 families falling into the $35,000 to $49,999 income range, which is the most common income bracket and makes up 43.9% of all families.
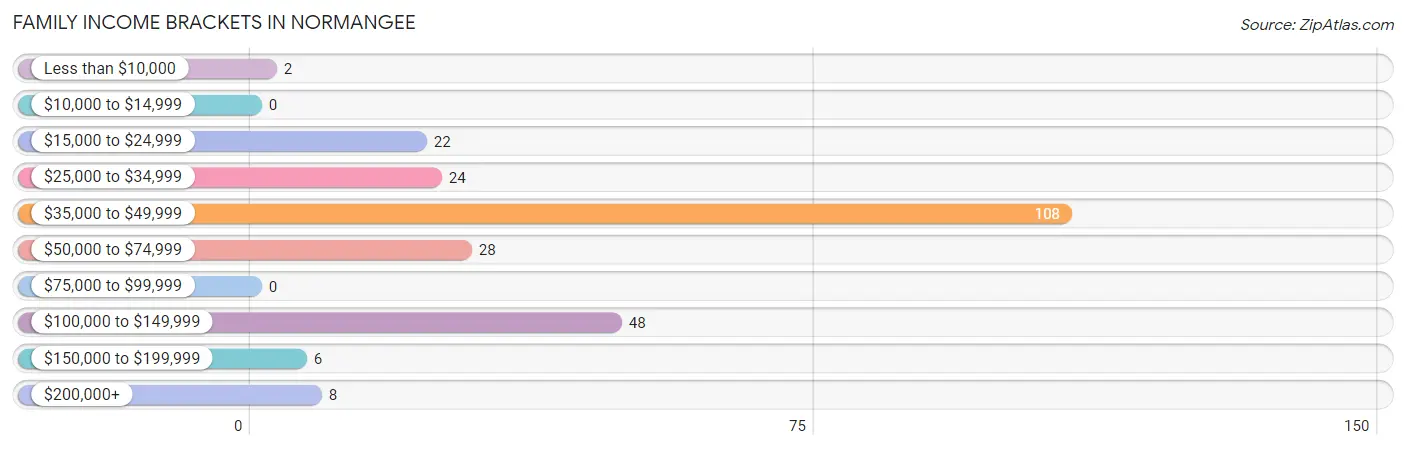
| Income Bracket | # Families | % Families |
| Less than $10,000 | 2 | 0.8% |
| $10,000 to $14,999 | 0 | 0.0% |
| $15,000 to $24,999 | 22 | 8.9% |
| $25,000 to $34,999 | 24 | 9.8% |
| $35,000 to $49,999 | 108 | 43.9% |
| $50,000 to $74,999 | 28 | 11.4% |
| $75,000 to $99,999 | 0 | 0.0% |
| $100,000 to $149,999 | 48 | 19.5% |
| $150,000 to $199,999 | 6 | 2.4% |
| $200,000+ | 8 | 3.3% |
Family Income by Famaliy Size in Normangee
3-person families (30 | 12.2%) account for the highest median family income in Normangee with $111,000 per family, while 3-person families (30 | 12.2%) have the highest median income of $37,000 per family member.
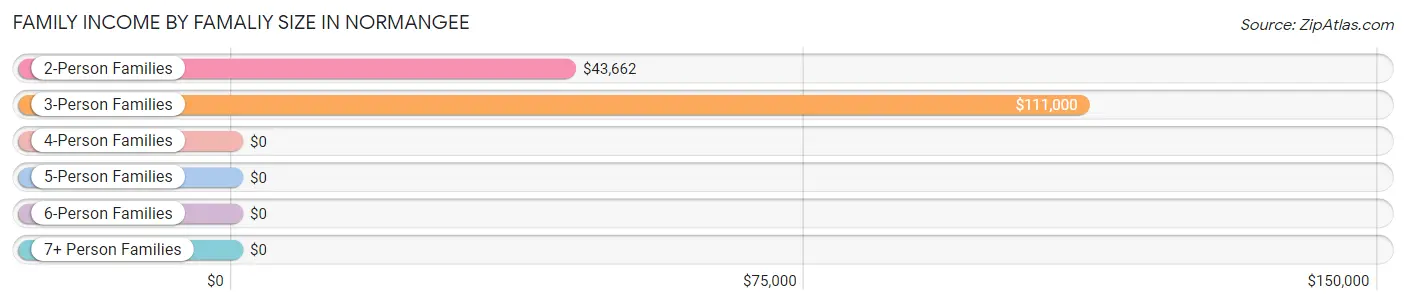
| Income Bracket | # Families | Median Income |
| 2-Person Families | 180 (73.2%) | $43,662 |
| 3-Person Families | 30 (12.2%) | $111,000 |
| 4-Person Families | 15 (6.1%) | $0 |
| 5-Person Families | 19 (7.7%) | $0 |
| 6-Person Families | 2 (0.8%) | $0 |
| 7+ Person Families | 0 (0.0%) | $0 |
| Total | 246 (100.0%) | $44,242 |
Family Income by Number of Earners in Normangee
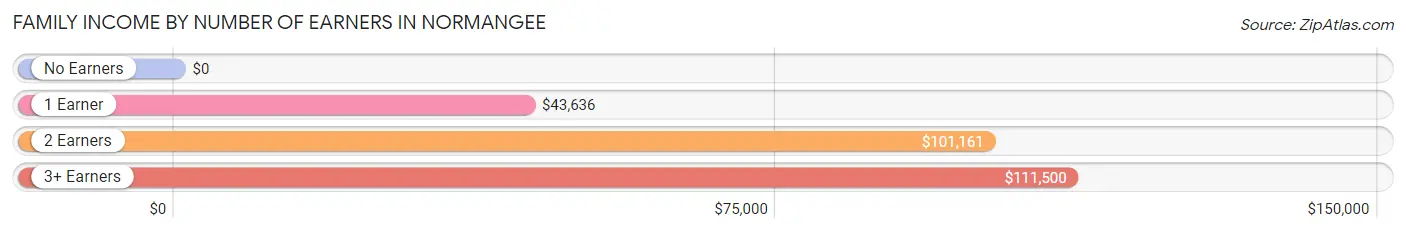
| Number of Earners | # Families | Median Income |
| No Earners | 23 (9.3%) | $0 |
| 1 Earner | 168 (68.3%) | $43,636 |
| 2 Earners | 27 (11.0%) | $101,161 |
| 3+ Earners | 28 (11.4%) | $111,500 |
| Total | 246 (100.0%) | $44,242 |
Household Income in Normangee
Household Income Brackets in Normangee
With 113 households falling in the category, the $35,000 to $49,999 income range is the most frequent in Normangee, accounting for 36.2% of all households.
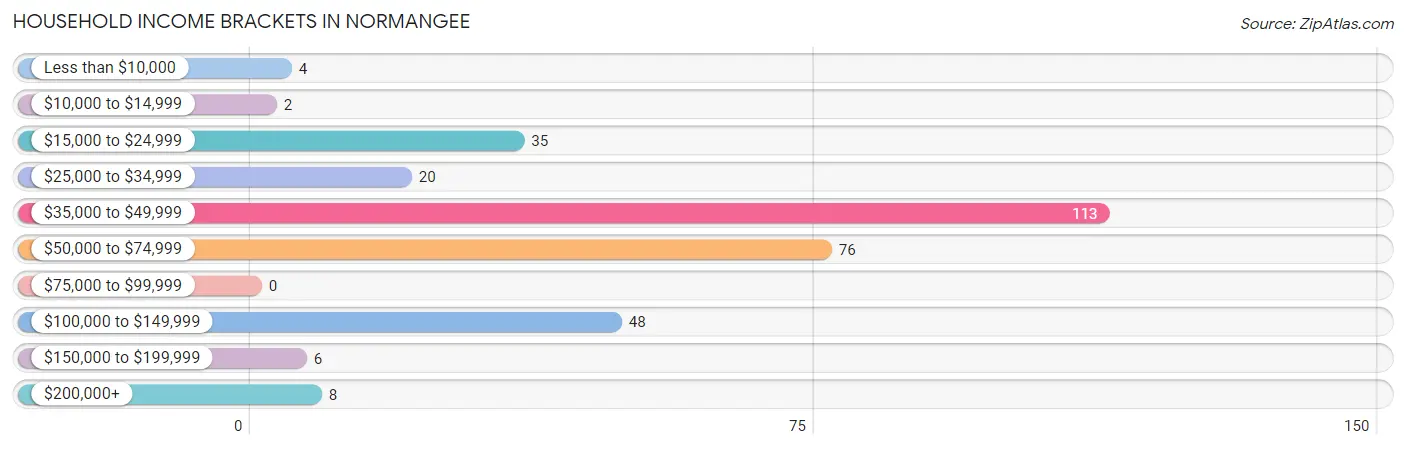
| Income Bracket | # Households | % Households |
| Less than $10,000 | 4 | 1.3% |
| $10,000 to $14,999 | 2 | 0.6% |
| $15,000 to $24,999 | 35 | 11.2% |
| $25,000 to $34,999 | 20 | 6.4% |
| $35,000 to $49,999 | 113 | 36.2% |
| $50,000 to $74,999 | 76 | 24.4% |
| $75,000 to $99,999 | 0 | 0.0% |
| $100,000 to $149,999 | 48 | 15.4% |
| $150,000 to $199,999 | 6 | 1.9% |
| $200,000+ | 8 | 2.6% |
Household Income by Householder Age in Normangee
The median household income in Normangee is $44,621, with the highest median household income of $71,477 found in the 25 to 44 years age bracket for the primary householder. A total of 55 households (17.6%) fall into this category. Meanwhile, the 15 to 24 years age bracket for the primary householder has the lowest median household income of $0, with 26 households (8.3%) in this group.
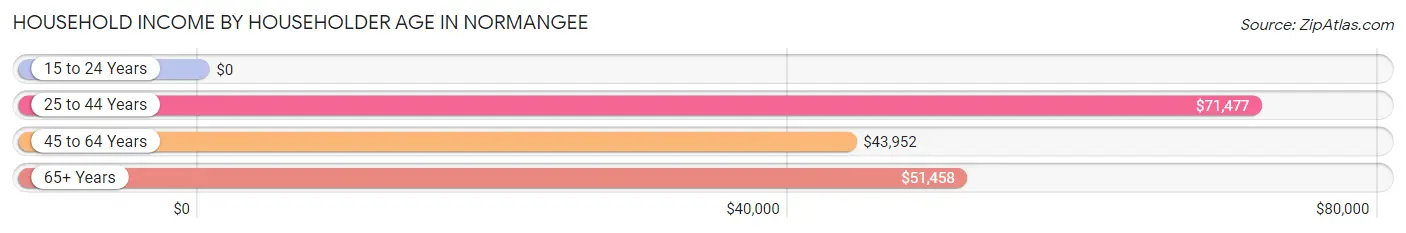
| Income Bracket | # Households | Median Income |
| 15 to 24 Years | 26 (8.3%) | $0 |
| 25 to 44 Years | 55 (17.6%) | $71,477 |
| 45 to 64 Years | 187 (59.9%) | $43,952 |
| 65+ Years | 44 (14.1%) | $51,458 |
| Total | 312 (100.0%) | $44,621 |
Poverty in Normangee
Income Below Poverty by Sex and Age in Normangee
With 2.9% poverty level for males and 7.6% for females among the residents of Normangee, 35 to 44 year old males and 45 to 54 year old females are the most vulnerable to poverty, with 5 males (9.1%) and 15 females (37.5%) in their respective age groups living below the poverty level.
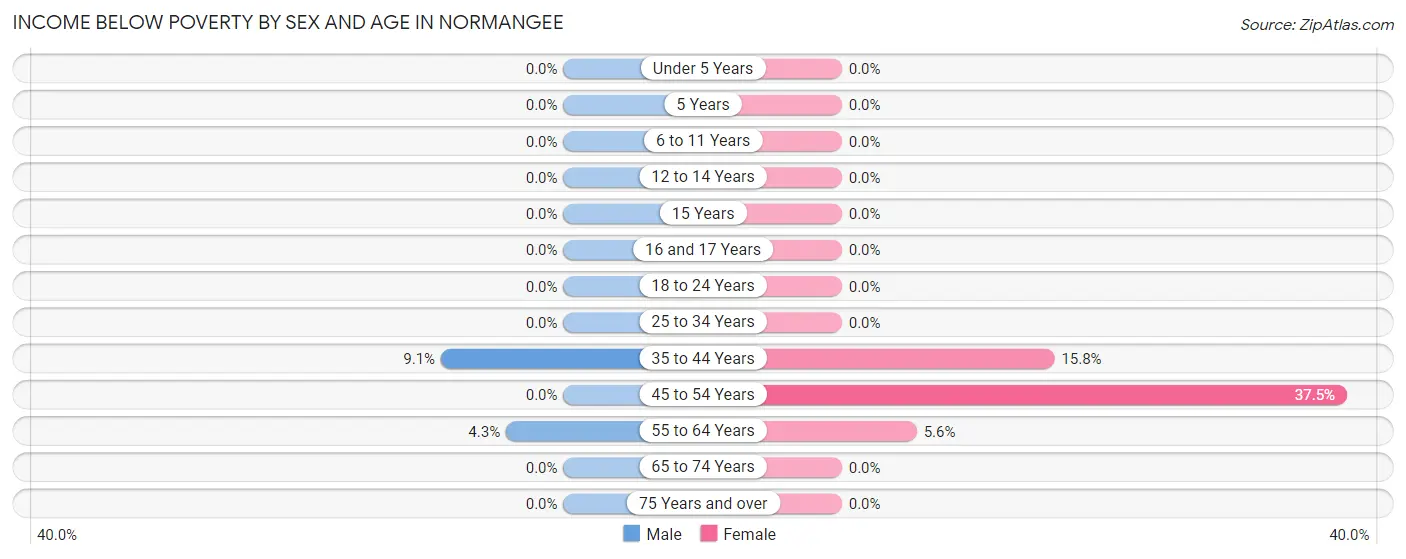
| Age Bracket | Male | Female |
| Under 5 Years | 0 (0.0%) | 0 (0.0%) |
| 5 Years | 0 (0.0%) | 0 (0.0%) |
| 6 to 11 Years | 0 (0.0%) | 0 (0.0%) |
| 12 to 14 Years | 0 (0.0%) | 0 (0.0%) |
| 15 Years | 0 (0.0%) | 0 (0.0%) |
| 16 and 17 Years | 0 (0.0%) | 0 (0.0%) |
| 18 to 24 Years | 0 (0.0%) | 0 (0.0%) |
| 25 to 34 Years | 0 (0.0%) | 0 (0.0%) |
| 35 to 44 Years | 5 (9.1%) | 3 (15.8%) |
| 45 to 54 Years | 0 (0.0%) | 15 (37.5%) |
| 55 to 64 Years | 6 (4.3%) | 9 (5.6%) |
| 65 to 74 Years | 0 (0.0%) | 0 (0.0%) |
| 75 Years and over | 0 (0.0%) | 0 (0.0%) |
| Total | 11 (2.9%) | 27 (7.6%) |
Income Above Poverty by Sex and Age in Normangee
According to the poverty statistics in Normangee, males aged under 5 years and females aged under 5 years are the age groups that are most secure financially, with 100.0% of males and 100.0% of females in these age groups living above the poverty line.
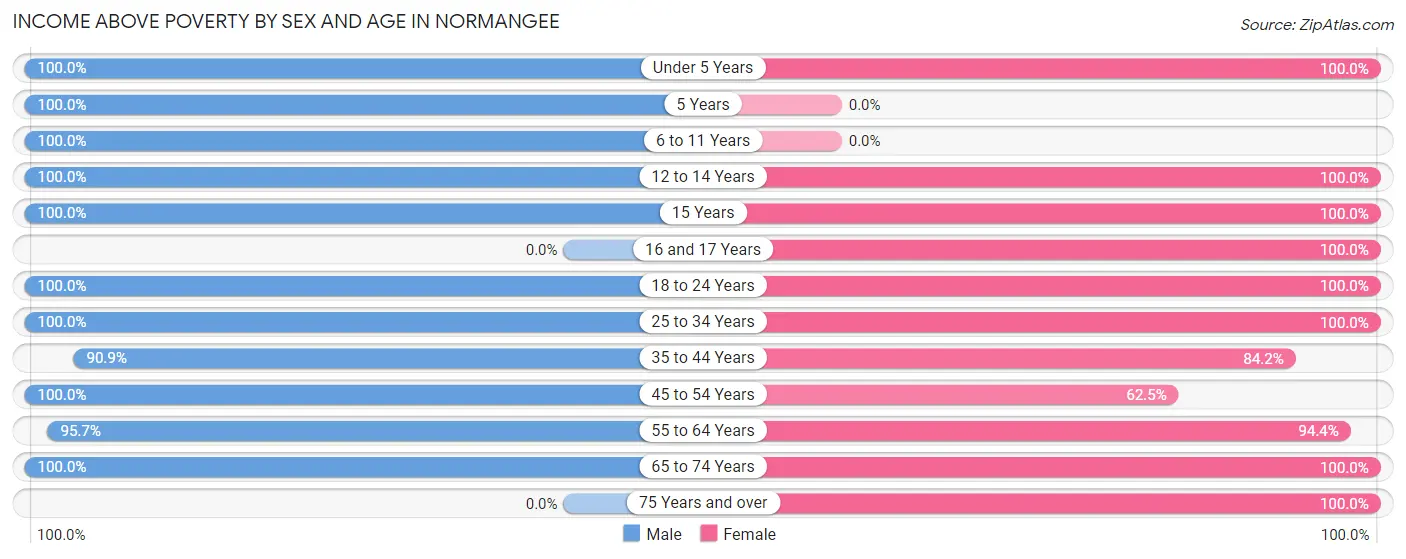
| Age Bracket | Male | Female |
| Under 5 Years | 9 (100.0%) | 2 (100.0%) |
| 5 Years | 5 (100.0%) | 0 (0.0%) |
| 6 to 11 Years | 42 (100.0%) | 0 (0.0%) |
| 12 to 14 Years | 5 (100.0%) | 33 (100.0%) |
| 15 Years | 15 (100.0%) | 13 (100.0%) |
| 16 and 17 Years | 0 (0.0%) | 7 (100.0%) |
| 18 to 24 Years | 37 (100.0%) | 16 (100.0%) |
| 25 to 34 Years | 10 (100.0%) | 37 (100.0%) |
| 35 to 44 Years | 50 (90.9%) | 16 (84.2%) |
| 45 to 54 Years | 27 (100.0%) | 25 (62.5%) |
| 55 to 64 Years | 135 (95.7%) | 153 (94.4%) |
| 65 to 74 Years | 35 (100.0%) | 5 (100.0%) |
| 75 Years and over | 0 (0.0%) | 19 (100.0%) |
| Total | 370 (97.1%) | 326 (92.3%) |
Income Below Poverty Among Married-Couple Families in Normangee
The poverty statistics for married-couple families in Normangee show that 3.2% or 6 of the total 188 families live below the poverty line. Families with no children have the highest poverty rate of 4.2%, comprising of 6 families. On the other hand, families with 1 or 2 children have the lowest poverty rate of 0.0%, which includes 0 families.
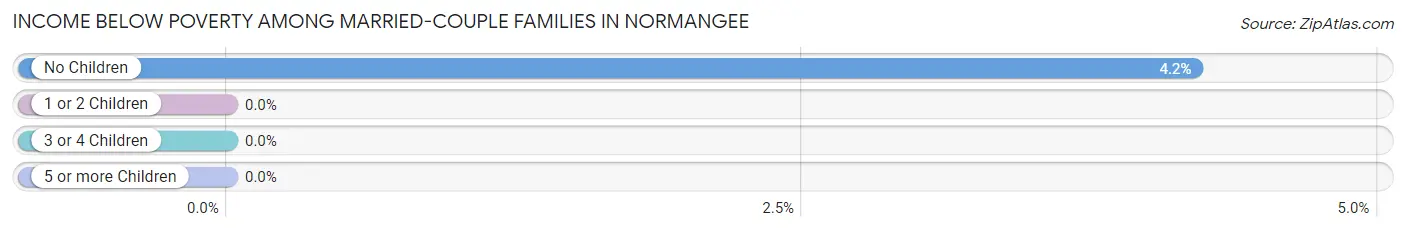
| Children | Above Poverty | Below Poverty |
| No Children | 137 (95.8%) | 6 (4.2%) |
| 1 or 2 Children | 28 (100.0%) | 0 (0.0%) |
| 3 or 4 Children | 17 (100.0%) | 0 (0.0%) |
| 5 or more Children | 0 (0.0%) | 0 (0.0%) |
| Total | 182 (96.8%) | 6 (3.2%) |
Income Below Poverty Among Single-Parent Households in Normangee
| Children | Single Father | Single Mother |
| No Children | 0 (0.0%) | 0 (0.0%) |
| 1 or 2 Children | 0 (0.0%) | 0 (0.0%) |
| 3 or 4 Children | 0 (0.0%) | 0 (0.0%) |
| 5 or more Children | 0 (0.0%) | 0 (0.0%) |
| Total | 0 (0.0%) | 0 (0.0%) |
Income Below Poverty Among Married-Couple vs Single-Parent Households in Normangee
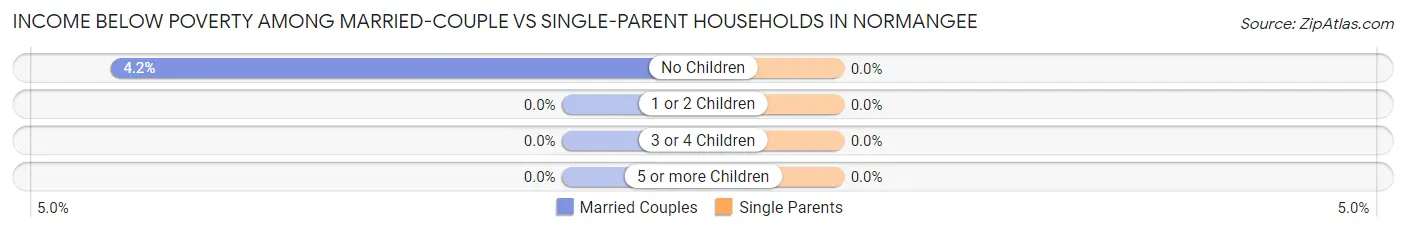
| Children | Married-Couple Families | Single-Parent Households |
| No Children | 6 (4.2%) | 0 (0.0%) |
| 1 or 2 Children | 0 (0.0%) | 0 (0.0%) |
| 3 or 4 Children | 0 (0.0%) | 0 (0.0%) |
| 5 or more Children | 0 (0.0%) | 0 (0.0%) |
| Total | 6 (3.2%) | 0 (0.0%) |
Race in Normangee
The most populous races in Normangee are White / Caucasian (610 | 83.1%), Black / African American (94 | 12.8%), and Native / Alaskan (17 | 2.3%).
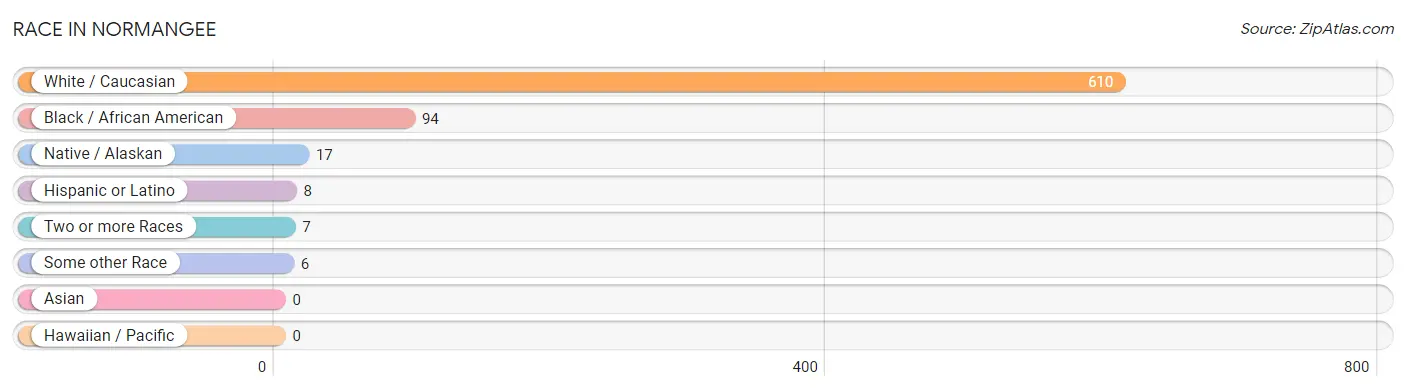
| Race | # Population | % Population |
| Asian | 0 | 0.0% |
| Black / African American | 94 | 12.8% |
| Hawaiian / Pacific | 0 | 0.0% |
| Hispanic or Latino | 8 | 1.1% |
| Native / Alaskan | 17 | 2.3% |
| White / Caucasian | 610 | 83.1% |
| Two or more Races | 7 | 0.9% |
| Some other Race | 6 | 0.8% |
| Total | 734 | 100.0% |
Ancestry in Normangee
The most populous ancestries reported in Normangee are German (88 | 12.0%), Irish (63 | 8.6%), English (58 | 7.9%), American (56 | 7.6%), and Scottish (20 | 2.7%), together accounting for 38.8% of all Normangee residents.
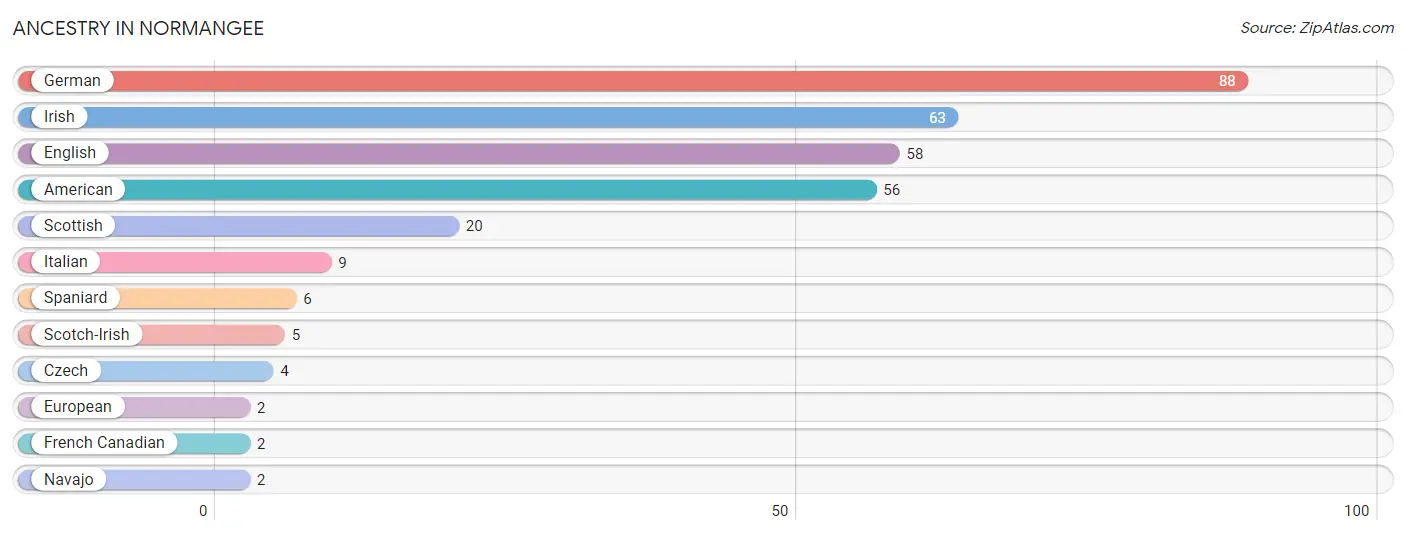
| Ancestry | # Population | % Population |
| American | 56 | 7.6% |
| Czech | 4 | 0.5% |
| English | 58 | 7.9% |
| European | 2 | 0.3% |
| French Canadian | 2 | 0.3% |
| German | 88 | 12.0% |
| Irish | 63 | 8.6% |
| Italian | 9 | 1.2% |
| Navajo | 2 | 0.3% |
| Scotch-Irish | 5 | 0.7% |
| Scottish | 20 | 2.7% |
| Spaniard | 6 | 0.8% | View All 12 Rows |
Immigrants in Normangee

| Immigration Origin | # Population | % Population | View All 0 Rows |
Sex and Age in Normangee
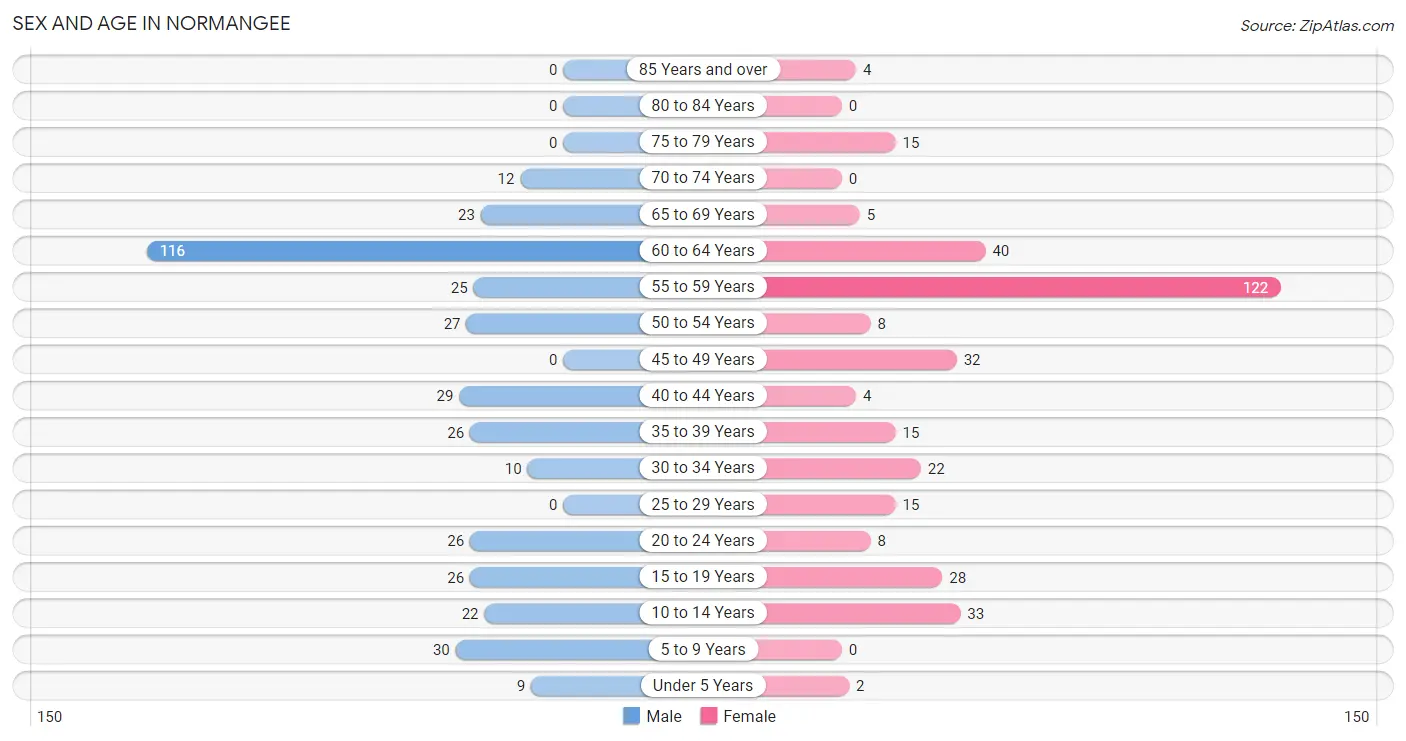
Sex and Age in Normangee
The most populous age groups in Normangee are 60 to 64 Years (116 | 30.4%) for men and 55 to 59 Years (122 | 34.6%) for women.
| Age Bracket | Male | Female |
| Under 5 Years | 9 (2.4%) | 2 (0.6%) |
| 5 to 9 Years | 30 (7.9%) | 0 (0.0%) |
| 10 to 14 Years | 22 (5.8%) | 33 (9.3%) |
| 15 to 19 Years | 26 (6.8%) | 28 (7.9%) |
| 20 to 24 Years | 26 (6.8%) | 8 (2.3%) |
| 25 to 29 Years | 0 (0.0%) | 15 (4.3%) |
| 30 to 34 Years | 10 (2.6%) | 22 (6.2%) |
| 35 to 39 Years | 26 (6.8%) | 15 (4.3%) |
| 40 to 44 Years | 29 (7.6%) | 4 (1.1%) |
| 45 to 49 Years | 0 (0.0%) | 32 (9.1%) |
| 50 to 54 Years | 27 (7.1%) | 8 (2.3%) |
| 55 to 59 Years | 25 (6.6%) | 122 (34.6%) |
| 60 to 64 Years | 116 (30.4%) | 40 (11.3%) |
| 65 to 69 Years | 23 (6.0%) | 5 (1.4%) |
| 70 to 74 Years | 12 (3.2%) | 0 (0.0%) |
| 75 to 79 Years | 0 (0.0%) | 15 (4.3%) |
| 80 to 84 Years | 0 (0.0%) | 0 (0.0%) |
| 85 Years and over | 0 (0.0%) | 4 (1.1%) |
| Total | 381 (100.0%) | 353 (100.0%) |
Families and Households in Normangee
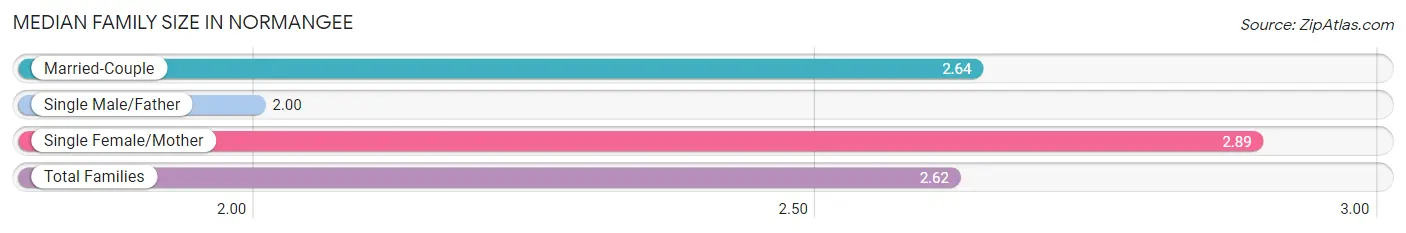
Median Family Size in Normangee
The median family size in Normangee is 2.62 persons per family, with single female/mother families (35 | 14.2%) accounting for the largest median family size of 2.89 persons per family. On the other hand, single male/father families (23 | 9.3%) represent the smallest median family size with 2.00 persons per family.
| Family Type | # Families | Family Size |
| Married-Couple | 188 (76.4%) | 2.64 |
| Single Male/Father | 23 (9.3%) | 2.00 |
| Single Female/Mother | 35 (14.2%) | 2.89 |
| Total Families | 246 (100.0%) | 2.62 |
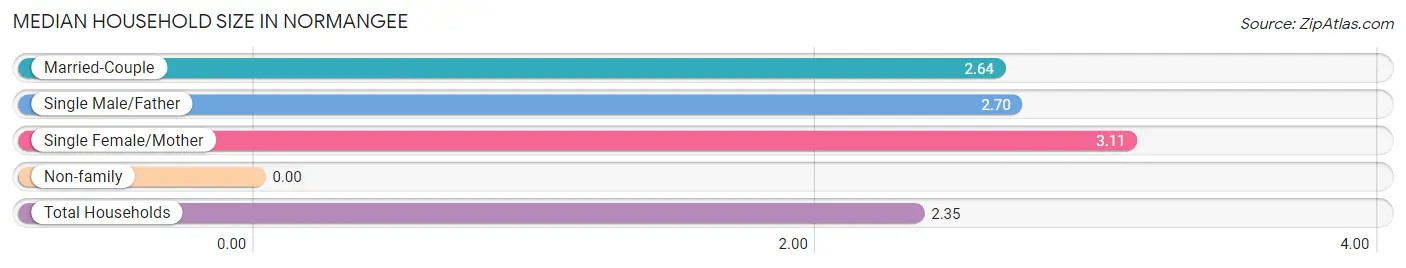
Median Household Size in Normangee
| Household Type | # Households | Household Size |
| Married-Couple | 188 (60.3%) | 2.64 |
| Single Male/Father | 23 (7.4%) | 2.70 |
| Single Female/Mother | 35 (11.2%) | 3.11 |
| Non-family | 66 (21.1%) | - |
| Total Households | 312 (100.0%) | 2.35 |
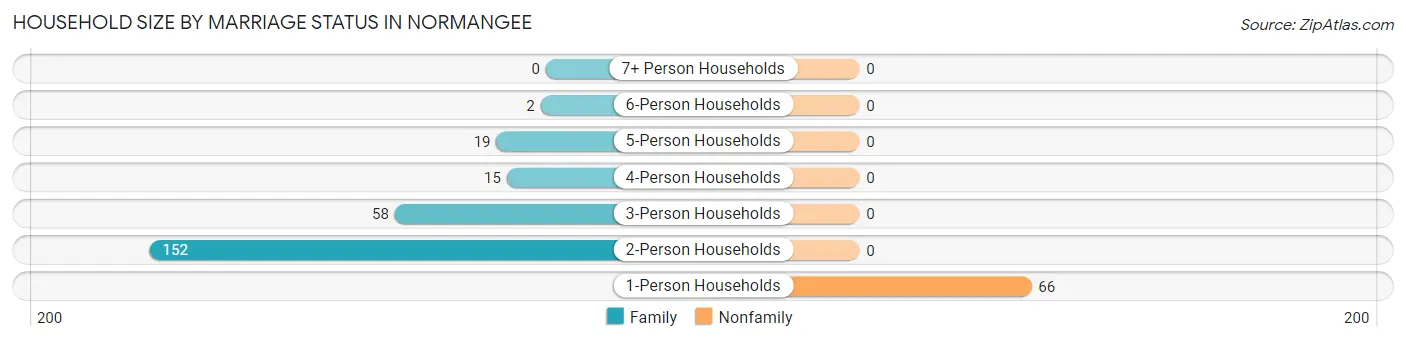
Household Size by Marriage Status in Normangee
Out of a total of 312 households in Normangee, 246 (78.8%) are family households, while 66 (21.1%) are nonfamily households. The most numerous type of family households are 2-person households, comprising 152, and the most common type of nonfamily households are 1-person households, comprising 66.
| Household Size | Family Households | Nonfamily Households |
| 1-Person Households | - | 66 (21.1%) |
| 2-Person Households | 152 (48.7%) | 0 (0.0%) |
| 3-Person Households | 58 (18.6%) | 0 (0.0%) |
| 4-Person Households | 15 (4.8%) | 0 (0.0%) |
| 5-Person Households | 19 (6.1%) | 0 (0.0%) |
| 6-Person Households | 2 (0.6%) | 0 (0.0%) |
| 7+ Person Households | 0 (0.0%) | 0 (0.0%) |
| Total | 246 (78.8%) | 66 (21.1%) |
Female Fertility in Normangee
Fertility by Age in Normangee
Average fertility rate in Normangee is 134.0 births per 1,000 women. Women in the age bracket of 35 to 50 years have the highest fertility rate with 278.0 births per 1,000 women. Women in the age bracket of 35 to 50 years acount for 88.2% of all women with births.
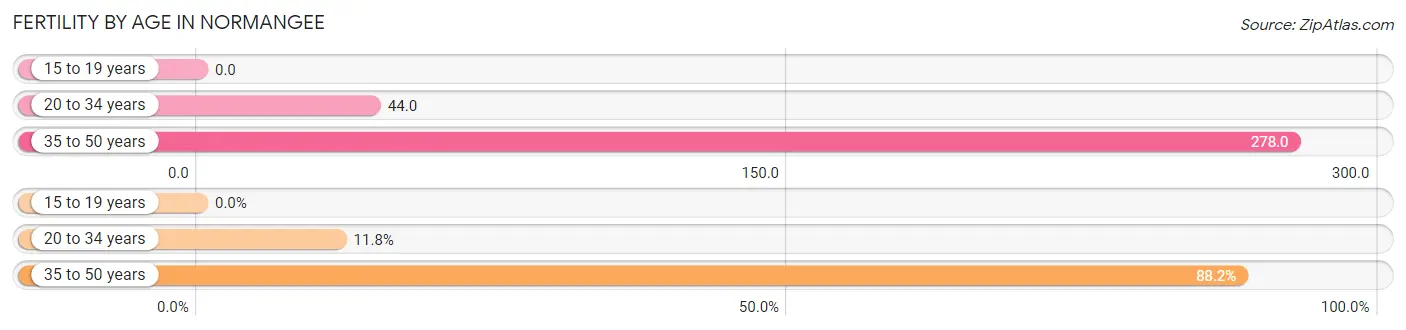
| Age Bracket | Women with Births | Births / 1,000 Women |
| 15 to 19 years | 0 (0.0%) | 0.0 |
| 20 to 34 years | 2 (11.8%) | 44.0 |
| 35 to 50 years | 15 (88.2%) | 278.0 |
| Total | 17 (100.0%) | 134.0 |
Fertility by Age by Marriage Status in Normangee
82.4% of women with births (17) in Normangee are married. The highest percentage of unmarried women with births falls into 35 to 50 years age bracket with 20.0% of them unmarried at the time of birth, while the lowest percentage of unmarried women with births belong to 20 to 34 years age bracket with 0.0% of them unmarried.
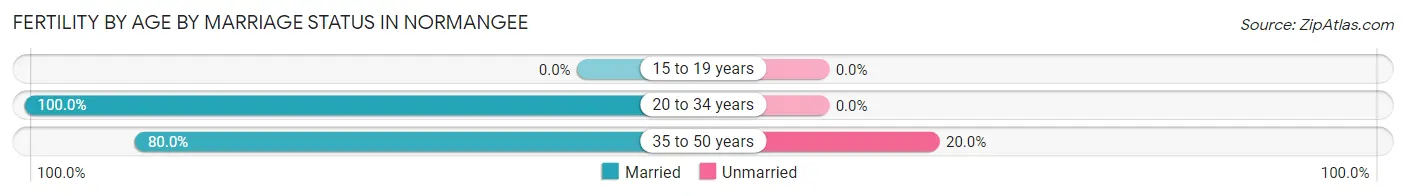
| Age Bracket | Married | Unmarried |
| 15 to 19 years | 0 (0.0%) | 0 (0.0%) |
| 20 to 34 years | 2 (100.0%) | 0 (0.0%) |
| 35 to 50 years | 12 (80.0%) | 3 (20.0%) |
| Total | 14 (82.4%) | 3 (17.6%) |
Fertility by Education in Normangee
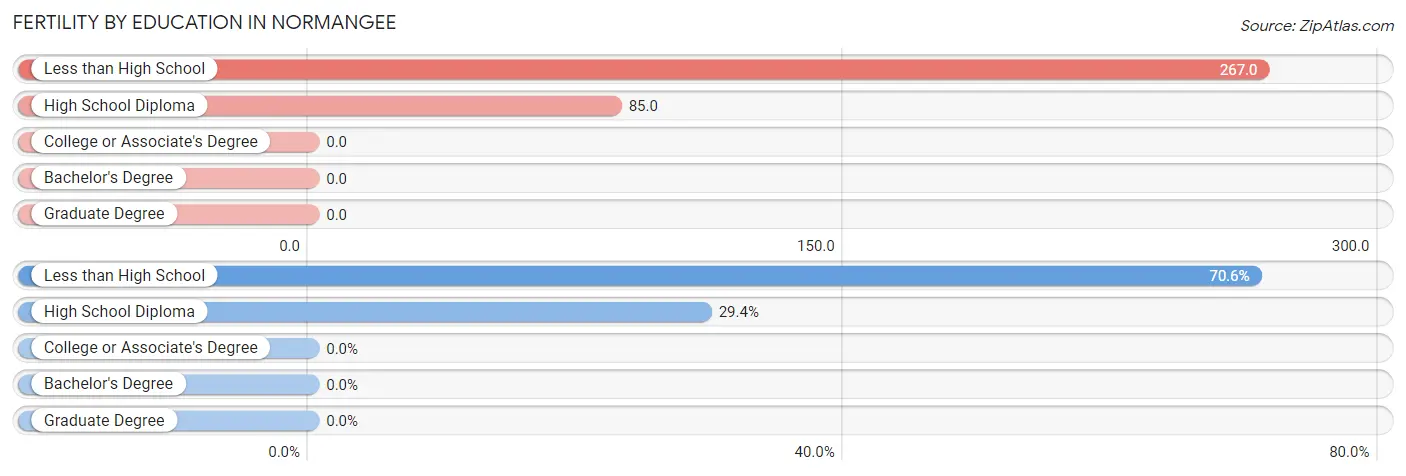
| Educational Attainment | Women with Births | Births / 1,000 Women |
| Less than High School | 12 (70.6%) | 267.0 |
| High School Diploma | 5 (29.4%) | 85.0 |
| College or Associate's Degree | 0 (0.0%) | 0.0 |
| Bachelor's Degree | 0 (0.0%) | 0.0 |
| Graduate Degree | 0 (0.0%) | 0.0 |
| Total | 17 (100.0%) | 134.0 |
Fertility by Education by Marriage Status in Normangee
17.6% of women with births in Normangee are unmarried. Women with the educational attainment of less than high school are most likely to be married with 100.0% of them married at childbirth, while women with the educational attainment of high school diploma are least likely to be married with 60.0% of them unmarried at childbirth.
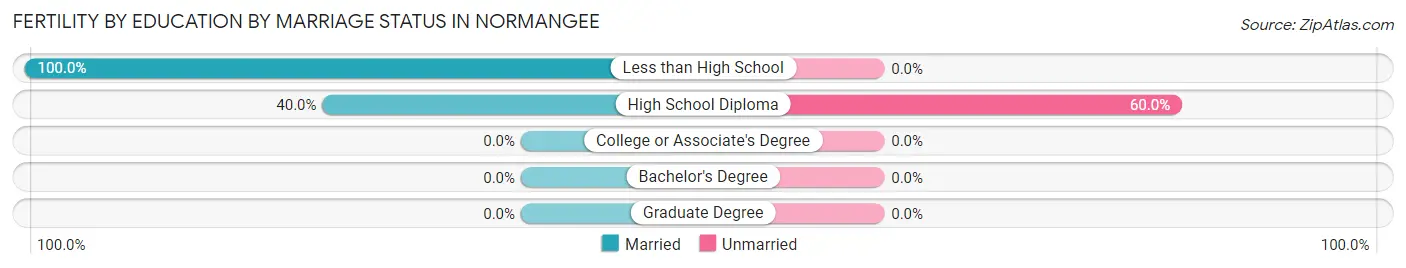
| Educational Attainment | Married | Unmarried |
| Less than High School | 12 (100.0%) | 0 (0.0%) |
| High School Diploma | 2 (40.0%) | 3 (60.0%) |
| College or Associate's Degree | 0 (0.0%) | 0 (0.0%) |
| Bachelor's Degree | 0 (0.0%) | 0 (0.0%) |
| Graduate Degree | 0 (0.0%) | 0 (0.0%) |
| Total | 14 (82.4%) | 3 (17.6%) |
Employment Characteristics in Normangee
Employment by Class of Employer in Normangee
Among the 316 employed individuals in Normangee, private company employees (114 | 36.1%), self-employed (not incorporated) (89 | 28.2%), and local government employees (50 | 15.8%) make up the most common classes of employment.
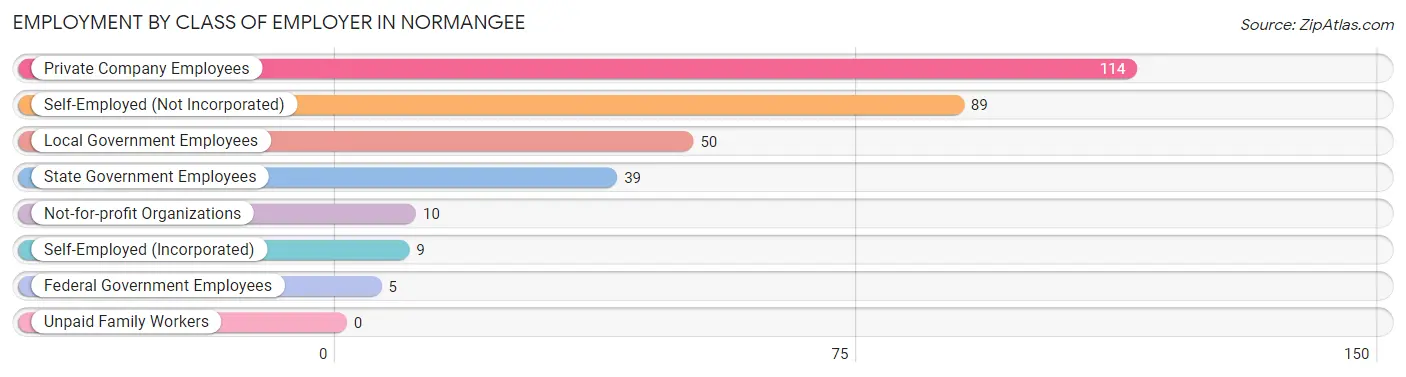
| Employer Class | # Employees | % Employees |
| Private Company Employees | 114 | 36.1% |
| Self-Employed (Incorporated) | 9 | 2.9% |
| Self-Employed (Not Incorporated) | 89 | 28.2% |
| Not-for-profit Organizations | 10 | 3.2% |
| Local Government Employees | 50 | 15.8% |
| State Government Employees | 39 | 12.3% |
| Federal Government Employees | 5 | 1.6% |
| Unpaid Family Workers | 0 | 0.0% |
| Total | 316 | 100.0% |
Employment Status by Age in Normangee
According to the labor force statistics for Normangee, out of the total population over 16 years of age (610), 59.0% or 360 individuals are in the labor force, with 6.9% or 25 of them unemployed. The age group with the highest labor force participation rate is 20 to 24 years, with 100.0% or 34 individuals in the labor force. Within the labor force, the 25 to 29 years age range has the highest percentage of unemployed individuals, with 80.0% or 12 of them being unemployed.
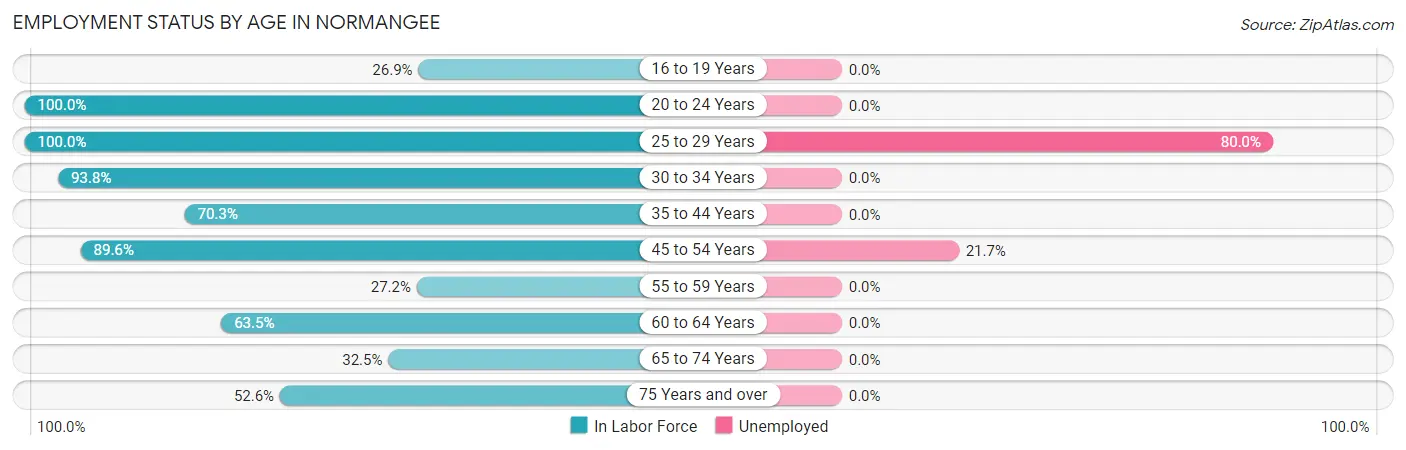
| Age Bracket | In Labor Force | Unemployed |
| 16 to 19 Years | 7 (26.9%) | 0 (0.0%) |
| 20 to 24 Years | 34 (100.0%) | 0 (0.0%) |
| 25 to 29 Years | 15 (100.0%) | 12 (80.0%) |
| 30 to 34 Years | 30 (93.8%) | 0 (0.0%) |
| 35 to 44 Years | 52 (70.3%) | 0 (0.0%) |
| 45 to 54 Years | 60 (89.6%) | 13 (21.7%) |
| 55 to 59 Years | 40 (27.2%) | 0 (0.0%) |
| 60 to 64 Years | 99 (63.5%) | 0 (0.0%) |
| 65 to 74 Years | 13 (32.5%) | 0 (0.0%) |
| 75 Years and over | 10 (52.6%) | 0 (0.0%) |
| Total | 360 (59.0%) | 25 (6.9%) |
Employment Status by Educational Attainment in Normangee
According to labor force statistics for Normangee, 60.3% of individuals (296) out of the total population between 25 and 64 years of age (491) are in the labor force, with 8.4% or 25 of them being unemployed. The group with the highest labor force participation rate are those with the educational attainment of bachelor's degree or higher, with 74.1% or 40 individuals in the labor force. Within the labor force, individuals with college / associate degree education have the highest percentage of unemployment, with 40.0% or 12 of them being unemployed.
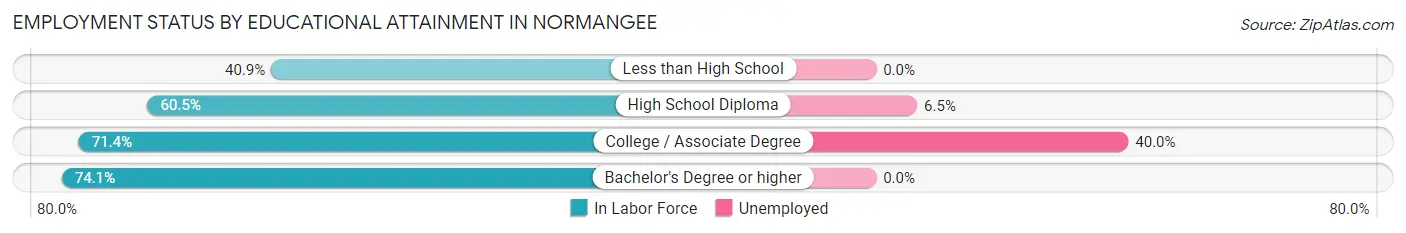
| Educational Attainment | In Labor Force | Unemployed |
| Less than High School | 27 (40.9%) | 0 (0.0%) |
| High School Diploma | 199 (60.5%) | 21 (6.5%) |
| College / Associate Degree | 30 (71.4%) | 17 (40.0%) |
| Bachelor's Degree or higher | 40 (74.1%) | 0 (0.0%) |
| Total | 296 (60.3%) | 41 (8.4%) |
Employment Occupations by Sex in Normangee
Management, Business, Science and Arts Occupations
The most common Management, Business, Science and Arts occupations in Normangee are Management (96 | 28.7%), Community & Social Service (13 | 3.9%), Education, Arts & Media (9 | 2.7%), Business & Financial (7 | 2.1%), and Arts, Media & Entertainment (4 | 1.2%).
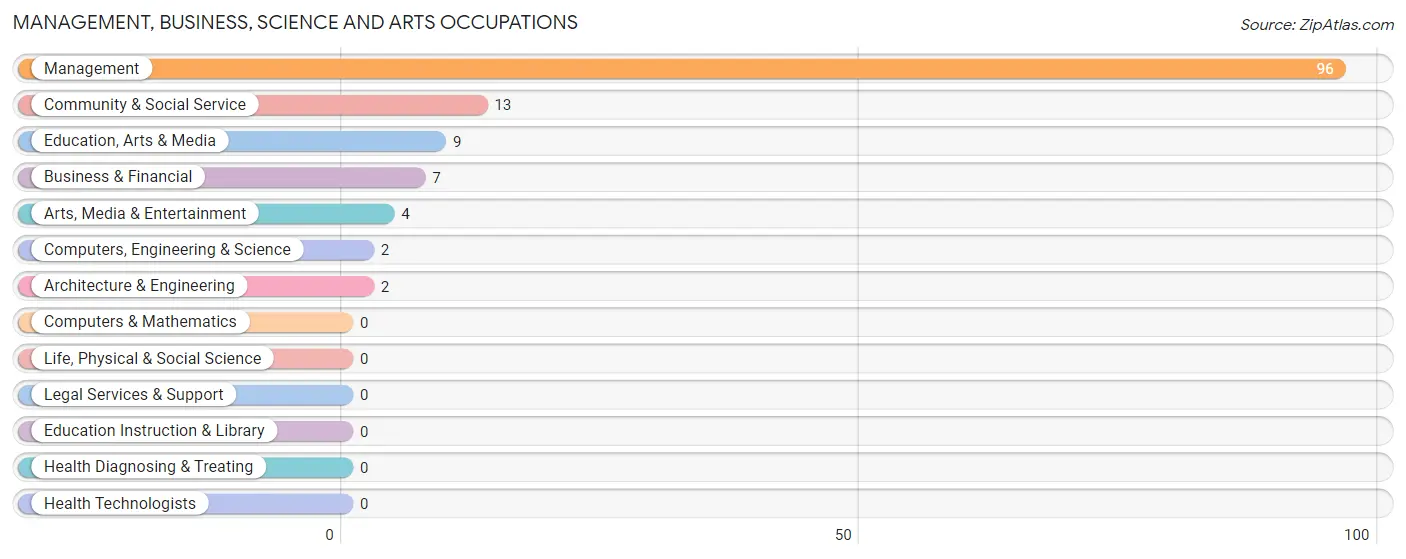
Management, Business, Science and Arts Occupations by Sex
Within the Management, Business, Science and Arts occupations in Normangee, the most male-oriented occupations are Management (100.0%), Education, Arts & Media (55.6%), and Community & Social Service (38.5%), while the most female-oriented occupations are Computers, Engineering & Science (100.0%), Architecture & Engineering (100.0%), and Arts, Media & Entertainment (100.0%).
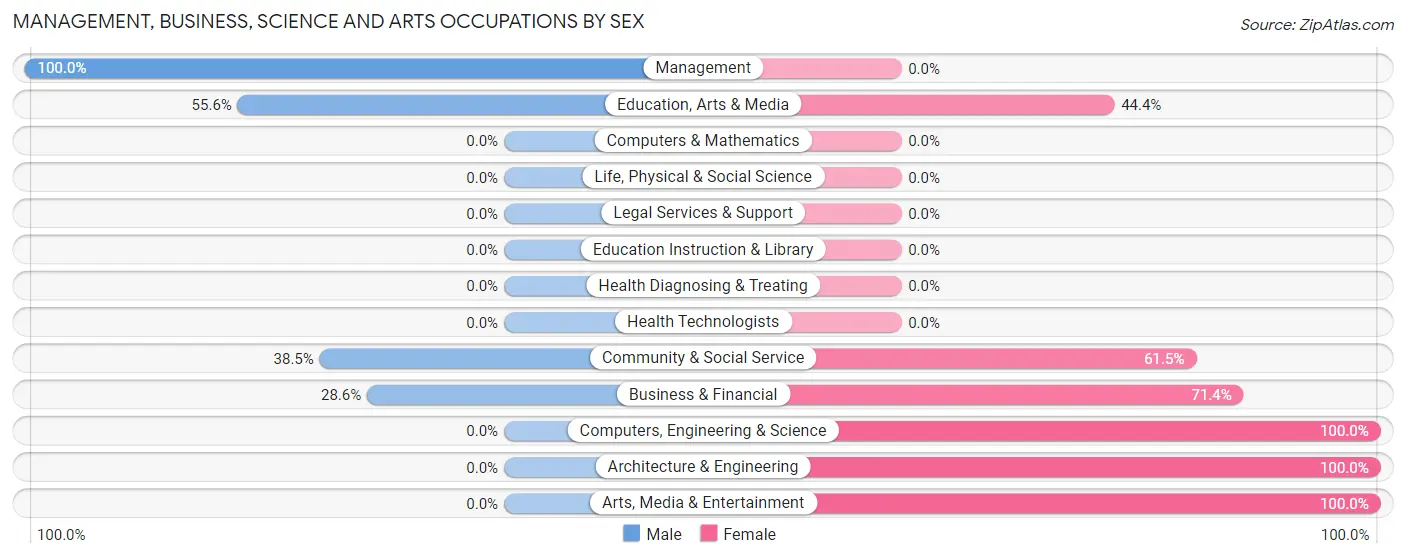
| Occupation | Male | Female |
| Management | 96 (100.0%) | 0 (0.0%) |
| Business & Financial | 2 (28.6%) | 5 (71.4%) |
| Computers, Engineering & Science | 0 (0.0%) | 2 (100.0%) |
| Computers & Mathematics | 0 (0.0%) | 0 (0.0%) |
| Architecture & Engineering | 0 (0.0%) | 2 (100.0%) |
| Life, Physical & Social Science | 0 (0.0%) | 0 (0.0%) |
| Community & Social Service | 5 (38.5%) | 8 (61.5%) |
| Education, Arts & Media | 5 (55.6%) | 4 (44.4%) |
| Legal Services & Support | 0 (0.0%) | 0 (0.0%) |
| Education Instruction & Library | 0 (0.0%) | 0 (0.0%) |
| Arts, Media & Entertainment | 0 (0.0%) | 4 (100.0%) |
| Health Diagnosing & Treating | 0 (0.0%) | 0 (0.0%) |
| Health Technologists | 0 (0.0%) | 0 (0.0%) |
| Total (Category) | 103 (87.3%) | 15 (12.7%) |
| Total (Overall) | 231 (69.0%) | 104 (31.0%) |
Services Occupations
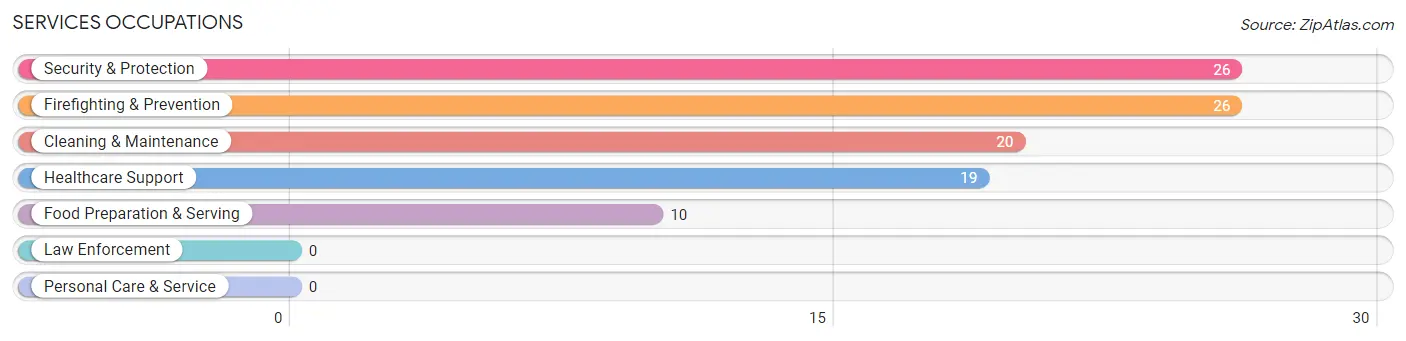
The most common Services occupations in Normangee are Security & Protection (26 | 7.8%), Firefighting & Prevention (26 | 7.8%), Cleaning & Maintenance (20 | 6.0%), Healthcare Support (19 | 5.7%), and Food Preparation & Serving (10 | 3.0%).
Services Occupations by Sex
Within the Services occupations in Normangee, the most male-oriented occupations are Security & Protection (100.0%), Firefighting & Prevention (100.0%), and Cleaning & Maintenance (40.0%), while the most female-oriented occupations are Healthcare Support (100.0%), Food Preparation & Serving (100.0%), and Cleaning & Maintenance (60.0%).
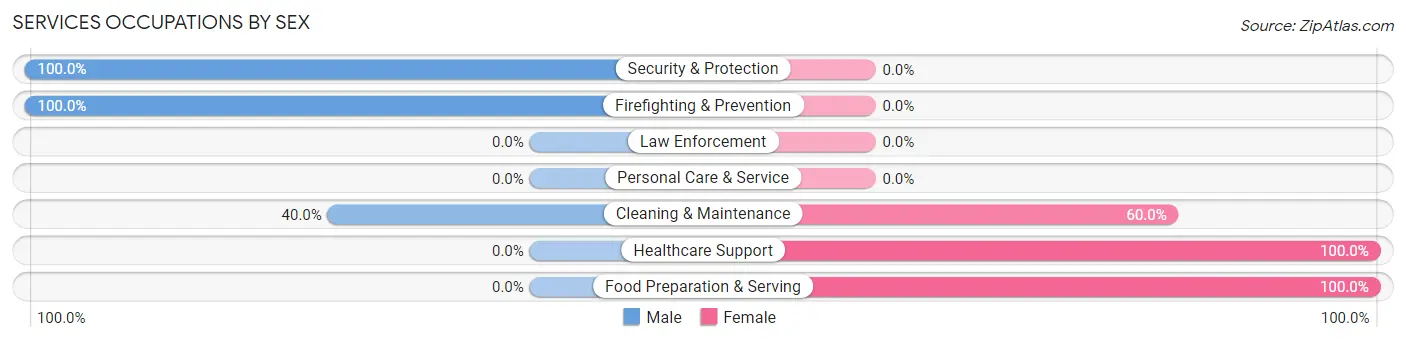
| Occupation | Male | Female |
| Healthcare Support | 0 (0.0%) | 19 (100.0%) |
| Security & Protection | 26 (100.0%) | 0 (0.0%) |
| Firefighting & Prevention | 26 (100.0%) | 0 (0.0%) |
| Law Enforcement | 0 (0.0%) | 0 (0.0%) |
| Food Preparation & Serving | 0 (0.0%) | 10 (100.0%) |
| Cleaning & Maintenance | 8 (40.0%) | 12 (60.0%) |
| Personal Care & Service | 0 (0.0%) | 0 (0.0%) |
| Total (Category) | 34 (45.3%) | 41 (54.7%) |
| Total (Overall) | 231 (69.0%) | 104 (31.0%) |
Sales and Office Occupations
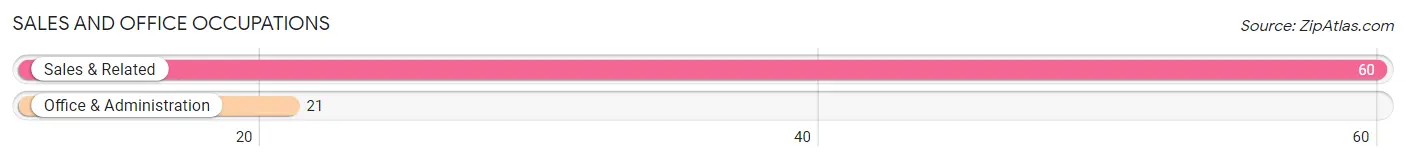
The most common Sales and Office occupations in Normangee are Sales & Related (60 | 17.9%), and Office & Administration (21 | 6.3%).
Sales and Office Occupations by Sex
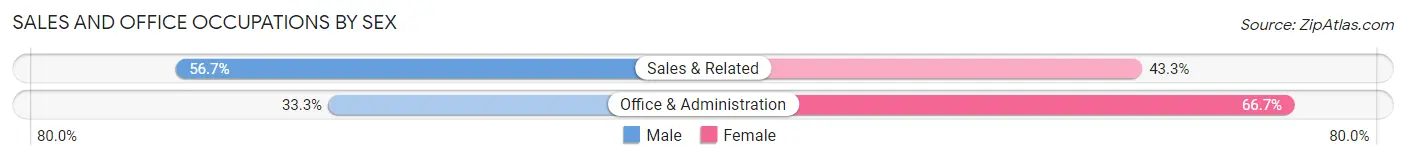
| Occupation | Male | Female |
| Sales & Related | 34 (56.7%) | 26 (43.3%) |
| Office & Administration | 7 (33.3%) | 14 (66.7%) |
| Total (Category) | 41 (50.6%) | 40 (49.4%) |
| Total (Overall) | 231 (69.0%) | 104 (31.0%) |
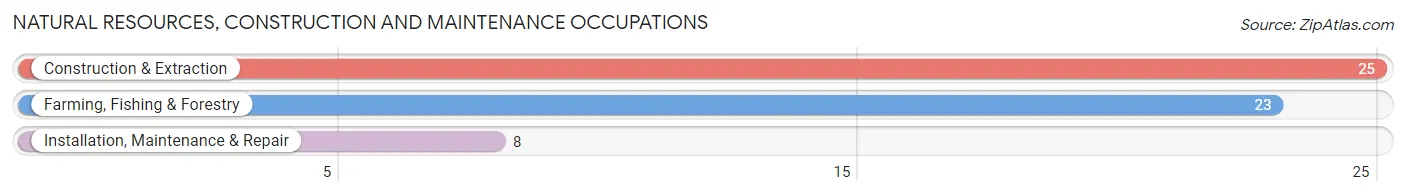
Natural Resources, Construction and Maintenance Occupations
The most common Natural Resources, Construction and Maintenance occupations in Normangee are Construction & Extraction (25 | 7.5%), Farming, Fishing & Forestry (23 | 6.9%), and Installation, Maintenance & Repair (8 | 2.4%).
Natural Resources, Construction and Maintenance Occupations by Sex
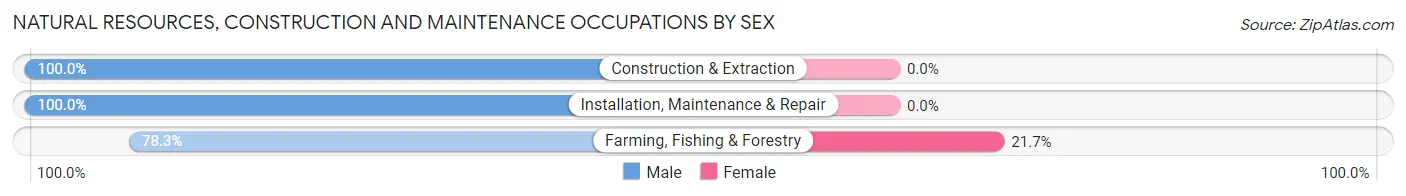
| Occupation | Male | Female |
| Farming, Fishing & Forestry | 18 (78.3%) | 5 (21.7%) |
| Construction & Extraction | 25 (100.0%) | 0 (0.0%) |
| Installation, Maintenance & Repair | 8 (100.0%) | 0 (0.0%) |
| Total (Category) | 51 (91.1%) | 5 (8.9%) |
| Total (Overall) | 231 (69.0%) | 104 (31.0%) |
Production, Transportation and Moving Occupations
The most common Production, Transportation and Moving occupations in Normangee are , and Transportation (5 | 1.5%).
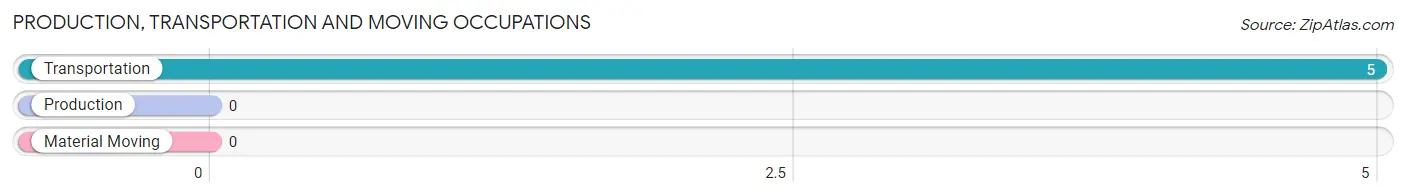
Production, Transportation and Moving Occupations by Sex
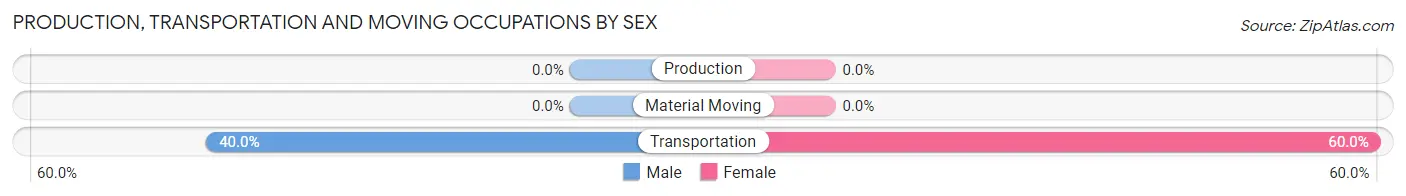
| Occupation | Male | Female |
| Production | 0 (0.0%) | 0 (0.0%) |
| Transportation | 2 (40.0%) | 3 (60.0%) |
| Material Moving | 0 (0.0%) | 0 (0.0%) |
| Total (Category) | 2 (40.0%) | 3 (60.0%) |
| Total (Overall) | 231 (69.0%) | 104 (31.0%) |
Employment Industries by Sex in Normangee
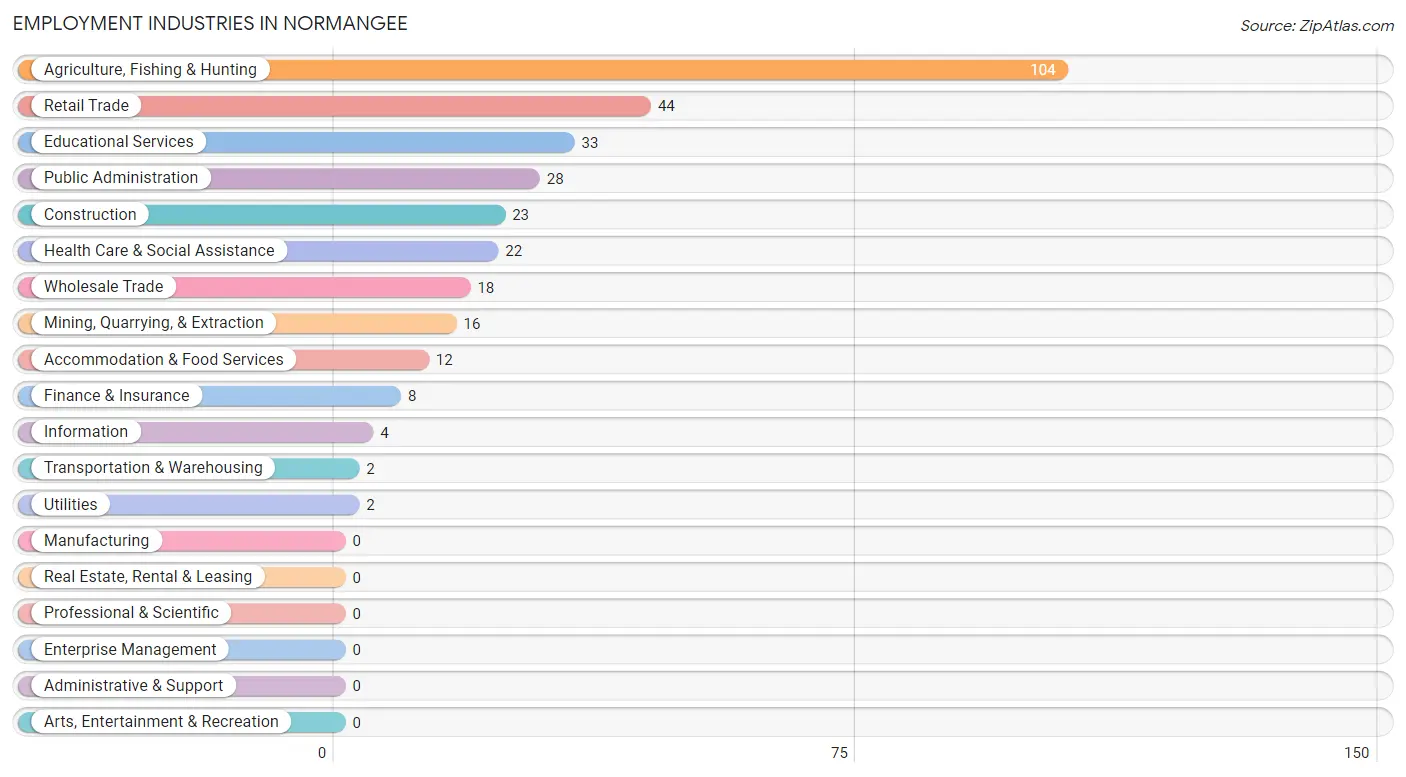
Employment Industries in Normangee
The major employment industries in Normangee include Agriculture, Fishing & Hunting (104 | 31.0%), Retail Trade (44 | 13.1%), Educational Services (33 | 9.9%), Public Administration (28 | 8.4%), and Construction (23 | 6.9%).
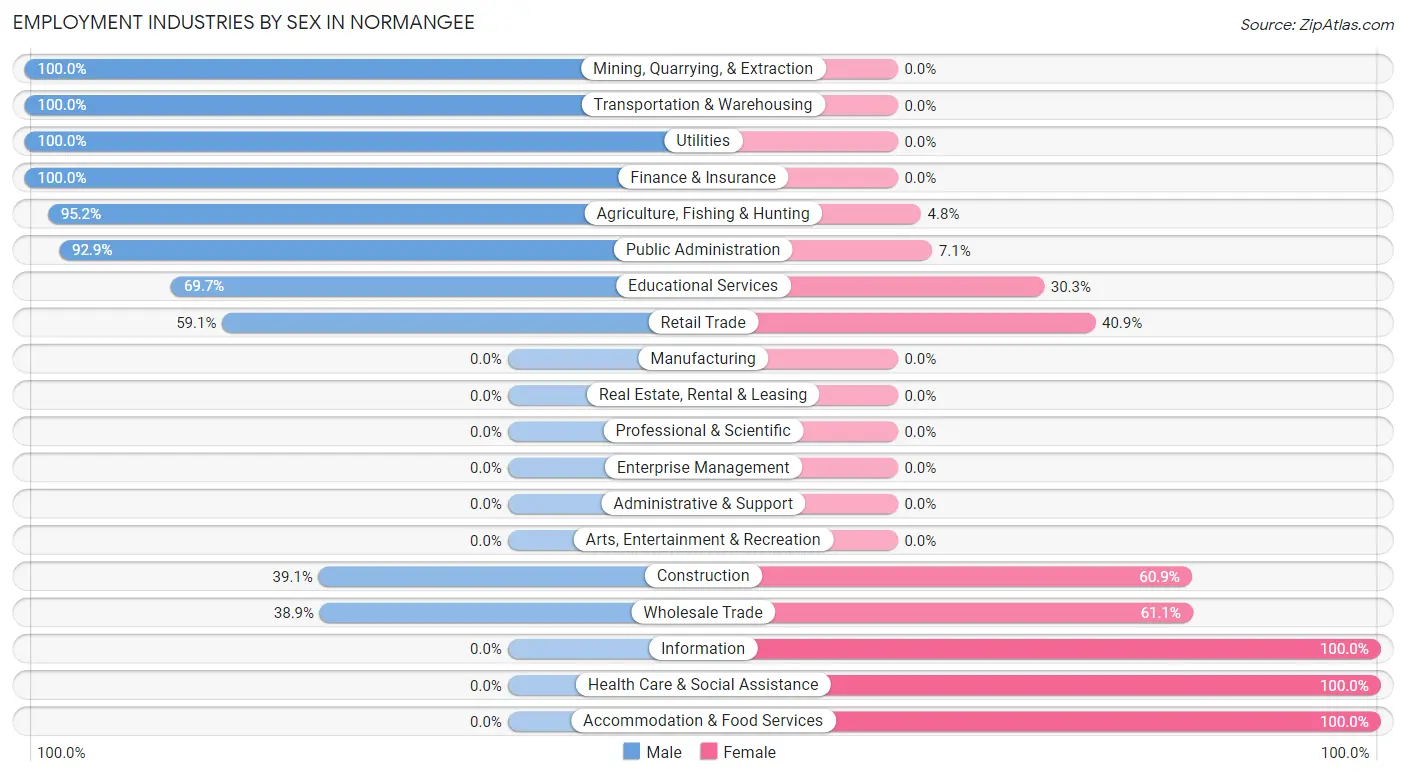
Employment Industries by Sex in Normangee
The Normangee industries that see more men than women are Mining, Quarrying, & Extraction (100.0%), Transportation & Warehousing (100.0%), and Utilities (100.0%), whereas the industries that tend to have a higher number of women are Information (100.0%), Health Care & Social Assistance (100.0%), and Accommodation & Food Services (100.0%).
| Industry | Male | Female |
| Agriculture, Fishing & Hunting | 99 (95.2%) | 5 (4.8%) |
| Mining, Quarrying, & Extraction | 16 (100.0%) | 0 (0.0%) |
| Construction | 9 (39.1%) | 14 (60.9%) |
| Manufacturing | 0 (0.0%) | 0 (0.0%) |
| Wholesale Trade | 7 (38.9%) | 11 (61.1%) |
| Retail Trade | 26 (59.1%) | 18 (40.9%) |
| Transportation & Warehousing | 2 (100.0%) | 0 (0.0%) |
| Utilities | 2 (100.0%) | 0 (0.0%) |
| Information | 0 (0.0%) | 4 (100.0%) |
| Finance & Insurance | 8 (100.0%) | 0 (0.0%) |
| Real Estate, Rental & Leasing | 0 (0.0%) | 0 (0.0%) |
| Professional & Scientific | 0 (0.0%) | 0 (0.0%) |
| Enterprise Management | 0 (0.0%) | 0 (0.0%) |
| Administrative & Support | 0 (0.0%) | 0 (0.0%) |
| Educational Services | 23 (69.7%) | 10 (30.3%) |
| Health Care & Social Assistance | 0 (0.0%) | 22 (100.0%) |
| Arts, Entertainment & Recreation | 0 (0.0%) | 0 (0.0%) |
| Accommodation & Food Services | 0 (0.0%) | 12 (100.0%) |
| Public Administration | 26 (92.9%) | 2 (7.1%) |
| Total | 231 (69.0%) | 104 (31.0%) |
Education in Normangee
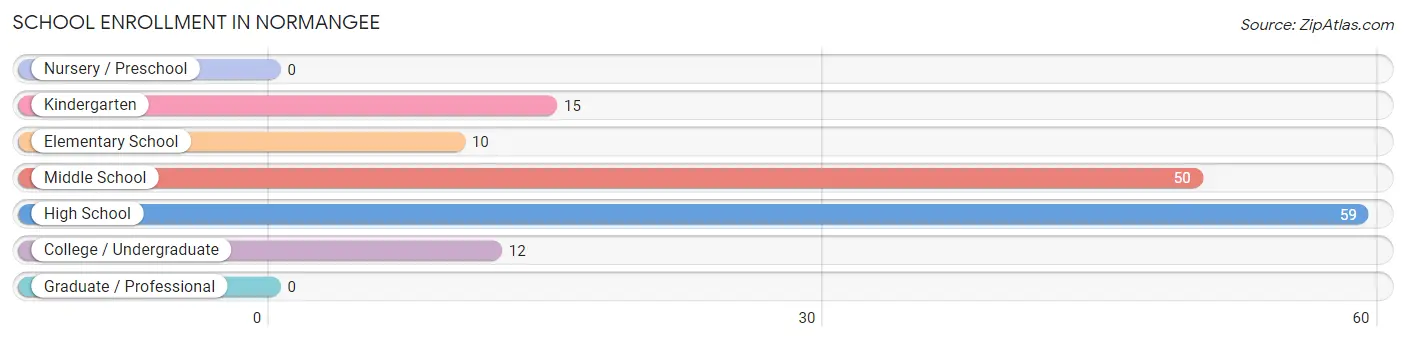
School Enrollment in Normangee
The most common levels of schooling among the 146 students in Normangee are high school (59 | 40.4%), middle school (50 | 34.3%), and kindergarten (15 | 10.3%).
| School Level | # Students | % Students |
| Nursery / Preschool | 0 | 0.0% |
| Kindergarten | 15 | 10.3% |
| Elementary School | 10 | 6.9% |
| Middle School | 50 | 34.3% |
| High School | 59 | 40.4% |
| College / Undergraduate | 12 | 8.2% |
| Graduate / Professional | 0 | 0.0% |
| Total | 146 | 100.0% |
School Enrollment by Age by Funding Source in Normangee
Out of a total of 146 students who are enrolled in schools in Normangee, 27 (18.5%) attend a private institution, while the remaining 119 (81.5%) are enrolled in public schools. The age group of 15 to 17 year olds has the highest likelihood of being enrolled in private schools, with 15 (42.9% in the age bracket) enrolled. Conversely, the age group of 5 to 9 year old has the lowest likelihood of being enrolled in a private school, with 25 (100.0% in the age bracket) attending a public institution.
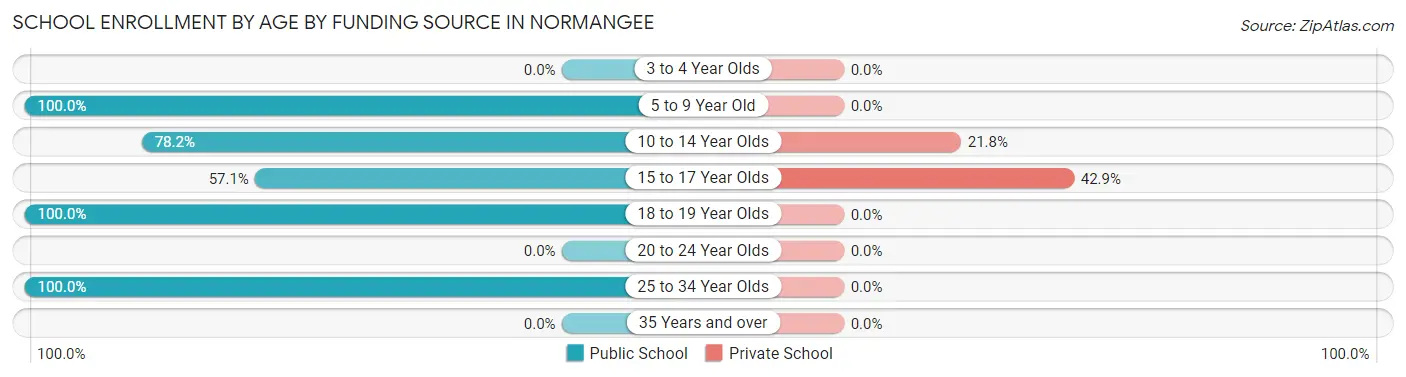
| Age Bracket | Public School | Private School |
| 3 to 4 Year Olds | 0 (0.0%) | 0 (0.0%) |
| 5 to 9 Year Old | 25 (100.0%) | 0 (0.0%) |
| 10 to 14 Year Olds | 43 (78.2%) | 12 (21.8%) |
| 15 to 17 Year Olds | 20 (57.1%) | 15 (42.9%) |
| 18 to 19 Year Olds | 19 (100.0%) | 0 (0.0%) |
| 20 to 24 Year Olds | 0 (0.0%) | 0 (0.0%) |
| 25 to 34 Year Olds | 12 (100.0%) | 0 (0.0%) |
| 35 Years and over | 0 (0.0%) | 0 (0.0%) |
| Total | 119 (81.5%) | 27 (18.5%) |
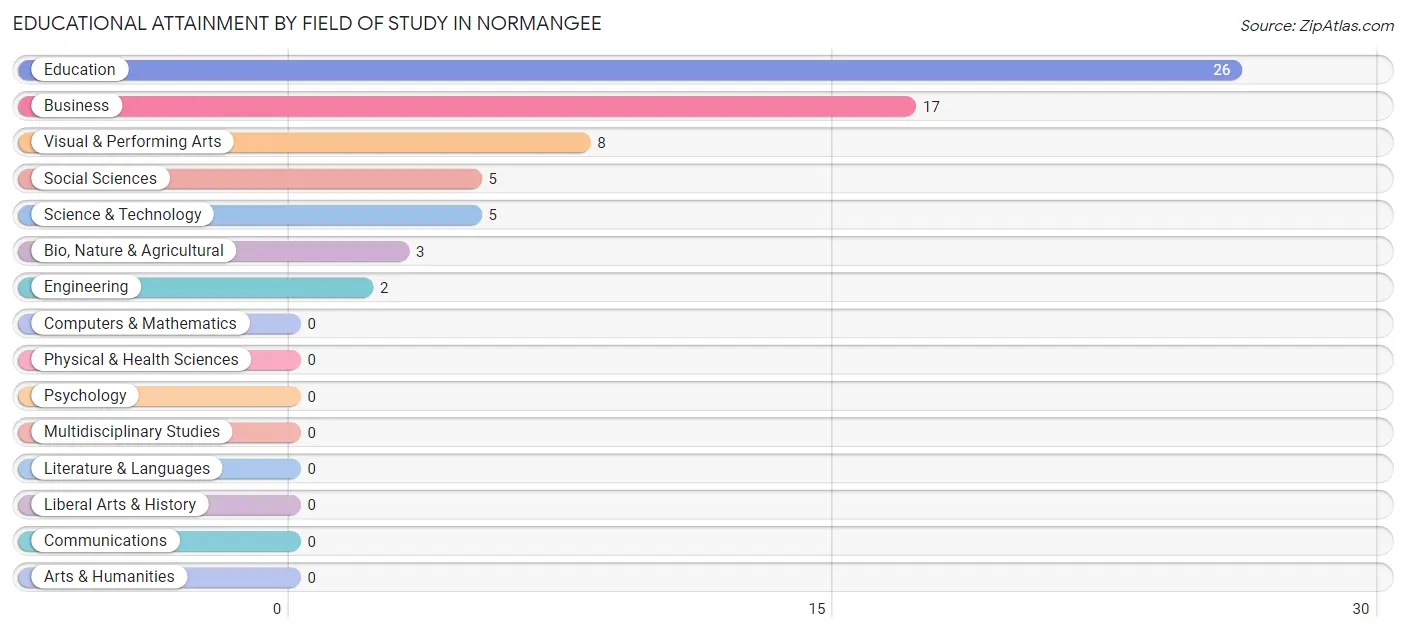
Educational Attainment by Field of Study in Normangee
Education (26 | 39.4%), business (17 | 25.8%), visual & performing arts (8 | 12.1%), social sciences (5 | 7.6%), and science & technology (5 | 7.6%) are the most common fields of study among 66 individuals in Normangee who have obtained a bachelor's degree or higher.
| Field of Study | # Graduates | % Graduates |
| Computers & Mathematics | 0 | 0.0% |
| Bio, Nature & Agricultural | 3 | 4.5% |
| Physical & Health Sciences | 0 | 0.0% |
| Psychology | 0 | 0.0% |
| Social Sciences | 5 | 7.6% |
| Engineering | 2 | 3.0% |
| Multidisciplinary Studies | 0 | 0.0% |
| Science & Technology | 5 | 7.6% |
| Business | 17 | 25.8% |
| Education | 26 | 39.4% |
| Literature & Languages | 0 | 0.0% |
| Liberal Arts & History | 0 | 0.0% |
| Visual & Performing Arts | 8 | 12.1% |
| Communications | 0 | 0.0% |
| Arts & Humanities | 0 | 0.0% |
| Total | 66 | 100.0% |
Transportation & Commute in Normangee
Vehicle Availability by Sex in Normangee
The most prevalent vehicle ownership categories in Normangee are males with 2 vehicles (111, accounting for 50.4%) and females with 2 vehicles (20, making up 115.6%).
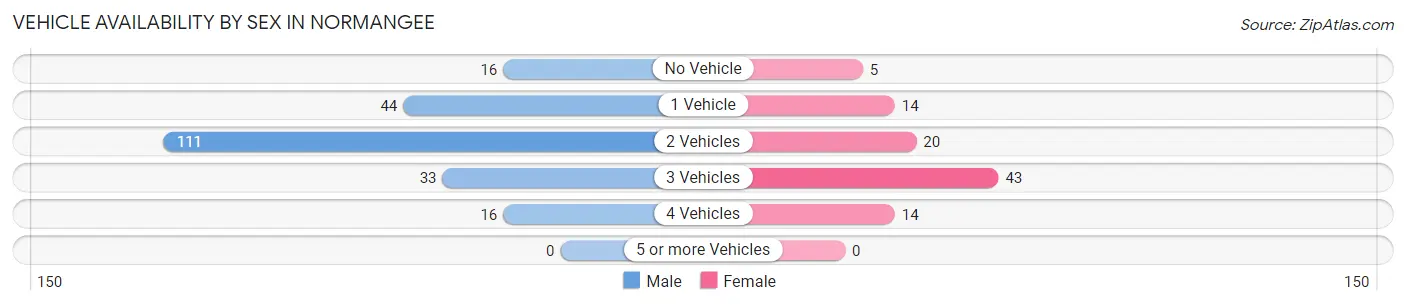
| Vehicles Available | Male | Female |
| No Vehicle | 16 (7.3%) | 5 (5.2%) |
| 1 Vehicle | 44 (20.0%) | 14 (14.6%) |
| 2 Vehicles | 111 (50.4%) | 20 (20.8%) |
| 3 Vehicles | 33 (15.0%) | 43 (44.8%) |
| 4 Vehicles | 16 (7.3%) | 14 (14.6%) |
| 5 or more Vehicles | 0 (0.0%) | 0 (0.0%) |
| Total | 220 (100.0%) | 96 (100.0%) |
Commute Time in Normangee
The most frequently occuring commute durations in Normangee are 10 to 14 minutes (81 commuters, 26.3%), less than 5 minutes (46 commuters, 14.9%), and 45 to 59 minutes (40 commuters, 13.0%).
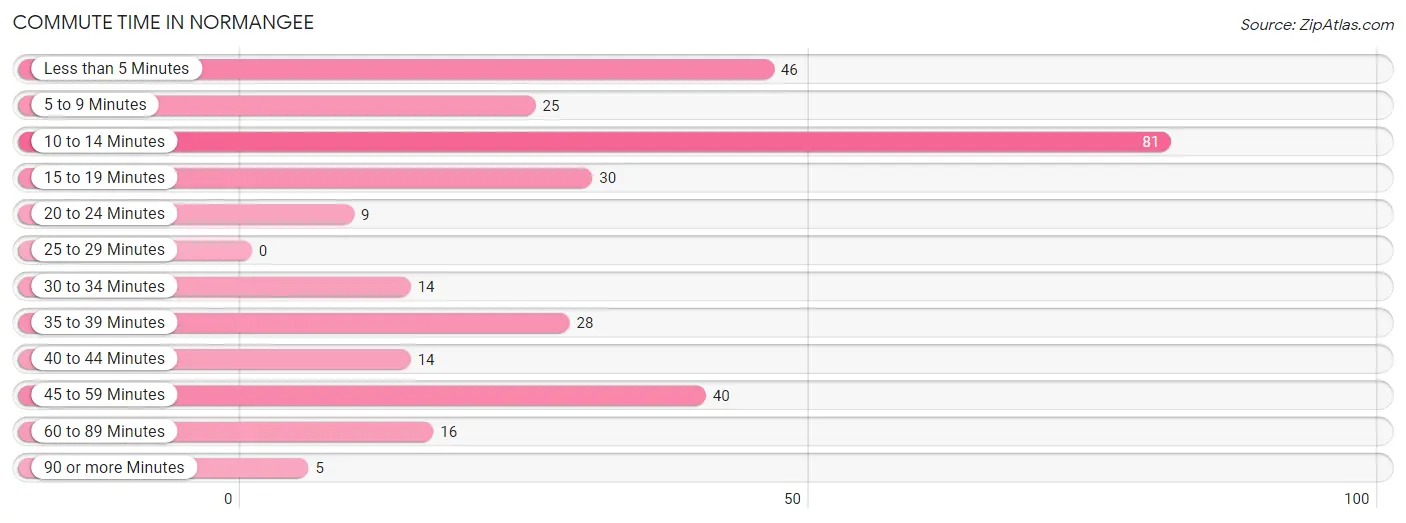
| Commute Time | # Commuters | % Commuters |
| Less than 5 Minutes | 46 | 14.9% |
| 5 to 9 Minutes | 25 | 8.1% |
| 10 to 14 Minutes | 81 | 26.3% |
| 15 to 19 Minutes | 30 | 9.7% |
| 20 to 24 Minutes | 9 | 2.9% |
| 25 to 29 Minutes | 0 | 0.0% |
| 30 to 34 Minutes | 14 | 4.5% |
| 35 to 39 Minutes | 28 | 9.1% |
| 40 to 44 Minutes | 14 | 4.5% |
| 45 to 59 Minutes | 40 | 13.0% |
| 60 to 89 Minutes | 16 | 5.2% |
| 90 or more Minutes | 5 | 1.6% |
Commute Time by Sex in Normangee
The most common commute times in Normangee are 10 to 14 minutes (81 commuters, 36.8%) for males and less than 5 minutes (22 commuters, 25.0%) for females.
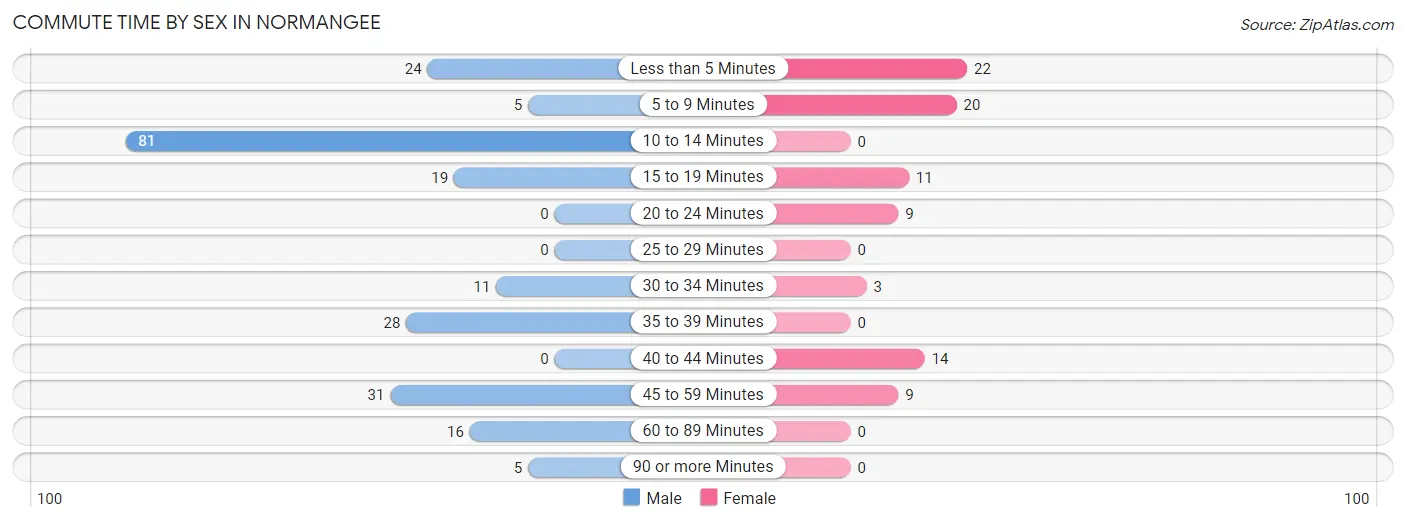
| Commute Time | Male | Female |
| Less than 5 Minutes | 24 (10.9%) | 22 (25.0%) |
| 5 to 9 Minutes | 5 (2.3%) | 20 (22.7%) |
| 10 to 14 Minutes | 81 (36.8%) | 0 (0.0%) |
| 15 to 19 Minutes | 19 (8.6%) | 11 (12.5%) |
| 20 to 24 Minutes | 0 (0.0%) | 9 (10.2%) |
| 25 to 29 Minutes | 0 (0.0%) | 0 (0.0%) |
| 30 to 34 Minutes | 11 (5.0%) | 3 (3.4%) |
| 35 to 39 Minutes | 28 (12.7%) | 0 (0.0%) |
| 40 to 44 Minutes | 0 (0.0%) | 14 (15.9%) |
| 45 to 59 Minutes | 31 (14.1%) | 9 (10.2%) |
| 60 to 89 Minutes | 16 (7.3%) | 0 (0.0%) |
| 90 or more Minutes | 5 (2.3%) | 0 (0.0%) |
Time of Departure to Work by Sex in Normangee
The most frequent times of departure to work in Normangee are 7:30 AM to 7:59 AM (81, 36.8%) for males and 4:00 PM to 11:59 PM (22, 25.0%) for females.
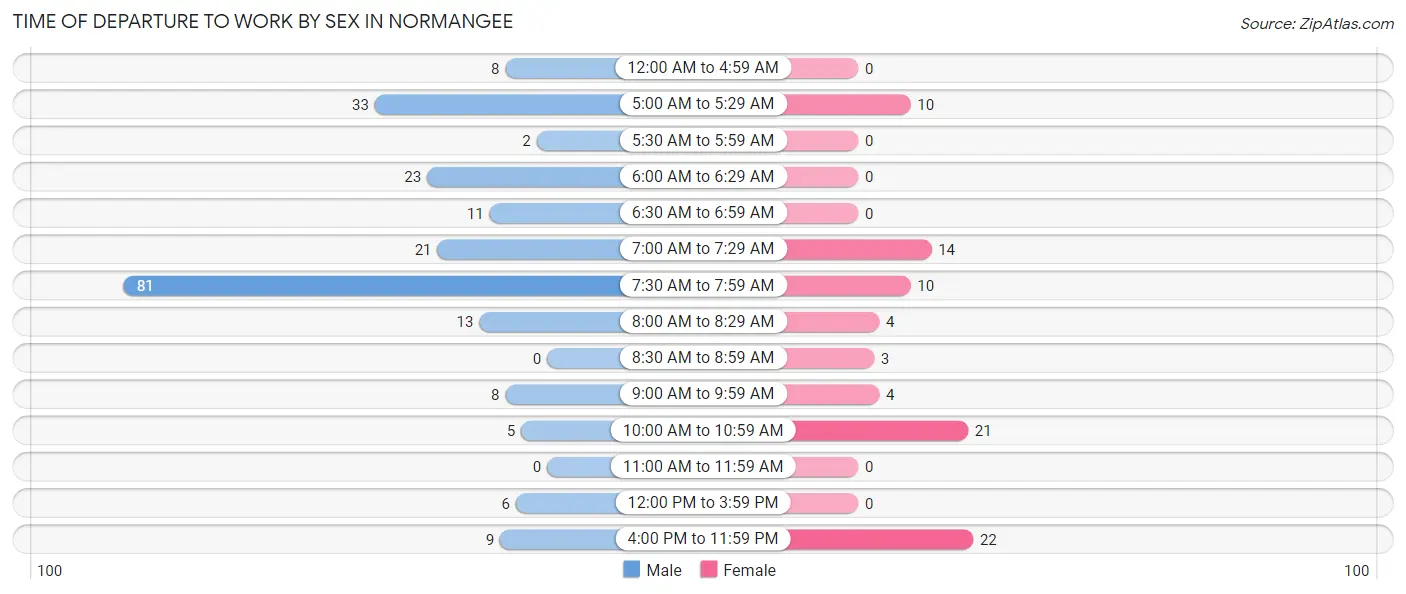
| Time of Departure | Male | Female |
| 12:00 AM to 4:59 AM | 8 (3.6%) | 0 (0.0%) |
| 5:00 AM to 5:29 AM | 33 (15.0%) | 10 (11.4%) |
| 5:30 AM to 5:59 AM | 2 (0.9%) | 0 (0.0%) |
| 6:00 AM to 6:29 AM | 23 (10.4%) | 0 (0.0%) |
| 6:30 AM to 6:59 AM | 11 (5.0%) | 0 (0.0%) |
| 7:00 AM to 7:29 AM | 21 (9.6%) | 14 (15.9%) |
| 7:30 AM to 7:59 AM | 81 (36.8%) | 10 (11.4%) |
| 8:00 AM to 8:29 AM | 13 (5.9%) | 4 (4.5%) |
| 8:30 AM to 8:59 AM | 0 (0.0%) | 3 (3.4%) |
| 9:00 AM to 9:59 AM | 8 (3.6%) | 4 (4.5%) |
| 10:00 AM to 10:59 AM | 5 (2.3%) | 21 (23.9%) |
| 11:00 AM to 11:59 AM | 0 (0.0%) | 0 (0.0%) |
| 12:00 PM to 3:59 PM | 6 (2.7%) | 0 (0.0%) |
| 4:00 PM to 11:59 PM | 9 (4.1%) | 22 (25.0%) |
| Total | 220 (100.0%) | 88 (100.0%) |
Housing Occupancy in Normangee
Occupancy by Ownership in Normangee
Of the total 312 dwellings in Normangee, owner-occupied units account for 227 (72.8%), while renter-occupied units make up 85 (27.2%).
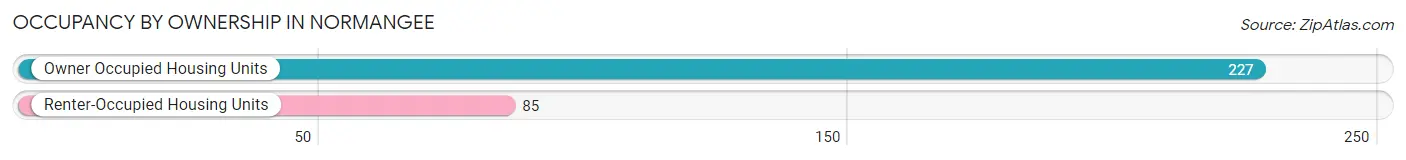
| Occupancy | # Housing Units | % Housing Units |
| Owner Occupied Housing Units | 227 | 72.8% |
| Renter-Occupied Housing Units | 85 | 27.2% |
| Total Occupied Housing Units | 312 | 100.0% |
Occupancy by Household Size in Normangee
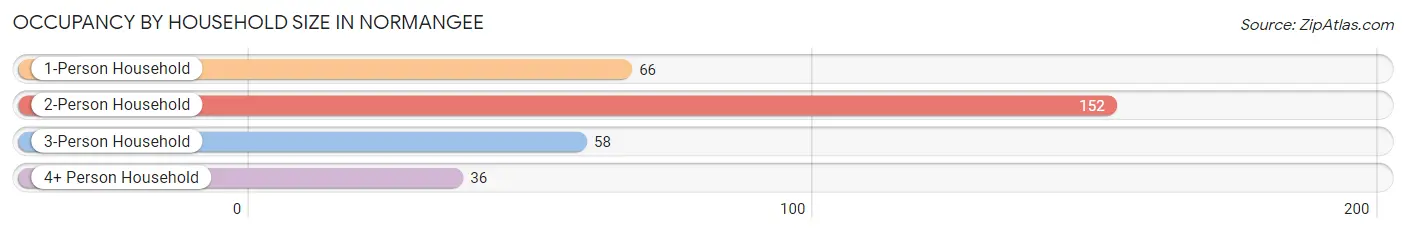
| Household Size | # Housing Units | % Housing Units |
| 1-Person Household | 66 | 21.1% |
| 2-Person Household | 152 | 48.7% |
| 3-Person Household | 58 | 18.6% |
| 4+ Person Household | 36 | 11.5% |
| Total Housing Units | 312 | 100.0% |
Occupancy by Ownership by Household Size in Normangee
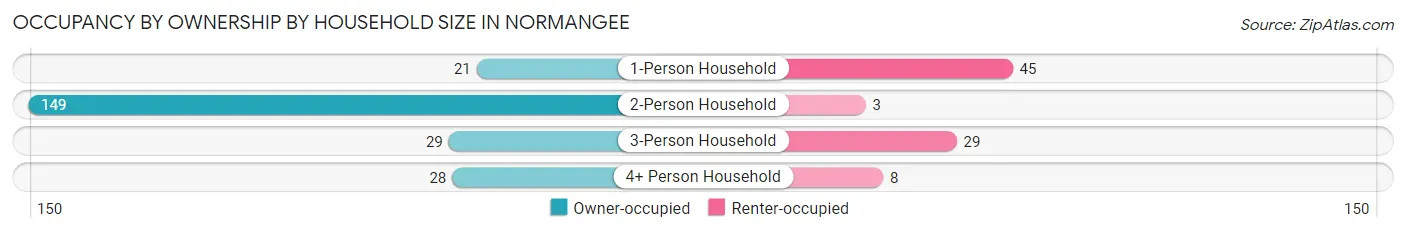
| Household Size | Owner-occupied | Renter-occupied |
| 1-Person Household | 21 (31.8%) | 45 (68.2%) |
| 2-Person Household | 149 (98.0%) | 3 (2.0%) |
| 3-Person Household | 29 (50.0%) | 29 (50.0%) |
| 4+ Person Household | 28 (77.8%) | 8 (22.2%) |
| Total Housing Units | 227 (72.8%) | 85 (27.2%) |
Occupancy by Educational Attainment in Normangee
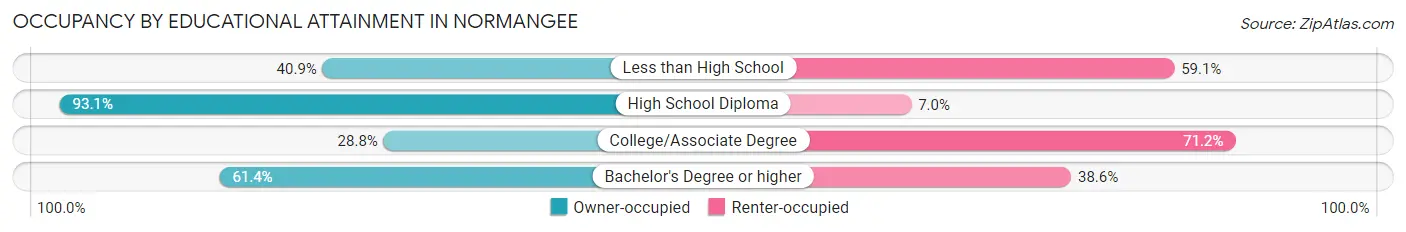
| Household Size | Owner-occupied | Renter-occupied |
| Less than High School | 9 (40.9%) | 13 (59.1%) |
| High School Diploma | 174 (93.0%) | 13 (7.0%) |
| College/Associate Degree | 17 (28.8%) | 42 (71.2%) |
| Bachelor's Degree or higher | 27 (61.4%) | 17 (38.6%) |
Occupancy by Age of Householder in Normangee
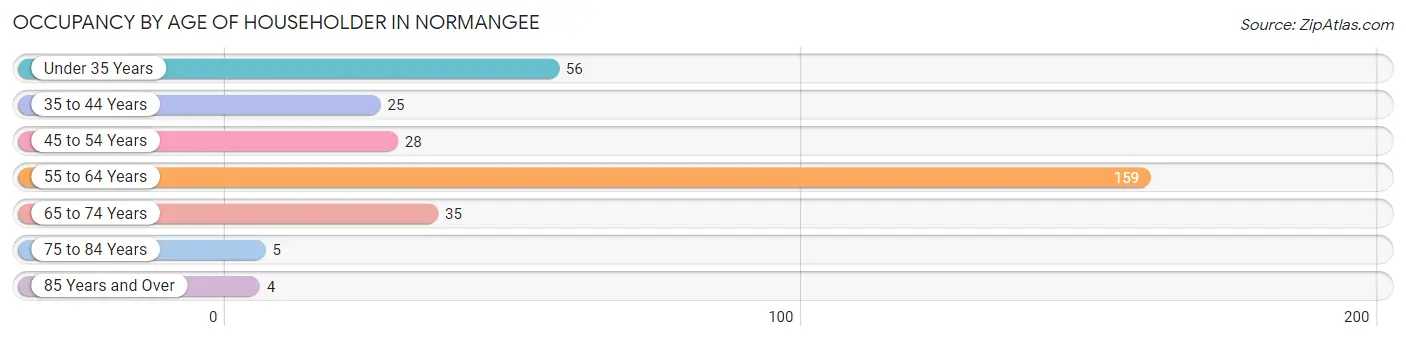
| Age Bracket | # Households | % Households |
| Under 35 Years | 56 | 17.9% |
| 35 to 44 Years | 25 | 8.0% |
| 45 to 54 Years | 28 | 9.0% |
| 55 to 64 Years | 159 | 51.0% |
| 65 to 74 Years | 35 | 11.2% |
| 75 to 84 Years | 5 | 1.6% |
| 85 Years and Over | 4 | 1.3% |
| Total | 312 | 100.0% |
Housing Finances in Normangee
Median Income by Occupancy in Normangee
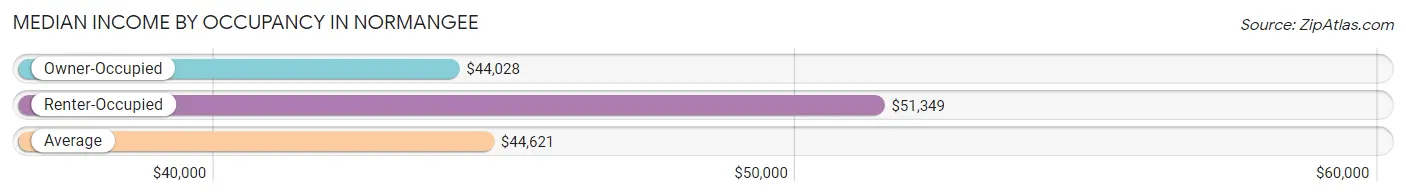
| Occupancy Type | # Households | Median Income |
| Owner-Occupied | 227 (72.8%) | $44,028 |
| Renter-Occupied | 85 (27.2%) | $51,349 |
| Average | 312 (100.0%) | $44,621 |
Occupancy by Householder Income Bracket in Normangee
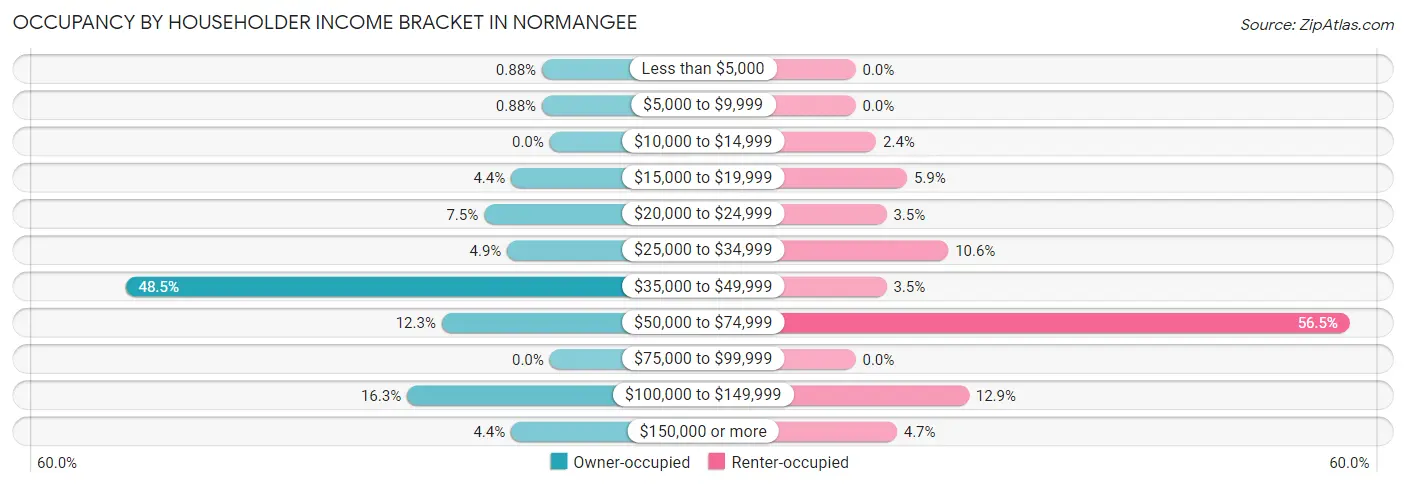
| Income Bracket | Owner-occupied | Renter-occupied |
| Less than $5,000 | 2 (0.9%) | 0 (0.0%) |
| $5,000 to $9,999 | 2 (0.9%) | 0 (0.0%) |
| $10,000 to $14,999 | 0 (0.0%) | 2 (2.4%) |
| $15,000 to $19,999 | 10 (4.4%) | 5 (5.9%) |
| $20,000 to $24,999 | 17 (7.5%) | 3 (3.5%) |
| $25,000 to $34,999 | 11 (4.9%) | 9 (10.6%) |
| $35,000 to $49,999 | 110 (48.5%) | 3 (3.5%) |
| $50,000 to $74,999 | 28 (12.3%) | 48 (56.5%) |
| $75,000 to $99,999 | 0 (0.0%) | 0 (0.0%) |
| $100,000 to $149,999 | 37 (16.3%) | 11 (12.9%) |
| $150,000 or more | 10 (4.4%) | 4 (4.7%) |
| Total | 227 (100.0%) | 85 (100.0%) |
Monthly Housing Cost Tiers in Normangee
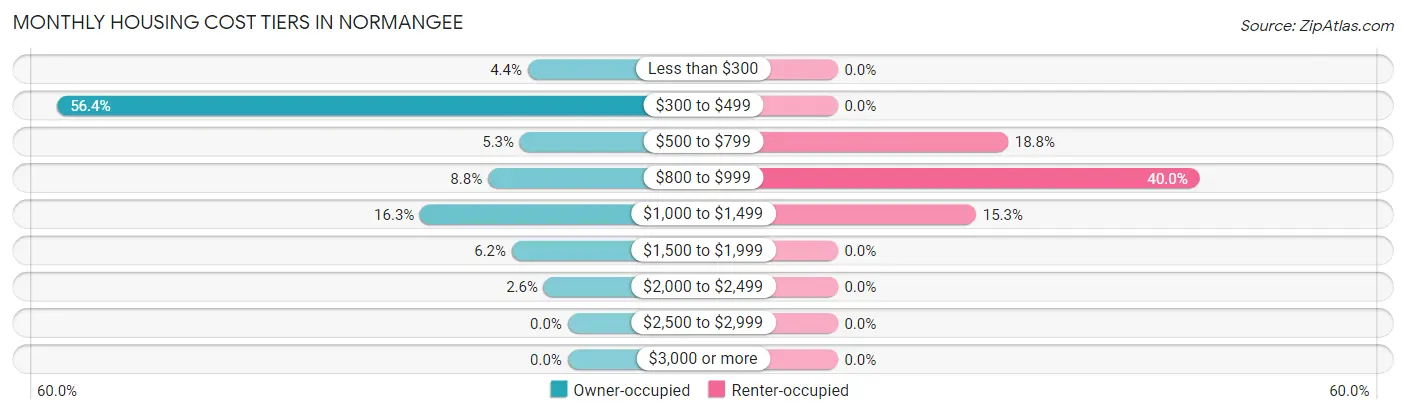
| Monthly Cost | Owner-occupied | Renter-occupied |
| Less than $300 | 10 (4.4%) | 0 (0.0%) |
| $300 to $499 | 128 (56.4%) | 0 (0.0%) |
| $500 to $799 | 12 (5.3%) | 16 (18.8%) |
| $800 to $999 | 20 (8.8%) | 34 (40.0%) |
| $1,000 to $1,499 | 37 (16.3%) | 13 (15.3%) |
| $1,500 to $1,999 | 14 (6.2%) | 0 (0.0%) |
| $2,000 to $2,499 | 6 (2.6%) | 0 (0.0%) |
| $2,500 to $2,999 | 0 (0.0%) | 0 (0.0%) |
| $3,000 or more | 0 (0.0%) | 0 (0.0%) |
| Total | 227 (100.0%) | 85 (100.0%) |
Physical Housing Characteristics in Normangee
Housing Structures in Normangee
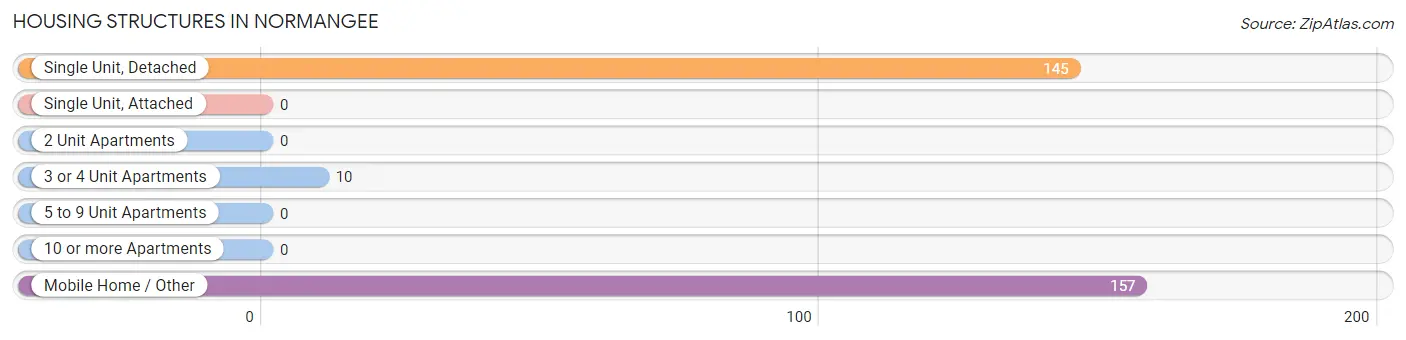
| Structure Type | # Housing Units | % Housing Units |
| Single Unit, Detached | 145 | 46.5% |
| Single Unit, Attached | 0 | 0.0% |
| 2 Unit Apartments | 0 | 0.0% |
| 3 or 4 Unit Apartments | 10 | 3.2% |
| 5 to 9 Unit Apartments | 0 | 0.0% |
| 10 or more Apartments | 0 | 0.0% |
| Mobile Home / Other | 157 | 50.3% |
| Total | 312 | 100.0% |
Housing Structures by Occupancy in Normangee
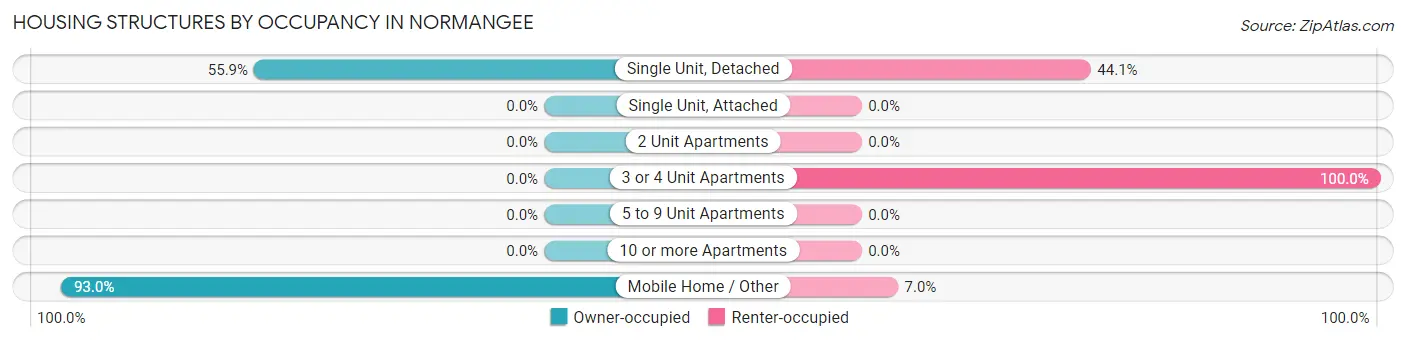
| Structure Type | Owner-occupied | Renter-occupied |
| Single Unit, Detached | 81 (55.9%) | 64 (44.1%) |
| Single Unit, Attached | 0 (0.0%) | 0 (0.0%) |
| 2 Unit Apartments | 0 (0.0%) | 0 (0.0%) |
| 3 or 4 Unit Apartments | 0 (0.0%) | 10 (100.0%) |
| 5 to 9 Unit Apartments | 0 (0.0%) | 0 (0.0%) |
| 10 or more Apartments | 0 (0.0%) | 0 (0.0%) |
| Mobile Home / Other | 146 (93.0%) | 11 (7.0%) |
| Total | 227 (72.8%) | 85 (27.2%) |
Housing Structures by Number of Rooms in Normangee
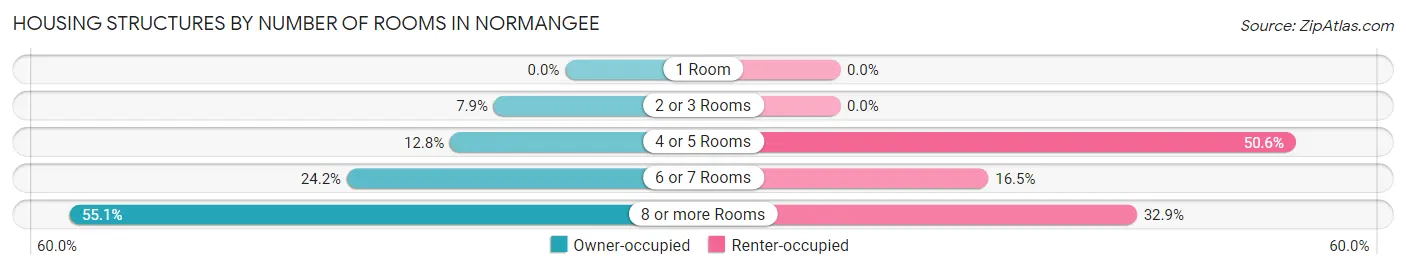
| Number of Rooms | Owner-occupied | Renter-occupied |
| 1 Room | 0 (0.0%) | 0 (0.0%) |
| 2 or 3 Rooms | 18 (7.9%) | 0 (0.0%) |
| 4 or 5 Rooms | 29 (12.8%) | 43 (50.6%) |
| 6 or 7 Rooms | 55 (24.2%) | 14 (16.5%) |
| 8 or more Rooms | 125 (55.1%) | 28 (32.9%) |
| Total | 227 (100.0%) | 85 (100.0%) |
Housing Structure by Heating Type in Normangee
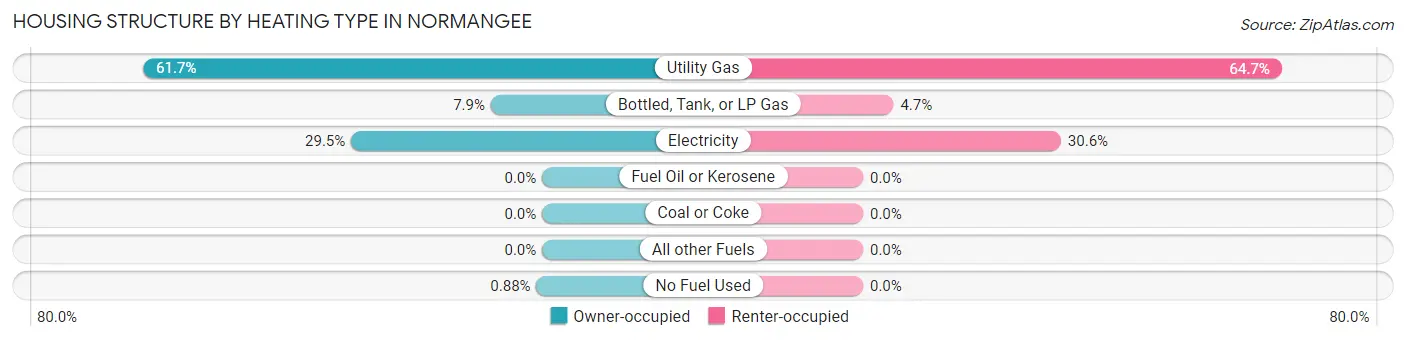
| Heating Type | Owner-occupied | Renter-occupied |
| Utility Gas | 140 (61.7%) | 55 (64.7%) |
| Bottled, Tank, or LP Gas | 18 (7.9%) | 4 (4.7%) |
| Electricity | 67 (29.5%) | 26 (30.6%) |
| Fuel Oil or Kerosene | 0 (0.0%) | 0 (0.0%) |
| Coal or Coke | 0 (0.0%) | 0 (0.0%) |
| All other Fuels | 0 (0.0%) | 0 (0.0%) |
| No Fuel Used | 2 (0.9%) | 0 (0.0%) |
| Total | 227 (100.0%) | 85 (100.0%) |
Household Vehicle Usage in Normangee
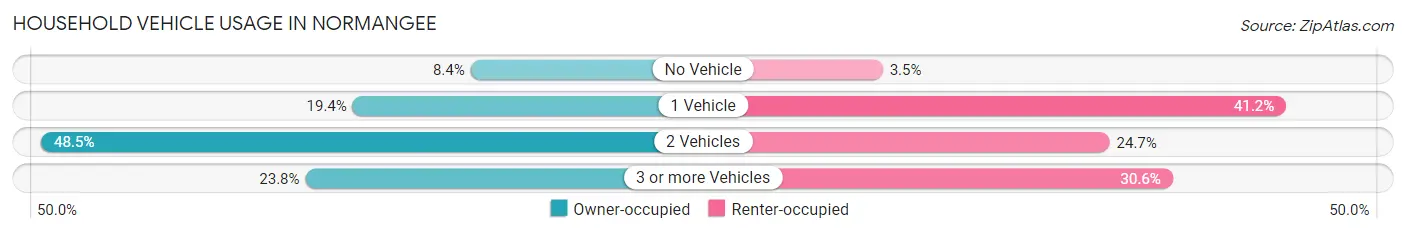
| Vehicles per Household | Owner-occupied | Renter-occupied |
| No Vehicle | 19 (8.4%) | 3 (3.5%) |
| 1 Vehicle | 44 (19.4%) | 35 (41.2%) |
| 2 Vehicles | 110 (48.5%) | 21 (24.7%) |
| 3 or more Vehicles | 54 (23.8%) | 26 (30.6%) |
| Total | 227 (100.0%) | 85 (100.0%) |
Real Estate & Mortgages in Normangee
Real Estate and Mortgage Overview in Normangee
| Characteristic | Without Mortgage | With Mortgage |
| Housing Units | 157 | 70 |
| Median Property Value | $160,500 | $0 |
| Median Household Income | $43,598 | $0 |
| Monthly Housing Costs | $442 | $0 |
| Real Estate Taxes | $608 | $2 |
Property Value by Mortgage Status in Normangee
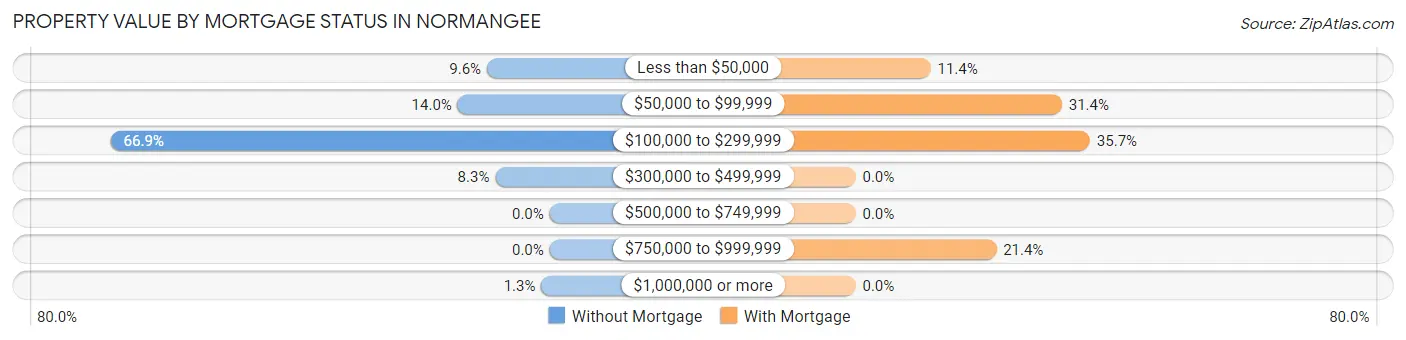
| Property Value | Without Mortgage | With Mortgage |
| Less than $50,000 | 15 (9.6%) | 8 (11.4%) |
| $50,000 to $99,999 | 22 (14.0%) | 22 (31.4%) |
| $100,000 to $299,999 | 105 (66.9%) | 25 (35.7%) |
| $300,000 to $499,999 | 13 (8.3%) | 0 (0.0%) |
| $500,000 to $749,999 | 0 (0.0%) | 0 (0.0%) |
| $750,000 to $999,999 | 0 (0.0%) | 15 (21.4%) |
| $1,000,000 or more | 2 (1.3%) | 0 (0.0%) |
| Total | 157 (100.0%) | 70 (100.0%) |
Household Income by Mortgage Status in Normangee
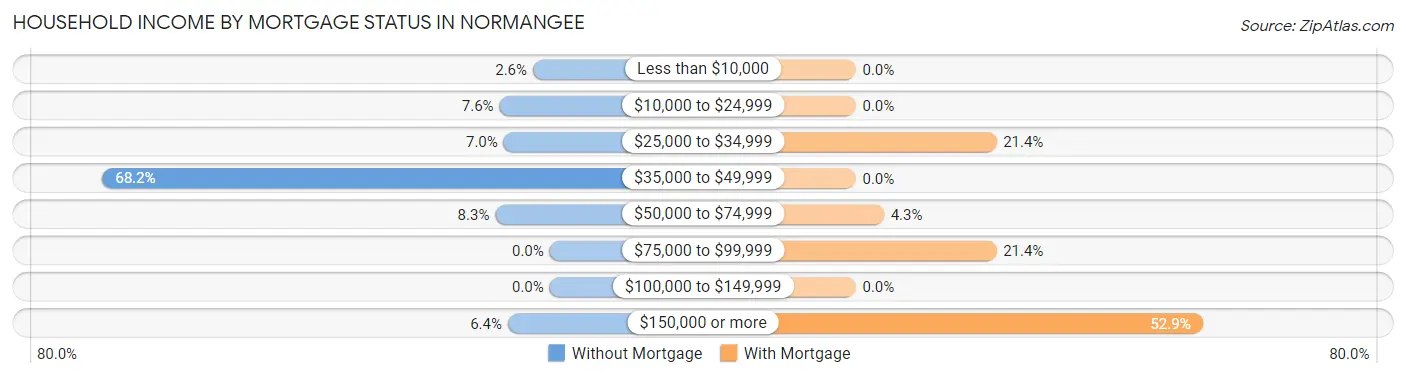
| Household Income | Without Mortgage | With Mortgage |
| Less than $10,000 | 4 (2.5%) | 0 (0.0%) |
| $10,000 to $24,999 | 12 (7.6%) | 0 (0.0%) |
| $25,000 to $34,999 | 11 (7.0%) | 15 (21.4%) |
| $35,000 to $49,999 | 107 (68.1%) | 0 (0.0%) |
| $50,000 to $74,999 | 13 (8.3%) | 3 (4.3%) |
| $75,000 to $99,999 | 0 (0.0%) | 15 (21.4%) |
| $100,000 to $149,999 | 0 (0.0%) | 0 (0.0%) |
| $150,000 or more | 10 (6.4%) | 37 (52.9%) |
| Total | 157 (100.0%) | 70 (100.0%) |
Property Value to Household Income Ratio in Normangee
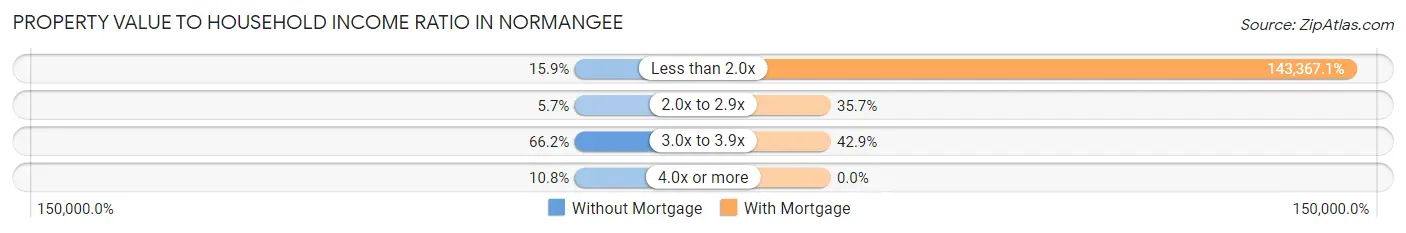
| Value-to-Income Ratio | Without Mortgage | With Mortgage |
| Less than 2.0x | 25 (15.9%) | 100,357 (143,367.1%) |
| 2.0x to 2.9x | 9 (5.7%) | 25 (35.7%) |
| 3.0x to 3.9x | 104 (66.2%) | 30 (42.9%) |
| 4.0x or more | 17 (10.8%) | 0 (0.0%) |
| Total | 157 (100.0%) | 70 (100.0%) |
Real Estate Taxes by Mortgage Status in Normangee
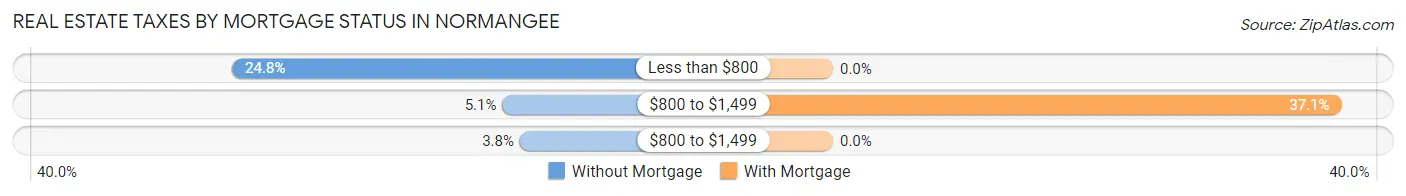
| Property Taxes | Without Mortgage | With Mortgage |
| Less than $800 | 39 (24.8%) | 0 (0.0%) |
| $800 to $1,499 | 8 (5.1%) | 26 (37.1%) |
| $800 to $1,499 | 6 (3.8%) | 0 (0.0%) |
| Total | 157 (100.0%) | 70 (100.0%) |
Health & Disability in Normangee
Health Insurance Coverage by Age in Normangee
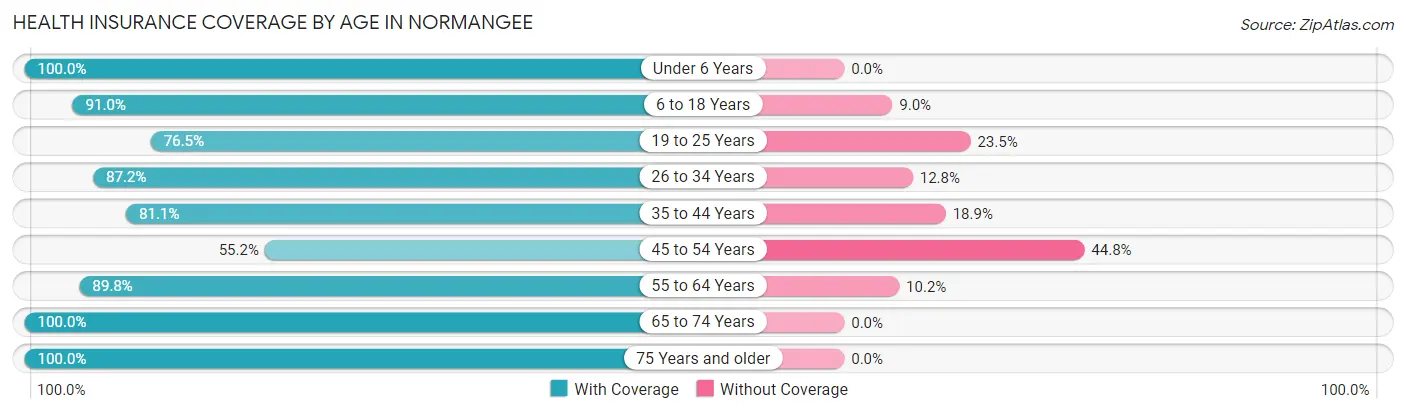
| Age Bracket | With Coverage | Without Coverage |
| Under 6 Years | 16 (100.0%) | 0 (0.0%) |
| 6 to 18 Years | 122 (91.0%) | 12 (9.0%) |
| 19 to 25 Years | 26 (76.5%) | 8 (23.5%) |
| 26 to 34 Years | 41 (87.2%) | 6 (12.8%) |
| 35 to 44 Years | 60 (81.1%) | 14 (18.9%) |
| 45 to 54 Years | 37 (55.2%) | 30 (44.8%) |
| 55 to 64 Years | 272 (89.8%) | 31 (10.2%) |
| 65 to 74 Years | 40 (100.0%) | 0 (0.0%) |
| 75 Years and older | 19 (100.0%) | 0 (0.0%) |
| Total | 633 (86.2%) | 101 (13.8%) |
Health Insurance Coverage by Citizenship Status in Normangee
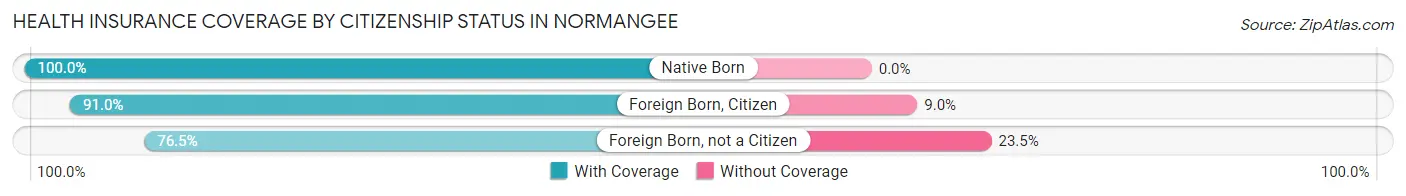
| Citizenship Status | With Coverage | Without Coverage |
| Native Born | 16 (100.0%) | 0 (0.0%) |
| Foreign Born, Citizen | 122 (91.0%) | 12 (9.0%) |
| Foreign Born, not a Citizen | 26 (76.5%) | 8 (23.5%) |
Health Insurance Coverage by Household Income in Normangee
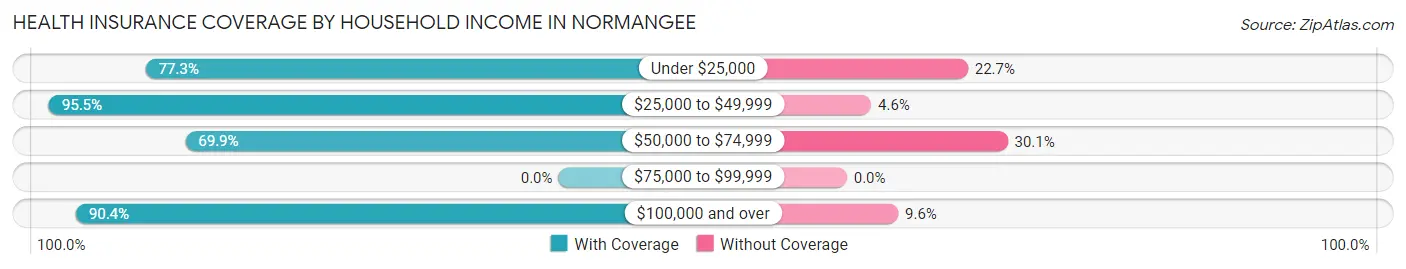
| Household Income | With Coverage | Without Coverage |
| Under $25,000 | 58 (77.3%) | 17 (22.7%) |
| $25,000 to $49,999 | 252 (95.5%) | 12 (4.5%) |
| $50,000 to $74,999 | 116 (69.9%) | 50 (30.1%) |
| $75,000 to $99,999 | 0 (0.0%) | 0 (0.0%) |
| $100,000 and over | 207 (90.4%) | 22 (9.6%) |
Public vs Private Health Insurance Coverage by Age in Normangee
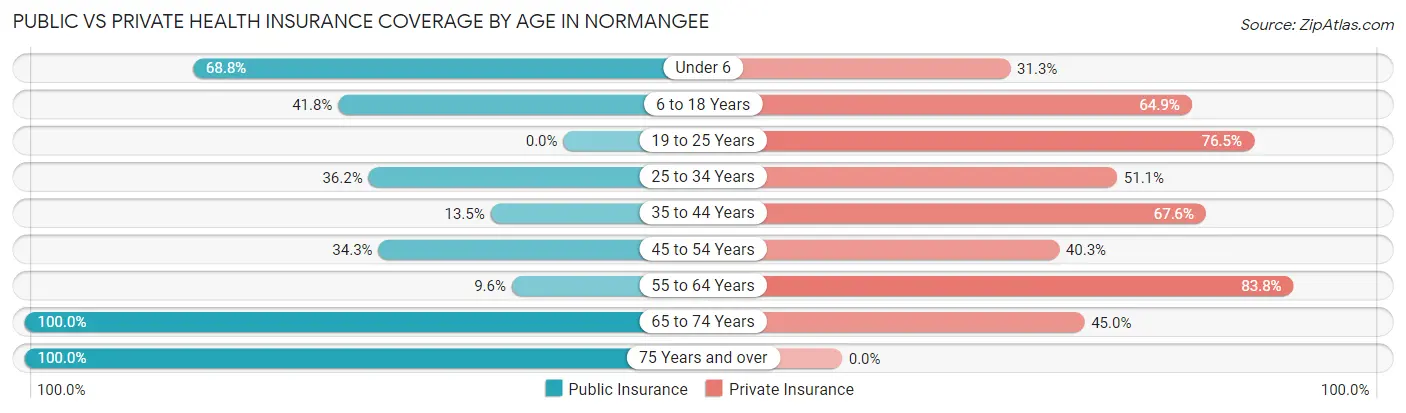
| Age Bracket | Public Insurance | Private Insurance |
| Under 6 | 11 (68.8%) | 5 (31.2%) |
| 6 to 18 Years | 56 (41.8%) | 87 (64.9%) |
| 19 to 25 Years | 0 (0.0%) | 26 (76.5%) |
| 25 to 34 Years | 17 (36.2%) | 24 (51.1%) |
| 35 to 44 Years | 10 (13.5%) | 50 (67.6%) |
| 45 to 54 Years | 23 (34.3%) | 27 (40.3%) |
| 55 to 64 Years | 29 (9.6%) | 254 (83.8%) |
| 65 to 74 Years | 40 (100.0%) | 18 (45.0%) |
| 75 Years and over | 19 (100.0%) | 0 (0.0%) |
| Total | 205 (27.9%) | 491 (66.9%) |
Disability Status by Sex by Age in Normangee
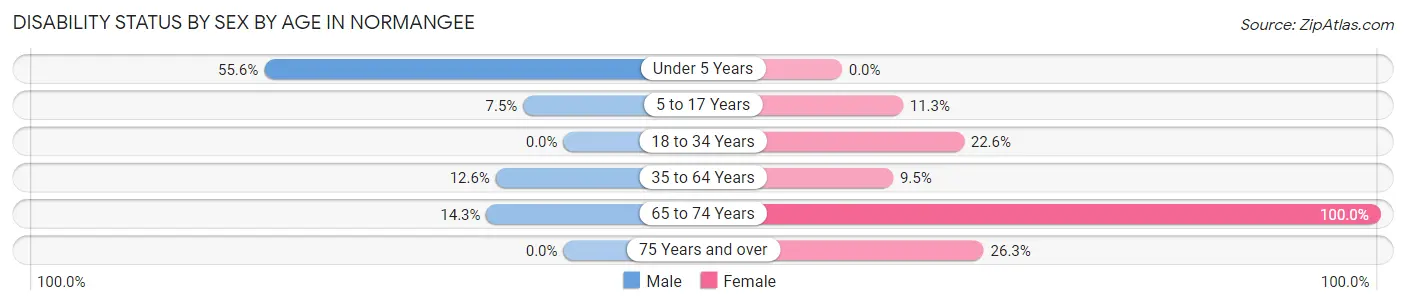
| Age Bracket | Male | Female |
| Under 5 Years | 5 (55.6%) | 0 (0.0%) |
| 5 to 17 Years | 5 (7.5%) | 6 (11.3%) |
| 18 to 34 Years | 0 (0.0%) | 12 (22.6%) |
| 35 to 64 Years | 28 (12.6%) | 21 (9.5%) |
| 65 to 74 Years | 5 (14.3%) | 5 (100.0%) |
| 75 Years and over | 0 (0.0%) | 5 (26.3%) |
Disability Class by Sex by Age in Normangee
Disability Class: Hearing Difficulty
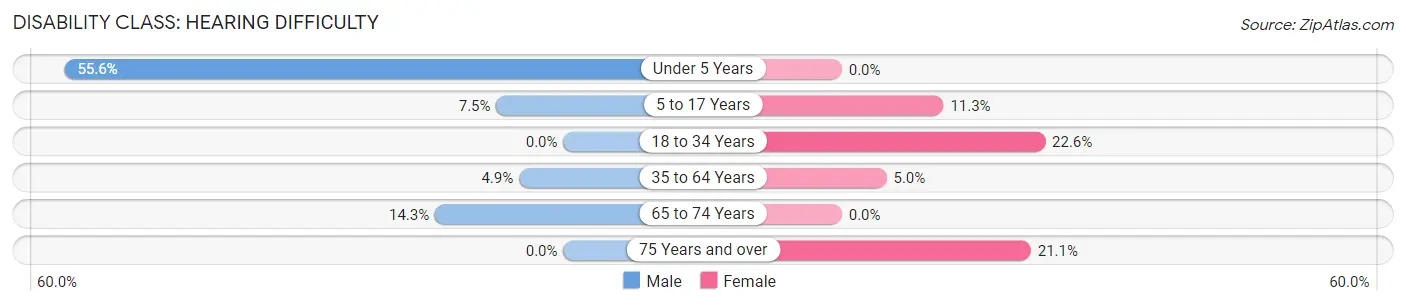
| Age Bracket | Male | Female |
| Under 5 Years | 5 (55.6%) | 0 (0.0%) |
| 5 to 17 Years | 5 (7.5%) | 6 (11.3%) |
| 18 to 34 Years | 0 (0.0%) | 12 (22.6%) |
| 35 to 64 Years | 11 (4.9%) | 11 (5.0%) |
| 65 to 74 Years | 5 (14.3%) | 0 (0.0%) |
| 75 Years and over | 0 (0.0%) | 4 (21.0%) |
Disability Class: Vision Difficulty
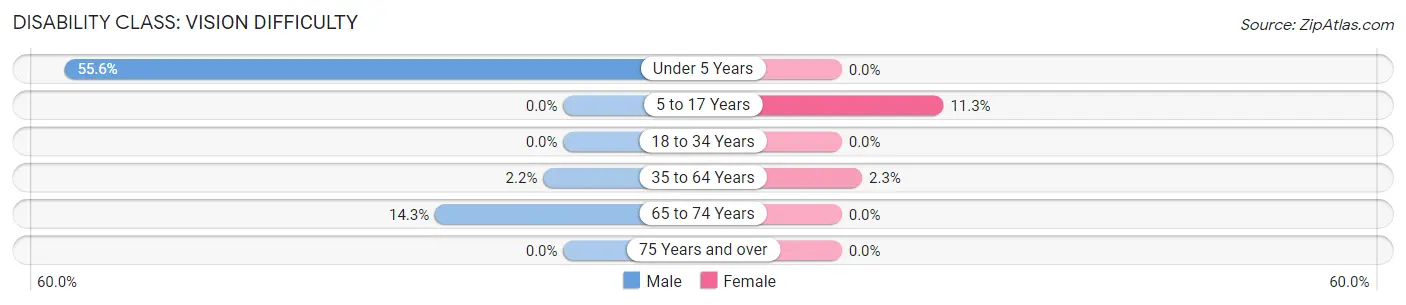
| Age Bracket | Male | Female |
| Under 5 Years | 5 (55.6%) | 0 (0.0%) |
| 5 to 17 Years | 0 (0.0%) | 6 (11.3%) |
| 18 to 34 Years | 0 (0.0%) | 0 (0.0%) |
| 35 to 64 Years | 5 (2.2%) | 5 (2.3%) |
| 65 to 74 Years | 5 (14.3%) | 0 (0.0%) |
| 75 Years and over | 0 (0.0%) | 0 (0.0%) |
Disability Class: Cognitive Difficulty
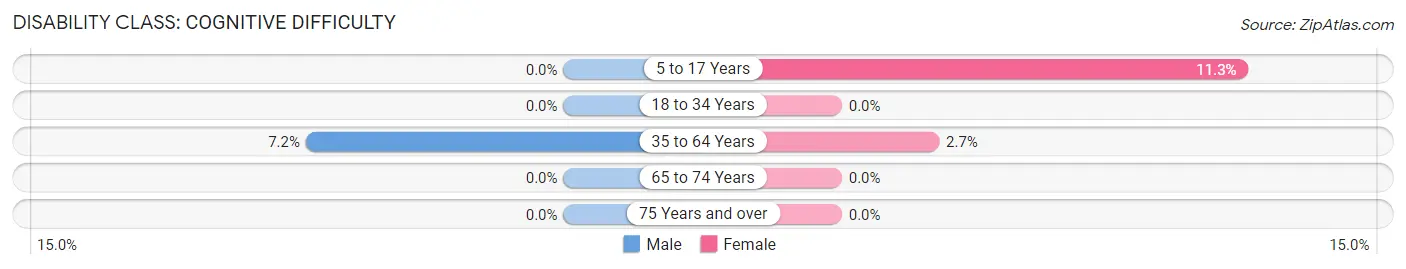
| Age Bracket | Male | Female |
| 5 to 17 Years | 0 (0.0%) | 6 (11.3%) |
| 18 to 34 Years | 0 (0.0%) | 0 (0.0%) |
| 35 to 64 Years | 16 (7.2%) | 6 (2.7%) |
| 65 to 74 Years | 0 (0.0%) | 0 (0.0%) |
| 75 Years and over | 0 (0.0%) | 0 (0.0%) |
Disability Class: Ambulatory Difficulty
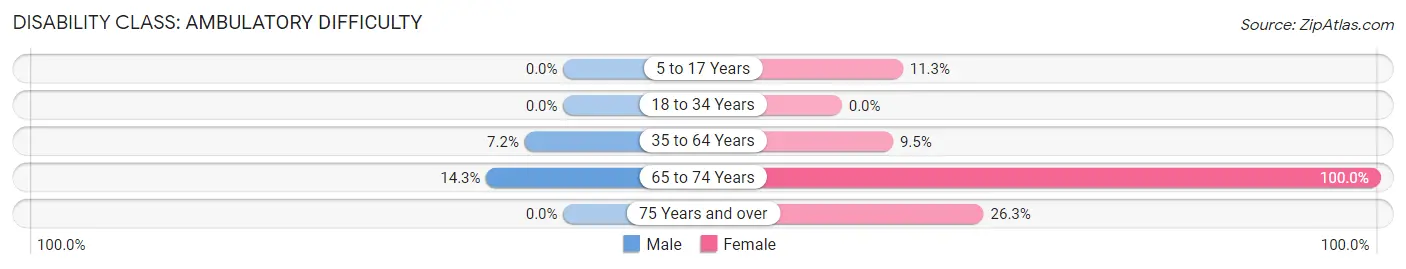
| Age Bracket | Male | Female |
| 5 to 17 Years | 0 (0.0%) | 6 (11.3%) |
| 18 to 34 Years | 0 (0.0%) | 0 (0.0%) |
| 35 to 64 Years | 16 (7.2%) | 21 (9.5%) |
| 65 to 74 Years | 5 (14.3%) | 5 (100.0%) |
| 75 Years and over | 0 (0.0%) | 5 (26.3%) |
Disability Class: Self-Care Difficulty
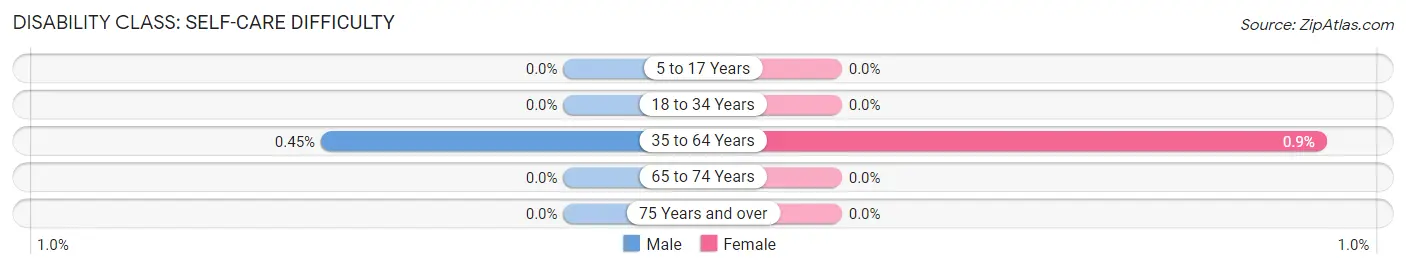
| Age Bracket | Male | Female |
| 5 to 17 Years | 0 (0.0%) | 0 (0.0%) |
| 18 to 34 Years | 0 (0.0%) | 0 (0.0%) |
| 35 to 64 Years | 1 (0.4%) | 2 (0.9%) |
| 65 to 74 Years | 0 (0.0%) | 0 (0.0%) |
| 75 Years and over | 0 (0.0%) | 0 (0.0%) |
Technology Access in Normangee
Computing Device Access in Normangee
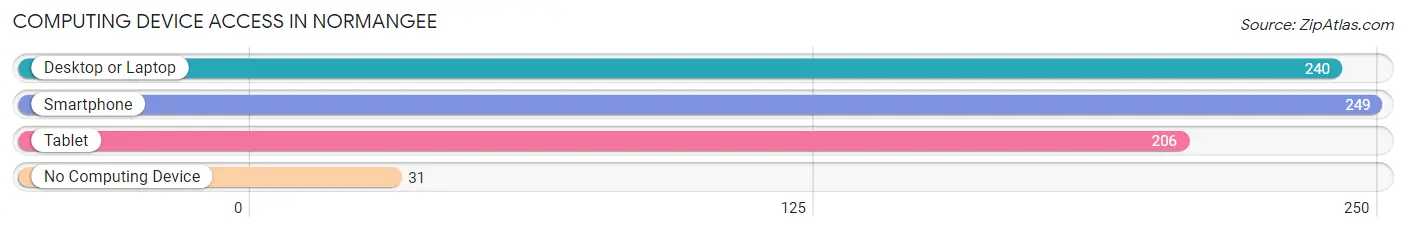
| Device Type | # Households | % Households |
| Desktop or Laptop | 240 | 76.9% |
| Smartphone | 249 | 79.8% |
| Tablet | 206 | 66.0% |
| No Computing Device | 31 | 9.9% |
| Total | 312 | 100.0% |
Internet Access in Normangee
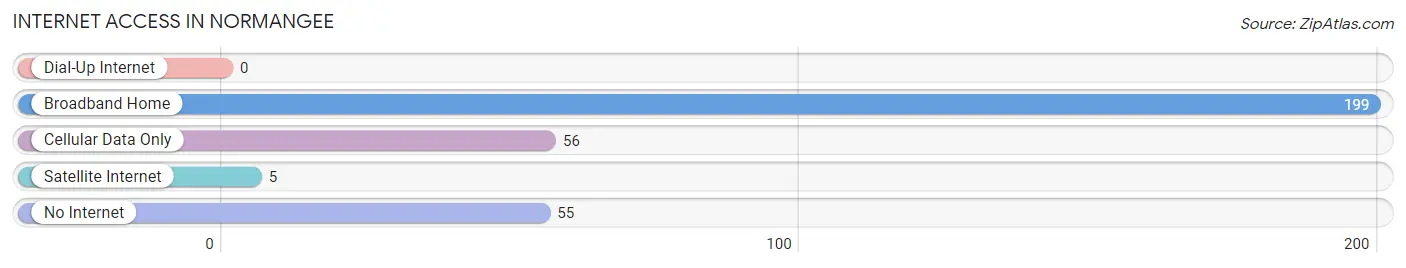
| Internet Type | # Households | % Households |
| Dial-Up Internet | 0 | 0.0% |
| Broadband Home | 199 | 63.8% |
| Cellular Data Only | 56 | 17.9% |
| Satellite Internet | 5 | 1.6% |
| No Internet | 55 | 17.6% |
| Total | 312 | 100.0% |
Normangee Summary
Normangee is a small town located in Leon County, Texas, United States. It is situated about halfway between Houston and Dallas, and is part of the Bryan-College Station metropolitan area. The population was 1,093 at the 2010 census.
History
The area around Normangee was first settled in the early 1840s by settlers from the United States and Europe. The town was founded in 1881 and named after Norman Gee, a local landowner. The town was incorporated in 1891 and a post office was established in 1892.
In the early 1900s, Normangee was a thriving agricultural community, with cotton, corn, and other crops being grown in the area. The town also had a number of businesses, including a bank, a hotel, a general store, and a blacksmith shop.
In the 1920s, the town began to decline as the Great Depression hit the area. The population dropped from 1,000 in 1920 to just over 500 in 1930. The town slowly recovered in the 1940s and 1950s, but the population remained relatively low until the 1970s.
Geography
Normangee is located at the intersection of State Highway 7 and Farm to Market Road 39. It is situated about halfway between Houston and Dallas, and is part of the Bryan-College Station metropolitan area. The town is located in the rolling hills of central Texas, and is surrounded by farmland and ranches.
The climate in Normangee is hot and humid in the summer, with temperatures reaching into the 90s, and mild in the winter, with temperatures rarely dropping below freezing. The average annual precipitation is about 35 inches.
Economy
The economy of Normangee is largely based on agriculture and ranching. The town is home to several large farms and ranches, and the surrounding area is known for its production of cotton, corn, and other crops.
In addition to agriculture, Normangee is home to a number of small businesses, including a grocery store, a hardware store, and a few restaurants. The town also has a few manufacturing plants, including a plastics factory and a furniture factory.
Demographics
As of the 2010 census, there were 1,093 people, 431 households, and 298 families residing in Normangee. The population density was 545.3 people per square mile (210.9/km2). The racial makeup of the town was 81.2% White, 14.2% African American, 0.3% Native American, 0.7% Asian, 0.1% Pacific Islander, 1.7% from other races, and 1.7% from two or more races. Hispanic or Latino of any race were 4.2% of the population.
The median income for a household in Normangee was $37,500, and the median income for a family was $45,000. The per capita income for the town was $17,845. About 15.2% of families and 18.2% of the population were below the poverty line, including 25.2% of those under age 18 and 11.2% of those age 65 or over.
Conclusion
Normangee is a small town located in Leon County, Texas, United States. It is situated about halfway between Houston and Dallas, and is part of the Bryan-College Station metropolitan area. The population was 1,093 at the 2010 census. The town was founded in 1881 and has a long history of agriculture and ranching. The economy of Normangee is largely based on agriculture and ranching, with a few small businesses and manufacturing plants. The population is mostly White, with a small percentage of African Americans, Native Americans, Asians, and other races. The median income for a household in Normangee was $37,500, and the median income for a family was $45,000.
Common Questions
What is Per Capita Income in Normangee?
Per Capita income in Normangee is $28,177.
What is the Median Family Income in Normangee?
Median Family Income in Normangee is $44,242.
What is the Median Household income in Normangee?
Median Household Income in Normangee is $44,621.
What is Income or Wage Gap in Normangee?
Income or Wage Gap in Normangee is 43.0%.
Women in Normangee earn 57.0 cents for every dollar earned by a man.
What is Inequality or Gini Index in Normangee?
Inequality or Gini Index in Normangee is 0.41.
What is the Total Population of Normangee?
Total Population of Normangee is 734.
What is the Total Male Population of Normangee?
Total Male Population of Normangee is 381.
What is the Total Female Population of Normangee?
Total Female Population of Normangee is 353.
What is the Ratio of Males per 100 Females in Normangee?
There are 107.93 Males per 100 Females in Normangee.
What is the Ratio of Females per 100 Males in Normangee?
There are 92.65 Females per 100 Males in Normangee.
What is the Median Population Age in Normangee?
Median Population Age in Normangee is 54.6 Years.
What is the Average Family Size in Normangee
Average Family Size in Normangee is 2.6 People.
What is the Average Household Size in Normangee
Average Household Size in Normangee is 2.4 People.
How Large is the Labor Force in Normangee?
There are 360 People in the Labor Forcein in Normangee.
What is the Percentage of People in the Labor Force in Normangee?
59.0% of People are in the Labor Force in Normangee.
What is the Unemployment Rate in Normangee?
Unemployment Rate in Normangee is 6.9%.