Socorro, TX Map & Demographics
Socorro Map
Socorro Overview
$19,122
PER CAPITA INCOME
$51,814
AVG FAMILY INCOME
$47,649
AVG HOUSEHOLD INCOME
28.1%
WAGE / INCOME GAP [ % ]
71.9¢/ $1
WAGE / INCOME GAP [ $ ]
$9,426
FAMILY INCOME DEFICIT
0.42
INEQUALITY / GINI INDEX
35,429
TOTAL POPULATION
16,382
MALE POPULATION
19,047
FEMALE POPULATION
86.01
MALES / 100 FEMALES
116.27
FEMALES / 100 MALES
35.6
MEDIAN AGE
3.6
AVG FAMILY SIZE
3.2
AVG HOUSEHOLD SIZE
16,425
LABOR FORCE [ PEOPLE ]
59.9%
PERCENT IN LABOR FORCE
5.6%
UNEMPLOYMENT RATE
Socorro Area Codes
Income in Socorro
Income Overview in Socorro
Per Capita Income in Socorro is $19,122, while median incomes of families and households are $51,814 and $47,649 respectively.
| Characteristic | Number | Measure |
| Per Capita Income | 35,429 | $19,122 |
| Median Family Income | 8,863 | $51,814 |
| Mean Family Income | 8,863 | $62,496 |
| Median Household Income | 11,125 | $47,649 |
| Mean Household Income | 11,125 | $57,726 |
| Income Deficit | 8,863 | $9,426 |
| Wage / Income Gap (%) | 35,429 | 28.05% |
| Wage / Income Gap ($) | 35,429 | 71.95¢ per $1 |
| Gini / Inequality Index | 35,429 | 0.42 |
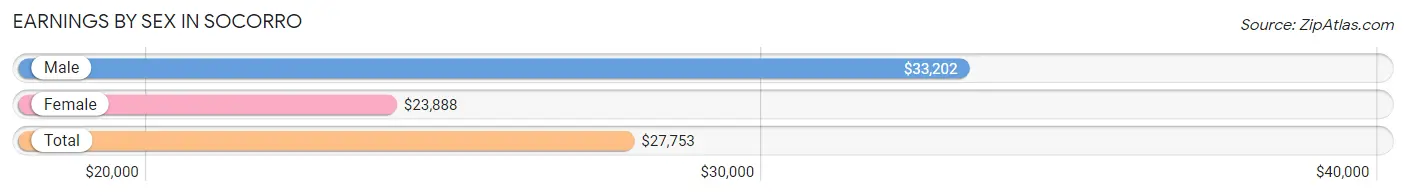
Earnings by Sex in Socorro
Average Earnings in Socorro are $27,753, $33,202 for men and $23,888 for women, a difference of 28.1%.
| Sex | Number | Average Earnings |
| Male | 8,906 (52.9%) | $33,202 |
| Female | 7,915 (47.0%) | $23,888 |
| Total | 16,821 (100.0%) | $27,753 |
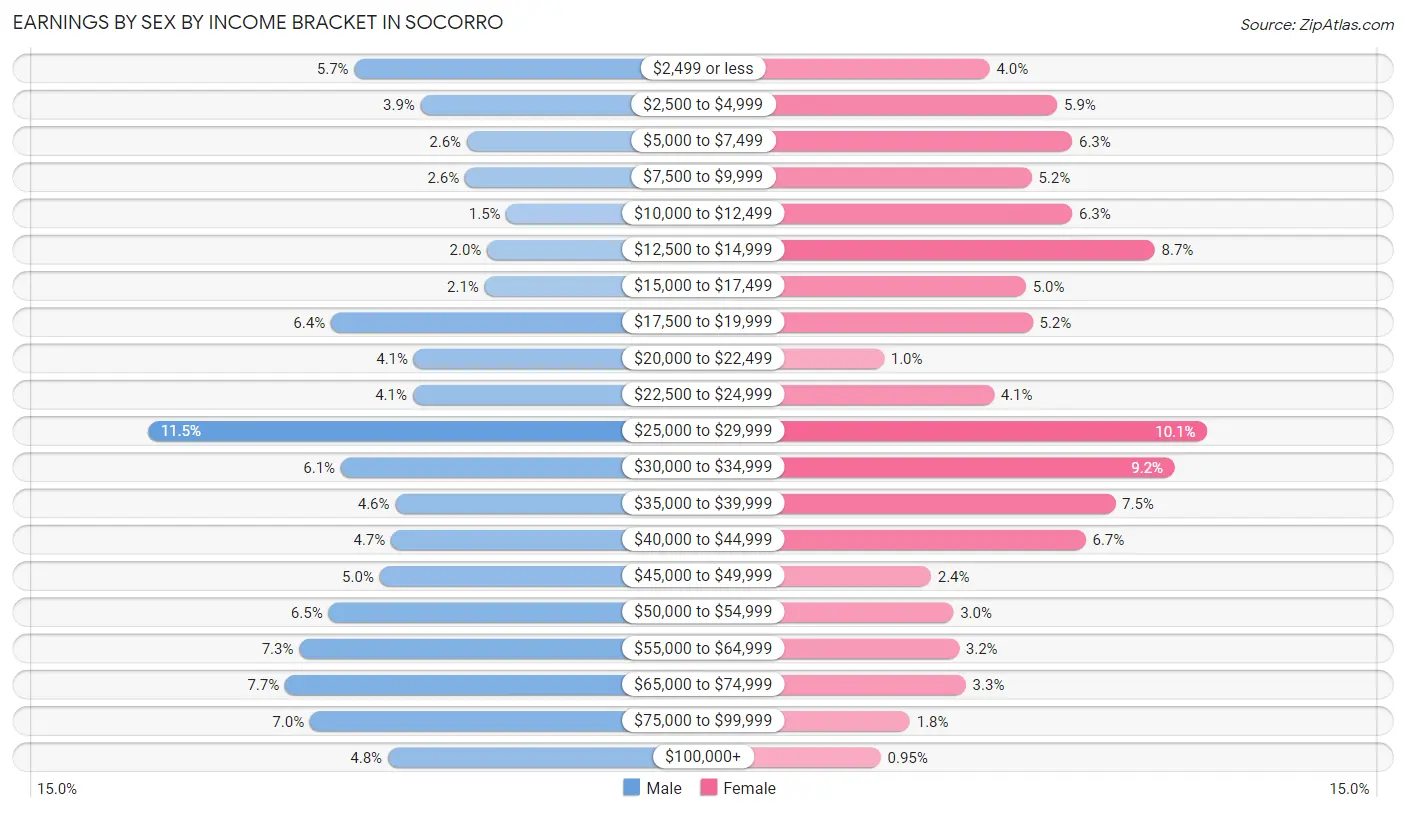
Earnings by Sex by Income Bracket in Socorro
The most common earnings brackets in Socorro are $25,000 to $29,999 for men (1,028 | 11.5%) and $25,000 to $29,999 for women (802 | 10.1%).
| Income | Male | Female |
| $2,499 or less | 510 (5.7%) | 317 (4.0%) |
| $2,500 to $4,999 | 345 (3.9%) | 468 (5.9%) |
| $5,000 to $7,499 | 229 (2.6%) | 501 (6.3%) |
| $7,500 to $9,999 | 233 (2.6%) | 411 (5.2%) |
| $10,000 to $12,499 | 130 (1.5%) | 501 (6.3%) |
| $12,500 to $14,999 | 178 (2.0%) | 685 (8.6%) |
| $15,000 to $17,499 | 184 (2.1%) | 398 (5.0%) |
| $17,500 to $19,999 | 569 (6.4%) | 413 (5.2%) |
| $20,000 to $22,499 | 362 (4.1%) | 82 (1.0%) |
| $22,500 to $24,999 | 364 (4.1%) | 327 (4.1%) |
| $25,000 to $29,999 | 1,028 (11.5%) | 802 (10.1%) |
| $30,000 to $34,999 | 544 (6.1%) | 730 (9.2%) |
| $35,000 to $39,999 | 408 (4.6%) | 597 (7.5%) |
| $40,000 to $44,999 | 419 (4.7%) | 531 (6.7%) |
| $45,000 to $49,999 | 447 (5.0%) | 187 (2.4%) |
| $50,000 to $54,999 | 575 (6.5%) | 237 (3.0%) |
| $55,000 to $64,999 | 648 (7.3%) | 249 (3.2%) |
| $65,000 to $74,999 | 684 (7.7%) | 264 (3.3%) |
| $75,000 to $99,999 | 622 (7.0%) | 140 (1.8%) |
| $100,000+ | 427 (4.8%) | 75 (0.9%) |
| Total | 8,906 (100.0%) | 7,915 (100.0%) |
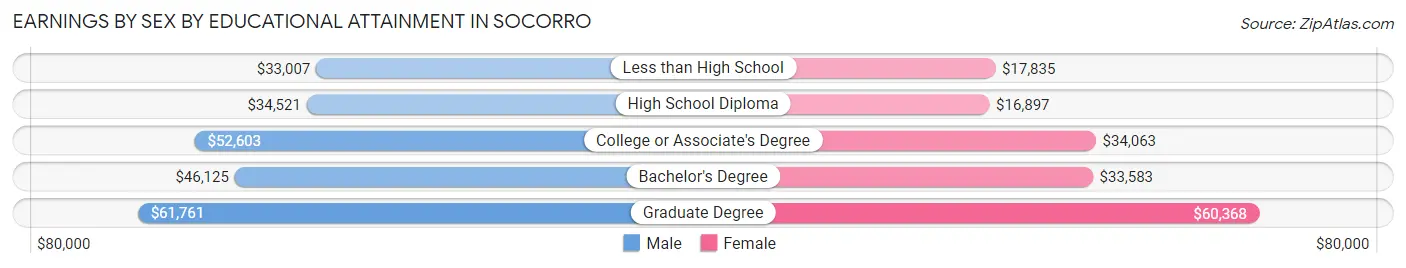
Earnings by Sex by Educational Attainment in Socorro
Average earnings in Socorro are $40,570 for men and $25,930 for women, a difference of 36.1%. Men with an educational attainment of graduate degree enjoy the highest average annual earnings of $61,761, while those with less than high school education earn the least with $33,007. Women with an educational attainment of graduate degree earn the most with the average annual earnings of $60,368, while those with high school diploma education have the smallest earnings of $16,897.
| Educational Attainment | Male Income | Female Income |
| Less than High School | $33,007 | $17,835 |
| High School Diploma | $34,521 | $16,897 |
| College or Associate's Degree | $52,603 | $34,063 |
| Bachelor's Degree | $46,125 | $33,583 |
| Graduate Degree | $61,761 | $60,368 |
| Total | $40,570 | $25,930 |
Family Income in Socorro
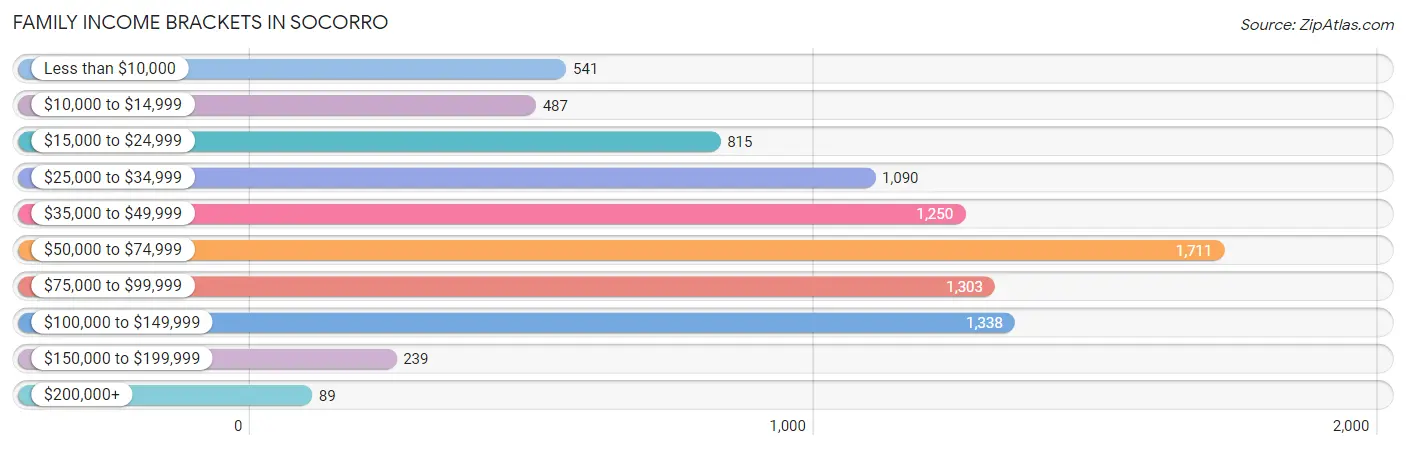
Family Income Brackets in Socorro
According to the Socorro family income data, there are 1,711 families falling into the $50,000 to $74,999 income range, which is the most common income bracket and makes up 19.3% of all families. Conversely, the $200,000+ income bracket is the least frequent group with only 89 families (1.0%) belonging to this category.
| Income Bracket | # Families | % Families |
| Less than $10,000 | 541 | 6.1% |
| $10,000 to $14,999 | 487 | 5.5% |
| $15,000 to $24,999 | 815 | 9.2% |
| $25,000 to $34,999 | 1,090 | 12.3% |
| $35,000 to $49,999 | 1,250 | 14.1% |
| $50,000 to $74,999 | 1,711 | 19.3% |
| $75,000 to $99,999 | 1,303 | 14.7% |
| $100,000 to $149,999 | 1,338 | 15.1% |
| $150,000 to $199,999 | 239 | 2.7% |
| $200,000+ | 89 | 1.0% |
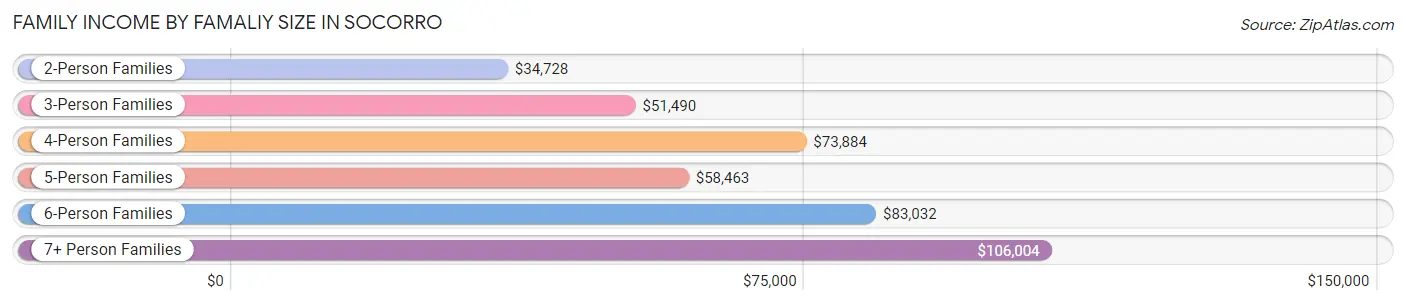
Family Income by Famaliy Size in Socorro
7+ person families (181 | 2.0%) account for the highest median family income in Socorro with $106,004 per family, while 4-person families (2,044 | 23.1%) have the highest median income of $18,471 per family member.
| Income Bracket | # Families | Median Income |
| 2-Person Families | 2,816 (31.8%) | $34,728 |
| 3-Person Families | 2,224 (25.1%) | $51,490 |
| 4-Person Families | 2,044 (23.1%) | $73,884 |
| 5-Person Families | 1,183 (13.4%) | $58,463 |
| 6-Person Families | 415 (4.7%) | $83,032 |
| 7+ Person Families | 181 (2.0%) | $106,004 |
| Total | 8,863 (100.0%) | $51,814 |
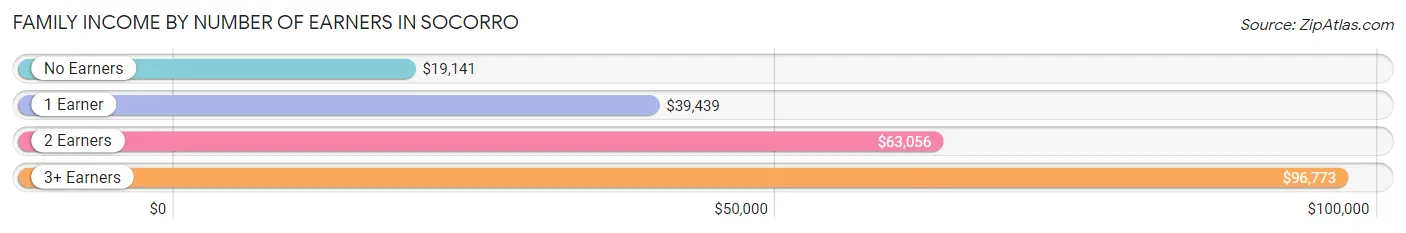
Family Income by Number of Earners in Socorro
The median family income in Socorro is $51,814, with families comprising 3+ earners (1,240) having the highest median family income of $96,773, while families with no earners (997) have the lowest median family income of $19,141, accounting for 14.0% and 11.3% of families, respectively.
| Number of Earners | # Families | Median Income |
| No Earners | 997 (11.3%) | $19,141 |
| 1 Earner | 3,352 (37.8%) | $39,439 |
| 2 Earners | 3,274 (36.9%) | $63,056 |
| 3+ Earners | 1,240 (14.0%) | $96,773 |
| Total | 8,863 (100.0%) | $51,814 |
Household Income in Socorro
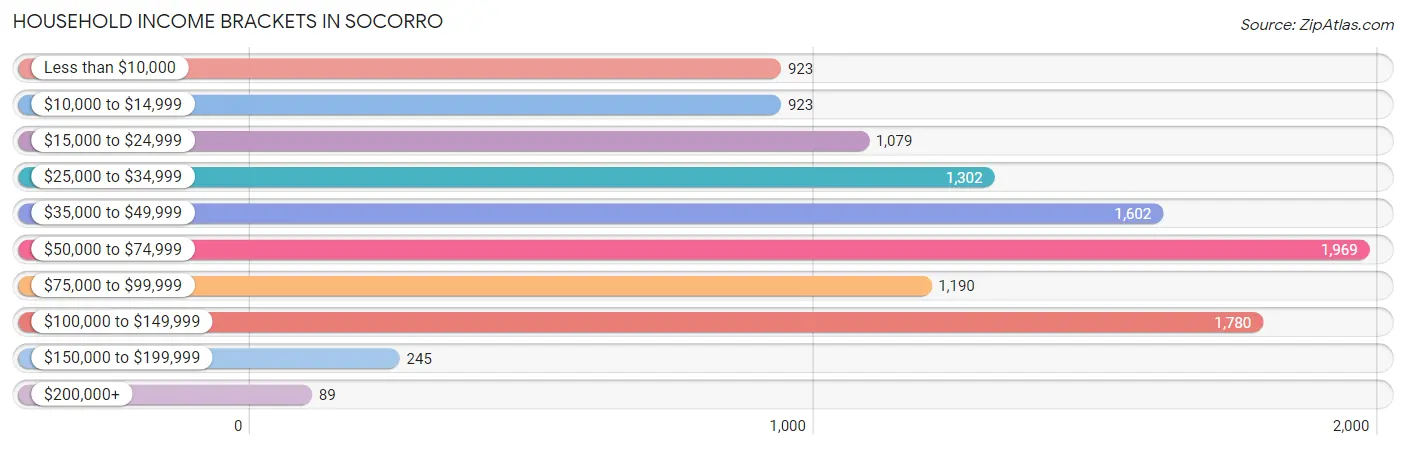
Household Income Brackets in Socorro
With 1,969 households falling in the category, the $50,000 to $74,999 income range is the most frequent in Socorro, accounting for 17.7% of all households. In contrast, only 89 households (0.8%) fall into the $200,000+ income bracket, making it the least populous group.
| Income Bracket | # Households | % Households |
| Less than $10,000 | 923 | 8.3% |
| $10,000 to $14,999 | 923 | 8.3% |
| $15,000 to $24,999 | 1,079 | 9.7% |
| $25,000 to $34,999 | 1,302 | 11.7% |
| $35,000 to $49,999 | 1,602 | 14.4% |
| $50,000 to $74,999 | 1,969 | 17.7% |
| $75,000 to $99,999 | 1,190 | 10.7% |
| $100,000 to $149,999 | 1,780 | 16.0% |
| $150,000 to $199,999 | 245 | 2.2% |
| $200,000+ | 89 | 0.8% |
Household Income by Householder Age in Socorro
The median household income in Socorro is $47,649, with the highest median household income of $67,522 found in the 25 to 44 years age bracket for the primary householder. A total of 3,922 households (35.2%) fall into this category. Meanwhile, the 15 to 24 years age bracket for the primary householder has the lowest median household income of $0, with 211 households (1.9%) in this group.
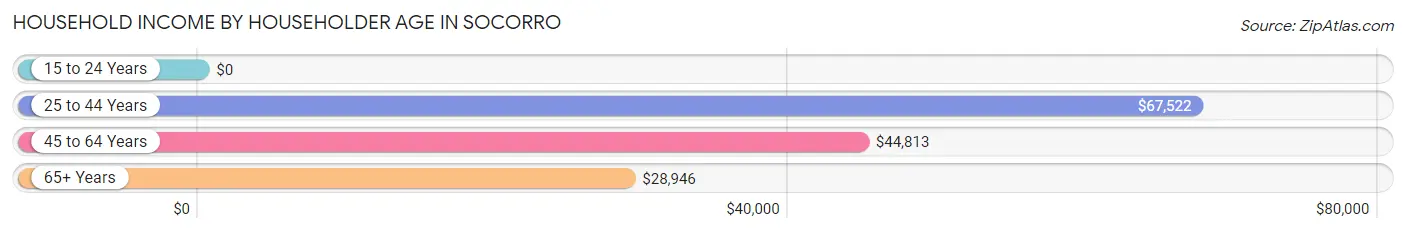
| Income Bracket | # Households | Median Income |
| 15 to 24 Years | 211 (1.9%) | $0 |
| 25 to 44 Years | 3,922 (35.2%) | $67,522 |
| 45 to 64 Years | 4,440 (39.9%) | $44,813 |
| 65+ Years | 2,552 (22.9%) | $28,946 |
| Total | 11,125 (100.0%) | $47,649 |
Poverty in Socorro
Income Below Poverty by Sex and Age in Socorro
With 20.3% poverty level for males and 26.2% for females among the residents of Socorro, 15 year old males and 15 year old females are the most vulnerable to poverty, with 131 males (50.4%) and 197 females (43.4%) in their respective age groups living below the poverty level.
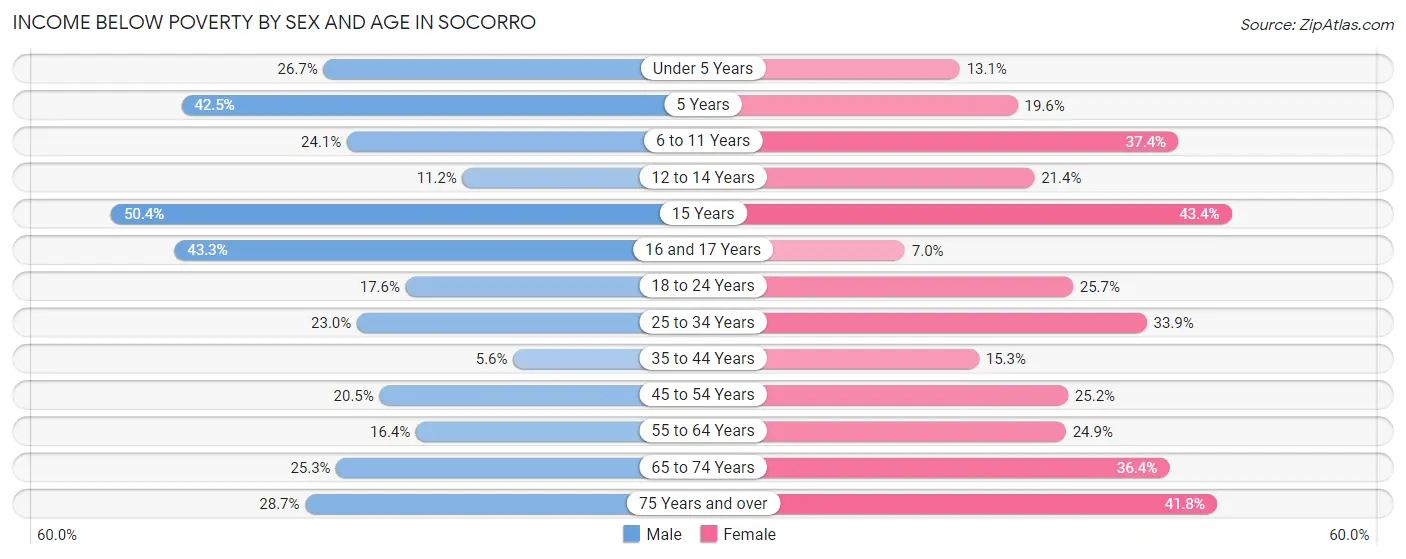
| Age Bracket | Male | Female |
| Under 5 Years | 267 (26.7%) | 146 (13.1%) |
| 5 Years | 37 (42.5%) | 45 (19.6%) |
| 6 to 11 Years | 334 (24.1%) | 542 (37.4%) |
| 12 to 14 Years | 91 (11.2%) | 239 (21.4%) |
| 15 Years | 131 (50.4%) | 197 (43.4%) |
| 16 and 17 Years | 295 (43.3%) | 46 (7.0%) |
| 18 to 24 Years | 341 (17.5%) | 476 (25.7%) |
| 25 to 34 Years | 432 (23.0%) | 769 (33.9%) |
| 35 to 44 Years | 129 (5.6%) | 445 (15.3%) |
| 45 to 54 Years | 419 (20.5%) | 558 (25.2%) |
| 55 to 64 Years | 319 (16.4%) | 580 (24.9%) |
| 65 to 74 Years | 346 (25.3%) | 535 (36.4%) |
| 75 Years and over | 158 (28.7%) | 403 (41.8%) |
| Total | 3,299 (20.3%) | 4,981 (26.2%) |
Income Above Poverty by Sex and Age in Socorro
According to the poverty statistics in Socorro, males aged 35 to 44 years and females aged 16 and 17 years are the age groups that are most secure financially, with 94.4% of males and 93.0% of females in these age groups living above the poverty line.
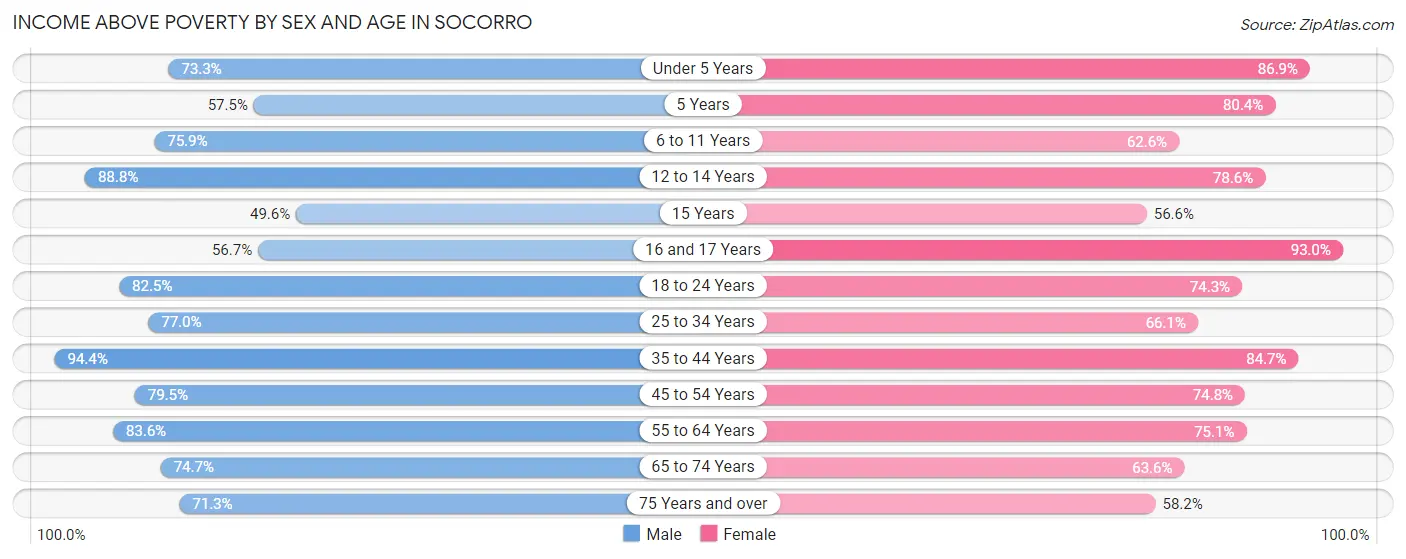
| Age Bracket | Male | Female |
| Under 5 Years | 733 (73.3%) | 966 (86.9%) |
| 5 Years | 50 (57.5%) | 185 (80.4%) |
| 6 to 11 Years | 1,053 (75.9%) | 906 (62.6%) |
| 12 to 14 Years | 721 (88.8%) | 876 (78.6%) |
| 15 Years | 129 (49.6%) | 257 (56.6%) |
| 16 and 17 Years | 386 (56.7%) | 609 (93.0%) |
| 18 to 24 Years | 1,602 (82.5%) | 1,374 (74.3%) |
| 25 to 34 Years | 1,449 (77.0%) | 1,497 (66.1%) |
| 35 to 44 Years | 2,187 (94.4%) | 2,471 (84.7%) |
| 45 to 54 Years | 1,629 (79.5%) | 1,658 (74.8%) |
| 55 to 64 Years | 1,626 (83.6%) | 1,746 (75.1%) |
| 65 to 74 Years | 1,023 (74.7%) | 933 (63.6%) |
| 75 Years and over | 392 (71.3%) | 562 (58.2%) |
| Total | 12,980 (79.7%) | 14,040 (73.8%) |
Income Below Poverty Among Married-Couple Families in Socorro
The poverty statistics for married-couple families in Socorro show that 18.0% or 1,071 of the total 5,959 families live below the poverty line. Families with 3 or 4 children have the highest poverty rate of 28.7%, comprising of 230 families. On the other hand, families with 5 or more children have the lowest poverty rate of 0.0%, which includes 0 families.
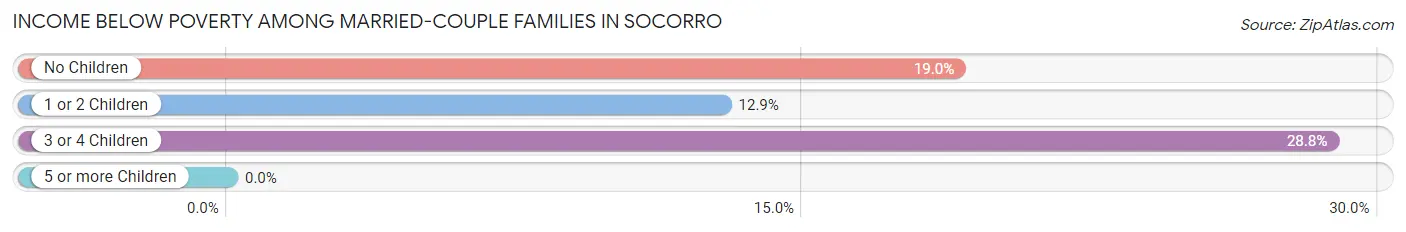
| Children | Above Poverty | Below Poverty |
| No Children | 2,343 (81.0%) | 550 (19.0%) |
| 1 or 2 Children | 1,967 (87.1%) | 291 (12.9%) |
| 3 or 4 Children | 570 (71.3%) | 230 (28.7%) |
| 5 or more Children | 8 (100.0%) | 0 (0.0%) |
| Total | 4,888 (82.0%) | 1,071 (18.0%) |
Income Below Poverty Among Single-Parent Households in Socorro
According to the poverty data in Socorro, 31.3% or 198 single-father households and 31.1% or 707 single-mother households are living below the poverty line. Among single-father households, those with 3 or 4 children have the highest poverty rate, with 21 households (48.8%) experiencing poverty. Likewise, among single-mother households, those with 3 or 4 children have the highest poverty rate, with 229 households (72.0%) falling below the poverty line.
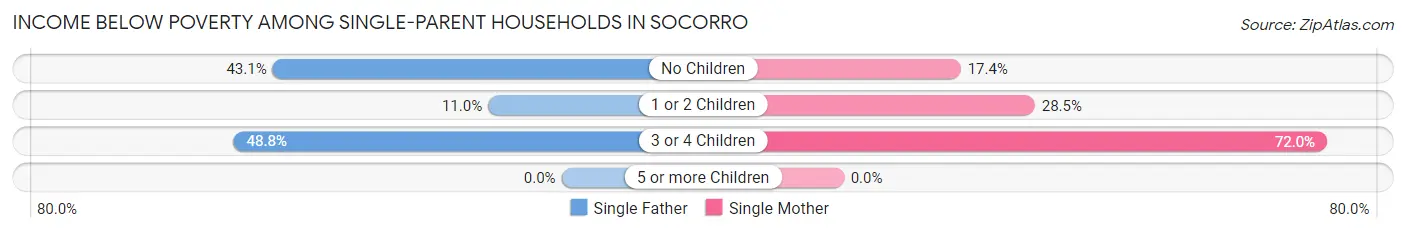
| Children | Single Father | Single Mother |
| No Children | 155 (43.1%) | 124 (17.4%) |
| 1 or 2 Children | 22 (11.0%) | 354 (28.5%) |
| 3 or 4 Children | 21 (48.8%) | 229 (72.0%) |
| 5 or more Children | 0 (0.0%) | 0 (0.0%) |
| Total | 198 (31.3%) | 707 (31.1%) |
Income Below Poverty Among Married-Couple vs Single-Parent Households in Socorro
The poverty data for Socorro shows that 1,071 of the married-couple family households (18.0%) and 905 of the single-parent households (31.2%) are living below the poverty level. Within the married-couple family households, those with 3 or 4 children have the highest poverty rate, with 230 households (28.7%) falling below the poverty line. Among the single-parent households, those with 3 or 4 children have the highest poverty rate, with 250 household (69.3%) living below poverty.
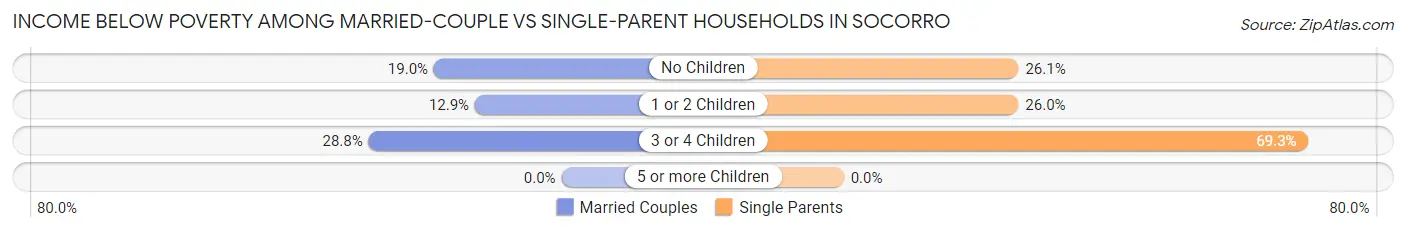
| Children | Married-Couple Families | Single-Parent Households |
| No Children | 550 (19.0%) | 279 (26.1%) |
| 1 or 2 Children | 291 (12.9%) | 376 (26.0%) |
| 3 or 4 Children | 230 (28.7%) | 250 (69.3%) |
| 5 or more Children | 0 (0.0%) | 0 (0.0%) |
| Total | 1,071 (18.0%) | 905 (31.2%) |
Race in Socorro
The most populous races in Socorro are Hispanic or Latino (34,398 | 97.1%), White / Caucasian (17,913 | 50.6%), and Two or more Races (10,923 | 30.8%).
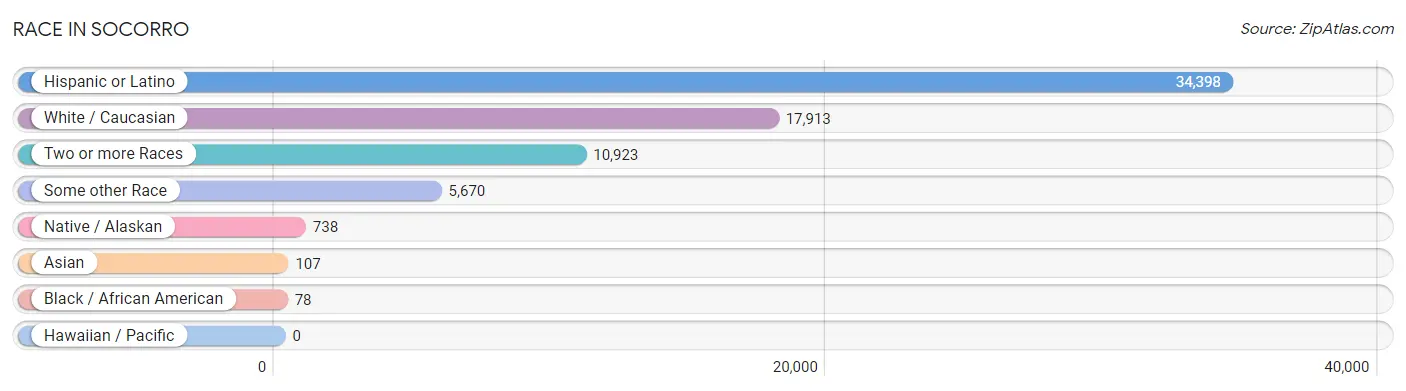
| Race | # Population | % Population |
| Asian | 107 | 0.3% |
| Black / African American | 78 | 0.2% |
| Hawaiian / Pacific | 0 | 0.0% |
| Hispanic or Latino | 34,398 | 97.1% |
| Native / Alaskan | 738 | 2.1% |
| White / Caucasian | 17,913 | 50.6% |
| Two or more Races | 10,923 | 30.8% |
| Some other Race | 5,670 | 16.0% |
| Total | 35,429 | 100.0% |
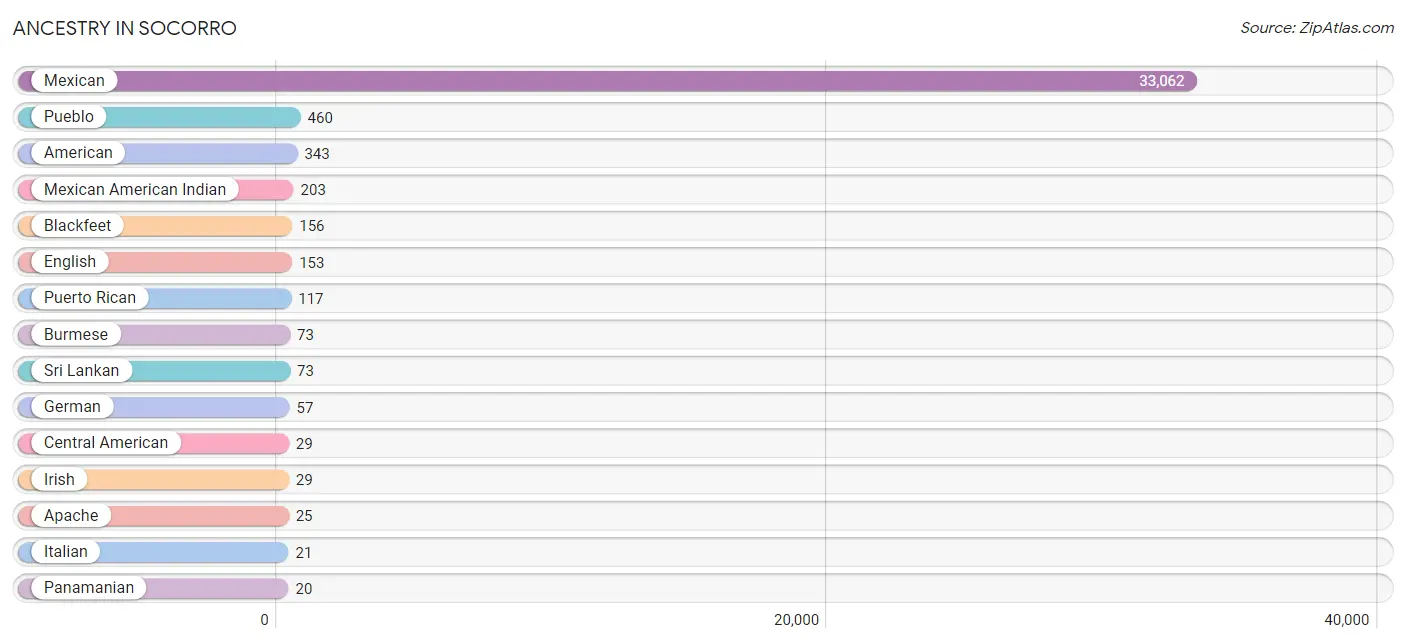
Ancestry in Socorro
The most populous ancestries reported in Socorro are Mexican (33,062 | 93.3%), Pueblo (460 | 1.3%), American (343 | 1.0%), Mexican American Indian (203 | 0.6%), and Blackfeet (156 | 0.4%), together accounting for 96.6% of all Socorro residents.
| Ancestry | # Population | % Population |
| American | 343 | 1.0% |
| Apache | 25 | 0.1% |
| Bhutanese | 4 | 0.0% |
| Blackfeet | 156 | 0.4% |
| Burmese | 73 | 0.2% |
| Central American | 29 | 0.1% |
| Cuban | 19 | 0.1% |
| English | 153 | 0.4% |
| European | 15 | 0.0% |
| Filipino | 11 | 0.0% |
| German | 57 | 0.2% |
| Guatemalan | 9 | 0.0% |
| Indian (Asian) | 11 | 0.0% |
| Irish | 29 | 0.1% |
| Italian | 21 | 0.1% |
| Korean | 8 | 0.0% |
| Mexican | 33,062 | 93.3% |
| Mexican American Indian | 203 | 0.6% |
| Navajo | 6 | 0.0% |
| Pakistani | 1 | 0.0% |
| Panamanian | 20 | 0.1% |
| Peruvian | 12 | 0.0% |
| Polish | 1 | 0.0% |
| Pueblo | 460 | 1.3% |
| Puerto Rican | 117 | 0.3% |
| South American | 12 | 0.0% |
| Spaniard | 15 | 0.0% |
| Sri Lankan | 73 | 0.2% |
| Thai | 15 | 0.0% |
| Welsh | 15 | 0.0% | View All 30 Rows |
Immigrants in Socorro
The most numerous immigrant groups reported in Socorro came from Central America (11,565 | 32.6%), Latin America (11,565 | 32.6%), Mexico (11,517 | 32.5%), Asia (93 | 0.3%), and South Eastern Asia (73 | 0.2%), together accounting for 98.3% of all Socorro residents.
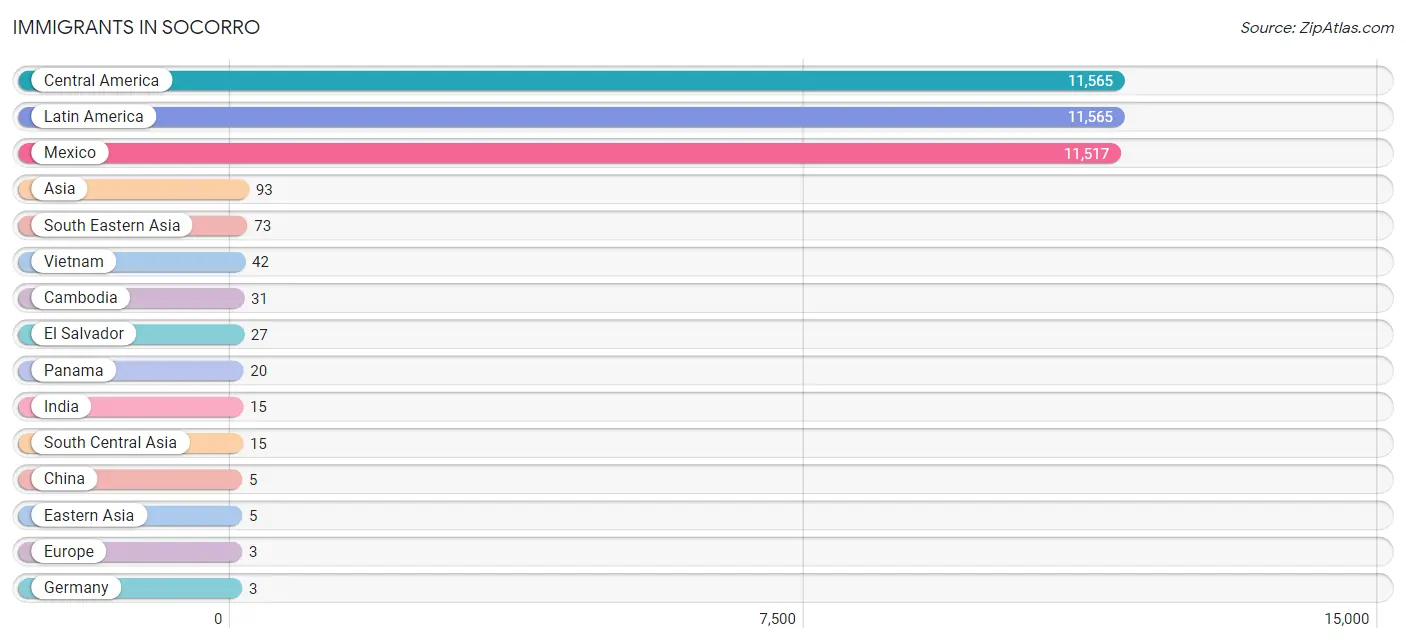
| Immigration Origin | # Population | % Population |
| Asia | 93 | 0.3% |
| Cambodia | 31 | 0.1% |
| Central America | 11,565 | 32.6% |
| China | 5 | 0.0% |
| Eastern Asia | 5 | 0.0% |
| El Salvador | 27 | 0.1% |
| Europe | 3 | 0.0% |
| Germany | 3 | 0.0% |
| Guatemala | 1 | 0.0% |
| India | 15 | 0.0% |
| Latin America | 11,565 | 32.6% |
| Mexico | 11,517 | 32.5% |
| Panama | 20 | 0.1% |
| South Central Asia | 15 | 0.0% |
| South Eastern Asia | 73 | 0.2% |
| Vietnam | 42 | 0.1% |
| Western Europe | 3 | 0.0% | View All 17 Rows |
Sex and Age in Socorro
Sex and Age in Socorro
The most populous age groups in Socorro are 15 to 19 Years (1,546 | 9.4%) for men and 15 to 19 Years (1,912 | 10.0%) for women.
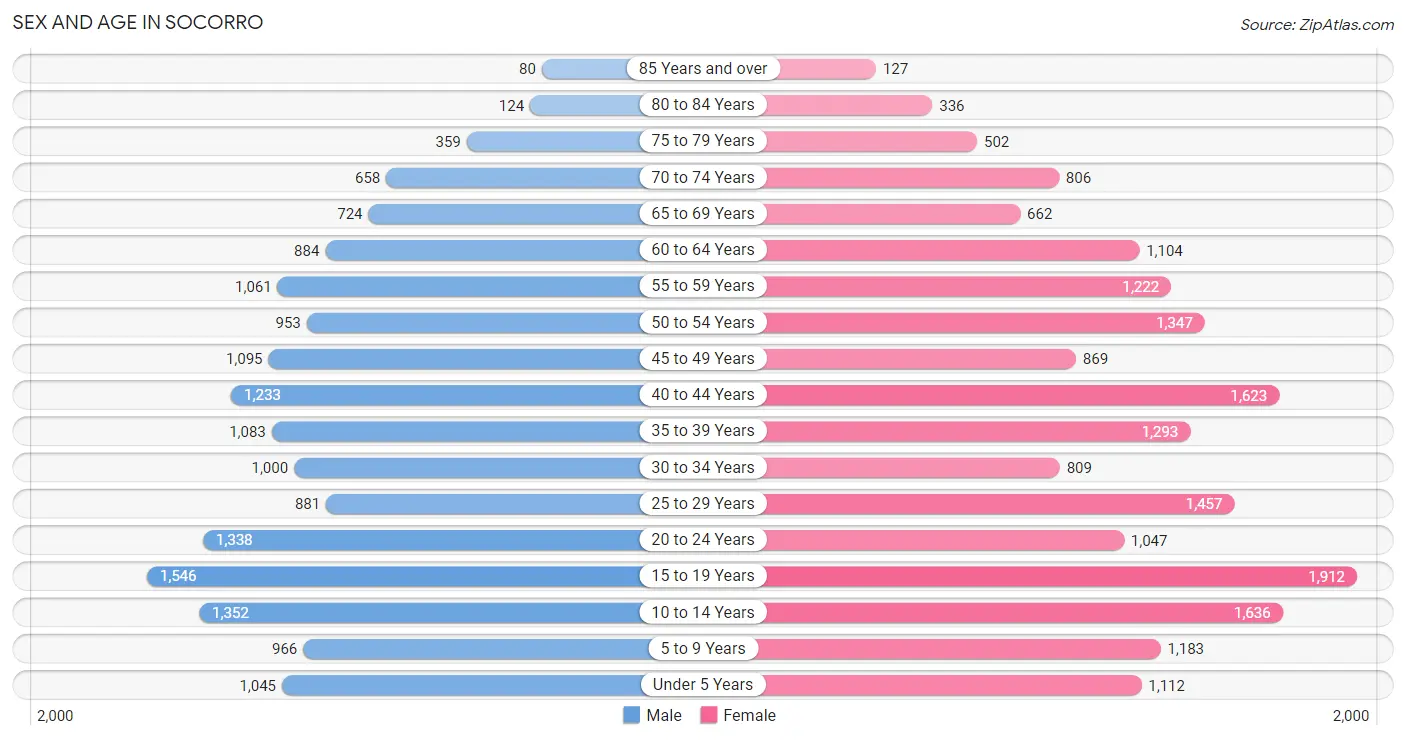
| Age Bracket | Male | Female |
| Under 5 Years | 1,045 (6.4%) | 1,112 (5.8%) |
| 5 to 9 Years | 966 (5.9%) | 1,183 (6.2%) |
| 10 to 14 Years | 1,352 (8.3%) | 1,636 (8.6%) |
| 15 to 19 Years | 1,546 (9.4%) | 1,912 (10.0%) |
| 20 to 24 Years | 1,338 (8.2%) | 1,047 (5.5%) |
| 25 to 29 Years | 881 (5.4%) | 1,457 (7.6%) |
| 30 to 34 Years | 1,000 (6.1%) | 809 (4.3%) |
| 35 to 39 Years | 1,083 (6.6%) | 1,293 (6.8%) |
| 40 to 44 Years | 1,233 (7.5%) | 1,623 (8.5%) |
| 45 to 49 Years | 1,095 (6.7%) | 869 (4.6%) |
| 50 to 54 Years | 953 (5.8%) | 1,347 (7.1%) |
| 55 to 59 Years | 1,061 (6.5%) | 1,222 (6.4%) |
| 60 to 64 Years | 884 (5.4%) | 1,104 (5.8%) |
| 65 to 69 Years | 724 (4.4%) | 662 (3.5%) |
| 70 to 74 Years | 658 (4.0%) | 806 (4.2%) |
| 75 to 79 Years | 359 (2.2%) | 502 (2.6%) |
| 80 to 84 Years | 124 (0.8%) | 336 (1.8%) |
| 85 Years and over | 80 (0.5%) | 127 (0.7%) |
| Total | 16,382 (100.0%) | 19,047 (100.0%) |
Families and Households in Socorro
Median Family Size in Socorro
The median family size in Socorro is 3.59 persons per family, with married-couple families (5,959 | 67.2%) accounting for the largest median family size of 3.7 persons per family. On the other hand, single male/father families (632 | 7.1%) represent the smallest median family size with 3.35 persons per family.
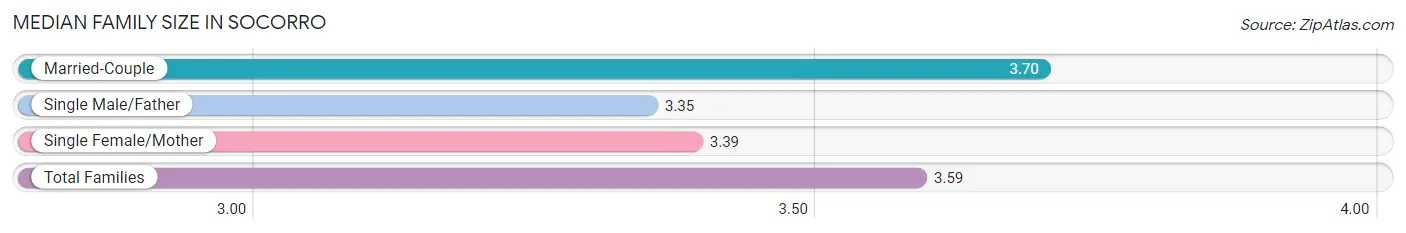
| Family Type | # Families | Family Size |
| Married-Couple | 5,959 (67.2%) | 3.70 |
| Single Male/Father | 632 (7.1%) | 3.35 |
| Single Female/Mother | 2,272 (25.6%) | 3.39 |
| Total Families | 8,863 (100.0%) | 3.59 |
Median Household Size in Socorro
The median household size in Socorro is 3.18 persons per household, with married-couple households (5,959 | 53.6%) accounting for the largest median household size of 3.76 persons per household. non-family households (2,262 | 20.3%) represent the smallest median household size with 1.18 persons per household.
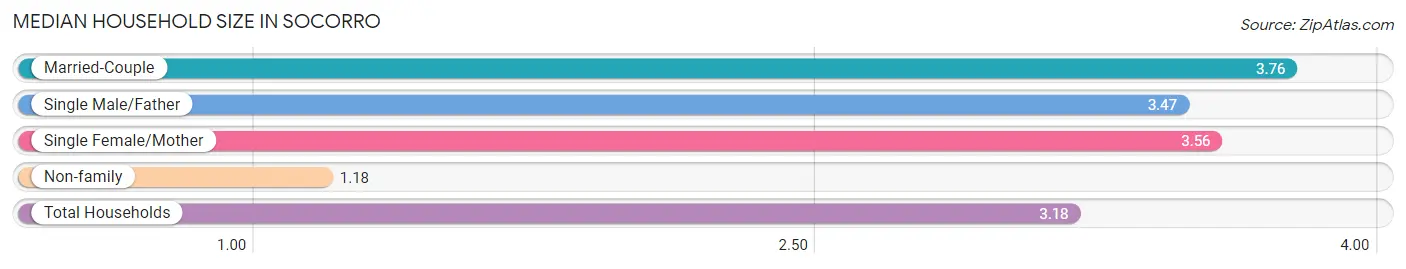
| Household Type | # Households | Household Size |
| Married-Couple | 5,959 (53.6%) | 3.76 |
| Single Male/Father | 632 (5.7%) | 3.47 |
| Single Female/Mother | 2,272 (20.4%) | 3.56 |
| Non-family | 2,262 (20.3%) | 1.18 |
| Total Households | 11,125 (100.0%) | 3.18 |
Household Size by Marriage Status in Socorro
Out of a total of 11,125 households in Socorro, 8,863 (79.7%) are family households, while 2,262 (20.3%) are nonfamily households. The most numerous type of family households are 2-person households, comprising 2,609, and the most common type of nonfamily households are 1-person households, comprising 1,925.
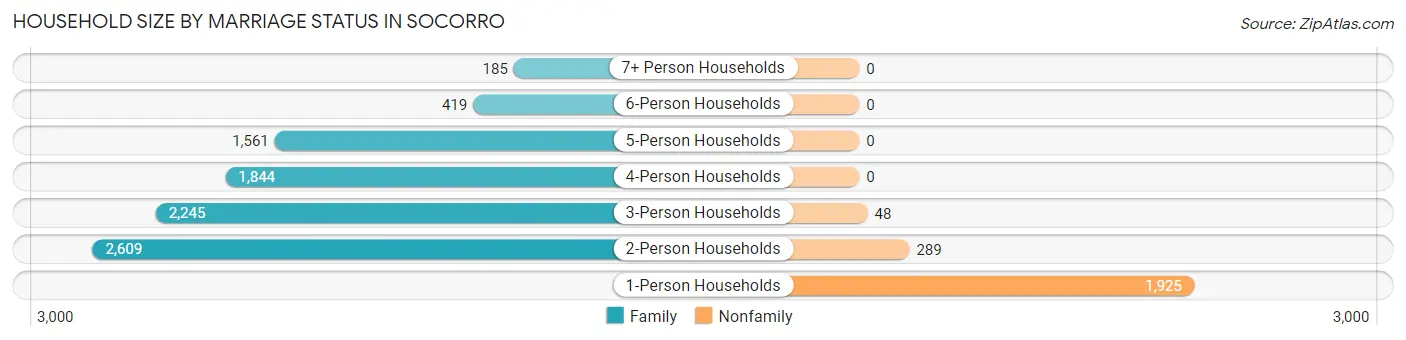
| Household Size | Family Households | Nonfamily Households |
| 1-Person Households | - | 1,925 (17.3%) |
| 2-Person Households | 2,609 (23.4%) | 289 (2.6%) |
| 3-Person Households | 2,245 (20.2%) | 48 (0.4%) |
| 4-Person Households | 1,844 (16.6%) | 0 (0.0%) |
| 5-Person Households | 1,561 (14.0%) | 0 (0.0%) |
| 6-Person Households | 419 (3.8%) | 0 (0.0%) |
| 7+ Person Households | 185 (1.7%) | 0 (0.0%) |
| Total | 8,863 (79.7%) | 2,262 (20.3%) |
Female Fertility in Socorro
Fertility by Age in Socorro
Average fertility rate in Socorro is 41.0 births per 1,000 women. Women in the age bracket of 20 to 34 years have the highest fertility rate with 86.0 births per 1,000 women. Women in the age bracket of 20 to 34 years acount for 74.6% of all women with births.
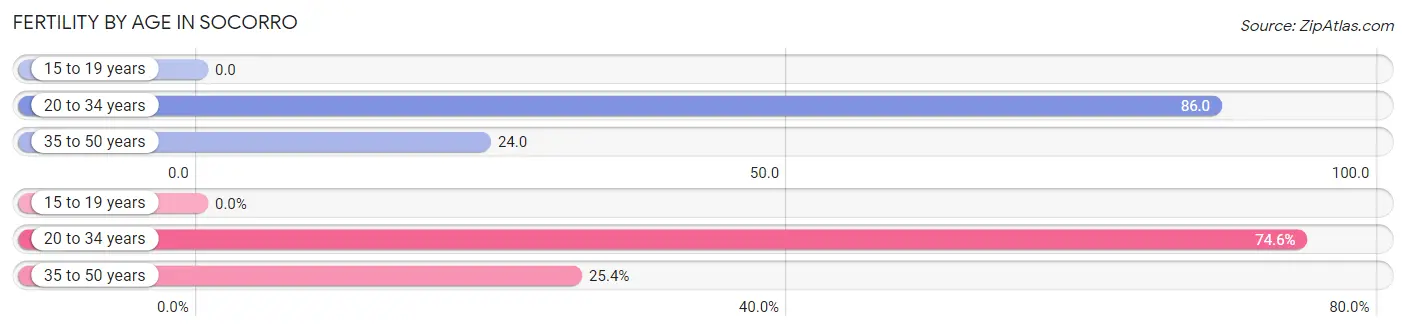
| Age Bracket | Women with Births | Births / 1,000 Women |
| 15 to 19 years | 0 (0.0%) | 0.0 |
| 20 to 34 years | 285 (74.6%) | 86.0 |
| 35 to 50 years | 97 (25.4%) | 24.0 |
| Total | 382 (100.0%) | 41.0 |
Fertility by Age by Marriage Status in Socorro
62.0% of women with births (382) in Socorro are married. The highest percentage of unmarried women with births falls into 20 to 34 years age bracket with 42.1% of them unmarried at the time of birth, while the lowest percentage of unmarried women with births belong to 35 to 50 years age bracket with 25.8% of them unmarried.
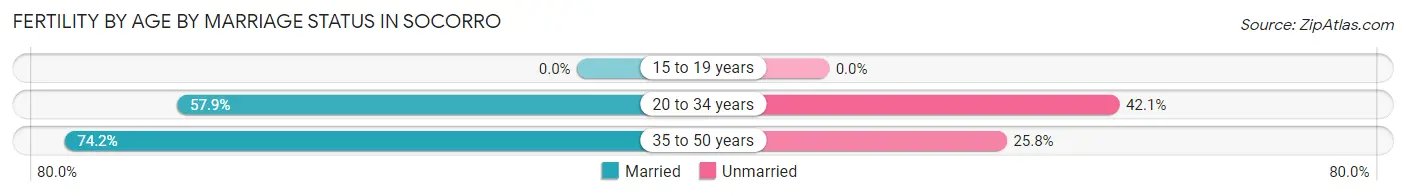
| Age Bracket | Married | Unmarried |
| 15 to 19 years | 0 (0.0%) | 0 (0.0%) |
| 20 to 34 years | 165 (57.9%) | 120 (42.1%) |
| 35 to 50 years | 72 (74.2%) | 25 (25.8%) |
| Total | 237 (62.0%) | 145 (38.0%) |
Fertility by Education in Socorro
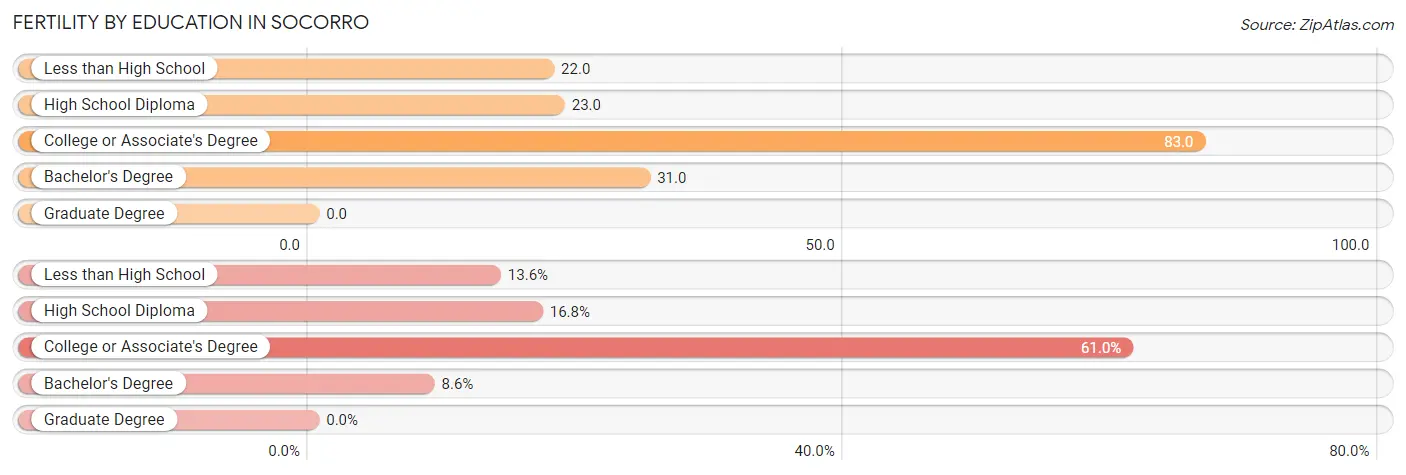
| Educational Attainment | Women with Births | Births / 1,000 Women |
| Less than High School | 52 (13.6%) | 22.0 |
| High School Diploma | 64 (16.8%) | 23.0 |
| College or Associate's Degree | 233 (61.0%) | 83.0 |
| Bachelor's Degree | 33 (8.6%) | 31.0 |
| Graduate Degree | 0 (0.0%) | 0.0 |
| Total | 382 (100.0%) | 41.0 |
Fertility by Education by Marriage Status in Socorro
38.0% of women with births in Socorro are unmarried. Women with the educational attainment of less than high school are most likely to be married with 100.0% of them married at childbirth, while women with the educational attainment of high school diploma are least likely to be married with 100.0% of them unmarried at childbirth.
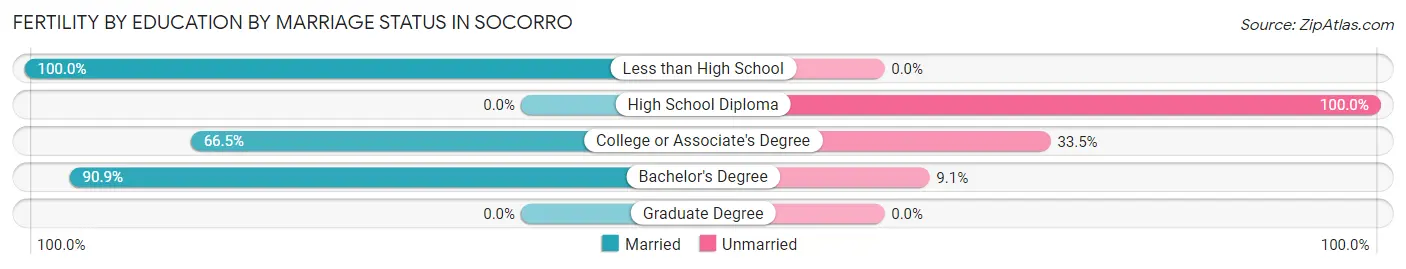
| Educational Attainment | Married | Unmarried |
| Less than High School | 52 (100.0%) | 0 (0.0%) |
| High School Diploma | 0 (0.0%) | 64 (100.0%) |
| College or Associate's Degree | 155 (66.5%) | 78 (33.5%) |
| Bachelor's Degree | 30 (90.9%) | 3 (9.1%) |
| Graduate Degree | 0 (0.0%) | 0 (0.0%) |
| Total | 237 (62.0%) | 145 (38.0%) |
Employment Characteristics in Socorro
Employment by Class of Employer in Socorro
Among the 14,591 employed individuals in Socorro, private company employees (10,130 | 69.4%), local government employees (1,659 | 11.4%), and self-employed (not incorporated) (968 | 6.6%) make up the most common classes of employment.
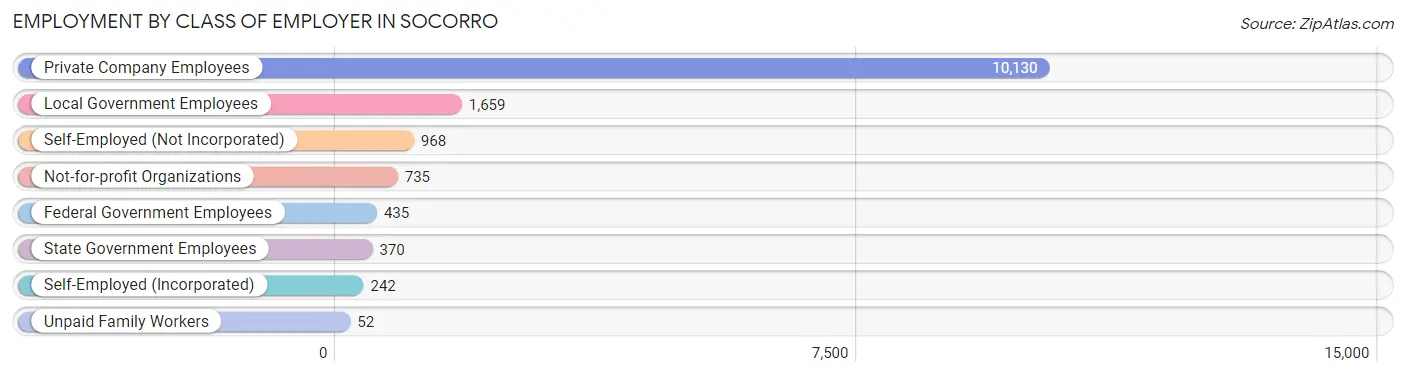
| Employer Class | # Employees | % Employees |
| Private Company Employees | 10,130 | 69.4% |
| Self-Employed (Incorporated) | 242 | 1.7% |
| Self-Employed (Not Incorporated) | 968 | 6.6% |
| Not-for-profit Organizations | 735 | 5.0% |
| Local Government Employees | 1,659 | 11.4% |
| State Government Employees | 370 | 2.5% |
| Federal Government Employees | 435 | 3.0% |
| Unpaid Family Workers | 52 | 0.4% |
| Total | 14,591 | 100.0% |
Employment Status by Age in Socorro
According to the labor force statistics for Socorro, out of the total population over 16 years of age (27,421), 59.9% or 16,425 individuals are in the labor force, with 5.6% or 920 of them unemployed. The age group with the highest labor force participation rate is 35 to 44 years, with 84.1% or 4,400 individuals in the labor force. Within the labor force, the 65 to 74 years age range has the highest percentage of unemployed individuals, with 16.1% or 54 of them being unemployed.
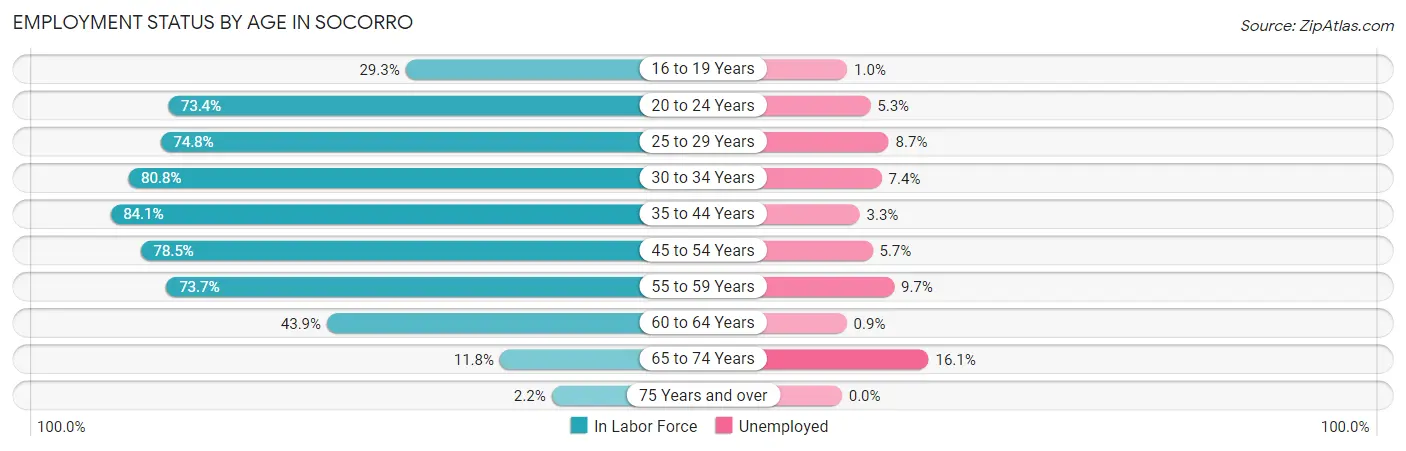
| Age Bracket | In Labor Force | Unemployed |
| 16 to 19 Years | 804 (29.3%) | 8 (1.0%) |
| 20 to 24 Years | 1,751 (73.4%) | 93 (5.3%) |
| 25 to 29 Years | 1,749 (74.8%) | 152 (8.7%) |
| 30 to 34 Years | 1,462 (80.8%) | 108 (7.4%) |
| 35 to 44 Years | 4,400 (84.1%) | 145 (3.3%) |
| 45 to 54 Years | 3,347 (78.5%) | 191 (5.7%) |
| 55 to 59 Years | 1,683 (73.7%) | 163 (9.7%) |
| 60 to 64 Years | 873 (43.9%) | 8 (0.9%) |
| 65 to 74 Years | 336 (11.8%) | 54 (16.1%) |
| 75 Years and over | 34 (2.2%) | 0 (0.0%) |
| Total | 16,425 (59.9%) | 920 (5.6%) |
Employment Status by Educational Attainment in Socorro
According to labor force statistics for Socorro, 75.4% of individuals (13,507) out of the total population between 25 and 64 years of age (17,914) are in the labor force, with 5.7% or 770 of them being unemployed. The group with the highest labor force participation rate are those with the educational attainment of bachelor's degree or higher, with 85.5% or 1,825 individuals in the labor force. Within the labor force, individuals with high school diploma education have the highest percentage of unemployment, with 8.8% or 366 of them being unemployed.
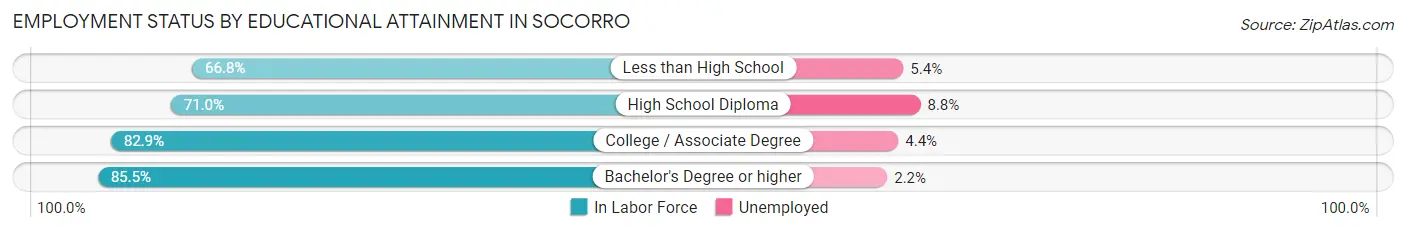
| Educational Attainment | In Labor Force | Unemployed |
| Less than High School | 2,897 (66.8%) | 234 (5.4%) |
| High School Diploma | 4,159 (71.0%) | 516 (8.8%) |
| College / Associate Degree | 4,630 (82.9%) | 246 (4.4%) |
| Bachelor's Degree or higher | 1,825 (85.5%) | 47 (2.2%) |
| Total | 13,507 (75.4%) | 1,021 (5.7%) |
Employment Occupations by Sex in Socorro
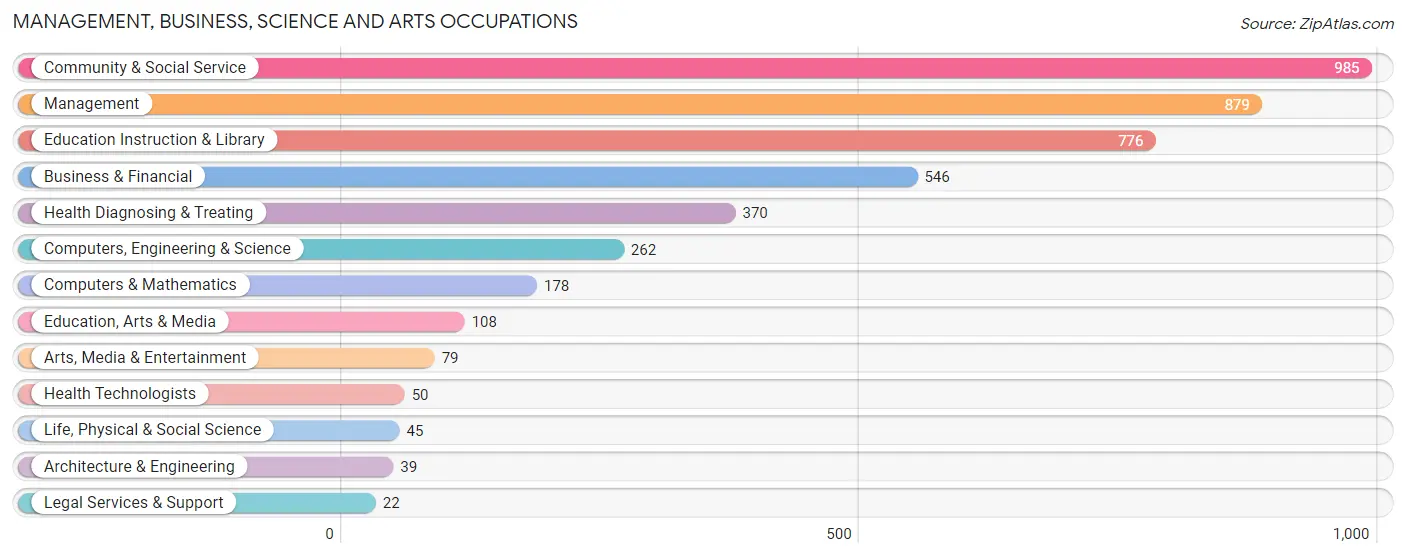
Management, Business, Science and Arts Occupations
The most common Management, Business, Science and Arts occupations in Socorro are Community & Social Service (985 | 6.4%), Management (879 | 5.7%), Education Instruction & Library (776 | 5.0%), Business & Financial (546 | 3.5%), and Health Diagnosing & Treating (370 | 2.4%).
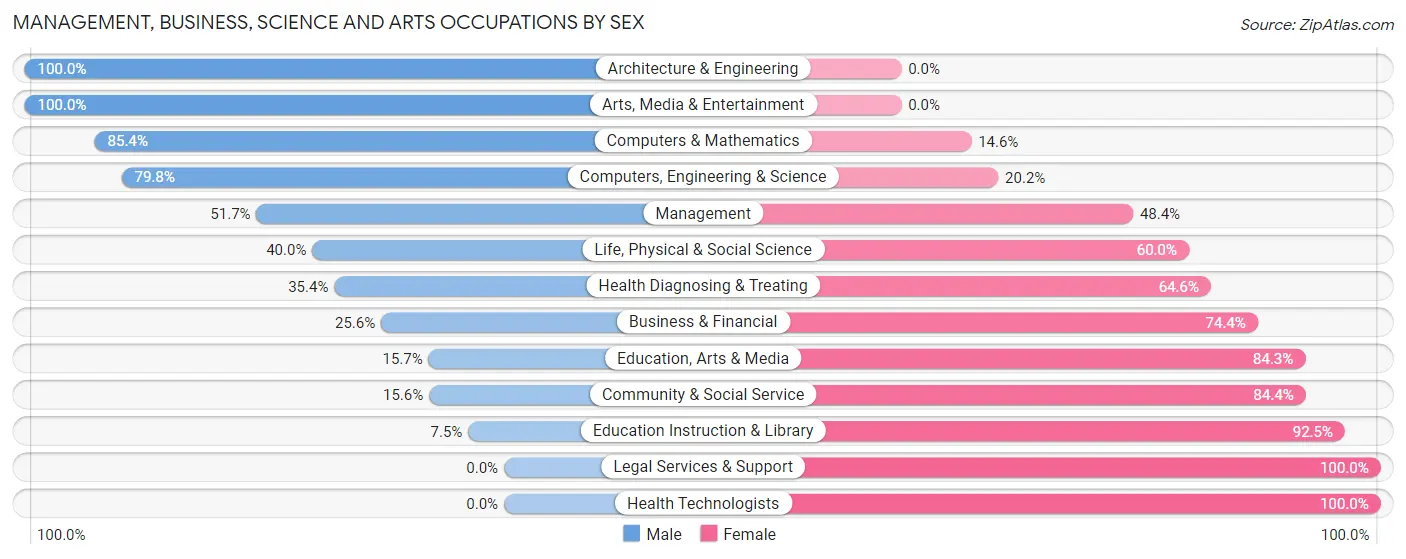
Management, Business, Science and Arts Occupations by Sex
Within the Management, Business, Science and Arts occupations in Socorro, the most male-oriented occupations are Architecture & Engineering (100.0%), Arts, Media & Entertainment (100.0%), and Computers & Mathematics (85.4%), while the most female-oriented occupations are Legal Services & Support (100.0%), Health Technologists (100.0%), and Education Instruction & Library (92.5%).
| Occupation | Male | Female |
| Management | 454 (51.6%) | 425 (48.3%) |
| Business & Financial | 140 (25.6%) | 406 (74.4%) |
| Computers, Engineering & Science | 209 (79.8%) | 53 (20.2%) |
| Computers & Mathematics | 152 (85.4%) | 26 (14.6%) |
| Architecture & Engineering | 39 (100.0%) | 0 (0.0%) |
| Life, Physical & Social Science | 18 (40.0%) | 27 (60.0%) |
| Community & Social Service | 154 (15.6%) | 831 (84.4%) |
| Education, Arts & Media | 17 (15.7%) | 91 (84.3%) |
| Legal Services & Support | 0 (0.0%) | 22 (100.0%) |
| Education Instruction & Library | 58 (7.5%) | 718 (92.5%) |
| Arts, Media & Entertainment | 79 (100.0%) | 0 (0.0%) |
| Health Diagnosing & Treating | 131 (35.4%) | 239 (64.6%) |
| Health Technologists | 0 (0.0%) | 50 (100.0%) |
| Total (Category) | 1,088 (35.8%) | 1,954 (64.2%) |
| Total (Overall) | 8,104 (52.3%) | 7,381 (47.7%) |
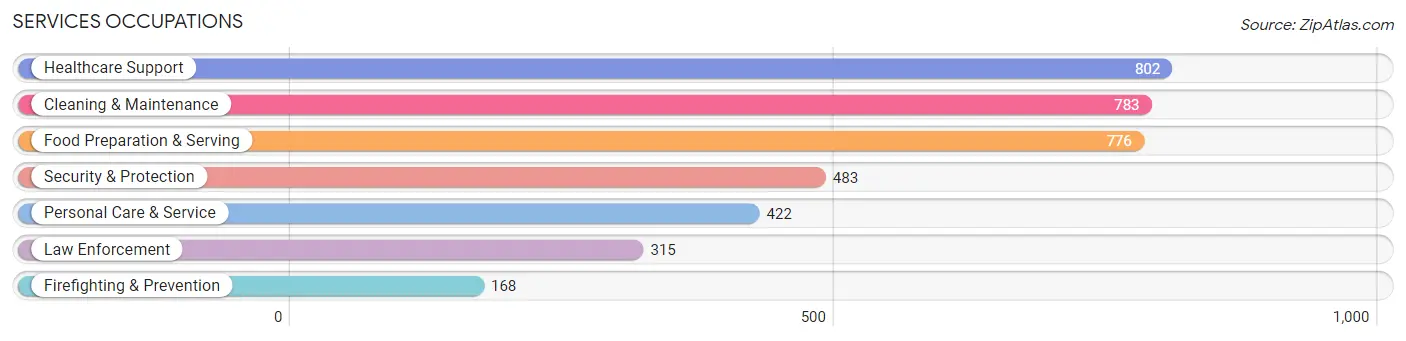
Services Occupations
The most common Services occupations in Socorro are Healthcare Support (802 | 5.2%), Cleaning & Maintenance (783 | 5.1%), Food Preparation & Serving (776 | 5.0%), Security & Protection (483 | 3.1%), and Personal Care & Service (422 | 2.7%).
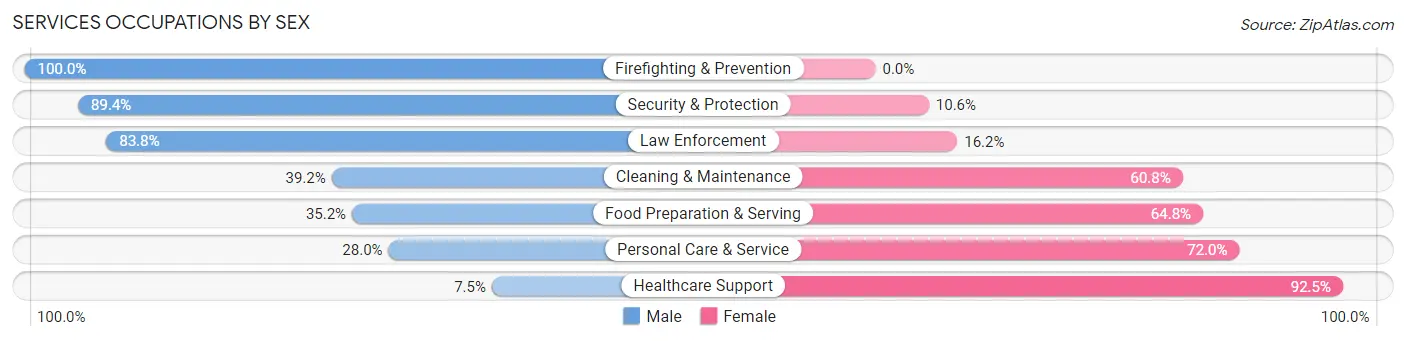
Services Occupations by Sex
Within the Services occupations in Socorro, the most male-oriented occupations are Firefighting & Prevention (100.0%), Security & Protection (89.4%), and Law Enforcement (83.8%), while the most female-oriented occupations are Healthcare Support (92.5%), Personal Care & Service (72.0%), and Food Preparation & Serving (64.8%).
| Occupation | Male | Female |
| Healthcare Support | 60 (7.5%) | 742 (92.5%) |
| Security & Protection | 432 (89.4%) | 51 (10.6%) |
| Firefighting & Prevention | 168 (100.0%) | 0 (0.0%) |
| Law Enforcement | 264 (83.8%) | 51 (16.2%) |
| Food Preparation & Serving | 273 (35.2%) | 503 (64.8%) |
| Cleaning & Maintenance | 307 (39.2%) | 476 (60.8%) |
| Personal Care & Service | 118 (28.0%) | 304 (72.0%) |
| Total (Category) | 1,190 (36.4%) | 2,076 (63.6%) |
| Total (Overall) | 8,104 (52.3%) | 7,381 (47.7%) |
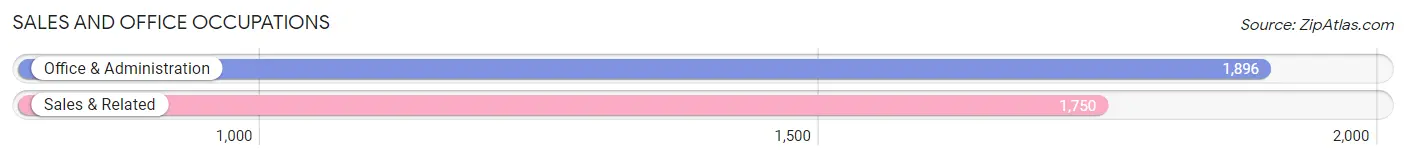
Sales and Office Occupations
The most common Sales and Office occupations in Socorro are Office & Administration (1,896 | 12.2%), and Sales & Related (1,750 | 11.3%).
Sales and Office Occupations by Sex
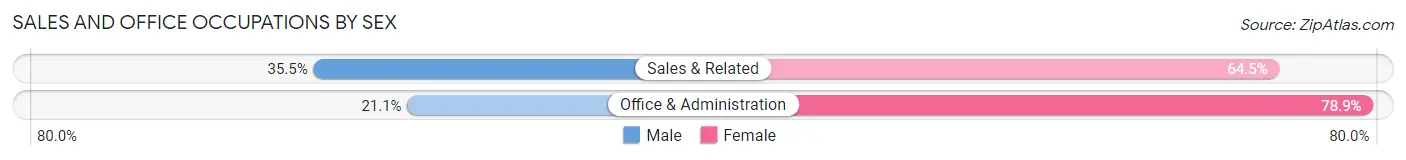
| Occupation | Male | Female |
| Sales & Related | 622 (35.5%) | 1,128 (64.5%) |
| Office & Administration | 400 (21.1%) | 1,496 (78.9%) |
| Total (Category) | 1,022 (28.0%) | 2,624 (72.0%) |
| Total (Overall) | 8,104 (52.3%) | 7,381 (47.7%) |
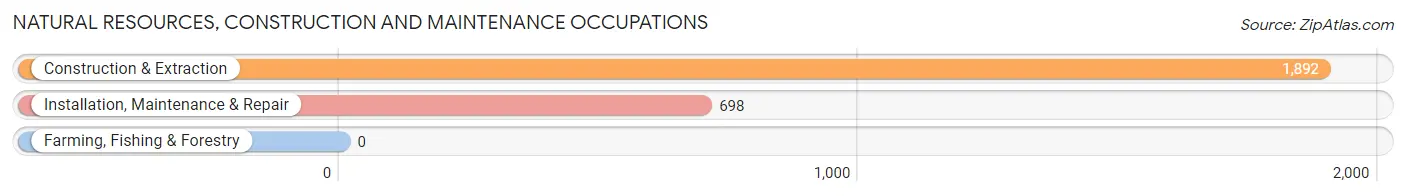
Natural Resources, Construction and Maintenance Occupations
The most common Natural Resources, Construction and Maintenance occupations in Socorro are Construction & Extraction (1,892 | 12.2%), and Installation, Maintenance & Repair (698 | 4.5%).
Natural Resources, Construction and Maintenance Occupations by Sex
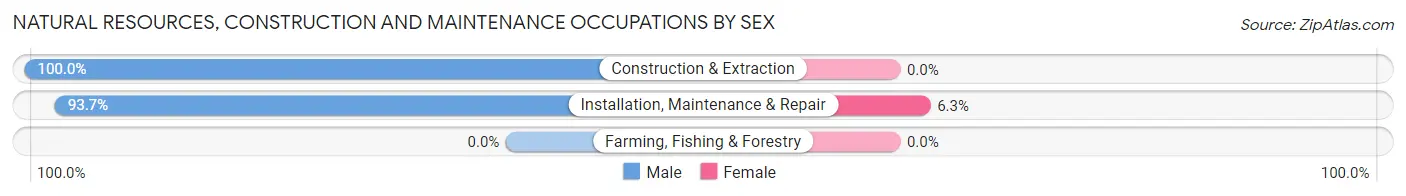
| Occupation | Male | Female |
| Farming, Fishing & Forestry | 0 (0.0%) | 0 (0.0%) |
| Construction & Extraction | 1,892 (100.0%) | 0 (0.0%) |
| Installation, Maintenance & Repair | 654 (93.7%) | 44 (6.3%) |
| Total (Category) | 2,546 (98.3%) | 44 (1.7%) |
| Total (Overall) | 8,104 (52.3%) | 7,381 (47.7%) |
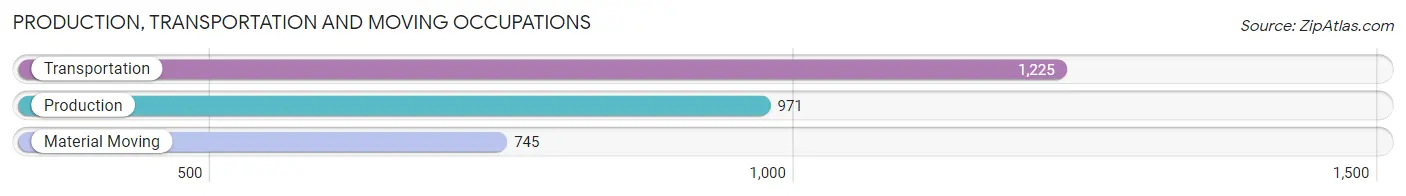
Production, Transportation and Moving Occupations
The most common Production, Transportation and Moving occupations in Socorro are Transportation (1,225 | 7.9%), Production (971 | 6.3%), and Material Moving (745 | 4.8%).
Production, Transportation and Moving Occupations by Sex
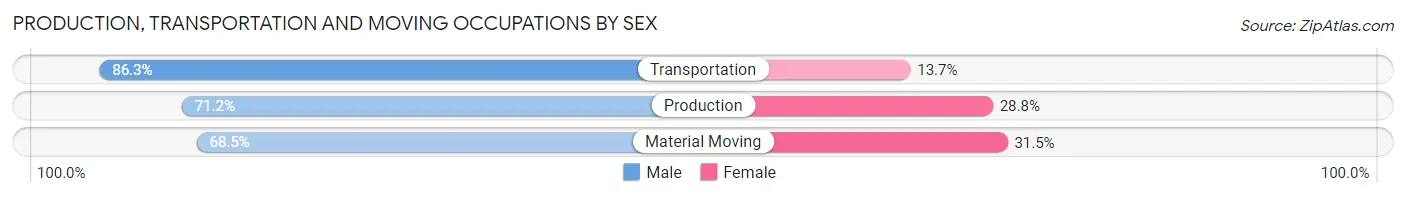
| Occupation | Male | Female |
| Production | 691 (71.2%) | 280 (28.8%) |
| Transportation | 1,057 (86.3%) | 168 (13.7%) |
| Material Moving | 510 (68.5%) | 235 (31.5%) |
| Total (Category) | 2,258 (76.8%) | 683 (23.2%) |
| Total (Overall) | 8,104 (52.3%) | 7,381 (47.7%) |
Employment Industries by Sex in Socorro
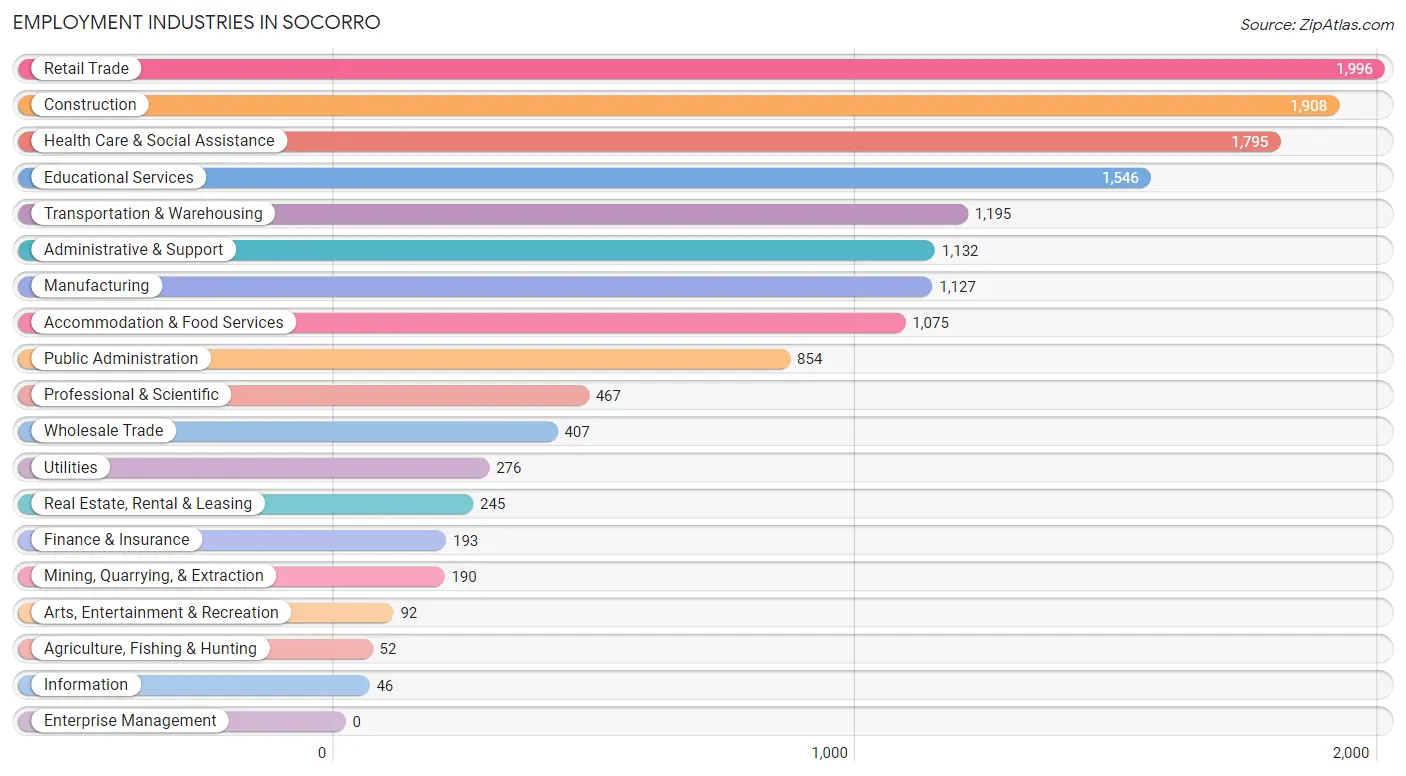
Employment Industries in Socorro
The major employment industries in Socorro include Retail Trade (1,996 | 12.9%), Construction (1,908 | 12.3%), Health Care & Social Assistance (1,795 | 11.6%), Educational Services (1,546 | 10.0%), and Transportation & Warehousing (1,195 | 7.7%).
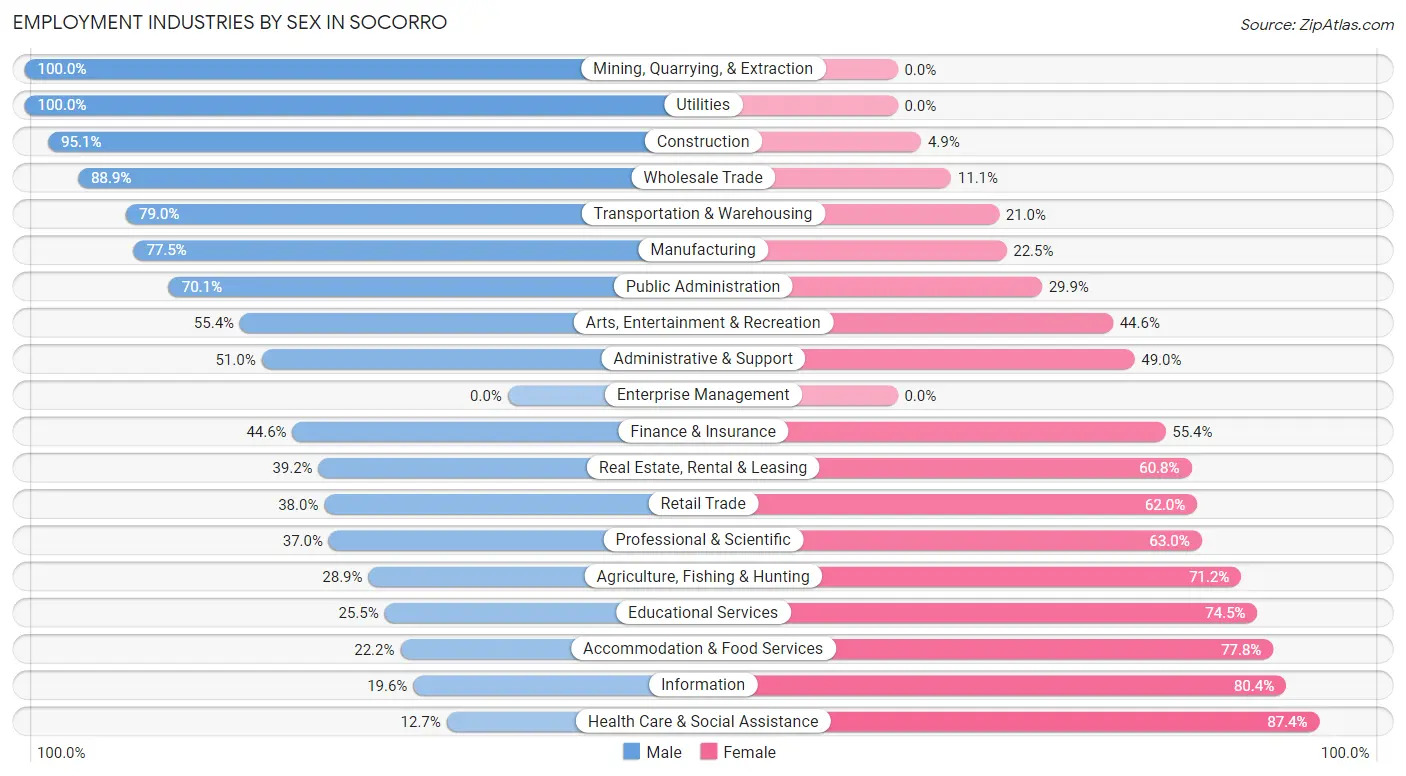
Employment Industries by Sex in Socorro
The Socorro industries that see more men than women are Mining, Quarrying, & Extraction (100.0%), Utilities (100.0%), and Construction (95.1%), whereas the industries that tend to have a higher number of women are Health Care & Social Assistance (87.4%), Information (80.4%), and Accommodation & Food Services (77.8%).
| Industry | Male | Female |
| Agriculture, Fishing & Hunting | 15 (28.8%) | 37 (71.2%) |
| Mining, Quarrying, & Extraction | 190 (100.0%) | 0 (0.0%) |
| Construction | 1,815 (95.1%) | 93 (4.9%) |
| Manufacturing | 873 (77.5%) | 254 (22.5%) |
| Wholesale Trade | 362 (88.9%) | 45 (11.1%) |
| Retail Trade | 758 (38.0%) | 1,238 (62.0%) |
| Transportation & Warehousing | 944 (79.0%) | 251 (21.0%) |
| Utilities | 276 (100.0%) | 0 (0.0%) |
| Information | 9 (19.6%) | 37 (80.4%) |
| Finance & Insurance | 86 (44.6%) | 107 (55.4%) |
| Real Estate, Rental & Leasing | 96 (39.2%) | 149 (60.8%) |
| Professional & Scientific | 173 (37.0%) | 294 (63.0%) |
| Enterprise Management | 0 (0.0%) | 0 (0.0%) |
| Administrative & Support | 577 (51.0%) | 555 (49.0%) |
| Educational Services | 394 (25.5%) | 1,152 (74.5%) |
| Health Care & Social Assistance | 227 (12.7%) | 1,568 (87.4%) |
| Arts, Entertainment & Recreation | 51 (55.4%) | 41 (44.6%) |
| Accommodation & Food Services | 239 (22.2%) | 836 (77.8%) |
| Public Administration | 599 (70.1%) | 255 (29.9%) |
| Total | 8,104 (52.3%) | 7,381 (47.7%) |
Education in Socorro
School Enrollment in Socorro
The most common levels of schooling among the 10,981 students in Socorro are high school (3,033 | 27.6%), college / undergraduate (2,754 | 25.1%), and middle school (2,224 | 20.3%).
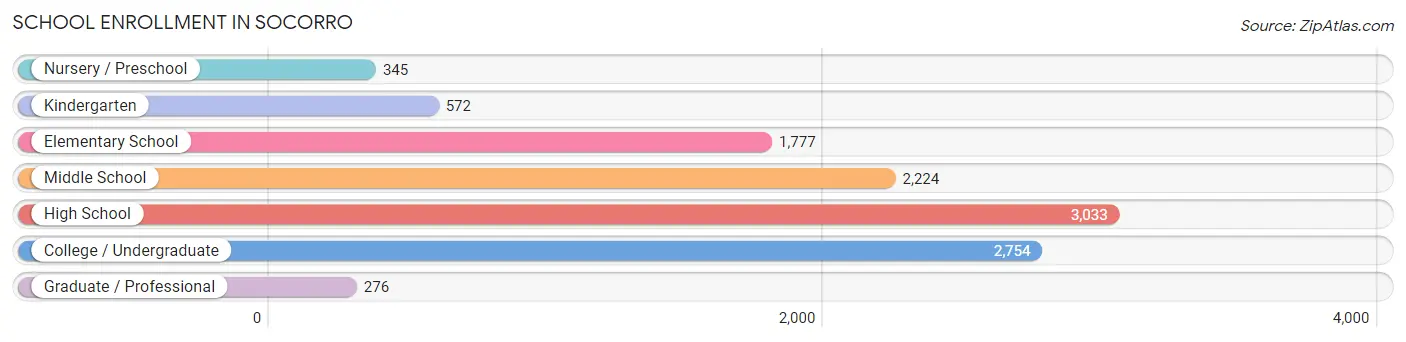
| School Level | # Students | % Students |
| Nursery / Preschool | 345 | 3.1% |
| Kindergarten | 572 | 5.2% |
| Elementary School | 1,777 | 16.2% |
| Middle School | 2,224 | 20.3% |
| High School | 3,033 | 27.6% |
| College / Undergraduate | 2,754 | 25.1% |
| Graduate / Professional | 276 | 2.5% |
| Total | 10,981 | 100.0% |
School Enrollment by Age by Funding Source in Socorro
Out of a total of 10,981 students who are enrolled in schools in Socorro, 461 (4.2%) attend a private institution, while the remaining 10,520 (95.8%) are enrolled in public schools. The age group of 35 years and over has the highest likelihood of being enrolled in private schools, with 141 (47.8% in the age bracket) enrolled. Conversely, the age group of 5 to 9 year old has the lowest likelihood of being enrolled in a private school, with 2,095 (100.0% in the age bracket) attending a public institution.
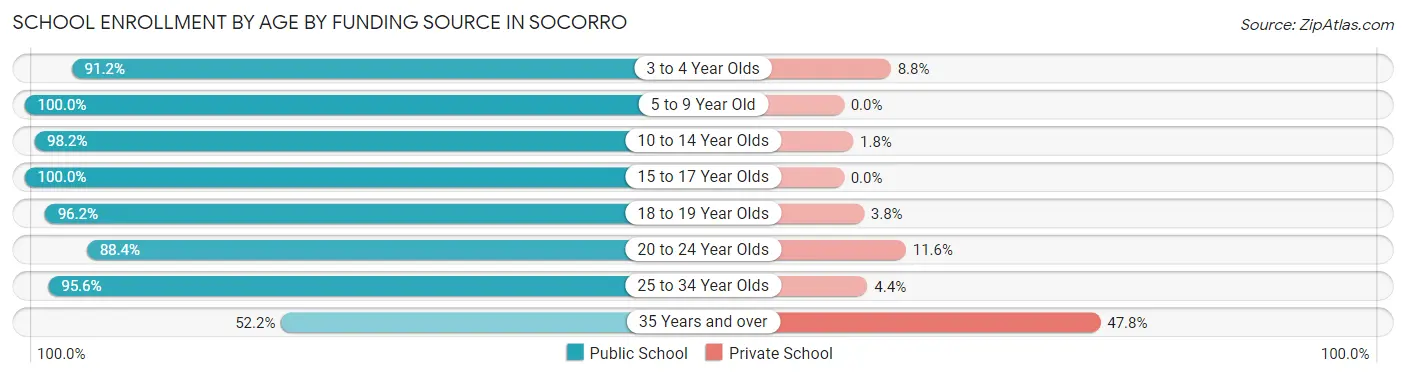
| Age Bracket | Public School | Private School |
| 3 to 4 Year Olds | 375 (91.2%) | 36 (8.8%) |
| 5 to 9 Year Old | 2,095 (100.0%) | 0 (0.0%) |
| 10 to 14 Year Olds | 2,851 (98.2%) | 51 (1.8%) |
| 15 to 17 Year Olds | 2,043 (100.0%) | 0 (0.0%) |
| 18 to 19 Year Olds | 1,075 (96.2%) | 42 (3.8%) |
| 20 to 24 Year Olds | 1,192 (88.4%) | 156 (11.6%) |
| 25 to 34 Year Olds | 736 (95.6%) | 34 (4.4%) |
| 35 Years and over | 154 (52.2%) | 141 (47.8%) |
| Total | 10,520 (95.8%) | 461 (4.2%) |
Educational Attainment by Field of Study in Socorro
Business (782 | 35.0%), education (366 | 16.4%), arts & humanities (254 | 11.4%), science & technology (155 | 6.9%), and computers & mathematics (143 | 6.4%) are the most common fields of study among 2,234 individuals in Socorro who have obtained a bachelor's degree or higher.
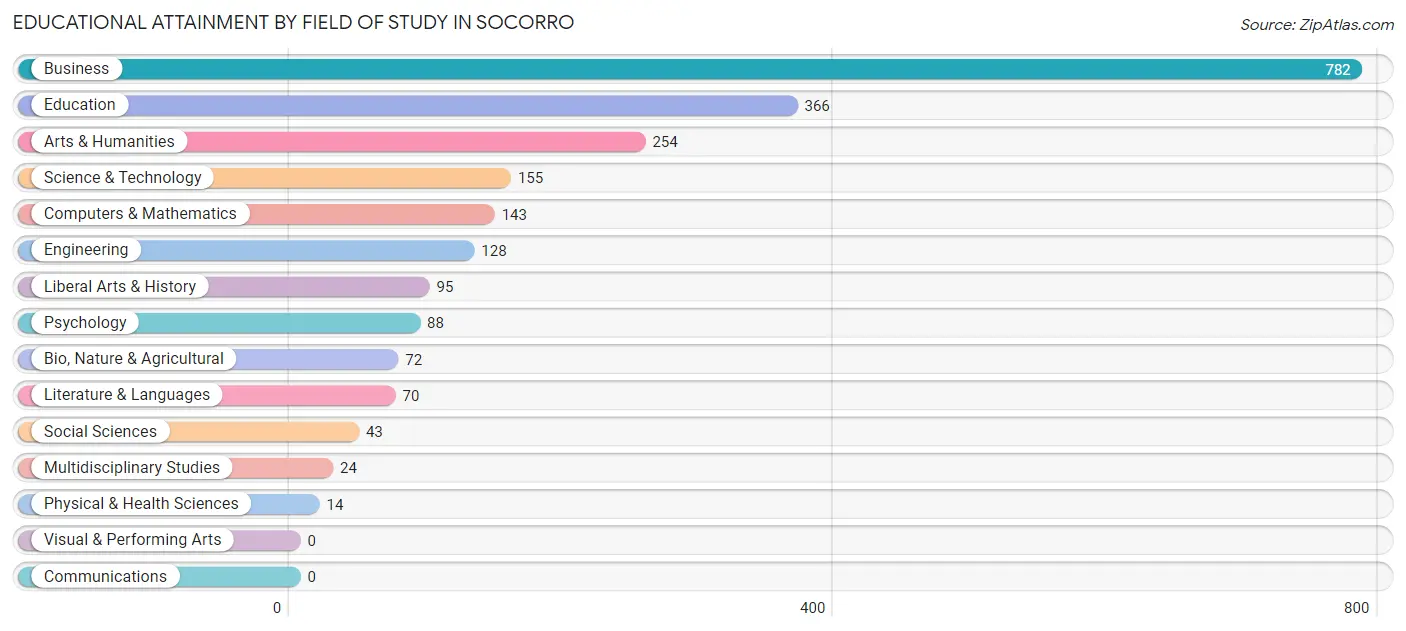
| Field of Study | # Graduates | % Graduates |
| Computers & Mathematics | 143 | 6.4% |
| Bio, Nature & Agricultural | 72 | 3.2% |
| Physical & Health Sciences | 14 | 0.6% |
| Psychology | 88 | 3.9% |
| Social Sciences | 43 | 1.9% |
| Engineering | 128 | 5.7% |
| Multidisciplinary Studies | 24 | 1.1% |
| Science & Technology | 155 | 6.9% |
| Business | 782 | 35.0% |
| Education | 366 | 16.4% |
| Literature & Languages | 70 | 3.1% |
| Liberal Arts & History | 95 | 4.3% |
| Visual & Performing Arts | 0 | 0.0% |
| Communications | 0 | 0.0% |
| Arts & Humanities | 254 | 11.4% |
| Total | 2,234 | 100.0% |
Transportation & Commute in Socorro
Vehicle Availability by Sex in Socorro
The most prevalent vehicle ownership categories in Socorro are males with 3 vehicles (2,867, accounting for 36.1%) and females with 3 vehicles (2,068, making up 43.1%).
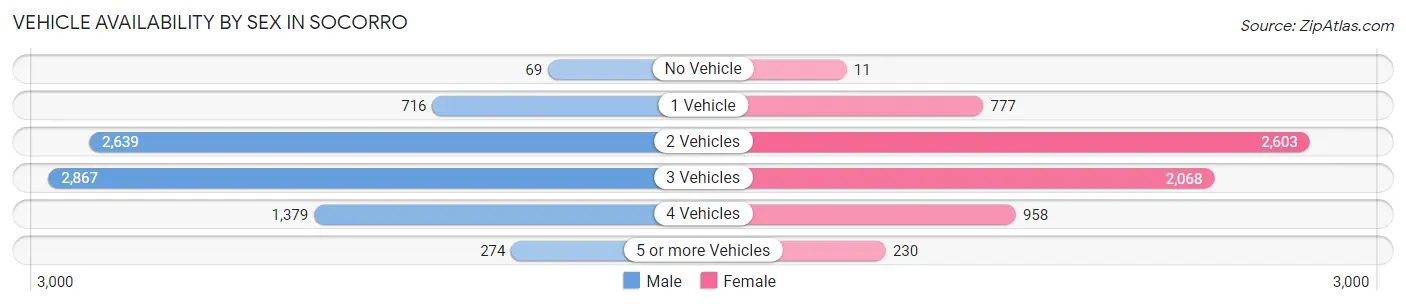
| Vehicles Available | Male | Female |
| No Vehicle | 69 (0.9%) | 11 (0.2%) |
| 1 Vehicle | 716 (9.0%) | 777 (11.7%) |
| 2 Vehicles | 2,639 (33.2%) | 2,603 (39.2%) |
| 3 Vehicles | 2,867 (36.1%) | 2,068 (31.1%) |
| 4 Vehicles | 1,379 (17.4%) | 958 (14.4%) |
| 5 or more Vehicles | 274 (3.5%) | 230 (3.5%) |
| Total | 7,944 (100.0%) | 6,647 (100.0%) |
Commute Time in Socorro
The most frequently occuring commute durations in Socorro are 20 to 24 minutes (2,696 commuters, 19.6%), 30 to 34 minutes (2,525 commuters, 18.3%), and 15 to 19 minutes (2,231 commuters, 16.2%).
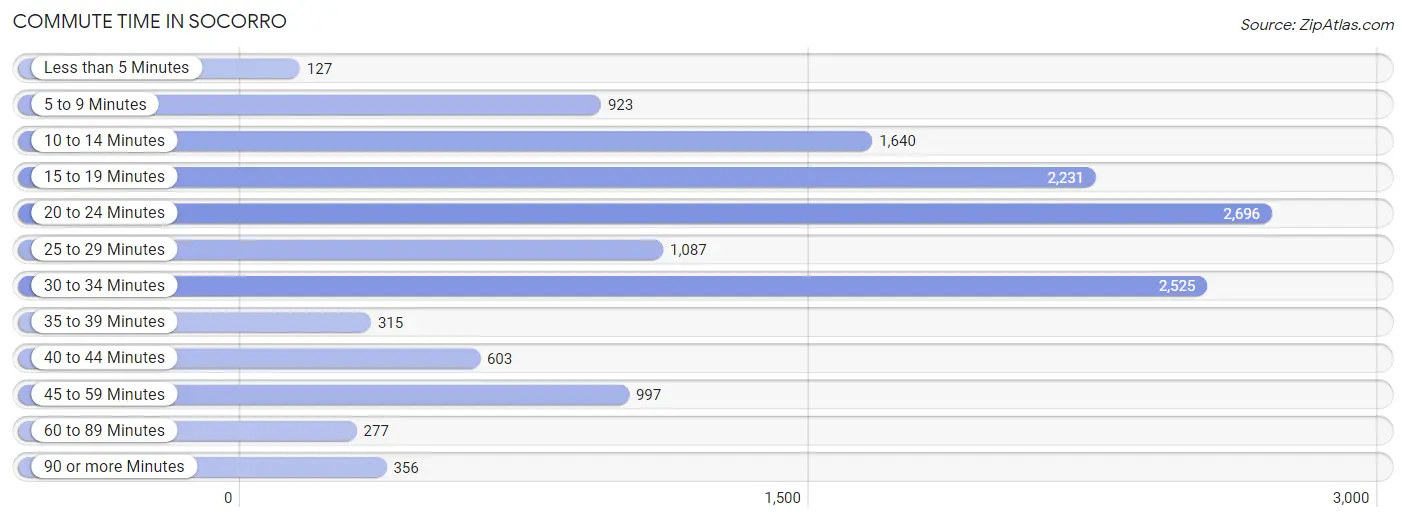
| Commute Time | # Commuters | % Commuters |
| Less than 5 Minutes | 127 | 0.9% |
| 5 to 9 Minutes | 923 | 6.7% |
| 10 to 14 Minutes | 1,640 | 11.9% |
| 15 to 19 Minutes | 2,231 | 16.2% |
| 20 to 24 Minutes | 2,696 | 19.6% |
| 25 to 29 Minutes | 1,087 | 7.9% |
| 30 to 34 Minutes | 2,525 | 18.3% |
| 35 to 39 Minutes | 315 | 2.3% |
| 40 to 44 Minutes | 603 | 4.4% |
| 45 to 59 Minutes | 997 | 7.2% |
| 60 to 89 Minutes | 277 | 2.0% |
| 90 or more Minutes | 356 | 2.6% |
Commute Time by Sex in Socorro
The most common commute times in Socorro are 20 to 24 minutes (1,727 commuters, 22.6%) for males and 30 to 34 minutes (1,048 commuters, 17.1%) for females.
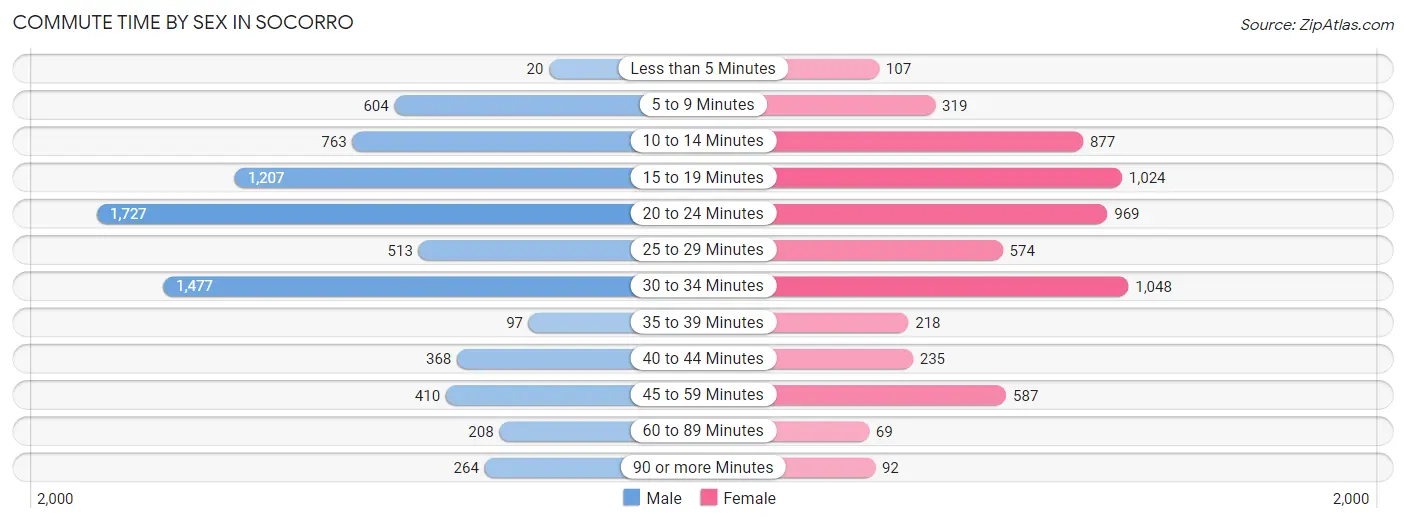
| Commute Time | Male | Female |
| Less than 5 Minutes | 20 (0.3%) | 107 (1.8%) |
| 5 to 9 Minutes | 604 (7.9%) | 319 (5.2%) |
| 10 to 14 Minutes | 763 (10.0%) | 877 (14.3%) |
| 15 to 19 Minutes | 1,207 (15.8%) | 1,024 (16.7%) |
| 20 to 24 Minutes | 1,727 (22.6%) | 969 (15.8%) |
| 25 to 29 Minutes | 513 (6.7%) | 574 (9.4%) |
| 30 to 34 Minutes | 1,477 (19.3%) | 1,048 (17.1%) |
| 35 to 39 Minutes | 97 (1.3%) | 218 (3.6%) |
| 40 to 44 Minutes | 368 (4.8%) | 235 (3.8%) |
| 45 to 59 Minutes | 410 (5.3%) | 587 (9.6%) |
| 60 to 89 Minutes | 208 (2.7%) | 69 (1.1%) |
| 90 or more Minutes | 264 (3.5%) | 92 (1.5%) |
Time of Departure to Work by Sex in Socorro
The most frequent times of departure to work in Socorro are 6:00 AM to 6:29 AM (1,422, 18.6%) for males and 7:00 AM to 7:29 AM (1,201, 19.6%) for females.
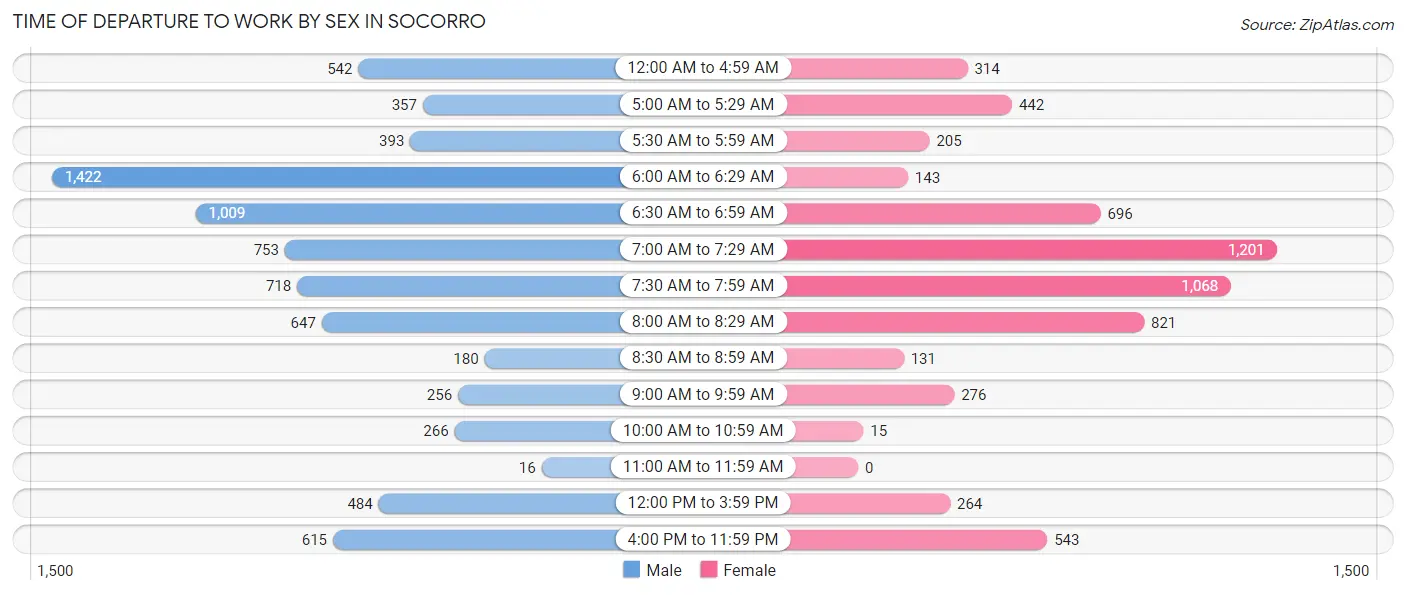
| Time of Departure | Male | Female |
| 12:00 AM to 4:59 AM | 542 (7.1%) | 314 (5.1%) |
| 5:00 AM to 5:29 AM | 357 (4.7%) | 442 (7.2%) |
| 5:30 AM to 5:59 AM | 393 (5.1%) | 205 (3.4%) |
| 6:00 AM to 6:29 AM | 1,422 (18.6%) | 143 (2.3%) |
| 6:30 AM to 6:59 AM | 1,009 (13.2%) | 696 (11.4%) |
| 7:00 AM to 7:29 AM | 753 (9.8%) | 1,201 (19.6%) |
| 7:30 AM to 7:59 AM | 718 (9.4%) | 1,068 (17.4%) |
| 8:00 AM to 8:29 AM | 647 (8.5%) | 821 (13.4%) |
| 8:30 AM to 8:59 AM | 180 (2.4%) | 131 (2.1%) |
| 9:00 AM to 9:59 AM | 256 (3.3%) | 276 (4.5%) |
| 10:00 AM to 10:59 AM | 266 (3.5%) | 15 (0.3%) |
| 11:00 AM to 11:59 AM | 16 (0.2%) | 0 (0.0%) |
| 12:00 PM to 3:59 PM | 484 (6.3%) | 264 (4.3%) |
| 4:00 PM to 11:59 PM | 615 (8.0%) | 543 (8.9%) |
| Total | 7,658 (100.0%) | 6,119 (100.0%) |
Housing Occupancy in Socorro
Occupancy by Ownership in Socorro
Of the total 11,125 dwellings in Socorro, owner-occupied units account for 8,855 (79.6%), while renter-occupied units make up 2,270 (20.4%).
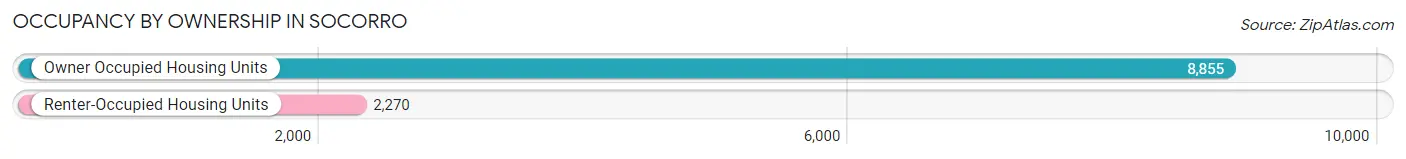
| Occupancy | # Housing Units | % Housing Units |
| Owner Occupied Housing Units | 8,855 | 79.6% |
| Renter-Occupied Housing Units | 2,270 | 20.4% |
| Total Occupied Housing Units | 11,125 | 100.0% |
Occupancy by Household Size in Socorro
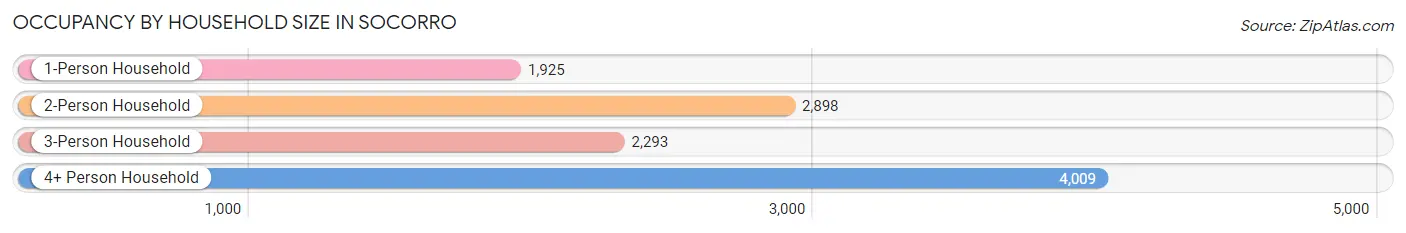
| Household Size | # Housing Units | % Housing Units |
| 1-Person Household | 1,925 | 17.3% |
| 2-Person Household | 2,898 | 26.1% |
| 3-Person Household | 2,293 | 20.6% |
| 4+ Person Household | 4,009 | 36.0% |
| Total Housing Units | 11,125 | 100.0% |
Occupancy by Ownership by Household Size in Socorro
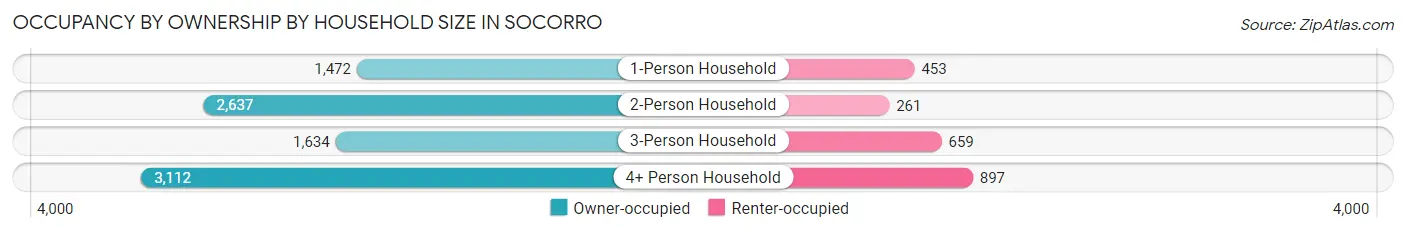
| Household Size | Owner-occupied | Renter-occupied |
| 1-Person Household | 1,472 (76.5%) | 453 (23.5%) |
| 2-Person Household | 2,637 (91.0%) | 261 (9.0%) |
| 3-Person Household | 1,634 (71.3%) | 659 (28.7%) |
| 4+ Person Household | 3,112 (77.6%) | 897 (22.4%) |
| Total Housing Units | 8,855 (79.6%) | 2,270 (20.4%) |
Occupancy by Educational Attainment in Socorro
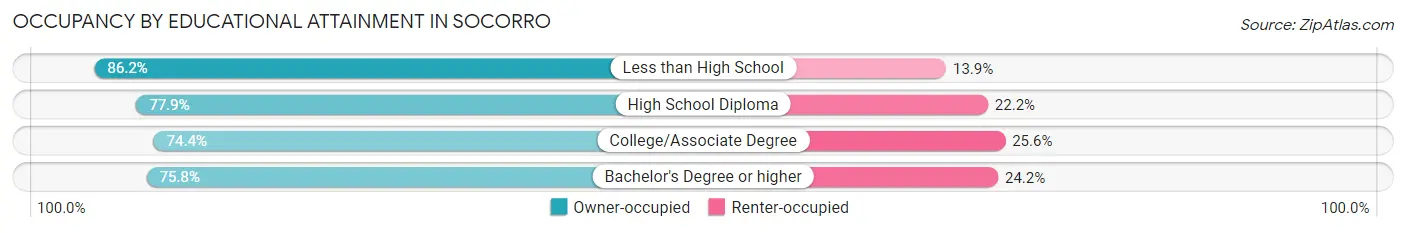
| Household Size | Owner-occupied | Renter-occupied |
| Less than High School | 3,395 (86.2%) | 546 (13.9%) |
| High School Diploma | 2,186 (77.8%) | 622 (22.2%) |
| College/Associate Degree | 2,317 (74.4%) | 797 (25.6%) |
| Bachelor's Degree or higher | 957 (75.8%) | 305 (24.2%) |
Occupancy by Age of Householder in Socorro
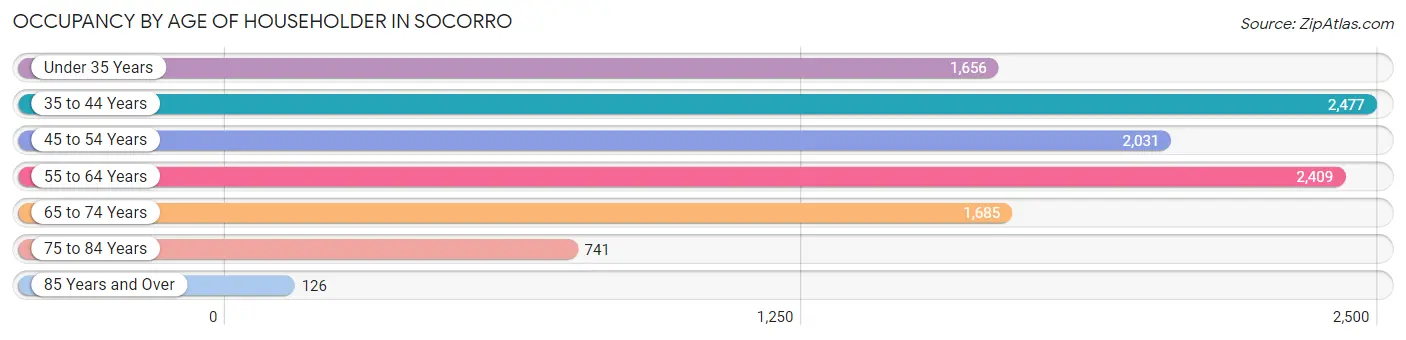
| Age Bracket | # Households | % Households |
| Under 35 Years | 1,656 | 14.9% |
| 35 to 44 Years | 2,477 | 22.3% |
| 45 to 54 Years | 2,031 | 18.3% |
| 55 to 64 Years | 2,409 | 21.6% |
| 65 to 74 Years | 1,685 | 15.1% |
| 75 to 84 Years | 741 | 6.7% |
| 85 Years and Over | 126 | 1.1% |
| Total | 11,125 | 100.0% |
Housing Finances in Socorro
Median Income by Occupancy in Socorro
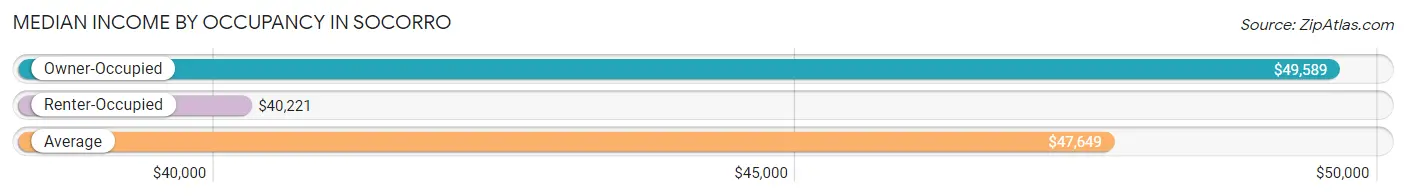
| Occupancy Type | # Households | Median Income |
| Owner-Occupied | 8,855 (79.6%) | $49,589 |
| Renter-Occupied | 2,270 (20.4%) | $40,221 |
| Average | 11,125 (100.0%) | $47,649 |
Occupancy by Householder Income Bracket in Socorro
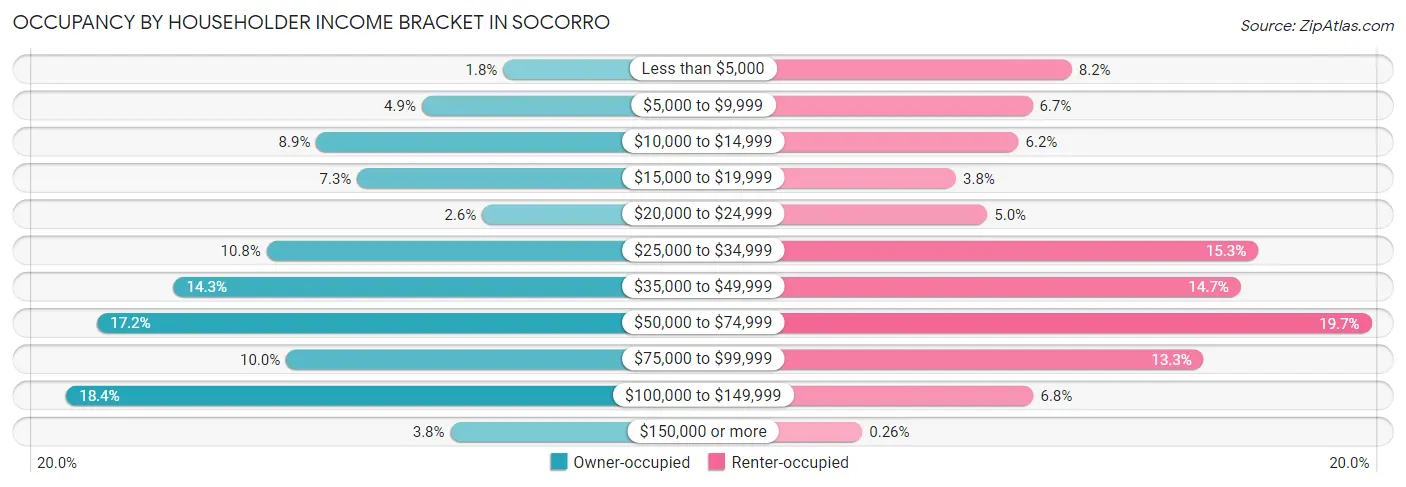
| Income Bracket | Owner-occupied | Renter-occupied |
| Less than $5,000 | 157 (1.8%) | 187 (8.2%) |
| $5,000 to $9,999 | 431 (4.9%) | 153 (6.7%) |
| $10,000 to $14,999 | 787 (8.9%) | 141 (6.2%) |
| $15,000 to $19,999 | 649 (7.3%) | 87 (3.8%) |
| $20,000 to $24,999 | 228 (2.6%) | 114 (5.0%) |
| $25,000 to $34,999 | 955 (10.8%) | 348 (15.3%) |
| $35,000 to $49,999 | 1,268 (14.3%) | 333 (14.7%) |
| $50,000 to $74,999 | 1,526 (17.2%) | 446 (19.7%) |
| $75,000 to $99,999 | 889 (10.0%) | 301 (13.3%) |
| $100,000 to $149,999 | 1,630 (18.4%) | 154 (6.8%) |
| $150,000 or more | 335 (3.8%) | 6 (0.3%) |
| Total | 8,855 (100.0%) | 2,270 (100.0%) |
Monthly Housing Cost Tiers in Socorro
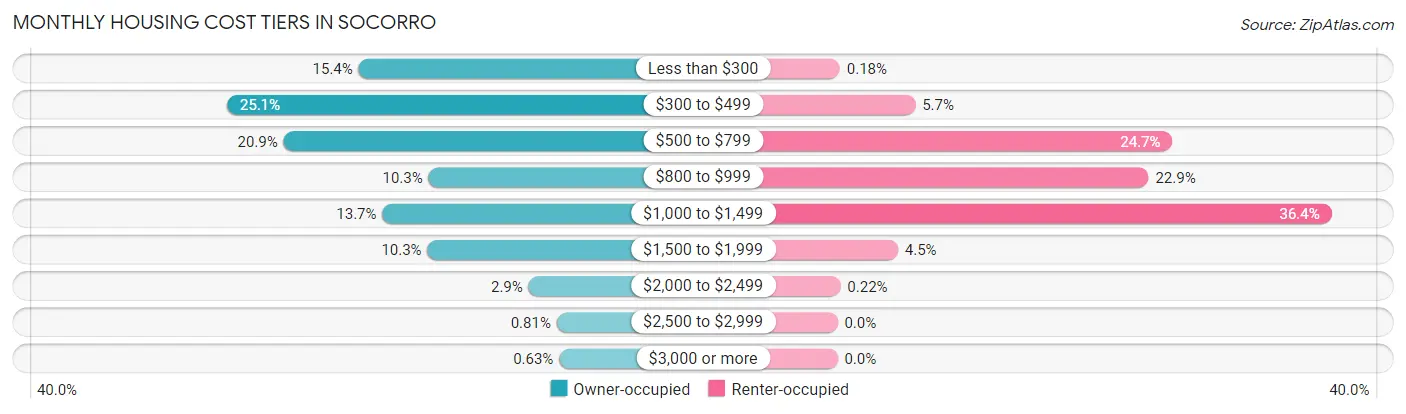
| Monthly Cost | Owner-occupied | Renter-occupied |
| Less than $300 | 1,364 (15.4%) | 4 (0.2%) |
| $300 to $499 | 2,223 (25.1%) | 130 (5.7%) |
| $500 to $799 | 1,853 (20.9%) | 560 (24.7%) |
| $800 to $999 | 908 (10.2%) | 520 (22.9%) |
| $1,000 to $1,499 | 1,209 (13.7%) | 826 (36.4%) |
| $1,500 to $1,999 | 915 (10.3%) | 101 (4.4%) |
| $2,000 to $2,499 | 255 (2.9%) | 5 (0.2%) |
| $2,500 to $2,999 | 72 (0.8%) | 0 (0.0%) |
| $3,000 or more | 56 (0.6%) | 0 (0.0%) |
| Total | 8,855 (100.0%) | 2,270 (100.0%) |
Physical Housing Characteristics in Socorro
Housing Structures in Socorro
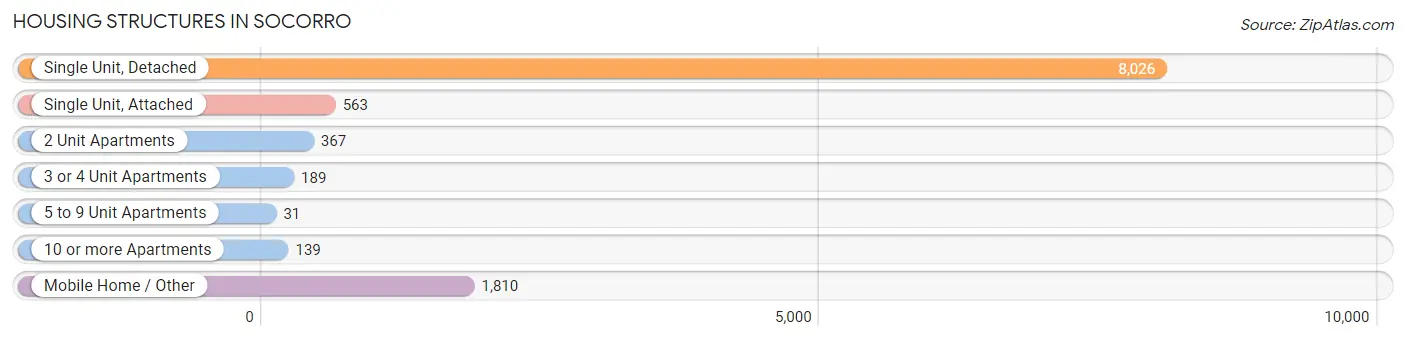
| Structure Type | # Housing Units | % Housing Units |
| Single Unit, Detached | 8,026 | 72.1% |
| Single Unit, Attached | 563 | 5.1% |
| 2 Unit Apartments | 367 | 3.3% |
| 3 or 4 Unit Apartments | 189 | 1.7% |
| 5 to 9 Unit Apartments | 31 | 0.3% |
| 10 or more Apartments | 139 | 1.3% |
| Mobile Home / Other | 1,810 | 16.3% |
| Total | 11,125 | 100.0% |
Housing Structures by Occupancy in Socorro
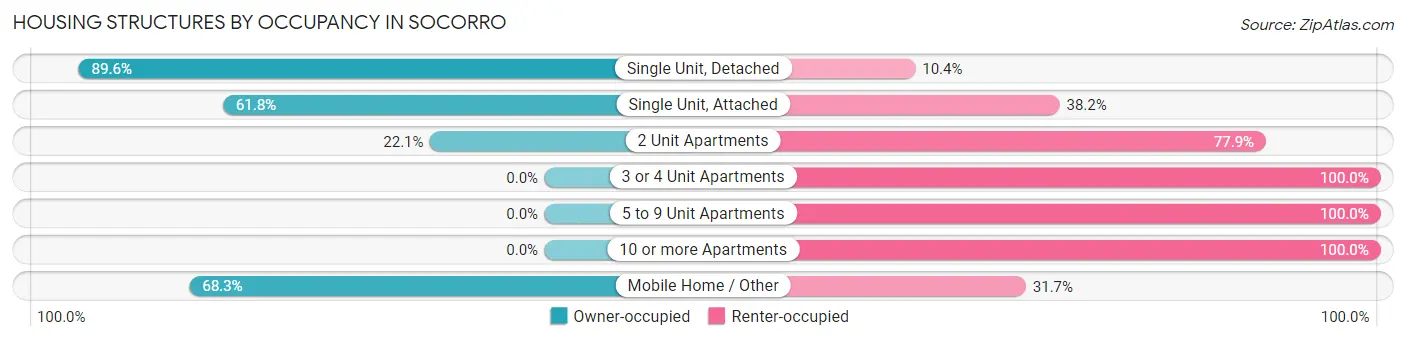
| Structure Type | Owner-occupied | Renter-occupied |
| Single Unit, Detached | 7,190 (89.6%) | 836 (10.4%) |
| Single Unit, Attached | 348 (61.8%) | 215 (38.2%) |
| 2 Unit Apartments | 81 (22.1%) | 286 (77.9%) |
| 3 or 4 Unit Apartments | 0 (0.0%) | 189 (100.0%) |
| 5 to 9 Unit Apartments | 0 (0.0%) | 31 (100.0%) |
| 10 or more Apartments | 0 (0.0%) | 139 (100.0%) |
| Mobile Home / Other | 1,236 (68.3%) | 574 (31.7%) |
| Total | 8,855 (79.6%) | 2,270 (20.4%) |
Housing Structures by Number of Rooms in Socorro
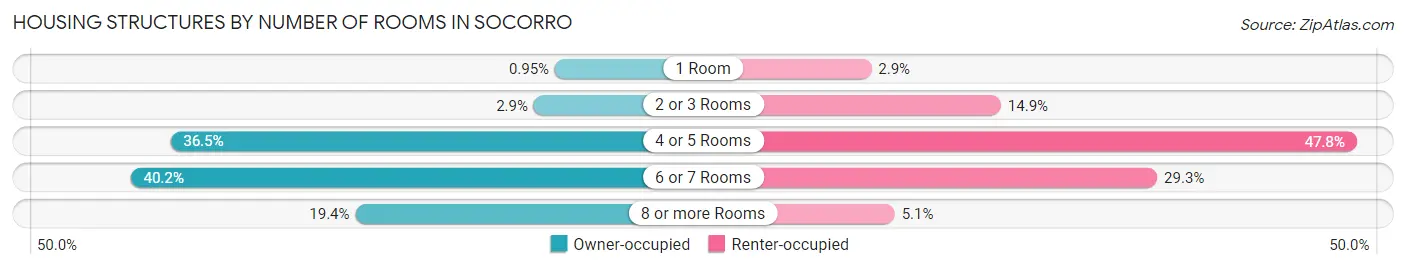
| Number of Rooms | Owner-occupied | Renter-occupied |
| 1 Room | 84 (0.9%) | 66 (2.9%) |
| 2 or 3 Rooms | 258 (2.9%) | 338 (14.9%) |
| 4 or 5 Rooms | 3,234 (36.5%) | 1,085 (47.8%) |
| 6 or 7 Rooms | 3,560 (40.2%) | 666 (29.3%) |
| 8 or more Rooms | 1,719 (19.4%) | 115 (5.1%) |
| Total | 8,855 (100.0%) | 2,270 (100.0%) |
Housing Structure by Heating Type in Socorro
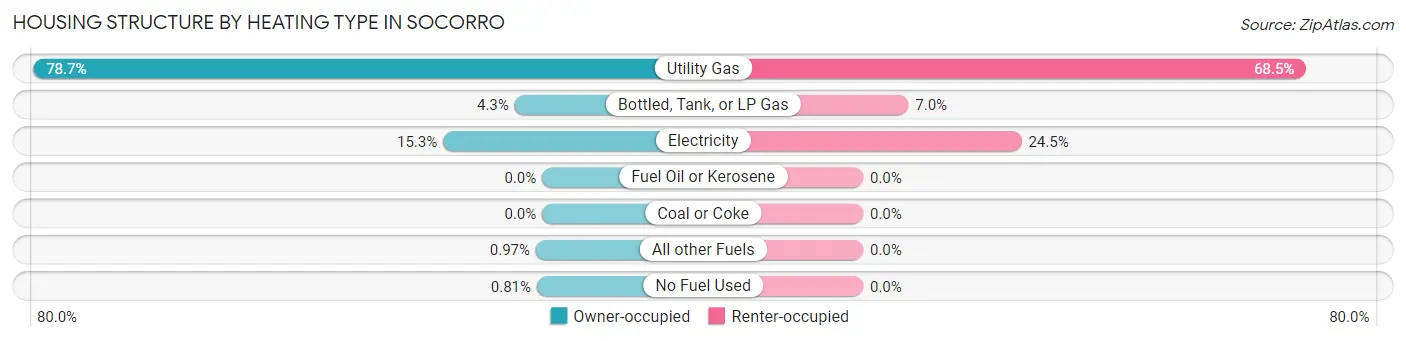
| Heating Type | Owner-occupied | Renter-occupied |
| Utility Gas | 6,965 (78.7%) | 1,555 (68.5%) |
| Bottled, Tank, or LP Gas | 376 (4.3%) | 159 (7.0%) |
| Electricity | 1,356 (15.3%) | 556 (24.5%) |
| Fuel Oil or Kerosene | 0 (0.0%) | 0 (0.0%) |
| Coal or Coke | 0 (0.0%) | 0 (0.0%) |
| All other Fuels | 86 (1.0%) | 0 (0.0%) |
| No Fuel Used | 72 (0.8%) | 0 (0.0%) |
| Total | 8,855 (100.0%) | 2,270 (100.0%) |
Household Vehicle Usage in Socorro
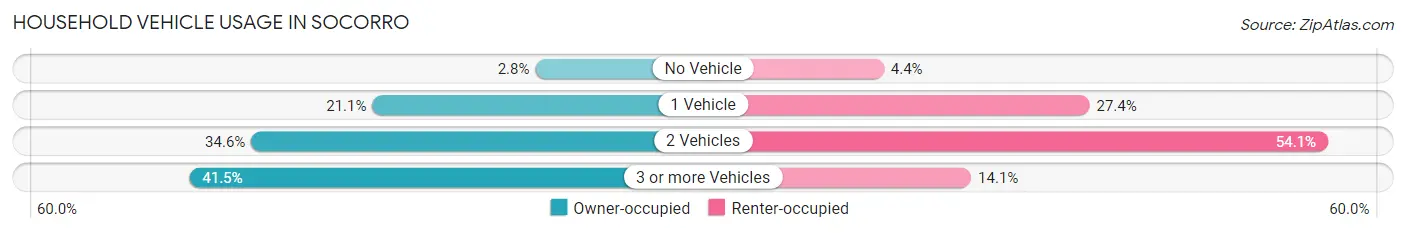
| Vehicles per Household | Owner-occupied | Renter-occupied |
| No Vehicle | 247 (2.8%) | 99 (4.4%) |
| 1 Vehicle | 1,864 (21.0%) | 622 (27.4%) |
| 2 Vehicles | 3,066 (34.6%) | 1,228 (54.1%) |
| 3 or more Vehicles | 3,678 (41.5%) | 321 (14.1%) |
| Total | 8,855 (100.0%) | 2,270 (100.0%) |
Real Estate & Mortgages in Socorro
Real Estate and Mortgage Overview in Socorro
| Characteristic | Without Mortgage | With Mortgage |
| Housing Units | 5,485 | 3,370 |
| Median Property Value | $103,000 | $139,500 |
| Median Household Income | $42,706 | $108 |
| Monthly Housing Costs | $434 | $56 |
| Real Estate Taxes | $2,070 | $220 |
Property Value by Mortgage Status in Socorro
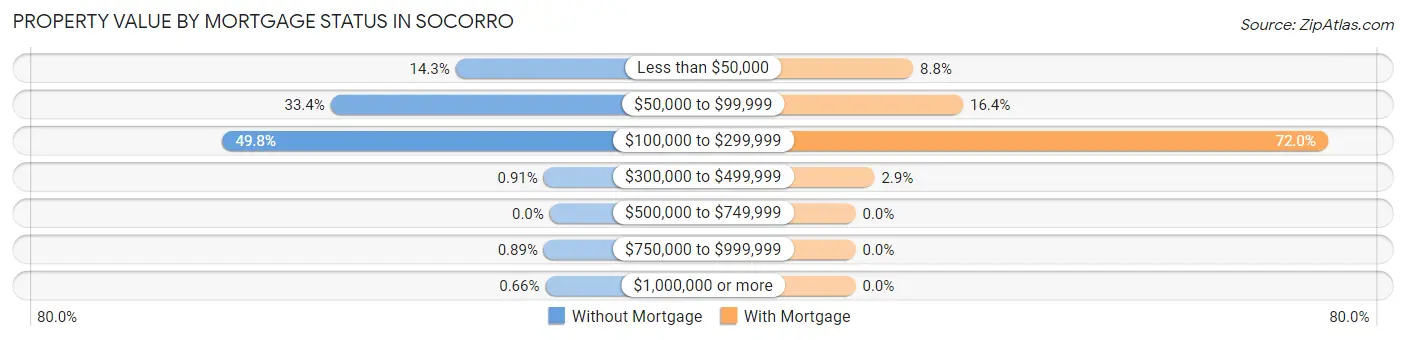
| Property Value | Without Mortgage | With Mortgage |
| Less than $50,000 | 786 (14.3%) | 296 (8.8%) |
| $50,000 to $99,999 | 1,831 (33.4%) | 552 (16.4%) |
| $100,000 to $299,999 | 2,733 (49.8%) | 2,425 (72.0%) |
| $300,000 to $499,999 | 50 (0.9%) | 97 (2.9%) |
| $500,000 to $749,999 | 0 (0.0%) | 0 (0.0%) |
| $750,000 to $999,999 | 49 (0.9%) | 0 (0.0%) |
| $1,000,000 or more | 36 (0.7%) | 0 (0.0%) |
| Total | 5,485 (100.0%) | 3,370 (100.0%) |
Household Income by Mortgage Status in Socorro
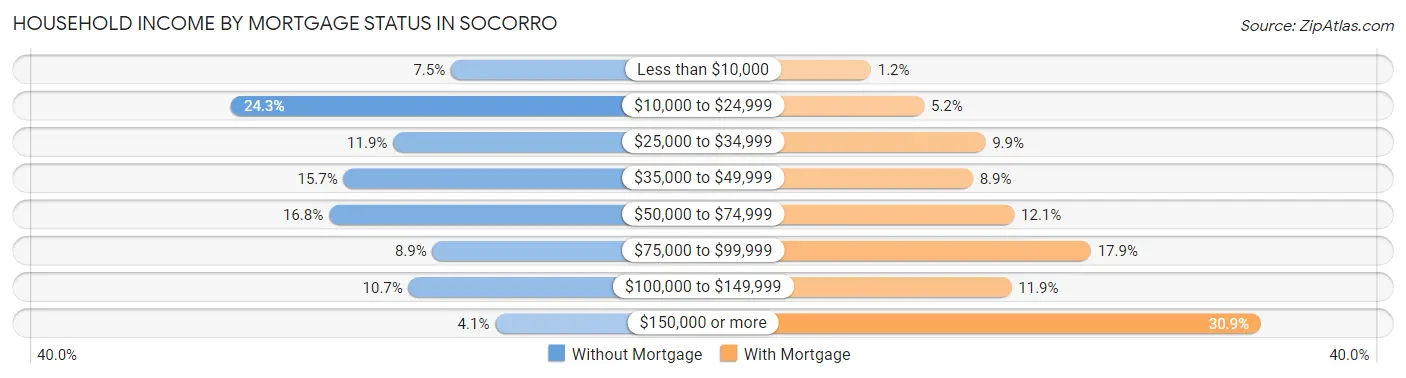
| Household Income | Without Mortgage | With Mortgage |
| Less than $10,000 | 412 (7.5%) | 39 (1.2%) |
| $10,000 to $24,999 | 1,331 (24.3%) | 176 (5.2%) |
| $25,000 to $34,999 | 654 (11.9%) | 333 (9.9%) |
| $35,000 to $49,999 | 861 (15.7%) | 301 (8.9%) |
| $50,000 to $74,999 | 922 (16.8%) | 407 (12.1%) |
| $75,000 to $99,999 | 489 (8.9%) | 604 (17.9%) |
| $100,000 to $149,999 | 589 (10.7%) | 400 (11.9%) |
| $150,000 or more | 227 (4.1%) | 1,041 (30.9%) |
| Total | 5,485 (100.0%) | 3,370 (100.0%) |
Property Value to Household Income Ratio in Socorro
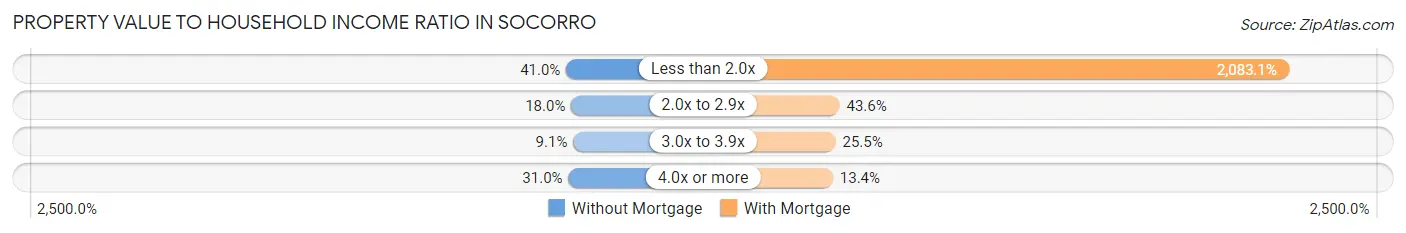
| Value-to-Income Ratio | Without Mortgage | With Mortgage |
| Less than 2.0x | 2,246 (40.9%) | 70,200 (2,083.1%) |
| 2.0x to 2.9x | 988 (18.0%) | 1,468 (43.6%) |
| 3.0x to 3.9x | 501 (9.1%) | 860 (25.5%) |
| 4.0x or more | 1,702 (31.0%) | 450 (13.4%) |
| Total | 5,485 (100.0%) | 3,370 (100.0%) |
Real Estate Taxes by Mortgage Status in Socorro
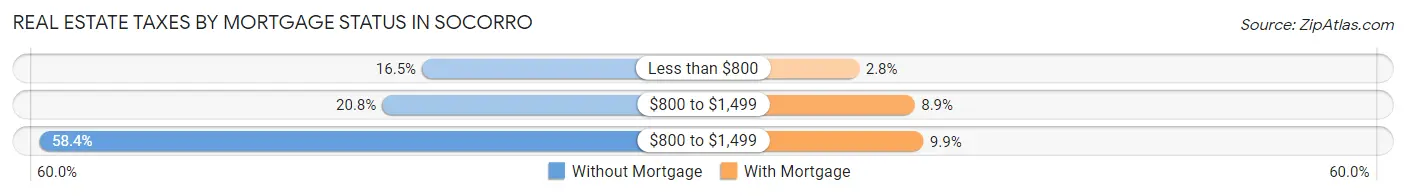
| Property Taxes | Without Mortgage | With Mortgage |
| Less than $800 | 903 (16.5%) | 95 (2.8%) |
| $800 to $1,499 | 1,142 (20.8%) | 300 (8.9%) |
| $800 to $1,499 | 3,203 (58.4%) | 332 (9.9%) |
| Total | 5,485 (100.0%) | 3,370 (100.0%) |
Health & Disability in Socorro
Health Insurance Coverage by Age in Socorro
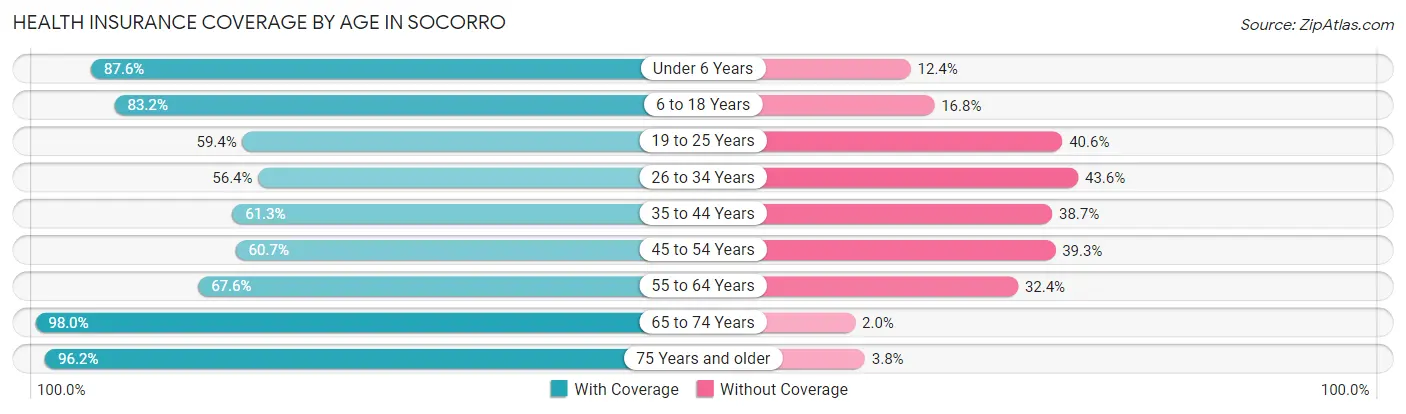
| Age Bracket | With Coverage | Without Coverage |
| Under 6 Years | 2,168 (87.6%) | 306 (12.4%) |
| 6 to 18 Years | 6,439 (83.2%) | 1,297 (16.8%) |
| 19 to 25 Years | 2,046 (59.4%) | 1,401 (40.6%) |
| 26 to 34 Years | 2,046 (56.4%) | 1,581 (43.6%) |
| 35 to 44 Years | 3,187 (61.3%) | 2,015 (38.7%) |
| 45 to 54 Years | 2,587 (60.7%) | 1,677 (39.3%) |
| 55 to 64 Years | 2,888 (67.6%) | 1,383 (32.4%) |
| 65 to 74 Years | 2,780 (98.0%) | 57 (2.0%) |
| 75 Years and older | 1,457 (96.2%) | 58 (3.8%) |
| Total | 25,598 (72.4%) | 9,775 (27.6%) |
Health Insurance Coverage by Citizenship Status in Socorro
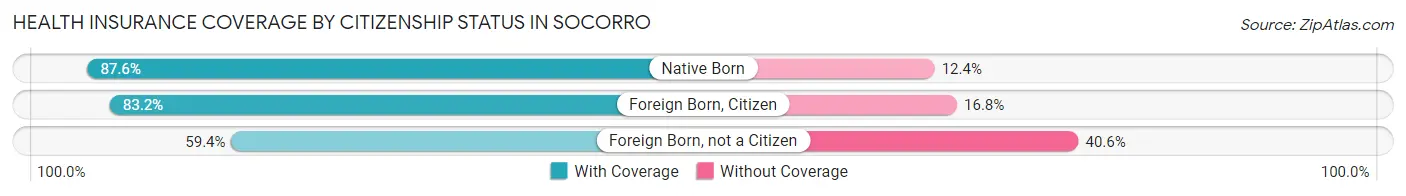
| Citizenship Status | With Coverage | Without Coverage |
| Native Born | 2,168 (87.6%) | 306 (12.4%) |
| Foreign Born, Citizen | 6,439 (83.2%) | 1,297 (16.8%) |
| Foreign Born, not a Citizen | 2,046 (59.4%) | 1,401 (40.6%) |
Health Insurance Coverage by Household Income in Socorro
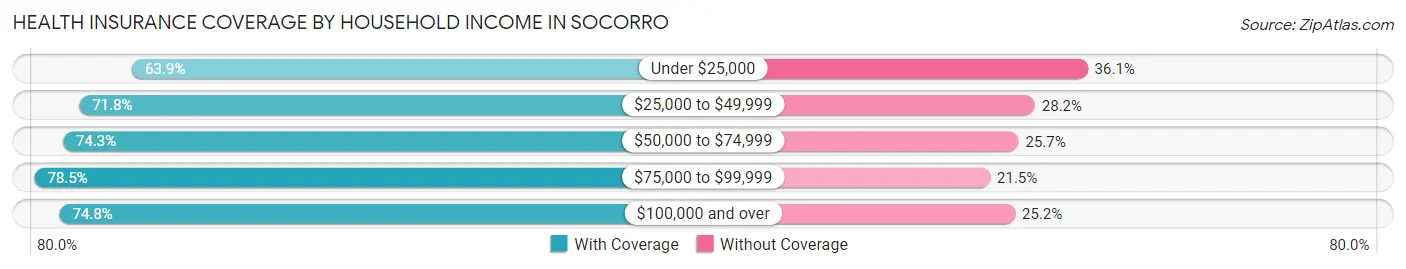
| Household Income | With Coverage | Without Coverage |
| Under $25,000 | 4,165 (63.9%) | 2,353 (36.1%) |
| $25,000 to $49,999 | 6,258 (71.8%) | 2,457 (28.2%) |
| $50,000 to $74,999 | 4,914 (74.3%) | 1,703 (25.7%) |
| $75,000 to $99,999 | 3,192 (78.5%) | 873 (21.5%) |
| $100,000 and over | 7,068 (74.8%) | 2,385 (25.2%) |
Public vs Private Health Insurance Coverage by Age in Socorro
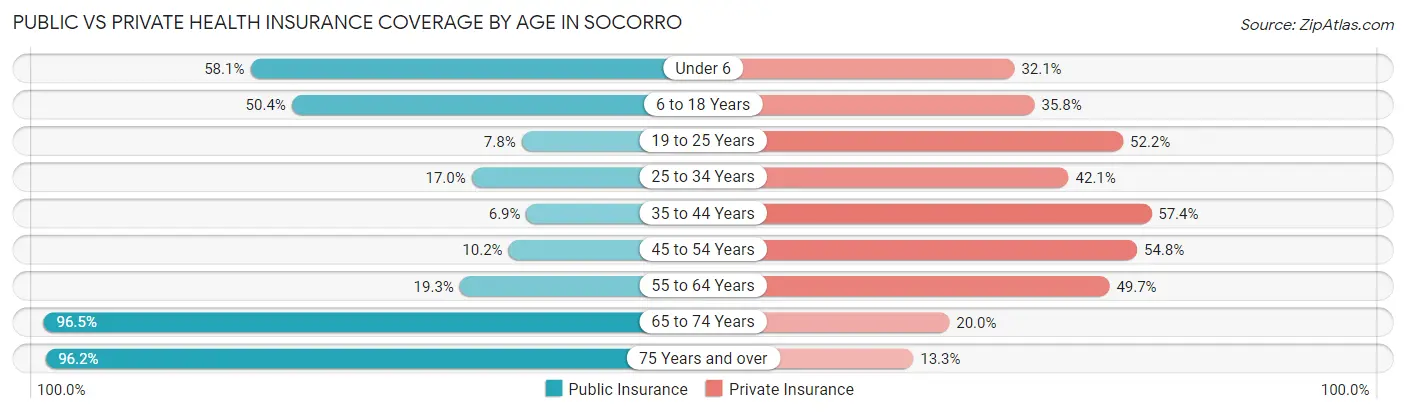
| Age Bracket | Public Insurance | Private Insurance |
| Under 6 | 1,438 (58.1%) | 793 (32.1%) |
| 6 to 18 Years | 3,901 (50.4%) | 2,768 (35.8%) |
| 19 to 25 Years | 268 (7.8%) | 1,800 (52.2%) |
| 25 to 34 Years | 618 (17.0%) | 1,527 (42.1%) |
| 35 to 44 Years | 357 (6.9%) | 2,988 (57.4%) |
| 45 to 54 Years | 435 (10.2%) | 2,337 (54.8%) |
| 55 to 64 Years | 822 (19.3%) | 2,122 (49.7%) |
| 65 to 74 Years | 2,737 (96.5%) | 566 (20.0%) |
| 75 Years and over | 1,457 (96.2%) | 201 (13.3%) |
| Total | 12,033 (34.0%) | 15,102 (42.7%) |
Disability Status by Sex by Age in Socorro
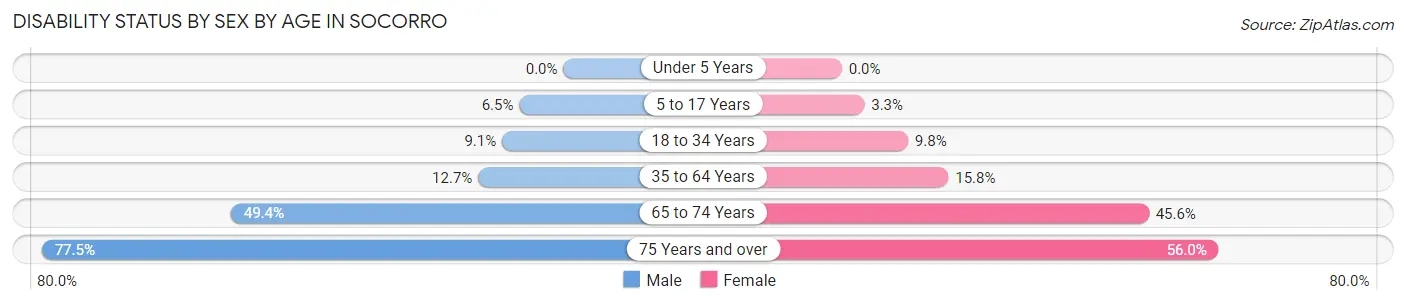
| Age Bracket | Male | Female |
| Under 5 Years | 0 (0.0%) | 0 (0.0%) |
| 5 to 17 Years | 213 (6.5%) | 131 (3.3%) |
| 18 to 34 Years | 348 (9.1%) | 404 (9.8%) |
| 35 to 64 Years | 794 (12.7%) | 1,179 (15.8%) |
| 65 to 74 Years | 676 (49.4%) | 669 (45.6%) |
| 75 Years and over | 426 (77.4%) | 540 (56.0%) |
Disability Class by Sex by Age in Socorro
Disability Class: Hearing Difficulty
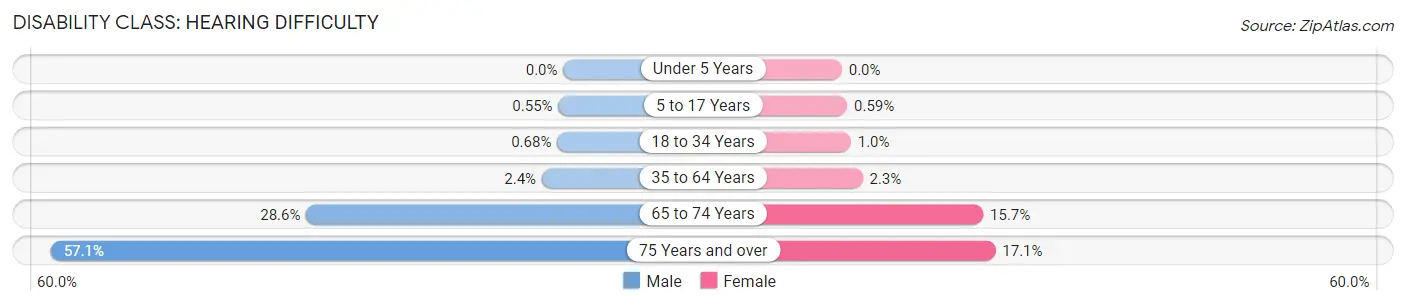
| Age Bracket | Male | Female |
| Under 5 Years | 0 (0.0%) | 0 (0.0%) |
| 5 to 17 Years | 18 (0.5%) | 23 (0.6%) |
| 18 to 34 Years | 26 (0.7%) | 41 (1.0%) |
| 35 to 64 Years | 150 (2.4%) | 172 (2.3%) |
| 65 to 74 Years | 392 (28.6%) | 231 (15.7%) |
| 75 Years and over | 314 (57.1%) | 165 (17.1%) |
Disability Class: Vision Difficulty
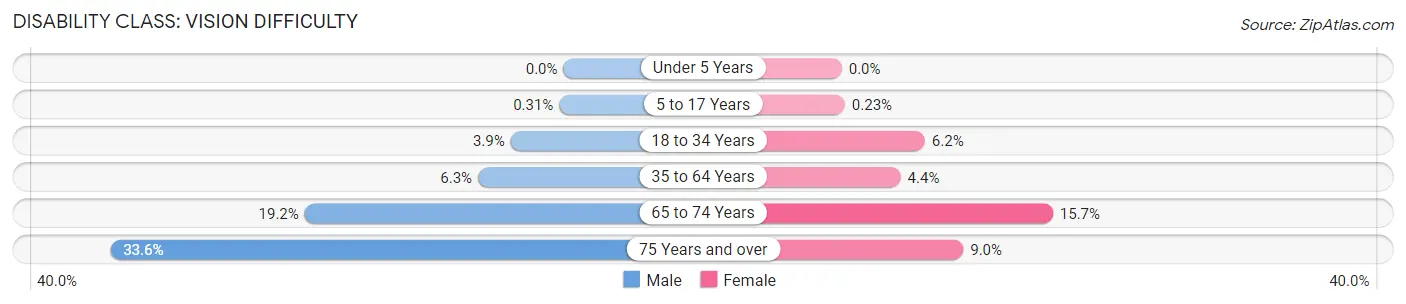
| Age Bracket | Male | Female |
| Under 5 Years | 0 (0.0%) | 0 (0.0%) |
| 5 to 17 Years | 10 (0.3%) | 9 (0.2%) |
| 18 to 34 Years | 150 (3.9%) | 254 (6.2%) |
| 35 to 64 Years | 398 (6.3%) | 326 (4.4%) |
| 65 to 74 Years | 263 (19.2%) | 230 (15.7%) |
| 75 Years and over | 185 (33.6%) | 87 (9.0%) |
Disability Class: Cognitive Difficulty
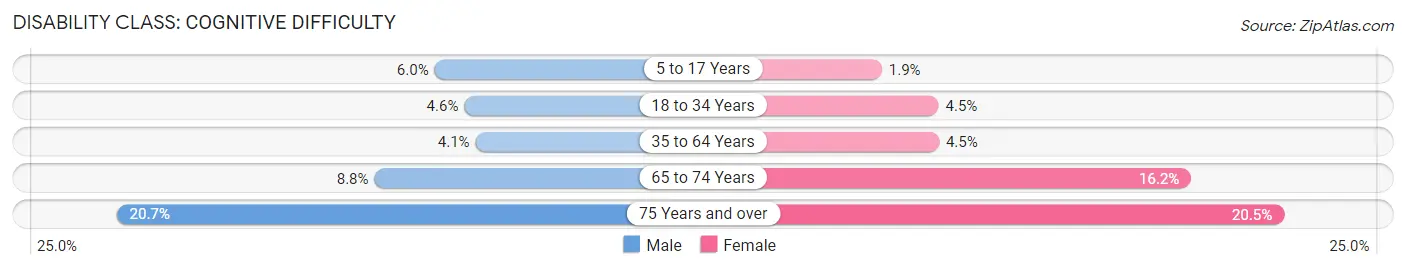
| Age Bracket | Male | Female |
| 5 to 17 Years | 195 (6.0%) | 73 (1.9%) |
| 18 to 34 Years | 176 (4.6%) | 185 (4.5%) |
| 35 to 64 Years | 256 (4.1%) | 336 (4.5%) |
| 65 to 74 Years | 120 (8.8%) | 238 (16.2%) |
| 75 Years and over | 114 (20.7%) | 198 (20.5%) |
Disability Class: Ambulatory Difficulty
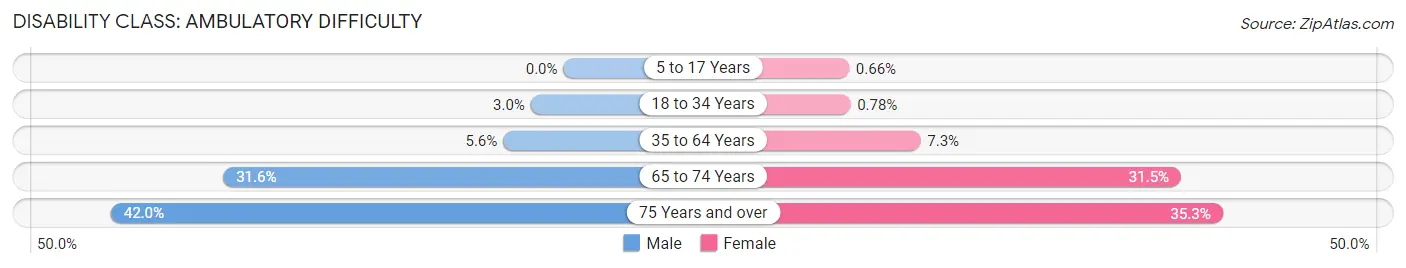
| Age Bracket | Male | Female |
| 5 to 17 Years | 0 (0.0%) | 26 (0.7%) |
| 18 to 34 Years | 116 (3.0%) | 32 (0.8%) |
| 35 to 64 Years | 351 (5.6%) | 544 (7.3%) |
| 65 to 74 Years | 432 (31.6%) | 462 (31.5%) |
| 75 Years and over | 231 (42.0%) | 341 (35.3%) |
Disability Class: Self-Care Difficulty
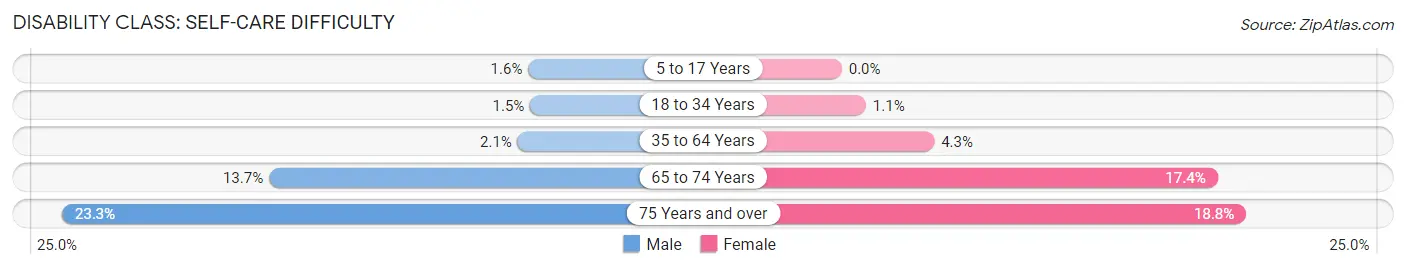
| Age Bracket | Male | Female |
| 5 to 17 Years | 53 (1.6%) | 0 (0.0%) |
| 18 to 34 Years | 59 (1.5%) | 46 (1.1%) |
| 35 to 64 Years | 133 (2.1%) | 320 (4.3%) |
| 65 to 74 Years | 187 (13.7%) | 256 (17.4%) |
| 75 Years and over | 128 (23.3%) | 181 (18.8%) |
Technology Access in Socorro
Computing Device Access in Socorro
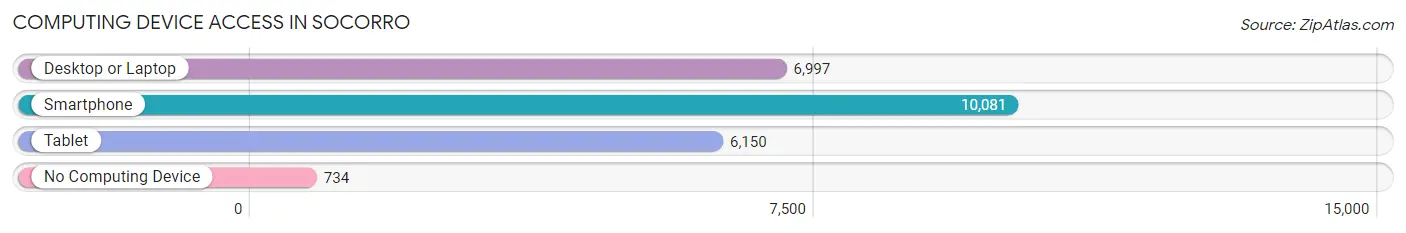
| Device Type | # Households | % Households |
| Desktop or Laptop | 6,997 | 62.9% |
| Smartphone | 10,081 | 90.6% |
| Tablet | 6,150 | 55.3% |
| No Computing Device | 734 | 6.6% |
| Total | 11,125 | 100.0% |
Internet Access in Socorro
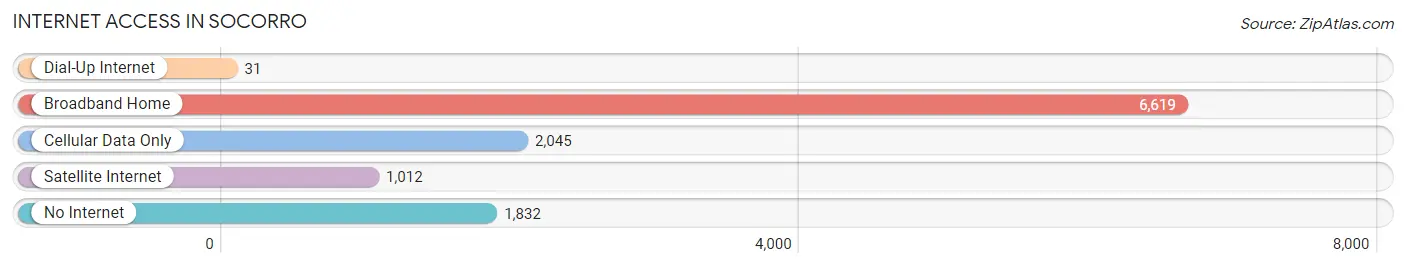
| Internet Type | # Households | % Households |
| Dial-Up Internet | 31 | 0.3% |
| Broadband Home | 6,619 | 59.5% |
| Cellular Data Only | 2,045 | 18.4% |
| Satellite Internet | 1,012 | 9.1% |
| No Internet | 1,832 | 16.5% |
| Total | 11,125 | 100.0% |
Socorro Summary
Socorro, Texas is a small city located in El Paso County, Texas. It is situated on the Rio Grande River, just south of El Paso. The city has a population of approximately 8,000 people and is part of the El Paso Metropolitan Statistical Area.
History
The area that is now Socorro was originally inhabited by the Tigua Indians, who were part of the Pueblo people. The Tigua Indians were known for their pottery and basket weaving. The first Europeans to settle in the area were Spanish missionaries in the late 1600s. The area was then part of the Spanish province of Nuevo Mexico.
In 1848, the Treaty of Guadalupe Hidalgo was signed, which ceded the area to the United States. The area was then part of the New Mexico Territory. In 1873, the area was annexed by Texas and became part of El Paso County.
In 1881, the town of Socorro was founded by a group of settlers from Mexico. The town was named after the Socorro River, which flows through the area. The town was incorporated in 1883.
Geography
Socorro is located in El Paso County, Texas. It is situated on the Rio Grande River, just south of El Paso. The city has a total area of 4.3 square miles, all of which is land. The city is located at an elevation of 3,845 feet above sea level.
The climate in Socorro is semi-arid, with hot summers and mild winters. The average annual temperature is 68 degrees Fahrenheit. The average annual precipitation is 8.5 inches.
Economy
The economy of Socorro is largely based on agriculture and manufacturing. The city is home to several large manufacturing plants, including a steel mill and a plastics factory. The city is also home to several agricultural businesses, including a dairy farm and a vegetable farm.
The city is also home to several retail businesses, including a grocery store, a hardware store, and a variety of restaurants. The city is also home to several medical facilities, including a hospital and several clinics.
Demographics
As of the 2010 census, the population of Socorro was 8,072. The racial makeup of the city was 79.3% Hispanic or Latino, 16.2% White, 1.2% African American, 0.7% Native American, 0.3% Asian, and 2.5% from other races.
The median household income in Socorro was $30,945, and the median family income was $35,945. The per capita income in the city was $14,945. About 18.3% of the population was below the poverty line.
Conclusion
Socorro, Texas is a small city located in El Paso County, Texas. It is situated on the Rio Grande River, just south of El Paso. The city has a population of approximately 8,000 people and is part of the El Paso Metropolitan Statistical Area. The economy of Socorro is largely based on agriculture and manufacturing, and the city is home to several retail businesses, medical facilities, and agricultural businesses. The population of Socorro is largely Hispanic or Latino, and the median household income is $30,945.
Common Questions
What is Per Capita Income in Socorro?
Per Capita income in Socorro is $19,122.
What is the Median Family Income in Socorro?
Median Family Income in Socorro is $51,814.
What is the Median Household income in Socorro?
Median Household Income in Socorro is $47,649.
What is Income or Wage Gap in Socorro?
Income or Wage Gap in Socorro is 28.1%.
Women in Socorro earn 71.9 cents for every dollar earned by a man.
What is Family Income Deficit in Socorro?
Family Income Deficit in Socorro is $9,426.
Families that are below poverty line in Socorro earn $9,426 less on average than the poverty threshold level.
What is Inequality or Gini Index in Socorro?
Inequality or Gini Index in Socorro is 0.42.
What is the Total Population of Socorro?
Total Population of Socorro is 35,429.
What is the Total Male Population of Socorro?
Total Male Population of Socorro is 16,382.
What is the Total Female Population of Socorro?
Total Female Population of Socorro is 19,047.
What is the Ratio of Males per 100 Females in Socorro?
There are 86.01 Males per 100 Females in Socorro.
What is the Ratio of Females per 100 Males in Socorro?
There are 116.27 Females per 100 Males in Socorro.
What is the Median Population Age in Socorro?
Median Population Age in Socorro is 35.6 Years.
What is the Average Family Size in Socorro
Average Family Size in Socorro is 3.6 People.
What is the Average Household Size in Socorro
Average Household Size in Socorro is 3.2 People.
How Large is the Labor Force in Socorro?
There are 16,425 People in the Labor Forcein in Socorro.
What is the Percentage of People in the Labor Force in Socorro?
59.9% of People are in the Labor Force in Socorro.
What is the Unemployment Rate in Socorro?
Unemployment Rate in Socorro is 5.6%.