Pharr, TX Map & Demographics
Pharr Map
Pharr Overview
$19,029
PER CAPITA INCOME
$50,637
AVG FAMILY INCOME
$45,016
AVG HOUSEHOLD INCOME
35.7%
WAGE / INCOME GAP [ % ]
64.3¢/ $1
WAGE / INCOME GAP [ $ ]
$11,426
FAMILY INCOME DEFICIT
0.47
INEQUALITY / GINI INDEX
79,434
TOTAL POPULATION
38,113
MALE POPULATION
41,321
FEMALE POPULATION
92.24
MALES / 100 FEMALES
108.42
FEMALES / 100 MALES
29.4
MEDIAN AGE
3.9
AVG FAMILY SIZE
3.4
AVG HOUSEHOLD SIZE
33,368
LABOR FORCE [ PEOPLE ]
59.5%
PERCENT IN LABOR FORCE
6.1%
UNEMPLOYMENT RATE
Pharr Zip Codes
Pharr Area Codes
Income in Pharr
Income Overview in Pharr
Per Capita Income in Pharr is $19,029, while median incomes of families and households are $50,637 and $45,016 respectively.
| Characteristic | Number | Measure |
| Per Capita Income | 79,434 | $19,029 |
| Median Family Income | 18,801 | $50,637 |
| Mean Family Income | 18,801 | $67,382 |
| Median Household Income | 23,277 | $45,016 |
| Mean Household Income | 23,277 | $62,995 |
| Income Deficit | 18,801 | $11,426 |
| Wage / Income Gap (%) | 79,434 | 35.71% |
| Wage / Income Gap ($) | 79,434 | 64.29¢ per $1 |
| Gini / Inequality Index | 79,434 | 0.47 |
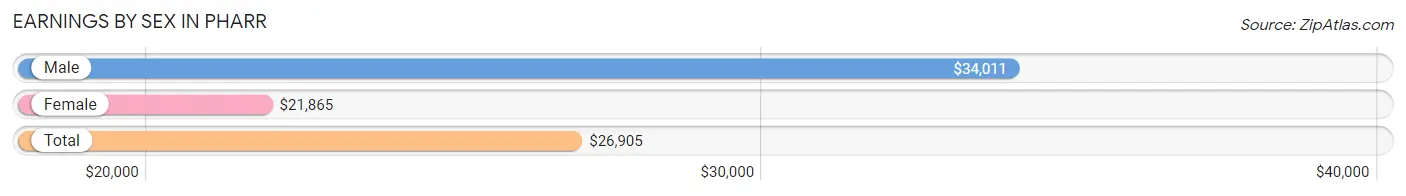
Earnings by Sex in Pharr
Average Earnings in Pharr are $26,905, $34,011 for men and $21,865 for women, a difference of 35.7%.
| Sex | Number | Average Earnings |
| Male | 19,197 (56.0%) | $34,011 |
| Female | 15,063 (44.0%) | $21,865 |
| Total | 34,260 (100.0%) | $26,905 |
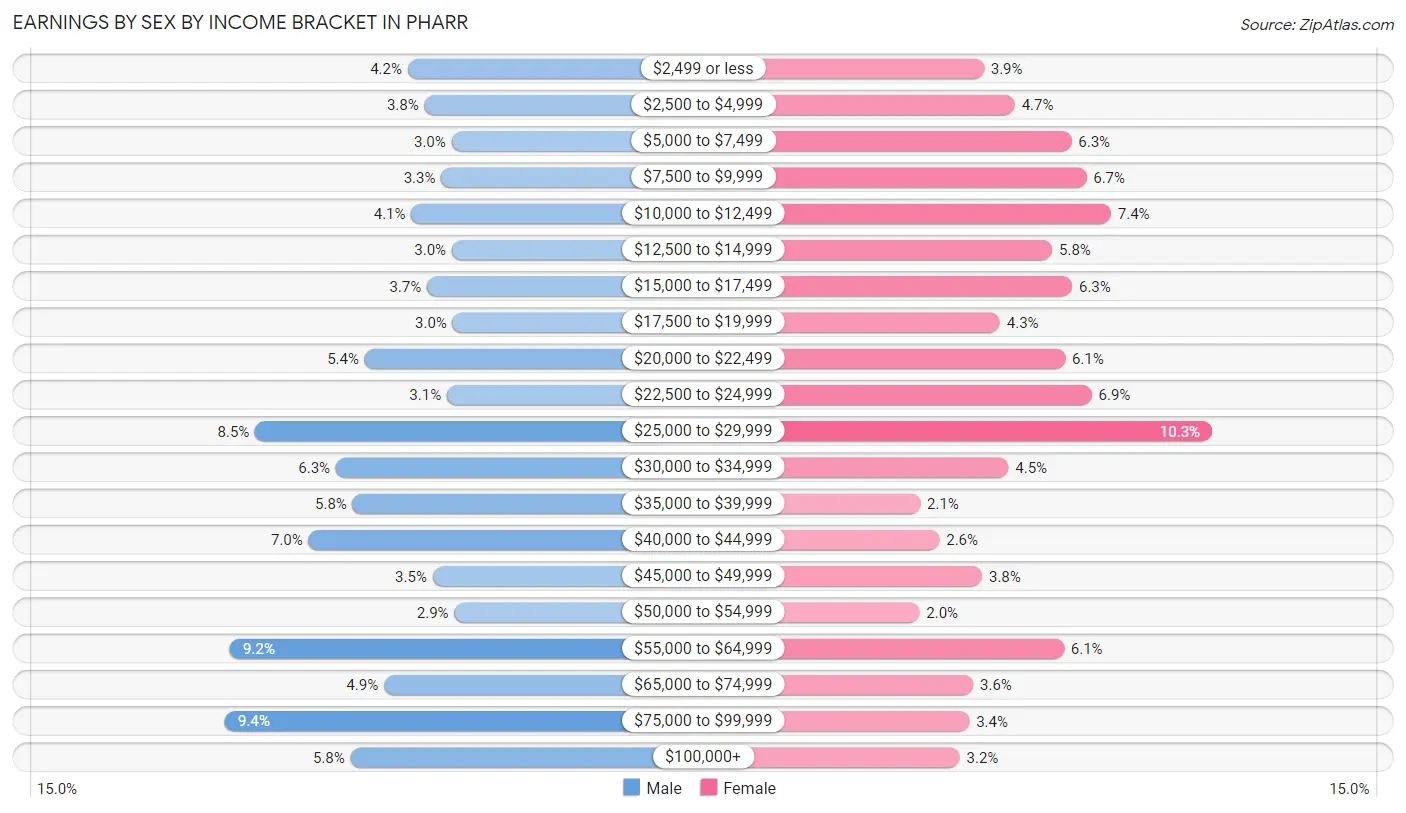
Earnings by Sex by Income Bracket in Pharr
The most common earnings brackets in Pharr are $75,000 to $99,999 for men (1,798 | 9.4%) and $25,000 to $29,999 for women (1,546 | 10.3%).
| Income | Male | Female |
| $2,499 or less | 812 (4.2%) | 580 (3.8%) |
| $2,500 to $4,999 | 722 (3.8%) | 711 (4.7%) |
| $5,000 to $7,499 | 576 (3.0%) | 951 (6.3%) |
| $7,500 to $9,999 | 631 (3.3%) | 1,014 (6.7%) |
| $10,000 to $12,499 | 793 (4.1%) | 1,118 (7.4%) |
| $12,500 to $14,999 | 574 (3.0%) | 869 (5.8%) |
| $15,000 to $17,499 | 709 (3.7%) | 953 (6.3%) |
| $17,500 to $19,999 | 570 (3.0%) | 647 (4.3%) |
| $20,000 to $22,499 | 1,045 (5.4%) | 923 (6.1%) |
| $22,500 to $24,999 | 600 (3.1%) | 1,036 (6.9%) |
| $25,000 to $29,999 | 1,636 (8.5%) | 1,546 (10.3%) |
| $30,000 to $34,999 | 1,200 (6.2%) | 684 (4.5%) |
| $35,000 to $39,999 | 1,110 (5.8%) | 311 (2.1%) |
| $40,000 to $44,999 | 1,348 (7.0%) | 391 (2.6%) |
| $45,000 to $49,999 | 678 (3.5%) | 573 (3.8%) |
| $50,000 to $54,999 | 560 (2.9%) | 308 (2.0%) |
| $55,000 to $64,999 | 1,772 (9.2%) | 919 (6.1%) |
| $65,000 to $74,999 | 941 (4.9%) | 534 (3.5%) |
| $75,000 to $99,999 | 1,798 (9.4%) | 518 (3.4%) |
| $100,000+ | 1,122 (5.8%) | 477 (3.2%) |
| Total | 19,197 (100.0%) | 15,063 (100.0%) |
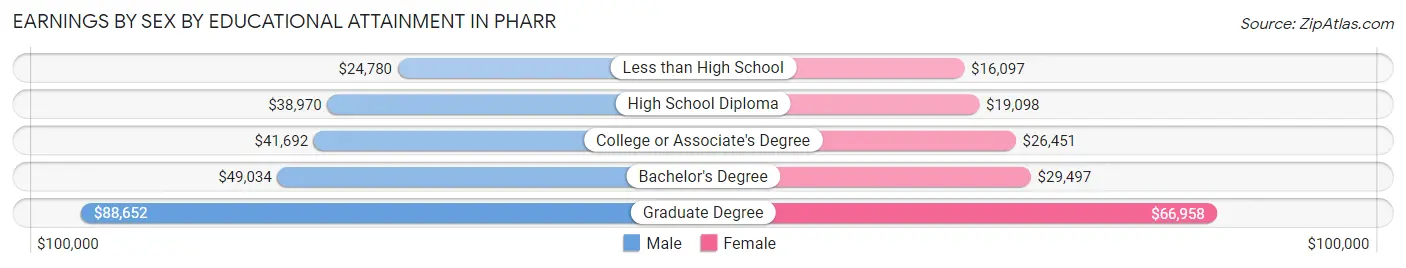
Earnings by Sex by Educational Attainment in Pharr
Average earnings in Pharr are $39,166 for men and $23,438 for women, a difference of 40.2%. Men with an educational attainment of graduate degree enjoy the highest average annual earnings of $88,652, while those with less than high school education earn the least with $24,780. Women with an educational attainment of graduate degree earn the most with the average annual earnings of $66,958, while those with less than high school education have the smallest earnings of $16,097.
| Educational Attainment | Male Income | Female Income |
| Less than High School | $24,780 | $16,097 |
| High School Diploma | $38,970 | $19,098 |
| College or Associate's Degree | $41,692 | $26,451 |
| Bachelor's Degree | $49,034 | $29,497 |
| Graduate Degree | $88,652 | $66,958 |
| Total | $39,166 | $23,438 |
Family Income in Pharr
Family Income Brackets in Pharr
According to the Pharr family income data, there are 3,384 families falling into the $50,000 to $74,999 income range, which is the most common income bracket and makes up 18.0% of all families. Conversely, the $150,000 to $199,999 income bracket is the least frequent group with only 526 families (2.8%) belonging to this category.
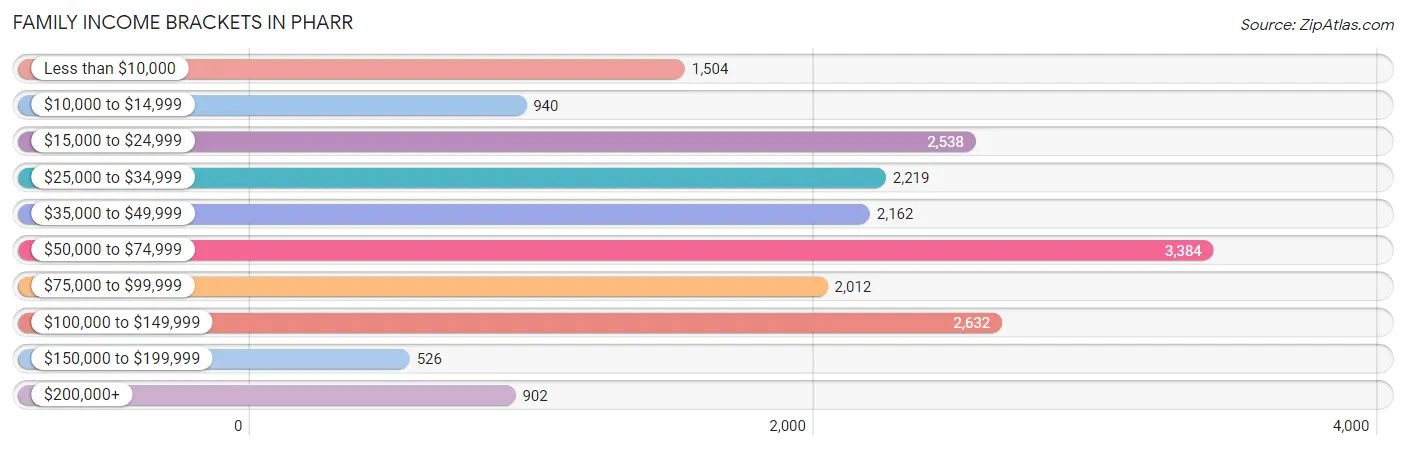
| Income Bracket | # Families | % Families |
| Less than $10,000 | 1,504 | 8.0% |
| $10,000 to $14,999 | 940 | 5.0% |
| $15,000 to $24,999 | 2,538 | 13.5% |
| $25,000 to $34,999 | 2,219 | 11.8% |
| $35,000 to $49,999 | 2,162 | 11.5% |
| $50,000 to $74,999 | 3,384 | 18.0% |
| $75,000 to $99,999 | 2,012 | 10.7% |
| $100,000 to $149,999 | 2,632 | 14.0% |
| $150,000 to $199,999 | 526 | 2.8% |
| $200,000+ | 902 | 4.8% |
Family Income by Famaliy Size in Pharr
6-person families (1,505 | 8.0%) account for the highest median family income in Pharr with $80,655 per family, while 2-person families (5,396 | 28.7%) have the highest median income of $20,272 per family member.
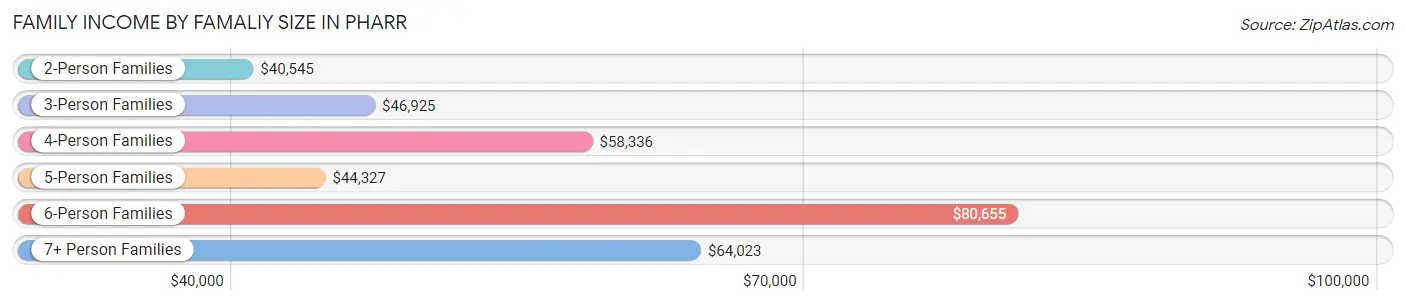
| Income Bracket | # Families | Median Income |
| 2-Person Families | 5,396 (28.7%) | $40,545 |
| 3-Person Families | 4,353 (23.2%) | $46,925 |
| 4-Person Families | 4,055 (21.6%) | $58,336 |
| 5-Person Families | 2,818 (15.0%) | $44,327 |
| 6-Person Families | 1,505 (8.0%) | $80,655 |
| 7+ Person Families | 674 (3.6%) | $64,023 |
| Total | 18,801 (100.0%) | $50,637 |
Family Income by Number of Earners in Pharr
The median family income in Pharr is $50,637, with families comprising 3+ earners (2,612) having the highest median family income of $100,826, while families with no earners (2,280) have the lowest median family income of $17,176, accounting for 13.9% and 12.1% of families, respectively.
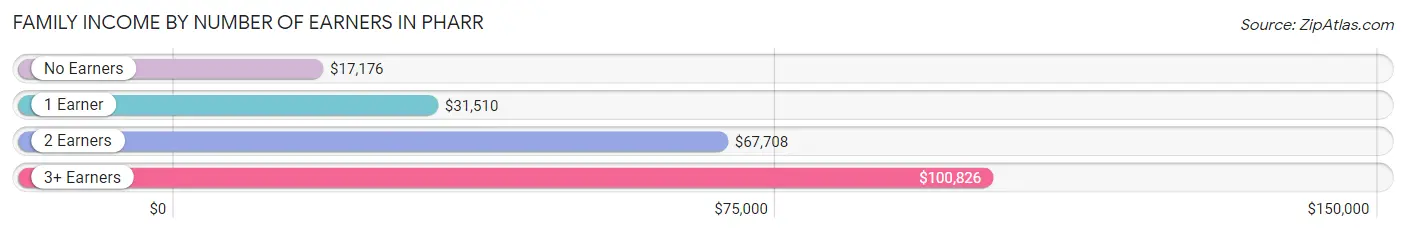
| Number of Earners | # Families | Median Income |
| No Earners | 2,280 (12.1%) | $17,176 |
| 1 Earner | 7,586 (40.4%) | $31,510 |
| 2 Earners | 6,323 (33.6%) | $67,708 |
| 3+ Earners | 2,612 (13.9%) | $100,826 |
| Total | 18,801 (100.0%) | $50,637 |
Household Income in Pharr
Household Income Brackets in Pharr
With 3,817 households falling in the category, the $50,000 to $74,999 income range is the most frequent in Pharr, accounting for 16.4% of all households. In contrast, only 652 households (2.8%) fall into the $150,000 to $199,999 income bracket, making it the least populous group.
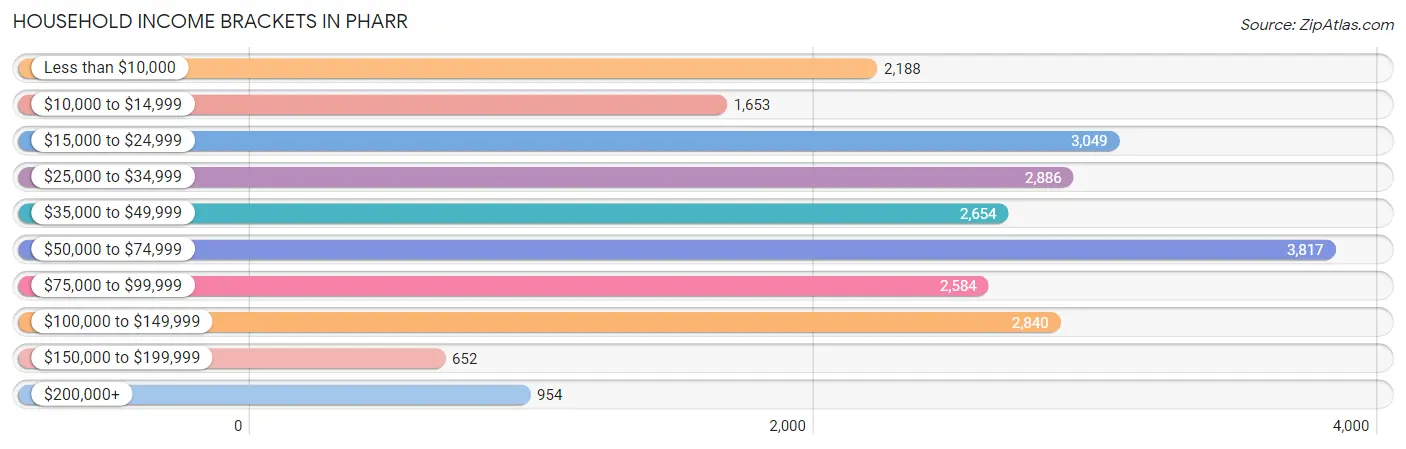
| Income Bracket | # Households | % Households |
| Less than $10,000 | 2,188 | 9.4% |
| $10,000 to $14,999 | 1,653 | 7.1% |
| $15,000 to $24,999 | 3,049 | 13.1% |
| $25,000 to $34,999 | 2,886 | 12.4% |
| $35,000 to $49,999 | 2,654 | 11.4% |
| $50,000 to $74,999 | 3,817 | 16.4% |
| $75,000 to $99,999 | 2,584 | 11.1% |
| $100,000 to $149,999 | 2,840 | 12.2% |
| $150,000 to $199,999 | 652 | 2.8% |
| $200,000+ | 954 | 4.1% |
Household Income by Householder Age in Pharr
The median household income in Pharr is $45,016, with the highest median household income of $56,841 found in the 25 to 44 years age bracket for the primary householder. A total of 9,667 households (41.5%) fall into this category. Meanwhile, the 65+ years age bracket for the primary householder has the lowest median household income of $28,960, with 4,978 households (21.4%) in this group.
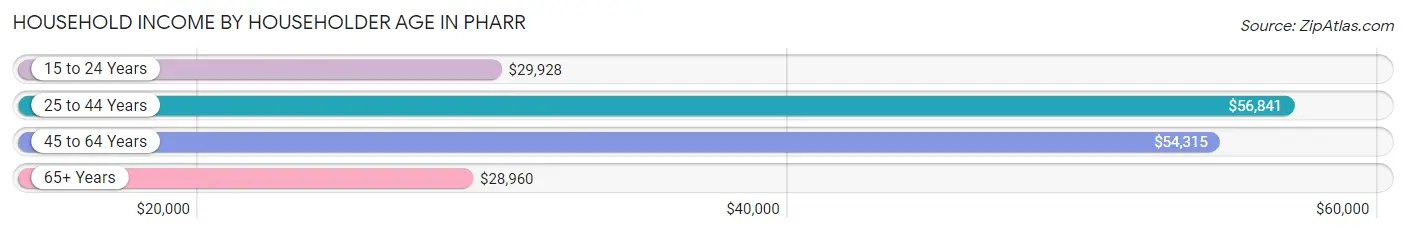
| Income Bracket | # Households | Median Income |
| 15 to 24 Years | 1,004 (4.3%) | $29,928 |
| 25 to 44 Years | 9,667 (41.5%) | $56,841 |
| 45 to 64 Years | 7,628 (32.8%) | $54,315 |
| 65+ Years | 4,978 (21.4%) | $28,960 |
| Total | 23,277 (100.0%) | $45,016 |
Poverty in Pharr
Income Below Poverty by Sex and Age in Pharr
With 28.3% poverty level for males and 32.3% for females among the residents of Pharr, 15 year old males and under 5 year old females are the most vulnerable to poverty, with 421 males (61.8%) and 1,777 females (50.4%) in their respective age groups living below the poverty level.
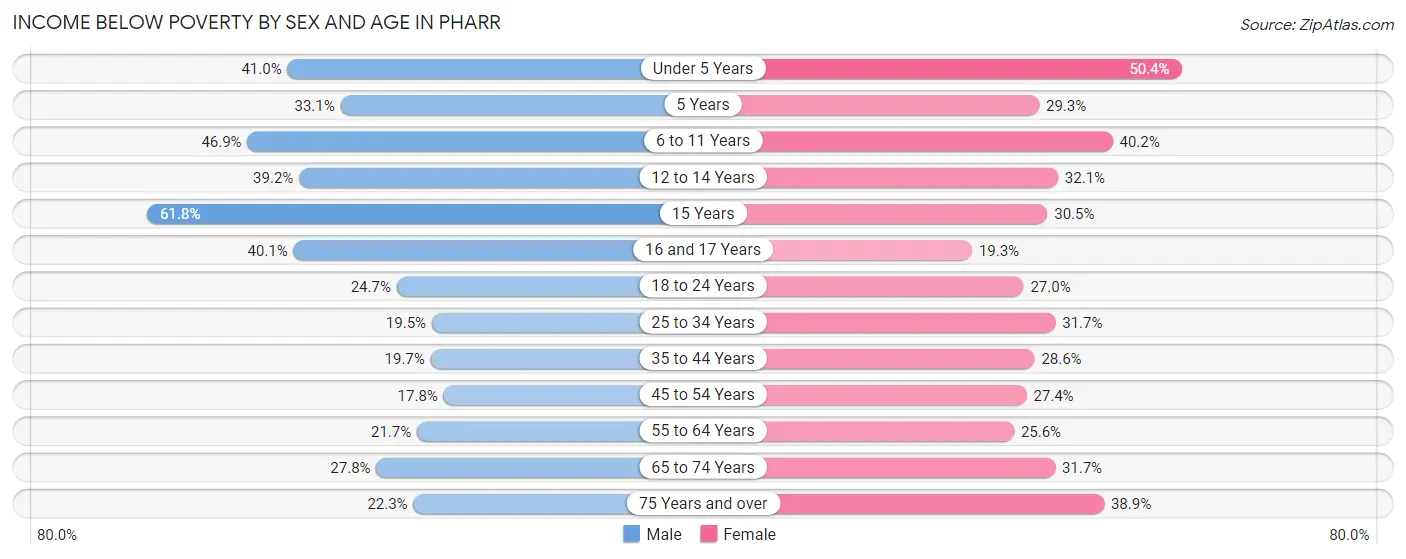
| Age Bracket | Male | Female |
| Under 5 Years | 1,466 (41.0%) | 1,777 (50.4%) |
| 5 Years | 268 (33.1%) | 111 (29.3%) |
| 6 to 11 Years | 1,715 (46.9%) | 1,749 (40.2%) |
| 12 to 14 Years | 794 (39.2%) | 1,023 (32.1%) |
| 15 Years | 421 (61.8%) | 271 (30.5%) |
| 16 and 17 Years | 618 (40.1%) | 279 (19.3%) |
| 18 to 24 Years | 1,041 (24.7%) | 1,187 (27.0%) |
| 25 to 34 Years | 1,013 (19.5%) | 1,921 (31.7%) |
| 35 to 44 Years | 1,123 (19.7%) | 1,330 (28.6%) |
| 45 to 54 Years | 648 (17.8%) | 1,217 (27.4%) |
| 55 to 64 Years | 679 (21.7%) | 794 (25.6%) |
| 65 to 74 Years | 591 (27.8%) | 827 (31.7%) |
| 75 Years and over | 371 (22.3%) | 818 (38.9%) |
| Total | 10,748 (28.3%) | 13,304 (32.3%) |
Income Above Poverty by Sex and Age in Pharr
According to the poverty statistics in Pharr, males aged 45 to 54 years and females aged 16 and 17 years are the age groups that are most secure financially, with 82.2% of males and 80.7% of females in these age groups living above the poverty line.
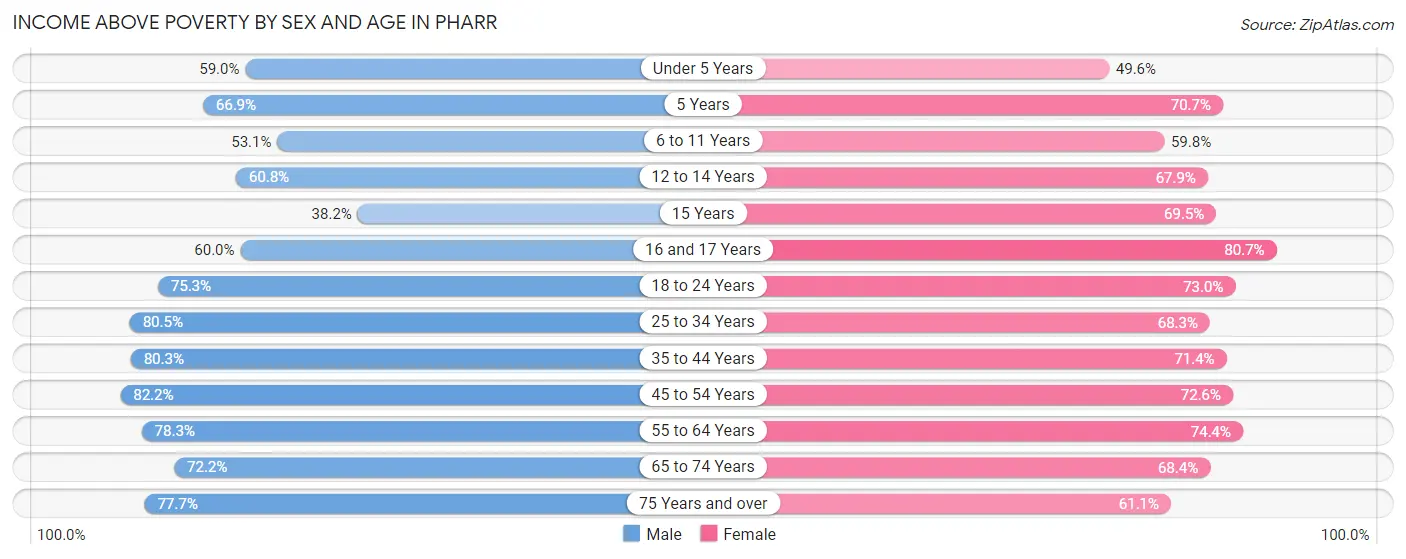
| Age Bracket | Male | Female |
| Under 5 Years | 2,113 (59.0%) | 1,747 (49.6%) |
| 5 Years | 542 (66.9%) | 268 (70.7%) |
| 6 to 11 Years | 1,941 (53.1%) | 2,602 (59.8%) |
| 12 to 14 Years | 1,230 (60.8%) | 2,165 (67.9%) |
| 15 Years | 260 (38.2%) | 617 (69.5%) |
| 16 and 17 Years | 925 (60.0%) | 1,164 (80.7%) |
| 18 to 24 Years | 3,167 (75.3%) | 3,212 (73.0%) |
| 25 to 34 Years | 4,176 (80.5%) | 4,139 (68.3%) |
| 35 to 44 Years | 4,575 (80.3%) | 3,318 (71.4%) |
| 45 to 54 Years | 2,999 (82.2%) | 3,221 (72.6%) |
| 55 to 64 Years | 2,445 (78.3%) | 2,312 (74.4%) |
| 65 to 74 Years | 1,538 (72.2%) | 1,786 (68.3%) |
| 75 Years and over | 1,296 (77.7%) | 1,283 (61.1%) |
| Total | 27,207 (71.7%) | 27,834 (67.7%) |
Income Below Poverty Among Married-Couple Families in Pharr
The poverty statistics for married-couple families in Pharr show that 20.8% or 2,479 of the total 11,891 families live below the poverty line. Families with 3 or 4 children have the highest poverty rate of 24.2%, comprising of 433 families. On the other hand, families with 5 or more children have the lowest poverty rate of 12.3%, which includes 9 families.
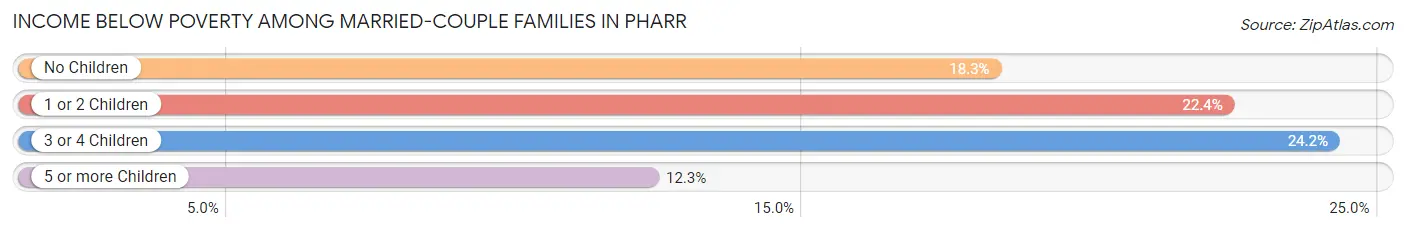
| Children | Above Poverty | Below Poverty |
| No Children | 4,102 (81.7%) | 918 (18.3%) |
| 1 or 2 Children | 3,888 (77.6%) | 1,119 (22.4%) |
| 3 or 4 Children | 1,358 (75.8%) | 433 (24.2%) |
| 5 or more Children | 64 (87.7%) | 9 (12.3%) |
| Total | 9,412 (79.1%) | 2,479 (20.8%) |
Income Below Poverty Among Single-Parent Households in Pharr
According to the poverty data in Pharr, 31.9% or 432 single-father households and 45.3% or 2,515 single-mother households are living below the poverty line. Among single-father households, those with 5 or more children have the highest poverty rate, with 15 households (100.0%) experiencing poverty. Likewise, among single-mother households, those with 3 or 4 children have the highest poverty rate, with 955 households (79.4%) falling below the poverty line.
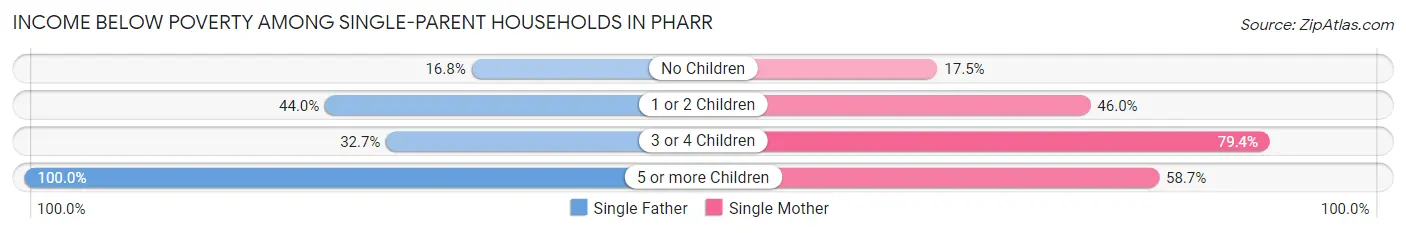
| Children | Single Father | Single Mother |
| No Children | 86 (16.8%) | 281 (17.5%) |
| 1 or 2 Children | 236 (44.0%) | 1,195 (46.0%) |
| 3 or 4 Children | 95 (32.7%) | 955 (79.4%) |
| 5 or more Children | 15 (100.0%) | 84 (58.7%) |
| Total | 432 (31.9%) | 2,515 (45.3%) |
Income Below Poverty Among Married-Couple vs Single-Parent Households in Pharr
The poverty data for Pharr shows that 2,479 of the married-couple family households (20.8%) and 2,947 of the single-parent households (42.6%) are living below the poverty level. Within the married-couple family households, those with 3 or 4 children have the highest poverty rate, with 433 households (24.2%) falling below the poverty line. Among the single-parent households, those with 3 or 4 children have the highest poverty rate, with 1,050 household (70.3%) living below poverty.
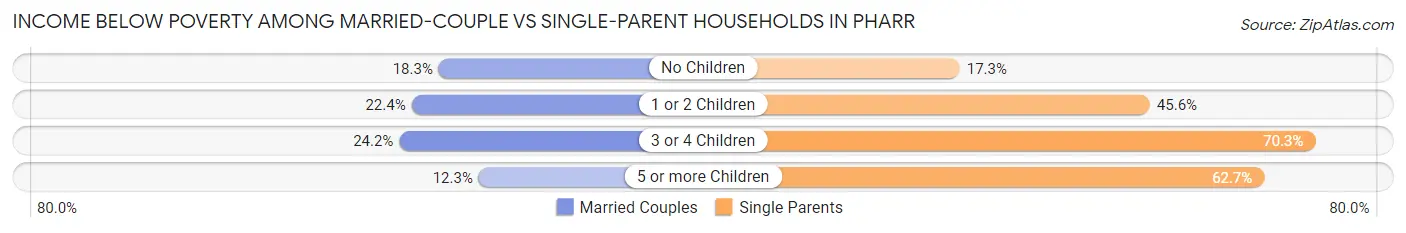
| Children | Married-Couple Families | Single-Parent Households |
| No Children | 918 (18.3%) | 367 (17.3%) |
| 1 or 2 Children | 1,119 (22.4%) | 1,431 (45.6%) |
| 3 or 4 Children | 433 (24.2%) | 1,050 (70.3%) |
| 5 or more Children | 9 (12.3%) | 99 (62.7%) |
| Total | 2,479 (20.8%) | 2,947 (42.6%) |
Race in Pharr
The most populous races in Pharr are Hispanic or Latino (75,480 | 95.0%), White / Caucasian (45,417 | 57.2%), and Two or more Races (24,746 | 31.1%).
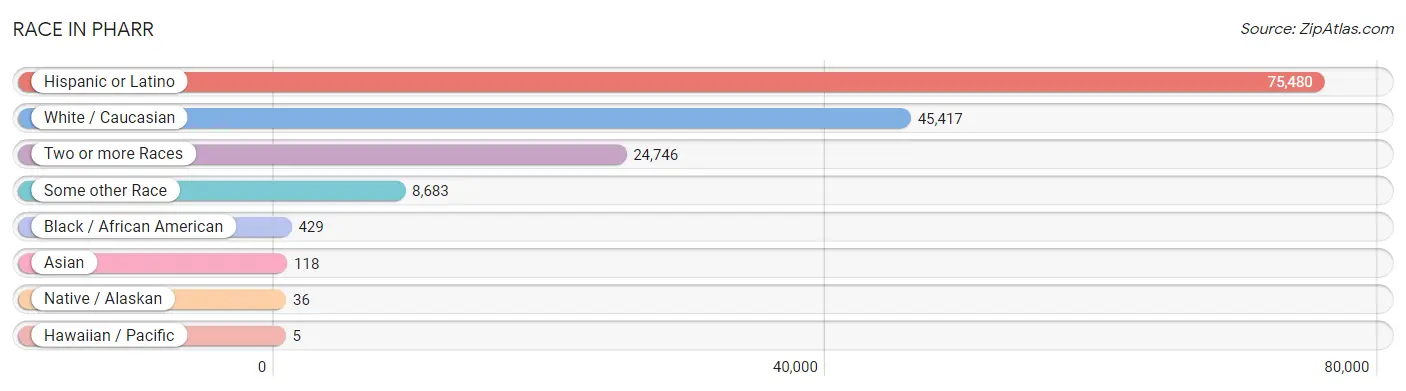
| Race | # Population | % Population |
| Asian | 118 | 0.2% |
| Black / African American | 429 | 0.5% |
| Hawaiian / Pacific | 5 | 0.0% |
| Hispanic or Latino | 75,480 | 95.0% |
| Native / Alaskan | 36 | 0.1% |
| White / Caucasian | 45,417 | 57.2% |
| Two or more Races | 24,746 | 31.1% |
| Some other Race | 8,683 | 10.9% |
| Total | 79,434 | 100.0% |
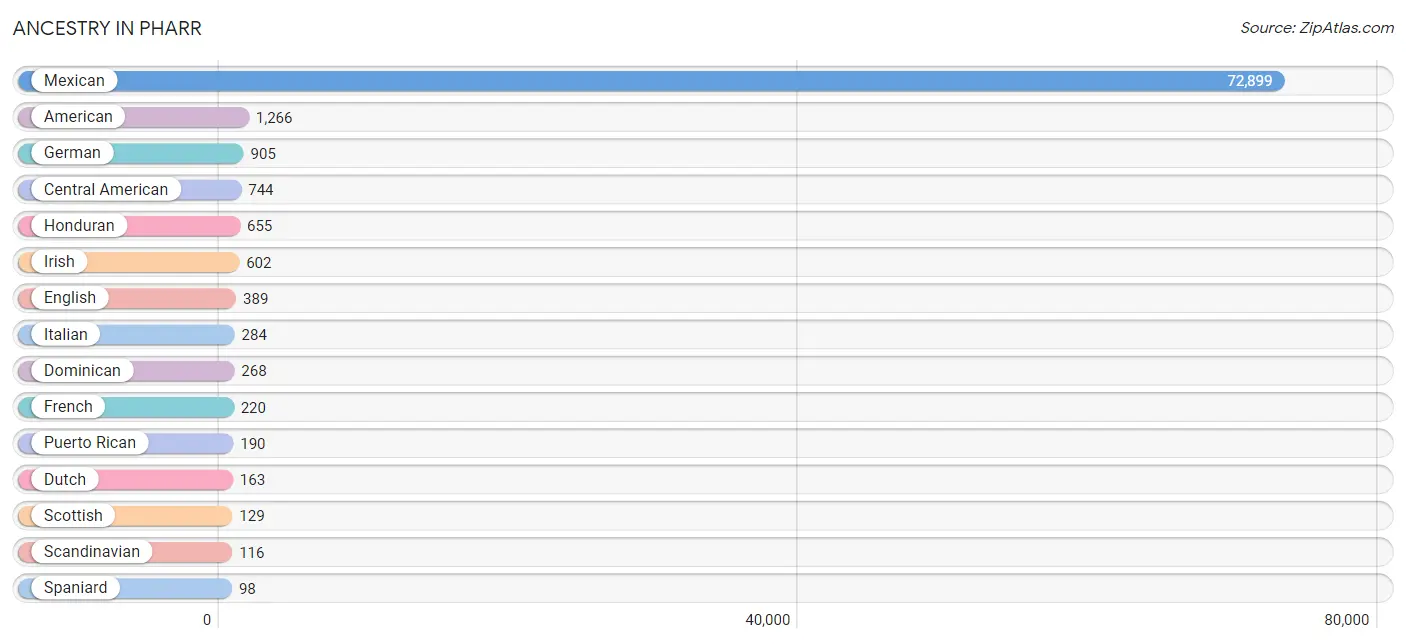
Ancestry in Pharr
The most populous ancestries reported in Pharr are Mexican (72,899 | 91.8%), American (1,266 | 1.6%), German (905 | 1.1%), Central American (744 | 0.9%), and Honduran (655 | 0.8%), together accounting for 96.3% of all Pharr residents.
| Ancestry | # Population | % Population |
| African | 20 | 0.0% |
| American | 1,266 | 1.6% |
| Apache | 10 | 0.0% |
| Arab | 47 | 0.1% |
| Argentinean | 15 | 0.0% |
| Belgian | 26 | 0.0% |
| Bhutanese | 20 | 0.0% |
| British | 59 | 0.1% |
| Canadian | 25 | 0.0% |
| Central American | 744 | 0.9% |
| Central American Indian | 52 | 0.1% |
| Cherokee | 6 | 0.0% |
| Chippewa | 5 | 0.0% |
| Colombian | 23 | 0.0% |
| Cuban | 45 | 0.1% |
| Dominican | 268 | 0.3% |
| Dutch | 163 | 0.2% |
| English | 389 | 0.5% |
| Estonian | 12 | 0.0% |
| European | 67 | 0.1% |
| Filipino | 86 | 0.1% |
| French | 220 | 0.3% |
| German | 905 | 1.1% |
| Greek | 9 | 0.0% |
| Guatemalan | 50 | 0.1% |
| Honduran | 655 | 0.8% |
| Hungarian | 13 | 0.0% |
| Indian (Asian) | 13 | 0.0% |
| Irish | 602 | 0.8% |
| Italian | 284 | 0.4% |
| Korean | 87 | 0.1% |
| Maltese | 25 | 0.0% |
| Mexican | 72,899 | 91.8% |
| Mexican American Indian | 60 | 0.1% |
| Navajo | 8 | 0.0% |
| Norwegian | 46 | 0.1% |
| Peruvian | 19 | 0.0% |
| Polish | 95 | 0.1% |
| Puerto Rican | 190 | 0.2% |
| Salvadoran | 39 | 0.1% |
| Samoan | 5 | 0.0% |
| Scandinavian | 116 | 0.2% |
| Scotch-Irish | 54 | 0.1% |
| Scottish | 129 | 0.2% |
| South American | 57 | 0.1% |
| Spaniard | 98 | 0.1% |
| Spanish | 11 | 0.0% |
| Subsaharan African | 20 | 0.0% |
| Swedish | 65 | 0.1% |
| Turkish | 25 | 0.0% | View All 50 Rows |
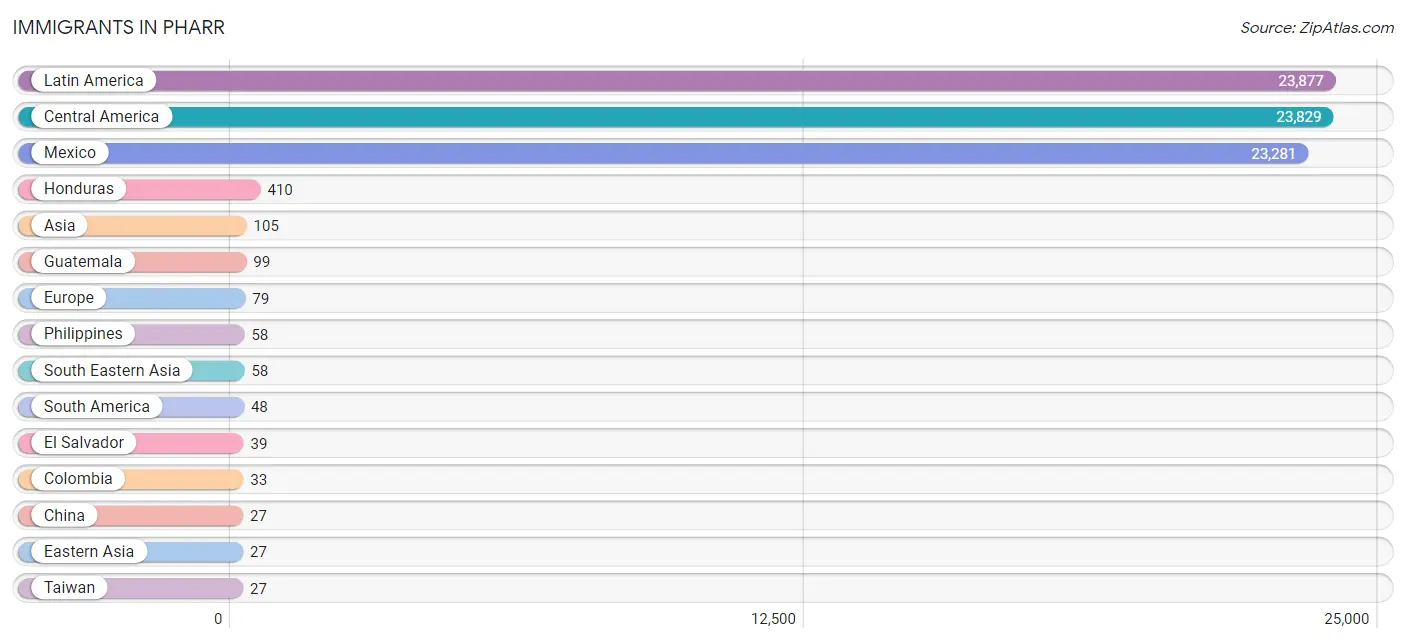
Immigrants in Pharr
The most numerous immigrant groups reported in Pharr came from Latin America (23,877 | 30.1%), Central America (23,829 | 30.0%), Mexico (23,281 | 29.3%), Honduras (410 | 0.5%), and Asia (105 | 0.1%), together accounting for 90.0% of all Pharr residents.
| Immigration Origin | # Population | % Population |
| Argentina | 15 | 0.0% |
| Asia | 105 | 0.1% |
| Belgium | 26 | 0.0% |
| Canada | 25 | 0.0% |
| Central America | 23,829 | 30.0% |
| China | 27 | 0.0% |
| Colombia | 33 | 0.0% |
| Eastern Asia | 27 | 0.0% |
| Eastern Europe | 12 | 0.0% |
| El Salvador | 39 | 0.1% |
| England | 23 | 0.0% |
| Europe | 79 | 0.1% |
| Guatemala | 99 | 0.1% |
| Honduras | 410 | 0.5% |
| Jordan | 12 | 0.0% |
| Latin America | 23,877 | 30.1% |
| Mexico | 23,281 | 29.3% |
| Northern Europe | 23 | 0.0% |
| Oceania | 5 | 0.0% |
| Philippines | 58 | 0.1% |
| South America | 48 | 0.1% |
| South Eastern Asia | 58 | 0.1% |
| Southern Europe | 18 | 0.0% |
| Spain | 7 | 0.0% |
| Taiwan | 27 | 0.0% |
| Turkey | 8 | 0.0% |
| Western Asia | 20 | 0.0% |
| Western Europe | 26 | 0.0% | View All 28 Rows |
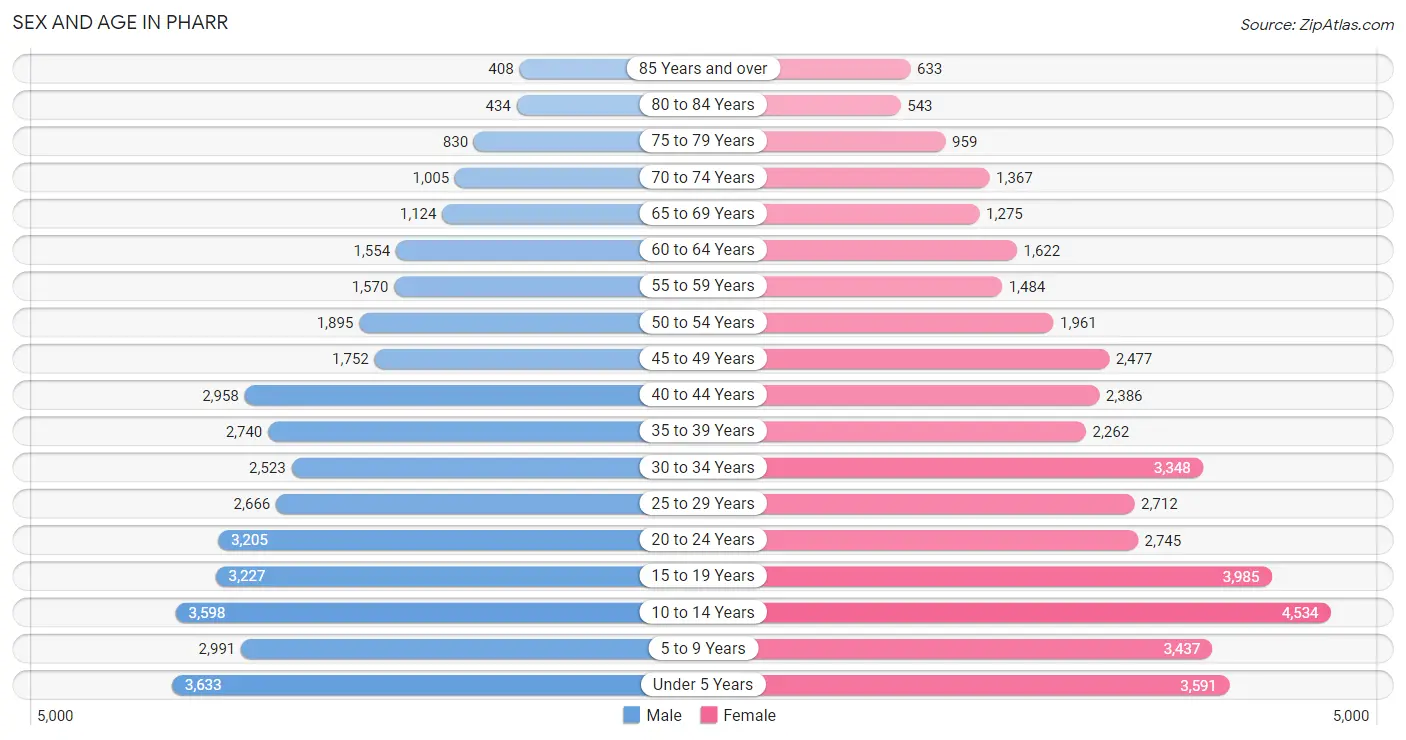
Sex and Age in Pharr
Sex and Age in Pharr
The most populous age groups in Pharr are Under 5 Years (3,633 | 9.5%) for men and 10 to 14 Years (4,534 | 11.0%) for women.
| Age Bracket | Male | Female |
| Under 5 Years | 3,633 (9.5%) | 3,591 (8.7%) |
| 5 to 9 Years | 2,991 (7.9%) | 3,437 (8.3%) |
| 10 to 14 Years | 3,598 (9.4%) | 4,534 (11.0%) |
| 15 to 19 Years | 3,227 (8.5%) | 3,985 (9.6%) |
| 20 to 24 Years | 3,205 (8.4%) | 2,745 (6.6%) |
| 25 to 29 Years | 2,666 (7.0%) | 2,712 (6.6%) |
| 30 to 34 Years | 2,523 (6.6%) | 3,348 (8.1%) |
| 35 to 39 Years | 2,740 (7.2%) | 2,262 (5.5%) |
| 40 to 44 Years | 2,958 (7.8%) | 2,386 (5.8%) |
| 45 to 49 Years | 1,752 (4.6%) | 2,477 (6.0%) |
| 50 to 54 Years | 1,895 (5.0%) | 1,961 (4.8%) |
| 55 to 59 Years | 1,570 (4.1%) | 1,484 (3.6%) |
| 60 to 64 Years | 1,554 (4.1%) | 1,622 (3.9%) |
| 65 to 69 Years | 1,124 (2.9%) | 1,275 (3.1%) |
| 70 to 74 Years | 1,005 (2.6%) | 1,367 (3.3%) |
| 75 to 79 Years | 830 (2.2%) | 959 (2.3%) |
| 80 to 84 Years | 434 (1.1%) | 543 (1.3%) |
| 85 Years and over | 408 (1.1%) | 633 (1.5%) |
| Total | 38,113 (100.0%) | 41,321 (100.0%) |
Families and Households in Pharr
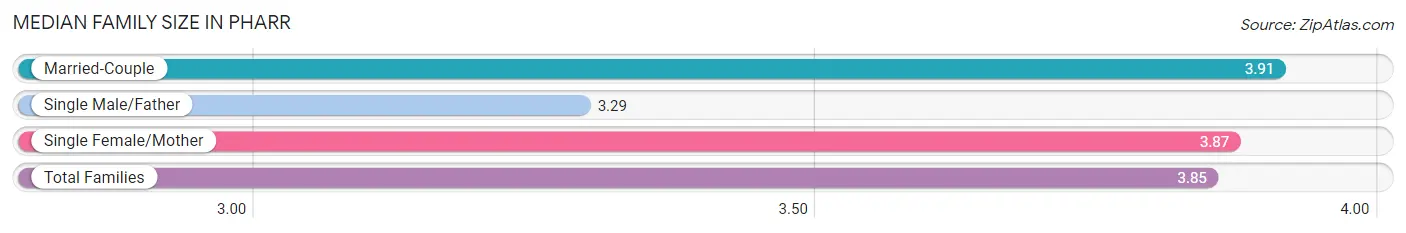
Median Family Size in Pharr
The median family size in Pharr is 3.85 persons per family, with married-couple families (11,891 | 63.2%) accounting for the largest median family size of 3.91 persons per family. On the other hand, single male/father families (1,355 | 7.2%) represent the smallest median family size with 3.29 persons per family.
| Family Type | # Families | Family Size |
| Married-Couple | 11,891 (63.2%) | 3.91 |
| Single Male/Father | 1,355 (7.2%) | 3.29 |
| Single Female/Mother | 5,555 (29.5%) | 3.87 |
| Total Families | 18,801 (100.0%) | 3.85 |
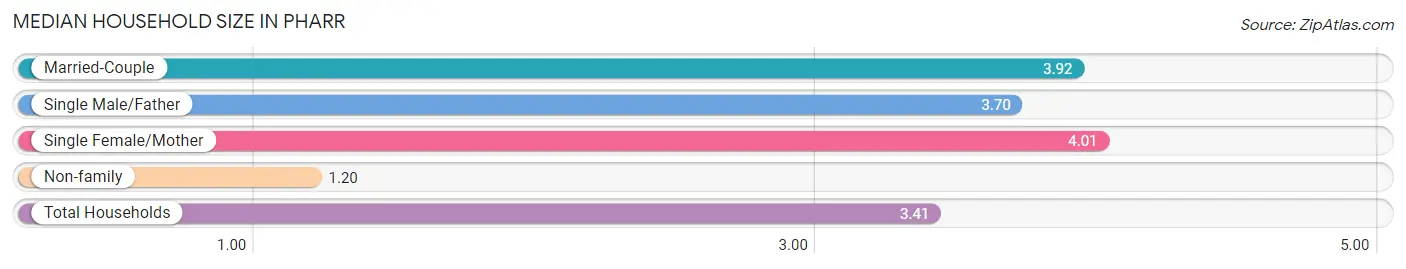
Median Household Size in Pharr
The median household size in Pharr is 3.41 persons per household, with single female/mother households (5,555 | 23.9%) accounting for the largest median household size of 4.01 persons per household. non-family households (4,476 | 19.2%) represent the smallest median household size with 1.20 persons per household.
| Household Type | # Households | Household Size |
| Married-Couple | 11,891 (51.1%) | 3.92 |
| Single Male/Father | 1,355 (5.8%) | 3.70 |
| Single Female/Mother | 5,555 (23.9%) | 4.01 |
| Non-family | 4,476 (19.2%) | 1.20 |
| Total Households | 23,277 (100.0%) | 3.41 |
Household Size by Marriage Status in Pharr
Out of a total of 23,277 households in Pharr, 18,801 (80.8%) are family households, while 4,476 (19.2%) are nonfamily households. The most numerous type of family households are 2-person households, comprising 4,979, and the most common type of nonfamily households are 1-person households, comprising 3,872.
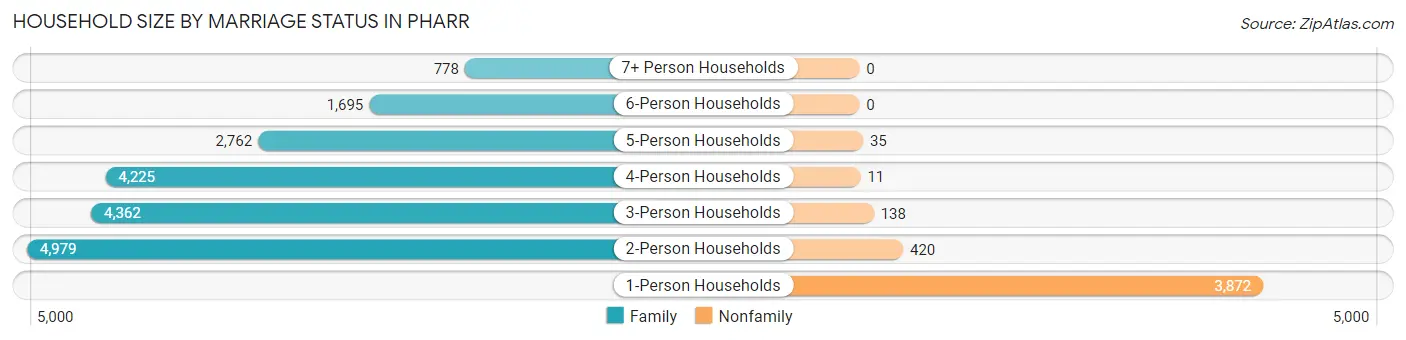
| Household Size | Family Households | Nonfamily Households |
| 1-Person Households | - | 3,872 (16.6%) |
| 2-Person Households | 4,979 (21.4%) | 420 (1.8%) |
| 3-Person Households | 4,362 (18.7%) | 138 (0.6%) |
| 4-Person Households | 4,225 (18.1%) | 11 (0.1%) |
| 5-Person Households | 2,762 (11.9%) | 35 (0.2%) |
| 6-Person Households | 1,695 (7.3%) | 0 (0.0%) |
| 7+ Person Households | 778 (3.3%) | 0 (0.0%) |
| Total | 18,801 (80.8%) | 4,476 (19.2%) |
Female Fertility in Pharr
Fertility by Age in Pharr
Average fertility rate in Pharr is 56.0 births per 1,000 women. Women in the age bracket of 20 to 34 years have the highest fertility rate with 94.0 births per 1,000 women. Women in the age bracket of 20 to 34 years acount for 72.3% of all women with births.
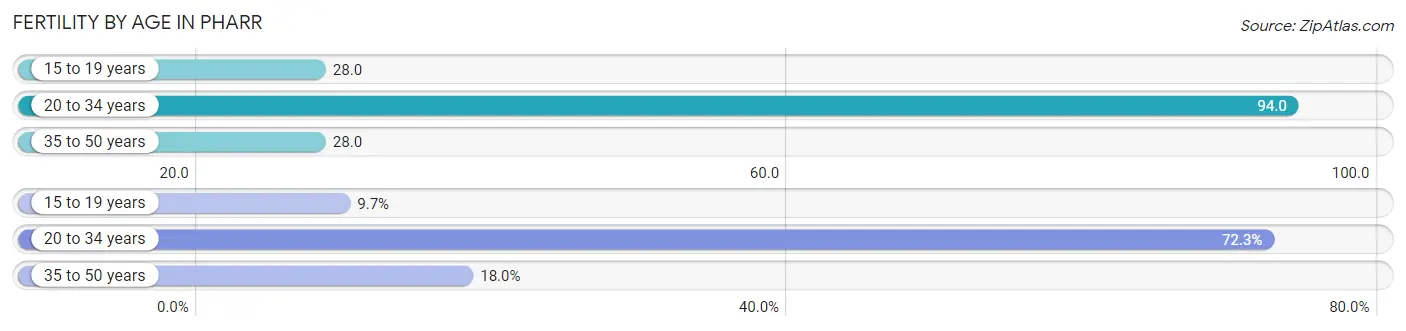
| Age Bracket | Women with Births | Births / 1,000 Women |
| 15 to 19 years | 110 (9.7%) | 28.0 |
| 20 to 34 years | 824 (72.3%) | 94.0 |
| 35 to 50 years | 205 (18.0%) | 28.0 |
| Total | 1,139 (100.0%) | 56.0 |
Fertility by Age by Marriage Status in Pharr
63.8% of women with births (1,139) in Pharr are married. The highest percentage of unmarried women with births falls into 15 to 19 years age bracket with 86.4% of them unmarried at the time of birth, while the lowest percentage of unmarried women with births belong to 35 to 50 years age bracket with 18.0% of them unmarried.
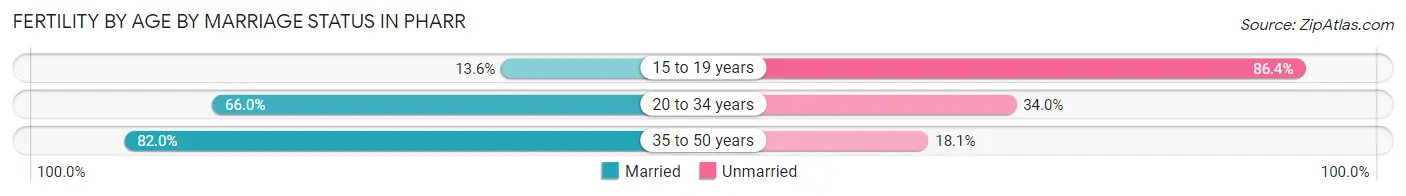
| Age Bracket | Married | Unmarried |
| 15 to 19 years | 15 (13.6%) | 95 (86.4%) |
| 20 to 34 years | 544 (66.0%) | 280 (34.0%) |
| 35 to 50 years | 168 (82.0%) | 37 (18.0%) |
| Total | 727 (63.8%) | 412 (36.2%) |
Fertility by Education in Pharr
Average fertility rate in Pharr is 56.0 births per 1,000 women. Women with the education attainment of graduate degree have the highest fertility rate of 124.0 births per 1,000 women, while women with the education attainment of high school diploma have the lowest fertility at 42.0 births per 1,000 women. Women with the education attainment of college or associate's degree represent 41.2% of all women with births.
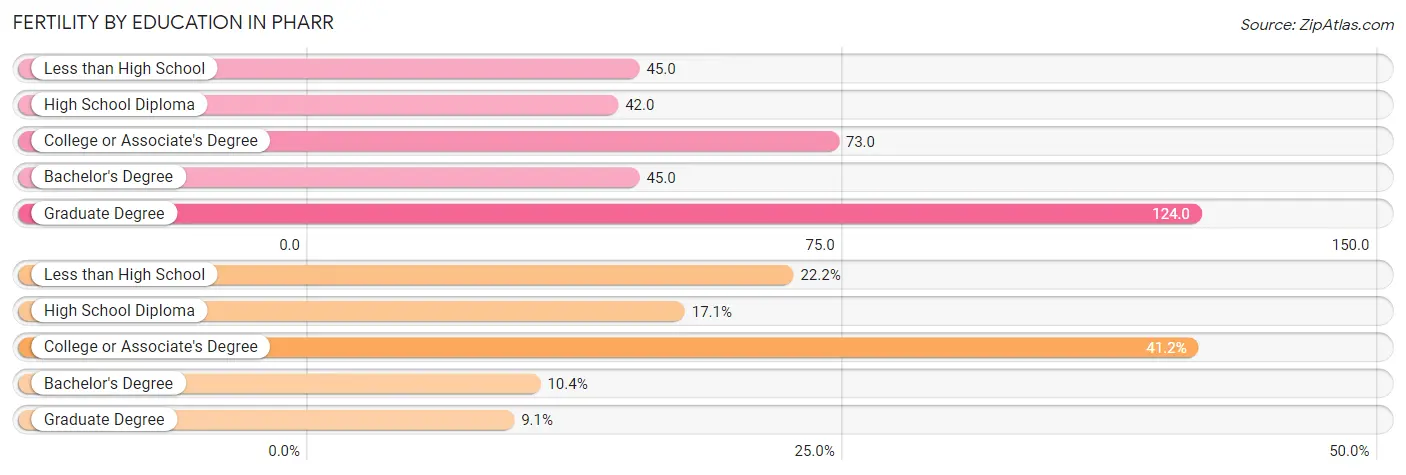
| Educational Attainment | Women with Births | Births / 1,000 Women |
| Less than High School | 253 (22.2%) | 45.0 |
| High School Diploma | 195 (17.1%) | 42.0 |
| College or Associate's Degree | 469 (41.2%) | 73.0 |
| Bachelor's Degree | 118 (10.4%) | 45.0 |
| Graduate Degree | 104 (9.1%) | 124.0 |
| Total | 1,139 (100.0%) | 56.0 |
Fertility by Education by Marriage Status in Pharr
36.2% of women with births in Pharr are unmarried. Women with the educational attainment of less than high school are most likely to be married with 88.1% of them married at childbirth, while women with the educational attainment of high school diploma are least likely to be married with 45.6% of them unmarried at childbirth.
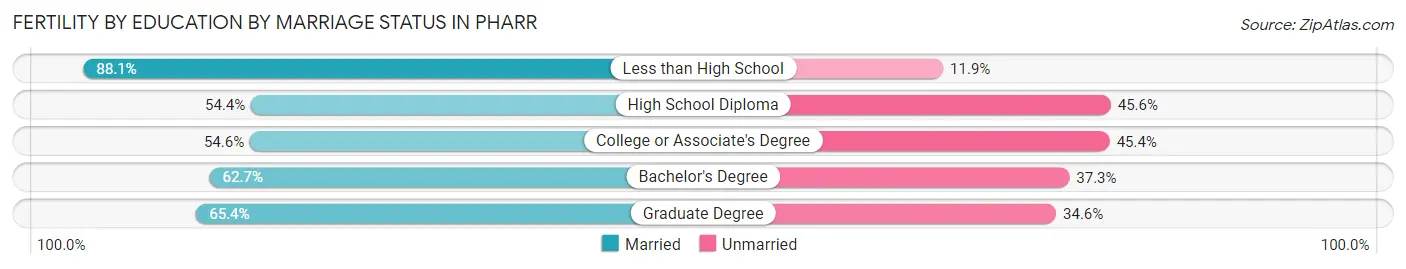
| Educational Attainment | Married | Unmarried |
| Less than High School | 223 (88.1%) | 30 (11.9%) |
| High School Diploma | 106 (54.4%) | 89 (45.6%) |
| College or Associate's Degree | 256 (54.6%) | 213 (45.4%) |
| Bachelor's Degree | 74 (62.7%) | 44 (37.3%) |
| Graduate Degree | 68 (65.4%) | 36 (34.6%) |
| Total | 727 (63.8%) | 412 (36.2%) |
Employment Characteristics in Pharr
Employment by Class of Employer in Pharr
Among the 30,867 employed individuals in Pharr, private company employees (21,319 | 69.1%), self-employed (not incorporated) (3,116 | 10.1%), and local government employees (2,271 | 7.4%) make up the most common classes of employment.
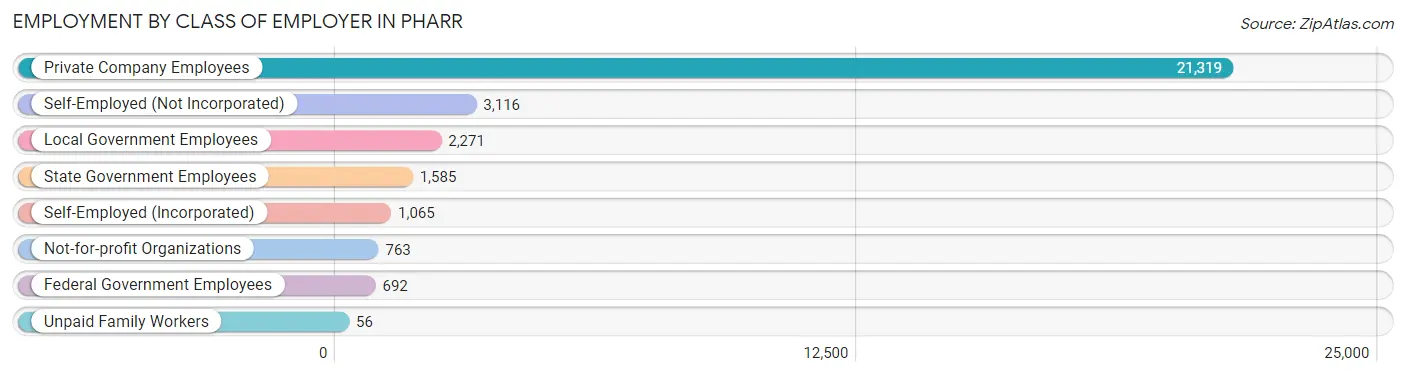
| Employer Class | # Employees | % Employees |
| Private Company Employees | 21,319 | 69.1% |
| Self-Employed (Incorporated) | 1,065 | 3.5% |
| Self-Employed (Not Incorporated) | 3,116 | 10.1% |
| Not-for-profit Organizations | 763 | 2.5% |
| Local Government Employees | 2,271 | 7.4% |
| State Government Employees | 1,585 | 5.1% |
| Federal Government Employees | 692 | 2.2% |
| Unpaid Family Workers | 56 | 0.2% |
| Total | 30,867 | 100.0% |
Employment Status by Age in Pharr
According to the labor force statistics for Pharr, out of the total population over 16 years of age (56,081), 59.5% or 33,368 individuals are in the labor force, with 6.1% or 2,035 of them unemployed. The age group with the highest labor force participation rate is 45 to 54 years, with 79.8% or 6,452 individuals in the labor force. Within the labor force, the 16 to 19 years age range has the highest percentage of unemployed individuals, with 26.9% or 525 of them being unemployed.
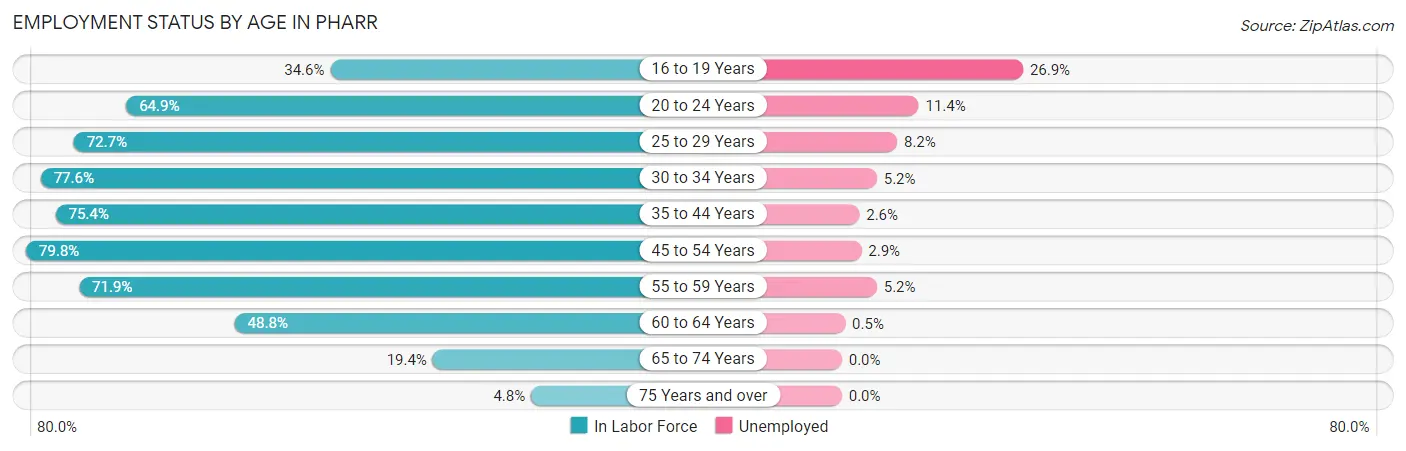
| Age Bracket | In Labor Force | Unemployed |
| 16 to 19 Years | 1,952 (34.6%) | 525 (26.9%) |
| 20 to 24 Years | 3,862 (64.9%) | 440 (11.4%) |
| 25 to 29 Years | 3,910 (72.7%) | 321 (8.2%) |
| 30 to 34 Years | 4,556 (77.6%) | 237 (5.2%) |
| 35 to 44 Years | 7,801 (75.4%) | 203 (2.6%) |
| 45 to 54 Years | 6,452 (79.8%) | 187 (2.9%) |
| 55 to 59 Years | 2,196 (71.9%) | 114 (5.2%) |
| 60 to 64 Years | 1,550 (48.8%) | 8 (0.5%) |
| 65 to 74 Years | 926 (19.4%) | 0 (0.0%) |
| 75 Years and over | 183 (4.8%) | 0 (0.0%) |
| Total | 33,368 (59.5%) | 2,035 (6.1%) |
Employment Status by Educational Attainment in Pharr
According to labor force statistics for Pharr, 73.7% of individuals (26,466) out of the total population between 25 and 64 years of age (35,910) are in the labor force, with 4.0% or 1,059 of them being unemployed. The group with the highest labor force participation rate are those with the educational attainment of bachelor's degree or higher, with 82.3% or 5,737 individuals in the labor force. Within the labor force, individuals with high school diploma education have the highest percentage of unemployment, with 4.7% or 358 of them being unemployed.
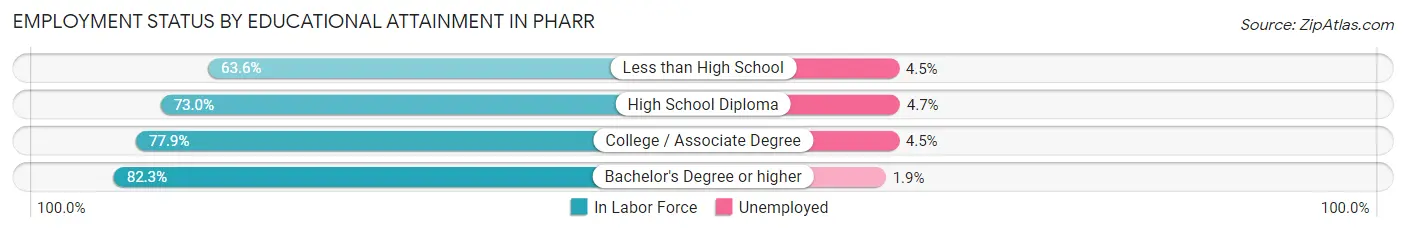
| Educational Attainment | In Labor Force | Unemployed |
| Less than High School | 5,827 (63.6%) | 412 (4.5%) |
| High School Diploma | 7,621 (73.0%) | 491 (4.7%) |
| College / Associate Degree | 7,274 (77.9%) | 420 (4.5%) |
| Bachelor's Degree or higher | 5,737 (82.3%) | 132 (1.9%) |
| Total | 26,466 (73.7%) | 1,436 (4.0%) |
Employment Occupations by Sex in Pharr
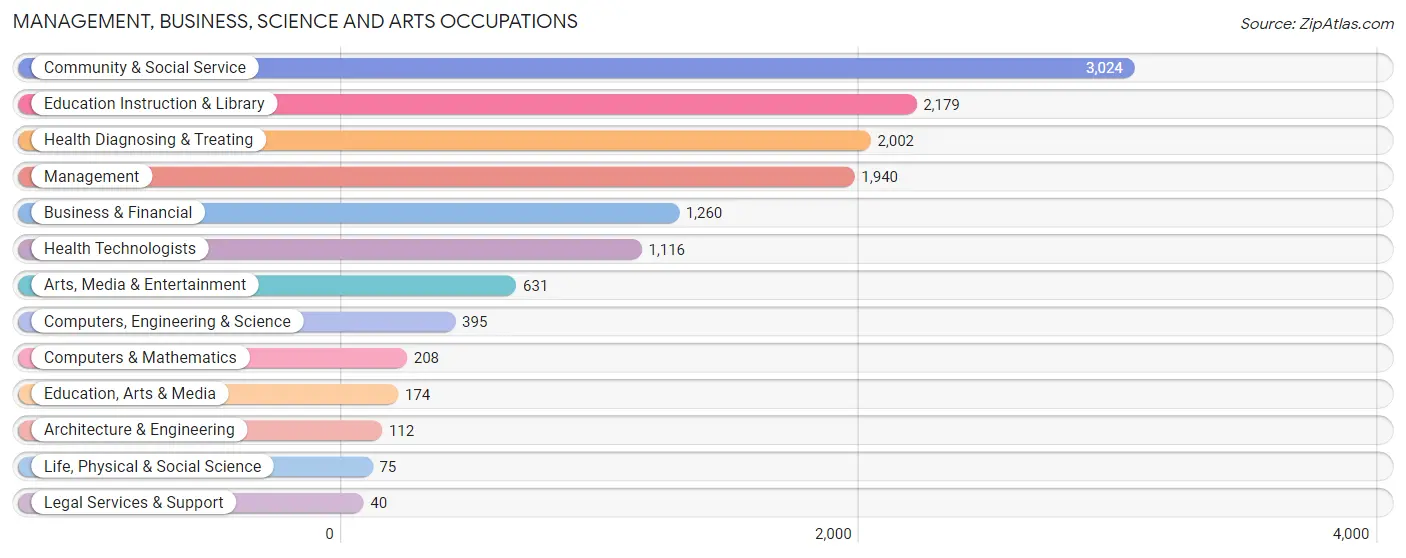
Management, Business, Science and Arts Occupations
The most common Management, Business, Science and Arts occupations in Pharr are Community & Social Service (3,024 | 9.7%), Education Instruction & Library (2,179 | 7.0%), Health Diagnosing & Treating (2,002 | 6.4%), Management (1,940 | 6.2%), and Business & Financial (1,260 | 4.0%).
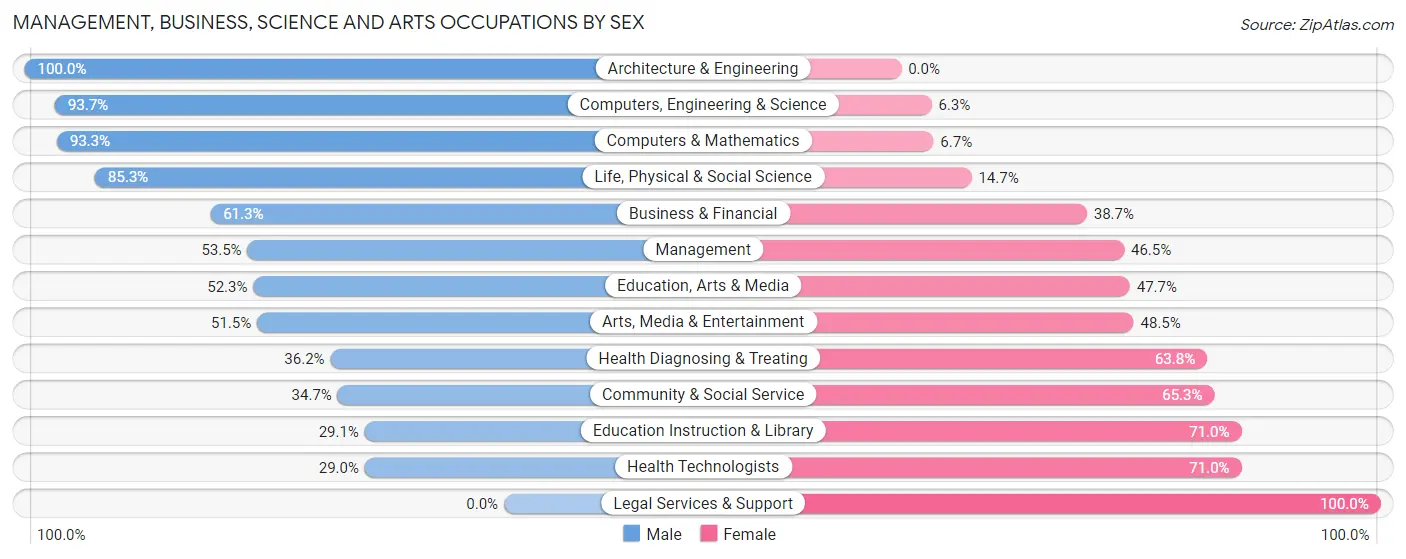
Management, Business, Science and Arts Occupations by Sex
Within the Management, Business, Science and Arts occupations in Pharr, the most male-oriented occupations are Architecture & Engineering (100.0%), Computers, Engineering & Science (93.7%), and Computers & Mathematics (93.3%), while the most female-oriented occupations are Legal Services & Support (100.0%), Health Technologists (71.0%), and Education Instruction & Library (71.0%).
| Occupation | Male | Female |
| Management | 1,038 (53.5%) | 902 (46.5%) |
| Business & Financial | 772 (61.3%) | 488 (38.7%) |
| Computers, Engineering & Science | 370 (93.7%) | 25 (6.3%) |
| Computers & Mathematics | 194 (93.3%) | 14 (6.7%) |
| Architecture & Engineering | 112 (100.0%) | 0 (0.0%) |
| Life, Physical & Social Science | 64 (85.3%) | 11 (14.7%) |
| Community & Social Service | 1,049 (34.7%) | 1,975 (65.3%) |
| Education, Arts & Media | 91 (52.3%) | 83 (47.7%) |
| Legal Services & Support | 0 (0.0%) | 40 (100.0%) |
| Education Instruction & Library | 633 (29.0%) | 1,546 (71.0%) |
| Arts, Media & Entertainment | 325 (51.5%) | 306 (48.5%) |
| Health Diagnosing & Treating | 725 (36.2%) | 1,277 (63.8%) |
| Health Technologists | 324 (29.0%) | 792 (71.0%) |
| Total (Category) | 3,954 (45.9%) | 4,667 (54.1%) |
| Total (Overall) | 17,524 (56.0%) | 13,792 (44.0%) |
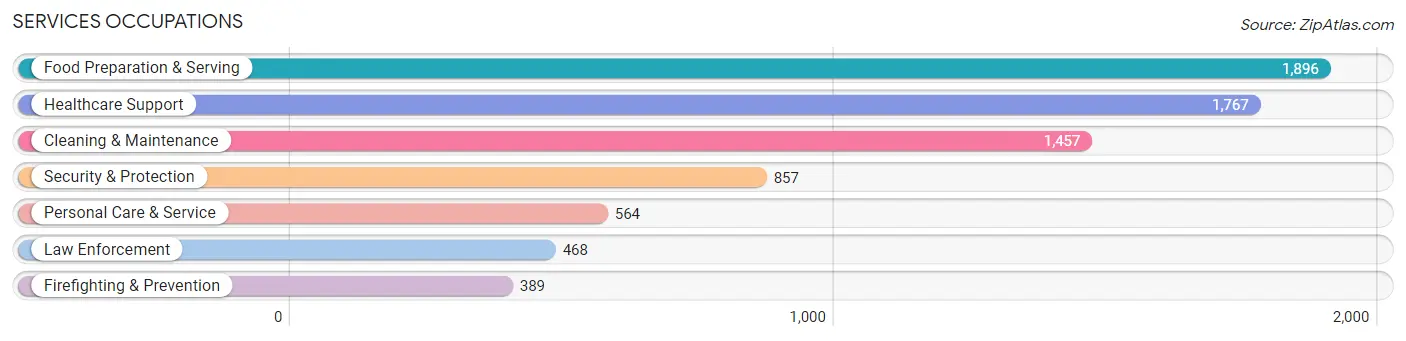
Services Occupations
The most common Services occupations in Pharr are Food Preparation & Serving (1,896 | 6.0%), Healthcare Support (1,767 | 5.6%), Cleaning & Maintenance (1,457 | 4.6%), Security & Protection (857 | 2.7%), and Personal Care & Service (564 | 1.8%).
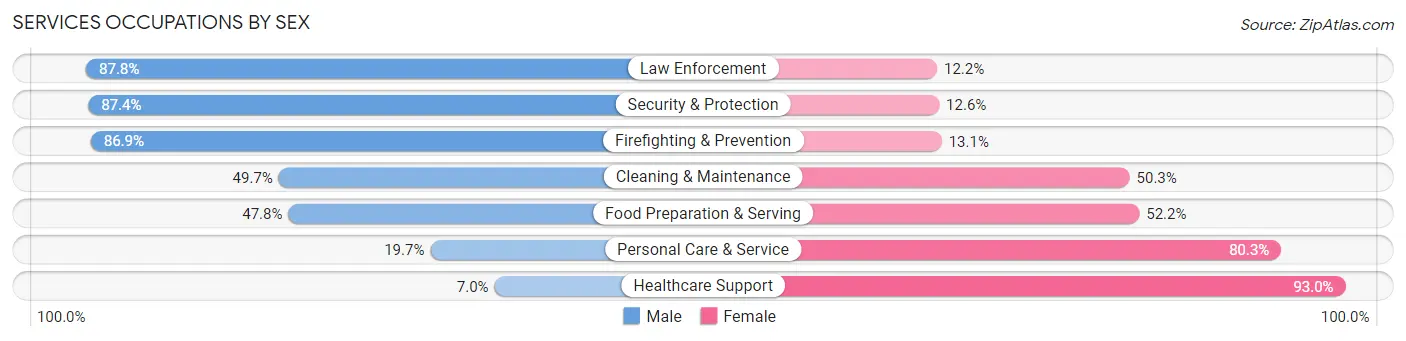
Services Occupations by Sex
Within the Services occupations in Pharr, the most male-oriented occupations are Law Enforcement (87.8%), Security & Protection (87.4%), and Firefighting & Prevention (86.9%), while the most female-oriented occupations are Healthcare Support (93.0%), Personal Care & Service (80.3%), and Food Preparation & Serving (52.2%).
| Occupation | Male | Female |
| Healthcare Support | 123 (7.0%) | 1,644 (93.0%) |
| Security & Protection | 749 (87.4%) | 108 (12.6%) |
| Firefighting & Prevention | 338 (86.9%) | 51 (13.1%) |
| Law Enforcement | 411 (87.8%) | 57 (12.2%) |
| Food Preparation & Serving | 906 (47.8%) | 990 (52.2%) |
| Cleaning & Maintenance | 724 (49.7%) | 733 (50.3%) |
| Personal Care & Service | 111 (19.7%) | 453 (80.3%) |
| Total (Category) | 2,613 (40.0%) | 3,928 (60.1%) |
| Total (Overall) | 17,524 (56.0%) | 13,792 (44.0%) |
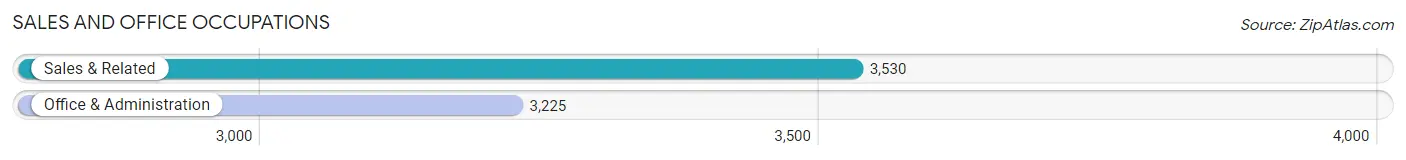
Sales and Office Occupations
The most common Sales and Office occupations in Pharr are Sales & Related (3,530 | 11.3%), and Office & Administration (3,225 | 10.3%).
Sales and Office Occupations by Sex
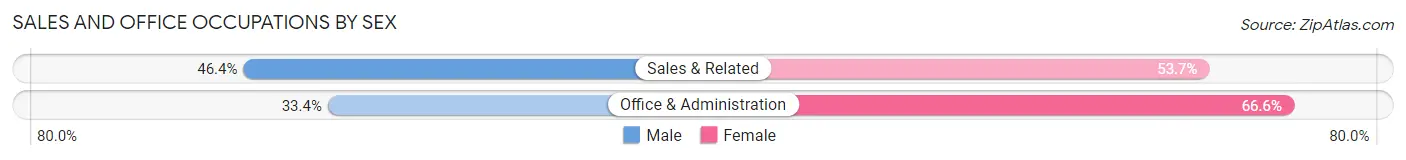
| Occupation | Male | Female |
| Sales & Related | 1,636 (46.4%) | 1,894 (53.6%) |
| Office & Administration | 1,076 (33.4%) | 2,149 (66.6%) |
| Total (Category) | 2,712 (40.2%) | 4,043 (59.9%) |
| Total (Overall) | 17,524 (56.0%) | 13,792 (44.0%) |
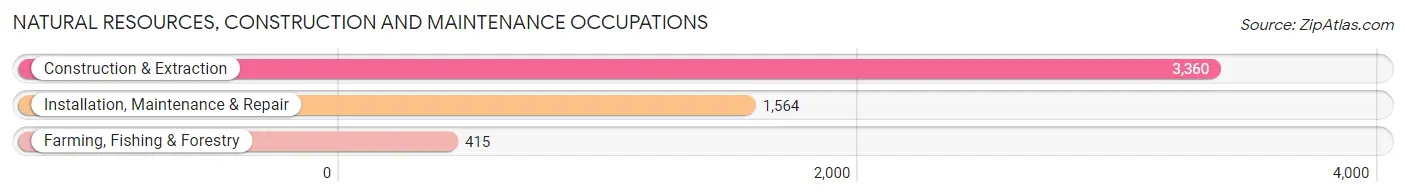
Natural Resources, Construction and Maintenance Occupations
The most common Natural Resources, Construction and Maintenance occupations in Pharr are Construction & Extraction (3,360 | 10.7%), Installation, Maintenance & Repair (1,564 | 5.0%), and Farming, Fishing & Forestry (415 | 1.3%).
Natural Resources, Construction and Maintenance Occupations by Sex
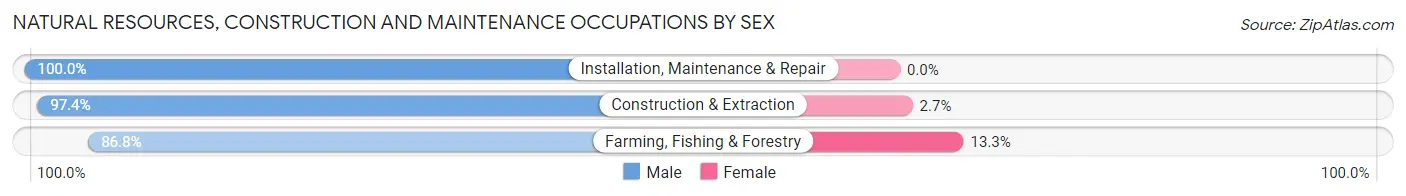
| Occupation | Male | Female |
| Farming, Fishing & Forestry | 360 (86.8%) | 55 (13.3%) |
| Construction & Extraction | 3,271 (97.4%) | 89 (2.6%) |
| Installation, Maintenance & Repair | 1,564 (100.0%) | 0 (0.0%) |
| Total (Category) | 5,195 (97.3%) | 144 (2.7%) |
| Total (Overall) | 17,524 (56.0%) | 13,792 (44.0%) |
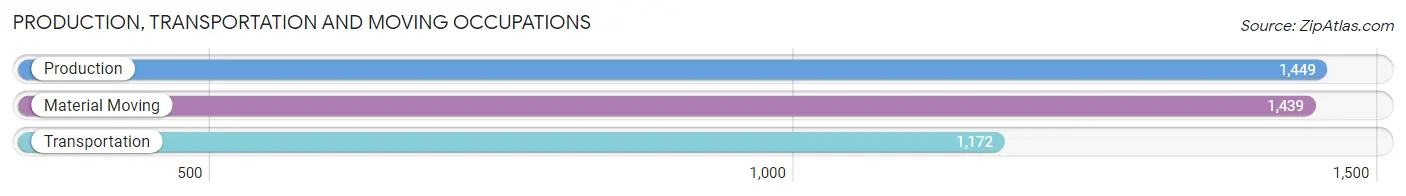
Production, Transportation and Moving Occupations
The most common Production, Transportation and Moving occupations in Pharr are Production (1,449 | 4.6%), Material Moving (1,439 | 4.6%), and Transportation (1,172 | 3.7%).
Production, Transportation and Moving Occupations by Sex
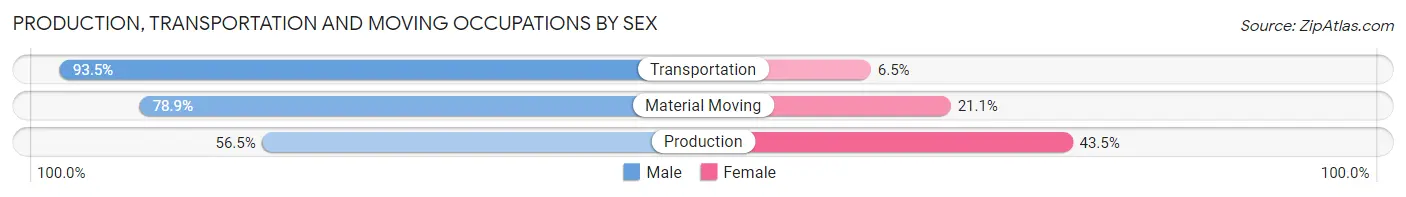
| Occupation | Male | Female |
| Production | 819 (56.5%) | 630 (43.5%) |
| Transportation | 1,096 (93.5%) | 76 (6.5%) |
| Material Moving | 1,135 (78.9%) | 304 (21.1%) |
| Total (Category) | 3,050 (75.1%) | 1,010 (24.9%) |
| Total (Overall) | 17,524 (56.0%) | 13,792 (44.0%) |
Employment Industries by Sex in Pharr
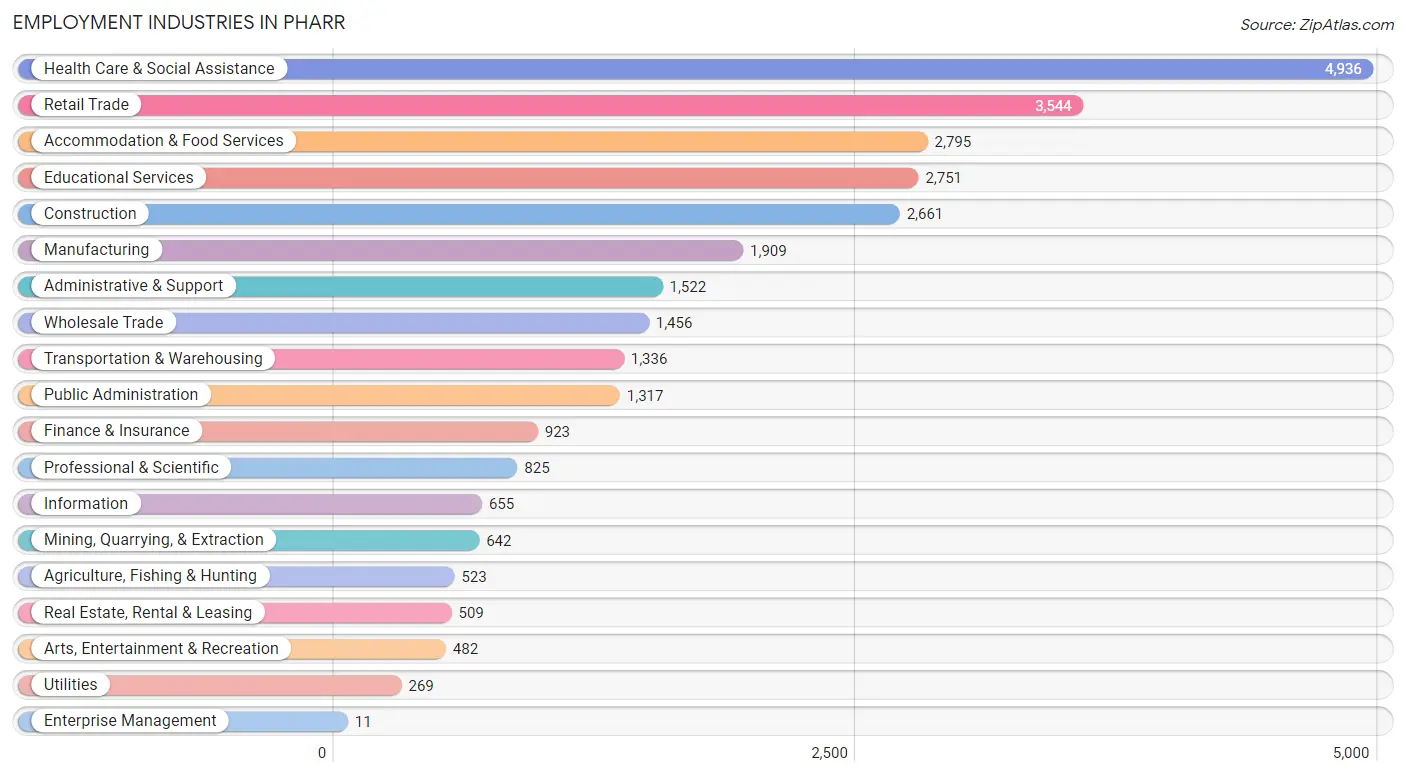
Employment Industries in Pharr
The major employment industries in Pharr include Health Care & Social Assistance (4,936 | 15.8%), Retail Trade (3,544 | 11.3%), Accommodation & Food Services (2,795 | 8.9%), Educational Services (2,751 | 8.8%), and Construction (2,661 | 8.5%).
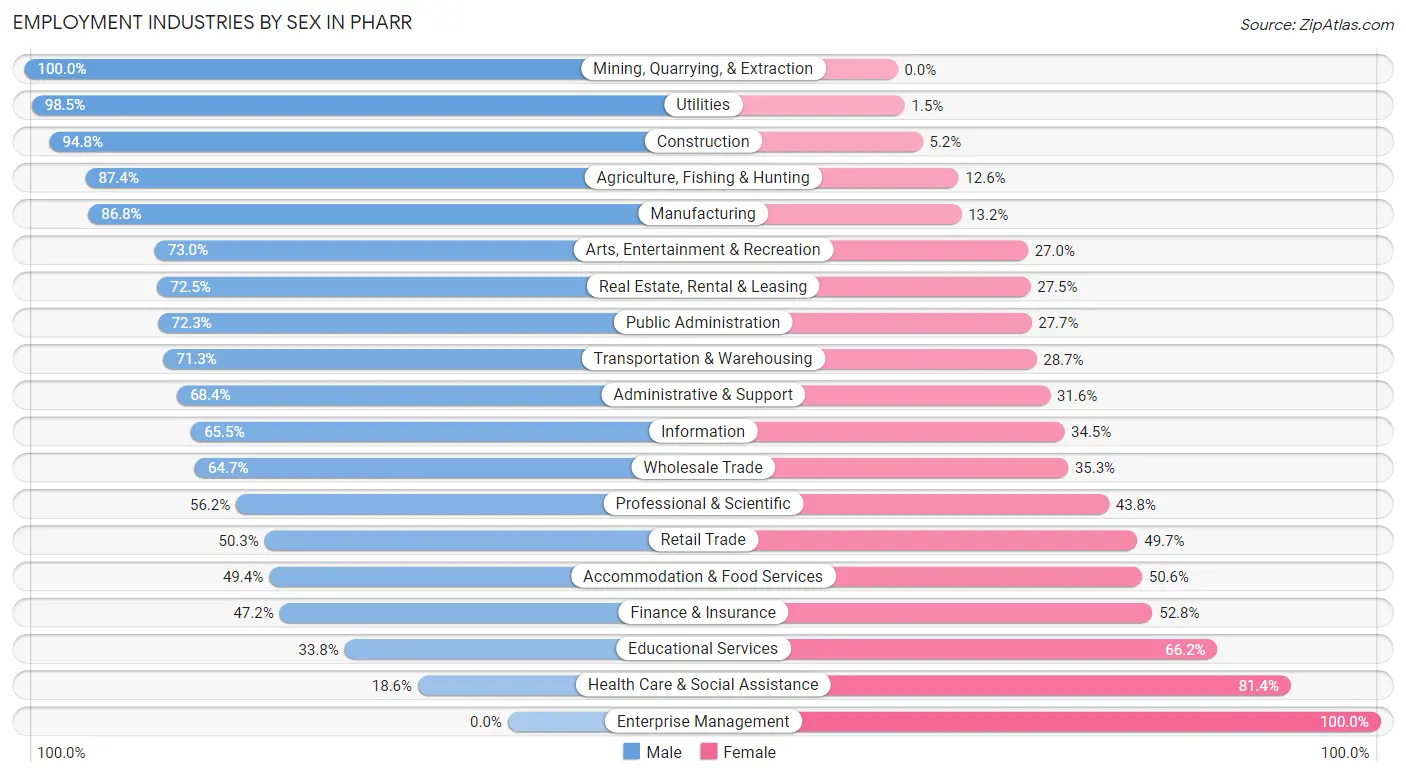
Employment Industries by Sex in Pharr
The Pharr industries that see more men than women are Mining, Quarrying, & Extraction (100.0%), Utilities (98.5%), and Construction (94.8%), whereas the industries that tend to have a higher number of women are Enterprise Management (100.0%), Health Care & Social Assistance (81.4%), and Educational Services (66.2%).
| Industry | Male | Female |
| Agriculture, Fishing & Hunting | 457 (87.4%) | 66 (12.6%) |
| Mining, Quarrying, & Extraction | 642 (100.0%) | 0 (0.0%) |
| Construction | 2,523 (94.8%) | 138 (5.2%) |
| Manufacturing | 1,657 (86.8%) | 252 (13.2%) |
| Wholesale Trade | 942 (64.7%) | 514 (35.3%) |
| Retail Trade | 1,784 (50.3%) | 1,760 (49.7%) |
| Transportation & Warehousing | 952 (71.3%) | 384 (28.7%) |
| Utilities | 265 (98.5%) | 4 (1.5%) |
| Information | 429 (65.5%) | 226 (34.5%) |
| Finance & Insurance | 436 (47.2%) | 487 (52.8%) |
| Real Estate, Rental & Leasing | 369 (72.5%) | 140 (27.5%) |
| Professional & Scientific | 464 (56.2%) | 361 (43.8%) |
| Enterprise Management | 0 (0.0%) | 11 (100.0%) |
| Administrative & Support | 1,041 (68.4%) | 481 (31.6%) |
| Educational Services | 929 (33.8%) | 1,822 (66.2%) |
| Health Care & Social Assistance | 918 (18.6%) | 4,018 (81.4%) |
| Arts, Entertainment & Recreation | 352 (73.0%) | 130 (27.0%) |
| Accommodation & Food Services | 1,381 (49.4%) | 1,414 (50.6%) |
| Public Administration | 952 (72.3%) | 365 (27.7%) |
| Total | 17,524 (56.0%) | 13,792 (44.0%) |
Education in Pharr
School Enrollment in Pharr
The most common levels of schooling among the 25,389 students in Pharr are high school (6,052 | 23.8%), middle school (5,373 | 21.2%), and elementary school (5,175 | 20.4%).
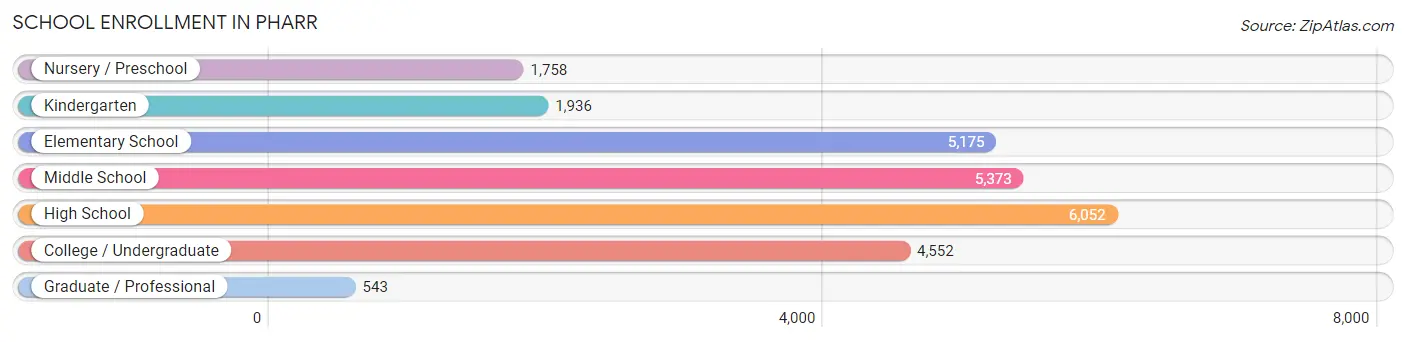
| School Level | # Students | % Students |
| Nursery / Preschool | 1,758 | 6.9% |
| Kindergarten | 1,936 | 7.6% |
| Elementary School | 5,175 | 20.4% |
| Middle School | 5,373 | 21.2% |
| High School | 6,052 | 23.8% |
| College / Undergraduate | 4,552 | 17.9% |
| Graduate / Professional | 543 | 2.1% |
| Total | 25,389 | 100.0% |
School Enrollment by Age by Funding Source in Pharr
Out of a total of 25,389 students who are enrolled in schools in Pharr, 711 (2.8%) attend a private institution, while the remaining 24,678 (97.2%) are enrolled in public schools. The age group of 25 to 34 year olds has the highest likelihood of being enrolled in private schools, with 68 (7.4% in the age bracket) enrolled. Conversely, the age group of 3 to 4 year olds has the lowest likelihood of being enrolled in a private school, with 1,963 (99.4% in the age bracket) attending a public institution.
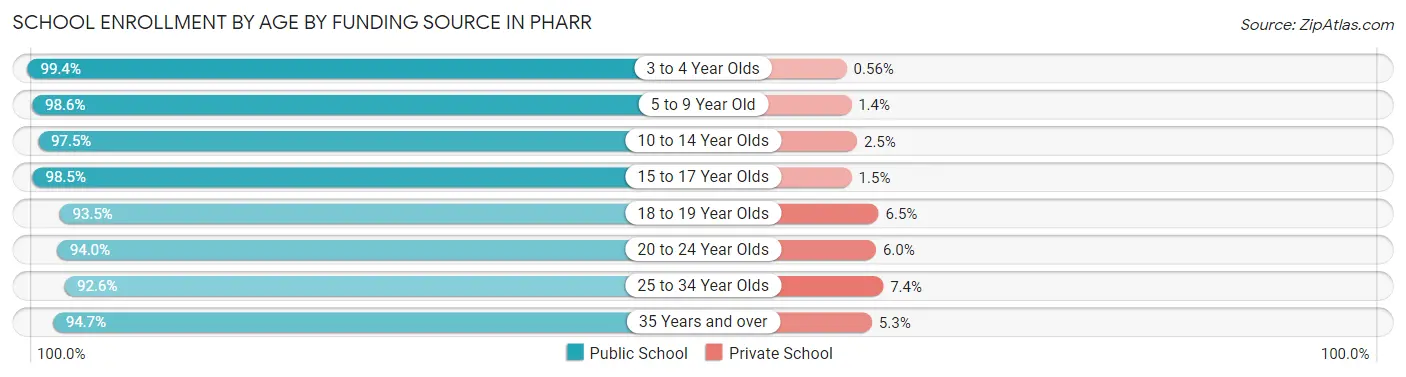
| Age Bracket | Public School | Private School |
| 3 to 4 Year Olds | 1,963 (99.4%) | 11 (0.6%) |
| 5 to 9 Year Old | 5,924 (98.6%) | 85 (1.4%) |
| 10 to 14 Year Olds | 7,118 (97.5%) | 182 (2.5%) |
| 15 to 17 Year Olds | 4,152 (98.5%) | 63 (1.5%) |
| 18 to 19 Year Olds | 1,568 (93.5%) | 109 (6.5%) |
| 20 to 24 Year Olds | 2,218 (94.0%) | 142 (6.0%) |
| 25 to 34 Year Olds | 855 (92.6%) | 68 (7.4%) |
| 35 Years and over | 882 (94.7%) | 49 (5.3%) |
| Total | 24,678 (97.2%) | 711 (2.8%) |
Educational Attainment by Field of Study in Pharr
Business (1,883 | 23.4%), education (1,433 | 17.8%), engineering (616 | 7.7%), science & technology (602 | 7.5%), and communications (437 | 5.4%) are the most common fields of study among 8,038 individuals in Pharr who have obtained a bachelor's degree or higher.
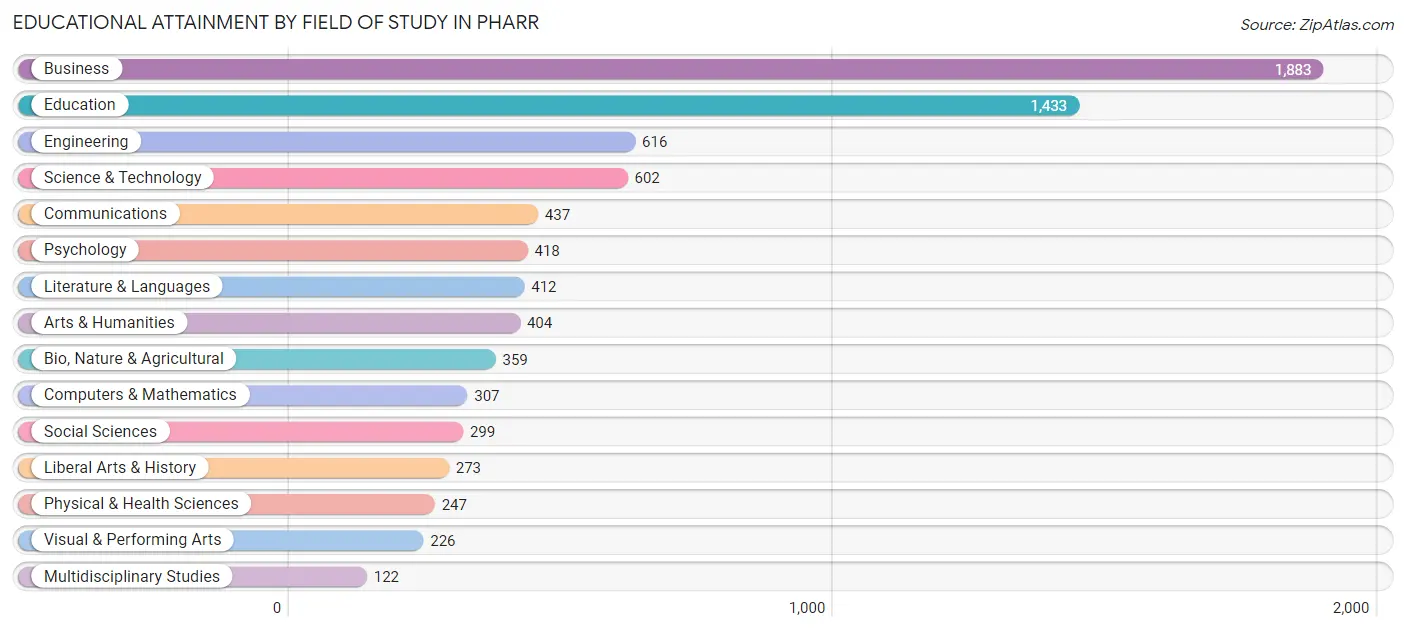
| Field of Study | # Graduates | % Graduates |
| Computers & Mathematics | 307 | 3.8% |
| Bio, Nature & Agricultural | 359 | 4.5% |
| Physical & Health Sciences | 247 | 3.1% |
| Psychology | 418 | 5.2% |
| Social Sciences | 299 | 3.7% |
| Engineering | 616 | 7.7% |
| Multidisciplinary Studies | 122 | 1.5% |
| Science & Technology | 602 | 7.5% |
| Business | 1,883 | 23.4% |
| Education | 1,433 | 17.8% |
| Literature & Languages | 412 | 5.1% |
| Liberal Arts & History | 273 | 3.4% |
| Visual & Performing Arts | 226 | 2.8% |
| Communications | 437 | 5.4% |
| Arts & Humanities | 404 | 5.0% |
| Total | 8,038 | 100.0% |
Transportation & Commute in Pharr
Vehicle Availability by Sex in Pharr
The most prevalent vehicle ownership categories in Pharr are males with 2 vehicles (7,580, accounting for 43.6%) and females with 2 vehicles (5,576, making up 56.2%).
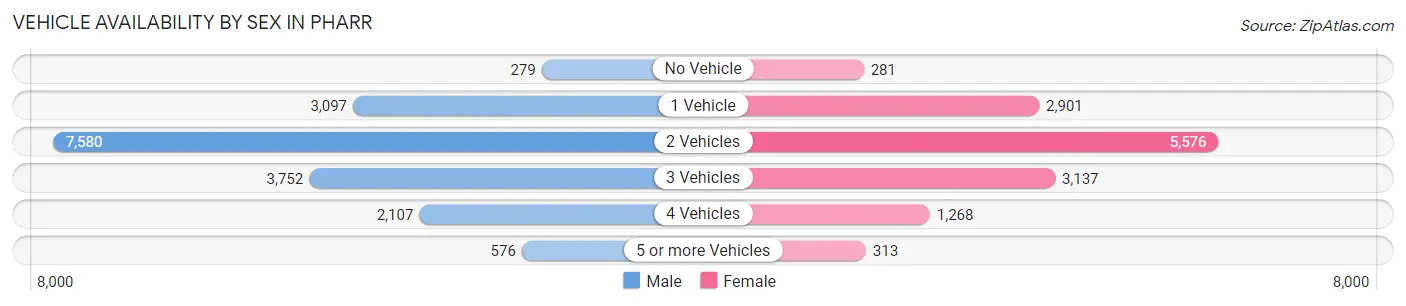
| Vehicles Available | Male | Female |
| No Vehicle | 279 (1.6%) | 281 (2.1%) |
| 1 Vehicle | 3,097 (17.8%) | 2,901 (21.5%) |
| 2 Vehicles | 7,580 (43.6%) | 5,576 (41.4%) |
| 3 Vehicles | 3,752 (21.6%) | 3,137 (23.3%) |
| 4 Vehicles | 2,107 (12.1%) | 1,268 (9.4%) |
| 5 or more Vehicles | 576 (3.3%) | 313 (2.3%) |
| Total | 17,391 (100.0%) | 13,476 (100.0%) |
Commute Time in Pharr
The most frequently occuring commute durations in Pharr are 20 to 24 minutes (6,461 commuters, 22.4%), 15 to 19 minutes (5,214 commuters, 18.1%), and 10 to 14 minutes (4,360 commuters, 15.1%).
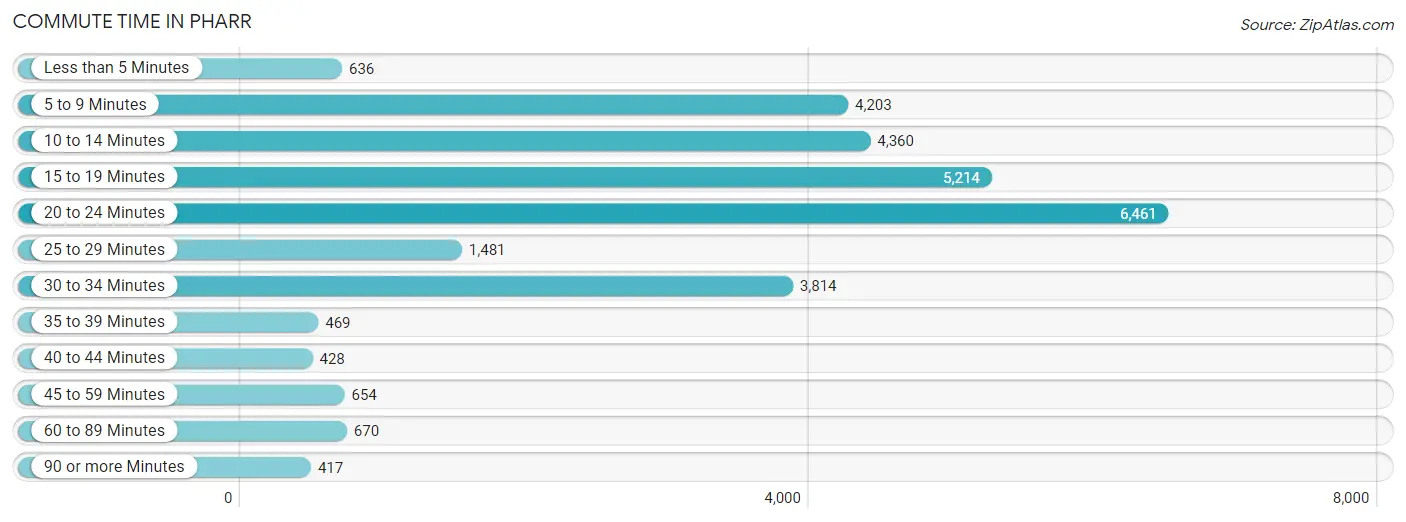
| Commute Time | # Commuters | % Commuters |
| Less than 5 Minutes | 636 | 2.2% |
| 5 to 9 Minutes | 4,203 | 14.6% |
| 10 to 14 Minutes | 4,360 | 15.1% |
| 15 to 19 Minutes | 5,214 | 18.1% |
| 20 to 24 Minutes | 6,461 | 22.4% |
| 25 to 29 Minutes | 1,481 | 5.1% |
| 30 to 34 Minutes | 3,814 | 13.2% |
| 35 to 39 Minutes | 469 | 1.6% |
| 40 to 44 Minutes | 428 | 1.5% |
| 45 to 59 Minutes | 654 | 2.3% |
| 60 to 89 Minutes | 670 | 2.3% |
| 90 or more Minutes | 417 | 1.5% |
Commute Time by Sex in Pharr
The most common commute times in Pharr are 20 to 24 minutes (3,836 commuters, 23.1%) for males and 20 to 24 minutes (2,625 commuters, 21.6%) for females.
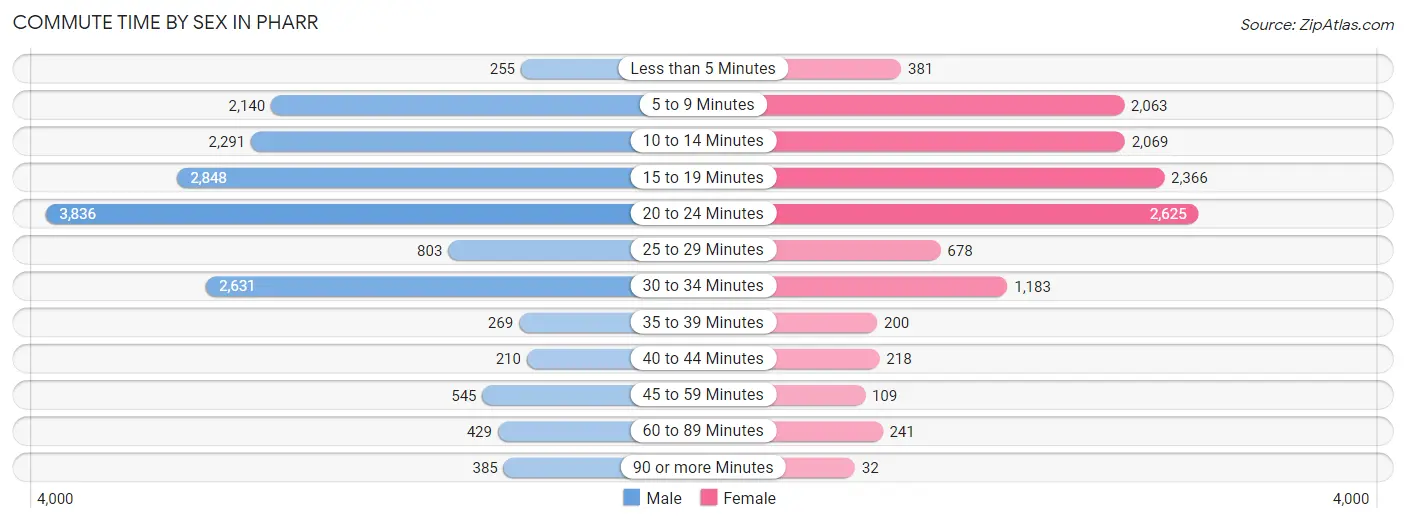
| Commute Time | Male | Female |
| Less than 5 Minutes | 255 (1.5%) | 381 (3.1%) |
| 5 to 9 Minutes | 2,140 (12.9%) | 2,063 (17.0%) |
| 10 to 14 Minutes | 2,291 (13.8%) | 2,069 (17.0%) |
| 15 to 19 Minutes | 2,848 (17.1%) | 2,366 (19.5%) |
| 20 to 24 Minutes | 3,836 (23.1%) | 2,625 (21.6%) |
| 25 to 29 Minutes | 803 (4.8%) | 678 (5.6%) |
| 30 to 34 Minutes | 2,631 (15.8%) | 1,183 (9.7%) |
| 35 to 39 Minutes | 269 (1.6%) | 200 (1.6%) |
| 40 to 44 Minutes | 210 (1.3%) | 218 (1.8%) |
| 45 to 59 Minutes | 545 (3.3%) | 109 (0.9%) |
| 60 to 89 Minutes | 429 (2.6%) | 241 (2.0%) |
| 90 or more Minutes | 385 (2.3%) | 32 (0.3%) |
Time of Departure to Work by Sex in Pharr
The most frequent times of departure to work in Pharr are 7:30 AM to 7:59 AM (2,620, 15.7%) for males and 7:30 AM to 7:59 AM (2,616, 21.5%) for females.
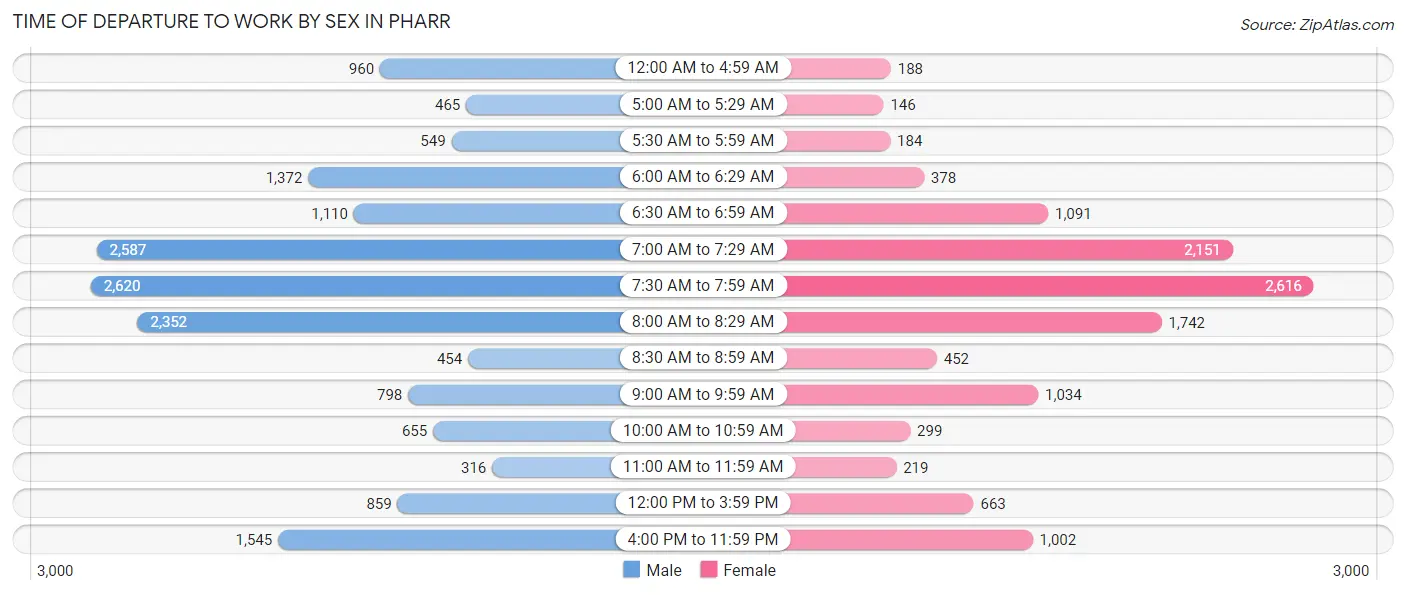
| Time of Departure | Male | Female |
| 12:00 AM to 4:59 AM | 960 (5.8%) | 188 (1.5%) |
| 5:00 AM to 5:29 AM | 465 (2.8%) | 146 (1.2%) |
| 5:30 AM to 5:59 AM | 549 (3.3%) | 184 (1.5%) |
| 6:00 AM to 6:29 AM | 1,372 (8.2%) | 378 (3.1%) |
| 6:30 AM to 6:59 AM | 1,110 (6.7%) | 1,091 (9.0%) |
| 7:00 AM to 7:29 AM | 2,587 (15.5%) | 2,151 (17.7%) |
| 7:30 AM to 7:59 AM | 2,620 (15.7%) | 2,616 (21.5%) |
| 8:00 AM to 8:29 AM | 2,352 (14.1%) | 1,742 (14.3%) |
| 8:30 AM to 8:59 AM | 454 (2.7%) | 452 (3.7%) |
| 9:00 AM to 9:59 AM | 798 (4.8%) | 1,034 (8.5%) |
| 10:00 AM to 10:59 AM | 655 (3.9%) | 299 (2.5%) |
| 11:00 AM to 11:59 AM | 316 (1.9%) | 219 (1.8%) |
| 12:00 PM to 3:59 PM | 859 (5.2%) | 663 (5.4%) |
| 4:00 PM to 11:59 PM | 1,545 (9.3%) | 1,002 (8.2%) |
| Total | 16,642 (100.0%) | 12,165 (100.0%) |
Housing Occupancy in Pharr
Occupancy by Ownership in Pharr
Of the total 23,277 dwellings in Pharr, owner-occupied units account for 13,668 (58.7%), while renter-occupied units make up 9,609 (41.3%).
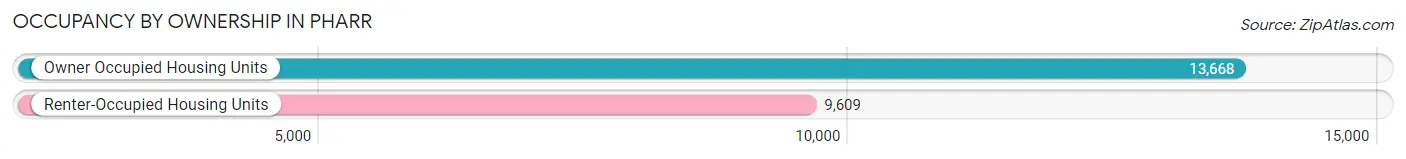
| Occupancy | # Housing Units | % Housing Units |
| Owner Occupied Housing Units | 13,668 | 58.7% |
| Renter-Occupied Housing Units | 9,609 | 41.3% |
| Total Occupied Housing Units | 23,277 | 100.0% |
Occupancy by Household Size in Pharr
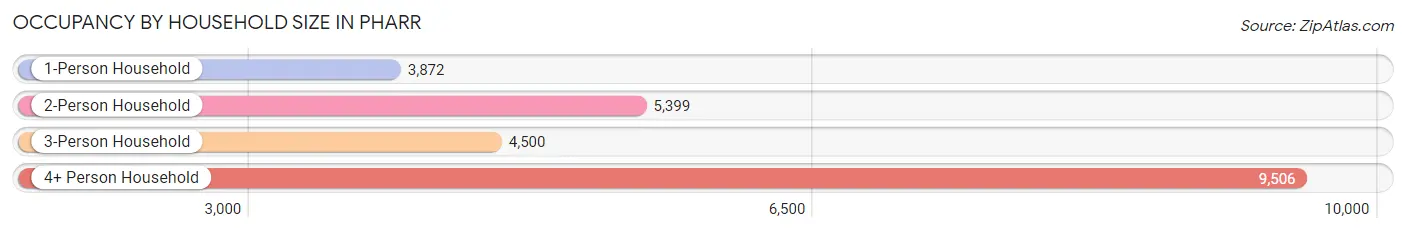
| Household Size | # Housing Units | % Housing Units |
| 1-Person Household | 3,872 | 16.6% |
| 2-Person Household | 5,399 | 23.2% |
| 3-Person Household | 4,500 | 19.3% |
| 4+ Person Household | 9,506 | 40.8% |
| Total Housing Units | 23,277 | 100.0% |
Occupancy by Ownership by Household Size in Pharr
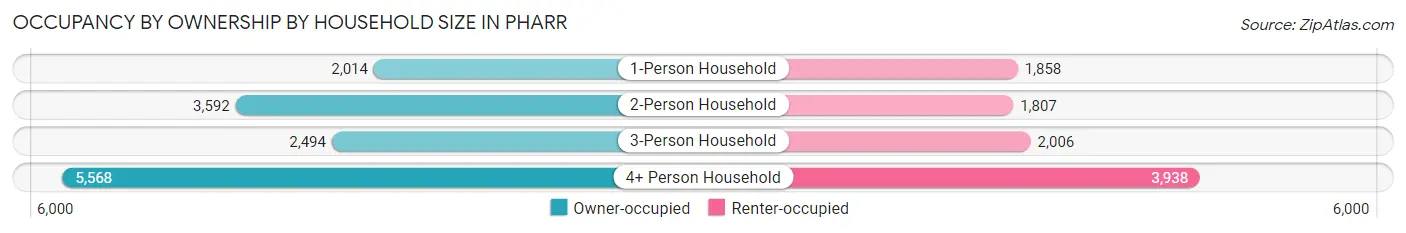
| Household Size | Owner-occupied | Renter-occupied |
| 1-Person Household | 2,014 (52.0%) | 1,858 (48.0%) |
| 2-Person Household | 3,592 (66.5%) | 1,807 (33.5%) |
| 3-Person Household | 2,494 (55.4%) | 2,006 (44.6%) |
| 4+ Person Household | 5,568 (58.6%) | 3,938 (41.4%) |
| Total Housing Units | 13,668 (58.7%) | 9,609 (41.3%) |
Occupancy by Educational Attainment in Pharr
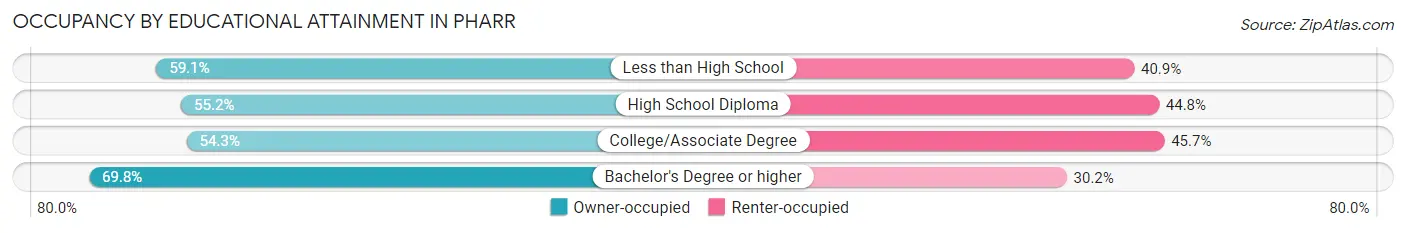
| Household Size | Owner-occupied | Renter-occupied |
| Less than High School | 4,066 (59.1%) | 2,814 (40.9%) |
| High School Diploma | 3,687 (55.2%) | 2,997 (44.8%) |
| College/Associate Degree | 3,030 (54.3%) | 2,549 (45.7%) |
| Bachelor's Degree or higher | 2,885 (69.8%) | 1,249 (30.2%) |
Occupancy by Age of Householder in Pharr
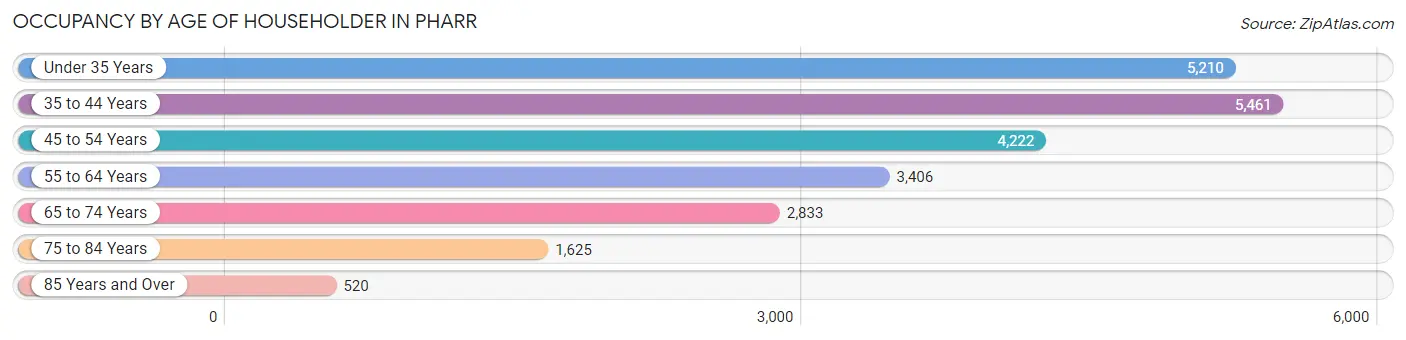
| Age Bracket | # Households | % Households |
| Under 35 Years | 5,210 | 22.4% |
| 35 to 44 Years | 5,461 | 23.5% |
| 45 to 54 Years | 4,222 | 18.1% |
| 55 to 64 Years | 3,406 | 14.6% |
| 65 to 74 Years | 2,833 | 12.2% |
| 75 to 84 Years | 1,625 | 7.0% |
| 85 Years and Over | 520 | 2.2% |
| Total | 23,277 | 100.0% |
Housing Finances in Pharr
Median Income by Occupancy in Pharr
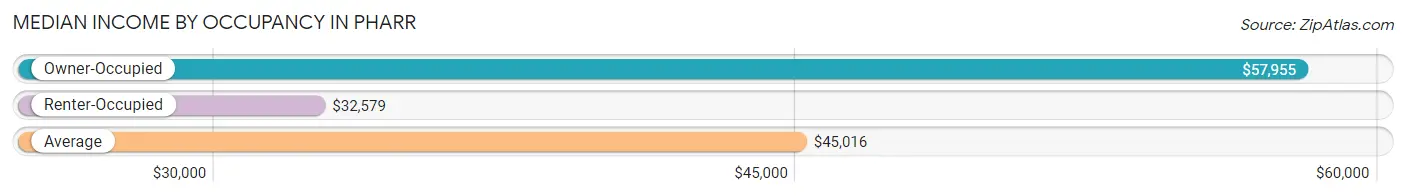
| Occupancy Type | # Households | Median Income |
| Owner-Occupied | 13,668 (58.7%) | $57,955 |
| Renter-Occupied | 9,609 (41.3%) | $32,579 |
| Average | 23,277 (100.0%) | $45,016 |
Occupancy by Householder Income Bracket in Pharr
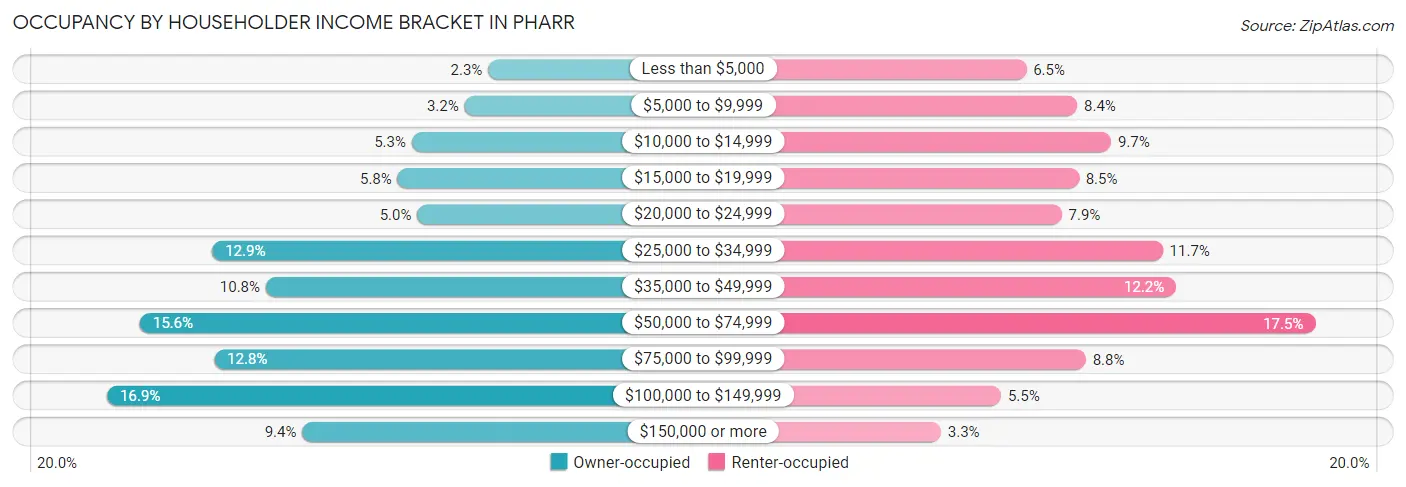
| Income Bracket | Owner-occupied | Renter-occupied |
| Less than $5,000 | 320 (2.3%) | 625 (6.5%) |
| $5,000 to $9,999 | 443 (3.2%) | 811 (8.4%) |
| $10,000 to $14,999 | 718 (5.2%) | 935 (9.7%) |
| $15,000 to $19,999 | 791 (5.8%) | 817 (8.5%) |
| $20,000 to $24,999 | 689 (5.0%) | 754 (7.9%) |
| $25,000 to $34,999 | 1,757 (12.9%) | 1,124 (11.7%) |
| $35,000 to $49,999 | 1,478 (10.8%) | 1,173 (12.2%) |
| $50,000 to $74,999 | 2,134 (15.6%) | 1,683 (17.5%) |
| $75,000 to $99,999 | 1,747 (12.8%) | 843 (8.8%) |
| $100,000 to $149,999 | 2,304 (16.9%) | 532 (5.5%) |
| $150,000 or more | 1,287 (9.4%) | 312 (3.3%) |
| Total | 13,668 (100.0%) | 9,609 (100.0%) |
Monthly Housing Cost Tiers in Pharr
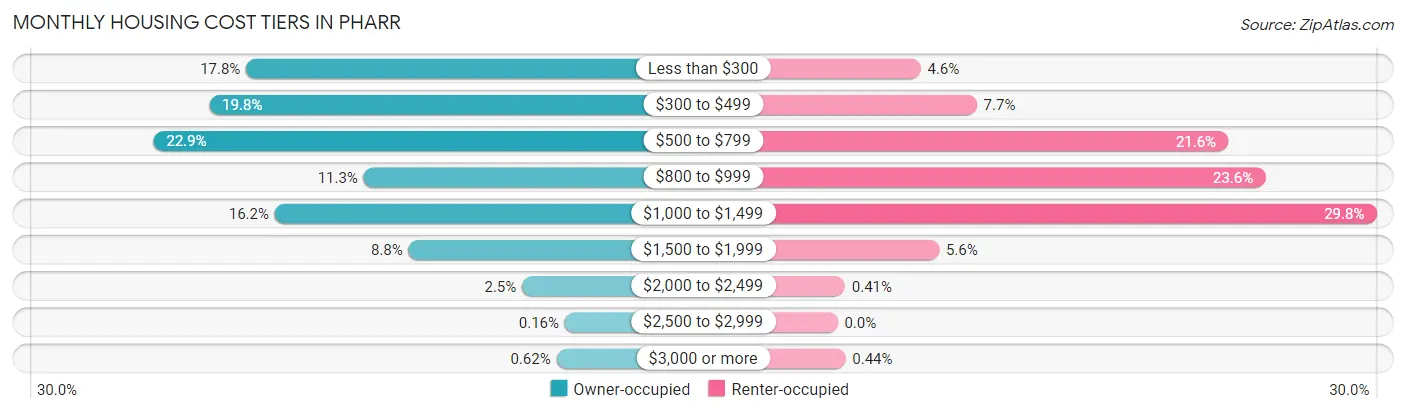
| Monthly Cost | Owner-occupied | Renter-occupied |
| Less than $300 | 2,428 (17.8%) | 441 (4.6%) |
| $300 to $499 | 2,708 (19.8%) | 739 (7.7%) |
| $500 to $799 | 3,128 (22.9%) | 2,073 (21.6%) |
| $800 to $999 | 1,540 (11.3%) | 2,270 (23.6%) |
| $1,000 to $1,499 | 2,211 (16.2%) | 2,860 (29.8%) |
| $1,500 to $1,999 | 1,201 (8.8%) | 539 (5.6%) |
| $2,000 to $2,499 | 345 (2.5%) | 39 (0.4%) |
| $2,500 to $2,999 | 22 (0.2%) | 0 (0.0%) |
| $3,000 or more | 85 (0.6%) | 42 (0.4%) |
| Total | 13,668 (100.0%) | 9,609 (100.0%) |
Physical Housing Characteristics in Pharr
Housing Structures in Pharr
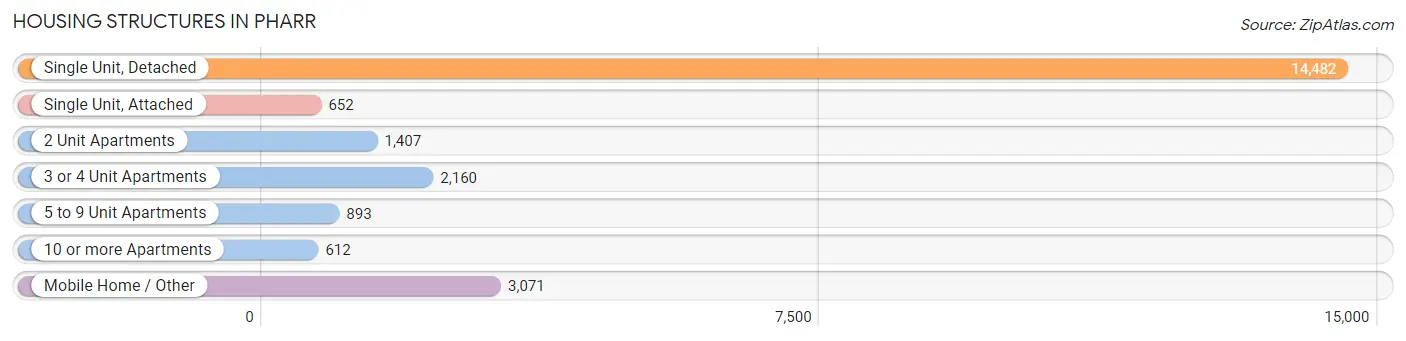
| Structure Type | # Housing Units | % Housing Units |
| Single Unit, Detached | 14,482 | 62.2% |
| Single Unit, Attached | 652 | 2.8% |
| 2 Unit Apartments | 1,407 | 6.0% |
| 3 or 4 Unit Apartments | 2,160 | 9.3% |
| 5 to 9 Unit Apartments | 893 | 3.8% |
| 10 or more Apartments | 612 | 2.6% |
| Mobile Home / Other | 3,071 | 13.2% |
| Total | 23,277 | 100.0% |
Housing Structures by Occupancy in Pharr
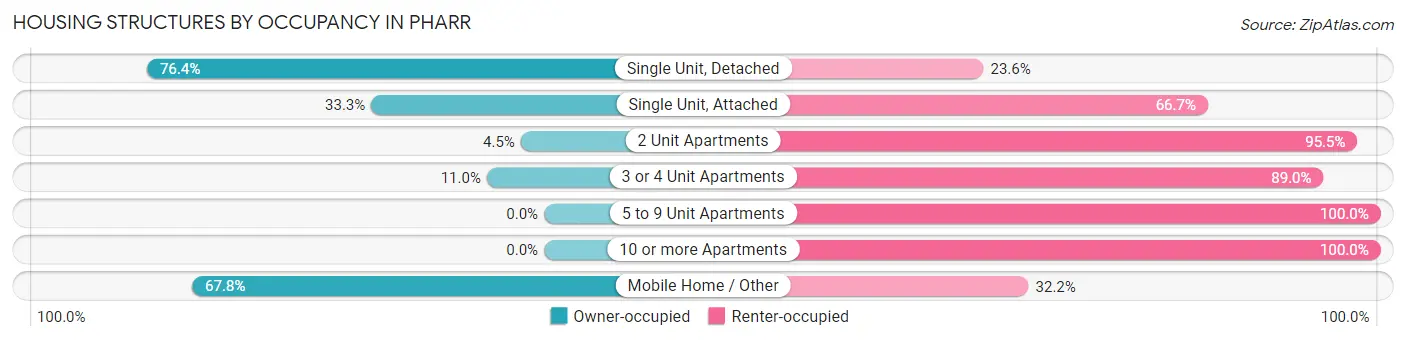
| Structure Type | Owner-occupied | Renter-occupied |
| Single Unit, Detached | 11,069 (76.4%) | 3,413 (23.6%) |
| Single Unit, Attached | 217 (33.3%) | 435 (66.7%) |
| 2 Unit Apartments | 63 (4.5%) | 1,344 (95.5%) |
| 3 or 4 Unit Apartments | 238 (11.0%) | 1,922 (89.0%) |
| 5 to 9 Unit Apartments | 0 (0.0%) | 893 (100.0%) |
| 10 or more Apartments | 0 (0.0%) | 612 (100.0%) |
| Mobile Home / Other | 2,081 (67.8%) | 990 (32.2%) |
| Total | 13,668 (58.7%) | 9,609 (41.3%) |
Housing Structures by Number of Rooms in Pharr
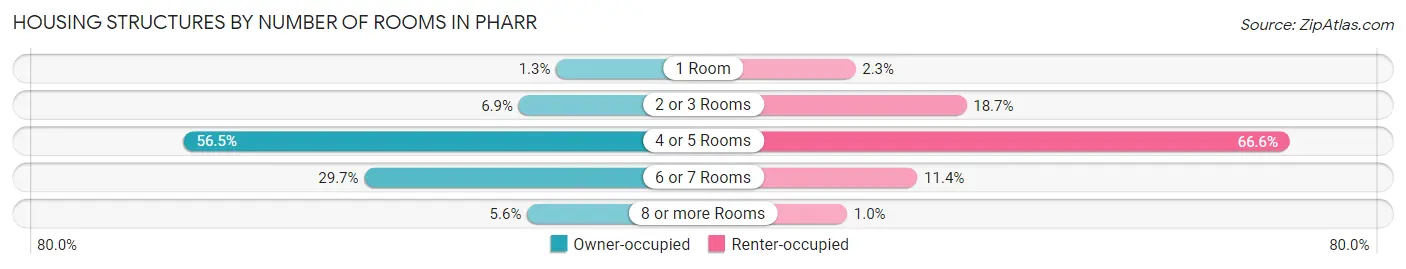
| Number of Rooms | Owner-occupied | Renter-occupied |
| 1 Room | 181 (1.3%) | 218 (2.3%) |
| 2 or 3 Rooms | 939 (6.9%) | 1,797 (18.7%) |
| 4 or 5 Rooms | 7,718 (56.5%) | 6,397 (66.6%) |
| 6 or 7 Rooms | 4,062 (29.7%) | 1,098 (11.4%) |
| 8 or more Rooms | 768 (5.6%) | 99 (1.0%) |
| Total | 13,668 (100.0%) | 9,609 (100.0%) |
Housing Structure by Heating Type in Pharr
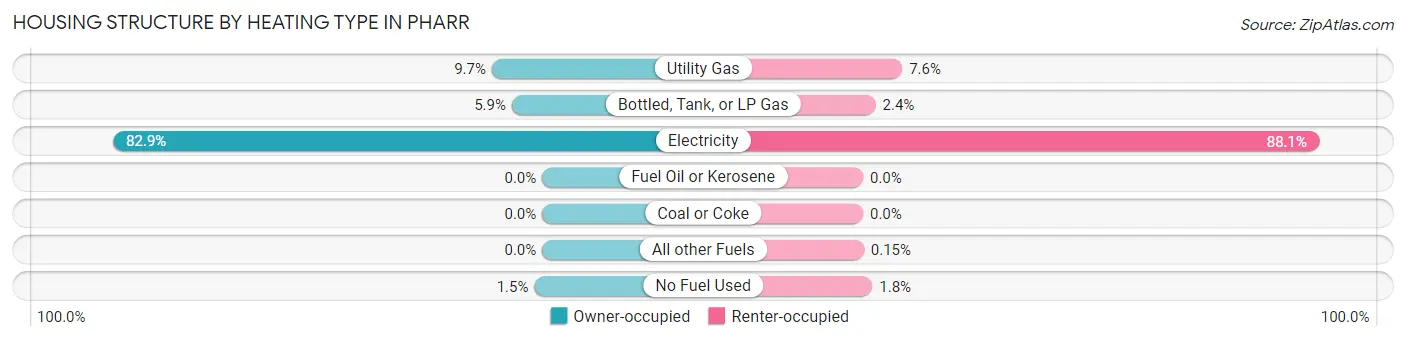
| Heating Type | Owner-occupied | Renter-occupied |
| Utility Gas | 1,328 (9.7%) | 727 (7.6%) |
| Bottled, Tank, or LP Gas | 800 (5.9%) | 233 (2.4%) |
| Electricity | 11,334 (82.9%) | 8,462 (88.1%) |
| Fuel Oil or Kerosene | 0 (0.0%) | 0 (0.0%) |
| Coal or Coke | 0 (0.0%) | 0 (0.0%) |
| All other Fuels | 0 (0.0%) | 14 (0.2%) |
| No Fuel Used | 206 (1.5%) | 173 (1.8%) |
| Total | 13,668 (100.0%) | 9,609 (100.0%) |
Household Vehicle Usage in Pharr
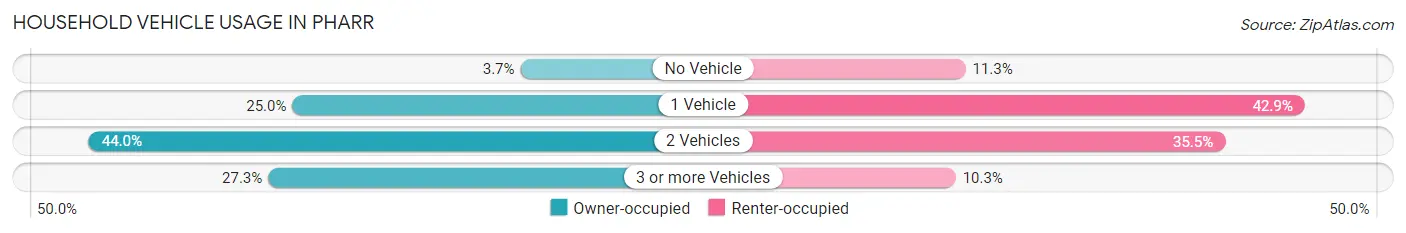
| Vehicles per Household | Owner-occupied | Renter-occupied |
| No Vehicle | 508 (3.7%) | 1,082 (11.3%) |
| 1 Vehicle | 3,419 (25.0%) | 4,124 (42.9%) |
| 2 Vehicles | 6,014 (44.0%) | 3,409 (35.5%) |
| 3 or more Vehicles | 3,727 (27.3%) | 994 (10.3%) |
| Total | 13,668 (100.0%) | 9,609 (100.0%) |
Real Estate & Mortgages in Pharr
Real Estate and Mortgage Overview in Pharr
| Characteristic | Without Mortgage | With Mortgage |
| Housing Units | 8,520 | 5,148 |
| Median Property Value | $82,100 | $132,400 |
| Median Household Income | $42,202 | $884 |
| Monthly Housing Costs | $447 | $85 |
| Real Estate Taxes | $1,481 | $244 |
Property Value by Mortgage Status in Pharr
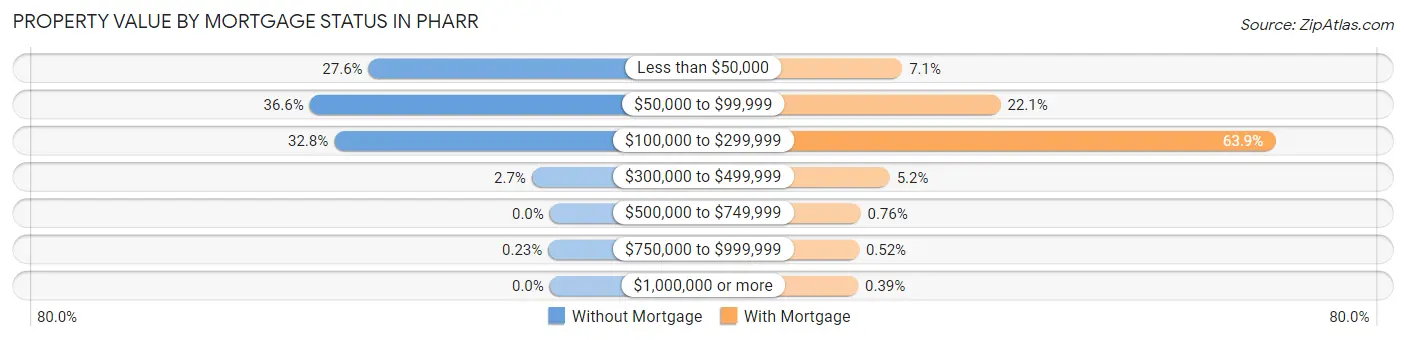
| Property Value | Without Mortgage | With Mortgage |
| Less than $50,000 | 2,352 (27.6%) | 366 (7.1%) |
| $50,000 to $99,999 | 3,117 (36.6%) | 1,137 (22.1%) |
| $100,000 to $299,999 | 2,798 (32.8%) | 3,291 (63.9%) |
| $300,000 to $499,999 | 233 (2.7%) | 268 (5.2%) |
| $500,000 to $749,999 | 0 (0.0%) | 39 (0.8%) |
| $750,000 to $999,999 | 20 (0.2%) | 27 (0.5%) |
| $1,000,000 or more | 0 (0.0%) | 20 (0.4%) |
| Total | 8,520 (100.0%) | 5,148 (100.0%) |
Household Income by Mortgage Status in Pharr
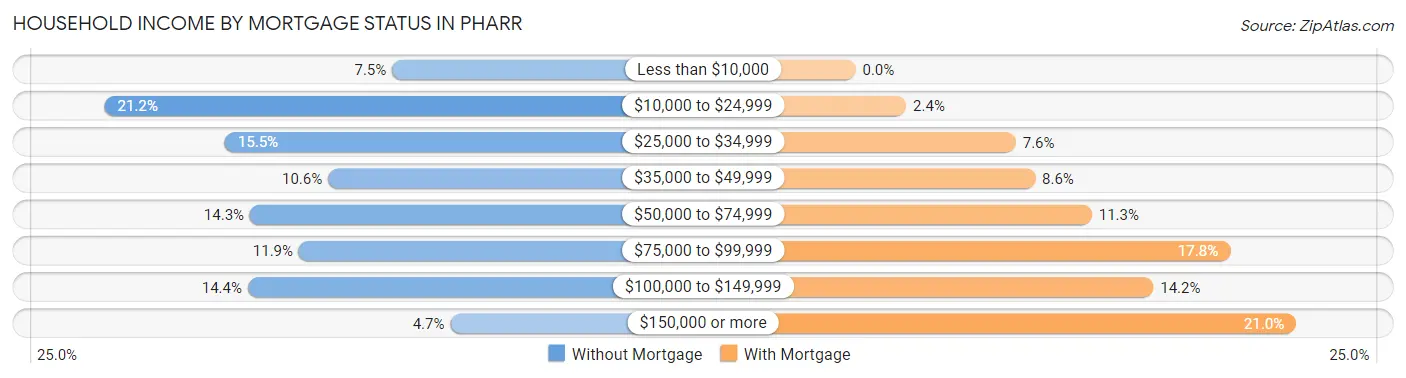
| Household Income | Without Mortgage | With Mortgage |
| Less than $10,000 | 639 (7.5%) | 0 (0.0%) |
| $10,000 to $24,999 | 1,805 (21.2%) | 124 (2.4%) |
| $25,000 to $34,999 | 1,317 (15.5%) | 393 (7.6%) |
| $35,000 to $49,999 | 899 (10.5%) | 440 (8.6%) |
| $50,000 to $74,999 | 1,216 (14.3%) | 579 (11.3%) |
| $75,000 to $99,999 | 1,017 (11.9%) | 918 (17.8%) |
| $100,000 to $149,999 | 1,224 (14.4%) | 730 (14.2%) |
| $150,000 or more | 403 (4.7%) | 1,080 (21.0%) |
| Total | 8,520 (100.0%) | 5,148 (100.0%) |
Property Value to Household Income Ratio in Pharr
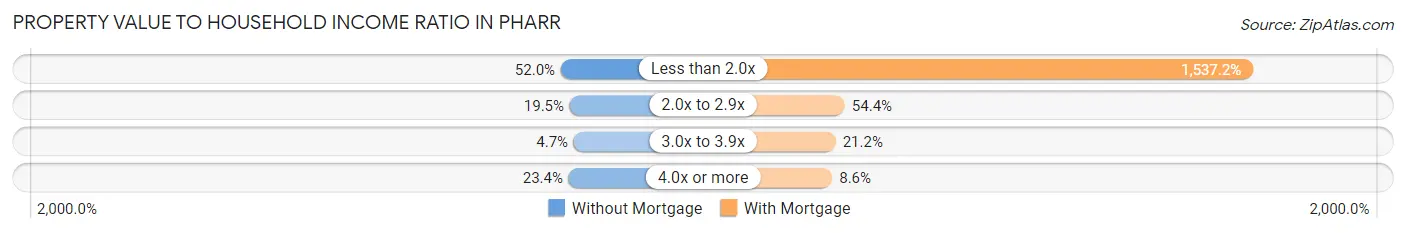
| Value-to-Income Ratio | Without Mortgage | With Mortgage |
| Less than 2.0x | 4,427 (52.0%) | 79,135 (1,537.2%) |
| 2.0x to 2.9x | 1,663 (19.5%) | 2,799 (54.4%) |
| 3.0x to 3.9x | 396 (4.6%) | 1,091 (21.2%) |
| 4.0x or more | 1,997 (23.4%) | 441 (8.6%) |
| Total | 8,520 (100.0%) | 5,148 (100.0%) |
Real Estate Taxes by Mortgage Status in Pharr
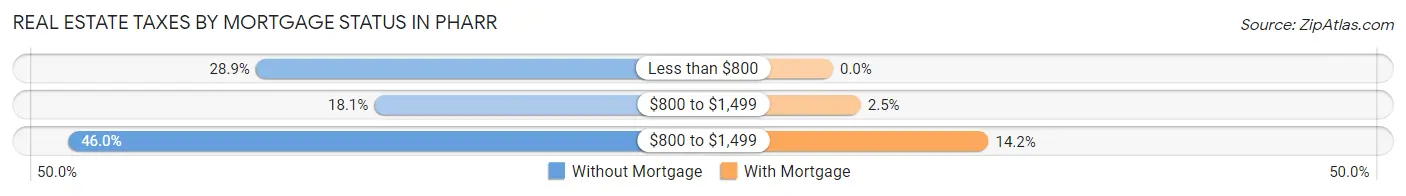
| Property Taxes | Without Mortgage | With Mortgage |
| Less than $800 | 2,462 (28.9%) | 0 (0.0%) |
| $800 to $1,499 | 1,540 (18.1%) | 131 (2.5%) |
| $800 to $1,499 | 3,920 (46.0%) | 731 (14.2%) |
| Total | 8,520 (100.0%) | 5,148 (100.0%) |
Health & Disability in Pharr
Health Insurance Coverage by Age in Pharr
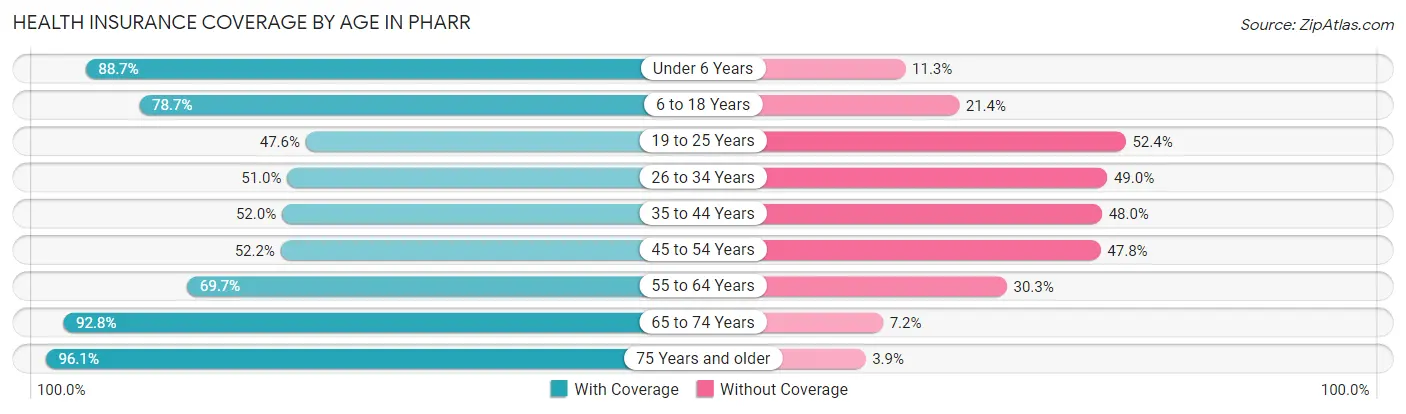
| Age Bracket | With Coverage | Without Coverage |
| Under 6 Years | 7,478 (88.7%) | 956 (11.3%) |
| 6 to 18 Years | 15,359 (78.6%) | 4,169 (21.3%) |
| 19 to 25 Years | 3,567 (47.6%) | 3,933 (52.4%) |
| 26 to 34 Years | 5,458 (51.0%) | 5,241 (49.0%) |
| 35 to 44 Years | 5,380 (52.0%) | 4,966 (48.0%) |
| 45 to 54 Years | 4,224 (52.2%) | 3,861 (47.8%) |
| 55 to 64 Years | 4,345 (69.7%) | 1,885 (30.3%) |
| 65 to 74 Years | 4,402 (92.8%) | 340 (7.2%) |
| 75 Years and older | 3,621 (96.1%) | 147 (3.9%) |
| Total | 53,834 (67.9%) | 25,498 (32.1%) |
Health Insurance Coverage by Citizenship Status in Pharr
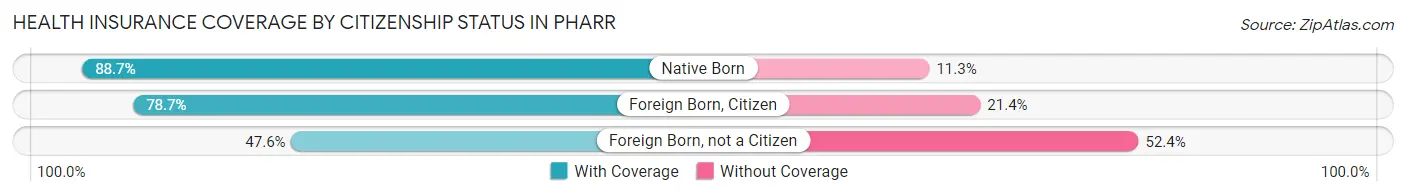
| Citizenship Status | With Coverage | Without Coverage |
| Native Born | 7,478 (88.7%) | 956 (11.3%) |
| Foreign Born, Citizen | 15,359 (78.6%) | 4,169 (21.3%) |
| Foreign Born, not a Citizen | 3,567 (47.6%) | 3,933 (52.4%) |
Health Insurance Coverage by Household Income in Pharr
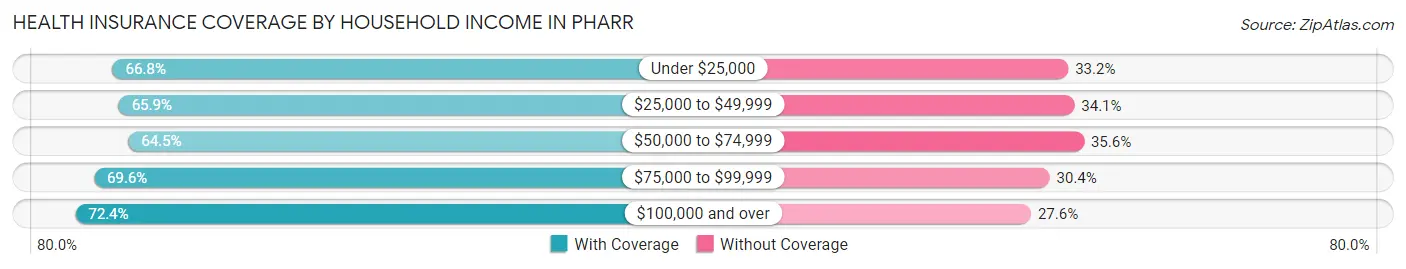
| Household Income | With Coverage | Without Coverage |
| Under $25,000 | 13,425 (66.8%) | 6,669 (33.2%) |
| $25,000 to $49,999 | 10,973 (65.9%) | 5,680 (34.1%) |
| $50,000 to $74,999 | 9,072 (64.4%) | 5,005 (35.5%) |
| $75,000 to $99,999 | 6,792 (69.6%) | 2,966 (30.4%) |
| $100,000 and over | 13,527 (72.4%) | 5,158 (27.6%) |
Public vs Private Health Insurance Coverage by Age in Pharr
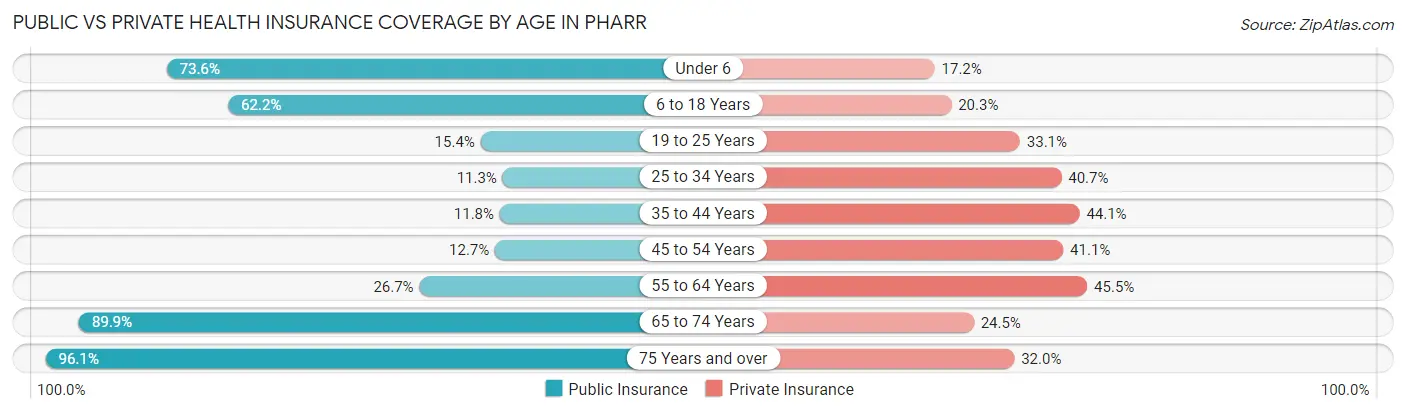
| Age Bracket | Public Insurance | Private Insurance |
| Under 6 | 6,210 (73.6%) | 1,453 (17.2%) |
| 6 to 18 Years | 12,154 (62.2%) | 3,967 (20.3%) |
| 19 to 25 Years | 1,151 (15.3%) | 2,479 (33.1%) |
| 25 to 34 Years | 1,205 (11.3%) | 4,359 (40.7%) |
| 35 to 44 Years | 1,219 (11.8%) | 4,564 (44.1%) |
| 45 to 54 Years | 1,024 (12.7%) | 3,322 (41.1%) |
| 55 to 64 Years | 1,664 (26.7%) | 2,837 (45.5%) |
| 65 to 74 Years | 4,264 (89.9%) | 1,161 (24.5%) |
| 75 Years and over | 3,621 (96.1%) | 1,206 (32.0%) |
| Total | 32,512 (41.0%) | 25,348 (32.0%) |
Disability Status by Sex by Age in Pharr
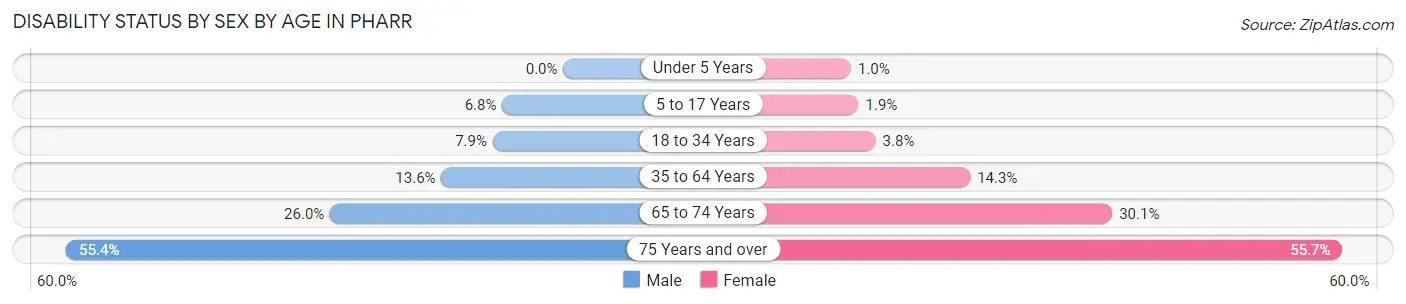
| Age Bracket | Male | Female |
| Under 5 Years | 0 (0.0%) | 37 (1.0%) |
| 5 to 17 Years | 599 (6.8%) | 193 (1.9%) |
| 18 to 34 Years | 736 (7.9%) | 394 (3.8%) |
| 35 to 64 Years | 1,693 (13.6%) | 1,743 (14.3%) |
| 65 to 74 Years | 553 (26.0%) | 787 (30.1%) |
| 75 Years and over | 923 (55.4%) | 1,171 (55.7%) |
Disability Class by Sex by Age in Pharr
Disability Class: Hearing Difficulty
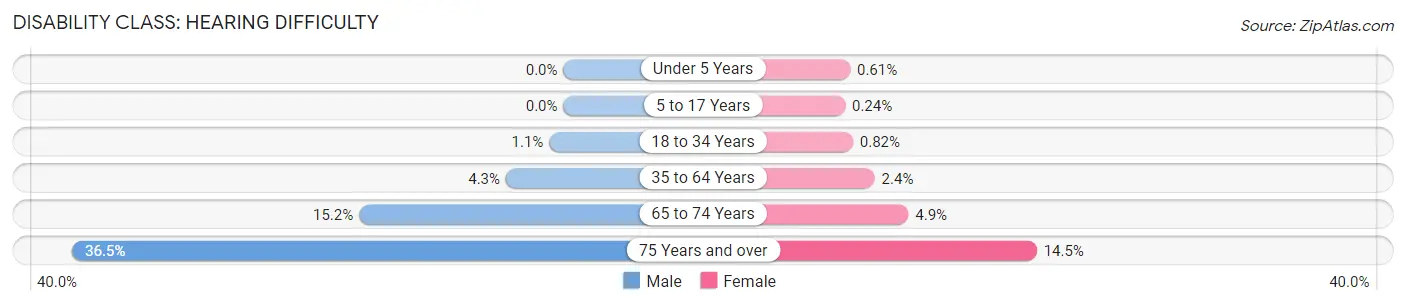
| Age Bracket | Male | Female |
| Under 5 Years | 0 (0.0%) | 22 (0.6%) |
| 5 to 17 Years | 0 (0.0%) | 25 (0.2%) |
| 18 to 34 Years | 98 (1.1%) | 86 (0.8%) |
| 35 to 64 Years | 533 (4.3%) | 298 (2.4%) |
| 65 to 74 Years | 323 (15.2%) | 129 (4.9%) |
| 75 Years and over | 608 (36.5%) | 304 (14.5%) |
Disability Class: Vision Difficulty
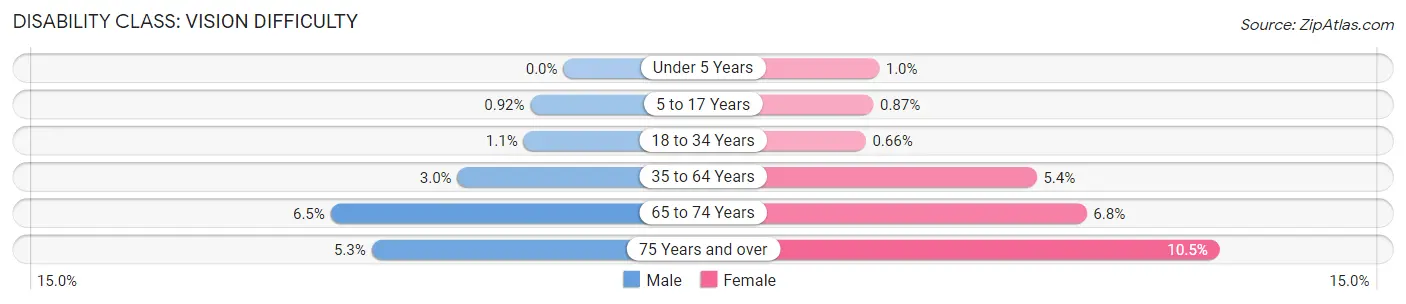
| Age Bracket | Male | Female |
| Under 5 Years | 0 (0.0%) | 37 (1.0%) |
| 5 to 17 Years | 81 (0.9%) | 90 (0.9%) |
| 18 to 34 Years | 104 (1.1%) | 69 (0.7%) |
| 35 to 64 Years | 368 (2.9%) | 661 (5.4%) |
| 65 to 74 Years | 138 (6.5%) | 178 (6.8%) |
| 75 Years and over | 89 (5.3%) | 221 (10.5%) |
Disability Class: Cognitive Difficulty
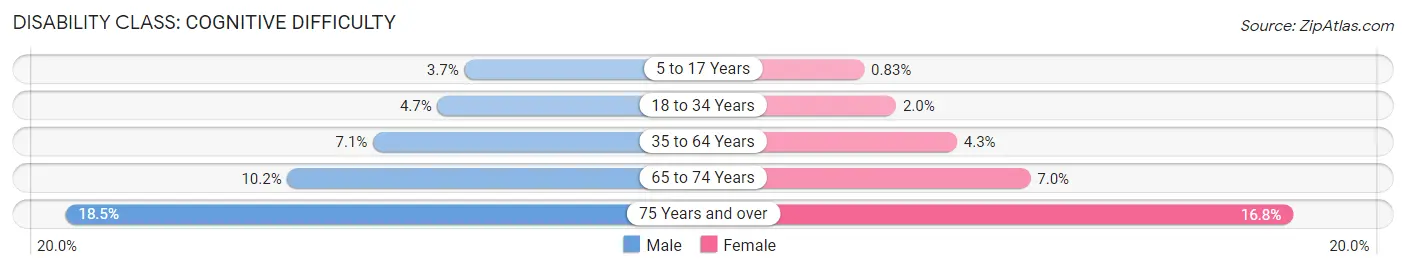
| Age Bracket | Male | Female |
| 5 to 17 Years | 323 (3.7%) | 85 (0.8%) |
| 18 to 34 Years | 437 (4.7%) | 210 (2.0%) |
| 35 to 64 Years | 880 (7.1%) | 521 (4.3%) |
| 65 to 74 Years | 218 (10.2%) | 183 (7.0%) |
| 75 Years and over | 308 (18.5%) | 352 (16.8%) |
Disability Class: Ambulatory Difficulty
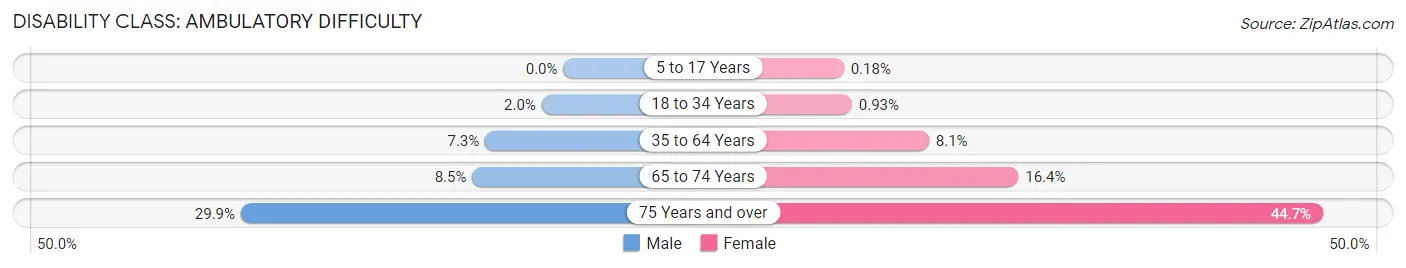
| Age Bracket | Male | Female |
| 5 to 17 Years | 0 (0.0%) | 19 (0.2%) |
| 18 to 34 Years | 188 (2.0%) | 97 (0.9%) |
| 35 to 64 Years | 905 (7.3%) | 985 (8.1%) |
| 65 to 74 Years | 180 (8.5%) | 428 (16.4%) |
| 75 Years and over | 499 (29.9%) | 938 (44.7%) |
Disability Class: Self-Care Difficulty
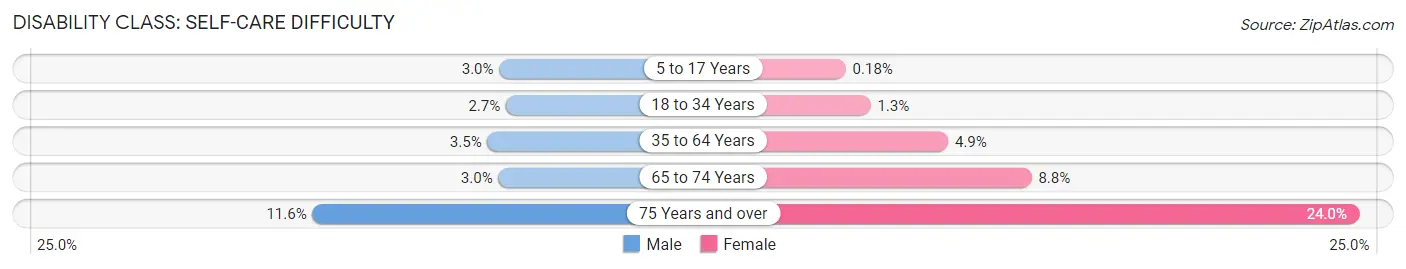
| Age Bracket | Male | Female |
| 5 to 17 Years | 262 (3.0%) | 19 (0.2%) |
| 18 to 34 Years | 249 (2.7%) | 139 (1.3%) |
| 35 to 64 Years | 439 (3.5%) | 601 (4.9%) |
| 65 to 74 Years | 64 (3.0%) | 230 (8.8%) |
| 75 Years and over | 194 (11.6%) | 504 (24.0%) |
Technology Access in Pharr
Computing Device Access in Pharr
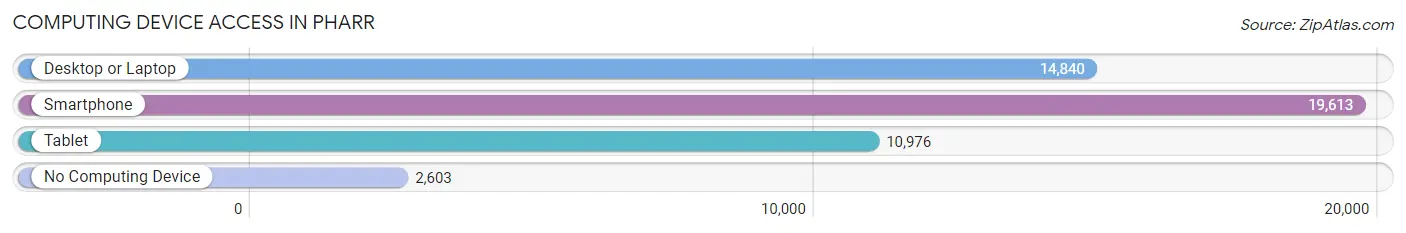
| Device Type | # Households | % Households |
| Desktop or Laptop | 14,840 | 63.7% |
| Smartphone | 19,613 | 84.3% |
| Tablet | 10,976 | 47.1% |
| No Computing Device | 2,603 | 11.2% |
| Total | 23,277 | 100.0% |
Internet Access in Pharr
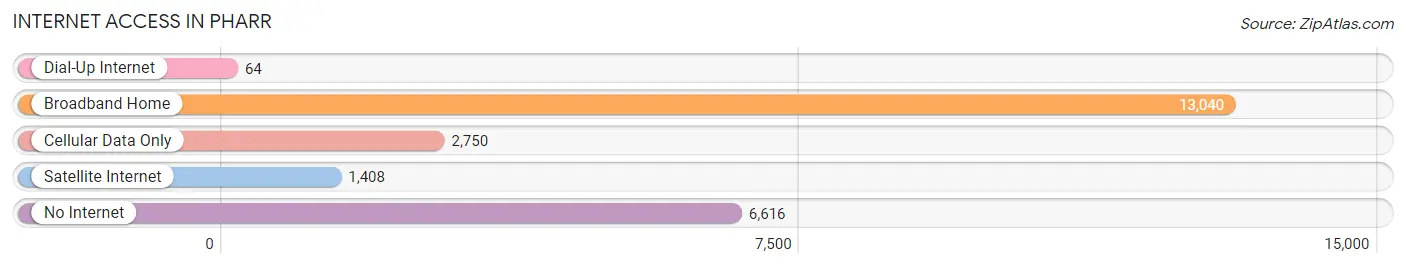
| Internet Type | # Households | % Households |
| Dial-Up Internet | 64 | 0.3% |
| Broadband Home | 13,040 | 56.0% |
| Cellular Data Only | 2,750 | 11.8% |
| Satellite Internet | 1,408 | 6.0% |
| No Internet | 6,616 | 28.4% |
| Total | 23,277 | 100.0% |
Pharr Summary
Pharr is a city located in Hidalgo County, Texas, United States. It is part of the McAllen–Edinburg–Mission and Reynosa–McAllen metropolitan areas. The population was 70,400 as of the 2010 census, and in 2019 the estimated population was 79,112. Pharr is one of the fastest-growing cities in the United States and is the largest city in Hidalgo County.
History
The area that is now Pharr was originally inhabited by the Coahuiltecan Indians. The first European to settle in the area was Juan José Ballí, who received a land grant from the Spanish government in 1790. The area was known as San Juan de los Esteros until the early 1900s, when it was renamed Pharr in honor of Dr. Henry Pharr, a prominent local physician.
The city was officially incorporated in 1908 and has since grown to become the largest city in Hidalgo County. The city has experienced rapid growth in recent years, with its population increasing by more than 50% between 2000 and 2010.
Geography
Pharr is located in the Rio Grande Valley of South Texas, about 10 miles (16 km) west of McAllen and 20 miles (32 km) east of Reynosa, Mexico. The city is situated at the intersection of U.S. Route 281 and State Highway 107.
The city has a total area of 24.2 square miles (62.7 km2), of which 24.1 square miles (62.4 km2) is land and 0.1 square miles (0.3 km2) is water.
Economy
Pharr is a major economic center in the Rio Grande Valley. The city is home to a variety of industries, including manufacturing, retail, healthcare, and tourism.
The city is also home to the Pharr-Reynosa International Bridge, which is the busiest land port of entry in the Rio Grande Valley. The bridge is a major source of economic activity for the city, as it serves as a major gateway for trade between the United States and Mexico.
The city is also home to a number of major employers, including the Pharr-San Juan-Alamo Independent School District, the City of Pharr, and the Pharr-Reynosa International Bridge.
Demographics
As of the 2010 census, there were 70,400 people, 19,890 households, and 16,890 families residing in the city. The population density was 2,919.3 people per square mile (1,127.3/km2). There were 21,890 housing units at an average density of 902.3 per square mile (348.3/km2). The racial makeup of the city was 77.2% White, 0.7% African American, 0.4% Native American, 0.3% Asian, 0.1% Pacific Islander, 19.3% from other races, and 2.1% from two or more races. Hispanic or Latino of any race were 97.2% of the population.
The median income for a household in the city was $25,945, and the median income for a family was $30,945. Males had a median income of $25,945 versus $20,945 for females. The per capita income for the city was $11,945. About 24.2% of families and 28.2% of the population were below the poverty line, including 37.2% of those under age 18 and 24.2% of those age 65 or over.
Common Questions
What is Per Capita Income in Pharr?
Per Capita income in Pharr is $19,029.
What is the Median Family Income in Pharr?
Median Family Income in Pharr is $50,637.
What is the Median Household income in Pharr?
Median Household Income in Pharr is $45,016.
What is Income or Wage Gap in Pharr?
Income or Wage Gap in Pharr is 35.7%.
Women in Pharr earn 64.3 cents for every dollar earned by a man.
What is Family Income Deficit in Pharr?
Family Income Deficit in Pharr is $11,426.
Families that are below poverty line in Pharr earn $11,426 less on average than the poverty threshold level.
What is Inequality or Gini Index in Pharr?
Inequality or Gini Index in Pharr is 0.47.
What is the Total Population of Pharr?
Total Population of Pharr is 79,434.
What is the Total Male Population of Pharr?
Total Male Population of Pharr is 38,113.
What is the Total Female Population of Pharr?
Total Female Population of Pharr is 41,321.
What is the Ratio of Males per 100 Females in Pharr?
There are 92.24 Males per 100 Females in Pharr.
What is the Ratio of Females per 100 Males in Pharr?
There are 108.42 Females per 100 Males in Pharr.
What is the Median Population Age in Pharr?
Median Population Age in Pharr is 29.4 Years.
What is the Average Family Size in Pharr
Average Family Size in Pharr is 3.9 People.
What is the Average Household Size in Pharr
Average Household Size in Pharr is 3.4 People.
How Large is the Labor Force in Pharr?
There are 33,368 People in the Labor Forcein in Pharr.
What is the Percentage of People in the Labor Force in Pharr?
59.5% of People are in the Labor Force in Pharr.
What is the Unemployment Rate in Pharr?
Unemployment Rate in Pharr is 6.1%.