Temple, TX Map & Demographics
Temple Map
Temple Overview
$31,905
PER CAPITA INCOME
$77,156
AVG FAMILY INCOME
$61,003
AVG HOUSEHOLD INCOME
27.0%
WAGE / INCOME GAP [ % ]
73.0¢/ $1
WAGE / INCOME GAP [ $ ]
$11,213
FAMILY INCOME DEFICIT
0.47
INEQUALITY / GINI INDEX
83,473
TOTAL POPULATION
39,887
MALE POPULATION
43,586
FEMALE POPULATION
91.51
MALES / 100 FEMALES
109.27
FEMALES / 100 MALES
34.0
MEDIAN AGE
3.3
AVG FAMILY SIZE
2.6
AVG HOUSEHOLD SIZE
38,619
LABOR FORCE [ PEOPLE ]
61.5%
PERCENT IN LABOR FORCE
7.1%
UNEMPLOYMENT RATE
Temple Area Codes
Income in Temple
Income Overview in Temple
Per Capita Income in Temple is $31,905, while median incomes of families and households are $77,156 and $61,003 respectively.
| Characteristic | Number | Measure |
| Per Capita Income | 83,473 | $31,905 |
| Median Family Income | 20,085 | $77,156 |
| Mean Family Income | 20,085 | $96,139 |
| Median Household Income | 31,552 | $61,003 |
| Mean Household Income | 31,552 | $81,303 |
| Income Deficit | 20,085 | $11,213 |
| Wage / Income Gap (%) | 83,473 | 26.98% |
| Wage / Income Gap ($) | 83,473 | 73.02¢ per $1 |
| Gini / Inequality Index | 83,473 | 0.47 |
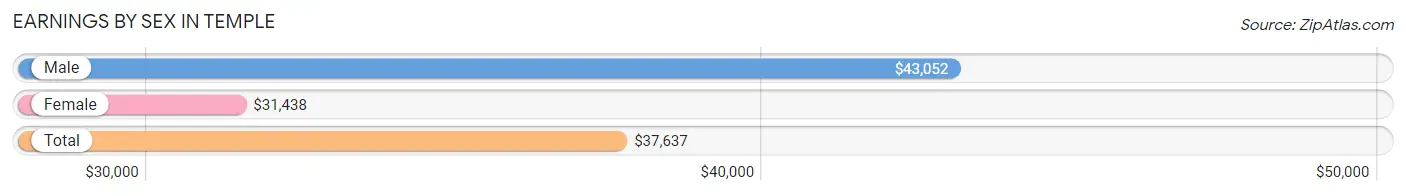
Earnings by Sex in Temple
Average Earnings in Temple are $37,637, $43,052 for men and $31,438 for women, a difference of 27.0%.
| Sex | Number | Average Earnings |
| Male | 20,903 (52.3%) | $43,052 |
| Female | 19,041 (47.7%) | $31,438 |
| Total | 39,944 (100.0%) | $37,637 |
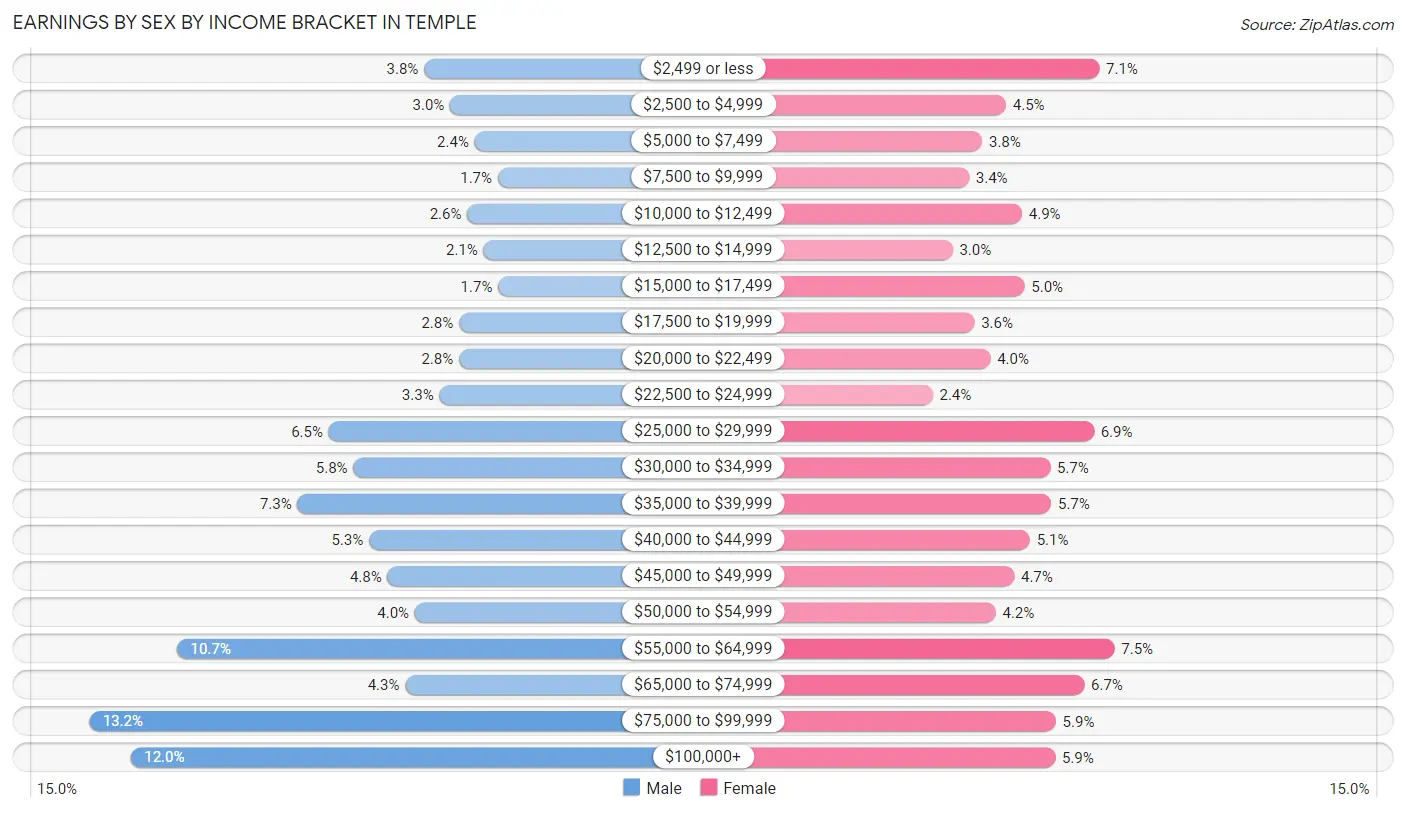
Earnings by Sex by Income Bracket in Temple
The most common earnings brackets in Temple are $75,000 to $99,999 for men (2,753 | 13.2%) and $55,000 to $64,999 for women (1,432 | 7.5%).
| Income | Male | Female |
| $2,499 or less | 788 (3.8%) | 1,350 (7.1%) |
| $2,500 to $4,999 | 635 (3.0%) | 851 (4.5%) |
| $5,000 to $7,499 | 491 (2.4%) | 724 (3.8%) |
| $7,500 to $9,999 | 355 (1.7%) | 654 (3.4%) |
| $10,000 to $12,499 | 536 (2.6%) | 937 (4.9%) |
| $12,500 to $14,999 | 438 (2.1%) | 565 (3.0%) |
| $15,000 to $17,499 | 354 (1.7%) | 950 (5.0%) |
| $17,500 to $19,999 | 583 (2.8%) | 682 (3.6%) |
| $20,000 to $22,499 | 584 (2.8%) | 768 (4.0%) |
| $22,500 to $24,999 | 698 (3.3%) | 458 (2.4%) |
| $25,000 to $29,999 | 1,349 (6.5%) | 1,321 (6.9%) |
| $30,000 to $34,999 | 1,204 (5.8%) | 1,088 (5.7%) |
| $35,000 to $39,999 | 1,532 (7.3%) | 1,093 (5.7%) |
| $40,000 to $44,999 | 1,111 (5.3%) | 978 (5.1%) |
| $45,000 to $49,999 | 1,004 (4.8%) | 895 (4.7%) |
| $50,000 to $54,999 | 843 (4.0%) | 795 (4.2%) |
| $55,000 to $64,999 | 2,237 (10.7%) | 1,432 (7.5%) |
| $65,000 to $74,999 | 899 (4.3%) | 1,270 (6.7%) |
| $75,000 to $99,999 | 2,753 (13.2%) | 1,117 (5.9%) |
| $100,000+ | 2,509 (12.0%) | 1,113 (5.9%) |
| Total | 20,903 (100.0%) | 19,041 (100.0%) |
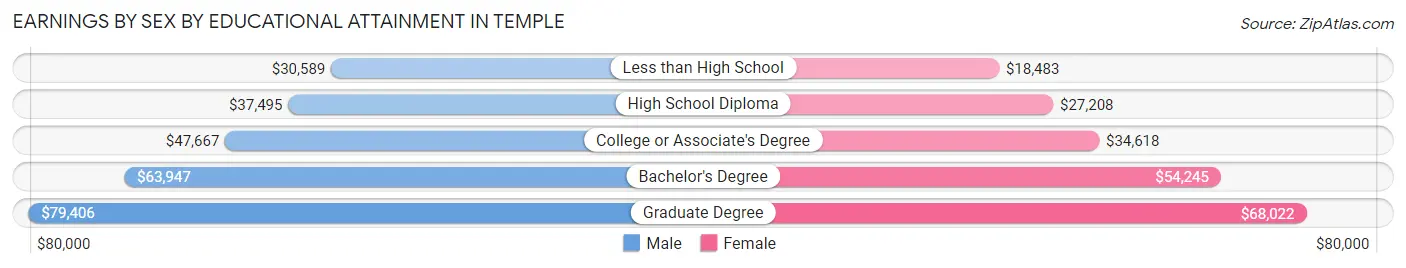
Earnings by Sex by Educational Attainment in Temple
Average earnings in Temple are $49,744 for men and $37,454 for women, a difference of 24.7%. Men with an educational attainment of graduate degree enjoy the highest average annual earnings of $79,406, while those with less than high school education earn the least with $30,589. Women with an educational attainment of graduate degree earn the most with the average annual earnings of $68,022, while those with less than high school education have the smallest earnings of $18,483.
| Educational Attainment | Male Income | Female Income |
| Less than High School | $30,589 | $18,483 |
| High School Diploma | $37,495 | $27,208 |
| College or Associate's Degree | $47,667 | $34,618 |
| Bachelor's Degree | $63,947 | $54,245 |
| Graduate Degree | $79,406 | $68,022 |
| Total | $49,744 | $37,454 |
Family Income in Temple
Family Income Brackets in Temple
According to the Temple family income data, there are 3,856 families falling into the $100,000 to $149,999 income range, which is the most common income bracket and makes up 19.2% of all families. Conversely, the less than $10,000 income bracket is the least frequent group with only 542 families (2.7%) belonging to this category.
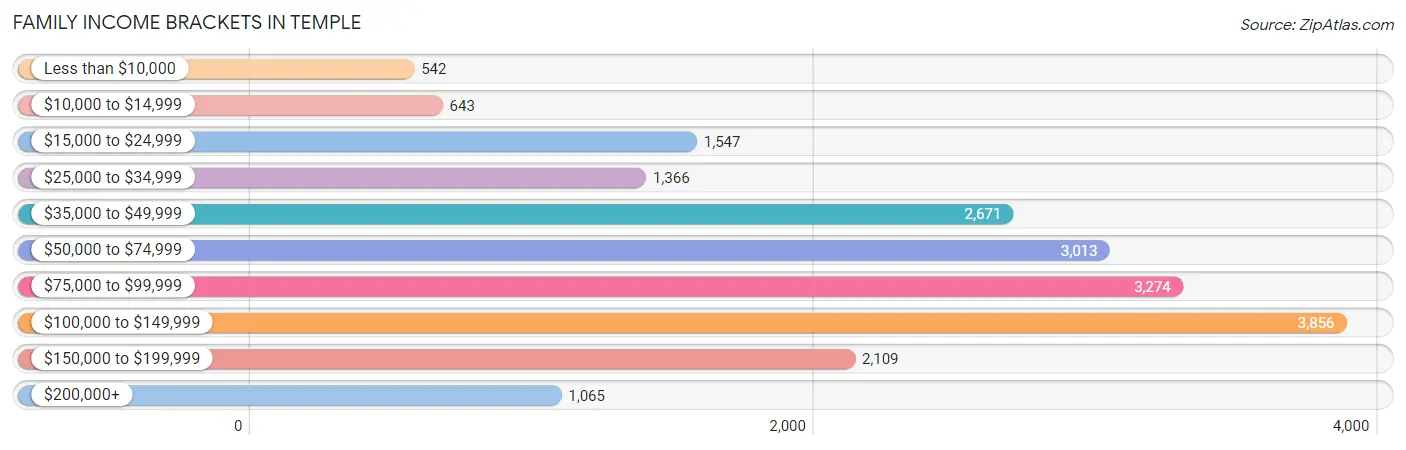
| Income Bracket | # Families | % Families |
| Less than $10,000 | 542 | 2.7% |
| $10,000 to $14,999 | 643 | 3.2% |
| $15,000 to $24,999 | 1,547 | 7.7% |
| $25,000 to $34,999 | 1,366 | 6.8% |
| $35,000 to $49,999 | 2,671 | 13.3% |
| $50,000 to $74,999 | 3,013 | 15.0% |
| $75,000 to $99,999 | 3,274 | 16.3% |
| $100,000 to $149,999 | 3,856 | 19.2% |
| $150,000 to $199,999 | 2,109 | 10.5% |
| $200,000+ | 1,065 | 5.3% |
Family Income by Famaliy Size in Temple
7+ person families (167 | 0.8%) account for the highest median family income in Temple with $180,365 per family, while 2-person families (9,092 | 45.3%) have the highest median income of $38,693 per family member.
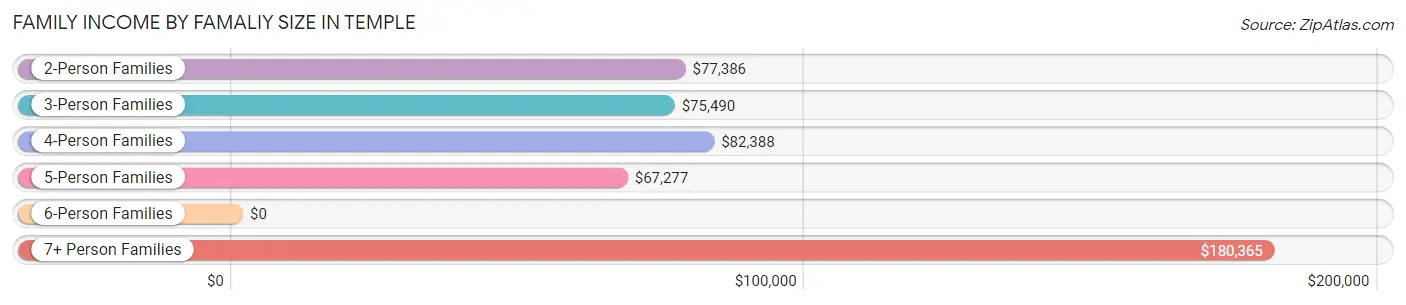
| Income Bracket | # Families | Median Income |
| 2-Person Families | 9,092 (45.3%) | $77,386 |
| 3-Person Families | 4,678 (23.3%) | $75,490 |
| 4-Person Families | 3,207 (16.0%) | $82,388 |
| 5-Person Families | 2,029 (10.1%) | $67,277 |
| 6-Person Families | 912 (4.5%) | $0 |
| 7+ Person Families | 167 (0.8%) | $180,365 |
| Total | 20,085 (100.0%) | $77,156 |
Family Income by Number of Earners in Temple
The median family income in Temple is $77,156, with families comprising 3+ earners (1,371) having the highest median family income of $137,620, while families with no earners (2,833) have the lowest median family income of $47,931, accounting for 6.8% and 14.1% of families, respectively.
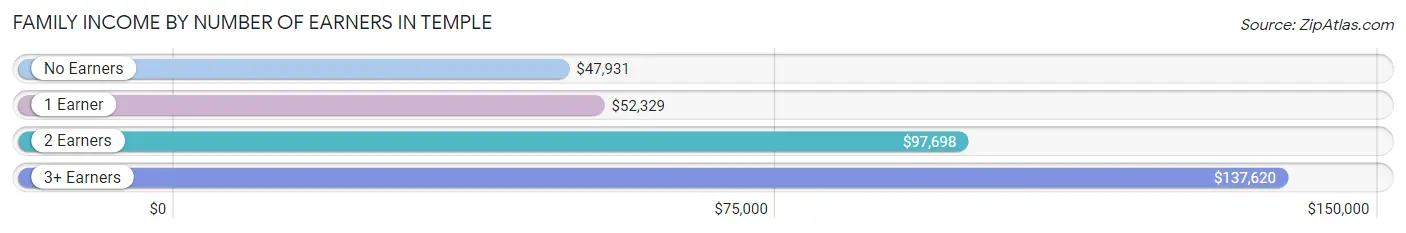
| Number of Earners | # Families | Median Income |
| No Earners | 2,833 (14.1%) | $47,931 |
| 1 Earner | 7,499 (37.3%) | $52,329 |
| 2 Earners | 8,382 (41.7%) | $97,698 |
| 3+ Earners | 1,371 (6.8%) | $137,620 |
| Total | 20,085 (100.0%) | $77,156 |
Household Income in Temple
Household Income Brackets in Temple
With 5,553 households falling in the category, the $50,000 to $74,999 income range is the most frequent in Temple, accounting for 17.6% of all households. In contrast, only 1,325 households (4.2%) fall into the $200,000+ income bracket, making it the least populous group.
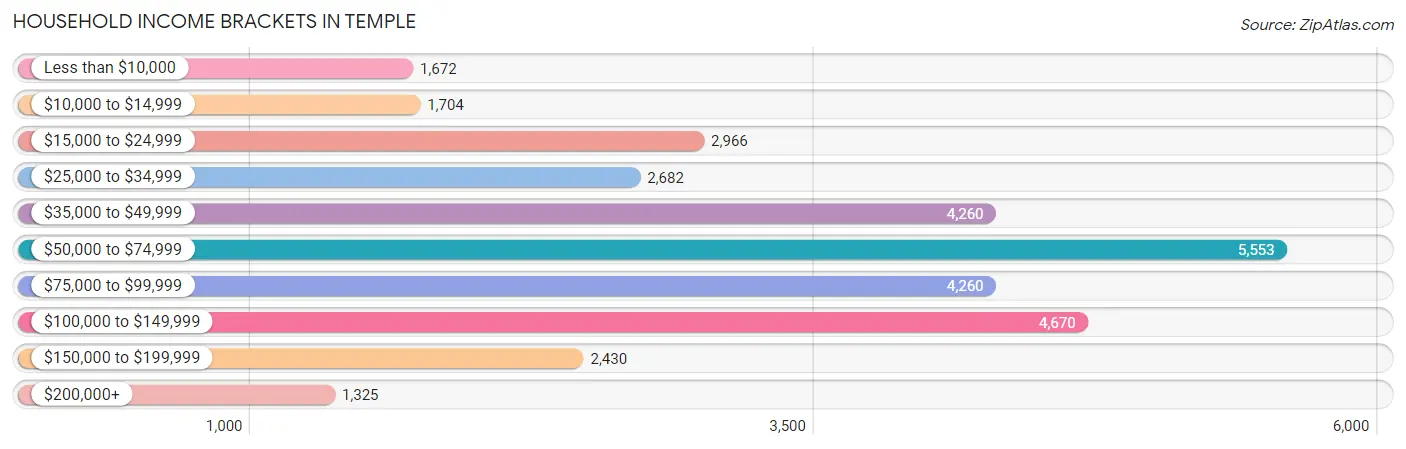
| Income Bracket | # Households | % Households |
| Less than $10,000 | 1,672 | 5.3% |
| $10,000 to $14,999 | 1,704 | 5.4% |
| $15,000 to $24,999 | 2,966 | 9.4% |
| $25,000 to $34,999 | 2,682 | 8.5% |
| $35,000 to $49,999 | 4,260 | 13.5% |
| $50,000 to $74,999 | 5,553 | 17.6% |
| $75,000 to $99,999 | 4,260 | 13.5% |
| $100,000 to $149,999 | 4,670 | 14.8% |
| $150,000 to $199,999 | 2,430 | 7.7% |
| $200,000+ | 1,325 | 4.2% |
Household Income by Householder Age in Temple
The median household income in Temple is $61,003, with the highest median household income of $68,402 found in the 25 to 44 years age bracket for the primary householder. A total of 12,697 households (40.2%) fall into this category. Meanwhile, the 15 to 24 years age bracket for the primary householder has the lowest median household income of $33,882, with 1,874 households (5.9%) in this group.
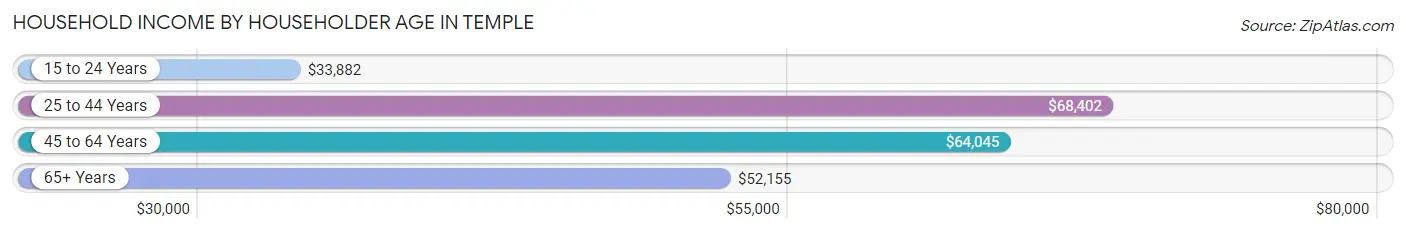
| Income Bracket | # Households | Median Income |
| 15 to 24 Years | 1,874 (5.9%) | $33,882 |
| 25 to 44 Years | 12,697 (40.2%) | $68,402 |
| 45 to 64 Years | 9,510 (30.1%) | $64,045 |
| 65+ Years | 7,471 (23.7%) | $52,155 |
| Total | 31,552 (100.0%) | $61,003 |
Poverty in Temple
Income Below Poverty by Sex and Age in Temple
With 14.0% poverty level for males and 19.8% for females among the residents of Temple, 5 year old males and 15 year old females are the most vulnerable to poverty, with 189 males (40.7%) and 284 females (39.7%) in their respective age groups living below the poverty level.
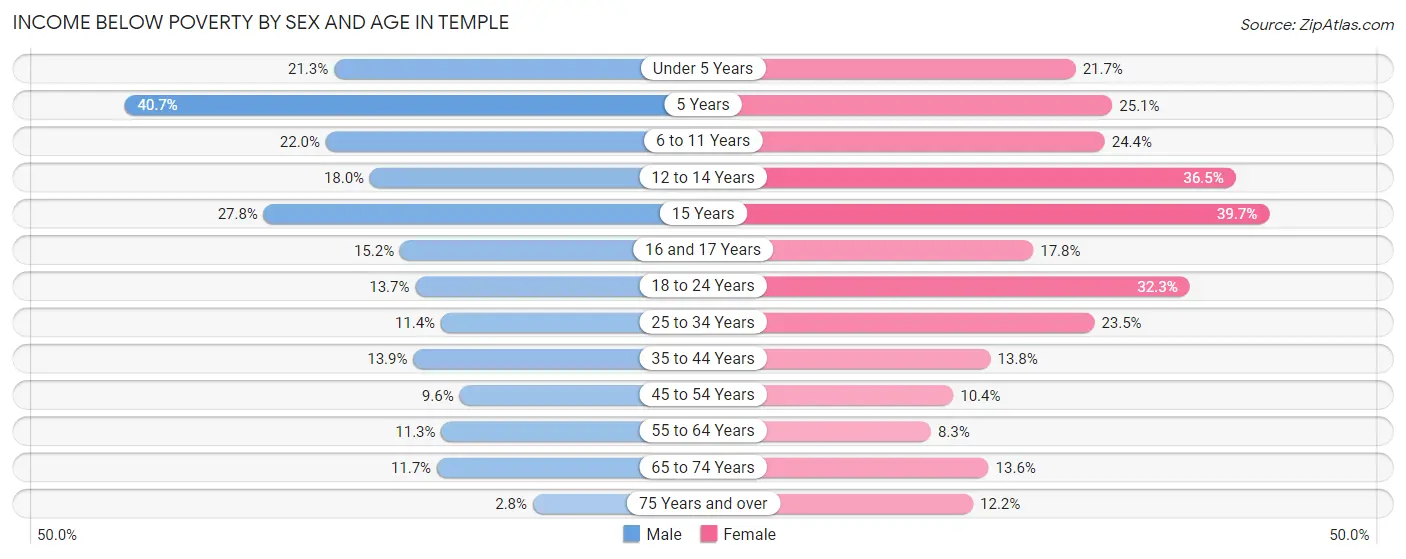
| Age Bracket | Male | Female |
| Under 5 Years | 813 (21.3%) | 664 (21.7%) |
| 5 Years | 189 (40.7%) | 171 (25.1%) |
| 6 to 11 Years | 758 (22.0%) | 926 (24.4%) |
| 12 to 14 Years | 208 (17.9%) | 1,015 (36.5%) |
| 15 Years | 109 (27.8%) | 284 (39.7%) |
| 16 and 17 Years | 184 (15.2%) | 196 (17.8%) |
| 18 to 24 Years | 446 (13.7%) | 1,350 (32.3%) |
| 25 to 34 Years | 724 (11.4%) | 1,513 (23.4%) |
| 35 to 44 Years | 786 (13.9%) | 756 (13.8%) |
| 45 to 54 Years | 377 (9.6%) | 409 (10.3%) |
| 55 to 64 Years | 480 (11.3%) | 342 (8.3%) |
| 65 to 74 Years | 330 (11.7%) | 454 (13.6%) |
| 75 Years and over | 63 (2.8%) | 397 (12.2%) |
| Total | 5,467 (14.0%) | 8,477 (19.8%) |
Income Above Poverty by Sex and Age in Temple
According to the poverty statistics in Temple, males aged 75 years and over and females aged 55 to 64 years are the age groups that are most secure financially, with 97.2% of males and 91.7% of females in these age groups living above the poverty line.
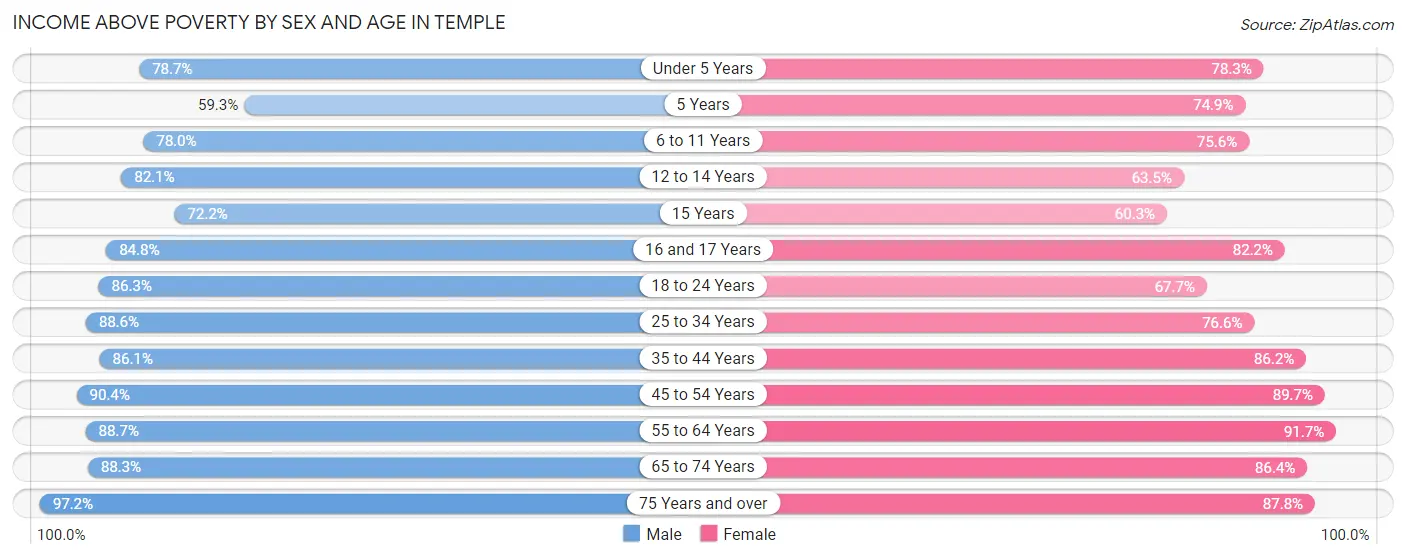
| Age Bracket | Male | Female |
| Under 5 Years | 3,008 (78.7%) | 2,395 (78.3%) |
| 5 Years | 275 (59.3%) | 510 (74.9%) |
| 6 to 11 Years | 2,681 (78.0%) | 2,867 (75.6%) |
| 12 to 14 Years | 951 (82.1%) | 1,763 (63.5%) |
| 15 Years | 283 (72.2%) | 432 (60.3%) |
| 16 and 17 Years | 1,030 (84.8%) | 907 (82.2%) |
| 18 to 24 Years | 2,801 (86.3%) | 2,834 (67.7%) |
| 25 to 34 Years | 5,651 (88.6%) | 4,939 (76.5%) |
| 35 to 44 Years | 4,855 (86.1%) | 4,718 (86.2%) |
| 45 to 54 Years | 3,533 (90.4%) | 3,543 (89.6%) |
| 55 to 64 Years | 3,762 (88.7%) | 3,790 (91.7%) |
| 65 to 74 Years | 2,484 (88.3%) | 2,877 (86.4%) |
| 75 Years and over | 2,161 (97.2%) | 2,859 (87.8%) |
| Total | 33,475 (86.0%) | 34,434 (80.2%) |
Income Below Poverty Among Married-Couple Families in Temple
The poverty statistics for married-couple families in Temple show that 8.1% or 1,142 of the total 14,088 families live below the poverty line. Families with 3 or 4 children have the highest poverty rate of 20.4%, comprising of 355 families. On the other hand, families with 5 or more children have the lowest poverty rate of 0.0%, which includes 0 families.
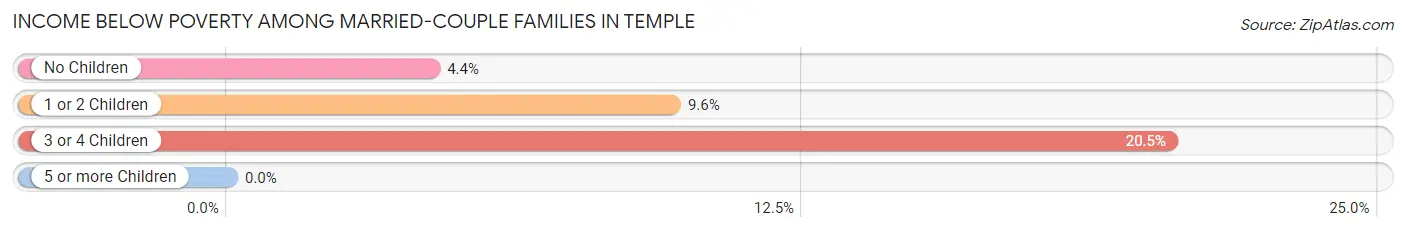
| Children | Above Poverty | Below Poverty |
| No Children | 7,309 (95.6%) | 336 (4.4%) |
| 1 or 2 Children | 4,228 (90.4%) | 451 (9.6%) |
| 3 or 4 Children | 1,381 (79.5%) | 355 (20.4%) |
| 5 or more Children | 28 (100.0%) | 0 (0.0%) |
| Total | 12,946 (91.9%) | 1,142 (8.1%) |
Income Below Poverty Among Single-Parent Households in Temple
According to the poverty data in Temple, 5.1% or 75 single-father households and 30.4% or 1,380 single-mother households are living below the poverty line. Among single-father households, those with 1 or 2 children have the highest poverty rate, with 62 households (7.2%) experiencing poverty. Likewise, among single-mother households, those with 5 or more children have the highest poverty rate, with 305 households (95.9%) falling below the poverty line.
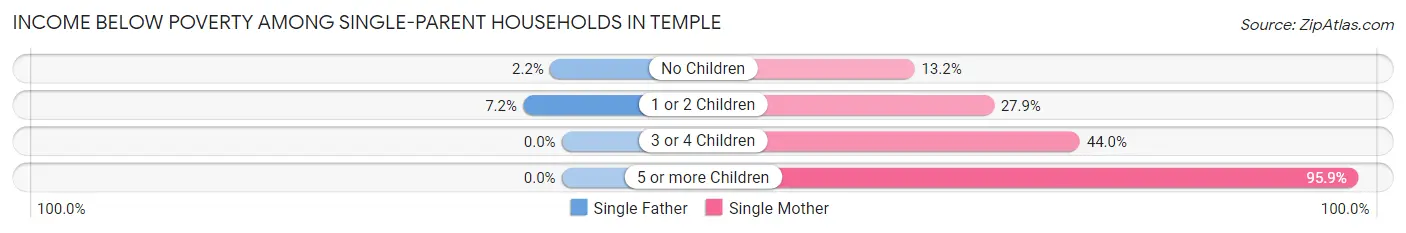
| Children | Single Father | Single Mother |
| No Children | 13 (2.2%) | 164 (13.2%) |
| 1 or 2 Children | 62 (7.2%) | 692 (27.9%) |
| 3 or 4 Children | 0 (0.0%) | 219 (44.0%) |
| 5 or more Children | 0 (0.0%) | 305 (95.9%) |
| Total | 75 (5.1%) | 1,380 (30.4%) |
Income Below Poverty Among Married-Couple vs Single-Parent Households in Temple
The poverty data for Temple shows that 1,142 of the married-couple family households (8.1%) and 1,455 of the single-parent households (24.3%) are living below the poverty level. Within the married-couple family households, those with 3 or 4 children have the highest poverty rate, with 355 households (20.4%) falling below the poverty line. Among the single-parent households, those with 5 or more children have the highest poverty rate, with 305 household (95.9%) living below poverty.
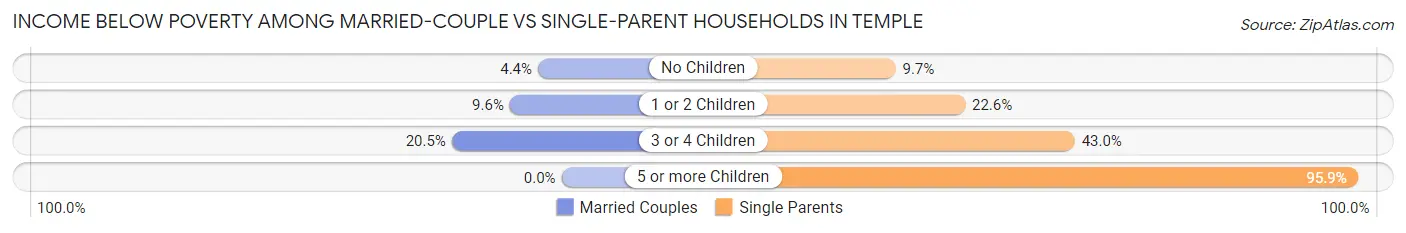
| Children | Married-Couple Families | Single-Parent Households |
| No Children | 336 (4.4%) | 177 (9.7%) |
| 1 or 2 Children | 451 (9.6%) | 754 (22.6%) |
| 3 or 4 Children | 355 (20.4%) | 219 (43.0%) |
| 5 or more Children | 0 (0.0%) | 305 (95.9%) |
| Total | 1,142 (8.1%) | 1,455 (24.3%) |
Race in Temple
The most populous races in Temple are White / Caucasian (54,757 | 65.6%), Hispanic or Latino (24,049 | 28.8%), and Black / African American (10,995 | 13.2%).
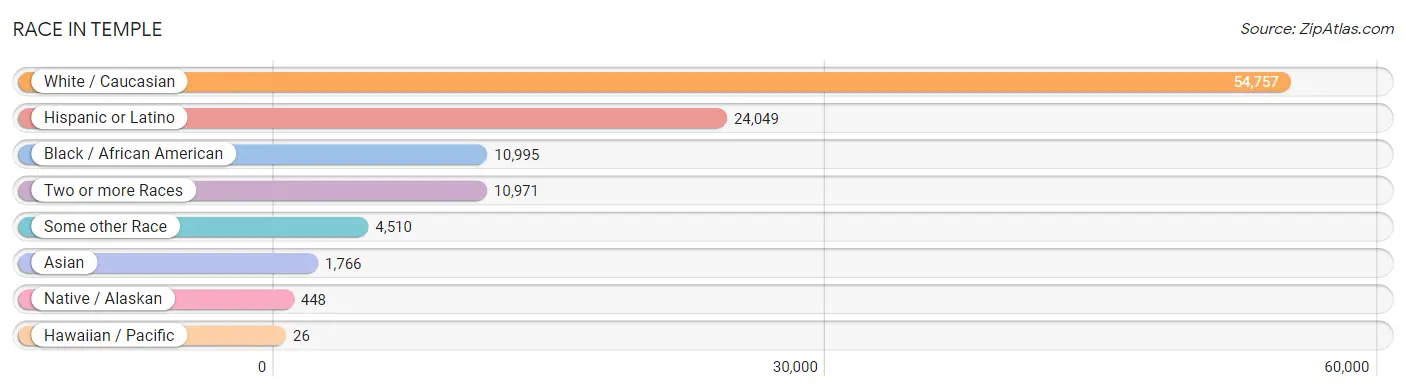
| Race | # Population | % Population |
| Asian | 1,766 | 2.1% |
| Black / African American | 10,995 | 13.2% |
| Hawaiian / Pacific | 26 | 0.0% |
| Hispanic or Latino | 24,049 | 28.8% |
| Native / Alaskan | 448 | 0.5% |
| White / Caucasian | 54,757 | 65.6% |
| Two or more Races | 10,971 | 13.1% |
| Some other Race | 4,510 | 5.4% |
| Total | 83,473 | 100.0% |
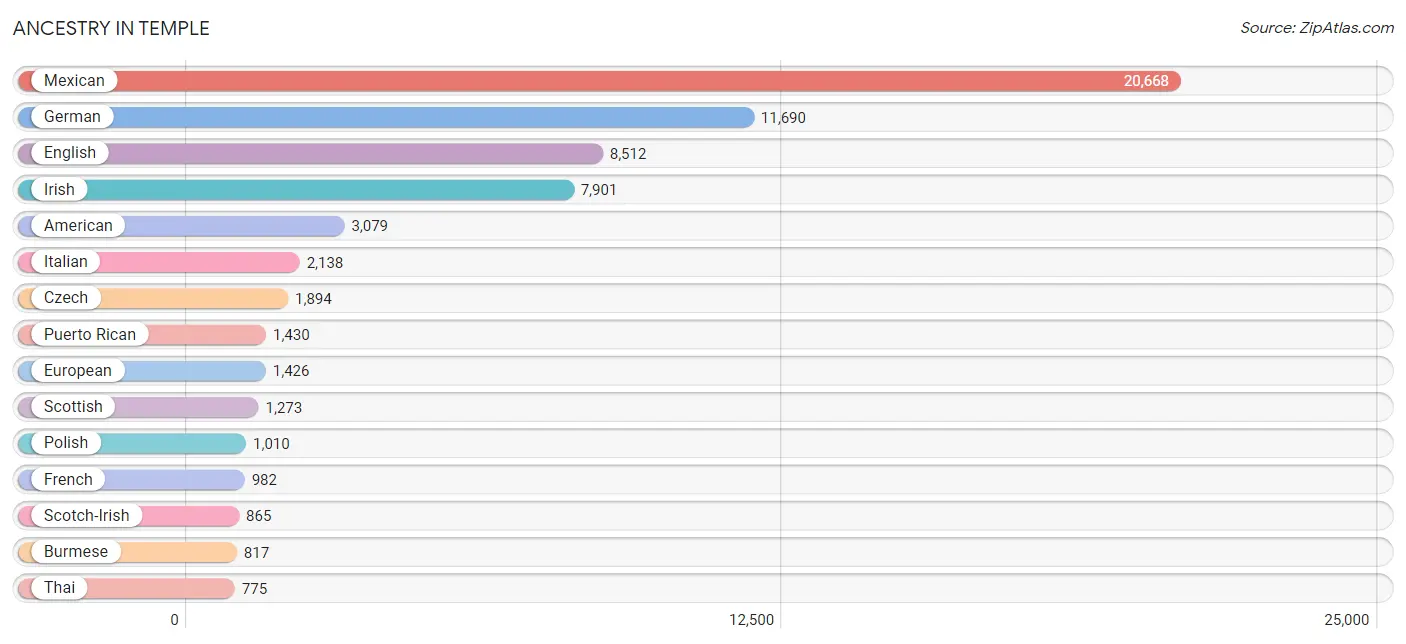
Ancestry in Temple
The most populous ancestries reported in Temple are Mexican (20,668 | 24.8%), German (11,690 | 14.0%), English (8,512 | 10.2%), Irish (7,901 | 9.5%), and American (3,079 | 3.7%), together accounting for 62.1% of all Temple residents.
| Ancestry | # Population | % Population |
| African | 99 | 0.1% |
| Albanian | 57 | 0.1% |
| American | 3,079 | 3.7% |
| Apache | 53 | 0.1% |
| Arab | 123 | 0.2% |
| Armenian | 11 | 0.0% |
| Assyrian / Chaldean / Syriac | 42 | 0.1% |
| Austrian | 75 | 0.1% |
| Belgian | 29 | 0.0% |
| Bhutanese | 516 | 0.6% |
| Blackfeet | 192 | 0.2% |
| Brazilian | 213 | 0.3% |
| British | 491 | 0.6% |
| Burmese | 817 | 1.0% |
| Canadian | 109 | 0.1% |
| Central American | 580 | 0.7% |
| Central American Indian | 156 | 0.2% |
| Cherokee | 470 | 0.6% |
| Chickasaw | 27 | 0.0% |
| Choctaw | 100 | 0.1% |
| Colombian | 62 | 0.1% |
| Comanche | 17 | 0.0% |
| Croatian | 19 | 0.0% |
| Crow | 73 | 0.1% |
| Cuban | 28 | 0.0% |
| Cypriot | 5 | 0.0% |
| Czech | 1,894 | 2.3% |
| Czechoslovakian | 98 | 0.1% |
| Danish | 169 | 0.2% |
| Dominican | 42 | 0.1% |
| Dutch | 462 | 0.5% |
| Dutch West Indian | 31 | 0.0% |
| Eastern European | 72 | 0.1% |
| Ecuadorian | 38 | 0.1% |
| English | 8,512 | 10.2% |
| Estonian | 6 | 0.0% |
| Ethiopian | 12 | 0.0% |
| European | 1,426 | 1.7% |
| Filipino | 31 | 0.0% |
| Finnish | 69 | 0.1% |
| French | 982 | 1.2% |
| French Canadian | 184 | 0.2% |
| German | 11,690 | 14.0% |
| German Russian | 12 | 0.0% |
| Greek | 16 | 0.0% |
| Guamanian / Chamorro | 37 | 0.0% |
| Guatemalan | 155 | 0.2% |
| Honduran | 192 | 0.2% |
| Hungarian | 146 | 0.2% |
| Indian (Asian) | 327 | 0.4% |
| Indonesian | 53 | 0.1% |
| Iranian | 71 | 0.1% |
| Irish | 7,901 | 9.5% |
| Iroquois | 7 | 0.0% |
| Israeli | 72 | 0.1% |
| Italian | 2,138 | 2.6% |
| Jamaican | 52 | 0.1% |
| Korean | 219 | 0.3% |
| Laotian | 60 | 0.1% |
| Latvian | 6 | 0.0% |
| Lebanese | 67 | 0.1% |
| Liberian | 62 | 0.1% |
| Lumbee | 2 | 0.0% |
| Mexican | 20,668 | 24.8% |
| Mexican American Indian | 197 | 0.2% |
| Native Hawaiian | 94 | 0.1% |
| Navajo | 60 | 0.1% |
| Nicaraguan | 157 | 0.2% |
| Nigerian | 46 | 0.1% |
| Northern European | 57 | 0.1% |
| Norwegian | 682 | 0.8% |
| Ottawa | 24 | 0.0% |
| Pakistani | 23 | 0.0% |
| Panamanian | 25 | 0.0% |
| Peruvian | 42 | 0.1% |
| Polish | 1,010 | 1.2% |
| Portuguese | 257 | 0.3% |
| Potawatomi | 14 | 0.0% |
| Puerto Rican | 1,430 | 1.7% |
| Romanian | 12 | 0.0% |
| Russian | 245 | 0.3% |
| Salvadoran | 51 | 0.1% |
| Samoan | 8 | 0.0% |
| Scandinavian | 263 | 0.3% |
| Scotch-Irish | 865 | 1.0% |
| Scottish | 1,273 | 1.5% |
| Sioux | 38 | 0.1% |
| Slovene | 28 | 0.0% |
| South American | 142 | 0.2% |
| Spaniard | 277 | 0.3% |
| Spanish | 190 | 0.2% |
| Spanish American | 278 | 0.3% |
| Sri Lankan | 127 | 0.2% |
| Subsaharan African | 266 | 0.3% |
| Swedish | 517 | 0.6% |
| Swiss | 303 | 0.4% |
| Syrian | 40 | 0.1% |
| Thai | 775 | 0.9% |
| Tlingit-Haida | 12 | 0.0% |
| Turkish | 62 | 0.1% |
| Ukrainian | 140 | 0.2% |
| Welsh | 455 | 0.5% |
| West Indian | 72 | 0.1% | View All 103 Rows |
Immigrants in Temple
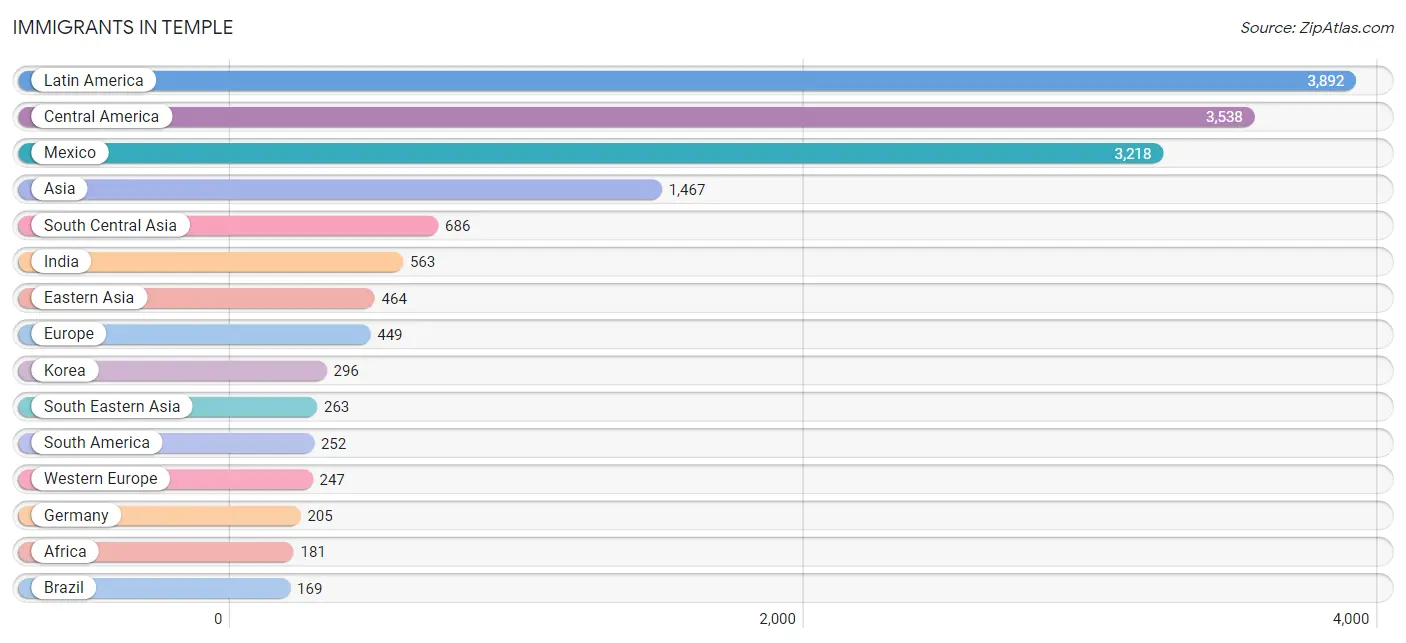
The most numerous immigrant groups reported in Temple came from Latin America (3,892 | 4.7%), Central America (3,538 | 4.2%), Mexico (3,218 | 3.9%), Asia (1,467 | 1.8%), and South Central Asia (686 | 0.8%), together accounting for 15.3% of all Temple residents.
| Immigration Origin | # Population | % Population |
| Africa | 181 | 0.2% |
| Armenia | 5 | 0.0% |
| Asia | 1,467 | 1.8% |
| Brazil | 169 | 0.2% |
| Canada | 45 | 0.1% |
| Caribbean | 102 | 0.1% |
| Central America | 3,538 | 4.2% |
| China | 154 | 0.2% |
| Colombia | 14 | 0.0% |
| Costa Rica | 19 | 0.0% |
| Dominican Republic | 42 | 0.1% |
| Eastern Africa | 78 | 0.1% |
| Eastern Asia | 464 | 0.6% |
| Eastern Europe | 97 | 0.1% |
| Ecuador | 38 | 0.1% |
| El Salvador | 45 | 0.1% |
| England | 26 | 0.0% |
| Ethiopia | 25 | 0.0% |
| Europe | 449 | 0.5% |
| France | 25 | 0.0% |
| Germany | 205 | 0.3% |
| Guatemala | 46 | 0.1% |
| Honduras | 78 | 0.1% |
| India | 563 | 0.7% |
| Indonesia | 11 | 0.0% |
| Iran | 36 | 0.0% |
| Italy | 5 | 0.0% |
| Jamaica | 39 | 0.1% |
| Japan | 14 | 0.0% |
| Korea | 296 | 0.4% |
| Latin America | 3,892 | 4.7% |
| Liberia | 62 | 0.1% |
| Mexico | 3,218 | 3.9% |
| Netherlands | 17 | 0.0% |
| Nicaragua | 24 | 0.0% |
| Nigeria | 41 | 0.1% |
| Northern Europe | 63 | 0.1% |
| Pakistan | 87 | 0.1% |
| Panama | 108 | 0.1% |
| Peru | 31 | 0.0% |
| Philippines | 128 | 0.2% |
| Poland | 38 | 0.1% |
| Romania | 27 | 0.0% |
| Russia | 14 | 0.0% |
| Saudi Arabia | 16 | 0.0% |
| South America | 252 | 0.3% |
| South Central Asia | 686 | 0.8% |
| South Eastern Asia | 263 | 0.3% |
| Southern Europe | 42 | 0.1% |
| Spain | 37 | 0.0% |
| Syria | 6 | 0.0% |
| Thailand | 23 | 0.0% |
| Trinidad and Tobago | 21 | 0.0% |
| Turkey | 20 | 0.0% |
| Ukraine | 12 | 0.0% |
| Vietnam | 75 | 0.1% |
| Western Africa | 103 | 0.1% |
| Western Asia | 54 | 0.1% |
| Western Europe | 247 | 0.3% |
| Zimbabwe | 23 | 0.0% | View All 60 Rows |
Sex and Age in Temple
Sex and Age in Temple
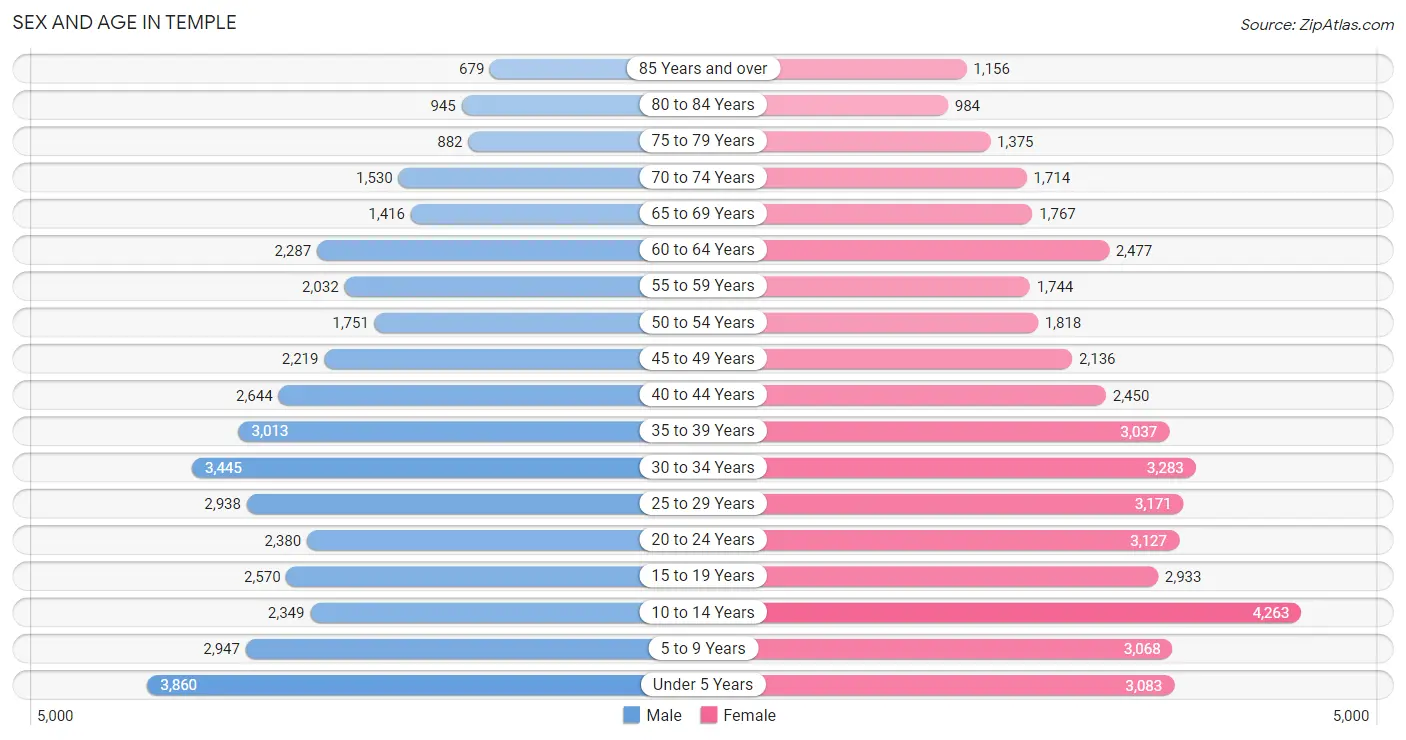
The most populous age groups in Temple are Under 5 Years (3,860 | 9.7%) for men and 10 to 14 Years (4,263 | 9.8%) for women.
| Age Bracket | Male | Female |
| Under 5 Years | 3,860 (9.7%) | 3,083 (7.1%) |
| 5 to 9 Years | 2,947 (7.4%) | 3,068 (7.0%) |
| 10 to 14 Years | 2,349 (5.9%) | 4,263 (9.8%) |
| 15 to 19 Years | 2,570 (6.4%) | 2,933 (6.7%) |
| 20 to 24 Years | 2,380 (6.0%) | 3,127 (7.2%) |
| 25 to 29 Years | 2,938 (7.4%) | 3,171 (7.3%) |
| 30 to 34 Years | 3,445 (8.6%) | 3,283 (7.5%) |
| 35 to 39 Years | 3,013 (7.5%) | 3,037 (7.0%) |
| 40 to 44 Years | 2,644 (6.6%) | 2,450 (5.6%) |
| 45 to 49 Years | 2,219 (5.6%) | 2,136 (4.9%) |
| 50 to 54 Years | 1,751 (4.4%) | 1,818 (4.2%) |
| 55 to 59 Years | 2,032 (5.1%) | 1,744 (4.0%) |
| 60 to 64 Years | 2,287 (5.7%) | 2,477 (5.7%) |
| 65 to 69 Years | 1,416 (3.5%) | 1,767 (4.1%) |
| 70 to 74 Years | 1,530 (3.8%) | 1,714 (3.9%) |
| 75 to 79 Years | 882 (2.2%) | 1,375 (3.2%) |
| 80 to 84 Years | 945 (2.4%) | 984 (2.3%) |
| 85 Years and over | 679 (1.7%) | 1,156 (2.6%) |
| Total | 39,887 (100.0%) | 43,586 (100.0%) |
Families and Households in Temple
Median Family Size in Temple
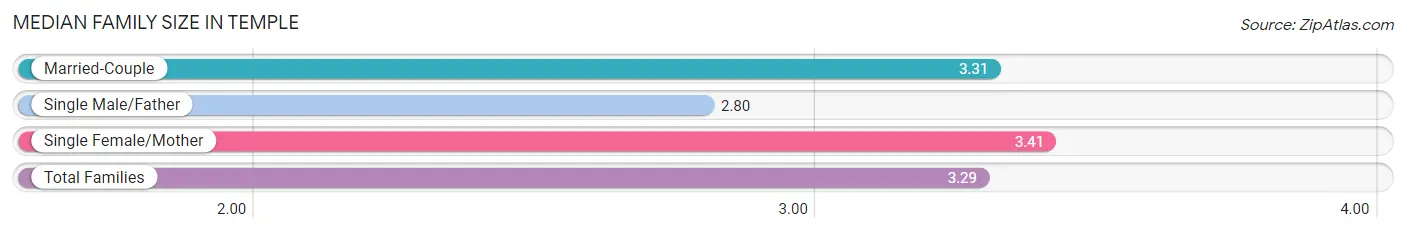
The median family size in Temple is 3.29 persons per family, with single female/mother families (4,536 | 22.6%) accounting for the largest median family size of 3.41 persons per family. On the other hand, single male/father families (1,461 | 7.3%) represent the smallest median family size with 2.80 persons per family.
| Family Type | # Families | Family Size |
| Married-Couple | 14,088 (70.1%) | 3.31 |
| Single Male/Father | 1,461 (7.3%) | 2.80 |
| Single Female/Mother | 4,536 (22.6%) | 3.41 |
| Total Families | 20,085 (100.0%) | 3.29 |
Median Household Size in Temple
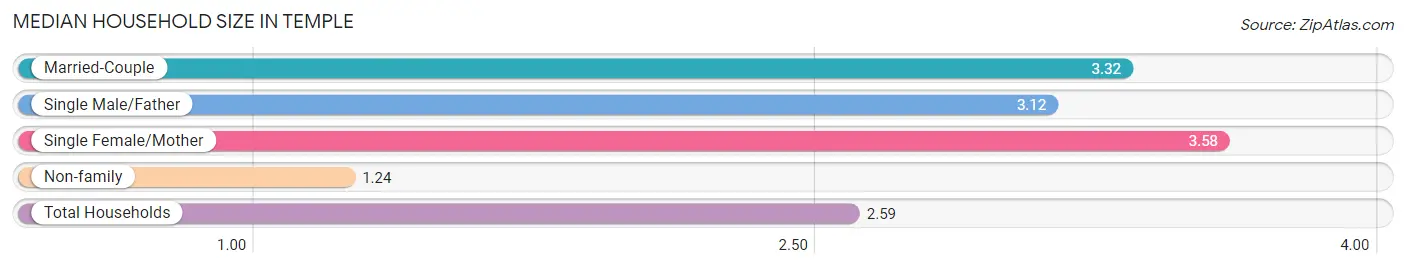
The median household size in Temple is 2.59 persons per household, with single female/mother households (4,536 | 14.4%) accounting for the largest median household size of 3.58 persons per household. non-family households (11,467 | 36.3%) represent the smallest median household size with 1.24 persons per household.
| Household Type | # Households | Household Size |
| Married-Couple | 14,088 (44.7%) | 3.32 |
| Single Male/Father | 1,461 (4.6%) | 3.12 |
| Single Female/Mother | 4,536 (14.4%) | 3.58 |
| Non-family | 11,467 (36.3%) | 1.24 |
| Total Households | 31,552 (100.0%) | 2.59 |
Household Size by Marriage Status in Temple
Out of a total of 31,552 households in Temple, 20,085 (63.7%) are family households, while 11,467 (36.3%) are nonfamily households. The most numerous type of family households are 2-person households, comprising 8,515, and the most common type of nonfamily households are 1-person households, comprising 9,610.
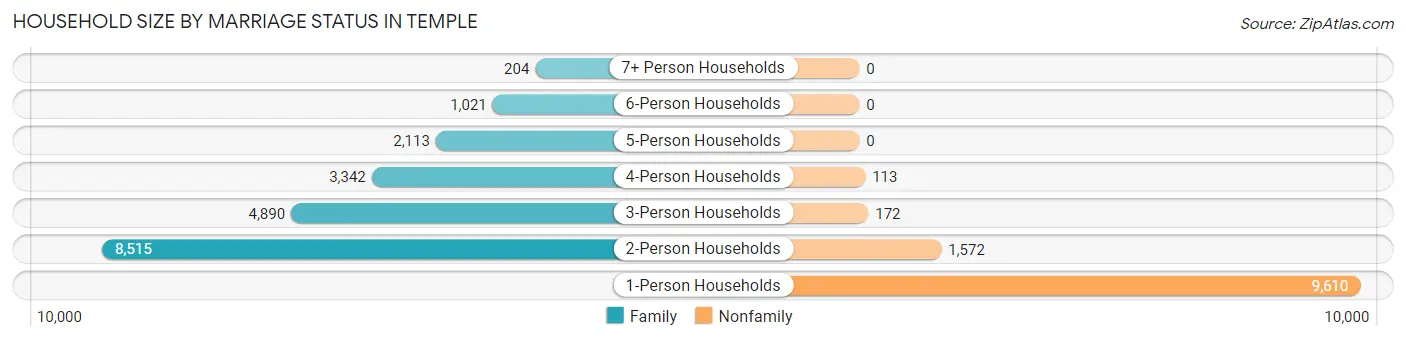
| Household Size | Family Households | Nonfamily Households |
| 1-Person Households | - | 9,610 (30.5%) |
| 2-Person Households | 8,515 (27.0%) | 1,572 (5.0%) |
| 3-Person Households | 4,890 (15.5%) | 172 (0.5%) |
| 4-Person Households | 3,342 (10.6%) | 113 (0.4%) |
| 5-Person Households | 2,113 (6.7%) | 0 (0.0%) |
| 6-Person Households | 1,021 (3.2%) | 0 (0.0%) |
| 7+ Person Households | 204 (0.6%) | 0 (0.0%) |
| Total | 20,085 (63.7%) | 11,467 (36.3%) |
Female Fertility in Temple
Fertility by Age in Temple
Average fertility rate in Temple is 71.0 births per 1,000 women. Women in the age bracket of 20 to 34 years have the highest fertility rate with 127.0 births per 1,000 women. Women in the age bracket of 20 to 34 years acount for 83.5% of all women with births.
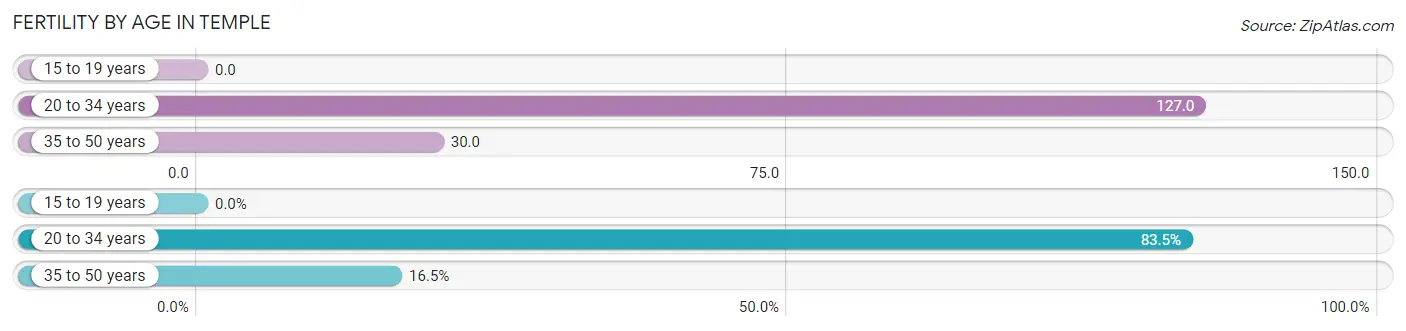
| Age Bracket | Women with Births | Births / 1,000 Women |
| 15 to 19 years | 0 (0.0%) | 0.0 |
| 20 to 34 years | 1,217 (83.5%) | 127.0 |
| 35 to 50 years | 240 (16.5%) | 30.0 |
| Total | 1,457 (100.0%) | 71.0 |
Fertility by Age by Marriage Status in Temple
67.2% of women with births (1,457) in Temple are married. The highest percentage of unmarried women with births falls into 20 to 34 years age bracket with 35.7% of them unmarried at the time of birth, while the lowest percentage of unmarried women with births belong to 35 to 50 years age bracket with 17.9% of them unmarried.
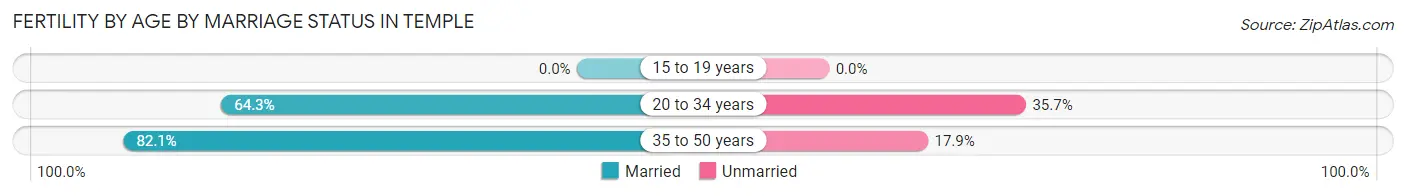
| Age Bracket | Married | Unmarried |
| 15 to 19 years | 0 (0.0%) | 0 (0.0%) |
| 20 to 34 years | 783 (64.3%) | 434 (35.7%) |
| 35 to 50 years | 197 (82.1%) | 43 (17.9%) |
| Total | 979 (67.2%) | 478 (32.8%) |
Fertility by Education in Temple
Average fertility rate in Temple is 71.0 births per 1,000 women. Women with the education attainment of high school diploma have the highest fertility rate of 101.0 births per 1,000 women, while women with the education attainment of less than high school have the lowest fertility at 19.0 births per 1,000 women. Women with the education attainment of college or associate's degree represent 33.6% of all women with births.
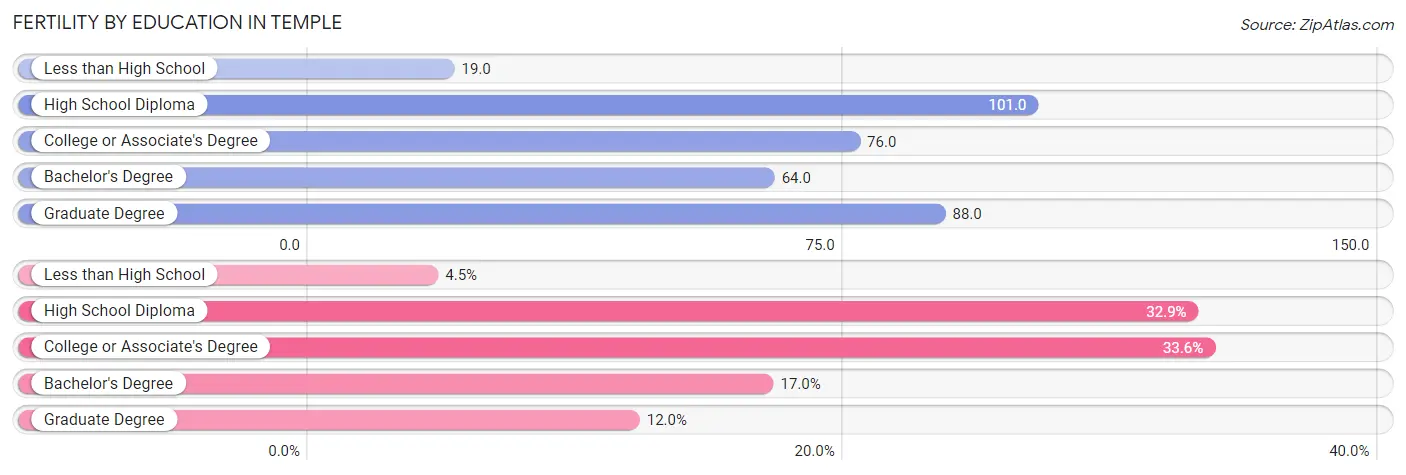
| Educational Attainment | Women with Births | Births / 1,000 Women |
| Less than High School | 65 (4.5%) | 19.0 |
| High School Diploma | 480 (32.9%) | 101.0 |
| College or Associate's Degree | 489 (33.6%) | 76.0 |
| Bachelor's Degree | 248 (17.0%) | 64.0 |
| Graduate Degree | 175 (12.0%) | 88.0 |
| Total | 1,457 (100.0%) | 71.0 |
Fertility by Education by Marriage Status in Temple
32.8% of women with births in Temple are unmarried. Women with the educational attainment of bachelor's degree are most likely to be married with 100.0% of them married at childbirth, while women with the educational attainment of high school diploma are least likely to be married with 54.0% of them unmarried at childbirth.
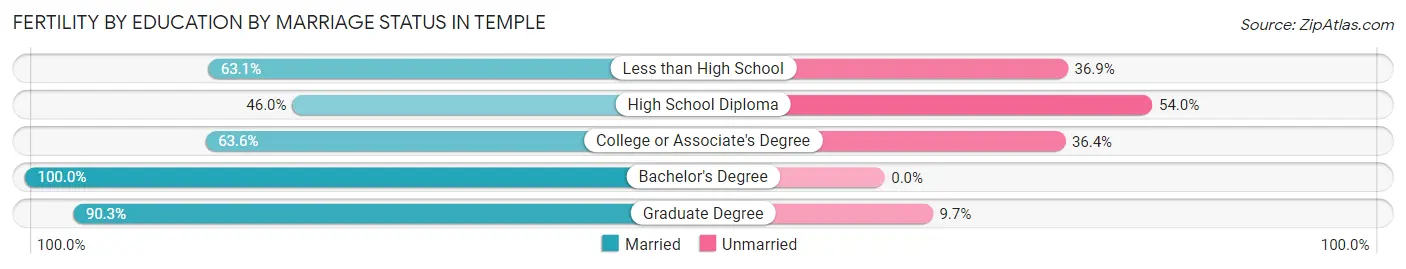
| Educational Attainment | Married | Unmarried |
| Less than High School | 41 (63.1%) | 24 (36.9%) |
| High School Diploma | 221 (46.0%) | 259 (54.0%) |
| College or Associate's Degree | 311 (63.6%) | 178 (36.4%) |
| Bachelor's Degree | 248 (100.0%) | 0 (0.0%) |
| Graduate Degree | 158 (90.3%) | 17 (9.7%) |
| Total | 979 (67.2%) | 478 (32.8%) |
Employment Characteristics in Temple
Employment by Class of Employer in Temple
Among the 35,301 employed individuals in Temple, private company employees (21,734 | 61.6%), not-for-profit organizations (4,161 | 11.8%), and local government employees (2,943 | 8.3%) make up the most common classes of employment.
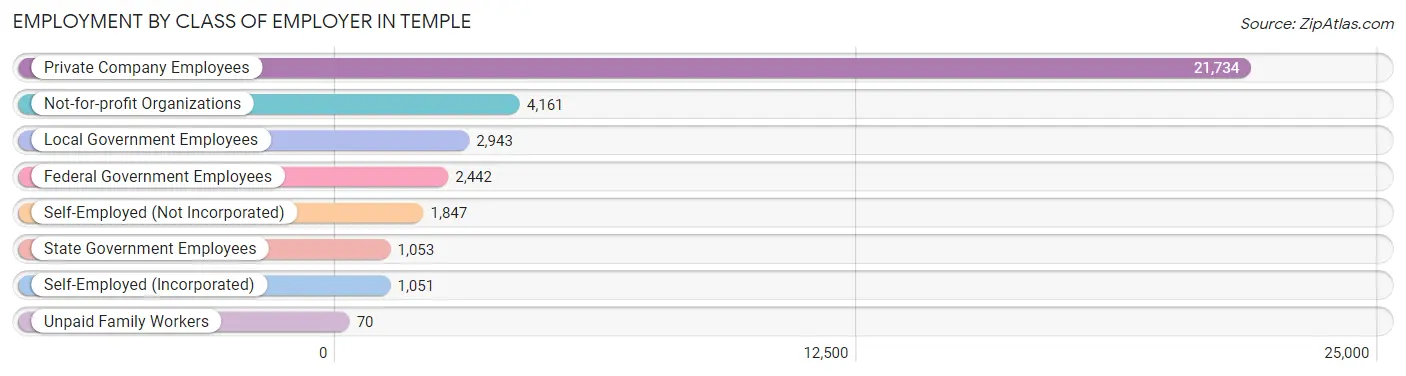
| Employer Class | # Employees | % Employees |
| Private Company Employees | 21,734 | 61.6% |
| Self-Employed (Incorporated) | 1,051 | 3.0% |
| Self-Employed (Not Incorporated) | 1,847 | 5.2% |
| Not-for-profit Organizations | 4,161 | 11.8% |
| Local Government Employees | 2,943 | 8.3% |
| State Government Employees | 1,053 | 3.0% |
| Federal Government Employees | 2,442 | 6.9% |
| Unpaid Family Workers | 70 | 0.2% |
| Total | 35,301 | 100.0% |
Employment Status by Age in Temple
According to the labor force statistics for Temple, out of the total population over 16 years of age (62,795), 61.5% or 38,619 individuals are in the labor force, with 7.1% or 2,742 of them unemployed. The age group with the highest labor force participation rate is 35 to 44 years, with 82.4% or 9,183 individuals in the labor force. Within the labor force, the 16 to 19 years age range has the highest percentage of unemployed individuals, with 20.0% or 365 of them being unemployed.
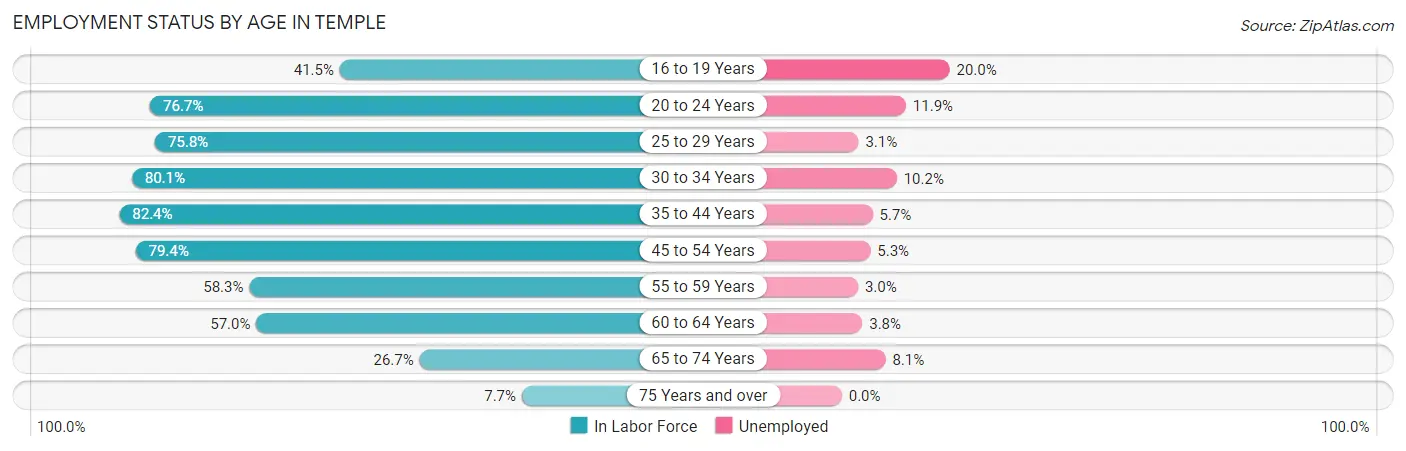
| Age Bracket | In Labor Force | Unemployed |
| 16 to 19 Years | 1,824 (41.5%) | 365 (20.0%) |
| 20 to 24 Years | 4,224 (76.7%) | 503 (11.9%) |
| 25 to 29 Years | 4,631 (75.8%) | 144 (3.1%) |
| 30 to 34 Years | 5,389 (80.1%) | 550 (10.2%) |
| 35 to 44 Years | 9,183 (82.4%) | 523 (5.7%) |
| 45 to 54 Years | 6,292 (79.4%) | 333 (5.3%) |
| 55 to 59 Years | 2,201 (58.3%) | 66 (3.0%) |
| 60 to 64 Years | 2,715 (57.0%) | 103 (3.8%) |
| 65 to 74 Years | 1,716 (26.7%) | 139 (8.1%) |
| 75 Years and over | 464 (7.7%) | 0 (0.0%) |
| Total | 38,619 (61.5%) | 2,742 (7.1%) |
Employment Status by Educational Attainment in Temple
According to labor force statistics for Temple, 75.2% of individuals (30,415) out of the total population between 25 and 64 years of age (40,445) are in the labor force, with 5.7% or 1,734 of them being unemployed. The group with the highest labor force participation rate are those with the educational attainment of bachelor's degree or higher, with 83.2% or 10,311 individuals in the labor force. Within the labor force, individuals with high school diploma education have the highest percentage of unemployment, with 9.8% or 678 of them being unemployed.
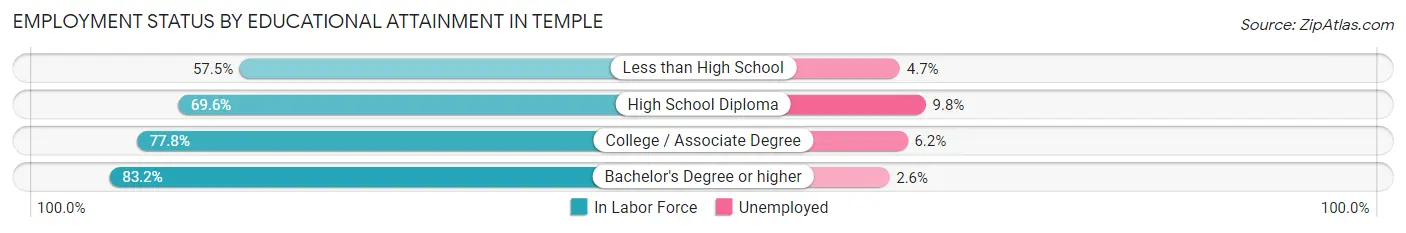
| Educational Attainment | In Labor Force | Unemployed |
| Less than High School | 2,585 (57.5%) | 211 (4.7%) |
| High School Diploma | 6,922 (69.6%) | 975 (9.8%) |
| College / Associate Degree | 10,590 (77.8%) | 844 (6.2%) |
| Bachelor's Degree or higher | 10,311 (83.2%) | 322 (2.6%) |
| Total | 30,415 (75.2%) | 2,305 (5.7%) |
Employment Occupations by Sex in Temple
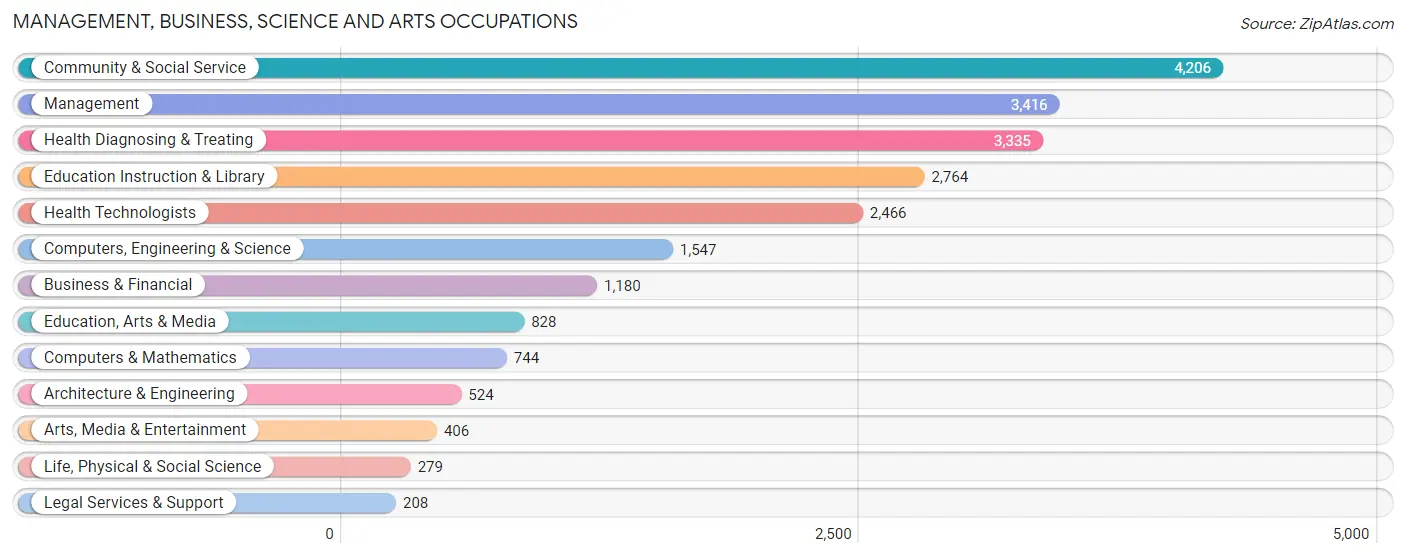
Management, Business, Science and Arts Occupations
The most common Management, Business, Science and Arts occupations in Temple are Community & Social Service (4,206 | 11.9%), Management (3,416 | 9.7%), Health Diagnosing & Treating (3,335 | 9.4%), Education Instruction & Library (2,764 | 7.8%), and Health Technologists (2,466 | 7.0%).
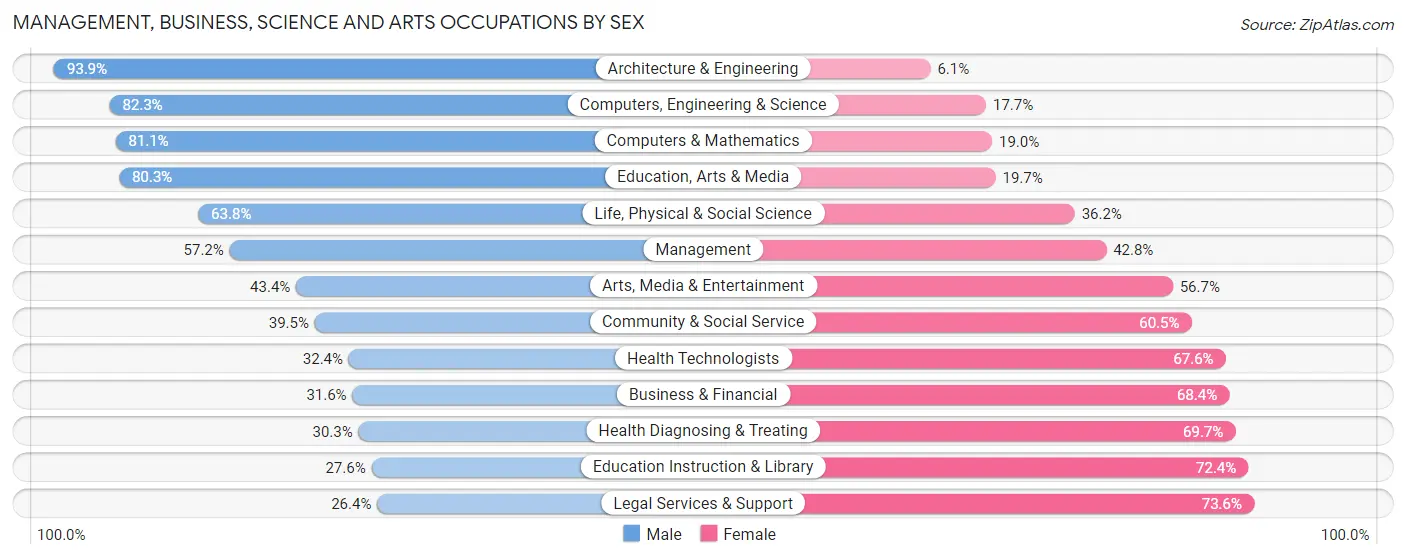
Management, Business, Science and Arts Occupations by Sex
Within the Management, Business, Science and Arts occupations in Temple, the most male-oriented occupations are Architecture & Engineering (93.9%), Computers, Engineering & Science (82.3%), and Computers & Mathematics (81.0%), while the most female-oriented occupations are Legal Services & Support (73.6%), Education Instruction & Library (72.4%), and Health Diagnosing & Treating (69.7%).
| Occupation | Male | Female |
| Management | 1,955 (57.2%) | 1,461 (42.8%) |
| Business & Financial | 373 (31.6%) | 807 (68.4%) |
| Computers, Engineering & Science | 1,273 (82.3%) | 274 (17.7%) |
| Computers & Mathematics | 603 (81.0%) | 141 (19.0%) |
| Architecture & Engineering | 492 (93.9%) | 32 (6.1%) |
| Life, Physical & Social Science | 178 (63.8%) | 101 (36.2%) |
| Community & Social Service | 1,660 (39.5%) | 2,546 (60.5%) |
| Education, Arts & Media | 665 (80.3%) | 163 (19.7%) |
| Legal Services & Support | 55 (26.4%) | 153 (73.6%) |
| Education Instruction & Library | 764 (27.6%) | 2,000 (72.4%) |
| Arts, Media & Entertainment | 176 (43.3%) | 230 (56.7%) |
| Health Diagnosing & Treating | 1,012 (30.3%) | 2,323 (69.7%) |
| Health Technologists | 798 (32.4%) | 1,668 (67.6%) |
| Total (Category) | 6,273 (45.8%) | 7,411 (54.2%) |
| Total (Overall) | 18,632 (52.8%) | 16,685 (47.2%) |
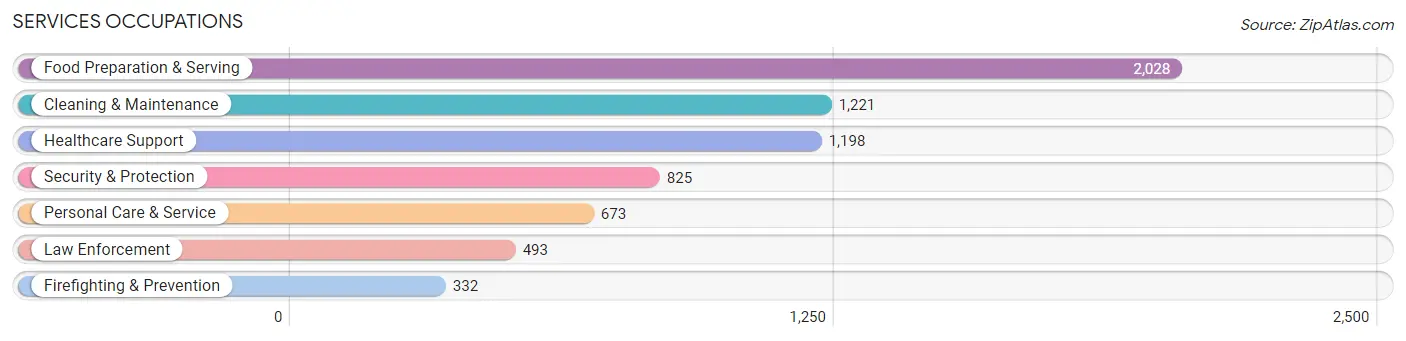
Services Occupations
The most common Services occupations in Temple are Food Preparation & Serving (2,028 | 5.7%), Cleaning & Maintenance (1,221 | 3.5%), Healthcare Support (1,198 | 3.4%), Security & Protection (825 | 2.3%), and Personal Care & Service (673 | 1.9%).
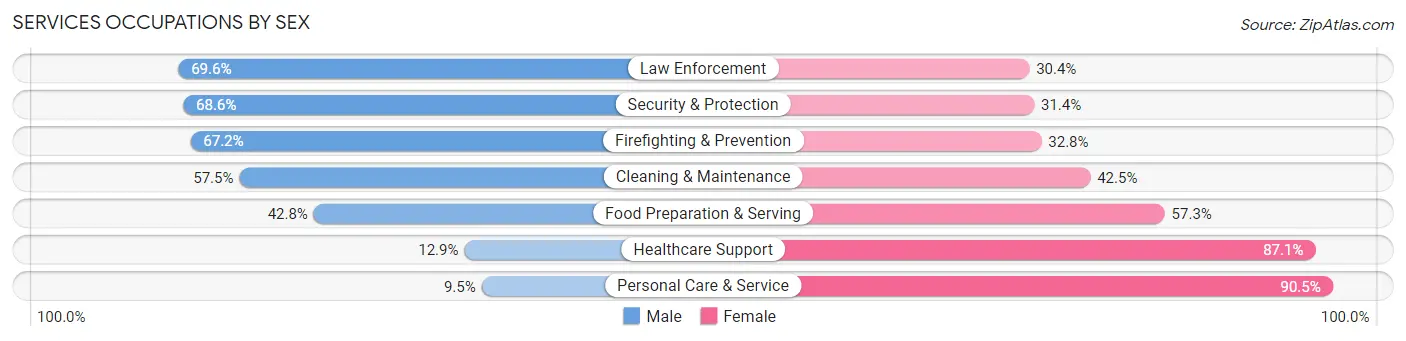
Services Occupations by Sex
Within the Services occupations in Temple, the most male-oriented occupations are Law Enforcement (69.6%), Security & Protection (68.6%), and Firefighting & Prevention (67.2%), while the most female-oriented occupations are Personal Care & Service (90.5%), Healthcare Support (87.1%), and Food Preparation & Serving (57.3%).
| Occupation | Male | Female |
| Healthcare Support | 155 (12.9%) | 1,043 (87.1%) |
| Security & Protection | 566 (68.6%) | 259 (31.4%) |
| Firefighting & Prevention | 223 (67.2%) | 109 (32.8%) |
| Law Enforcement | 343 (69.6%) | 150 (30.4%) |
| Food Preparation & Serving | 867 (42.7%) | 1,161 (57.3%) |
| Cleaning & Maintenance | 702 (57.5%) | 519 (42.5%) |
| Personal Care & Service | 64 (9.5%) | 609 (90.5%) |
| Total (Category) | 2,354 (39.6%) | 3,591 (60.4%) |
| Total (Overall) | 18,632 (52.8%) | 16,685 (47.2%) |
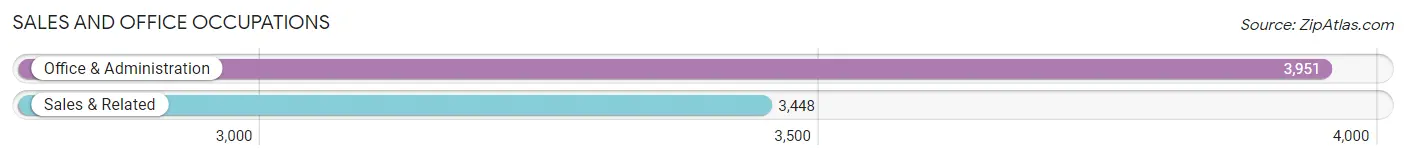
Sales and Office Occupations
The most common Sales and Office occupations in Temple are Office & Administration (3,951 | 11.2%), and Sales & Related (3,448 | 9.8%).
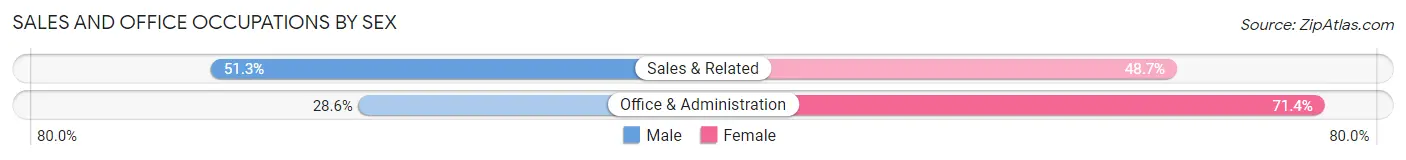
Sales and Office Occupations by Sex
| Occupation | Male | Female |
| Sales & Related | 1,770 (51.3%) | 1,678 (48.7%) |
| Office & Administration | 1,130 (28.6%) | 2,821 (71.4%) |
| Total (Category) | 2,900 (39.2%) | 4,499 (60.8%) |
| Total (Overall) | 18,632 (52.8%) | 16,685 (47.2%) |
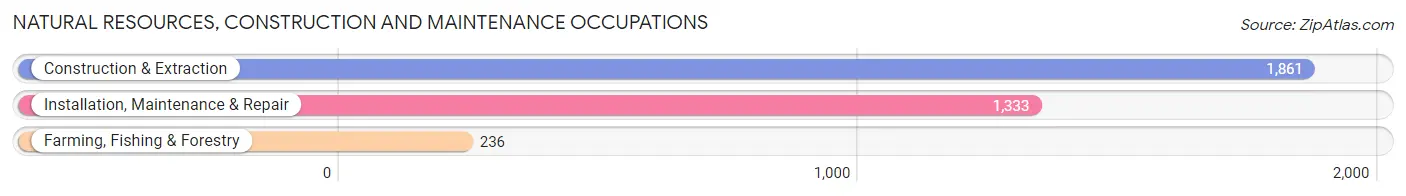
Natural Resources, Construction and Maintenance Occupations
The most common Natural Resources, Construction and Maintenance occupations in Temple are Construction & Extraction (1,861 | 5.3%), Installation, Maintenance & Repair (1,333 | 3.8%), and Farming, Fishing & Forestry (236 | 0.7%).
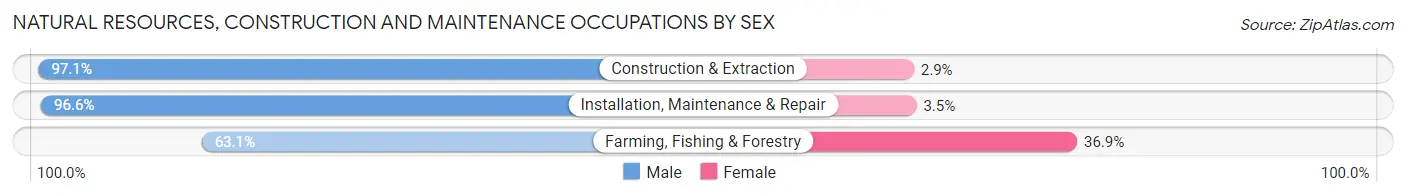
Natural Resources, Construction and Maintenance Occupations by Sex
| Occupation | Male | Female |
| Farming, Fishing & Forestry | 149 (63.1%) | 87 (36.9%) |
| Construction & Extraction | 1,807 (97.1%) | 54 (2.9%) |
| Installation, Maintenance & Repair | 1,287 (96.6%) | 46 (3.5%) |
| Total (Category) | 3,243 (94.6%) | 187 (5.4%) |
| Total (Overall) | 18,632 (52.8%) | 16,685 (47.2%) |
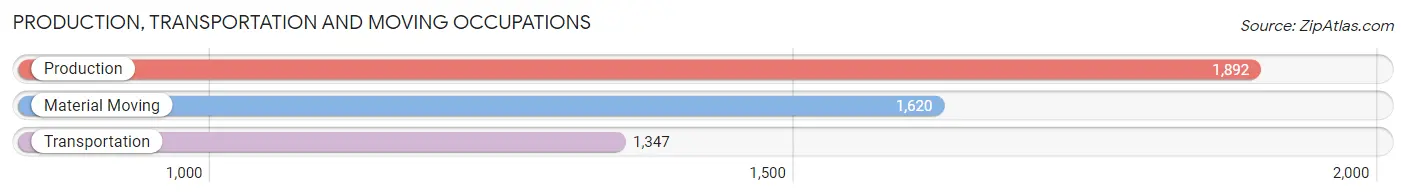
Production, Transportation and Moving Occupations
The most common Production, Transportation and Moving occupations in Temple are Production (1,892 | 5.4%), Material Moving (1,620 | 4.6%), and Transportation (1,347 | 3.8%).
Production, Transportation and Moving Occupations by Sex
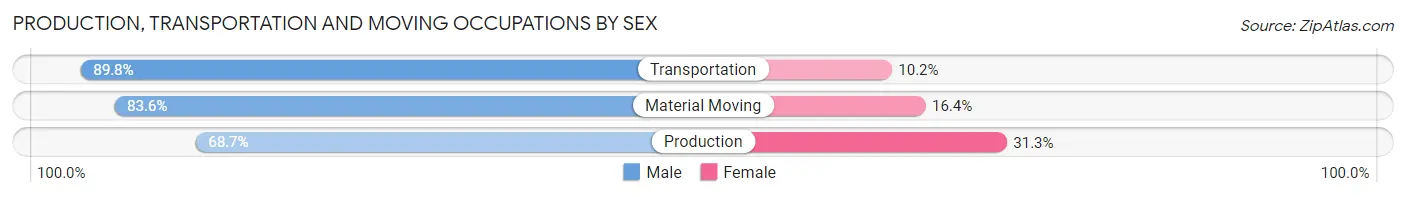
| Occupation | Male | Female |
| Production | 1,299 (68.7%) | 593 (31.3%) |
| Transportation | 1,209 (89.8%) | 138 (10.2%) |
| Material Moving | 1,354 (83.6%) | 266 (16.4%) |
| Total (Category) | 3,862 (79.5%) | 997 (20.5%) |
| Total (Overall) | 18,632 (52.8%) | 16,685 (47.2%) |
Employment Industries by Sex in Temple
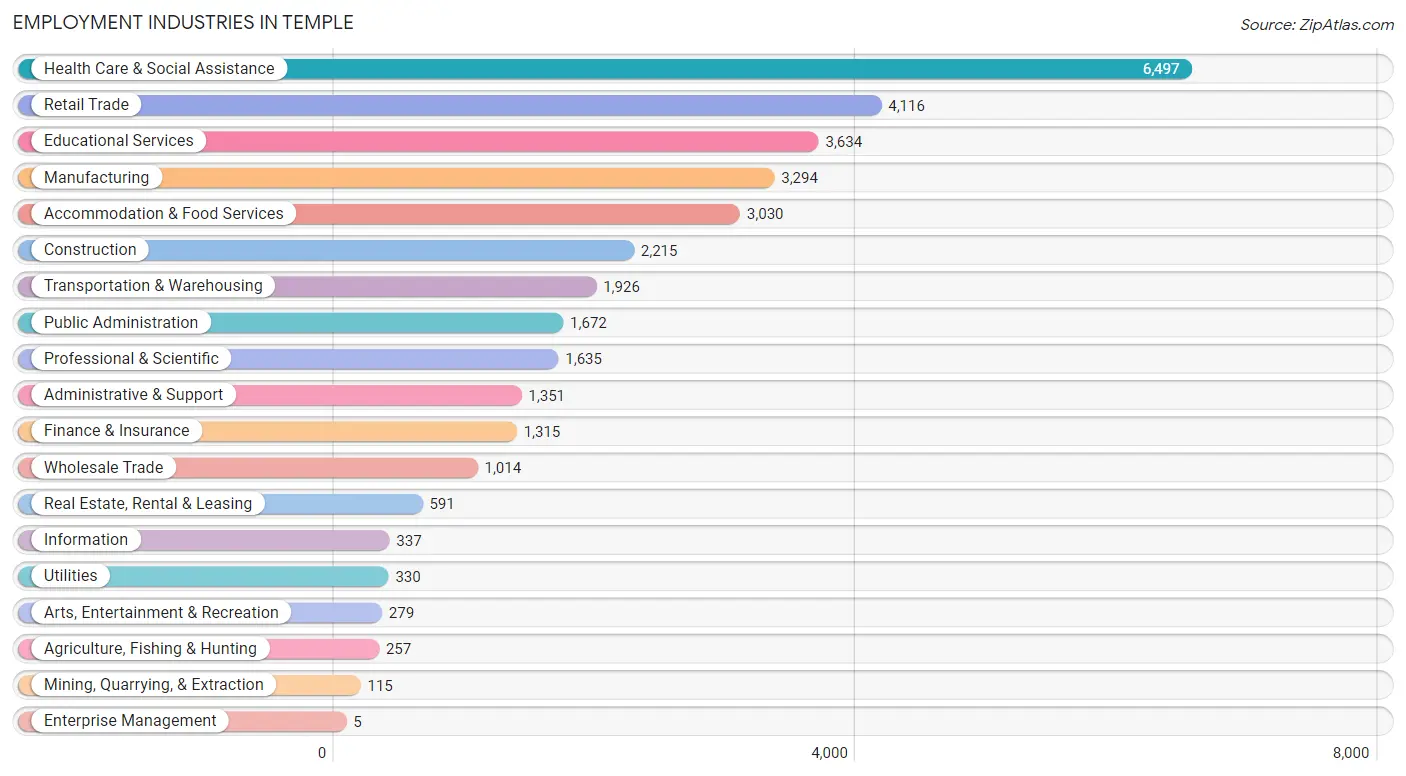
Employment Industries in Temple
The major employment industries in Temple include Health Care & Social Assistance (6,497 | 18.4%), Retail Trade (4,116 | 11.7%), Educational Services (3,634 | 10.3%), Manufacturing (3,294 | 9.3%), and Accommodation & Food Services (3,030 | 8.6%).
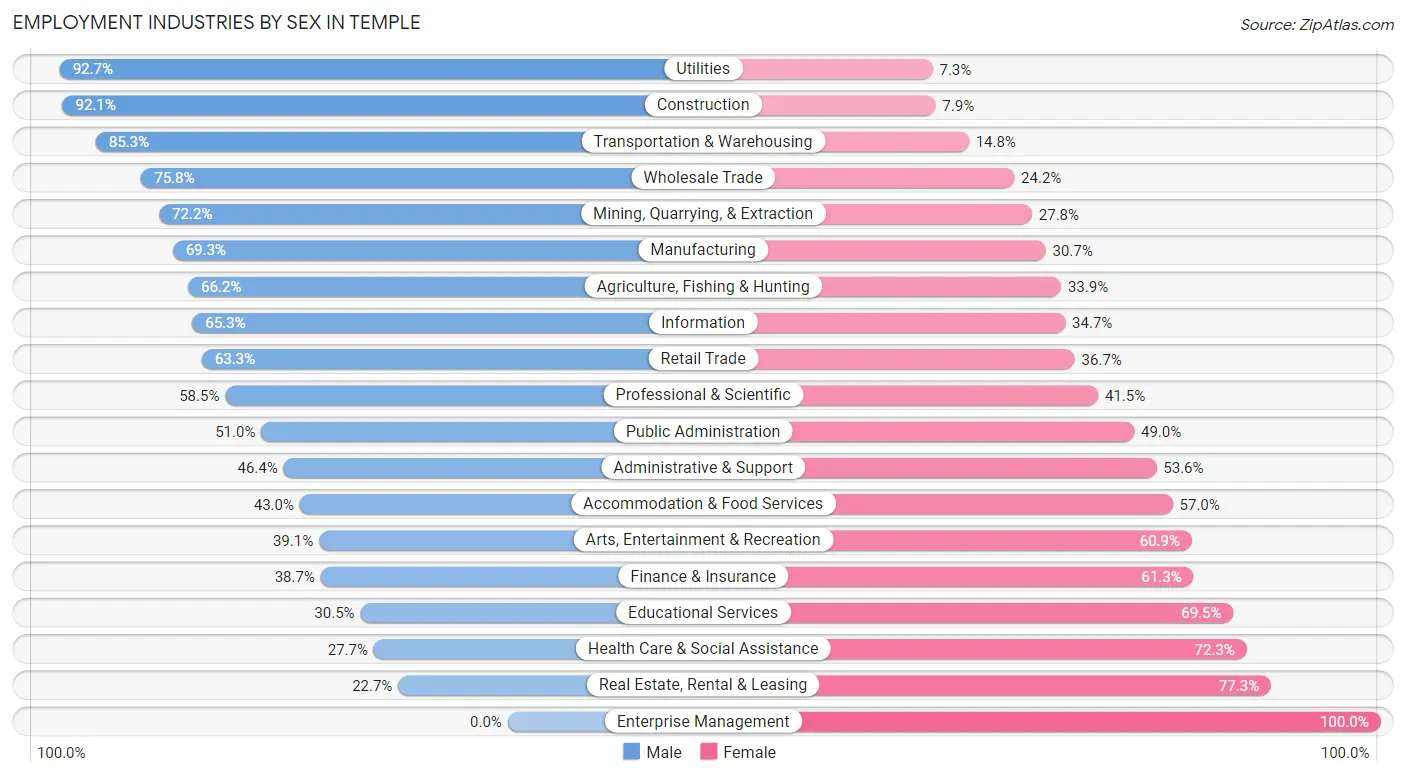
Employment Industries by Sex in Temple
The Temple industries that see more men than women are Utilities (92.7%), Construction (92.1%), and Transportation & Warehousing (85.3%), whereas the industries that tend to have a higher number of women are Enterprise Management (100.0%), Real Estate, Rental & Leasing (77.3%), and Health Care & Social Assistance (72.3%).
| Industry | Male | Female |
| Agriculture, Fishing & Hunting | 170 (66.1%) | 87 (33.9%) |
| Mining, Quarrying, & Extraction | 83 (72.2%) | 32 (27.8%) |
| Construction | 2,041 (92.1%) | 174 (7.9%) |
| Manufacturing | 2,284 (69.3%) | 1,010 (30.7%) |
| Wholesale Trade | 769 (75.8%) | 245 (24.2%) |
| Retail Trade | 2,606 (63.3%) | 1,510 (36.7%) |
| Transportation & Warehousing | 1,642 (85.3%) | 284 (14.7%) |
| Utilities | 306 (92.7%) | 24 (7.3%) |
| Information | 220 (65.3%) | 117 (34.7%) |
| Finance & Insurance | 509 (38.7%) | 806 (61.3%) |
| Real Estate, Rental & Leasing | 134 (22.7%) | 457 (77.3%) |
| Professional & Scientific | 956 (58.5%) | 679 (41.5%) |
| Enterprise Management | 0 (0.0%) | 5 (100.0%) |
| Administrative & Support | 627 (46.4%) | 724 (53.6%) |
| Educational Services | 1,108 (30.5%) | 2,526 (69.5%) |
| Health Care & Social Assistance | 1,801 (27.7%) | 4,696 (72.3%) |
| Arts, Entertainment & Recreation | 109 (39.1%) | 170 (60.9%) |
| Accommodation & Food Services | 1,304 (43.0%) | 1,726 (57.0%) |
| Public Administration | 853 (51.0%) | 819 (49.0%) |
| Total | 18,632 (52.8%) | 16,685 (47.2%) |
Education in Temple
School Enrollment in Temple
The most common levels of schooling among the 22,208 students in Temple are middle school (5,172 | 23.3%), high school (4,836 | 21.8%), and elementary school (4,800 | 21.6%).
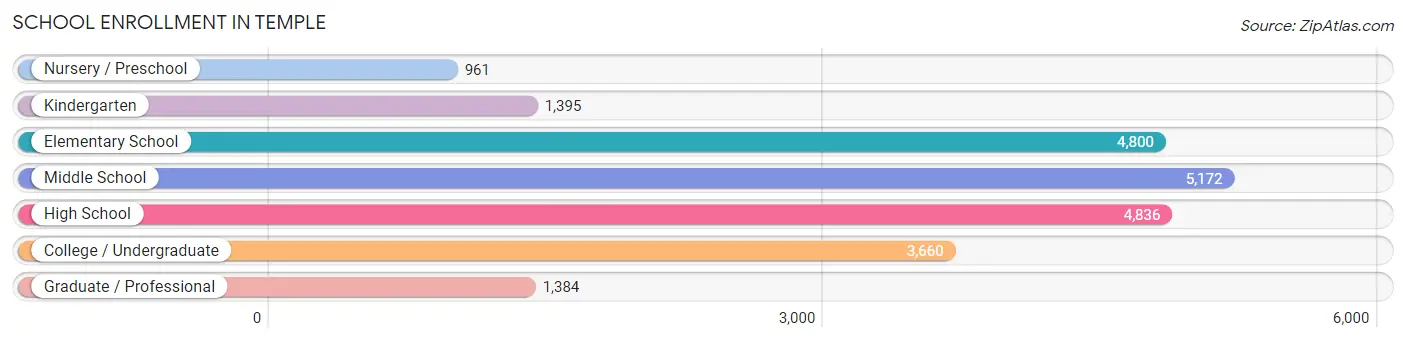
| School Level | # Students | % Students |
| Nursery / Preschool | 961 | 4.3% |
| Kindergarten | 1,395 | 6.3% |
| Elementary School | 4,800 | 21.6% |
| Middle School | 5,172 | 23.3% |
| High School | 4,836 | 21.8% |
| College / Undergraduate | 3,660 | 16.5% |
| Graduate / Professional | 1,384 | 6.2% |
| Total | 22,208 | 100.0% |
School Enrollment by Age by Funding Source in Temple
Out of a total of 22,208 students who are enrolled in schools in Temple, 3,065 (13.8%) attend a private institution, while the remaining 19,143 (86.2%) are enrolled in public schools. The age group of 3 to 4 year olds has the highest likelihood of being enrolled in private schools, with 596 (85.9% in the age bracket) enrolled. Conversely, the age group of 10 to 14 year olds has the lowest likelihood of being enrolled in a private school, with 5,949 (92.5% in the age bracket) attending a public institution.
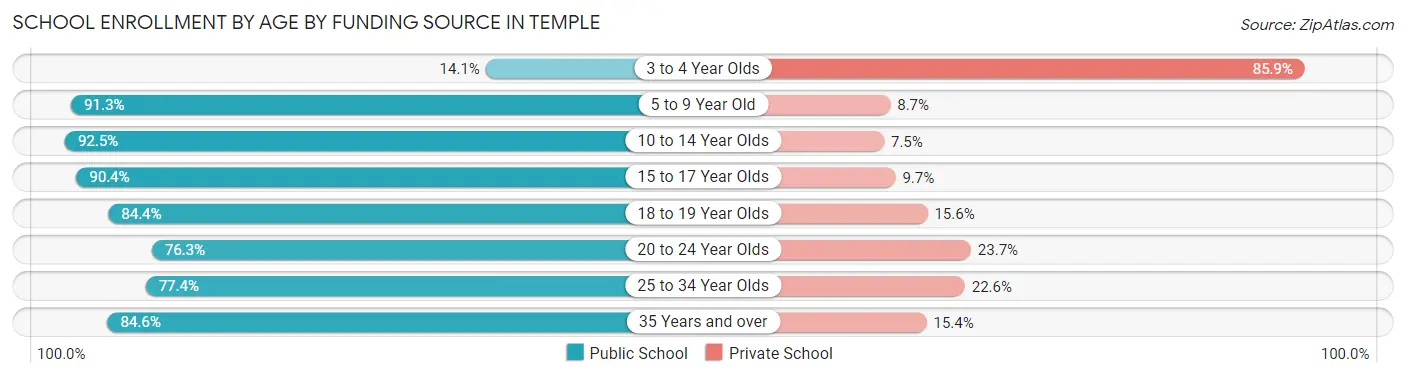
| Age Bracket | Public School | Private School |
| 3 to 4 Year Olds | 98 (14.1%) | 596 (85.9%) |
| 5 to 9 Year Old | 5,158 (91.3%) | 490 (8.7%) |
| 10 to 14 Year Olds | 5,949 (92.5%) | 484 (7.5%) |
| 15 to 17 Year Olds | 3,071 (90.3%) | 328 (9.7%) |
| 18 to 19 Year Olds | 1,276 (84.4%) | 236 (15.6%) |
| 20 to 24 Year Olds | 1,127 (76.3%) | 350 (23.7%) |
| 25 to 34 Year Olds | 1,119 (77.4%) | 326 (22.6%) |
| 35 Years and over | 1,353 (84.6%) | 247 (15.4%) |
| Total | 19,143 (86.2%) | 3,065 (13.8%) |
Educational Attainment by Field of Study in Temple
Business (2,872 | 17.2%), education (2,598 | 15.6%), science & technology (1,729 | 10.3%), bio, nature & agricultural (1,628 | 9.8%), and arts & humanities (1,515 | 9.1%) are the most common fields of study among 16,699 individuals in Temple who have obtained a bachelor's degree or higher.
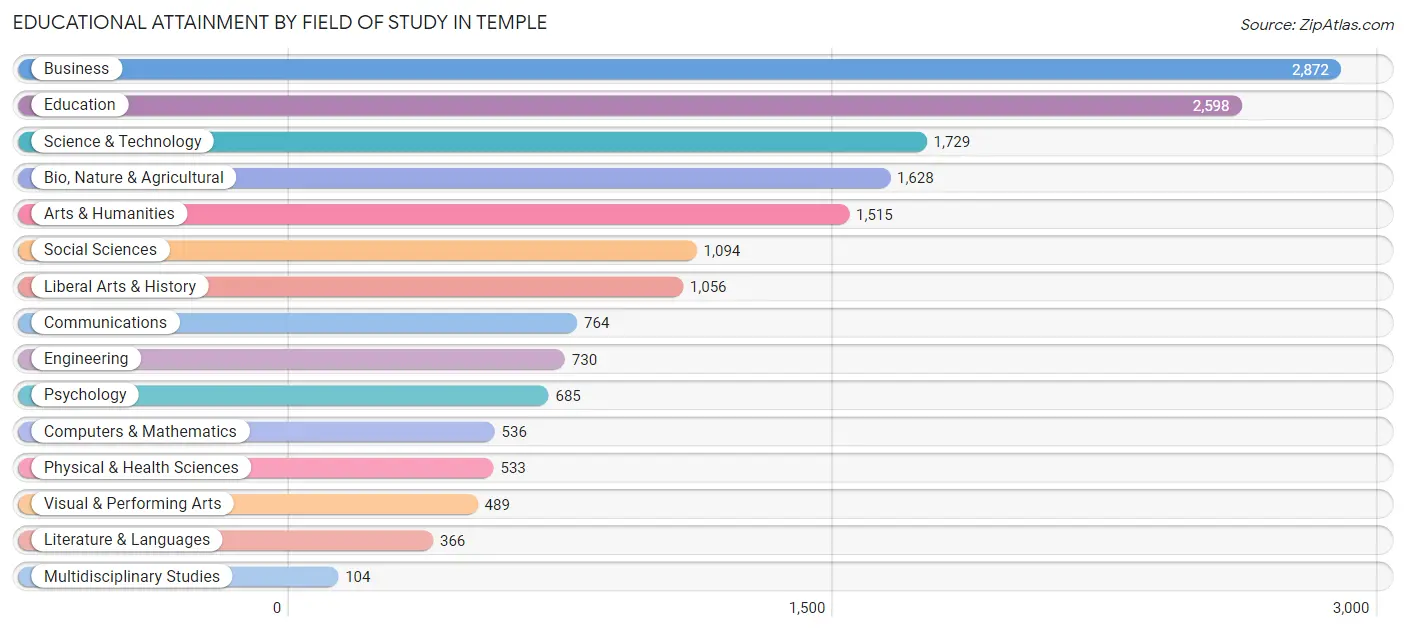
| Field of Study | # Graduates | % Graduates |
| Computers & Mathematics | 536 | 3.2% |
| Bio, Nature & Agricultural | 1,628 | 9.8% |
| Physical & Health Sciences | 533 | 3.2% |
| Psychology | 685 | 4.1% |
| Social Sciences | 1,094 | 6.6% |
| Engineering | 730 | 4.4% |
| Multidisciplinary Studies | 104 | 0.6% |
| Science & Technology | 1,729 | 10.3% |
| Business | 2,872 | 17.2% |
| Education | 2,598 | 15.6% |
| Literature & Languages | 366 | 2.2% |
| Liberal Arts & History | 1,056 | 6.3% |
| Visual & Performing Arts | 489 | 2.9% |
| Communications | 764 | 4.6% |
| Arts & Humanities | 1,515 | 9.1% |
| Total | 16,699 | 100.0% |
Transportation & Commute in Temple
Vehicle Availability by Sex in Temple
The most prevalent vehicle ownership categories in Temple are males with 2 vehicles (9,909, accounting for 52.4%) and females with 2 vehicles (7,663, making up 61.3%).
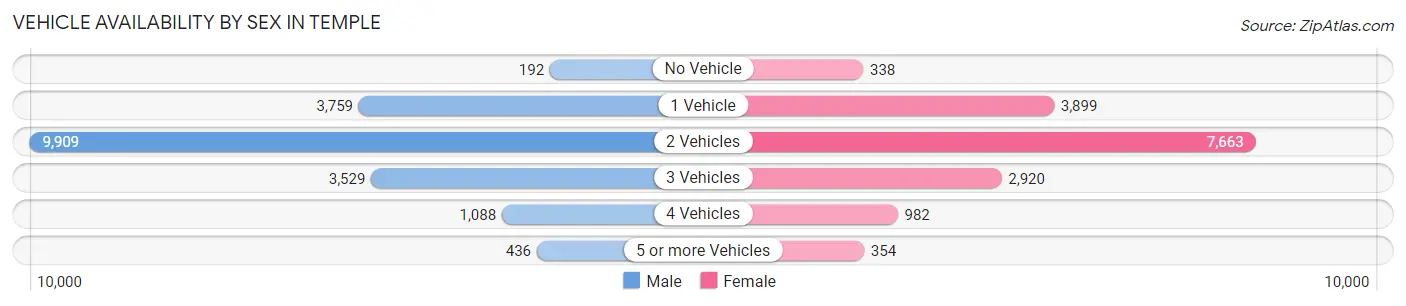
| Vehicles Available | Male | Female |
| No Vehicle | 192 (1.0%) | 338 (2.1%) |
| 1 Vehicle | 3,759 (19.9%) | 3,899 (24.1%) |
| 2 Vehicles | 9,909 (52.4%) | 7,663 (47.4%) |
| 3 Vehicles | 3,529 (18.7%) | 2,920 (18.1%) |
| 4 Vehicles | 1,088 (5.8%) | 982 (6.1%) |
| 5 or more Vehicles | 436 (2.3%) | 354 (2.2%) |
| Total | 18,913 (100.0%) | 16,156 (100.0%) |
Commute Time in Temple
The most frequently occuring commute durations in Temple are 10 to 14 minutes (8,056 commuters, 25.0%), 15 to 19 minutes (6,682 commuters, 20.7%), and 5 to 9 minutes (5,676 commuters, 17.6%).
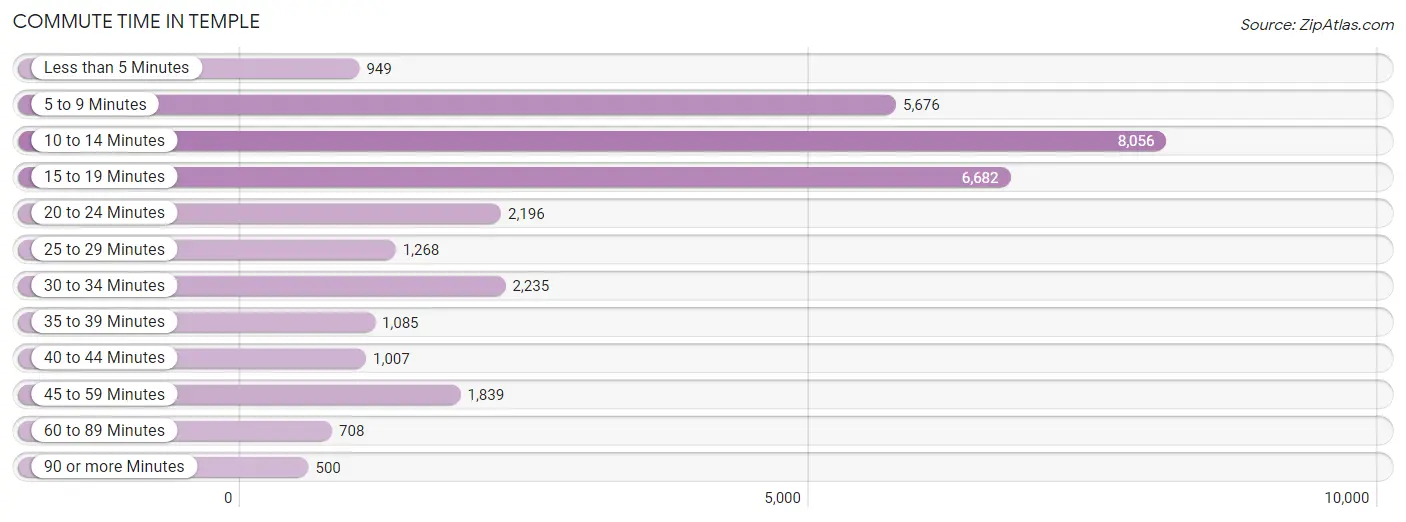
| Commute Time | # Commuters | % Commuters |
| Less than 5 Minutes | 949 | 2.9% |
| 5 to 9 Minutes | 5,676 | 17.6% |
| 10 to 14 Minutes | 8,056 | 25.0% |
| 15 to 19 Minutes | 6,682 | 20.7% |
| 20 to 24 Minutes | 2,196 | 6.8% |
| 25 to 29 Minutes | 1,268 | 3.9% |
| 30 to 34 Minutes | 2,235 | 6.9% |
| 35 to 39 Minutes | 1,085 | 3.4% |
| 40 to 44 Minutes | 1,007 | 3.1% |
| 45 to 59 Minutes | 1,839 | 5.7% |
| 60 to 89 Minutes | 708 | 2.2% |
| 90 or more Minutes | 500 | 1.5% |
Commute Time by Sex in Temple
The most common commute times in Temple are 10 to 14 minutes (4,104 commuters, 23.3%) for males and 10 to 14 minutes (3,952 commuters, 27.1%) for females.
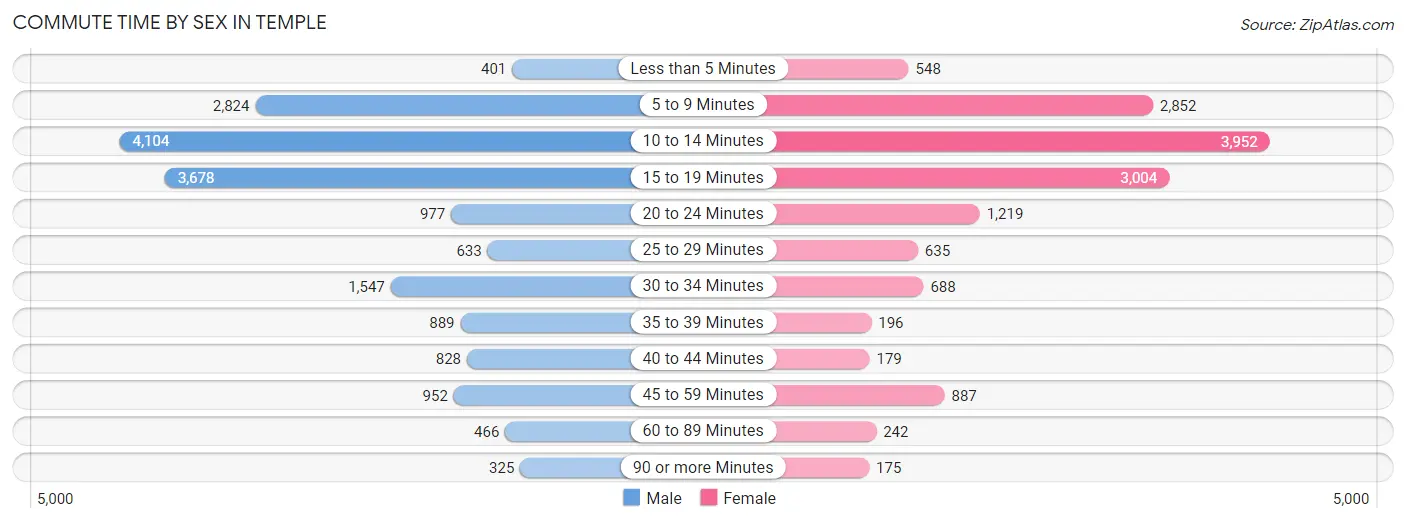
| Commute Time | Male | Female |
| Less than 5 Minutes | 401 (2.3%) | 548 (3.8%) |
| 5 to 9 Minutes | 2,824 (16.0%) | 2,852 (19.6%) |
| 10 to 14 Minutes | 4,104 (23.3%) | 3,952 (27.1%) |
| 15 to 19 Minutes | 3,678 (20.9%) | 3,004 (20.6%) |
| 20 to 24 Minutes | 977 (5.5%) | 1,219 (8.4%) |
| 25 to 29 Minutes | 633 (3.6%) | 635 (4.4%) |
| 30 to 34 Minutes | 1,547 (8.8%) | 688 (4.7%) |
| 35 to 39 Minutes | 889 (5.0%) | 196 (1.3%) |
| 40 to 44 Minutes | 828 (4.7%) | 179 (1.2%) |
| 45 to 59 Minutes | 952 (5.4%) | 887 (6.1%) |
| 60 to 89 Minutes | 466 (2.6%) | 242 (1.7%) |
| 90 or more Minutes | 325 (1.8%) | 175 (1.2%) |
Time of Departure to Work by Sex in Temple
The most frequent times of departure to work in Temple are 7:00 AM to 7:29 AM (2,544, 14.4%) for males and 7:30 AM to 7:59 AM (2,644, 18.1%) for females.
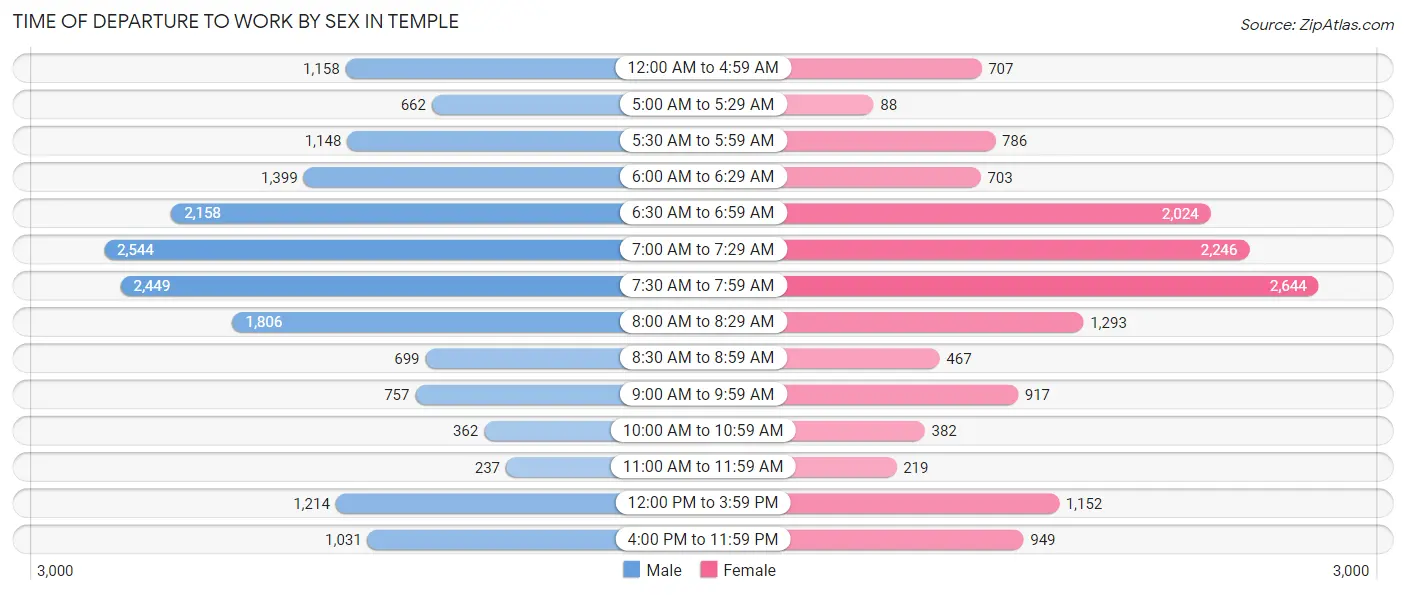
| Time of Departure | Male | Female |
| 12:00 AM to 4:59 AM | 1,158 (6.6%) | 707 (4.9%) |
| 5:00 AM to 5:29 AM | 662 (3.8%) | 88 (0.6%) |
| 5:30 AM to 5:59 AM | 1,148 (6.5%) | 786 (5.4%) |
| 6:00 AM to 6:29 AM | 1,399 (7.9%) | 703 (4.8%) |
| 6:30 AM to 6:59 AM | 2,158 (12.2%) | 2,024 (13.9%) |
| 7:00 AM to 7:29 AM | 2,544 (14.4%) | 2,246 (15.4%) |
| 7:30 AM to 7:59 AM | 2,449 (13.9%) | 2,644 (18.1%) |
| 8:00 AM to 8:29 AM | 1,806 (10.2%) | 1,293 (8.9%) |
| 8:30 AM to 8:59 AM | 699 (4.0%) | 467 (3.2%) |
| 9:00 AM to 9:59 AM | 757 (4.3%) | 917 (6.3%) |
| 10:00 AM to 10:59 AM | 362 (2.1%) | 382 (2.6%) |
| 11:00 AM to 11:59 AM | 237 (1.3%) | 219 (1.5%) |
| 12:00 PM to 3:59 PM | 1,214 (6.9%) | 1,152 (7.9%) |
| 4:00 PM to 11:59 PM | 1,031 (5.9%) | 949 (6.5%) |
| Total | 17,624 (100.0%) | 14,577 (100.0%) |
Housing Occupancy in Temple
Occupancy by Ownership in Temple
Of the total 31,552 dwellings in Temple, owner-occupied units account for 16,662 (52.8%), while renter-occupied units make up 14,890 (47.2%).
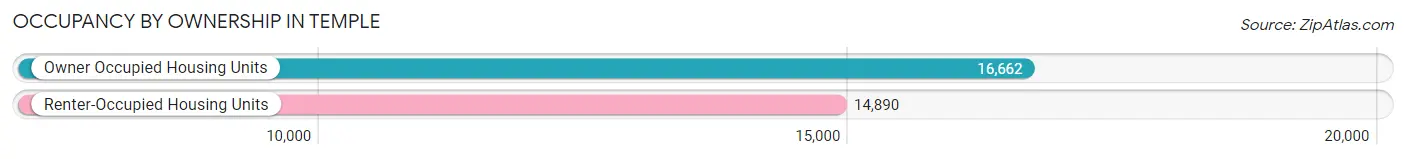
| Occupancy | # Housing Units | % Housing Units |
| Owner Occupied Housing Units | 16,662 | 52.8% |
| Renter-Occupied Housing Units | 14,890 | 47.2% |
| Total Occupied Housing Units | 31,552 | 100.0% |
Occupancy by Household Size in Temple
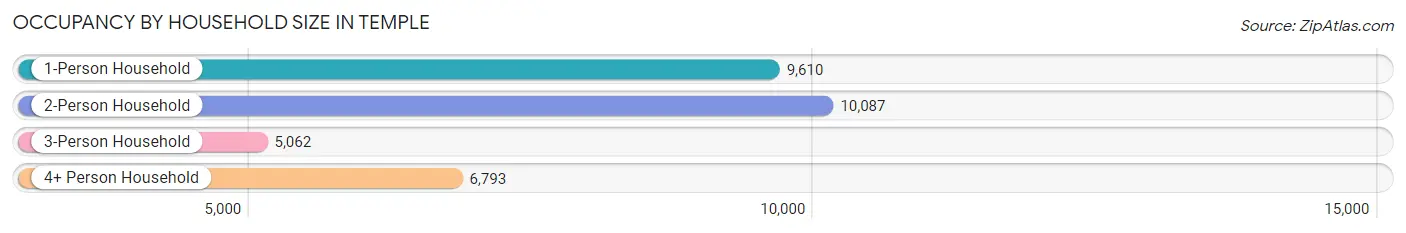
| Household Size | # Housing Units | % Housing Units |
| 1-Person Household | 9,610 | 30.5% |
| 2-Person Household | 10,087 | 32.0% |
| 3-Person Household | 5,062 | 16.0% |
| 4+ Person Household | 6,793 | 21.5% |
| Total Housing Units | 31,552 | 100.0% |
Occupancy by Ownership by Household Size in Temple
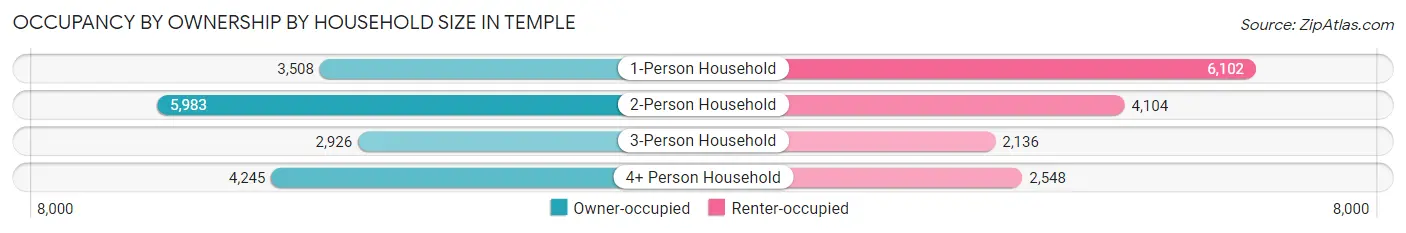
| Household Size | Owner-occupied | Renter-occupied |
| 1-Person Household | 3,508 (36.5%) | 6,102 (63.5%) |
| 2-Person Household | 5,983 (59.3%) | 4,104 (40.7%) |
| 3-Person Household | 2,926 (57.8%) | 2,136 (42.2%) |
| 4+ Person Household | 4,245 (62.5%) | 2,548 (37.5%) |
| Total Housing Units | 16,662 (52.8%) | 14,890 (47.2%) |
Occupancy by Educational Attainment in Temple
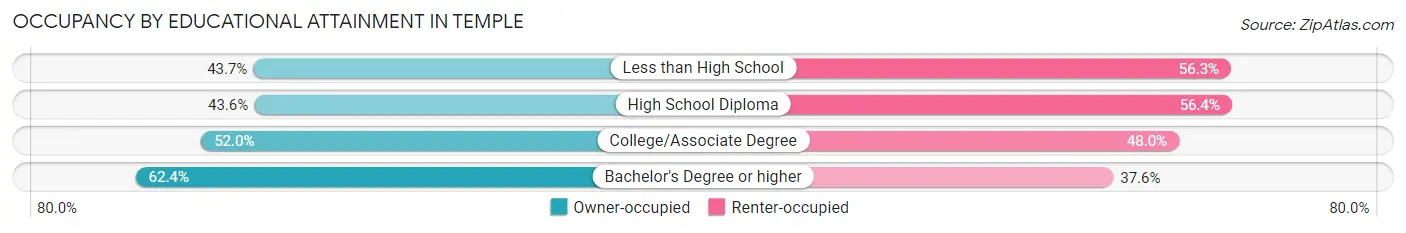
| Household Size | Owner-occupied | Renter-occupied |
| Less than High School | 1,339 (43.7%) | 1,722 (56.3%) |
| High School Diploma | 3,007 (43.6%) | 3,888 (56.4%) |
| College/Associate Degree | 5,779 (52.0%) | 5,339 (48.0%) |
| Bachelor's Degree or higher | 6,537 (62.4%) | 3,941 (37.6%) |
Occupancy by Age of Householder in Temple
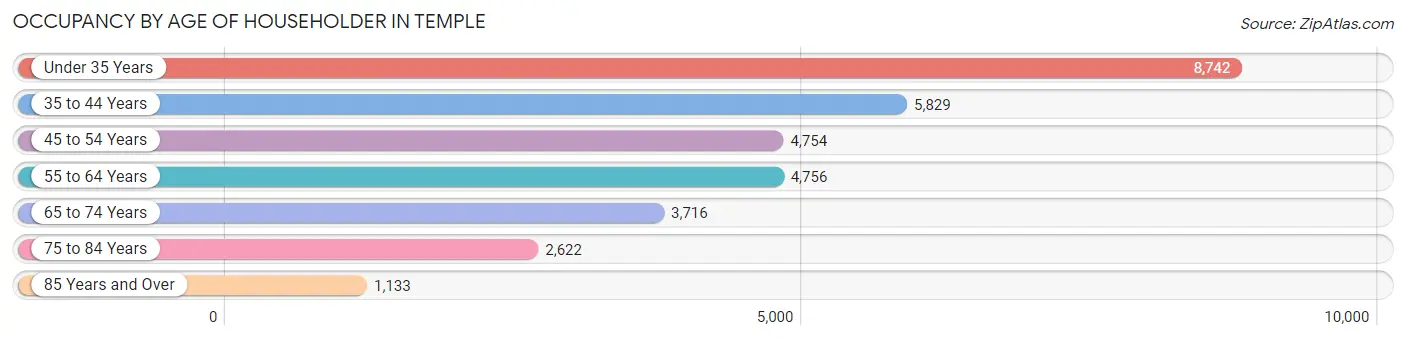
| Age Bracket | # Households | % Households |
| Under 35 Years | 8,742 | 27.7% |
| 35 to 44 Years | 5,829 | 18.5% |
| 45 to 54 Years | 4,754 | 15.1% |
| 55 to 64 Years | 4,756 | 15.1% |
| 65 to 74 Years | 3,716 | 11.8% |
| 75 to 84 Years | 2,622 | 8.3% |
| 85 Years and Over | 1,133 | 3.6% |
| Total | 31,552 | 100.0% |
Housing Finances in Temple
Median Income by Occupancy in Temple
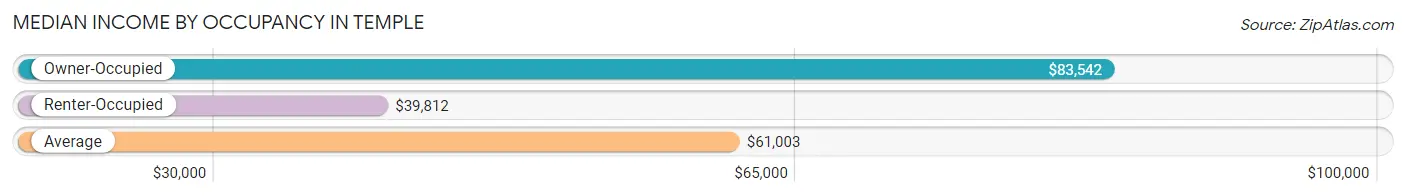
| Occupancy Type | # Households | Median Income |
| Owner-Occupied | 16,662 (52.8%) | $83,542 |
| Renter-Occupied | 14,890 (47.2%) | $39,812 |
| Average | 31,552 (100.0%) | $61,003 |
Occupancy by Householder Income Bracket in Temple
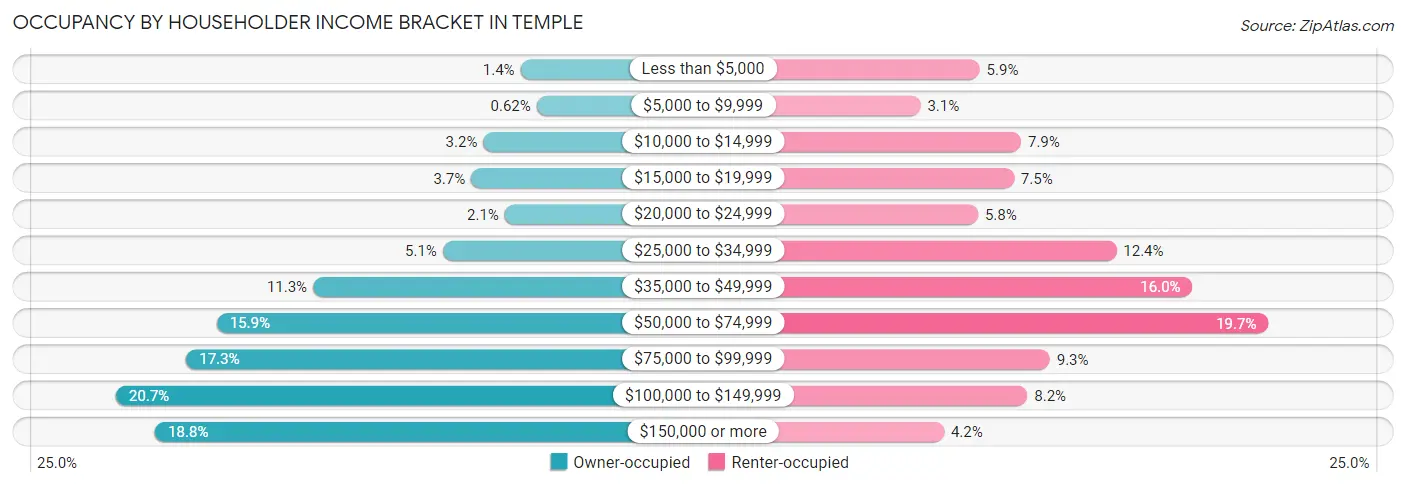
| Income Bracket | Owner-occupied | Renter-occupied |
| Less than $5,000 | 231 (1.4%) | 880 (5.9%) |
| $5,000 to $9,999 | 103 (0.6%) | 460 (3.1%) |
| $10,000 to $14,999 | 527 (3.2%) | 1,173 (7.9%) |
| $15,000 to $19,999 | 623 (3.7%) | 1,123 (7.5%) |
| $20,000 to $24,999 | 357 (2.1%) | 868 (5.8%) |
| $25,000 to $34,999 | 848 (5.1%) | 1,849 (12.4%) |
| $35,000 to $49,999 | 1,878 (11.3%) | 2,388 (16.0%) |
| $50,000 to $74,999 | 2,641 (15.9%) | 2,926 (19.7%) |
| $75,000 to $99,999 | 2,883 (17.3%) | 1,378 (9.2%) |
| $100,000 to $149,999 | 3,440 (20.6%) | 1,218 (8.2%) |
| $150,000 or more | 3,131 (18.8%) | 627 (4.2%) |
| Total | 16,662 (100.0%) | 14,890 (100.0%) |
Monthly Housing Cost Tiers in Temple
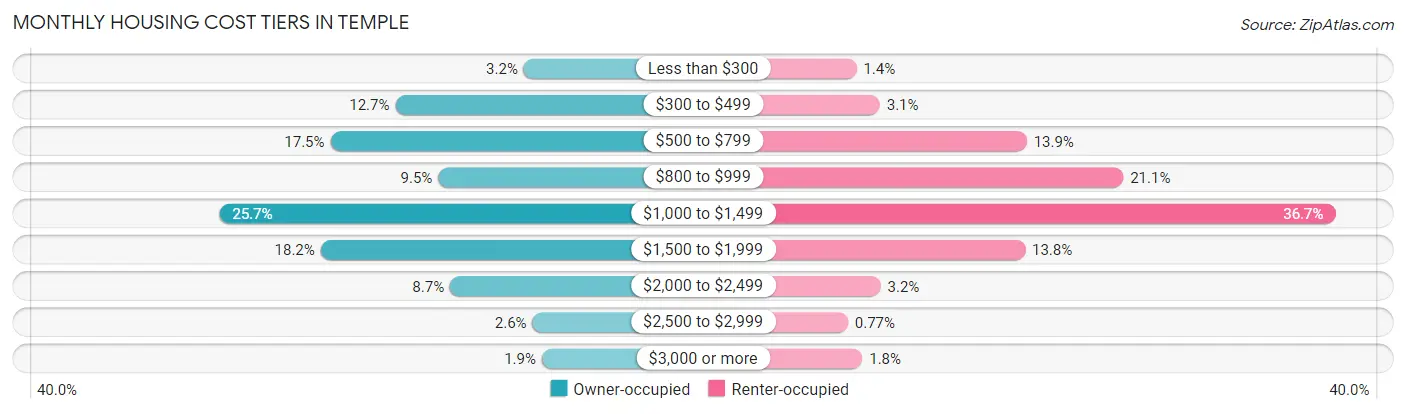
| Monthly Cost | Owner-occupied | Renter-occupied |
| Less than $300 | 540 (3.2%) | 208 (1.4%) |
| $300 to $499 | 2,116 (12.7%) | 464 (3.1%) |
| $500 to $799 | 2,912 (17.5%) | 2,076 (13.9%) |
| $800 to $999 | 1,589 (9.5%) | 3,134 (21.0%) |
| $1,000 to $1,499 | 4,276 (25.7%) | 5,460 (36.7%) |
| $1,500 to $1,999 | 3,033 (18.2%) | 2,058 (13.8%) |
| $2,000 to $2,499 | 1,444 (8.7%) | 474 (3.2%) |
| $2,500 to $2,999 | 434 (2.6%) | 114 (0.8%) |
| $3,000 or more | 318 (1.9%) | 273 (1.8%) |
| Total | 16,662 (100.0%) | 14,890 (100.0%) |
Physical Housing Characteristics in Temple
Housing Structures in Temple
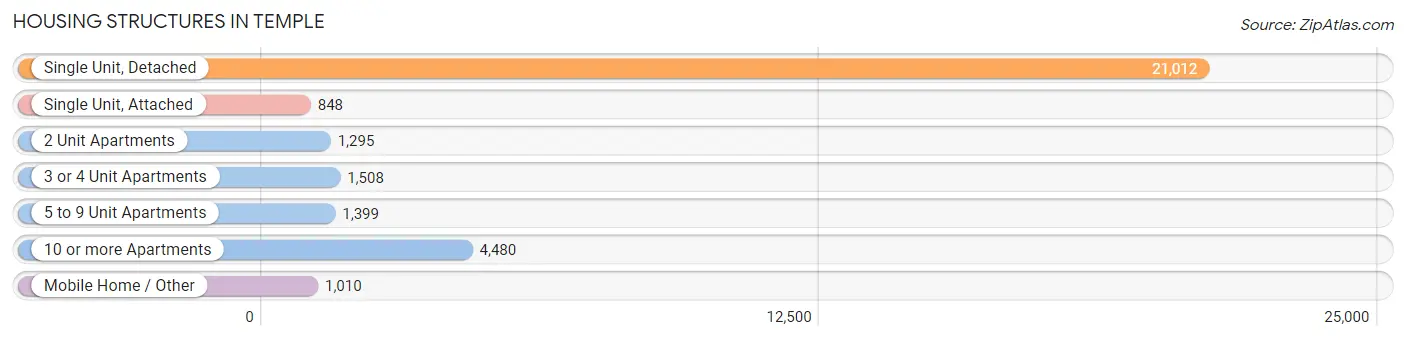
| Structure Type | # Housing Units | % Housing Units |
| Single Unit, Detached | 21,012 | 66.6% |
| Single Unit, Attached | 848 | 2.7% |
| 2 Unit Apartments | 1,295 | 4.1% |
| 3 or 4 Unit Apartments | 1,508 | 4.8% |
| 5 to 9 Unit Apartments | 1,399 | 4.4% |
| 10 or more Apartments | 4,480 | 14.2% |
| Mobile Home / Other | 1,010 | 3.2% |
| Total | 31,552 | 100.0% |
Housing Structures by Occupancy in Temple
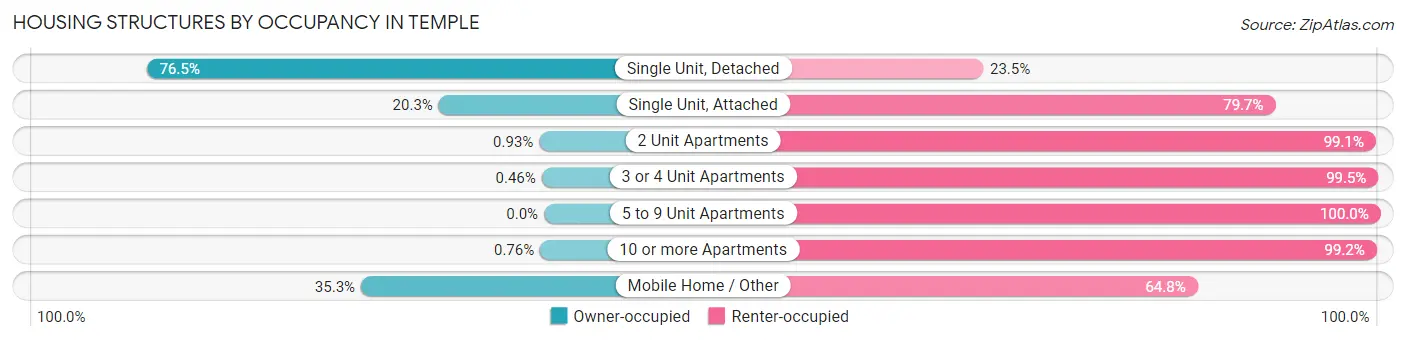
| Structure Type | Owner-occupied | Renter-occupied |
| Single Unit, Detached | 16,081 (76.5%) | 4,931 (23.5%) |
| Single Unit, Attached | 172 (20.3%) | 676 (79.7%) |
| 2 Unit Apartments | 12 (0.9%) | 1,283 (99.1%) |
| 3 or 4 Unit Apartments | 7 (0.5%) | 1,501 (99.5%) |
| 5 to 9 Unit Apartments | 0 (0.0%) | 1,399 (100.0%) |
| 10 or more Apartments | 34 (0.8%) | 4,446 (99.2%) |
| Mobile Home / Other | 356 (35.2%) | 654 (64.7%) |
| Total | 16,662 (52.8%) | 14,890 (47.2%) |
Housing Structures by Number of Rooms in Temple
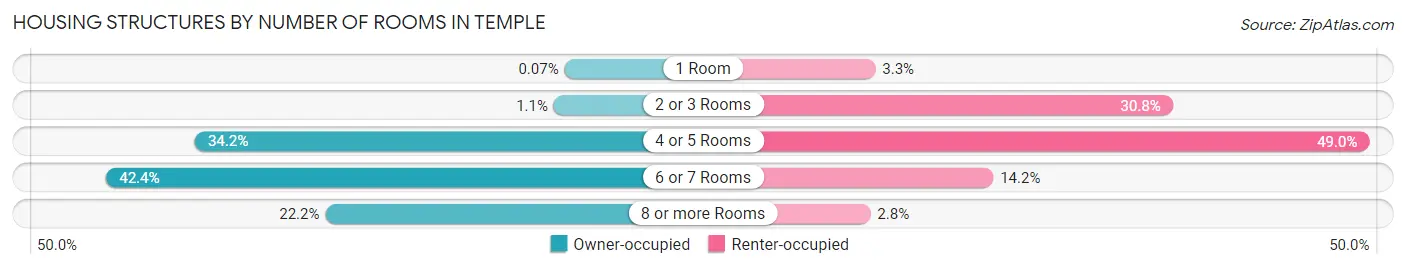
| Number of Rooms | Owner-occupied | Renter-occupied |
| 1 Room | 11 (0.1%) | 489 (3.3%) |
| 2 or 3 Rooms | 177 (1.1%) | 4,581 (30.8%) |
| 4 or 5 Rooms | 5,705 (34.2%) | 7,289 (48.9%) |
| 6 or 7 Rooms | 7,071 (42.4%) | 2,111 (14.2%) |
| 8 or more Rooms | 3,698 (22.2%) | 420 (2.8%) |
| Total | 16,662 (100.0%) | 14,890 (100.0%) |
Housing Structure by Heating Type in Temple
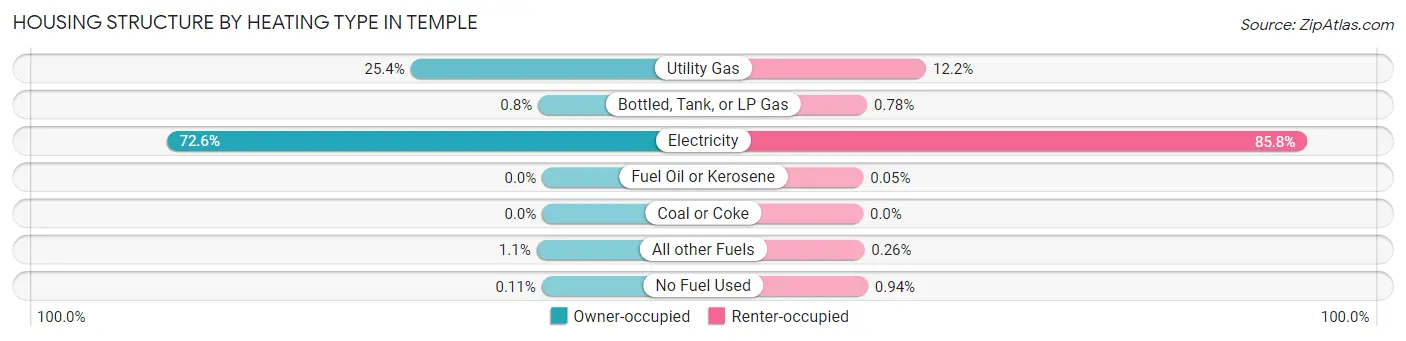
| Heating Type | Owner-occupied | Renter-occupied |
| Utility Gas | 4,237 (25.4%) | 1,814 (12.2%) |
| Bottled, Tank, or LP Gas | 134 (0.8%) | 116 (0.8%) |
| Electricity | 12,092 (72.6%) | 12,774 (85.8%) |
| Fuel Oil or Kerosene | 0 (0.0%) | 8 (0.1%) |
| Coal or Coke | 0 (0.0%) | 0 (0.0%) |
| All other Fuels | 180 (1.1%) | 38 (0.3%) |
| No Fuel Used | 19 (0.1%) | 140 (0.9%) |
| Total | 16,662 (100.0%) | 14,890 (100.0%) |
Household Vehicle Usage in Temple
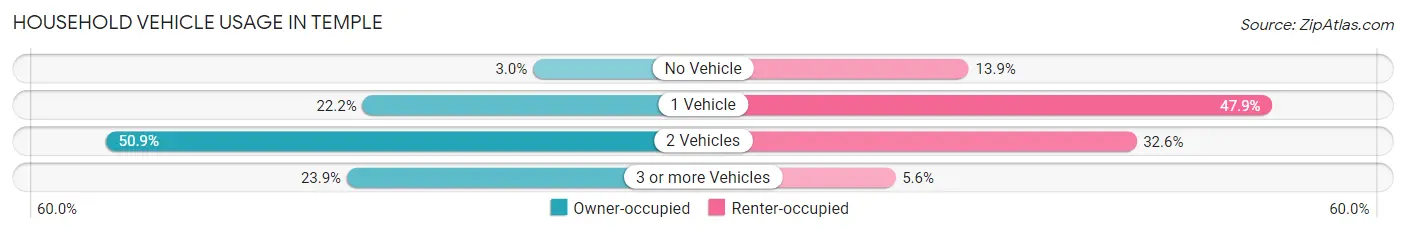
| Vehicles per Household | Owner-occupied | Renter-occupied |
| No Vehicle | 507 (3.0%) | 2,064 (13.9%) |
| 1 Vehicle | 3,690 (22.2%) | 7,129 (47.9%) |
| 2 Vehicles | 8,484 (50.9%) | 4,859 (32.6%) |
| 3 or more Vehicles | 3,981 (23.9%) | 838 (5.6%) |
| Total | 16,662 (100.0%) | 14,890 (100.0%) |
Real Estate & Mortgages in Temple
Real Estate and Mortgage Overview in Temple
| Characteristic | Without Mortgage | With Mortgage |
| Housing Units | 6,503 | 10,159 |
| Median Property Value | $166,500 | $207,000 |
| Median Household Income | $69,794 | $2,078 |
| Monthly Housing Costs | $595 | $311 |
| Real Estate Taxes | $2,505 | $734 |
Property Value by Mortgage Status in Temple
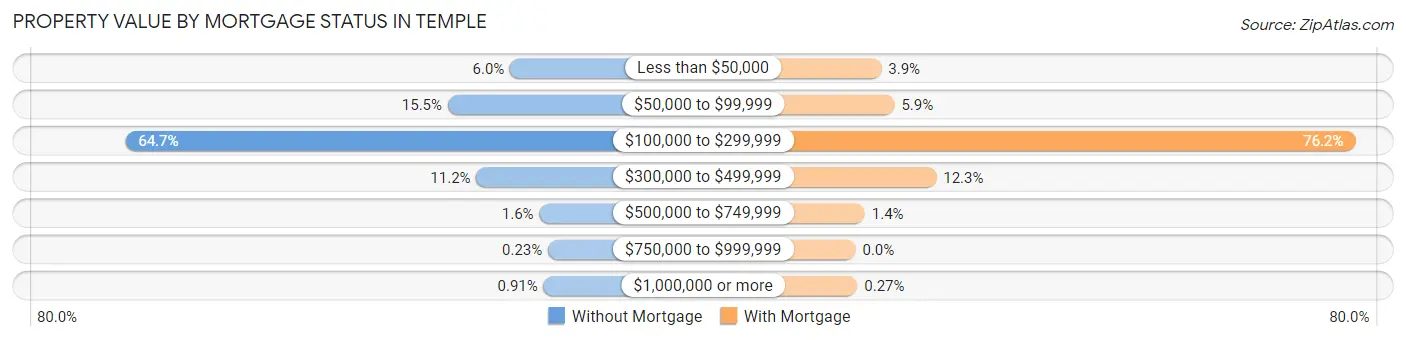
| Property Value | Without Mortgage | With Mortgage |
| Less than $50,000 | 391 (6.0%) | 399 (3.9%) |
| $50,000 to $99,999 | 1,008 (15.5%) | 602 (5.9%) |
| $100,000 to $299,999 | 4,204 (64.6%) | 7,737 (76.2%) |
| $300,000 to $499,999 | 725 (11.2%) | 1,250 (12.3%) |
| $500,000 to $749,999 | 101 (1.5%) | 144 (1.4%) |
| $750,000 to $999,999 | 15 (0.2%) | 0 (0.0%) |
| $1,000,000 or more | 59 (0.9%) | 27 (0.3%) |
| Total | 6,503 (100.0%) | 10,159 (100.0%) |
Household Income by Mortgage Status in Temple
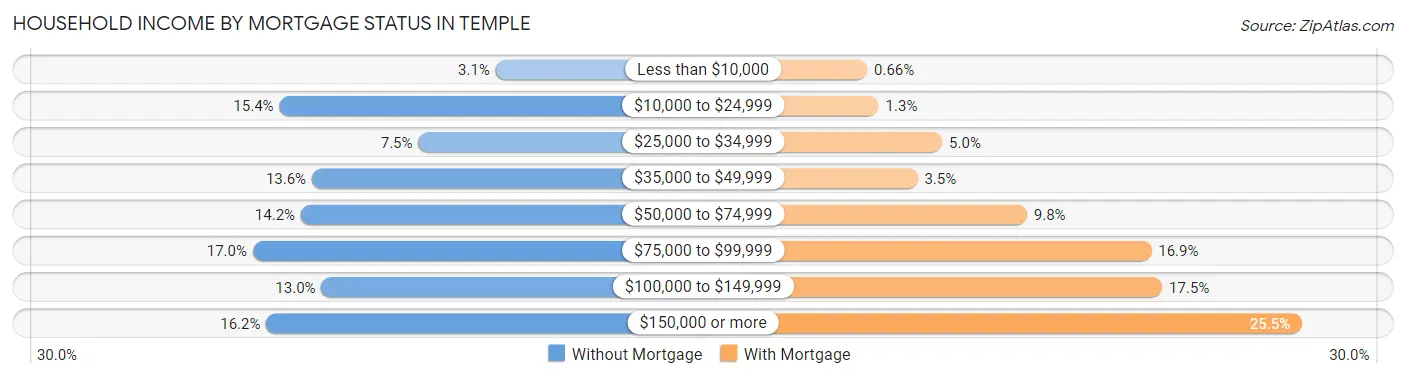
| Household Income | Without Mortgage | With Mortgage |
| Less than $10,000 | 200 (3.1%) | 67 (0.7%) |
| $10,000 to $24,999 | 1,004 (15.4%) | 134 (1.3%) |
| $25,000 to $34,999 | 488 (7.5%) | 503 (5.0%) |
| $35,000 to $49,999 | 883 (13.6%) | 360 (3.5%) |
| $50,000 to $74,999 | 924 (14.2%) | 995 (9.8%) |
| $75,000 to $99,999 | 1,103 (17.0%) | 1,717 (16.9%) |
| $100,000 to $149,999 | 848 (13.0%) | 1,780 (17.5%) |
| $150,000 or more | 1,053 (16.2%) | 2,592 (25.5%) |
| Total | 6,503 (100.0%) | 10,159 (100.0%) |
Property Value to Household Income Ratio in Temple
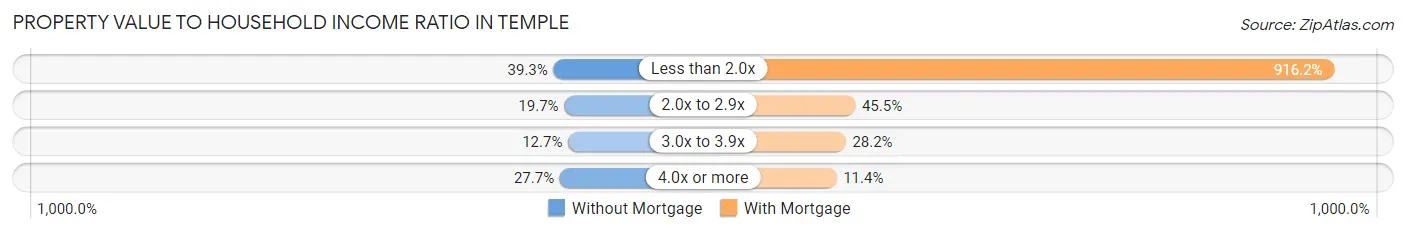
| Value-to-Income Ratio | Without Mortgage | With Mortgage |
| Less than 2.0x | 2,556 (39.3%) | 93,076 (916.2%) |
| 2.0x to 2.9x | 1,279 (19.7%) | 4,621 (45.5%) |
| 3.0x to 3.9x | 825 (12.7%) | 2,867 (28.2%) |
| 4.0x or more | 1,800 (27.7%) | 1,161 (11.4%) |
| Total | 6,503 (100.0%) | 10,159 (100.0%) |
Real Estate Taxes by Mortgage Status in Temple
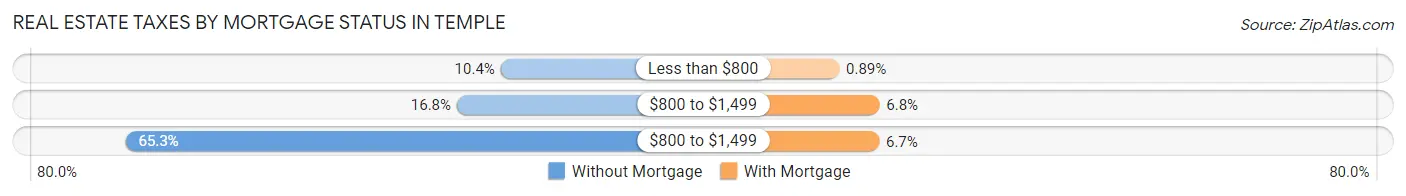
| Property Taxes | Without Mortgage | With Mortgage |
| Less than $800 | 679 (10.4%) | 90 (0.9%) |
| $800 to $1,499 | 1,095 (16.8%) | 688 (6.8%) |
| $800 to $1,499 | 4,244 (65.3%) | 683 (6.7%) |
| Total | 6,503 (100.0%) | 10,159 (100.0%) |
Health & Disability in Temple
Health Insurance Coverage by Age in Temple
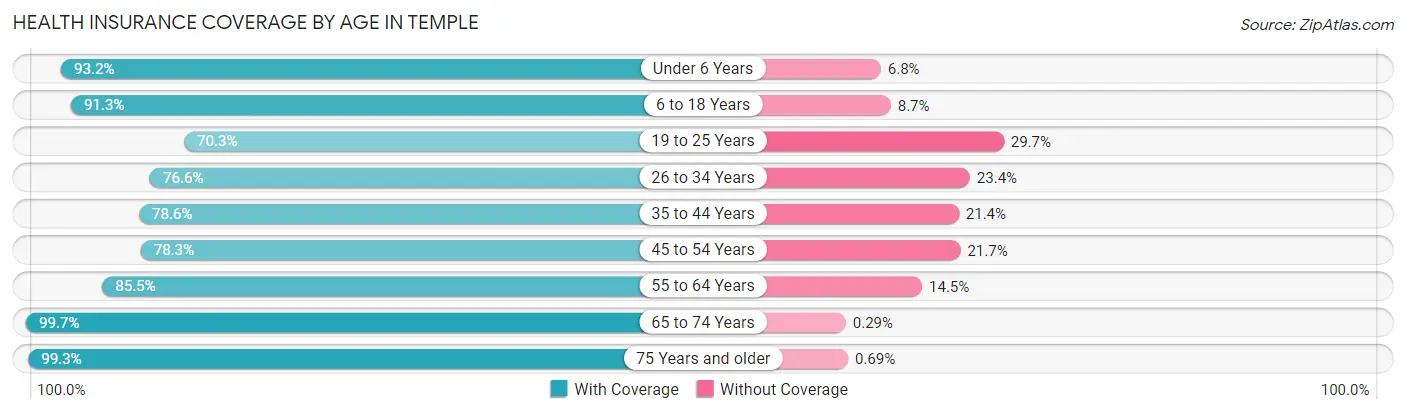
| Age Bracket | With Coverage | Without Coverage |
| Under 6 Years | 7,536 (93.2%) | 552 (6.8%) |
| 6 to 18 Years | 14,573 (91.3%) | 1,384 (8.7%) |
| 19 to 25 Years | 5,083 (70.3%) | 2,152 (29.7%) |
| 26 to 34 Years | 8,979 (76.6%) | 2,746 (23.4%) |
| 35 to 44 Years | 8,574 (78.6%) | 2,329 (21.4%) |
| 45 to 54 Years | 6,136 (78.3%) | 1,698 (21.7%) |
| 55 to 64 Years | 7,159 (85.5%) | 1,215 (14.5%) |
| 65 to 74 Years | 6,127 (99.7%) | 18 (0.3%) |
| 75 Years and older | 5,442 (99.3%) | 38 (0.7%) |
| Total | 69,609 (85.2%) | 12,132 (14.8%) |
Health Insurance Coverage by Citizenship Status in Temple
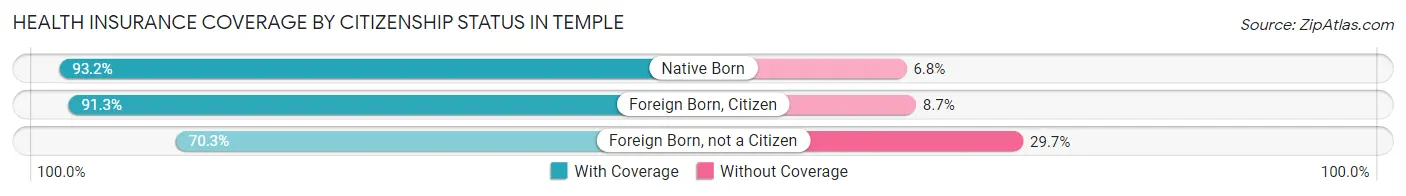
| Citizenship Status | With Coverage | Without Coverage |
| Native Born | 7,536 (93.2%) | 552 (6.8%) |
| Foreign Born, Citizen | 14,573 (91.3%) | 1,384 (8.7%) |
| Foreign Born, not a Citizen | 5,083 (70.3%) | 2,152 (29.7%) |
Health Insurance Coverage by Household Income in Temple
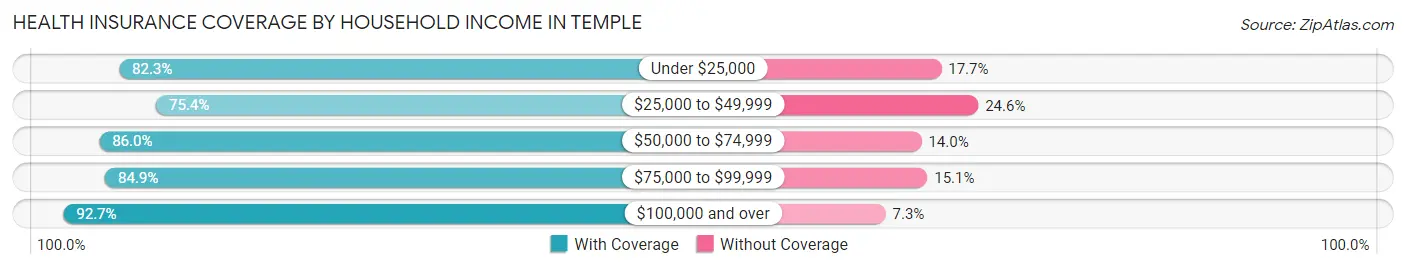
| Household Income | With Coverage | Without Coverage |
| Under $25,000 | 10,227 (82.3%) | 2,201 (17.7%) |
| $25,000 to $49,999 | 13,023 (75.4%) | 4,255 (24.6%) |
| $50,000 to $74,999 | 11,394 (86.0%) | 1,854 (14.0%) |
| $75,000 to $99,999 | 10,066 (84.9%) | 1,788 (15.1%) |
| $100,000 and over | 24,403 (92.7%) | 1,912 (7.3%) |
Public vs Private Health Insurance Coverage by Age in Temple
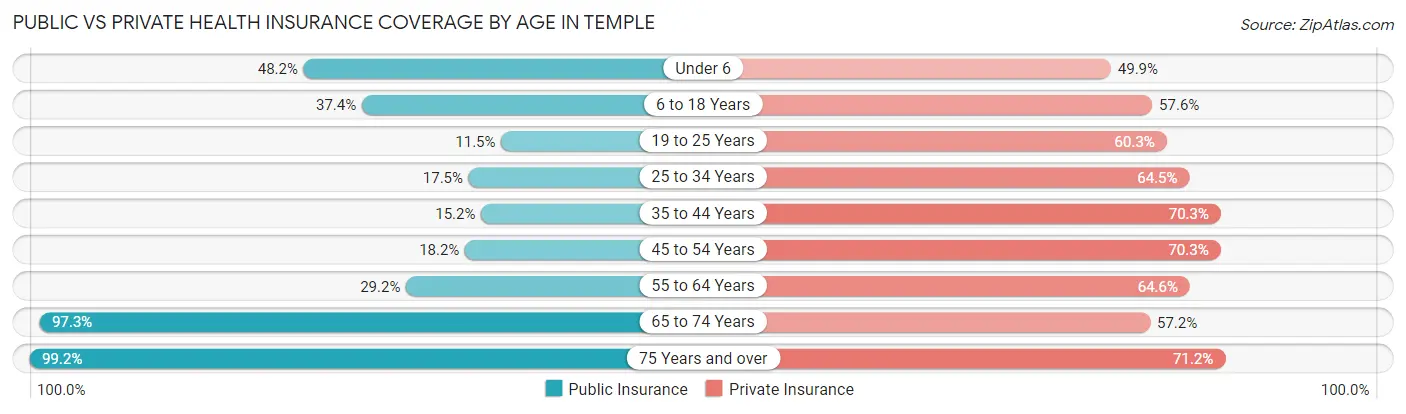
| Age Bracket | Public Insurance | Private Insurance |
| Under 6 | 3,896 (48.2%) | 4,039 (49.9%) |
| 6 to 18 Years | 5,962 (37.4%) | 9,193 (57.6%) |
| 19 to 25 Years | 833 (11.5%) | 4,362 (60.3%) |
| 25 to 34 Years | 2,056 (17.5%) | 7,564 (64.5%) |
| 35 to 44 Years | 1,661 (15.2%) | 7,669 (70.3%) |
| 45 to 54 Years | 1,427 (18.2%) | 5,506 (70.3%) |
| 55 to 64 Years | 2,442 (29.2%) | 5,409 (64.6%) |
| 65 to 74 Years | 5,981 (97.3%) | 3,516 (57.2%) |
| 75 Years and over | 5,435 (99.2%) | 3,899 (71.2%) |
| Total | 29,693 (36.3%) | 51,157 (62.6%) |
Disability Status by Sex by Age in Temple
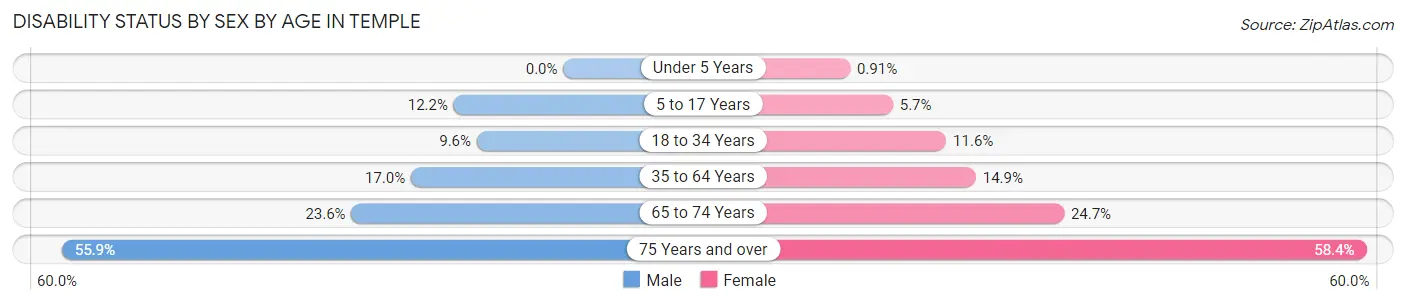
| Age Bracket | Male | Female |
| Under 5 Years | 0 (0.0%) | 28 (0.9%) |
| 5 to 17 Years | 842 (12.2%) | 520 (5.7%) |
| 18 to 34 Years | 901 (9.6%) | 1,238 (11.6%) |
| 35 to 64 Years | 2,299 (17.0%) | 2,023 (14.9%) |
| 65 to 74 Years | 664 (23.6%) | 824 (24.7%) |
| 75 Years and over | 1,242 (55.8%) | 1,902 (58.4%) |
Disability Class by Sex by Age in Temple
Disability Class: Hearing Difficulty
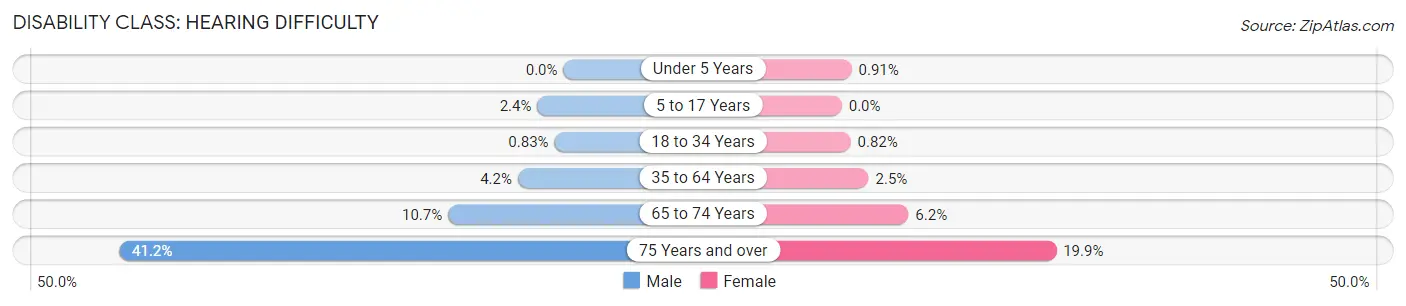
| Age Bracket | Male | Female |
| Under 5 Years | 0 (0.0%) | 28 (0.9%) |
| 5 to 17 Years | 167 (2.4%) | 0 (0.0%) |
| 18 to 34 Years | 78 (0.8%) | 87 (0.8%) |
| 35 to 64 Years | 573 (4.2%) | 338 (2.5%) |
| 65 to 74 Years | 301 (10.7%) | 206 (6.2%) |
| 75 Years and over | 917 (41.2%) | 648 (19.9%) |
Disability Class: Vision Difficulty
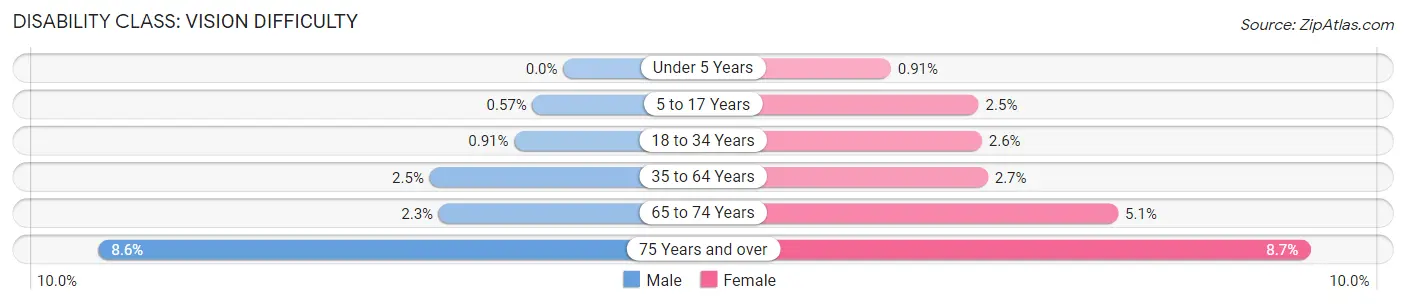
| Age Bracket | Male | Female |
| Under 5 Years | 0 (0.0%) | 28 (0.9%) |
| 5 to 17 Years | 39 (0.6%) | 232 (2.5%) |
| 18 to 34 Years | 85 (0.9%) | 277 (2.6%) |
| 35 to 64 Years | 336 (2.5%) | 367 (2.7%) |
| 65 to 74 Years | 65 (2.3%) | 171 (5.1%) |
| 75 Years and over | 192 (8.6%) | 283 (8.7%) |
Disability Class: Cognitive Difficulty
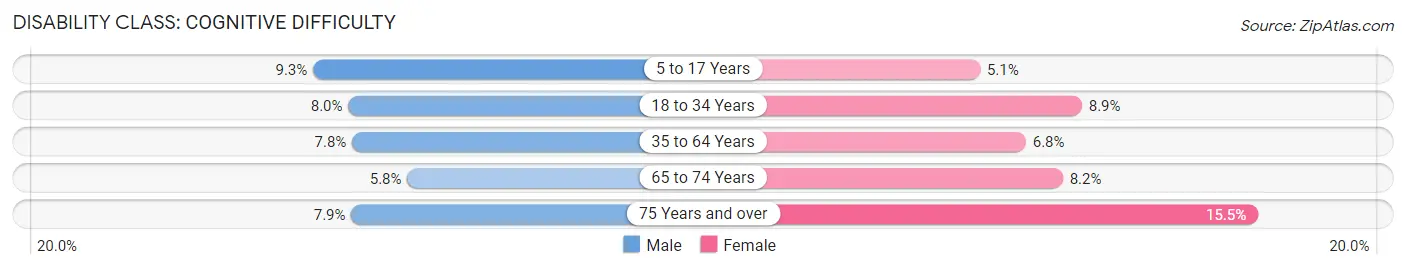
| Age Bracket | Male | Female |
| 5 to 17 Years | 641 (9.3%) | 469 (5.1%) |
| 18 to 34 Years | 746 (8.0%) | 949 (8.9%) |
| 35 to 64 Years | 1,062 (7.8%) | 926 (6.8%) |
| 65 to 74 Years | 163 (5.8%) | 273 (8.2%) |
| 75 Years and over | 175 (7.9%) | 503 (15.4%) |
Disability Class: Ambulatory Difficulty
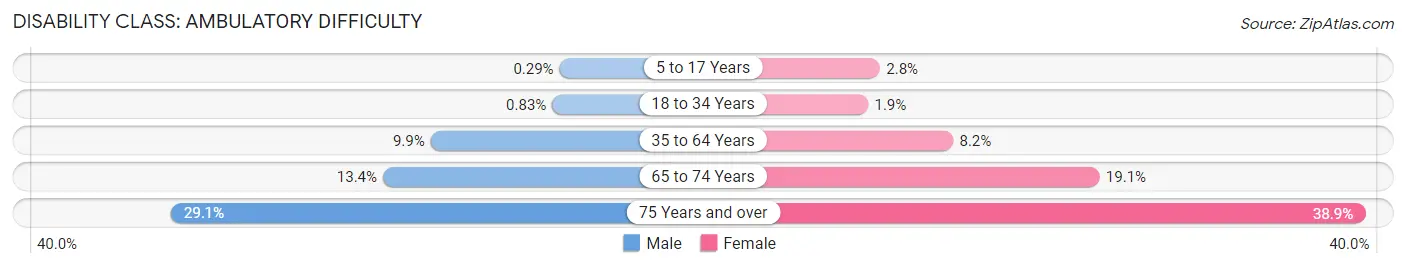
| Age Bracket | Male | Female |
| 5 to 17 Years | 20 (0.3%) | 255 (2.8%) |
| 18 to 34 Years | 78 (0.8%) | 203 (1.9%) |
| 35 to 64 Years | 1,337 (9.9%) | 1,114 (8.2%) |
| 65 to 74 Years | 377 (13.4%) | 636 (19.1%) |
| 75 Years and over | 648 (29.1%) | 1,265 (38.9%) |
Disability Class: Self-Care Difficulty
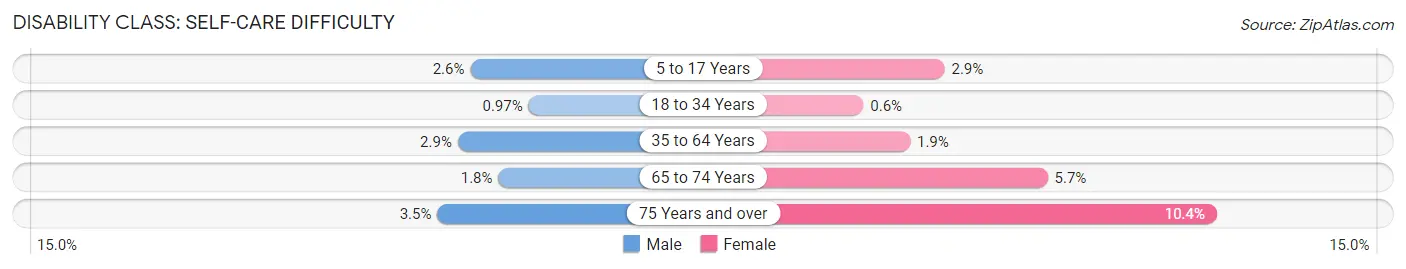
| Age Bracket | Male | Female |
| 5 to 17 Years | 179 (2.6%) | 262 (2.9%) |
| 18 to 34 Years | 91 (1.0%) | 64 (0.6%) |
| 35 to 64 Years | 398 (2.9%) | 257 (1.9%) |
| 65 to 74 Years | 51 (1.8%) | 191 (5.7%) |
| 75 Years and over | 78 (3.5%) | 340 (10.4%) |
Technology Access in Temple
Computing Device Access in Temple
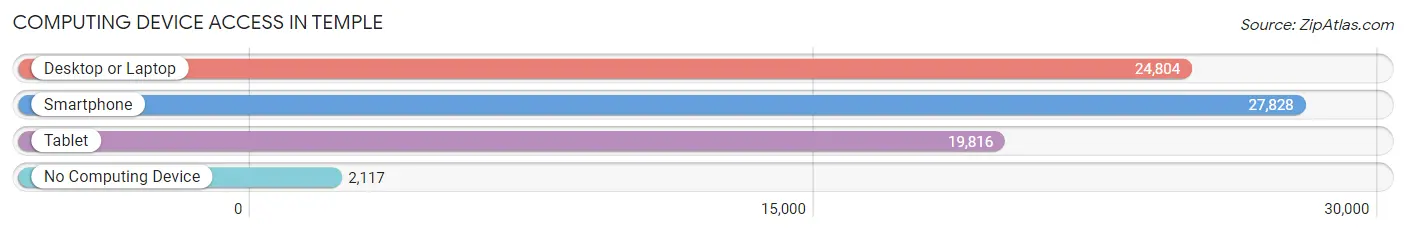
| Device Type | # Households | % Households |
| Desktop or Laptop | 24,804 | 78.6% |
| Smartphone | 27,828 | 88.2% |
| Tablet | 19,816 | 62.8% |
| No Computing Device | 2,117 | 6.7% |
| Total | 31,552 | 100.0% |
Internet Access in Temple
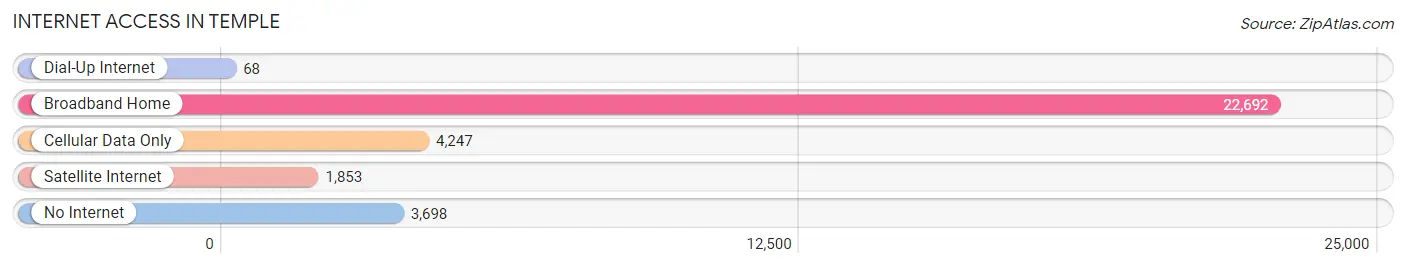
| Internet Type | # Households | % Households |
| Dial-Up Internet | 68 | 0.2% |
| Broadband Home | 22,692 | 71.9% |
| Cellular Data Only | 4,247 | 13.5% |
| Satellite Internet | 1,853 | 5.9% |
| No Internet | 3,698 | 11.7% |
| Total | 31,552 | 100.0% |
Temple Summary
Temple is a city located in Bell County, Texas, United States. It is the county seat of Bell County and is located near the center of the county. The population of Temple was 66,102 at the 2010 census, making it the sixth most populous city in the state of Texas.
History
The area around Temple was first settled in the early 1850s by settlers from the nearby town of Belton. The town was originally named “Tanglewood” after the abundance of trees in the area. In 1882, the town was renamed “Temple” after a local businessman, Bernard Moore Temple.
Temple was incorporated in 1882 and quickly became a major center for the cotton and railroad industries. The city was also home to several military bases, including Camp MacArthur, which was established in 1917. During World War II, the city was a major training center for the U.S. Army Air Corps.
Geography
Temple is located in Central Texas, approximately 70 miles north of Austin and 70 miles south of Waco. The city is situated on the banks of the Leon River, which flows through the city and is a major tributary of the Brazos River. The city is also located near the Balcones Escarpment, a geological formation that runs through Central Texas.
The city has a total area of 44.2 square miles, of which 43.9 square miles is land and 0.3 square miles is water. The climate in Temple is characterized by hot, humid summers and mild winters. The average temperature in the summer is around 90°F and the average temperature in the winter is around 50°F.
Economy
Temple’s economy is largely based on the healthcare, education, and manufacturing industries. The city is home to several major employers, including Scott & White Healthcare, Temple College, and McLane Company. The city is also home to several major manufacturing companies, including Caterpillar, Inc., which has a large manufacturing plant in the city.
Demographics
As of the 2010 census, the population of Temple was 66,102. The racial makeup of the city was 68.2% White, 16.3% African American, 0.7% Native American, 1.7% Asian, 0.1% Pacific Islander, 9.7% from other races, and 3.1% from two or more races. Hispanic or Latino of any race were 24.2% of the population.
The median income for a household in the city was $41,945, and the median income for a family was $50,919. The per capita income for the city was $20,945. About 14.2% of families and 17.7% of the population were below the poverty line, including 25.2% of those under age 18 and 10.2% of those age 65 or over.
Common Questions
What is Per Capita Income in Temple?
Per Capita income in Temple is $31,905.
What is the Median Family Income in Temple?
Median Family Income in Temple is $77,156.
What is the Median Household income in Temple?
Median Household Income in Temple is $61,003.
What is Income or Wage Gap in Temple?
Income or Wage Gap in Temple is 27.0%.
Women in Temple earn 73.0 cents for every dollar earned by a man.
What is Family Income Deficit in Temple?
Family Income Deficit in Temple is $11,213.
Families that are below poverty line in Temple earn $11,213 less on average than the poverty threshold level.
What is Inequality or Gini Index in Temple?
Inequality or Gini Index in Temple is 0.47.
What is the Total Population of Temple?
Total Population of Temple is 83,473.
What is the Total Male Population of Temple?
Total Male Population of Temple is 39,887.
What is the Total Female Population of Temple?
Total Female Population of Temple is 43,586.
What is the Ratio of Males per 100 Females in Temple?
There are 91.51 Males per 100 Females in Temple.
What is the Ratio of Females per 100 Males in Temple?
There are 109.27 Females per 100 Males in Temple.
What is the Median Population Age in Temple?
Median Population Age in Temple is 34.0 Years.
What is the Average Family Size in Temple
Average Family Size in Temple is 3.3 People.
What is the Average Household Size in Temple
Average Household Size in Temple is 2.6 People.
How Large is the Labor Force in Temple?
There are 38,619 People in the Labor Forcein in Temple.
What is the Percentage of People in the Labor Force in Temple?
61.5% of People are in the Labor Force in Temple.
What is the Unemployment Rate in Temple?
Unemployment Rate in Temple is 7.1%.