Corsicana, TX Map & Demographics
Corsicana Map
Corsicana Overview
$24,274
PER CAPITA INCOME
$65,444
AVG FAMILY INCOME
$49,353
AVG HOUSEHOLD INCOME
25.1%
WAGE / INCOME GAP [ % ]
74.9¢/ $1
WAGE / INCOME GAP [ $ ]
$10,037
FAMILY INCOME DEFICIT
0.46
INEQUALITY / GINI INDEX
25,107
TOTAL POPULATION
12,881
MALE POPULATION
12,226
FEMALE POPULATION
105.36
MALES / 100 FEMALES
94.91
FEMALES / 100 MALES
34.6
MEDIAN AGE
3.6
AVG FAMILY SIZE
2.8
AVG HOUSEHOLD SIZE
11,768
LABOR FORCE [ PEOPLE ]
61.1%
PERCENT IN LABOR FORCE
7.7%
UNEMPLOYMENT RATE
Corsicana Area Codes
Income in Corsicana
Income Overview in Corsicana
Per Capita Income in Corsicana is $24,274, while median incomes of families and households are $65,444 and $49,353 respectively.
| Characteristic | Number | Measure |
| Per Capita Income | 25,107 | $24,274 |
| Median Family Income | 5,717 | $65,444 |
| Mean Family Income | 5,717 | $83,553 |
| Median Household Income | 8,610 | $49,353 |
| Mean Household Income | 8,610 | $68,785 |
| Income Deficit | 5,717 | $10,037 |
| Wage / Income Gap (%) | 25,107 | 25.07% |
| Wage / Income Gap ($) | 25,107 | 74.93¢ per $1 |
| Gini / Inequality Index | 25,107 | 0.46 |
Earnings by Sex in Corsicana
Average Earnings in Corsicana are $28,019, $32,696 for men and $24,498 for women, a difference of 25.1%.
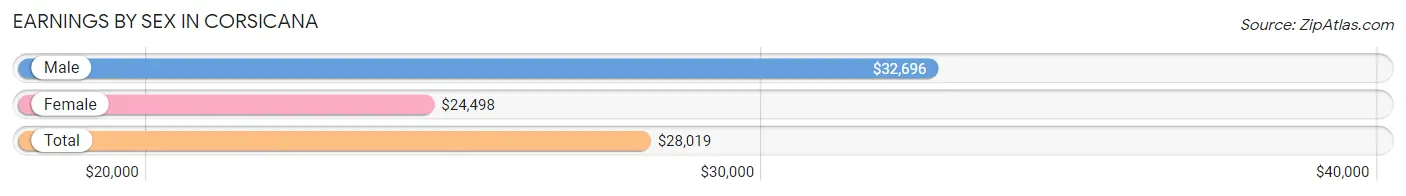
| Sex | Number | Average Earnings |
| Male | 6,482 (54.0%) | $32,696 |
| Female | 5,520 (46.0%) | $24,498 |
| Total | 12,002 (100.0%) | $28,019 |
Earnings by Sex by Income Bracket in Corsicana
The most common earnings brackets in Corsicana are $45,000 to $49,999 for men (600 | 9.3%) and $25,000 to $29,999 for women (471 | 8.5%).
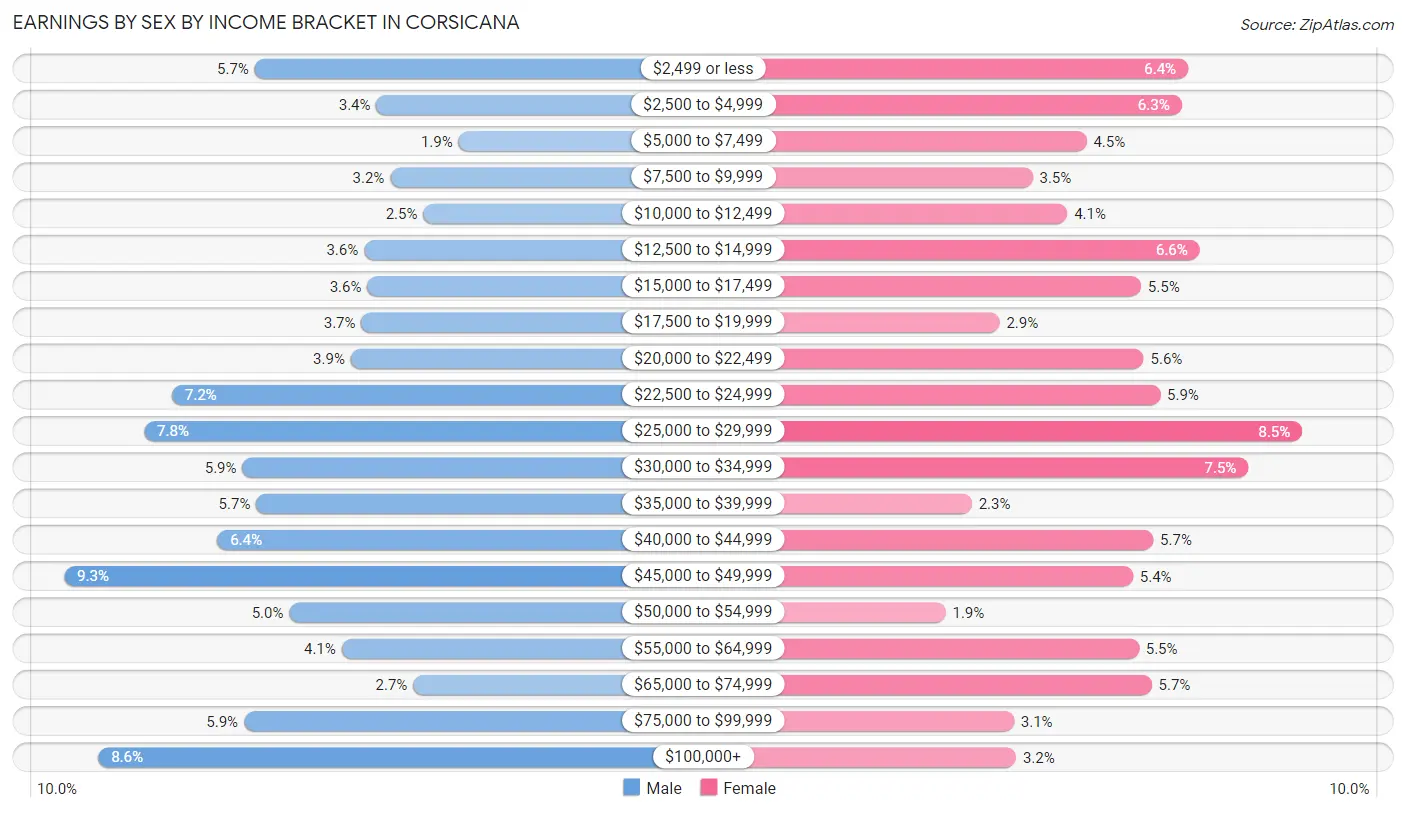
| Income | Male | Female |
| $2,499 or less | 369 (5.7%) | 353 (6.4%) |
| $2,500 to $4,999 | 221 (3.4%) | 346 (6.3%) |
| $5,000 to $7,499 | 121 (1.9%) | 248 (4.5%) |
| $7,500 to $9,999 | 204 (3.2%) | 192 (3.5%) |
| $10,000 to $12,499 | 164 (2.5%) | 228 (4.1%) |
| $12,500 to $14,999 | 236 (3.6%) | 365 (6.6%) |
| $15,000 to $17,499 | 232 (3.6%) | 304 (5.5%) |
| $17,500 to $19,999 | 239 (3.7%) | 158 (2.9%) |
| $20,000 to $22,499 | 252 (3.9%) | 307 (5.6%) |
| $22,500 to $24,999 | 469 (7.2%) | 324 (5.9%) |
| $25,000 to $29,999 | 503 (7.8%) | 471 (8.5%) |
| $30,000 to $34,999 | 384 (5.9%) | 415 (7.5%) |
| $35,000 to $39,999 | 367 (5.7%) | 129 (2.3%) |
| $40,000 to $44,999 | 414 (6.4%) | 317 (5.7%) |
| $45,000 to $49,999 | 600 (9.3%) | 296 (5.4%) |
| $50,000 to $54,999 | 327 (5.0%) | 102 (1.8%) |
| $55,000 to $64,999 | 263 (4.1%) | 302 (5.5%) |
| $65,000 to $74,999 | 176 (2.7%) | 315 (5.7%) |
| $75,000 to $99,999 | 382 (5.9%) | 173 (3.1%) |
| $100,000+ | 559 (8.6%) | 175 (3.2%) |
| Total | 6,482 (100.0%) | 5,520 (100.0%) |
Earnings by Sex by Educational Attainment in Corsicana
Average earnings in Corsicana are $40,374 for men and $29,550 for women, a difference of 26.8%. Men with an educational attainment of graduate degree enjoy the highest average annual earnings of $143,134, while those with high school diploma education earn the least with $35,469. Women with an educational attainment of graduate degree earn the most with the average annual earnings of $68,393, while those with college or associate's degree education have the smallest earnings of $21,806.
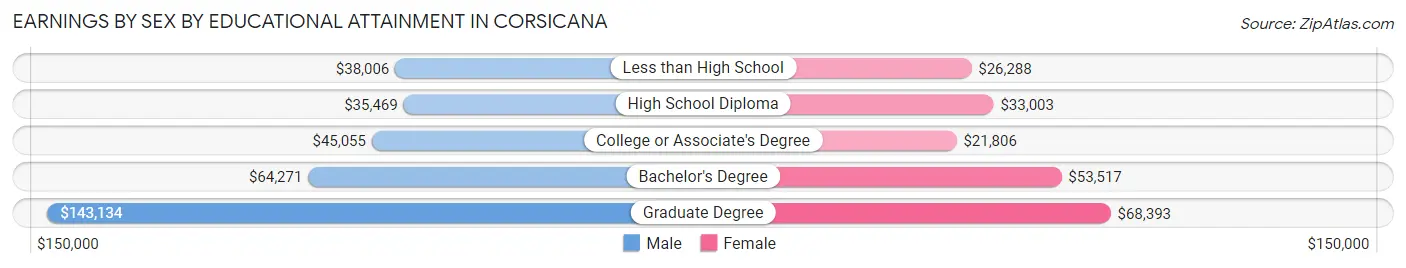
| Educational Attainment | Male Income | Female Income |
| Less than High School | $38,006 | $26,288 |
| High School Diploma | $35,469 | $33,003 |
| College or Associate's Degree | $45,055 | $21,806 |
| Bachelor's Degree | $64,271 | $53,517 |
| Graduate Degree | $143,134 | $68,393 |
| Total | $40,374 | $29,550 |
Family Income in Corsicana
Family Income Brackets in Corsicana
According to the Corsicana family income data, there are 1,029 families falling into the $100,000 to $149,999 income range, which is the most common income bracket and makes up 18.0% of all families. Conversely, the $10,000 to $14,999 income bracket is the least frequent group with only 154 families (2.7%) belonging to this category.
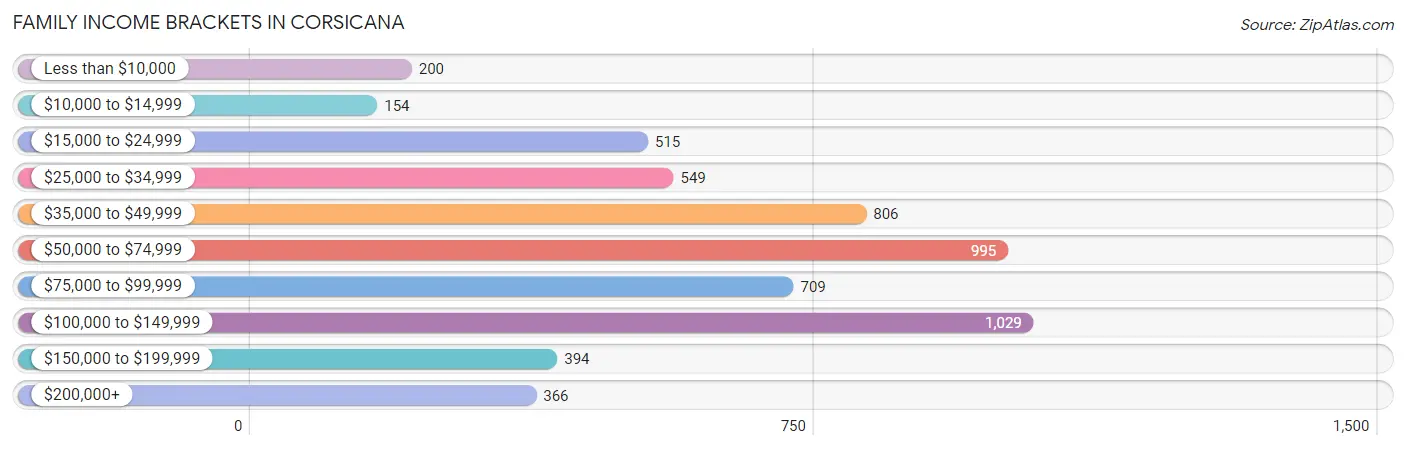
| Income Bracket | # Families | % Families |
| Less than $10,000 | 200 | 3.5% |
| $10,000 to $14,999 | 154 | 2.7% |
| $15,000 to $24,999 | 515 | 9.0% |
| $25,000 to $34,999 | 549 | 9.6% |
| $35,000 to $49,999 | 806 | 14.1% |
| $50,000 to $74,999 | 995 | 17.4% |
| $75,000 to $99,999 | 709 | 12.4% |
| $100,000 to $149,999 | 1,029 | 18.0% |
| $150,000 to $199,999 | 394 | 6.9% |
| $200,000+ | 366 | 6.4% |
Family Income by Famaliy Size in Corsicana
6-person families (348 | 6.1%) account for the highest median family income in Corsicana with $141,667 per family, while 2-person families (2,509 | 43.9%) have the highest median income of $28,696 per family member.
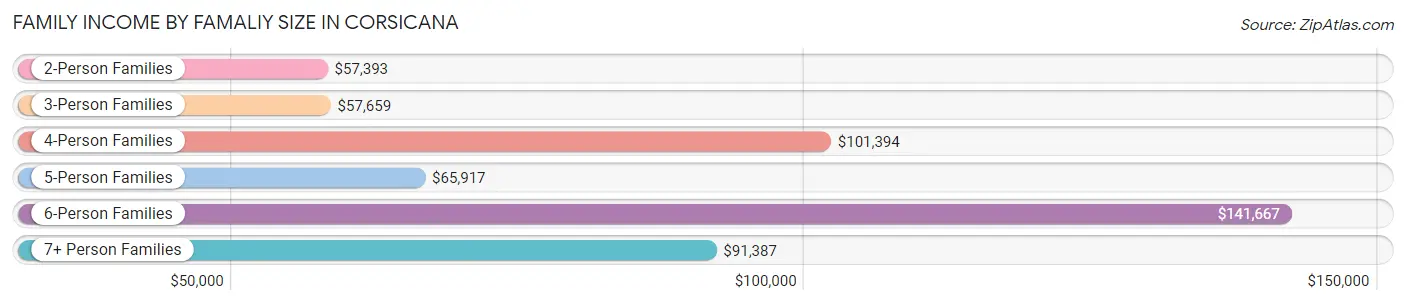
| Income Bracket | # Families | Median Income |
| 2-Person Families | 2,509 (43.9%) | $57,393 |
| 3-Person Families | 1,120 (19.6%) | $57,659 |
| 4-Person Families | 1,061 (18.6%) | $101,394 |
| 5-Person Families | 460 (8.1%) | $65,917 |
| 6-Person Families | 348 (6.1%) | $141,667 |
| 7+ Person Families | 219 (3.8%) | $91,387 |
| Total | 5,717 (100.0%) | $65,444 |
Family Income by Number of Earners in Corsicana
The median family income in Corsicana is $65,444, with families comprising 3+ earners (720) having the highest median family income of $113,063, while families with no earners (730) have the lowest median family income of $36,694, accounting for 12.6% and 12.8% of families, respectively.
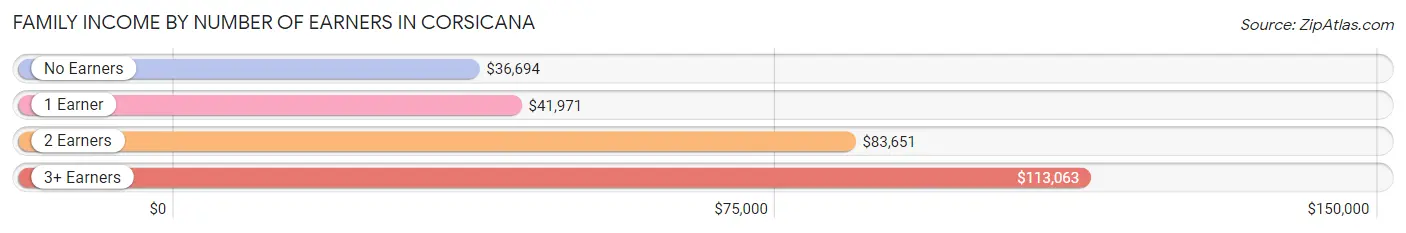
| Number of Earners | # Families | Median Income |
| No Earners | 730 (12.8%) | $36,694 |
| 1 Earner | 2,206 (38.6%) | $41,971 |
| 2 Earners | 2,061 (36.0%) | $83,651 |
| 3+ Earners | 720 (12.6%) | $113,063 |
| Total | 5,717 (100.0%) | $65,444 |
Household Income in Corsicana
Household Income Brackets in Corsicana
With 1,403 households falling in the category, the $50,000 to $74,999 income range is the most frequent in Corsicana, accounting for 16.3% of all households. In contrast, only 370 households (4.3%) fall into the $200,000+ income bracket, making it the least populous group.
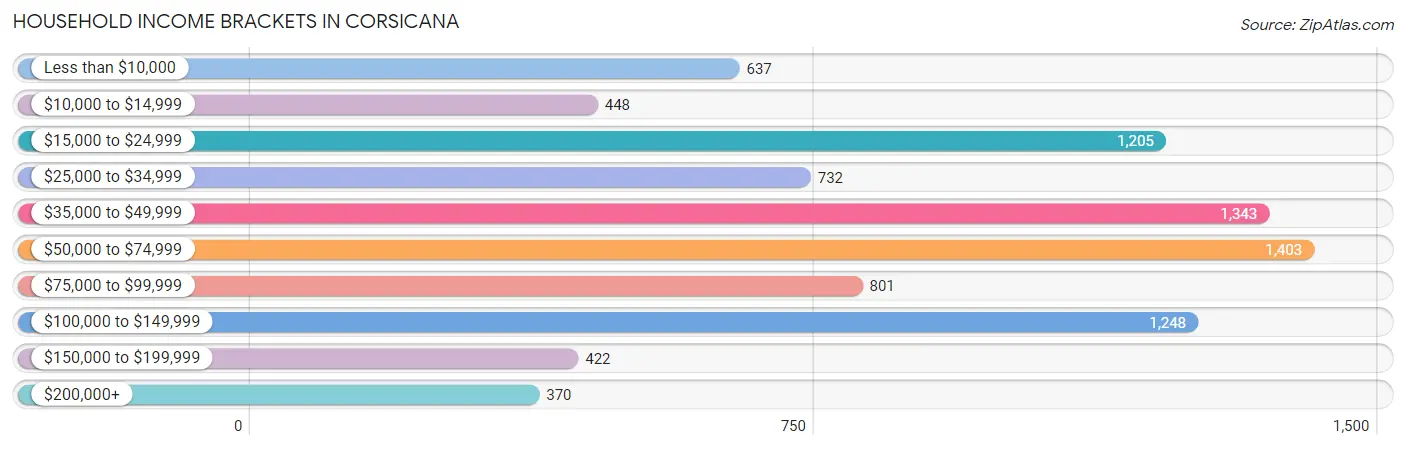
| Income Bracket | # Households | % Households |
| Less than $10,000 | 637 | 7.4% |
| $10,000 to $14,999 | 448 | 5.2% |
| $15,000 to $24,999 | 1,205 | 14.0% |
| $25,000 to $34,999 | 732 | 8.5% |
| $35,000 to $49,999 | 1,343 | 15.6% |
| $50,000 to $74,999 | 1,403 | 16.3% |
| $75,000 to $99,999 | 801 | 9.3% |
| $100,000 to $149,999 | 1,248 | 14.5% |
| $150,000 to $199,999 | 422 | 4.9% |
| $200,000+ | 370 | 4.3% |
Household Income by Householder Age in Corsicana
The median household income in Corsicana is $49,353, with the highest median household income of $57,313 found in the 25 to 44 years age bracket for the primary householder. A total of 2,820 households (32.8%) fall into this category. Meanwhile, the 15 to 24 years age bracket for the primary householder has the lowest median household income of $37,404, with 409 households (4.8%) in this group.
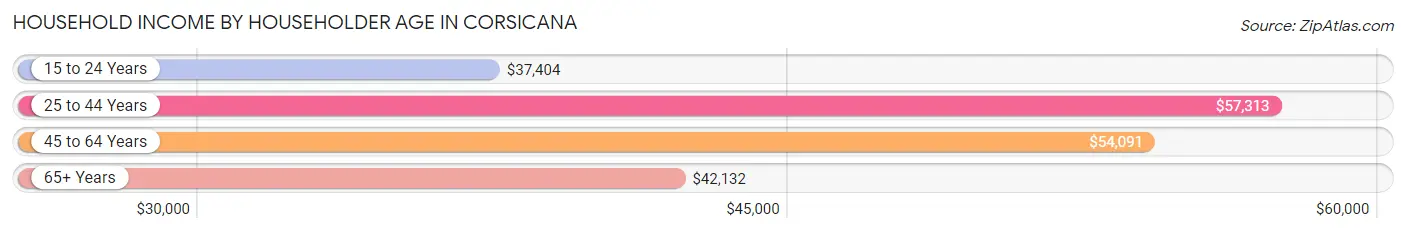
| Income Bracket | # Households | Median Income |
| 15 to 24 Years | 409 (4.8%) | $37,404 |
| 25 to 44 Years | 2,820 (32.8%) | $57,313 |
| 45 to 64 Years | 2,796 (32.5%) | $54,091 |
| 65+ Years | 2,585 (30.0%) | $42,132 |
| Total | 8,610 (100.0%) | $49,353 |
Poverty in Corsicana
Income Below Poverty by Sex and Age in Corsicana
With 16.4% poverty level for males and 19.0% for females among the residents of Corsicana, 12 to 14 year old males and 6 to 11 year old females are the most vulnerable to poverty, with 248 males (43.4%) and 350 females (37.8%) in their respective age groups living below the poverty level.
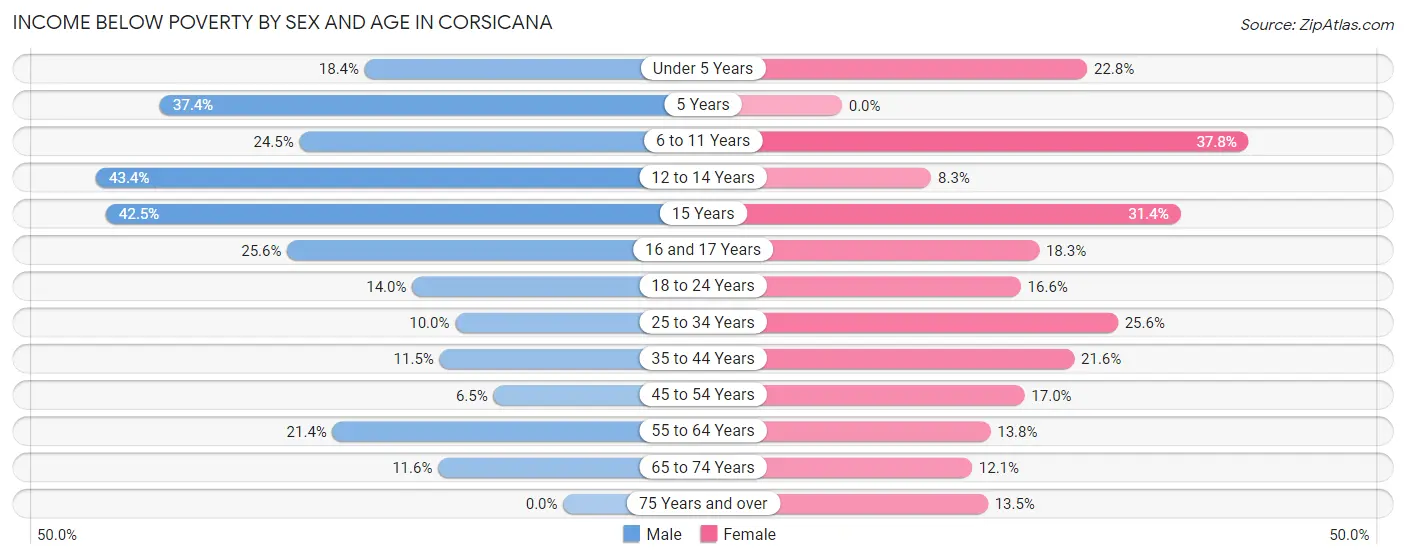
| Age Bracket | Male | Female |
| Under 5 Years | 203 (18.4%) | 175 (22.8%) |
| 5 Years | 76 (37.4%) | 0 (0.0%) |
| 6 to 11 Years | 340 (24.5%) | 350 (37.8%) |
| 12 to 14 Years | 248 (43.4%) | 34 (8.3%) |
| 15 Years | 59 (42.4%) | 44 (31.4%) |
| 16 and 17 Years | 82 (25.6%) | 43 (18.3%) |
| 18 to 24 Years | 243 (14.0%) | 208 (16.6%) |
| 25 to 34 Years | 145 (10.0%) | 388 (25.6%) |
| 35 to 44 Years | 198 (11.5%) | 295 (21.6%) |
| 45 to 54 Years | 80 (6.5%) | 216 (17.0%) |
| 55 to 64 Years | 240 (21.4%) | 203 (13.8%) |
| 65 to 74 Years | 106 (11.6%) | 154 (12.1%) |
| 75 Years and over | 0 (0.0%) | 142 (13.5%) |
| Total | 2,020 (16.4%) | 2,252 (19.0%) |
Income Above Poverty by Sex and Age in Corsicana
According to the poverty statistics in Corsicana, males aged 75 years and over and females aged 5 years are the age groups that are most secure financially, with 100.0% of males and 100.0% of females in these age groups living above the poverty line.
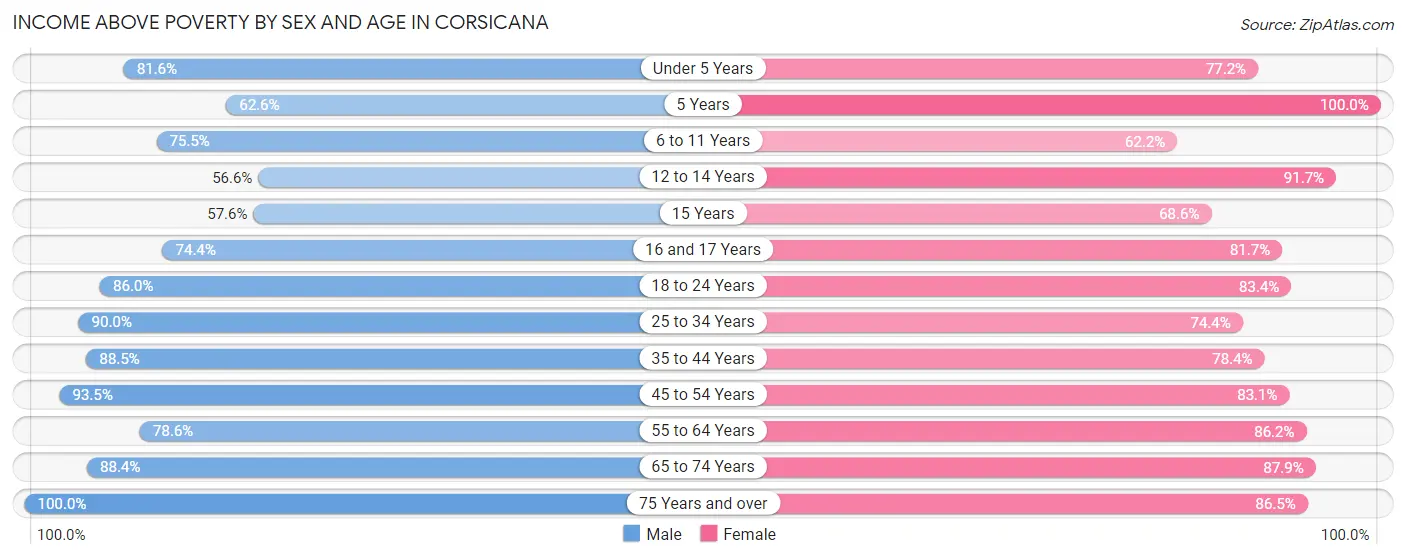
| Age Bracket | Male | Female |
| Under 5 Years | 899 (81.6%) | 594 (77.2%) |
| 5 Years | 127 (62.6%) | 144 (100.0%) |
| 6 to 11 Years | 1,049 (75.5%) | 577 (62.2%) |
| 12 to 14 Years | 324 (56.6%) | 376 (91.7%) |
| 15 Years | 80 (57.6%) | 96 (68.6%) |
| 16 and 17 Years | 238 (74.4%) | 192 (81.7%) |
| 18 to 24 Years | 1,490 (86.0%) | 1,045 (83.4%) |
| 25 to 34 Years | 1,301 (90.0%) | 1,127 (74.4%) |
| 35 to 44 Years | 1,526 (88.5%) | 1,073 (78.4%) |
| 45 to 54 Years | 1,155 (93.5%) | 1,058 (83.1%) |
| 55 to 64 Years | 881 (78.6%) | 1,270 (86.2%) |
| 65 to 74 Years | 807 (88.4%) | 1,122 (87.9%) |
| 75 Years and over | 434 (100.0%) | 907 (86.5%) |
| Total | 10,311 (83.6%) | 9,581 (81.0%) |
Income Below Poverty Among Married-Couple Families in Corsicana
The poverty statistics for married-couple families in Corsicana show that 7.5% or 268 of the total 3,593 families live below the poverty line. Families with 5 or more children have the highest poverty rate of 24.2%, comprising of 23 families. On the other hand, families with 1 or 2 children have the lowest poverty rate of 5.7%, which includes 55 families.
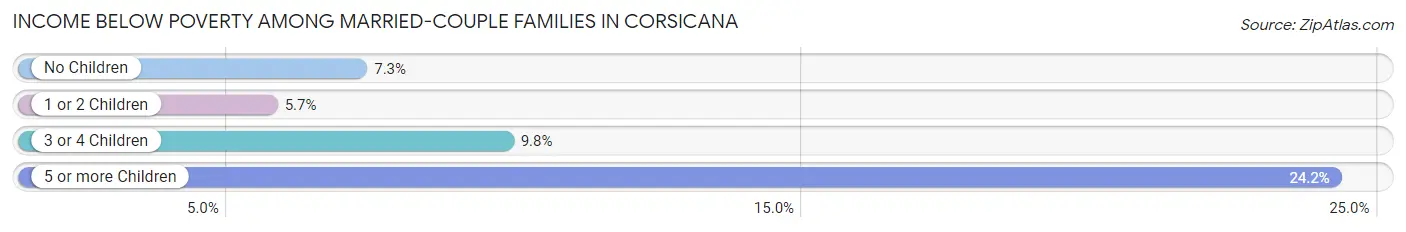
| Children | Above Poverty | Below Poverty |
| No Children | 2,111 (92.7%) | 165 (7.2%) |
| 1 or 2 Children | 912 (94.3%) | 55 (5.7%) |
| 3 or 4 Children | 230 (90.2%) | 25 (9.8%) |
| 5 or more Children | 72 (75.8%) | 23 (24.2%) |
| Total | 3,325 (92.5%) | 268 (7.5%) |
Income Below Poverty Among Single-Parent Households in Corsicana
According to the poverty data in Corsicana, 9.7% or 44 single-father households and 28.0% or 467 single-mother households are living below the poverty line. Among single-father households, those with 3 or 4 children have the highest poverty rate, with 2 households (100.0%) experiencing poverty. Likewise, among single-mother households, those with 3 or 4 children have the highest poverty rate, with 130 households (48.7%) falling below the poverty line.
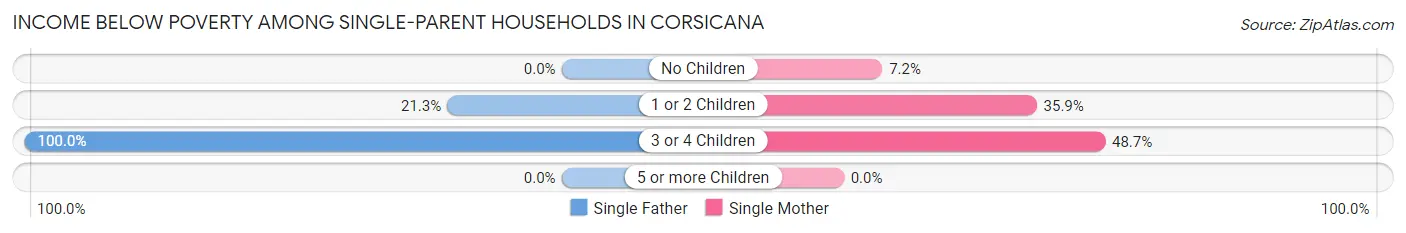
| Children | Single Father | Single Mother |
| No Children | 0 (0.0%) | 38 (7.2%) |
| 1 or 2 Children | 42 (21.3%) | 299 (35.9%) |
| 3 or 4 Children | 2 (100.0%) | 130 (48.7%) |
| 5 or more Children | 0 (0.0%) | 0 (0.0%) |
| Total | 44 (9.7%) | 467 (28.0%) |
Income Below Poverty Among Married-Couple vs Single-Parent Households in Corsicana
The poverty data for Corsicana shows that 268 of the married-couple family households (7.5%) and 511 of the single-parent households (24.1%) are living below the poverty level. Within the married-couple family households, those with 5 or more children have the highest poverty rate, with 23 households (24.2%) falling below the poverty line. Among the single-parent households, those with 3 or 4 children have the highest poverty rate, with 132 household (49.1%) living below poverty.
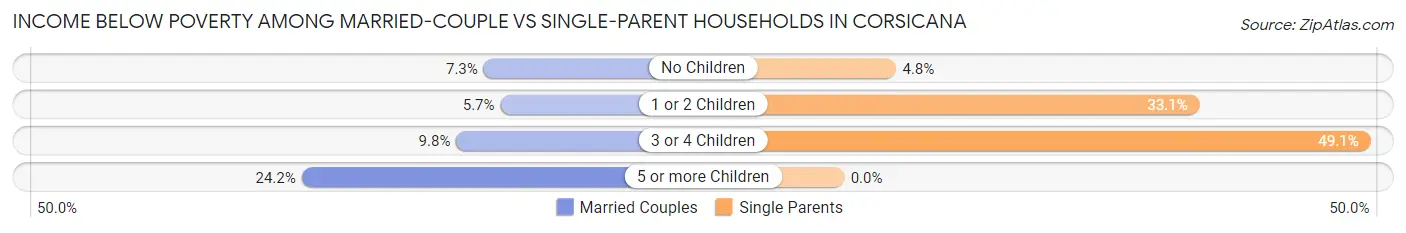
| Children | Married-Couple Families | Single-Parent Households |
| No Children | 165 (7.2%) | 38 (4.8%) |
| 1 or 2 Children | 55 (5.7%) | 341 (33.1%) |
| 3 or 4 Children | 25 (9.8%) | 132 (49.1%) |
| 5 or more Children | 23 (24.2%) | 0 (0.0%) |
| Total | 268 (7.5%) | 511 (24.1%) |
Race in Corsicana
The most populous races in Corsicana are White / Caucasian (13,338 | 53.1%), Hispanic or Latino (8,808 | 35.1%), and Black / African American (4,341 | 17.3%).
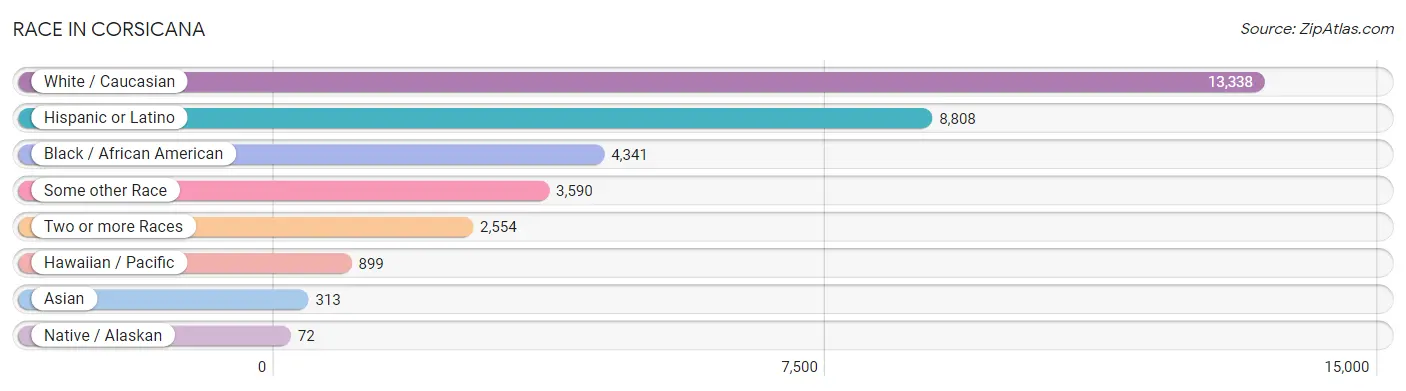
| Race | # Population | % Population |
| Asian | 313 | 1.3% |
| Black / African American | 4,341 | 17.3% |
| Hawaiian / Pacific | 899 | 3.6% |
| Hispanic or Latino | 8,808 | 35.1% |
| Native / Alaskan | 72 | 0.3% |
| White / Caucasian | 13,338 | 53.1% |
| Two or more Races | 2,554 | 10.2% |
| Some other Race | 3,590 | 14.3% |
| Total | 25,107 | 100.0% |
Ancestry in Corsicana
The most populous ancestries reported in Corsicana are Mexican (8,106 | 32.3%), Irish (1,527 | 6.1%), American (1,147 | 4.6%), German (1,135 | 4.5%), and English (897 | 3.6%), together accounting for 51.0% of all Corsicana residents.
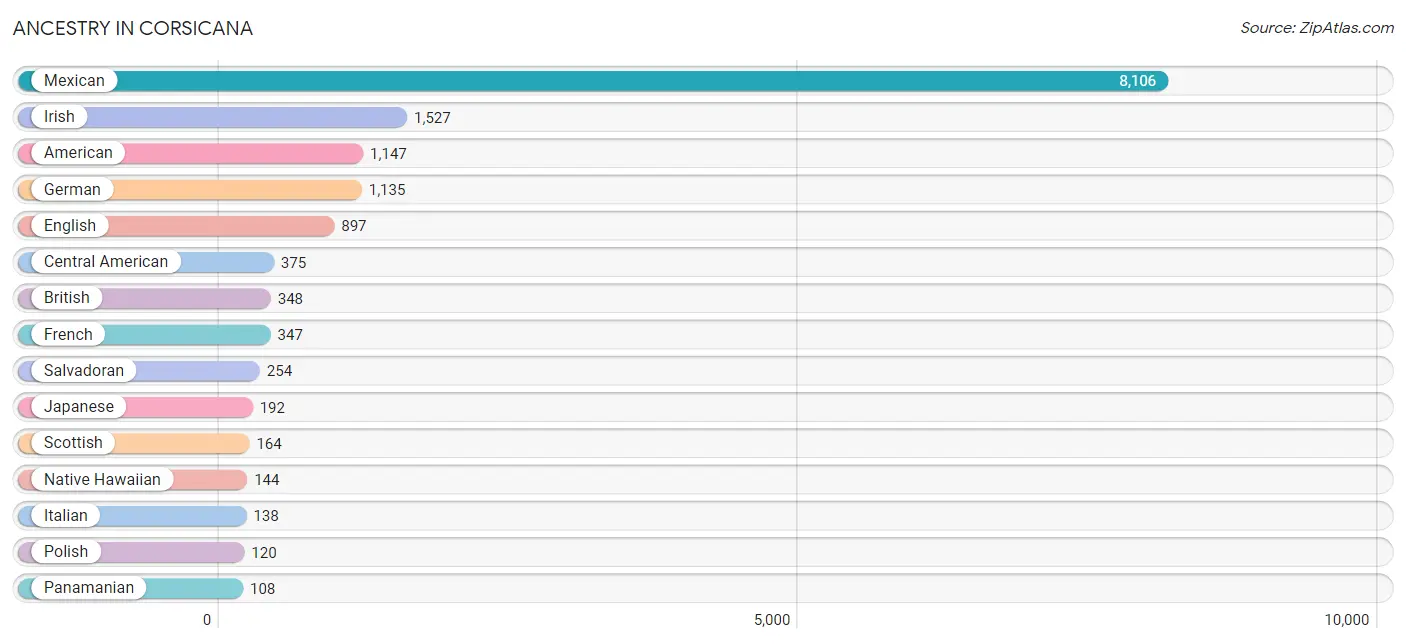
| Ancestry | # Population | % Population |
| African | 1 | 0.0% |
| American | 1,147 | 4.6% |
| Arab | 35 | 0.1% |
| Austrian | 23 | 0.1% |
| Bhutanese | 4 | 0.0% |
| Blackfeet | 5 | 0.0% |
| Brazilian | 34 | 0.1% |
| British | 348 | 1.4% |
| Celtic | 4 | 0.0% |
| Central American | 375 | 1.5% |
| Cherokee | 65 | 0.3% |
| Choctaw | 39 | 0.2% |
| Colombian | 35 | 0.1% |
| Comanche | 5 | 0.0% |
| Czech | 62 | 0.3% |
| Danish | 36 | 0.1% |
| Dutch | 65 | 0.3% |
| English | 897 | 3.6% |
| European | 80 | 0.3% |
| Finnish | 34 | 0.1% |
| French | 347 | 1.4% |
| French Canadian | 10 | 0.0% |
| German | 1,135 | 4.5% |
| Greek | 44 | 0.2% |
| Guatemalan | 6 | 0.0% |
| Honduran | 7 | 0.0% |
| Hungarian | 76 | 0.3% |
| Iranian | 4 | 0.0% |
| Irish | 1,527 | 6.1% |
| Israeli | 13 | 0.1% |
| Italian | 138 | 0.5% |
| Japanese | 192 | 0.8% |
| Korean | 48 | 0.2% |
| Mexican | 8,106 | 32.3% |
| Mexican American Indian | 49 | 0.2% |
| Moroccan | 3 | 0.0% |
| Native Hawaiian | 144 | 0.6% |
| Nigerian | 9 | 0.0% |
| Northern European | 10 | 0.0% |
| Norwegian | 50 | 0.2% |
| Pakistani | 30 | 0.1% |
| Palestinian | 32 | 0.1% |
| Panamanian | 108 | 0.4% |
| Polish | 120 | 0.5% |
| Puerto Rican | 83 | 0.3% |
| Russian | 12 | 0.1% |
| Salvadoran | 254 | 1.0% |
| Scandinavian | 11 | 0.0% |
| Scotch-Irish | 107 | 0.4% |
| Scottish | 164 | 0.6% |
| South American | 35 | 0.1% |
| Spaniard | 99 | 0.4% |
| Spanish | 2 | 0.0% |
| Sri Lankan | 48 | 0.2% |
| Subsaharan African | 10 | 0.0% |
| Swedish | 38 | 0.2% |
| Thai | 36 | 0.1% |
| Ukrainian | 6 | 0.0% |
| Welsh | 96 | 0.4% |
| Yup'ik | 9 | 0.0% | View All 60 Rows |
Immigrants in Corsicana
The most numerous immigrant groups reported in Corsicana came from Latin America (3,516 | 14.0%), Central America (3,471 | 13.8%), Mexico (3,222 | 12.8%), Oceania (659 | 2.6%), and Micronesia (656 | 2.6%), together accounting for 45.9% of all Corsicana residents.
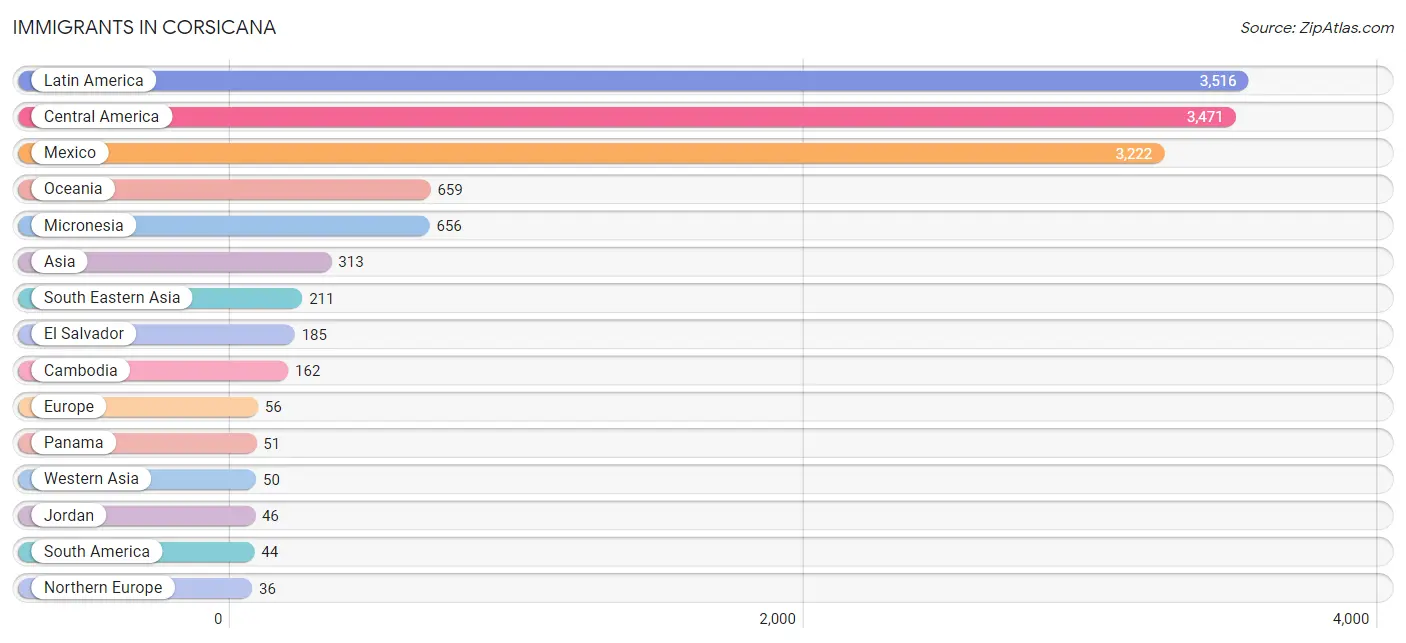
| Immigration Origin | # Population | % Population |
| Africa | 3 | 0.0% |
| Asia | 313 | 1.3% |
| Brazil | 9 | 0.0% |
| Cambodia | 162 | 0.6% |
| Caribbean | 1 | 0.0% |
| Central America | 3,471 | 13.8% |
| China | 30 | 0.1% |
| Colombia | 35 | 0.1% |
| Eastern Asia | 30 | 0.1% |
| Eastern Europe | 6 | 0.0% |
| El Salvador | 185 | 0.7% |
| Europe | 56 | 0.2% |
| Germany | 14 | 0.1% |
| Guatemala | 6 | 0.0% |
| Honduras | 7 | 0.0% |
| India | 22 | 0.1% |
| Israel | 4 | 0.0% |
| Jamaica | 1 | 0.0% |
| Jordan | 46 | 0.2% |
| Latin America | 3,516 | 14.0% |
| Mexico | 3,222 | 12.8% |
| Micronesia | 656 | 2.6% |
| Morocco | 3 | 0.0% |
| Northern Africa | 3 | 0.0% |
| Northern Europe | 36 | 0.1% |
| Oceania | 659 | 2.6% |
| Panama | 51 | 0.2% |
| Philippines | 11 | 0.0% |
| South America | 44 | 0.2% |
| South Central Asia | 22 | 0.1% |
| South Eastern Asia | 211 | 0.8% |
| Taiwan | 30 | 0.1% |
| Thailand | 30 | 0.1% |
| Ukraine | 6 | 0.0% |
| Vietnam | 8 | 0.0% |
| Western Asia | 50 | 0.2% |
| Western Europe | 14 | 0.1% | View All 37 Rows |
Sex and Age in Corsicana
Sex and Age in Corsicana
The most populous age groups in Corsicana are 20 to 24 Years (1,617 | 12.6%) for men and 20 to 24 Years (949 | 7.8%) for women.
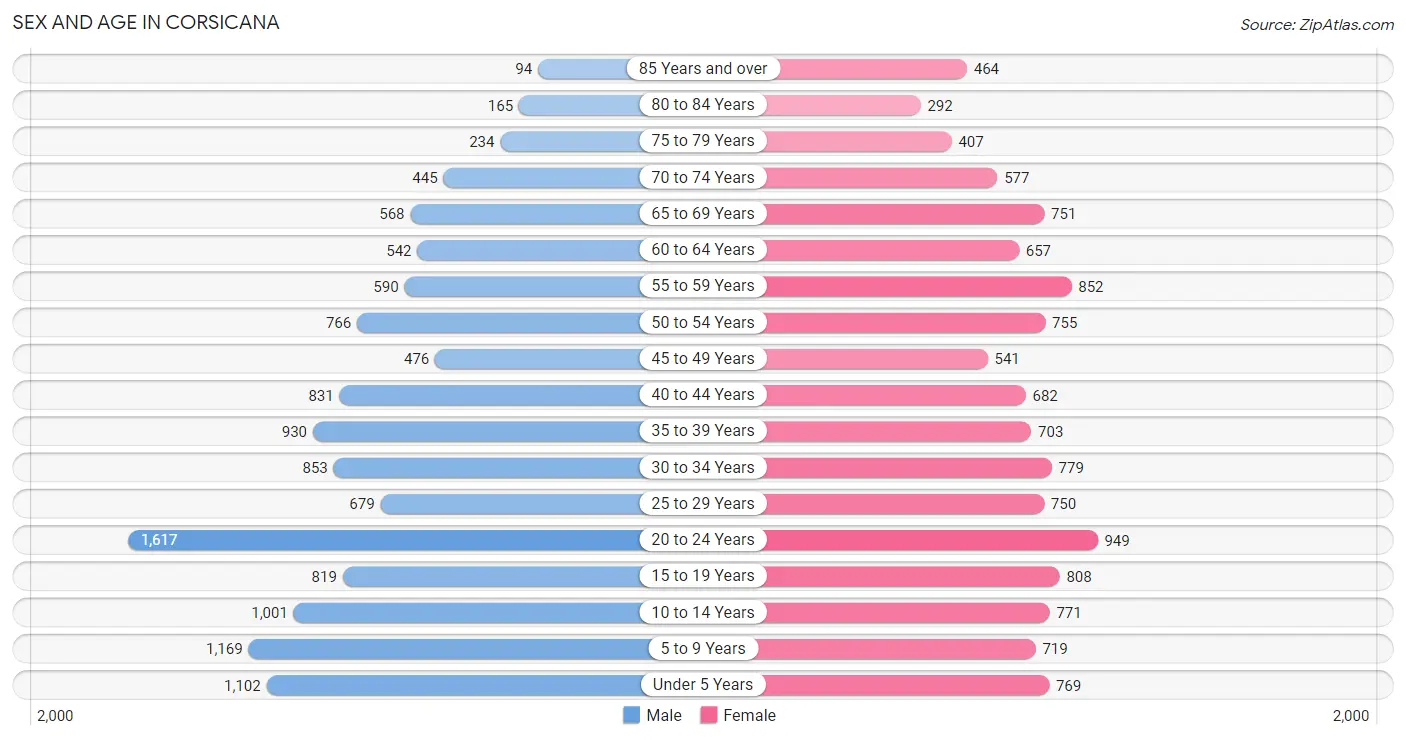
| Age Bracket | Male | Female |
| Under 5 Years | 1,102 (8.6%) | 769 (6.3%) |
| 5 to 9 Years | 1,169 (9.1%) | 719 (5.9%) |
| 10 to 14 Years | 1,001 (7.8%) | 771 (6.3%) |
| 15 to 19 Years | 819 (6.4%) | 808 (6.6%) |
| 20 to 24 Years | 1,617 (12.6%) | 949 (7.8%) |
| 25 to 29 Years | 679 (5.3%) | 750 (6.1%) |
| 30 to 34 Years | 853 (6.6%) | 779 (6.4%) |
| 35 to 39 Years | 930 (7.2%) | 703 (5.8%) |
| 40 to 44 Years | 831 (6.5%) | 682 (5.6%) |
| 45 to 49 Years | 476 (3.7%) | 541 (4.4%) |
| 50 to 54 Years | 766 (5.9%) | 755 (6.2%) |
| 55 to 59 Years | 590 (4.6%) | 852 (7.0%) |
| 60 to 64 Years | 542 (4.2%) | 657 (5.4%) |
| 65 to 69 Years | 568 (4.4%) | 751 (6.1%) |
| 70 to 74 Years | 445 (3.5%) | 577 (4.7%) |
| 75 to 79 Years | 234 (1.8%) | 407 (3.3%) |
| 80 to 84 Years | 165 (1.3%) | 292 (2.4%) |
| 85 Years and over | 94 (0.7%) | 464 (3.8%) |
| Total | 12,881 (100.0%) | 12,226 (100.0%) |
Families and Households in Corsicana
Median Family Size in Corsicana
The median family size in Corsicana is 3.57 persons per family, with married-couple families (3,593 | 62.8%) accounting for the largest median family size of 3.62 persons per family. On the other hand, single male/father families (456 | 8.0%) represent the smallest median family size with 3.02 persons per family.
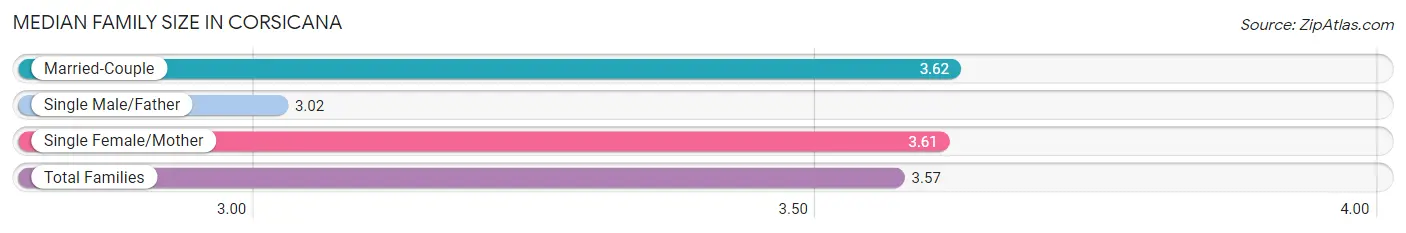
| Family Type | # Families | Family Size |
| Married-Couple | 3,593 (62.8%) | 3.62 |
| Single Male/Father | 456 (8.0%) | 3.02 |
| Single Female/Mother | 1,668 (29.2%) | 3.61 |
| Total Families | 5,717 (100.0%) | 3.57 |
Median Household Size in Corsicana
The median household size in Corsicana is 2.80 persons per household, with single female/mother households (1,668 | 19.4%) accounting for the largest median household size of 3.74 persons per household. non-family households (2,893 | 33.6%) represent the smallest median household size with 1.18 persons per household.
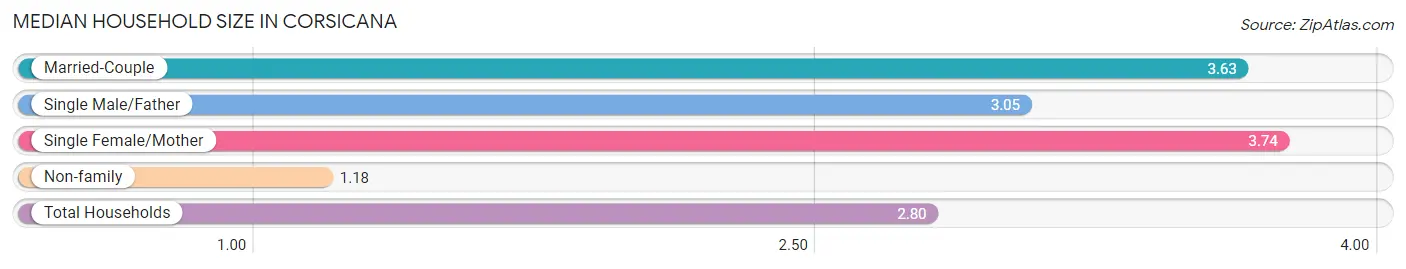
| Household Type | # Households | Household Size |
| Married-Couple | 3,593 (41.7%) | 3.63 |
| Single Male/Father | 456 (5.3%) | 3.05 |
| Single Female/Mother | 1,668 (19.4%) | 3.74 |
| Non-family | 2,893 (33.6%) | 1.18 |
| Total Households | 8,610 (100.0%) | 2.80 |
Household Size by Marriage Status in Corsicana
Out of a total of 8,610 households in Corsicana, 5,717 (66.4%) are family households, while 2,893 (33.6%) are nonfamily households. The most numerous type of family households are 2-person households, comprising 2,475, and the most common type of nonfamily households are 1-person households, comprising 2,558.
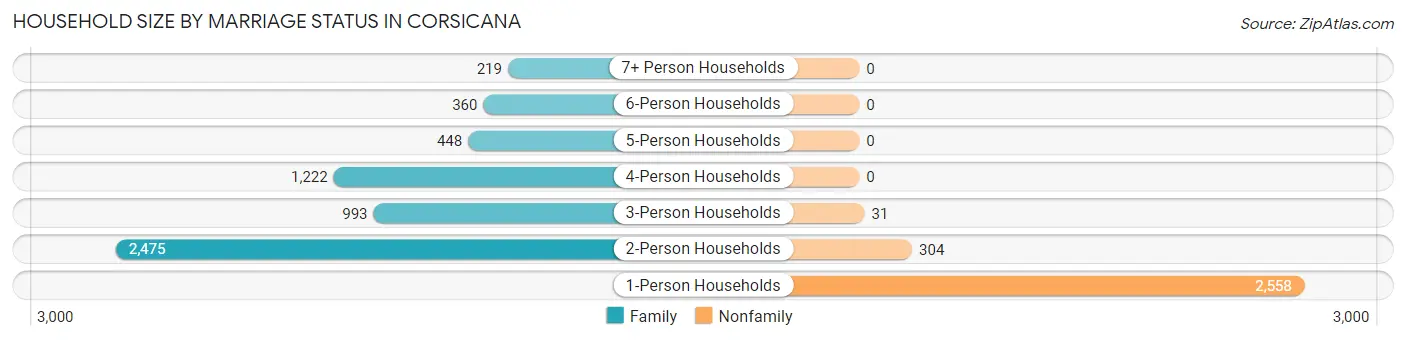
| Household Size | Family Households | Nonfamily Households |
| 1-Person Households | - | 2,558 (29.7%) |
| 2-Person Households | 2,475 (28.7%) | 304 (3.5%) |
| 3-Person Households | 993 (11.5%) | 31 (0.4%) |
| 4-Person Households | 1,222 (14.2%) | 0 (0.0%) |
| 5-Person Households | 448 (5.2%) | 0 (0.0%) |
| 6-Person Households | 360 (4.2%) | 0 (0.0%) |
| 7+ Person Households | 219 (2.5%) | 0 (0.0%) |
| Total | 5,717 (66.4%) | 2,893 (33.6%) |
Female Fertility in Corsicana
Fertility by Age in Corsicana
Average fertility rate in Corsicana is 72.0 births per 1,000 women. Women in the age bracket of 20 to 34 years have the highest fertility rate with 119.0 births per 1,000 women. Women in the age bracket of 20 to 34 years acount for 74.7% of all women with births.
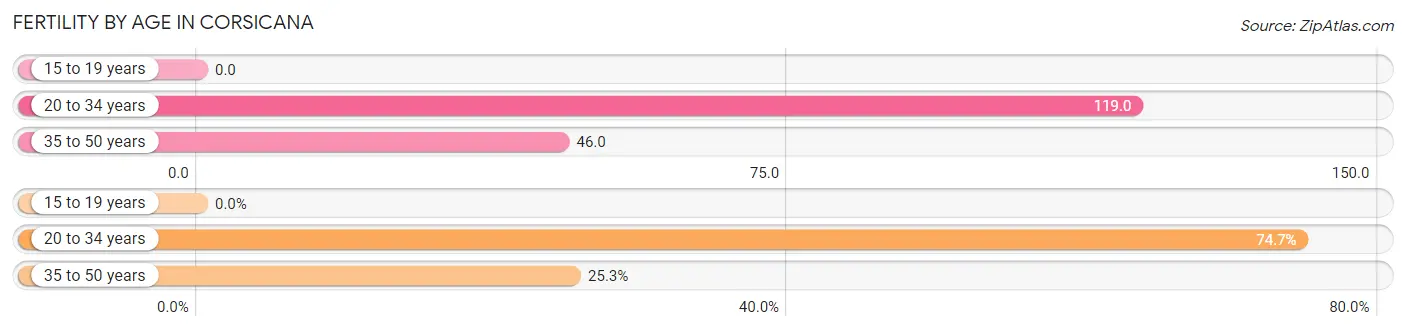
| Age Bracket | Women with Births | Births / 1,000 Women |
| 15 to 19 years | 0 (0.0%) | 0.0 |
| 20 to 34 years | 295 (74.7%) | 119.0 |
| 35 to 50 years | 100 (25.3%) | 46.0 |
| Total | 395 (100.0%) | 72.0 |
Fertility by Age by Marriage Status in Corsicana
42.0% of women with births (395) in Corsicana are married. The highest percentage of unmarried women with births falls into 20 to 34 years age bracket with 73.6% of them unmarried at the time of birth, while the lowest percentage of unmarried women with births belong to 35 to 50 years age bracket with 12.0% of them unmarried.
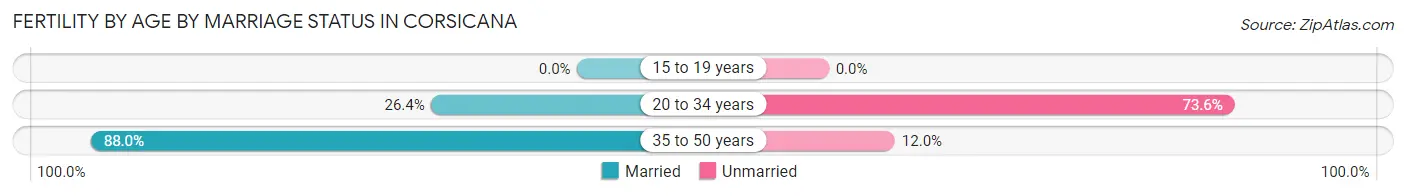
| Age Bracket | Married | Unmarried |
| 15 to 19 years | 0 (0.0%) | 0 (0.0%) |
| 20 to 34 years | 78 (26.4%) | 217 (73.6%) |
| 35 to 50 years | 88 (88.0%) | 12 (12.0%) |
| Total | 166 (42.0%) | 229 (58.0%) |
Fertility by Education in Corsicana
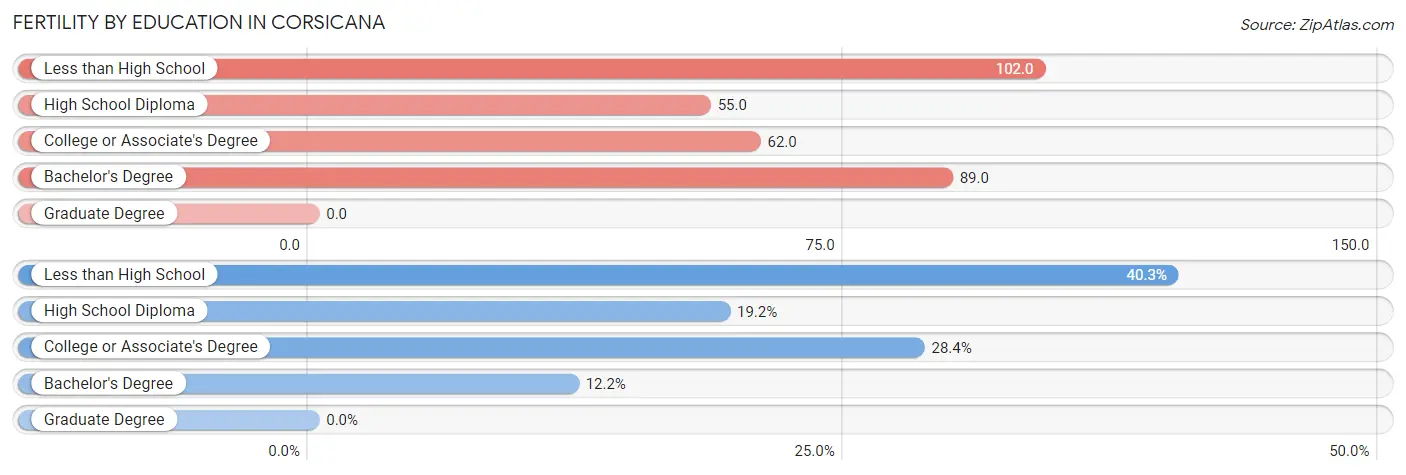
| Educational Attainment | Women with Births | Births / 1,000 Women |
| Less than High School | 159 (40.3%) | 102.0 |
| High School Diploma | 76 (19.2%) | 55.0 |
| College or Associate's Degree | 112 (28.3%) | 62.0 |
| Bachelor's Degree | 48 (12.1%) | 89.0 |
| Graduate Degree | 0 (0.0%) | 0.0 |
| Total | 395 (100.0%) | 72.0 |
Fertility by Education by Marriage Status in Corsicana
58.0% of women with births in Corsicana are unmarried. Women with the educational attainment of bachelor's degree are most likely to be married with 100.0% of them married at childbirth, while women with the educational attainment of high school diploma are least likely to be married with 100.0% of them unmarried at childbirth.
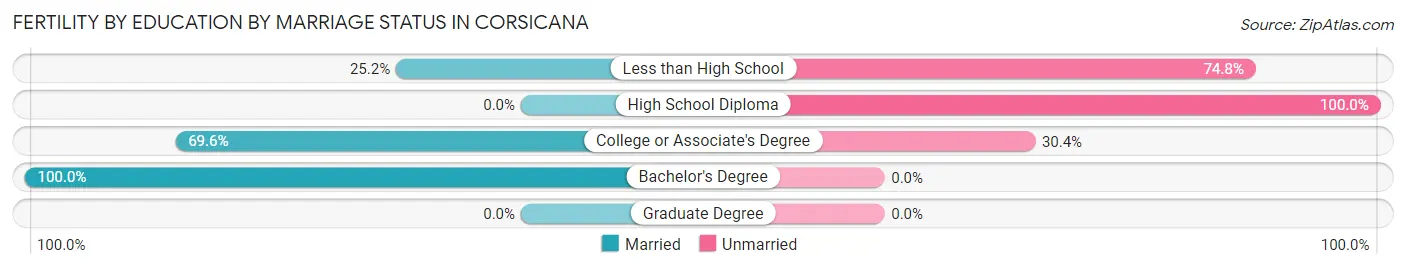
| Educational Attainment | Married | Unmarried |
| Less than High School | 40 (25.2%) | 119 (74.8%) |
| High School Diploma | 0 (0.0%) | 76 (100.0%) |
| College or Associate's Degree | 78 (69.6%) | 34 (30.4%) |
| Bachelor's Degree | 48 (100.0%) | 0 (0.0%) |
| Graduate Degree | 0 (0.0%) | 0 (0.0%) |
| Total | 166 (42.0%) | 229 (58.0%) |
Employment Characteristics in Corsicana
Employment by Class of Employer in Corsicana
Among the 10,343 employed individuals in Corsicana, private company employees (7,383 | 71.4%), state government employees (605 | 5.9%), and not-for-profit organizations (602 | 5.8%) make up the most common classes of employment.
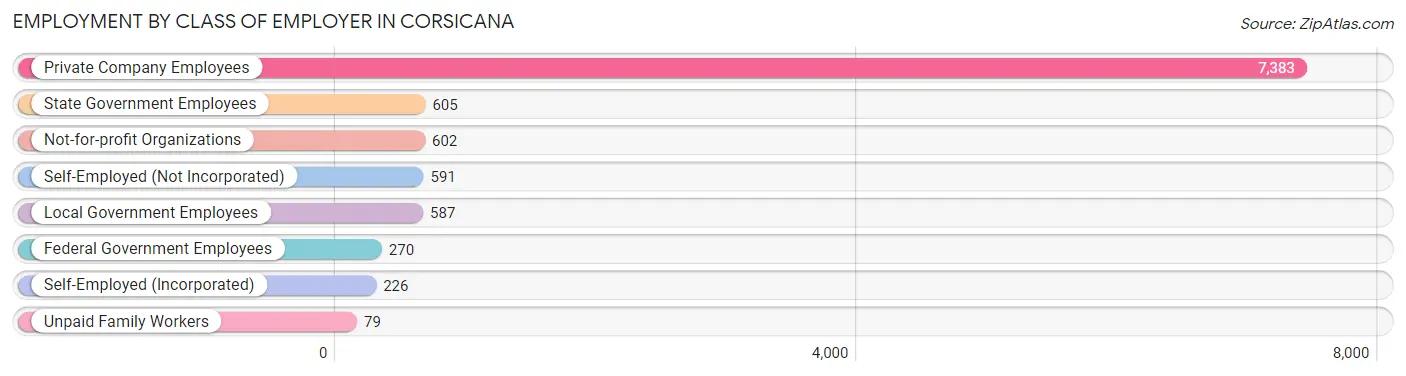
| Employer Class | # Employees | % Employees |
| Private Company Employees | 7,383 | 71.4% |
| Self-Employed (Incorporated) | 226 | 2.2% |
| Self-Employed (Not Incorporated) | 591 | 5.7% |
| Not-for-profit Organizations | 602 | 5.8% |
| Local Government Employees | 587 | 5.7% |
| State Government Employees | 605 | 5.9% |
| Federal Government Employees | 270 | 2.6% |
| Unpaid Family Workers | 79 | 0.8% |
| Total | 10,343 | 100.0% |
Employment Status by Age in Corsicana
According to the labor force statistics for Corsicana, out of the total population over 16 years of age (19,260), 61.1% or 11,768 individuals are in the labor force, with 7.7% or 906 of them unemployed. The age group with the highest labor force participation rate is 20 to 24 years, with 86.6% or 2,222 individuals in the labor force. Within the labor force, the 16 to 19 years age range has the highest percentage of unemployed individuals, with 16.0% or 117 of them being unemployed.
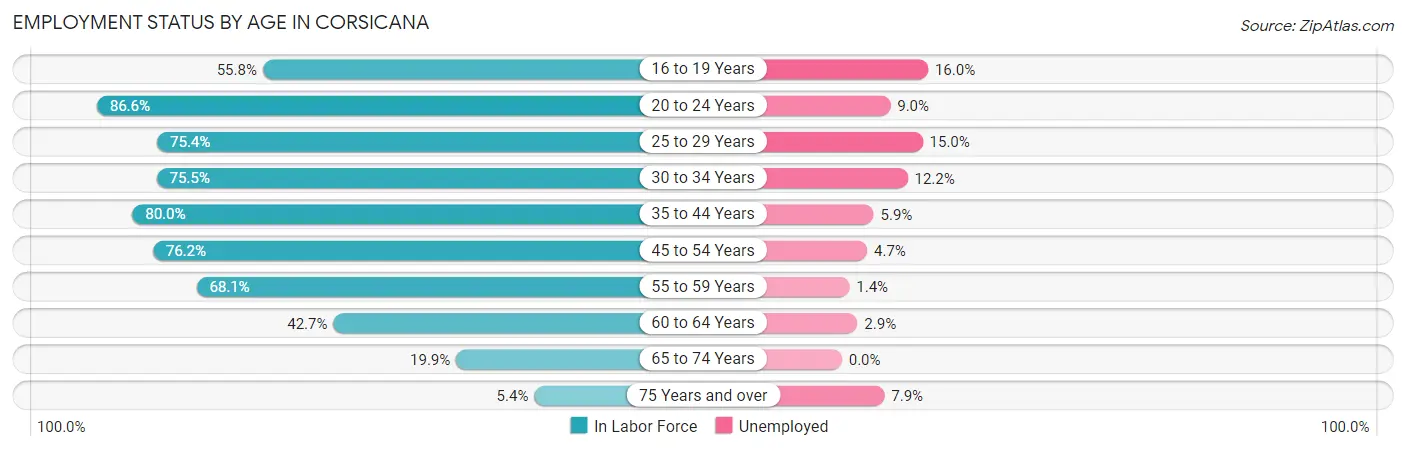
| Age Bracket | In Labor Force | Unemployed |
| 16 to 19 Years | 732 (55.8%) | 117 (16.0%) |
| 20 to 24 Years | 2,222 (86.6%) | 200 (9.0%) |
| 25 to 29 Years | 1,077 (75.4%) | 162 (15.0%) |
| 30 to 34 Years | 1,232 (75.5%) | 150 (12.2%) |
| 35 to 44 Years | 2,517 (80.0%) | 149 (5.9%) |
| 45 to 54 Years | 1,934 (76.2%) | 91 (4.7%) |
| 55 to 59 Years | 982 (68.1%) | 14 (1.4%) |
| 60 to 64 Years | 512 (42.7%) | 15 (2.9%) |
| 65 to 74 Years | 466 (19.9%) | 0 (0.0%) |
| 75 Years and over | 89 (5.4%) | 7 (7.9%) |
| Total | 11,768 (61.1%) | 906 (7.7%) |
Employment Status by Educational Attainment in Corsicana
According to labor force statistics for Corsicana, 72.5% of individuals (8,255) out of the total population between 25 and 64 years of age (11,386) are in the labor force, with 7.0% or 578 of them being unemployed. The group with the highest labor force participation rate are those with the educational attainment of college / associate degree, with 83.5% or 3,059 individuals in the labor force. Within the labor force, individuals with less than high school education have the highest percentage of unemployment, with 10.6% or 167 of them being unemployed.
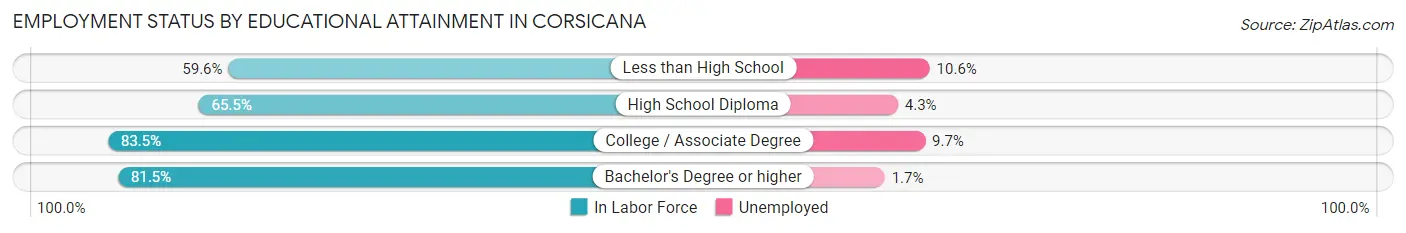
| Educational Attainment | In Labor Force | Unemployed |
| Less than High School | 1,580 (59.6%) | 281 (10.6%) |
| High School Diploma | 2,133 (65.5%) | 140 (4.3%) |
| College / Associate Degree | 3,059 (83.5%) | 355 (9.7%) |
| Bachelor's Degree or higher | 1,479 (81.5%) | 31 (1.7%) |
| Total | 8,255 (72.5%) | 797 (7.0%) |
Employment Occupations by Sex in Corsicana
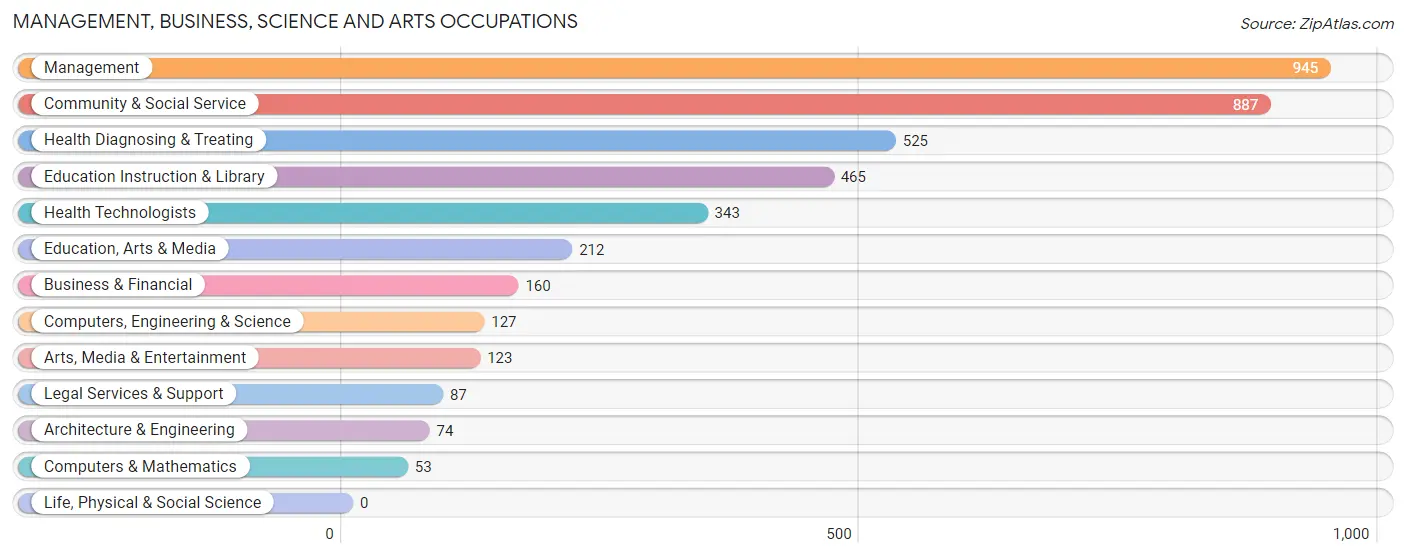
Management, Business, Science and Arts Occupations
The most common Management, Business, Science and Arts occupations in Corsicana are Management (945 | 8.7%), Community & Social Service (887 | 8.2%), Health Diagnosing & Treating (525 | 4.8%), Education Instruction & Library (465 | 4.3%), and Health Technologists (343 | 3.2%).
Management, Business, Science and Arts Occupations by Sex
Within the Management, Business, Science and Arts occupations in Corsicana, the most male-oriented occupations are Architecture & Engineering (100.0%), Computers, Engineering & Science (87.4%), and Legal Services & Support (80.5%), while the most female-oriented occupations are Education Instruction & Library (89.2%), Health Diagnosing & Treating (84.4%), and Business & Financial (80.6%).
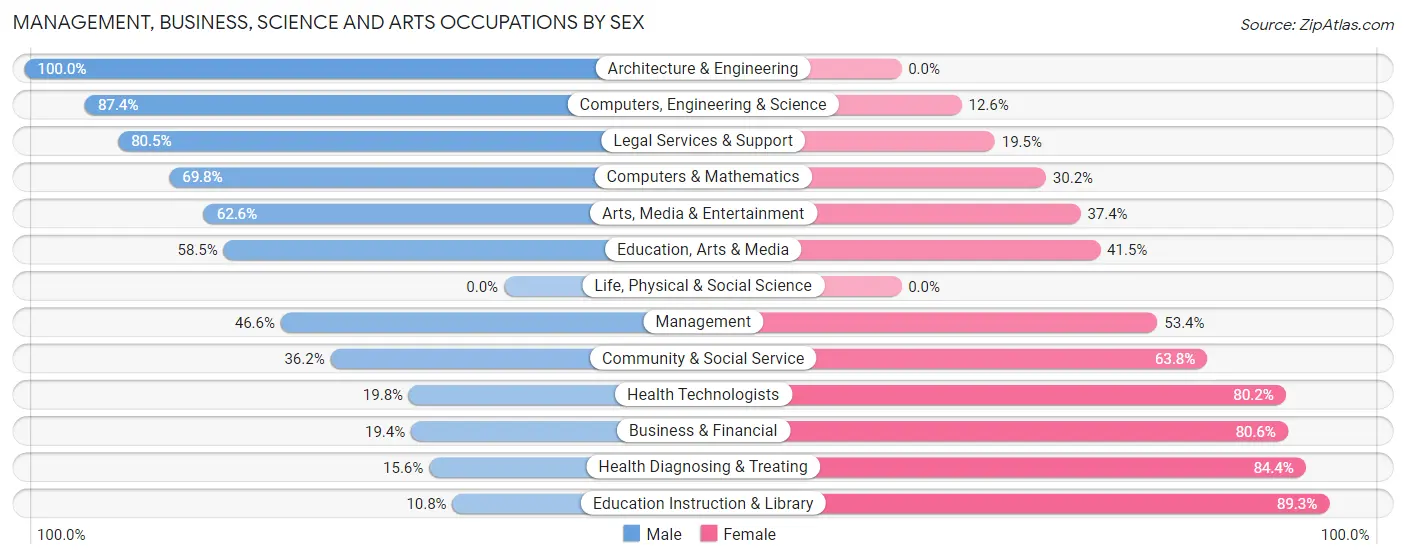
| Occupation | Male | Female |
| Management | 440 (46.6%) | 505 (53.4%) |
| Business & Financial | 31 (19.4%) | 129 (80.6%) |
| Computers, Engineering & Science | 111 (87.4%) | 16 (12.6%) |
| Computers & Mathematics | 37 (69.8%) | 16 (30.2%) |
| Architecture & Engineering | 74 (100.0%) | 0 (0.0%) |
| Life, Physical & Social Science | 0 (0.0%) | 0 (0.0%) |
| Community & Social Service | 321 (36.2%) | 566 (63.8%) |
| Education, Arts & Media | 124 (58.5%) | 88 (41.5%) |
| Legal Services & Support | 70 (80.5%) | 17 (19.5%) |
| Education Instruction & Library | 50 (10.7%) | 415 (89.2%) |
| Arts, Media & Entertainment | 77 (62.6%) | 46 (37.4%) |
| Health Diagnosing & Treating | 82 (15.6%) | 443 (84.4%) |
| Health Technologists | 68 (19.8%) | 275 (80.2%) |
| Total (Category) | 985 (37.2%) | 1,659 (62.7%) |
| Total (Overall) | 5,849 (53.9%) | 4,998 (46.1%) |
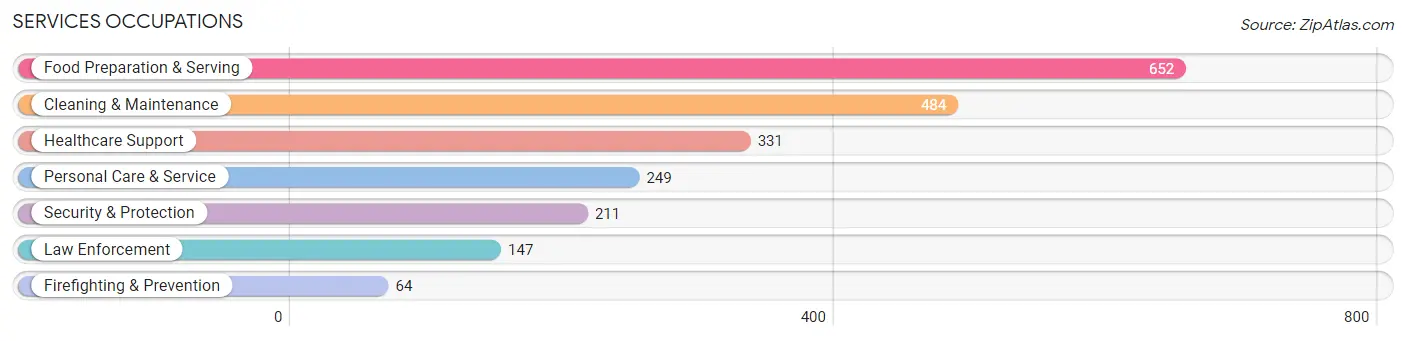
Services Occupations
The most common Services occupations in Corsicana are Food Preparation & Serving (652 | 6.0%), Cleaning & Maintenance (484 | 4.5%), Healthcare Support (331 | 3.0%), Personal Care & Service (249 | 2.3%), and Security & Protection (211 | 1.9%).
Services Occupations by Sex
Within the Services occupations in Corsicana, the most male-oriented occupations are Firefighting & Prevention (87.5%), Security & Protection (64.4%), and Cleaning & Maintenance (59.9%), while the most female-oriented occupations are Personal Care & Service (96.8%), Healthcare Support (90.6%), and Food Preparation & Serving (61.5%).
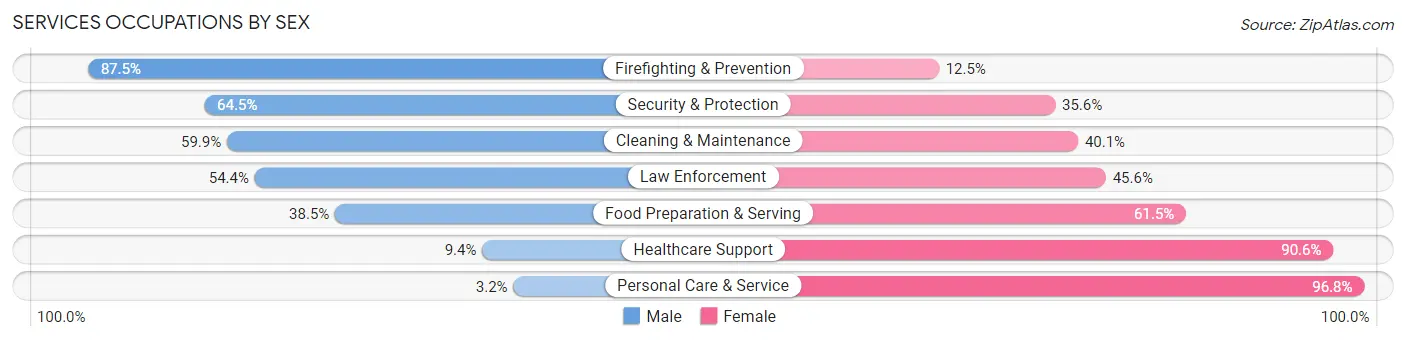
| Occupation | Male | Female |
| Healthcare Support | 31 (9.4%) | 300 (90.6%) |
| Security & Protection | 136 (64.4%) | 75 (35.5%) |
| Firefighting & Prevention | 56 (87.5%) | 8 (12.5%) |
| Law Enforcement | 80 (54.4%) | 67 (45.6%) |
| Food Preparation & Serving | 251 (38.5%) | 401 (61.5%) |
| Cleaning & Maintenance | 290 (59.9%) | 194 (40.1%) |
| Personal Care & Service | 8 (3.2%) | 241 (96.8%) |
| Total (Category) | 716 (37.2%) | 1,211 (62.8%) |
| Total (Overall) | 5,849 (53.9%) | 4,998 (46.1%) |
Sales and Office Occupations
The most common Sales and Office occupations in Corsicana are Sales & Related (1,208 | 11.1%), and Office & Administration (807 | 7.4%).

Sales and Office Occupations by Sex
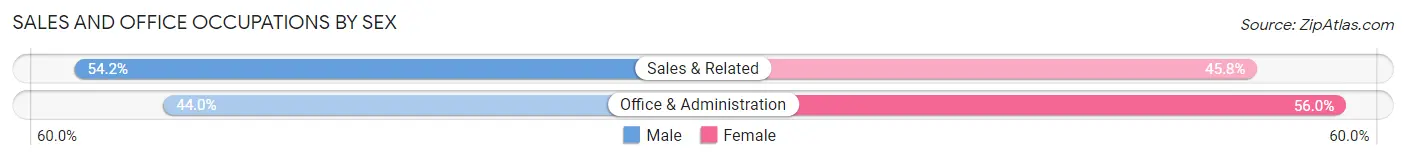
| Occupation | Male | Female |
| Sales & Related | 655 (54.2%) | 553 (45.8%) |
| Office & Administration | 355 (44.0%) | 452 (56.0%) |
| Total (Category) | 1,010 (50.1%) | 1,005 (49.9%) |
| Total (Overall) | 5,849 (53.9%) | 4,998 (46.1%) |
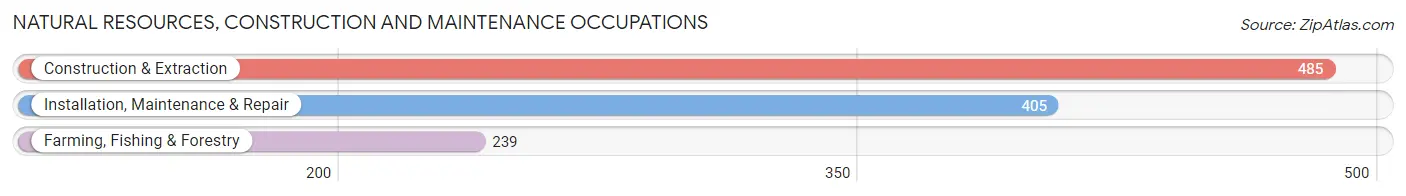
Natural Resources, Construction and Maintenance Occupations
The most common Natural Resources, Construction and Maintenance occupations in Corsicana are Construction & Extraction (485 | 4.5%), Installation, Maintenance & Repair (405 | 3.7%), and Farming, Fishing & Forestry (239 | 2.2%).
Natural Resources, Construction and Maintenance Occupations by Sex
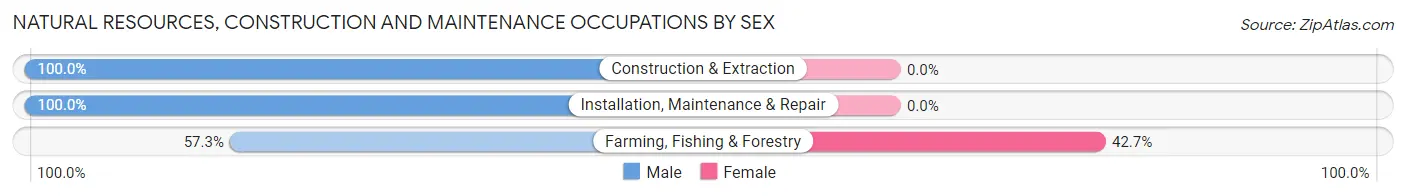
| Occupation | Male | Female |
| Farming, Fishing & Forestry | 137 (57.3%) | 102 (42.7%) |
| Construction & Extraction | 485 (100.0%) | 0 (0.0%) |
| Installation, Maintenance & Repair | 405 (100.0%) | 0 (0.0%) |
| Total (Category) | 1,027 (91.0%) | 102 (9.0%) |
| Total (Overall) | 5,849 (53.9%) | 4,998 (46.1%) |
Production, Transportation and Moving Occupations
The most common Production, Transportation and Moving occupations in Corsicana are Production (1,745 | 16.1%), Material Moving (1,093 | 10.1%), and Transportation (294 | 2.7%).
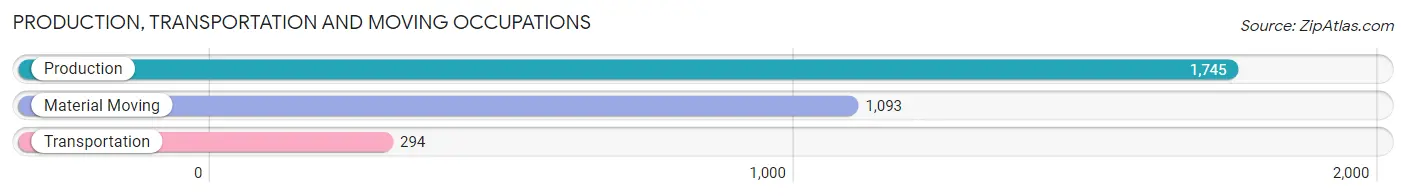
Production, Transportation and Moving Occupations by Sex
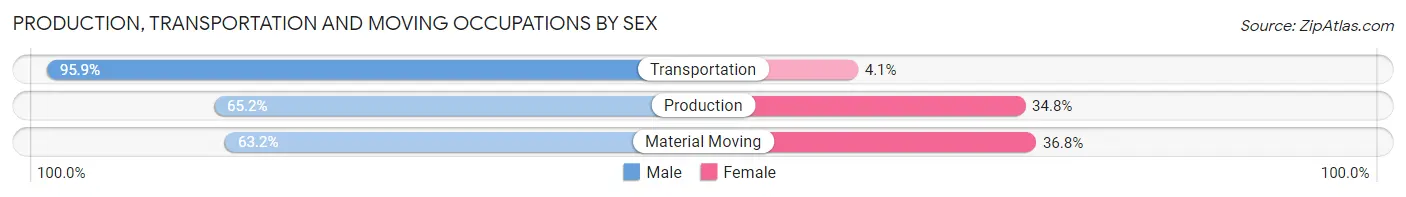
| Occupation | Male | Female |
| Production | 1,138 (65.2%) | 607 (34.8%) |
| Transportation | 282 (95.9%) | 12 (4.1%) |
| Material Moving | 691 (63.2%) | 402 (36.8%) |
| Total (Category) | 2,111 (67.4%) | 1,021 (32.6%) |
| Total (Overall) | 5,849 (53.9%) | 4,998 (46.1%) |
Employment Industries by Sex in Corsicana
Employment Industries in Corsicana
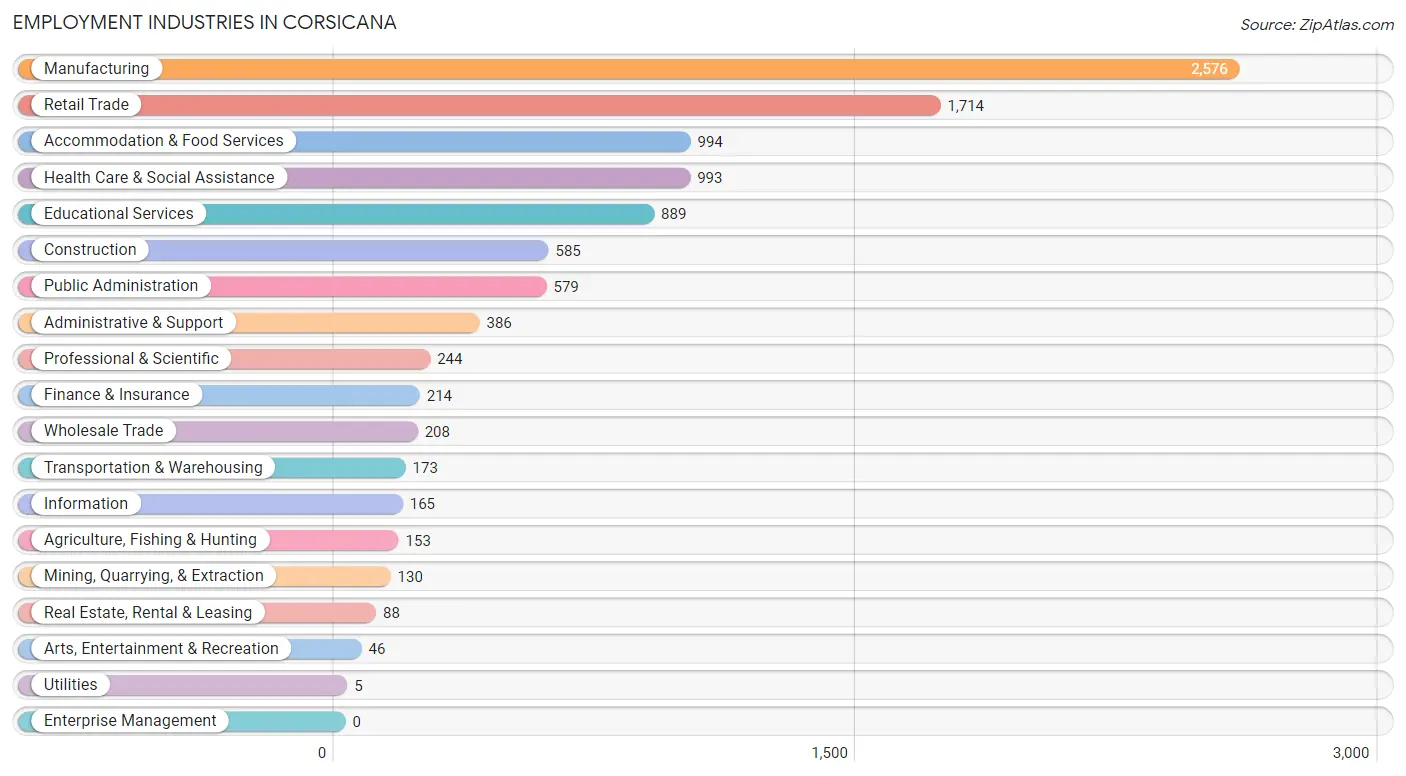
The major employment industries in Corsicana include Manufacturing (2,576 | 23.7%), Retail Trade (1,714 | 15.8%), Accommodation & Food Services (994 | 9.2%), Health Care & Social Assistance (993 | 9.1%), and Educational Services (889 | 8.2%).
Employment Industries by Sex in Corsicana
The Corsicana industries that see more men than women are Utilities (100.0%), Construction (99.2%), and Wholesale Trade (97.1%), whereas the industries that tend to have a higher number of women are Educational Services (80.2%), Health Care & Social Assistance (79.1%), and Arts, Entertainment & Recreation (73.9%).
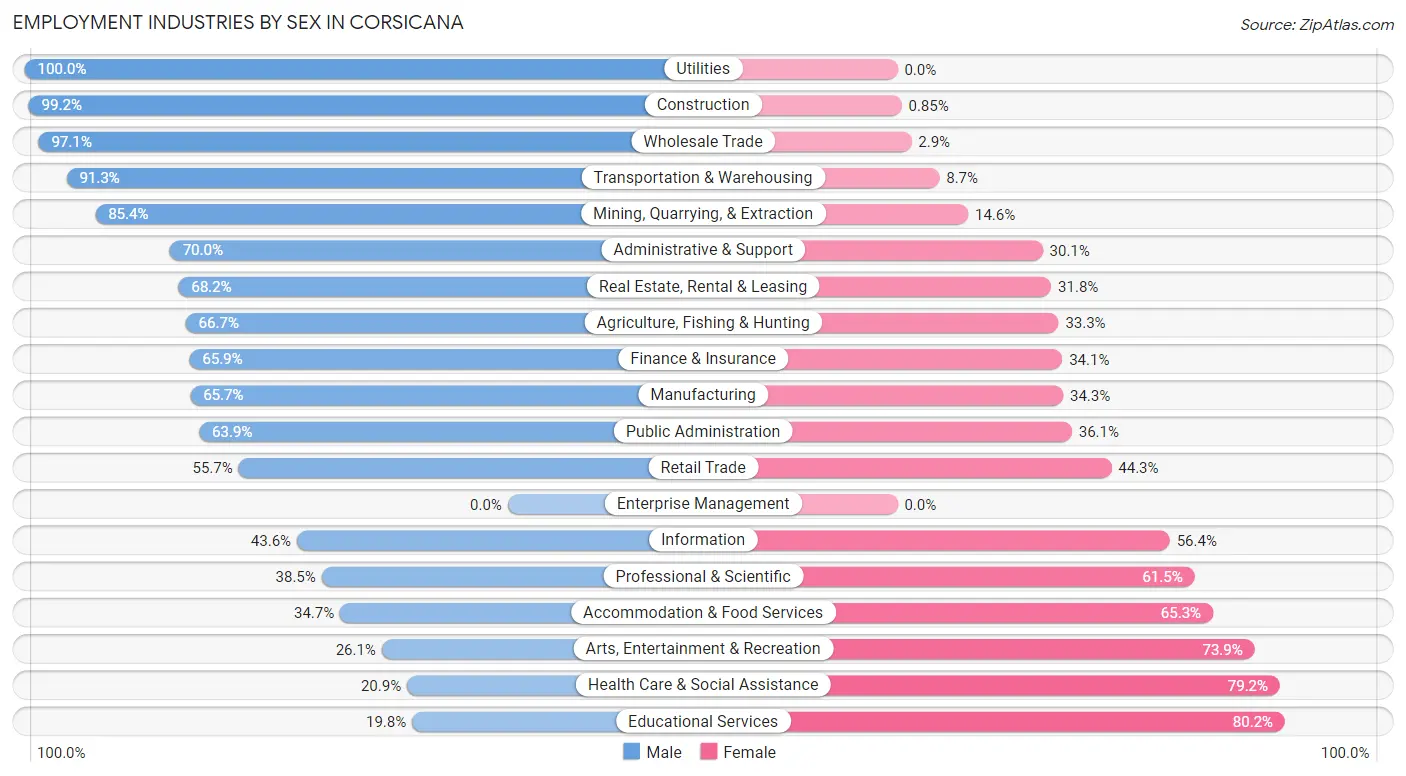
| Industry | Male | Female |
| Agriculture, Fishing & Hunting | 102 (66.7%) | 51 (33.3%) |
| Mining, Quarrying, & Extraction | 111 (85.4%) | 19 (14.6%) |
| Construction | 580 (99.2%) | 5 (0.9%) |
| Manufacturing | 1,693 (65.7%) | 883 (34.3%) |
| Wholesale Trade | 202 (97.1%) | 6 (2.9%) |
| Retail Trade | 955 (55.7%) | 759 (44.3%) |
| Transportation & Warehousing | 158 (91.3%) | 15 (8.7%) |
| Utilities | 5 (100.0%) | 0 (0.0%) |
| Information | 72 (43.6%) | 93 (56.4%) |
| Finance & Insurance | 141 (65.9%) | 73 (34.1%) |
| Real Estate, Rental & Leasing | 60 (68.2%) | 28 (31.8%) |
| Professional & Scientific | 94 (38.5%) | 150 (61.5%) |
| Enterprise Management | 0 (0.0%) | 0 (0.0%) |
| Administrative & Support | 270 (70.0%) | 116 (30.0%) |
| Educational Services | 176 (19.8%) | 713 (80.2%) |
| Health Care & Social Assistance | 207 (20.8%) | 786 (79.1%) |
| Arts, Entertainment & Recreation | 12 (26.1%) | 34 (73.9%) |
| Accommodation & Food Services | 345 (34.7%) | 649 (65.3%) |
| Public Administration | 370 (63.9%) | 209 (36.1%) |
| Total | 5,849 (53.9%) | 4,998 (46.1%) |
Education in Corsicana
School Enrollment in Corsicana
The most common levels of schooling among the 6,209 students in Corsicana are elementary school (1,606 | 25.9%), middle school (1,475 | 23.8%), and college / undergraduate (1,133 | 18.2%).
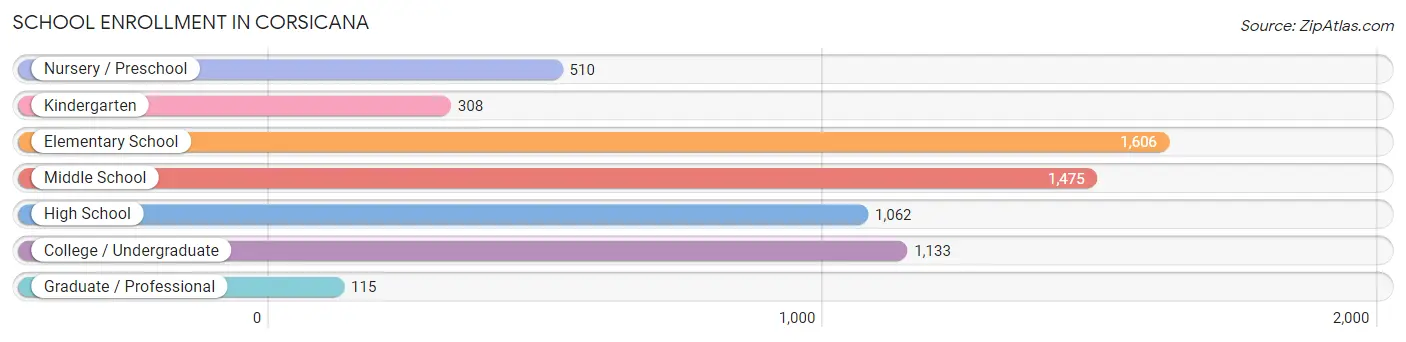
| School Level | # Students | % Students |
| Nursery / Preschool | 510 | 8.2% |
| Kindergarten | 308 | 5.0% |
| Elementary School | 1,606 | 25.9% |
| Middle School | 1,475 | 23.8% |
| High School | 1,062 | 17.1% |
| College / Undergraduate | 1,133 | 18.2% |
| Graduate / Professional | 115 | 1.8% |
| Total | 6,209 | 100.0% |
School Enrollment by Age by Funding Source in Corsicana
Out of a total of 6,209 students who are enrolled in schools in Corsicana, 435 (7.0%) attend a private institution, while the remaining 5,774 (93.0%) are enrolled in public schools. The age group of 25 to 34 year olds has the highest likelihood of being enrolled in private schools, with 145 (59.7% in the age bracket) enrolled. Conversely, the age group of 15 to 17 year olds has the lowest likelihood of being enrolled in a private school, with 809 (100.0% in the age bracket) attending a public institution.
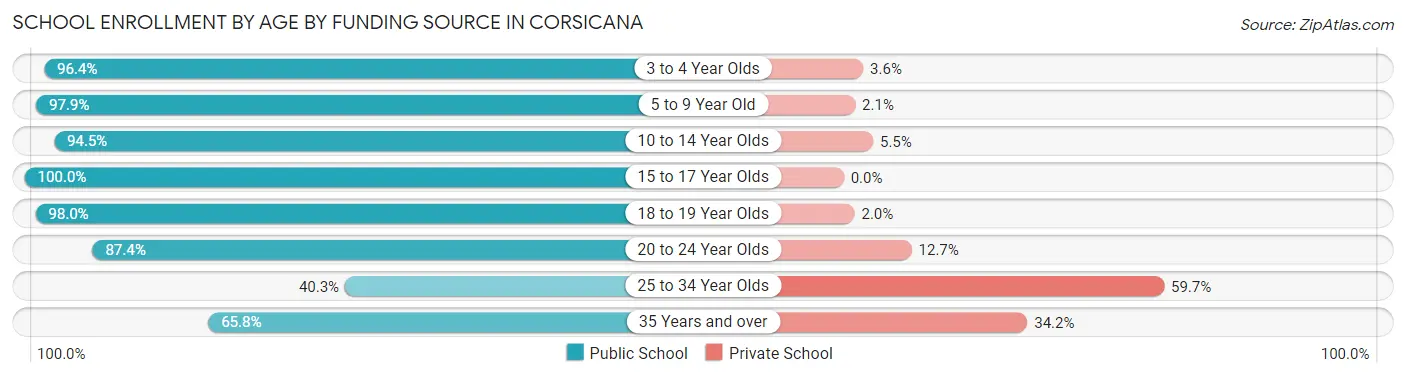
| Age Bracket | Public School | Private School |
| 3 to 4 Year Olds | 345 (96.4%) | 13 (3.6%) |
| 5 to 9 Year Old | 1,833 (97.9%) | 40 (2.1%) |
| 10 to 14 Year Olds | 1,675 (94.5%) | 97 (5.5%) |
| 15 to 17 Year Olds | 809 (100.0%) | 0 (0.0%) |
| 18 to 19 Year Olds | 339 (98.0%) | 7 (2.0%) |
| 20 to 24 Year Olds | 573 (87.4%) | 83 (12.7%) |
| 25 to 34 Year Olds | 98 (40.3%) | 145 (59.7%) |
| 35 Years and over | 100 (65.8%) | 52 (34.2%) |
| Total | 5,774 (93.0%) | 435 (7.0%) |
Educational Attainment by Field of Study in Corsicana
Business (598 | 24.6%), education (381 | 15.7%), science & technology (324 | 13.3%), physical & health sciences (164 | 6.8%), and bio, nature & agricultural (156 | 6.4%) are the most common fields of study among 2,430 individuals in Corsicana who have obtained a bachelor's degree or higher.
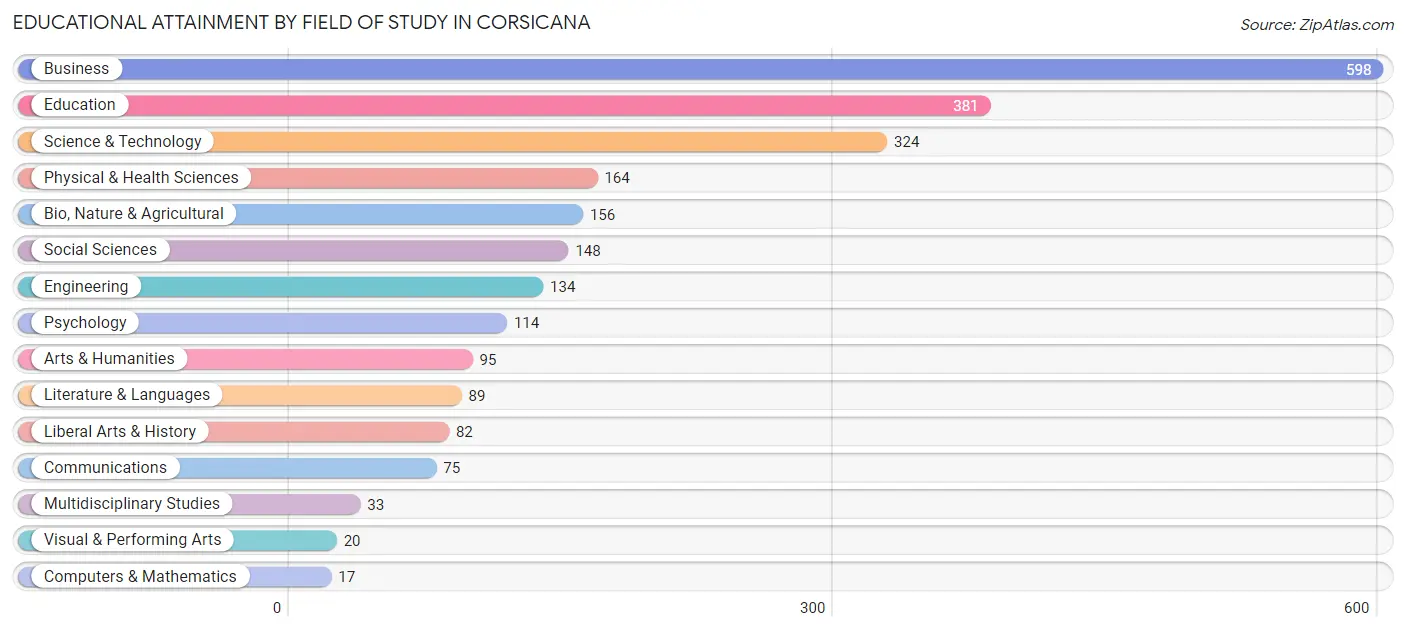
| Field of Study | # Graduates | % Graduates |
| Computers & Mathematics | 17 | 0.7% |
| Bio, Nature & Agricultural | 156 | 6.4% |
| Physical & Health Sciences | 164 | 6.8% |
| Psychology | 114 | 4.7% |
| Social Sciences | 148 | 6.1% |
| Engineering | 134 | 5.5% |
| Multidisciplinary Studies | 33 | 1.4% |
| Science & Technology | 324 | 13.3% |
| Business | 598 | 24.6% |
| Education | 381 | 15.7% |
| Literature & Languages | 89 | 3.7% |
| Liberal Arts & History | 82 | 3.4% |
| Visual & Performing Arts | 20 | 0.8% |
| Communications | 75 | 3.1% |
| Arts & Humanities | 95 | 3.9% |
| Total | 2,430 | 100.0% |
Transportation & Commute in Corsicana
Vehicle Availability by Sex in Corsicana
The most prevalent vehicle ownership categories in Corsicana are males with 2 vehicles (1,954, accounting for 34.5%) and females with 2 vehicles (1,673, making up 42.5%).
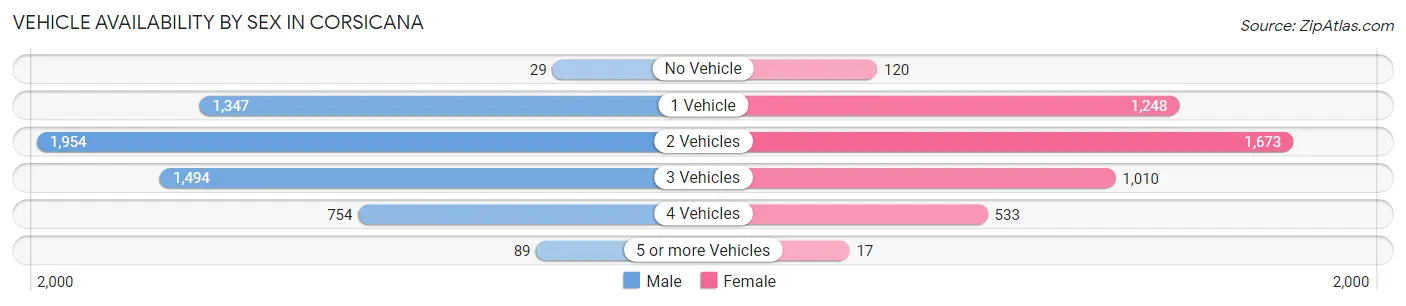
| Vehicles Available | Male | Female |
| No Vehicle | 29 (0.5%) | 120 (2.6%) |
| 1 Vehicle | 1,347 (23.8%) | 1,248 (27.1%) |
| 2 Vehicles | 1,954 (34.5%) | 1,673 (36.4%) |
| 3 Vehicles | 1,494 (26.4%) | 1,010 (22.0%) |
| 4 Vehicles | 754 (13.3%) | 533 (11.6%) |
| 5 or more Vehicles | 89 (1.6%) | 17 (0.4%) |
| Total | 5,667 (100.0%) | 4,601 (100.0%) |
Commute Time in Corsicana
The most frequently occuring commute durations in Corsicana are 5 to 9 minutes (3,048 commuters, 30.4%), 10 to 14 minutes (2,017 commuters, 20.1%), and 15 to 19 minutes (1,775 commuters, 17.7%).
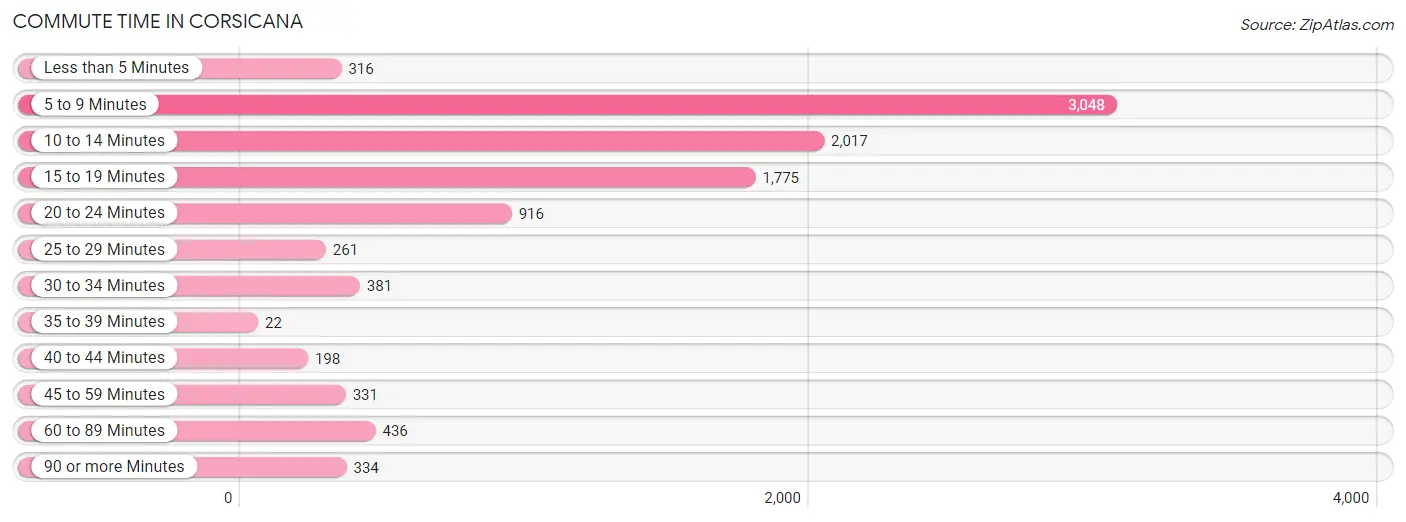
| Commute Time | # Commuters | % Commuters |
| Less than 5 Minutes | 316 | 3.2% |
| 5 to 9 Minutes | 3,048 | 30.4% |
| 10 to 14 Minutes | 2,017 | 20.1% |
| 15 to 19 Minutes | 1,775 | 17.7% |
| 20 to 24 Minutes | 916 | 9.1% |
| 25 to 29 Minutes | 261 | 2.6% |
| 30 to 34 Minutes | 381 | 3.8% |
| 35 to 39 Minutes | 22 | 0.2% |
| 40 to 44 Minutes | 198 | 2.0% |
| 45 to 59 Minutes | 331 | 3.3% |
| 60 to 89 Minutes | 436 | 4.3% |
| 90 or more Minutes | 334 | 3.3% |
Commute Time by Sex in Corsicana
The most common commute times in Corsicana are 5 to 9 minutes (1,622 commuters, 29.2%) for males and 5 to 9 minutes (1,426 commuters, 31.8%) for females.
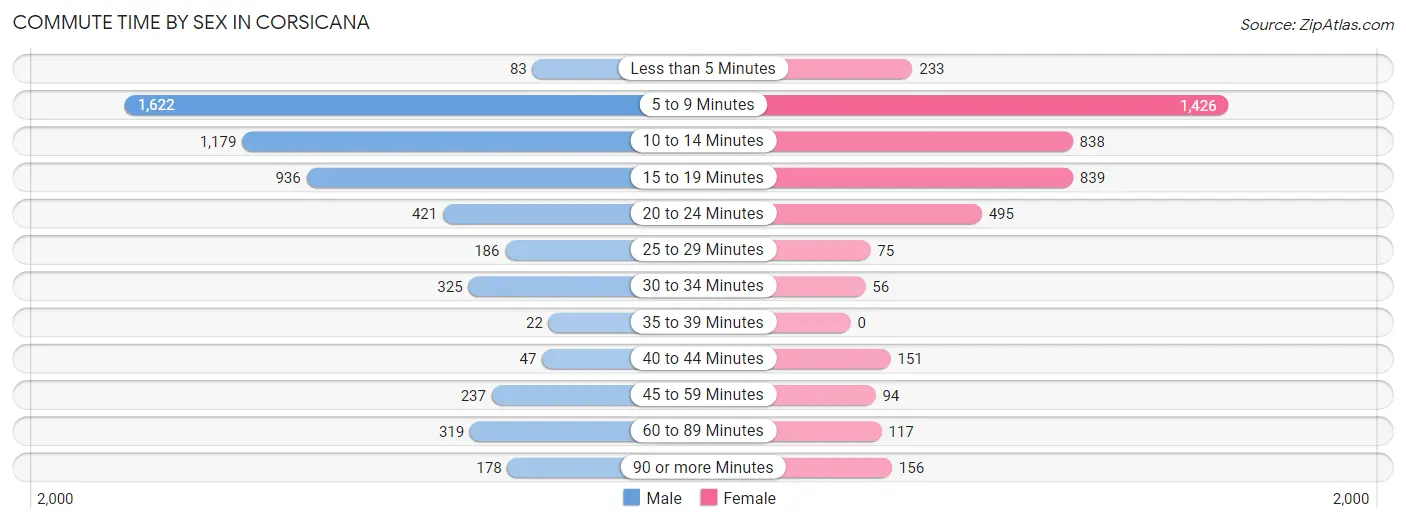
| Commute Time | Male | Female |
| Less than 5 Minutes | 83 (1.5%) | 233 (5.2%) |
| 5 to 9 Minutes | 1,622 (29.2%) | 1,426 (31.8%) |
| 10 to 14 Minutes | 1,179 (21.2%) | 838 (18.7%) |
| 15 to 19 Minutes | 936 (16.9%) | 839 (18.7%) |
| 20 to 24 Minutes | 421 (7.6%) | 495 (11.1%) |
| 25 to 29 Minutes | 186 (3.4%) | 75 (1.7%) |
| 30 to 34 Minutes | 325 (5.9%) | 56 (1.3%) |
| 35 to 39 Minutes | 22 (0.4%) | 0 (0.0%) |
| 40 to 44 Minutes | 47 (0.9%) | 151 (3.4%) |
| 45 to 59 Minutes | 237 (4.3%) | 94 (2.1%) |
| 60 to 89 Minutes | 319 (5.7%) | 117 (2.6%) |
| 90 or more Minutes | 178 (3.2%) | 156 (3.5%) |
Time of Departure to Work by Sex in Corsicana
The most frequent times of departure to work in Corsicana are 12:00 AM to 4:59 AM (830, 14.9%) for males and 7:00 AM to 7:29 AM (798, 17.8%) for females.
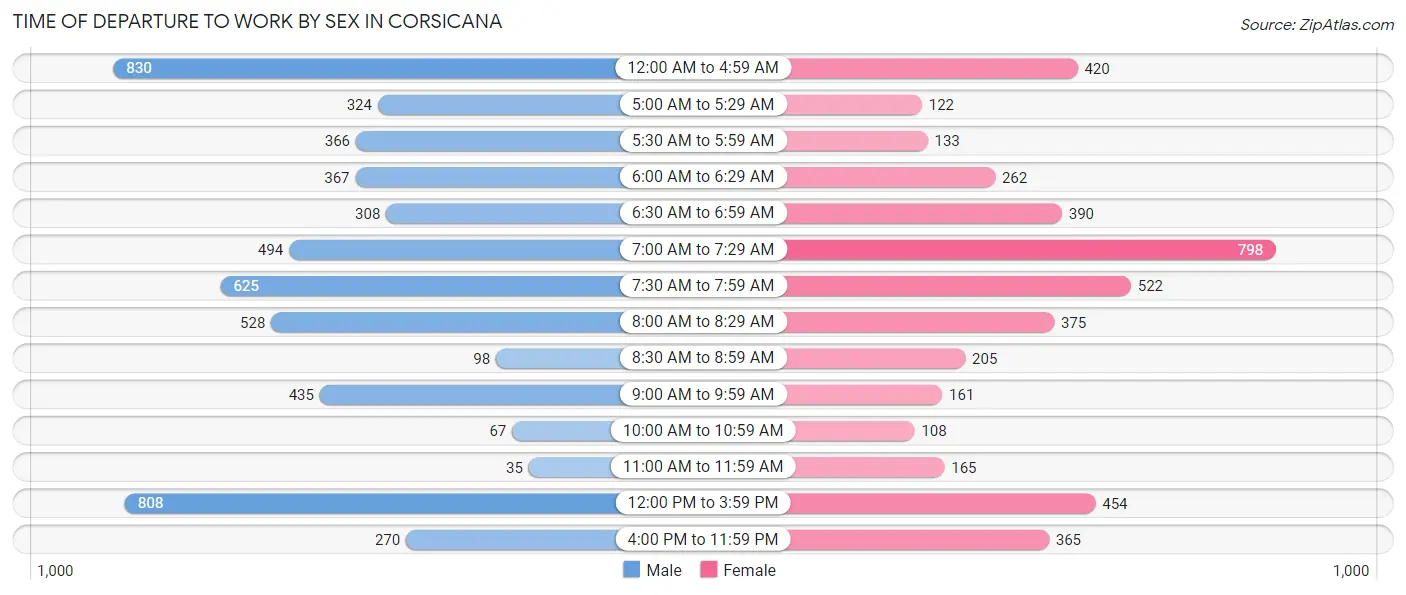
| Time of Departure | Male | Female |
| 12:00 AM to 4:59 AM | 830 (14.9%) | 420 (9.4%) |
| 5:00 AM to 5:29 AM | 324 (5.8%) | 122 (2.7%) |
| 5:30 AM to 5:59 AM | 366 (6.6%) | 133 (3.0%) |
| 6:00 AM to 6:29 AM | 367 (6.6%) | 262 (5.9%) |
| 6:30 AM to 6:59 AM | 308 (5.5%) | 390 (8.7%) |
| 7:00 AM to 7:29 AM | 494 (8.9%) | 798 (17.8%) |
| 7:30 AM to 7:59 AM | 625 (11.3%) | 522 (11.7%) |
| 8:00 AM to 8:29 AM | 528 (9.5%) | 375 (8.4%) |
| 8:30 AM to 8:59 AM | 98 (1.8%) | 205 (4.6%) |
| 9:00 AM to 9:59 AM | 435 (7.8%) | 161 (3.6%) |
| 10:00 AM to 10:59 AM | 67 (1.2%) | 108 (2.4%) |
| 11:00 AM to 11:59 AM | 35 (0.6%) | 165 (3.7%) |
| 12:00 PM to 3:59 PM | 808 (14.5%) | 454 (10.1%) |
| 4:00 PM to 11:59 PM | 270 (4.9%) | 365 (8.2%) |
| Total | 5,555 (100.0%) | 4,480 (100.0%) |
Housing Occupancy in Corsicana
Occupancy by Ownership in Corsicana
Of the total 8,610 dwellings in Corsicana, owner-occupied units account for 4,674 (54.3%), while renter-occupied units make up 3,936 (45.7%).
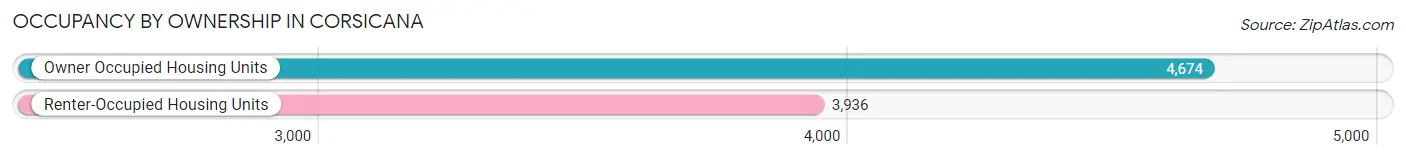
| Occupancy | # Housing Units | % Housing Units |
| Owner Occupied Housing Units | 4,674 | 54.3% |
| Renter-Occupied Housing Units | 3,936 | 45.7% |
| Total Occupied Housing Units | 8,610 | 100.0% |
Occupancy by Household Size in Corsicana
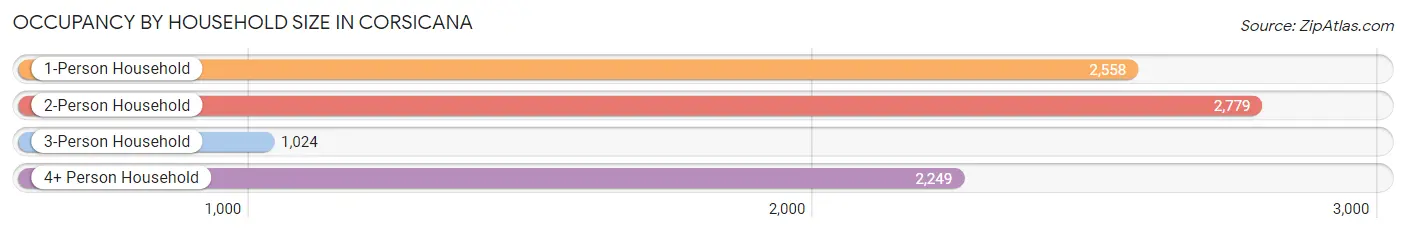
| Household Size | # Housing Units | % Housing Units |
| 1-Person Household | 2,558 | 29.7% |
| 2-Person Household | 2,779 | 32.3% |
| 3-Person Household | 1,024 | 11.9% |
| 4+ Person Household | 2,249 | 26.1% |
| Total Housing Units | 8,610 | 100.0% |
Occupancy by Ownership by Household Size in Corsicana
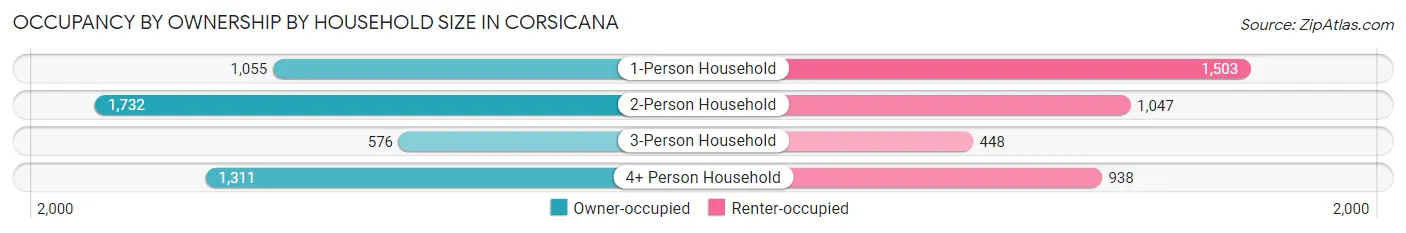
| Household Size | Owner-occupied | Renter-occupied |
| 1-Person Household | 1,055 (41.2%) | 1,503 (58.8%) |
| 2-Person Household | 1,732 (62.3%) | 1,047 (37.7%) |
| 3-Person Household | 576 (56.2%) | 448 (43.8%) |
| 4+ Person Household | 1,311 (58.3%) | 938 (41.7%) |
| Total Housing Units | 4,674 (54.3%) | 3,936 (45.7%) |
Occupancy by Educational Attainment in Corsicana
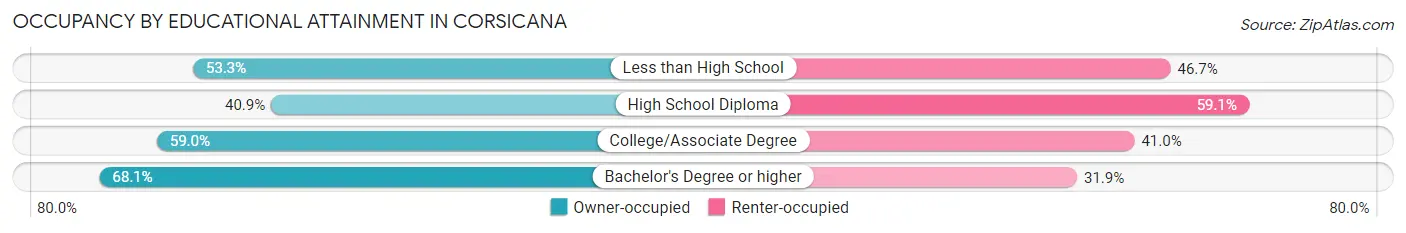
| Household Size | Owner-occupied | Renter-occupied |
| Less than High School | 917 (53.3%) | 803 (46.7%) |
| High School Diploma | 979 (40.9%) | 1,414 (59.1%) |
| College/Associate Degree | 1,856 (59.0%) | 1,288 (41.0%) |
| Bachelor's Degree or higher | 922 (68.1%) | 431 (31.9%) |
Occupancy by Age of Householder in Corsicana
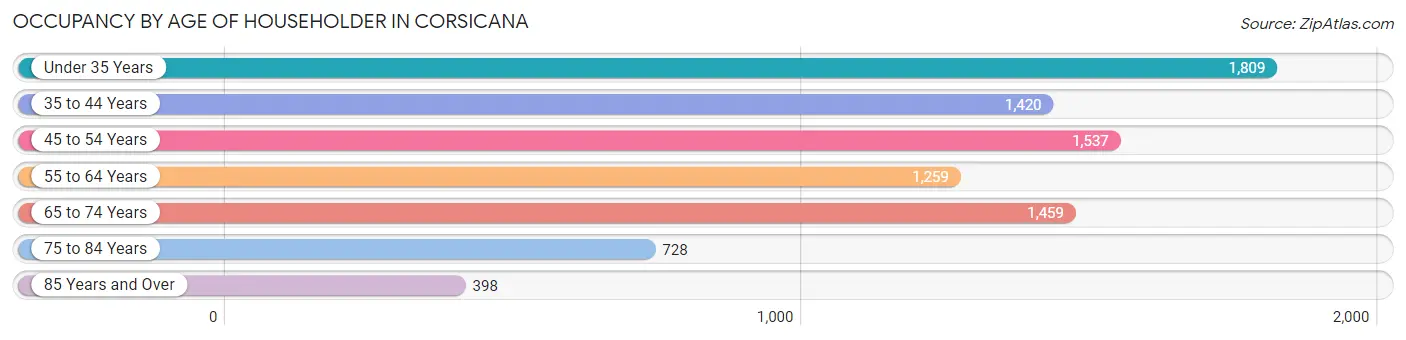
| Age Bracket | # Households | % Households |
| Under 35 Years | 1,809 | 21.0% |
| 35 to 44 Years | 1,420 | 16.5% |
| 45 to 54 Years | 1,537 | 17.8% |
| 55 to 64 Years | 1,259 | 14.6% |
| 65 to 74 Years | 1,459 | 17.0% |
| 75 to 84 Years | 728 | 8.5% |
| 85 Years and Over | 398 | 4.6% |
| Total | 8,610 | 100.0% |
Housing Finances in Corsicana
Median Income by Occupancy in Corsicana
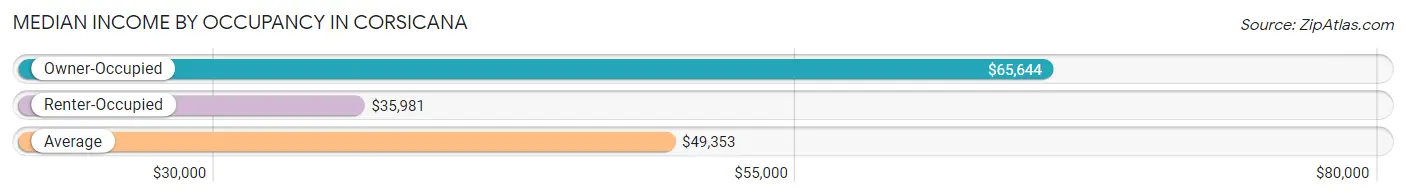
| Occupancy Type | # Households | Median Income |
| Owner-Occupied | 4,674 (54.3%) | $65,644 |
| Renter-Occupied | 3,936 (45.7%) | $35,981 |
| Average | 8,610 (100.0%) | $49,353 |
Occupancy by Householder Income Bracket in Corsicana
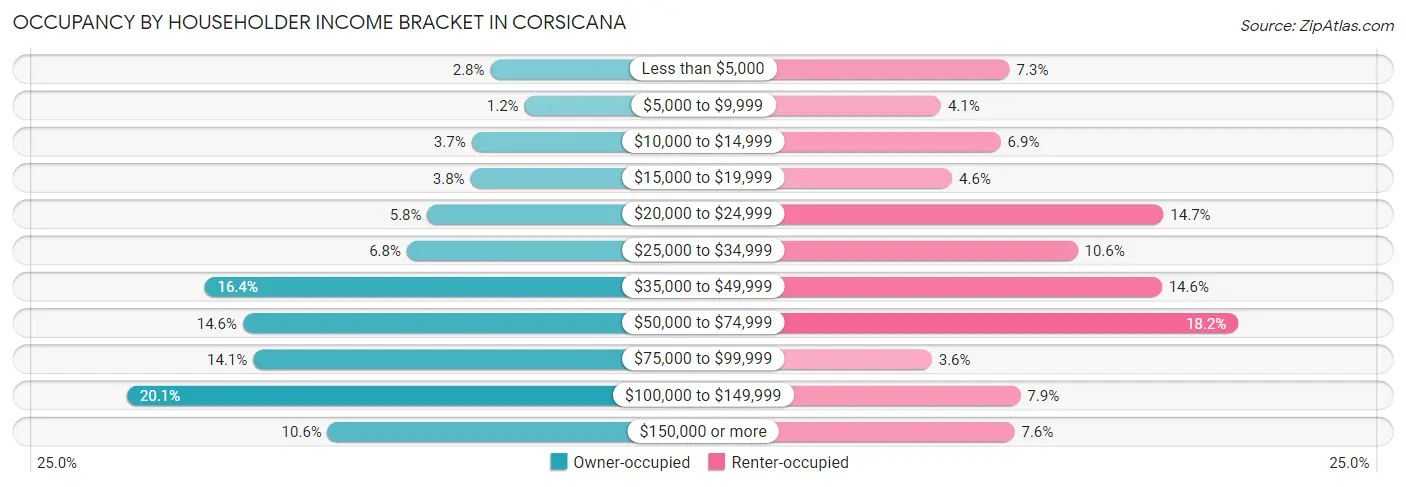
| Income Bracket | Owner-occupied | Renter-occupied |
| Less than $5,000 | 132 (2.8%) | 289 (7.3%) |
| $5,000 to $9,999 | 56 (1.2%) | 160 (4.1%) |
| $10,000 to $14,999 | 174 (3.7%) | 272 (6.9%) |
| $15,000 to $19,999 | 176 (3.8%) | 181 (4.6%) |
| $20,000 to $24,999 | 272 (5.8%) | 577 (14.7%) |
| $25,000 to $34,999 | 318 (6.8%) | 416 (10.6%) |
| $35,000 to $49,999 | 768 (16.4%) | 574 (14.6%) |
| $50,000 to $74,999 | 683 (14.6%) | 717 (18.2%) |
| $75,000 to $99,999 | 660 (14.1%) | 143 (3.6%) |
| $100,000 to $149,999 | 941 (20.1%) | 309 (7.9%) |
| $150,000 or more | 494 (10.6%) | 298 (7.6%) |
| Total | 4,674 (100.0%) | 3,936 (100.0%) |
Monthly Housing Cost Tiers in Corsicana
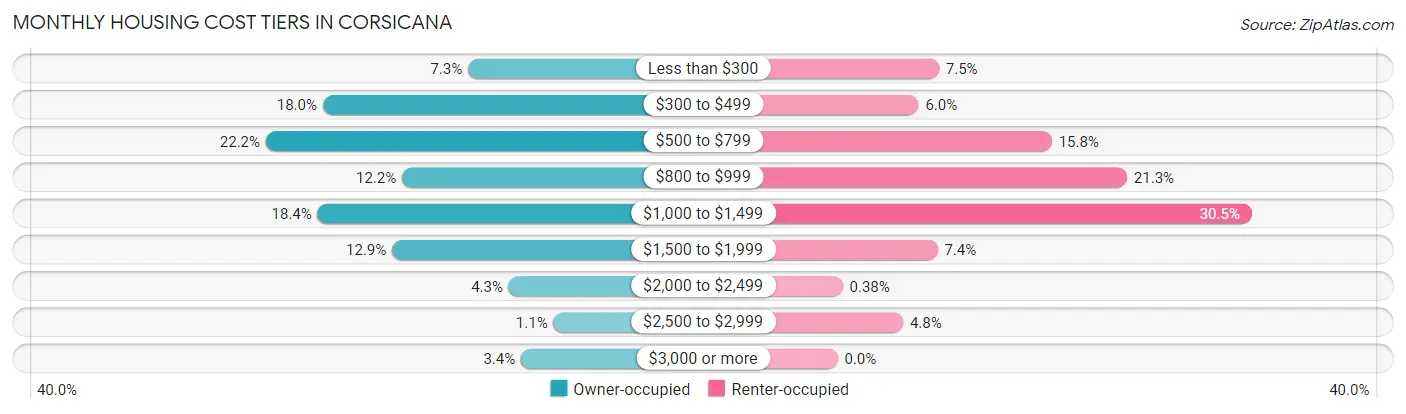
| Monthly Cost | Owner-occupied | Renter-occupied |
| Less than $300 | 343 (7.3%) | 294 (7.5%) |
| $300 to $499 | 843 (18.0%) | 235 (6.0%) |
| $500 to $799 | 1,039 (22.2%) | 621 (15.8%) |
| $800 to $999 | 570 (12.2%) | 839 (21.3%) |
| $1,000 to $1,499 | 861 (18.4%) | 1,201 (30.5%) |
| $1,500 to $1,999 | 605 (12.9%) | 290 (7.4%) |
| $2,000 to $2,499 | 203 (4.3%) | 15 (0.4%) |
| $2,500 to $2,999 | 49 (1.1%) | 190 (4.8%) |
| $3,000 or more | 161 (3.4%) | 0 (0.0%) |
| Total | 4,674 (100.0%) | 3,936 (100.0%) |
Physical Housing Characteristics in Corsicana
Housing Structures in Corsicana
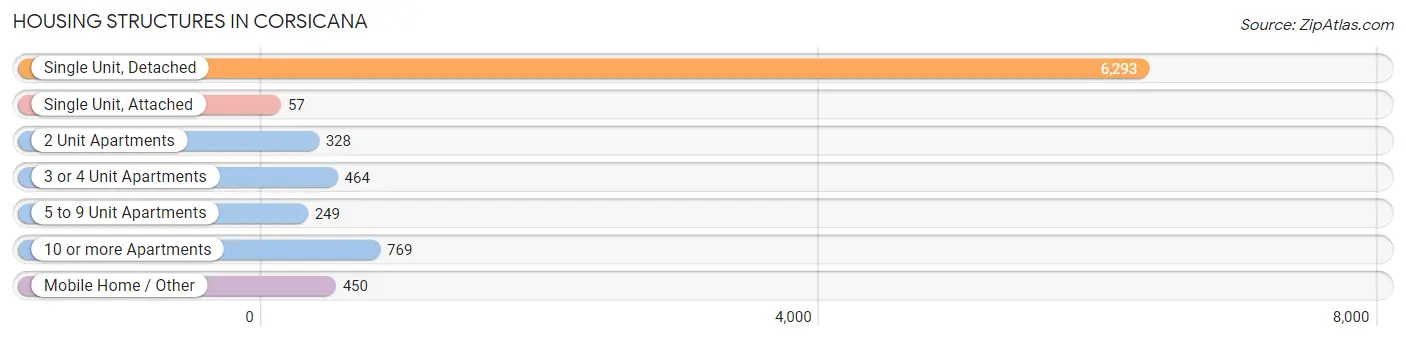
| Structure Type | # Housing Units | % Housing Units |
| Single Unit, Detached | 6,293 | 73.1% |
| Single Unit, Attached | 57 | 0.7% |
| 2 Unit Apartments | 328 | 3.8% |
| 3 or 4 Unit Apartments | 464 | 5.4% |
| 5 to 9 Unit Apartments | 249 | 2.9% |
| 10 or more Apartments | 769 | 8.9% |
| Mobile Home / Other | 450 | 5.2% |
| Total | 8,610 | 100.0% |
Housing Structures by Occupancy in Corsicana
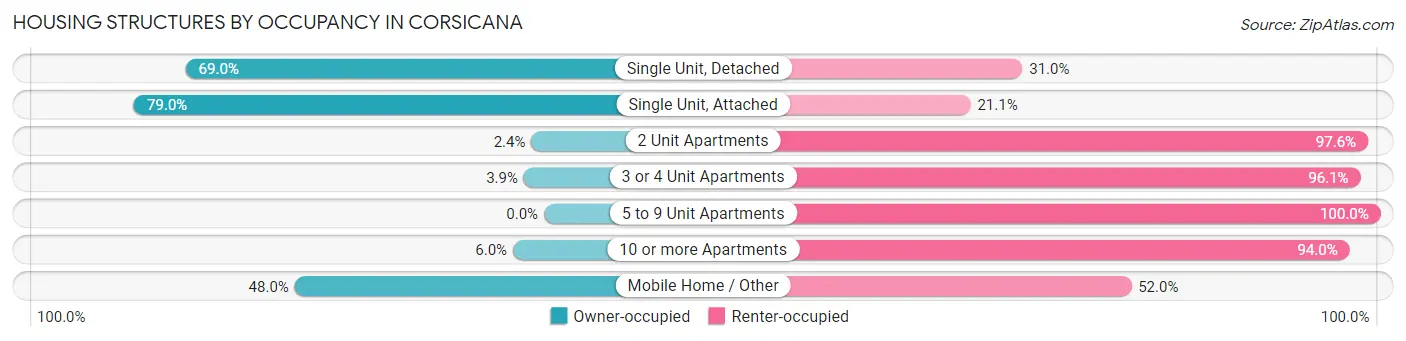
| Structure Type | Owner-occupied | Renter-occupied |
| Single Unit, Detached | 4,341 (69.0%) | 1,952 (31.0%) |
| Single Unit, Attached | 45 (78.9%) | 12 (21.0%) |
| 2 Unit Apartments | 8 (2.4%) | 320 (97.6%) |
| 3 or 4 Unit Apartments | 18 (3.9%) | 446 (96.1%) |
| 5 to 9 Unit Apartments | 0 (0.0%) | 249 (100.0%) |
| 10 or more Apartments | 46 (6.0%) | 723 (94.0%) |
| Mobile Home / Other | 216 (48.0%) | 234 (52.0%) |
| Total | 4,674 (54.3%) | 3,936 (45.7%) |
Housing Structures by Number of Rooms in Corsicana
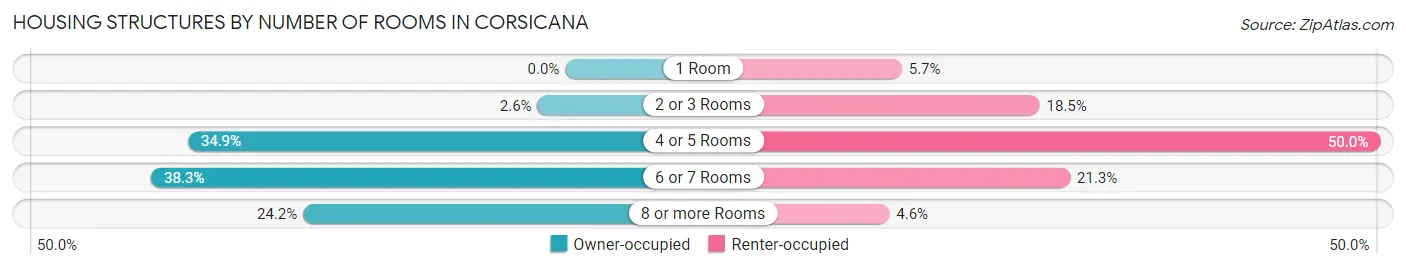
| Number of Rooms | Owner-occupied | Renter-occupied |
| 1 Room | 0 (0.0%) | 225 (5.7%) |
| 2 or 3 Rooms | 120 (2.6%) | 727 (18.5%) |
| 4 or 5 Rooms | 1,631 (34.9%) | 1,966 (49.9%) |
| 6 or 7 Rooms | 1,790 (38.3%) | 838 (21.3%) |
| 8 or more Rooms | 1,133 (24.2%) | 180 (4.6%) |
| Total | 4,674 (100.0%) | 3,936 (100.0%) |
Housing Structure by Heating Type in Corsicana
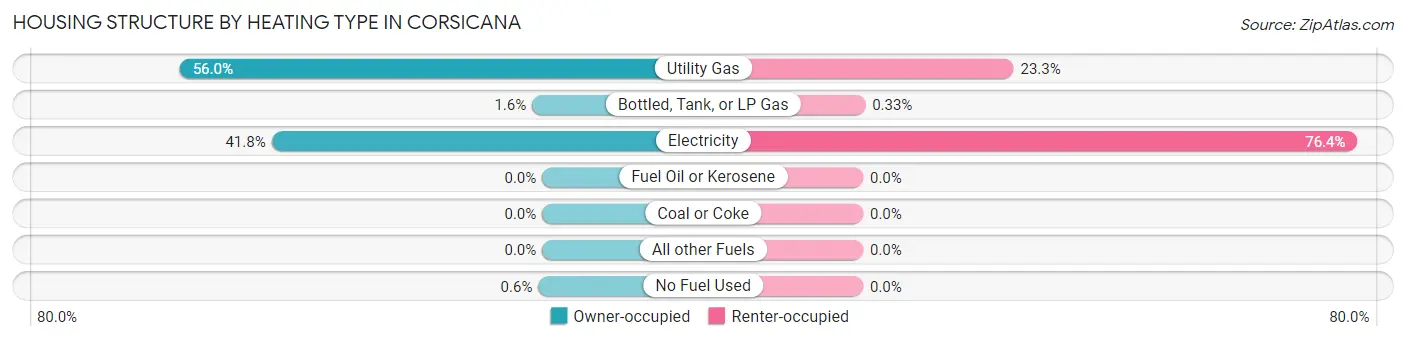
| Heating Type | Owner-occupied | Renter-occupied |
| Utility Gas | 2,618 (56.0%) | 916 (23.3%) |
| Bottled, Tank, or LP Gas | 73 (1.6%) | 13 (0.3%) |
| Electricity | 1,955 (41.8%) | 3,007 (76.4%) |
| Fuel Oil or Kerosene | 0 (0.0%) | 0 (0.0%) |
| Coal or Coke | 0 (0.0%) | 0 (0.0%) |
| All other Fuels | 0 (0.0%) | 0 (0.0%) |
| No Fuel Used | 28 (0.6%) | 0 (0.0%) |
| Total | 4,674 (100.0%) | 3,936 (100.0%) |
Household Vehicle Usage in Corsicana
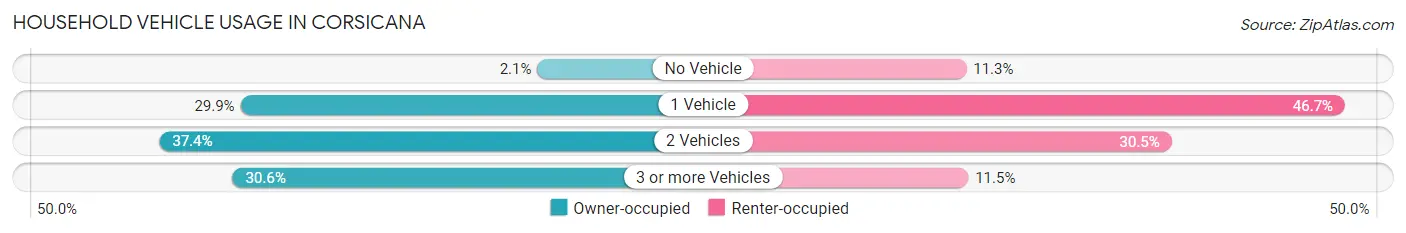
| Vehicles per Household | Owner-occupied | Renter-occupied |
| No Vehicle | 100 (2.1%) | 446 (11.3%) |
| 1 Vehicle | 1,395 (29.8%) | 1,837 (46.7%) |
| 2 Vehicles | 1,749 (37.4%) | 1,200 (30.5%) |
| 3 or more Vehicles | 1,430 (30.6%) | 453 (11.5%) |
| Total | 4,674 (100.0%) | 3,936 (100.0%) |
Real Estate & Mortgages in Corsicana
Real Estate and Mortgage Overview in Corsicana
| Characteristic | Without Mortgage | With Mortgage |
| Housing Units | 2,489 | 2,185 |
| Median Property Value | $105,600 | $174,500 |
| Median Household Income | $49,531 | $301 |
| Monthly Housing Costs | $533 | $161 |
| Real Estate Taxes | $1,582 | $157 |
Property Value by Mortgage Status in Corsicana
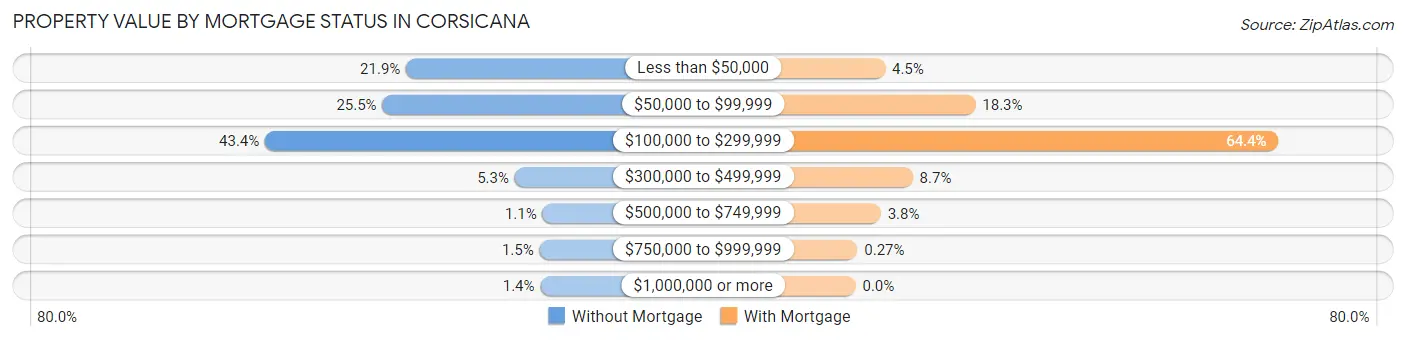
| Property Value | Without Mortgage | With Mortgage |
| Less than $50,000 | 544 (21.9%) | 98 (4.5%) |
| $50,000 to $99,999 | 634 (25.5%) | 399 (18.3%) |
| $100,000 to $299,999 | 1,079 (43.3%) | 1,408 (64.4%) |
| $300,000 to $499,999 | 132 (5.3%) | 190 (8.7%) |
| $500,000 to $749,999 | 27 (1.1%) | 84 (3.8%) |
| $750,000 to $999,999 | 38 (1.5%) | 6 (0.3%) |
| $1,000,000 or more | 35 (1.4%) | 0 (0.0%) |
| Total | 2,489 (100.0%) | 2,185 (100.0%) |
Household Income by Mortgage Status in Corsicana
| Household Income | Without Mortgage | With Mortgage |
| Less than $10,000 | 137 (5.5%) | 17 (0.8%) |
| $10,000 to $24,999 | 479 (19.2%) | 51 (2.3%) |
| $25,000 to $34,999 | 175 (7.0%) | 143 (6.5%) |
| $35,000 to $49,999 | 464 (18.6%) | 143 (6.5%) |
| $50,000 to $74,999 | 380 (15.3%) | 304 (13.9%) |
| $75,000 to $99,999 | 324 (13.0%) | 303 (13.9%) |
| $100,000 to $149,999 | 337 (13.5%) | 336 (15.4%) |
| $150,000 or more | 193 (7.7%) | 604 (27.6%) |
| Total | 2,489 (100.0%) | 2,185 (100.0%) |
Property Value to Household Income Ratio in Corsicana
| Value-to-Income Ratio | Without Mortgage | With Mortgage |
| Less than 2.0x | 1,363 (54.8%) | 83,708 (3,831.0%) |
| 2.0x to 2.9x | 285 (11.5%) | 896 (41.0%) |
| 3.0x to 3.9x | 242 (9.7%) | 729 (33.4%) |
| 4.0x or more | 592 (23.8%) | 210 (9.6%) |
| Total | 2,489 (100.0%) | 2,185 (100.0%) |
Real Estate Taxes by Mortgage Status in Corsicana
| Property Taxes | Without Mortgage | With Mortgage |
| Less than $800 | 621 (24.9%) | 0 (0.0%) |
| $800 to $1,499 | 518 (20.8%) | 116 (5.3%) |
| $800 to $1,499 | 1,237 (49.7%) | 442 (20.2%) |
| Total | 2,489 (100.0%) | 2,185 (100.0%) |
Health & Disability in Corsicana
Health Insurance Coverage by Age in Corsicana
| Age Bracket | With Coverage | Without Coverage |
| Under 6 Years | 2,136 (96.3%) | 82 (3.7%) |
| 6 to 18 Years | 3,961 (87.3%) | 577 (12.7%) |
| 19 to 25 Years | 1,945 (65.1%) | 1,042 (34.9%) |
| 26 to 34 Years | 1,914 (68.2%) | 891 (31.8%) |
| 35 to 44 Years | 2,269 (73.6%) | 814 (26.4%) |
| 45 to 54 Years | 1,686 (67.2%) | 823 (32.8%) |
| 55 to 64 Years | 2,199 (84.8%) | 395 (15.2%) |
| 65 to 74 Years | 2,173 (99.3%) | 16 (0.7%) |
| 75 Years and older | 1,483 (100.0%) | 0 (0.0%) |
| Total | 19,766 (81.0%) | 4,640 (19.0%) |
Health Insurance Coverage by Citizenship Status in Corsicana
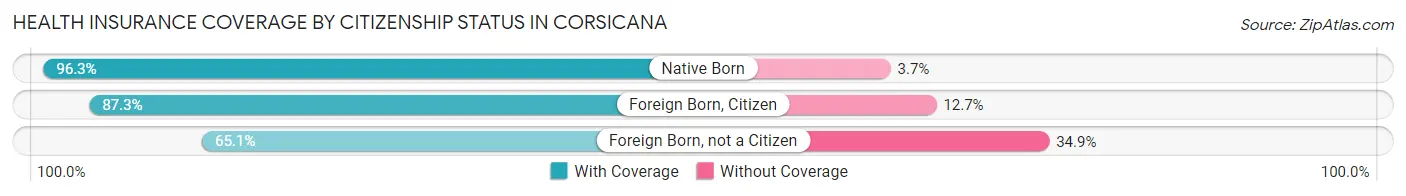
| Citizenship Status | With Coverage | Without Coverage |
| Native Born | 2,136 (96.3%) | 82 (3.7%) |
| Foreign Born, Citizen | 3,961 (87.3%) | 577 (12.7%) |
| Foreign Born, not a Citizen | 1,945 (65.1%) | 1,042 (34.9%) |
Health Insurance Coverage by Household Income in Corsicana
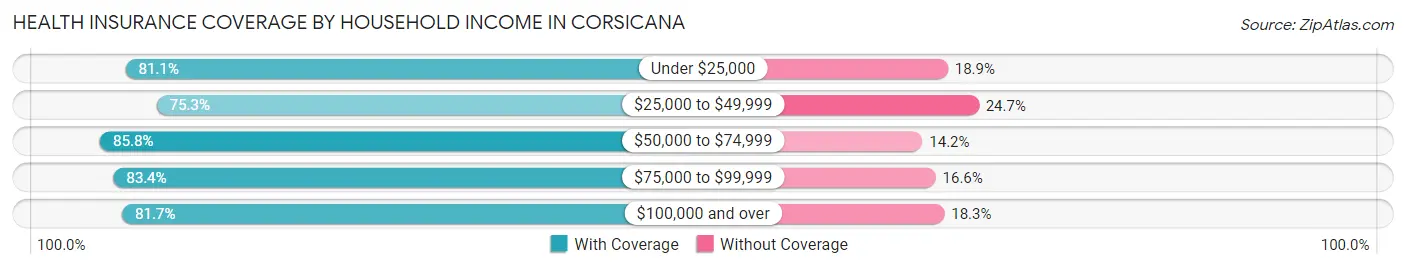
| Household Income | With Coverage | Without Coverage |
| Under $25,000 | 3,475 (81.1%) | 811 (18.9%) |
| $25,000 to $49,999 | 4,275 (75.3%) | 1,404 (24.7%) |
| $50,000 to $74,999 | 3,679 (85.8%) | 607 (14.2%) |
| $75,000 to $99,999 | 2,194 (83.4%) | 438 (16.6%) |
| $100,000 and over | 5,882 (81.7%) | 1,315 (18.3%) |
Public vs Private Health Insurance Coverage by Age in Corsicana
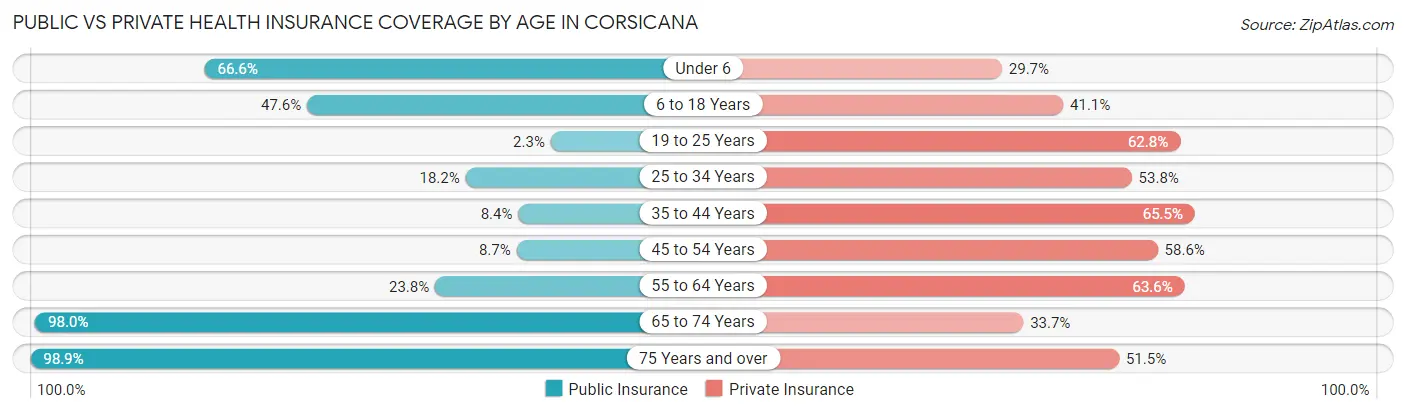
| Age Bracket | Public Insurance | Private Insurance |
| Under 6 | 1,477 (66.6%) | 659 (29.7%) |
| 6 to 18 Years | 2,159 (47.6%) | 1,864 (41.1%) |
| 19 to 25 Years | 70 (2.3%) | 1,875 (62.8%) |
| 25 to 34 Years | 509 (18.1%) | 1,509 (53.8%) |
| 35 to 44 Years | 258 (8.4%) | 2,020 (65.5%) |
| 45 to 54 Years | 218 (8.7%) | 1,471 (58.6%) |
| 55 to 64 Years | 618 (23.8%) | 1,650 (63.6%) |
| 65 to 74 Years | 2,146 (98.0%) | 737 (33.7%) |
| 75 Years and over | 1,467 (98.9%) | 763 (51.4%) |
| Total | 8,922 (36.6%) | 12,548 (51.4%) |
Disability Status by Sex by Age in Corsicana
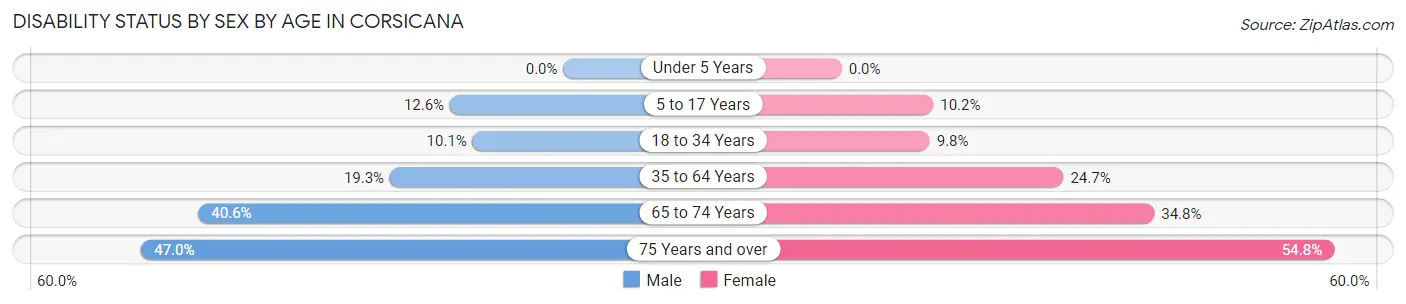
| Age Bracket | Male | Female |
| Under 5 Years | 0 (0.0%) | 0 (0.0%) |
| 5 to 17 Years | 332 (12.6%) | 190 (10.2%) |
| 18 to 34 Years | 332 (10.1%) | 284 (9.8%) |
| 35 to 64 Years | 786 (19.3%) | 1,016 (24.7%) |
| 65 to 74 Years | 371 (40.6%) | 444 (34.8%) |
| 75 Years and over | 204 (47.0%) | 575 (54.8%) |
Disability Class by Sex by Age in Corsicana
Disability Class: Hearing Difficulty
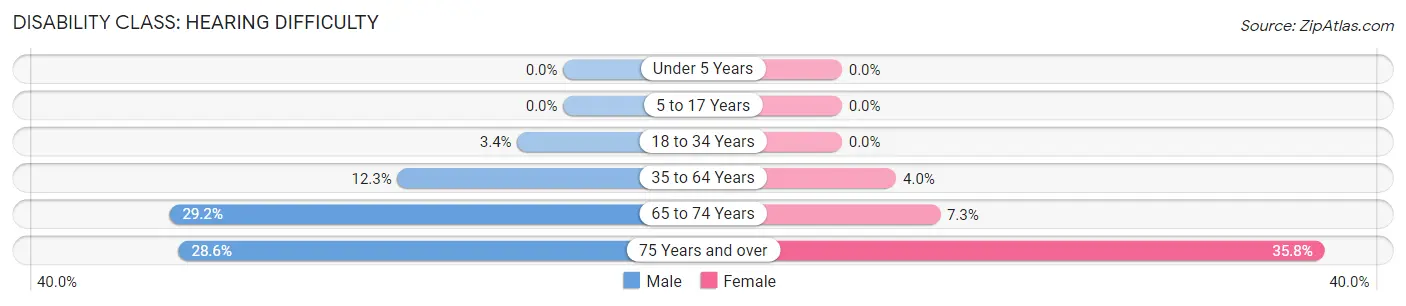
| Age Bracket | Male | Female |
| Under 5 Years | 0 (0.0%) | 0 (0.0%) |
| 5 to 17 Years | 0 (0.0%) | 0 (0.0%) |
| 18 to 34 Years | 112 (3.4%) | 0 (0.0%) |
| 35 to 64 Years | 501 (12.3%) | 166 (4.0%) |
| 65 to 74 Years | 267 (29.2%) | 93 (7.3%) |
| 75 Years and over | 124 (28.6%) | 376 (35.8%) |
Disability Class: Vision Difficulty
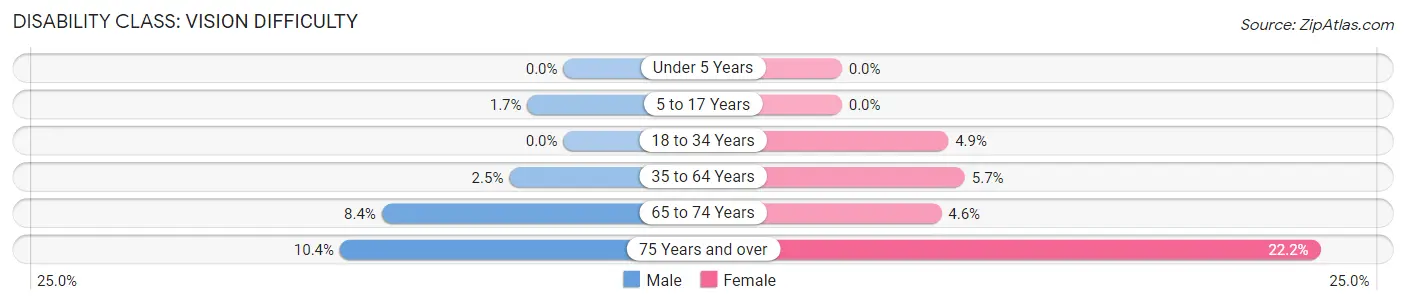
| Age Bracket | Male | Female |
| Under 5 Years | 0 (0.0%) | 0 (0.0%) |
| 5 to 17 Years | 44 (1.7%) | 0 (0.0%) |
| 18 to 34 Years | 0 (0.0%) | 143 (4.9%) |
| 35 to 64 Years | 102 (2.5%) | 235 (5.7%) |
| 65 to 74 Years | 77 (8.4%) | 59 (4.6%) |
| 75 Years and over | 45 (10.4%) | 233 (22.2%) |
Disability Class: Cognitive Difficulty
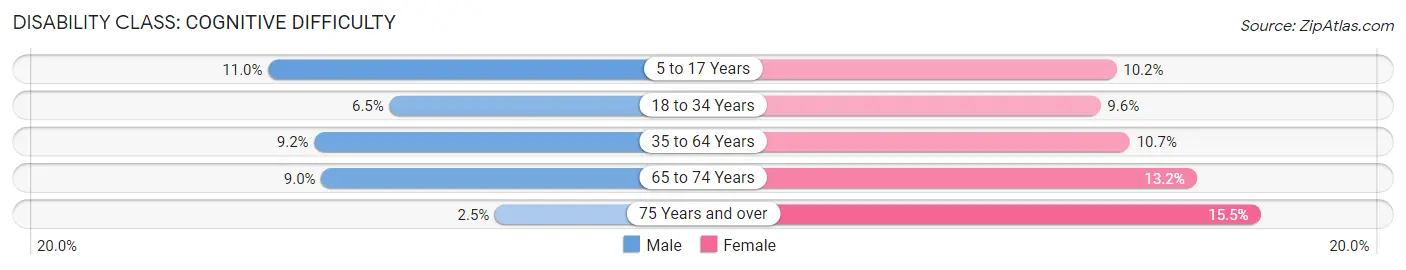
| Age Bracket | Male | Female |
| 5 to 17 Years | 288 (11.0%) | 190 (10.2%) |
| 18 to 34 Years | 212 (6.5%) | 278 (9.6%) |
| 35 to 64 Years | 376 (9.2%) | 440 (10.7%) |
| 65 to 74 Years | 82 (9.0%) | 168 (13.2%) |
| 75 Years and over | 11 (2.5%) | 163 (15.5%) |
Disability Class: Ambulatory Difficulty
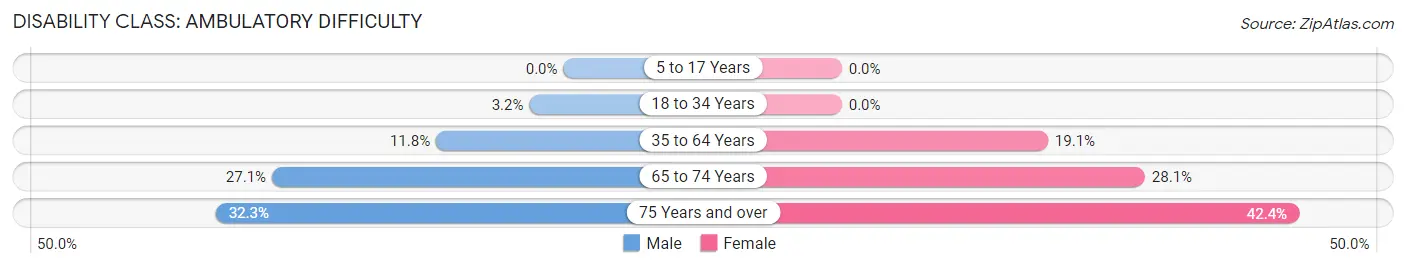
| Age Bracket | Male | Female |
| 5 to 17 Years | 0 (0.0%) | 0 (0.0%) |
| 18 to 34 Years | 104 (3.2%) | 0 (0.0%) |
| 35 to 64 Years | 481 (11.8%) | 787 (19.1%) |
| 65 to 74 Years | 247 (27.1%) | 359 (28.1%) |
| 75 Years and over | 140 (32.3%) | 445 (42.4%) |
Disability Class: Self-Care Difficulty
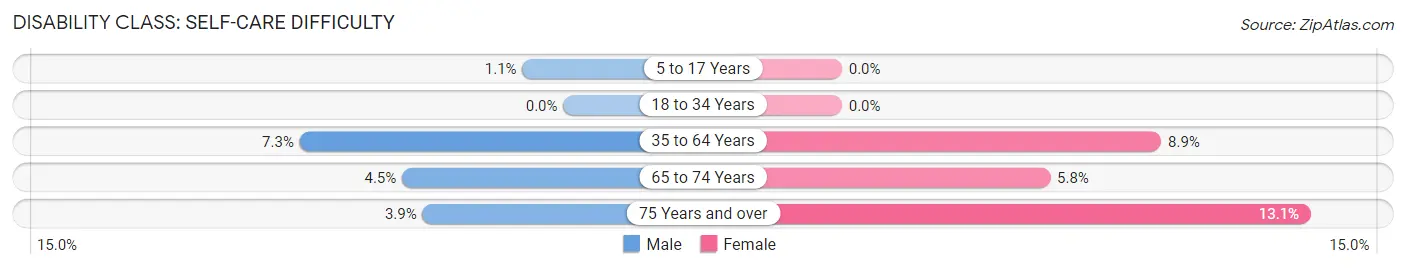
| Age Bracket | Male | Female |
| 5 to 17 Years | 30 (1.1%) | 0 (0.0%) |
| 18 to 34 Years | 0 (0.0%) | 0 (0.0%) |
| 35 to 64 Years | 299 (7.3%) | 366 (8.9%) |
| 65 to 74 Years | 41 (4.5%) | 74 (5.8%) |
| 75 Years and over | 17 (3.9%) | 137 (13.1%) |
Technology Access in Corsicana
Computing Device Access in Corsicana
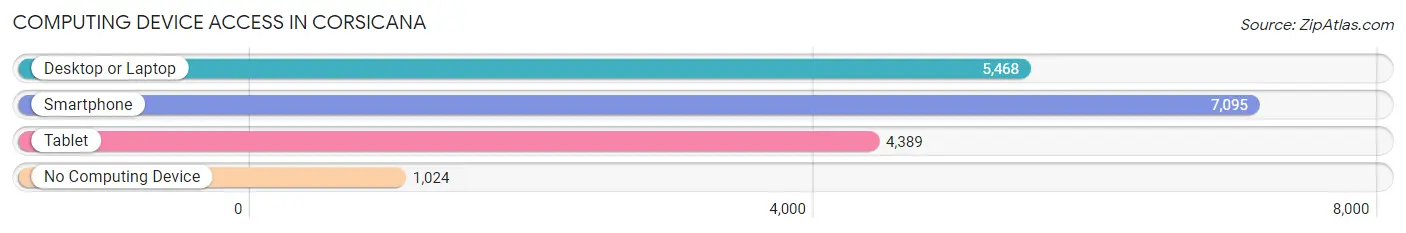
| Device Type | # Households | % Households |
| Desktop or Laptop | 5,468 | 63.5% |
| Smartphone | 7,095 | 82.4% |
| Tablet | 4,389 | 51.0% |
| No Computing Device | 1,024 | 11.9% |
| Total | 8,610 | 100.0% |
Internet Access in Corsicana
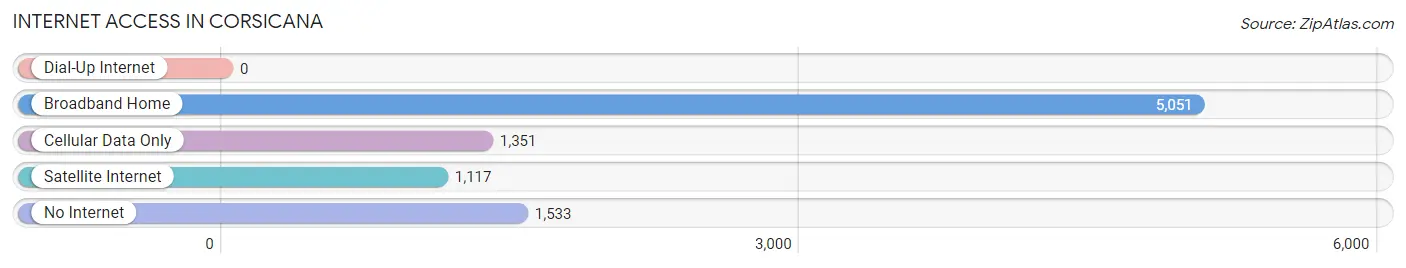
| Internet Type | # Households | % Households |
| Dial-Up Internet | 0 | 0.0% |
| Broadband Home | 5,051 | 58.7% |
| Cellular Data Only | 1,351 | 15.7% |
| Satellite Internet | 1,117 | 13.0% |
| No Internet | 1,533 | 17.8% |
| Total | 8,610 | 100.0% |
Corsicana Summary
Corsicana, Texas is a city located in Navarro County, Texas, United States. It is the county seat of Navarro County and is located approximately 100 miles south of Dallas. The population of Corsicana was 23,770 at the 2010 census, making it the largest city in Navarro County.
History
Corsicana was founded in 1848 by Joseph Daniel “J.D.” Shackelford, a settler from Tennessee. The city was named after the Mediterranean island of Corsica, which was the birthplace of Napoleon Bonaparte. The city was incorporated in 1873 and was the first city in Navarro County.
Corsicana was an important center for the cotton industry in the late 19th and early 20th centuries. The city was home to several cotton gins and warehouses, as well as a cottonseed oil mill. The city was also home to the first cottonseed oil mill in Texas, which was established in 1894.
Corsicana was also an important center for the oil industry in the early 20th century. The city was home to several oil refineries and was the site of the first oil well in Texas, which was drilled in 1916.
Geography
Corsicana is located in Navarro County, Texas, approximately 100 miles south of Dallas. The city is situated on the northern edge of the Blackland Prairie, a region of flat, fertile land that stretches from the Red River in the north to the Gulf Coast in the south. The city is located at the intersection of State Highway 31 and U.S. Highway 287.
The climate in Corsicana is humid subtropical, with hot summers and mild winters. The average annual temperature is 68°F (20°C), and the average annual precipitation is 37.5 inches (95 cm).
Economy
Corsicana’s economy is largely based on agriculture and manufacturing. The city is home to several large agricultural operations, including a large cotton gin and several feed mills. The city is also home to several manufacturing companies, including a large paper mill and a large oil refinery.
The city is also home to several retail stores, restaurants, and other businesses. The city is served by two hospitals, Navarro Regional Hospital and Corsicana Medical Center.
Demographics
As of the 2010 census, the population of Corsicana was 23,770. The racial makeup of the city was 68.3% White, 22.2% African American, 0.7% Native American, 0.7% Asian, 0.1% Pacific Islander, 6.2% from other races, and 2.0% from two or more races. Hispanic or Latino of any race were 13.3% of the population.
The median income for a household in the city was $35,945, and the median income for a family was $43,945. The per capita income for the city was $19,845. About 17.2% of families and 20.7% of the population were below the poverty line, including 28.3% of those under age 18 and 13.2% of those age 65 or over.
Common Questions
What is Per Capita Income in Corsicana?
Per Capita income in Corsicana is $24,274.
What is the Median Family Income in Corsicana?
Median Family Income in Corsicana is $65,444.
What is the Median Household income in Corsicana?
Median Household Income in Corsicana is $49,353.
What is Income or Wage Gap in Corsicana?
Income or Wage Gap in Corsicana is 25.1%.
Women in Corsicana earn 74.9 cents for every dollar earned by a man.
What is Family Income Deficit in Corsicana?
Family Income Deficit in Corsicana is $10,037.
Families that are below poverty line in Corsicana earn $10,037 less on average than the poverty threshold level.
What is Inequality or Gini Index in Corsicana?
Inequality or Gini Index in Corsicana is 0.46.
What is the Total Population of Corsicana?
Total Population of Corsicana is 25,107.
What is the Total Male Population of Corsicana?
Total Male Population of Corsicana is 12,881.
What is the Total Female Population of Corsicana?
Total Female Population of Corsicana is 12,226.
What is the Ratio of Males per 100 Females in Corsicana?
There are 105.36 Males per 100 Females in Corsicana.
What is the Ratio of Females per 100 Males in Corsicana?
There are 94.91 Females per 100 Males in Corsicana.
What is the Median Population Age in Corsicana?
Median Population Age in Corsicana is 34.6 Years.
What is the Average Family Size in Corsicana
Average Family Size in Corsicana is 3.6 People.
What is the Average Household Size in Corsicana
Average Household Size in Corsicana is 2.8 People.
How Large is the Labor Force in Corsicana?
There are 11,768 People in the Labor Forcein in Corsicana.
What is the Percentage of People in the Labor Force in Corsicana?
61.1% of People are in the Labor Force in Corsicana.
What is the Unemployment Rate in Corsicana?
Unemployment Rate in Corsicana is 7.7%.