Denison, TX Map & Demographics
Denison Map
Denison Overview
$28,829
PER CAPITA INCOME
$70,812
AVG FAMILY INCOME
$58,930
AVG HOUSEHOLD INCOME
26.3%
WAGE / INCOME GAP [ % ]
73.7¢/ $1
WAGE / INCOME GAP [ $ ]
$10,019
FAMILY INCOME DEFICIT
0.43
INEQUALITY / GINI INDEX
24,872
TOTAL POPULATION
11,841
MALE POPULATION
13,031
FEMALE POPULATION
90.87
MALES / 100 FEMALES
110.05
FEMALES / 100 MALES
40.1
MEDIAN AGE
3.1
AVG FAMILY SIZE
2.5
AVG HOUSEHOLD SIZE
11,352
LABOR FORCE [ PEOPLE ]
58.9%
PERCENT IN LABOR FORCE
5.2%
UNEMPLOYMENT RATE
Denison Area Codes
Income in Denison
Income Overview in Denison
Per Capita Income in Denison is $28,829, while median incomes of families and households are $70,812 and $58,930 respectively.
| Characteristic | Number | Measure |
| Per Capita Income | 24,872 | $28,829 |
| Median Family Income | 6,322 | $70,812 |
| Mean Family Income | 6,322 | $82,121 |
| Median Household Income | 9,588 | $58,930 |
| Mean Household Income | 9,588 | $73,705 |
| Income Deficit | 6,322 | $10,019 |
| Wage / Income Gap (%) | 24,872 | 26.26% |
| Wage / Income Gap ($) | 24,872 | 73.74¢ per $1 |
| Gini / Inequality Index | 24,872 | 0.43 |
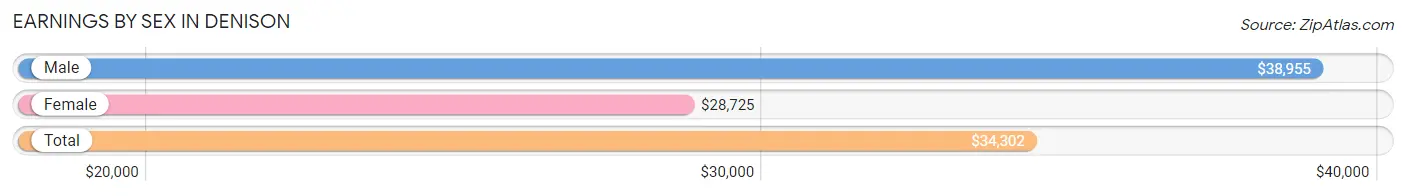
Earnings by Sex in Denison
Average Earnings in Denison are $34,302, $38,955 for men and $28,725 for women, a difference of 26.3%.
| Sex | Number | Average Earnings |
| Male | 6,065 (51.1%) | $38,955 |
| Female | 5,792 (48.8%) | $28,725 |
| Total | 11,857 (100.0%) | $34,302 |
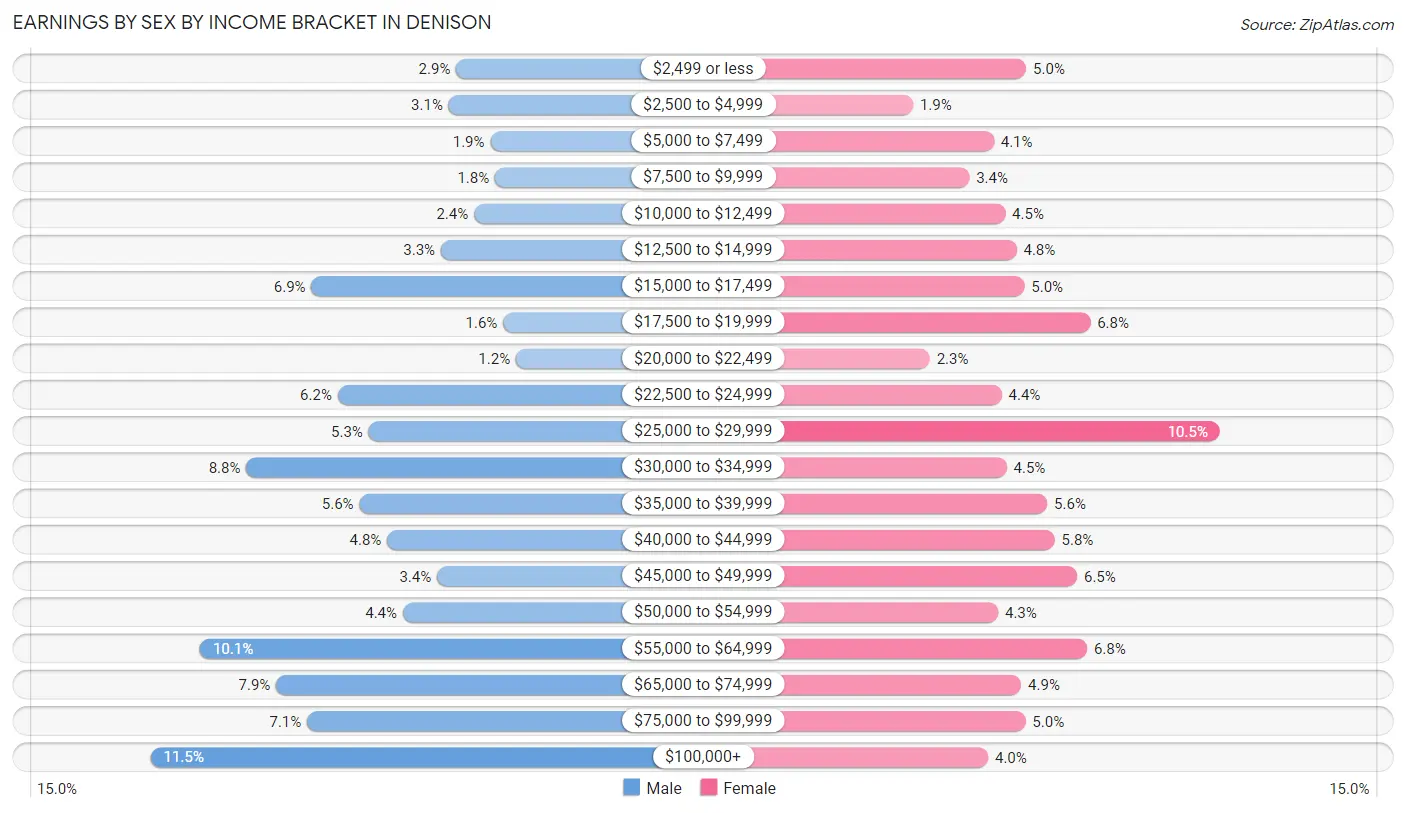
Earnings by Sex by Income Bracket in Denison
The most common earnings brackets in Denison are $100,000+ for men (695 | 11.5%) and $25,000 to $29,999 for women (607 | 10.5%).
| Income | Male | Female |
| $2,499 or less | 174 (2.9%) | 292 (5.0%) |
| $2,500 to $4,999 | 187 (3.1%) | 108 (1.9%) |
| $5,000 to $7,499 | 116 (1.9%) | 239 (4.1%) |
| $7,500 to $9,999 | 108 (1.8%) | 199 (3.4%) |
| $10,000 to $12,499 | 144 (2.4%) | 258 (4.4%) |
| $12,500 to $14,999 | 200 (3.3%) | 276 (4.8%) |
| $15,000 to $17,499 | 421 (6.9%) | 289 (5.0%) |
| $17,500 to $19,999 | 94 (1.5%) | 396 (6.8%) |
| $20,000 to $22,499 | 72 (1.2%) | 135 (2.3%) |
| $22,500 to $24,999 | 376 (6.2%) | 252 (4.3%) |
| $25,000 to $29,999 | 323 (5.3%) | 607 (10.5%) |
| $30,000 to $34,999 | 532 (8.8%) | 260 (4.5%) |
| $35,000 to $39,999 | 339 (5.6%) | 326 (5.6%) |
| $40,000 to $44,999 | 292 (4.8%) | 338 (5.8%) |
| $45,000 to $49,999 | 207 (3.4%) | 375 (6.5%) |
| $50,000 to $54,999 | 265 (4.4%) | 246 (4.3%) |
| $55,000 to $64,999 | 611 (10.1%) | 391 (6.8%) |
| $65,000 to $74,999 | 481 (7.9%) | 284 (4.9%) |
| $75,000 to $99,999 | 428 (7.1%) | 291 (5.0%) |
| $100,000+ | 695 (11.5%) | 230 (4.0%) |
| Total | 6,065 (100.0%) | 5,792 (100.0%) |
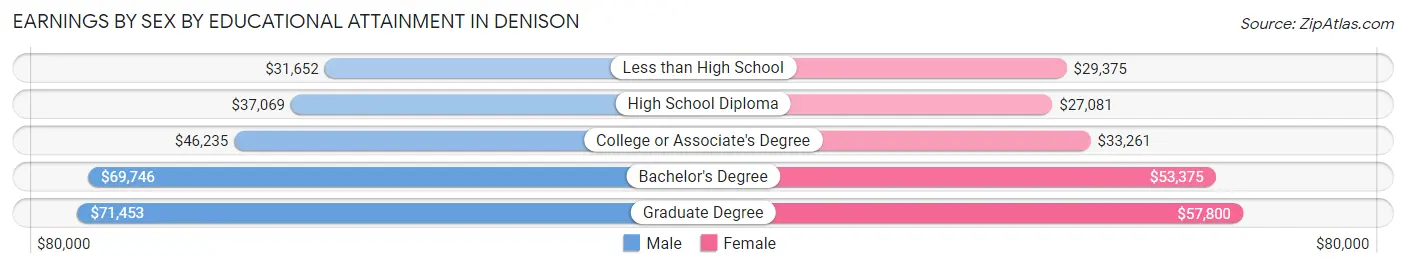
Earnings by Sex by Educational Attainment in Denison
Average earnings in Denison are $45,656 for men and $33,077 for women, a difference of 27.6%. Men with an educational attainment of graduate degree enjoy the highest average annual earnings of $71,453, while those with less than high school education earn the least with $31,652. Women with an educational attainment of graduate degree earn the most with the average annual earnings of $57,800, while those with high school diploma education have the smallest earnings of $27,081.
| Educational Attainment | Male Income | Female Income |
| Less than High School | $31,652 | $29,375 |
| High School Diploma | $37,069 | $27,081 |
| College or Associate's Degree | $46,235 | $33,261 |
| Bachelor's Degree | $69,746 | $53,375 |
| Graduate Degree | $71,453 | $57,800 |
| Total | $45,656 | $33,077 |
Family Income in Denison
Family Income Brackets in Denison
According to the Denison family income data, there are 1,315 families falling into the $100,000 to $149,999 income range, which is the most common income bracket and makes up 20.8% of all families. Conversely, the $10,000 to $14,999 income bracket is the least frequent group with only 89 families (1.4%) belonging to this category.
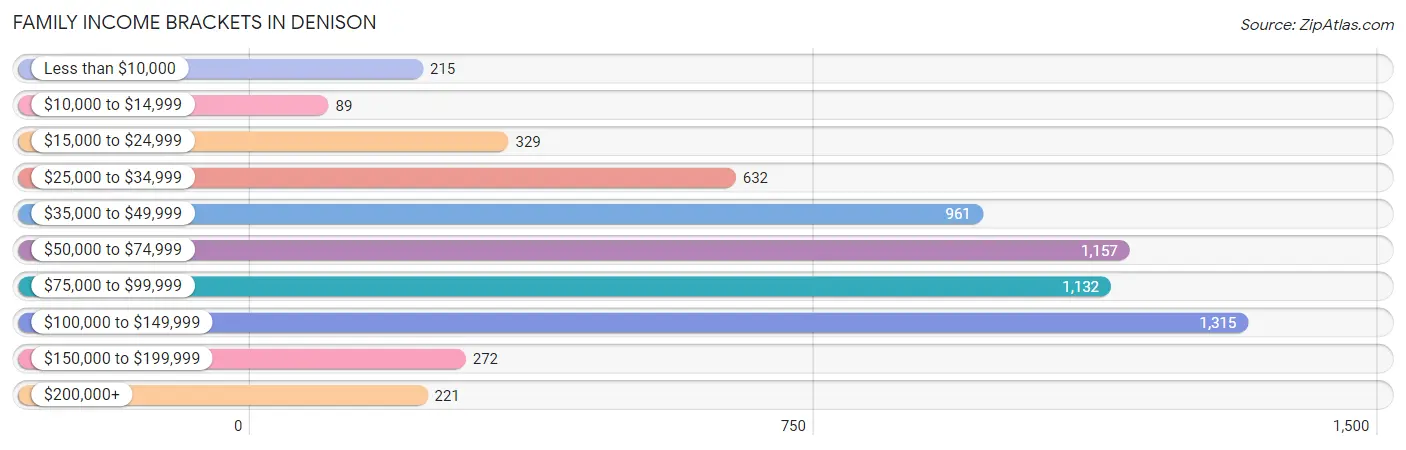
| Income Bracket | # Families | % Families |
| Less than $10,000 | 215 | 3.4% |
| $10,000 to $14,999 | 89 | 1.4% |
| $15,000 to $24,999 | 329 | 5.2% |
| $25,000 to $34,999 | 632 | 10.0% |
| $35,000 to $49,999 | 961 | 15.2% |
| $50,000 to $74,999 | 1,157 | 18.3% |
| $75,000 to $99,999 | 1,132 | 17.9% |
| $100,000 to $149,999 | 1,315 | 20.8% |
| $150,000 to $199,999 | 272 | 4.3% |
| $200,000+ | 221 | 3.5% |
Family Income by Famaliy Size in Denison
4-person families (876 | 13.9%) account for the highest median family income in Denison with $87,500 per family, while 2-person families (2,777 | 43.9%) have the highest median income of $32,423 per family member.
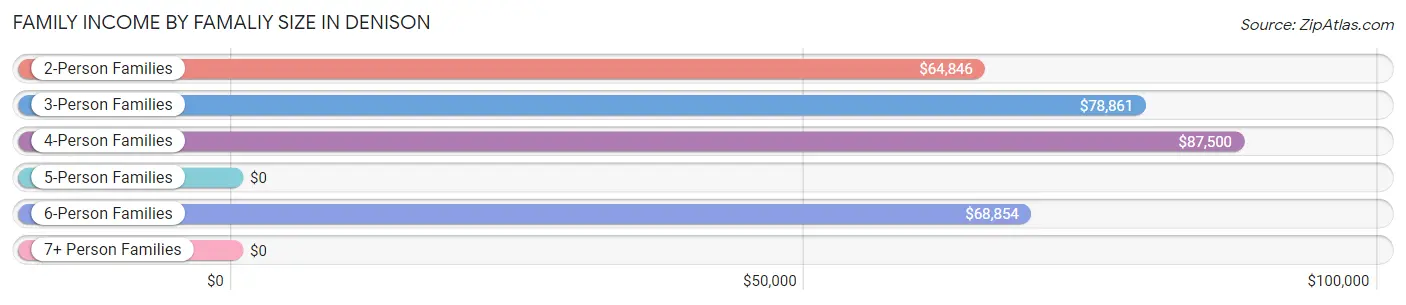
| Income Bracket | # Families | Median Income |
| 2-Person Families | 2,777 (43.9%) | $64,846 |
| 3-Person Families | 1,912 (30.2%) | $78,861 |
| 4-Person Families | 876 (13.9%) | $87,500 |
| 5-Person Families | 403 (6.4%) | $0 |
| 6-Person Families | 255 (4.0%) | $68,854 |
| 7+ Person Families | 99 (1.6%) | $0 |
| Total | 6,322 (100.0%) | $70,812 |
Family Income by Number of Earners in Denison
The median family income in Denison is $70,812, with families comprising 3+ earners (474) having the highest median family income of $122,692, while families with no earners (1,000) have the lowest median family income of $42,583, accounting for 7.5% and 15.8% of families, respectively.
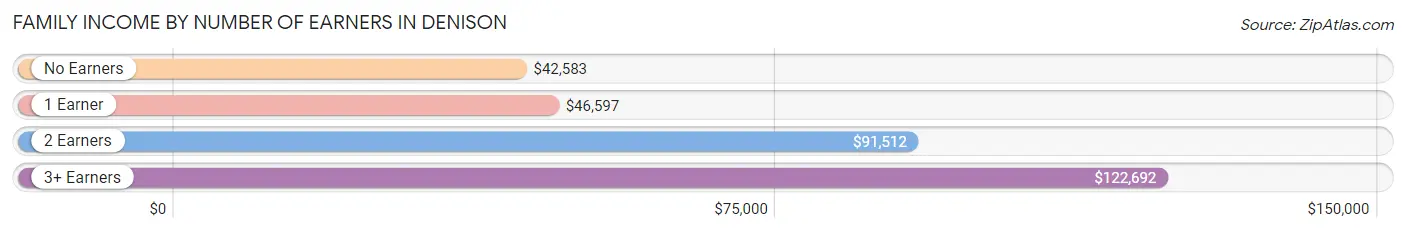
| Number of Earners | # Families | Median Income |
| No Earners | 1,000 (15.8%) | $42,583 |
| 1 Earner | 2,210 (35.0%) | $46,597 |
| 2 Earners | 2,638 (41.7%) | $91,512 |
| 3+ Earners | 474 (7.5%) | $122,692 |
| Total | 6,322 (100.0%) | $70,812 |
Household Income in Denison
Household Income Brackets in Denison
With 1,707 households falling in the category, the $50,000 to $74,999 income range is the most frequent in Denison, accounting for 17.8% of all households. In contrast, only 307 households (3.2%) fall into the $200,000+ income bracket, making it the least populous group.
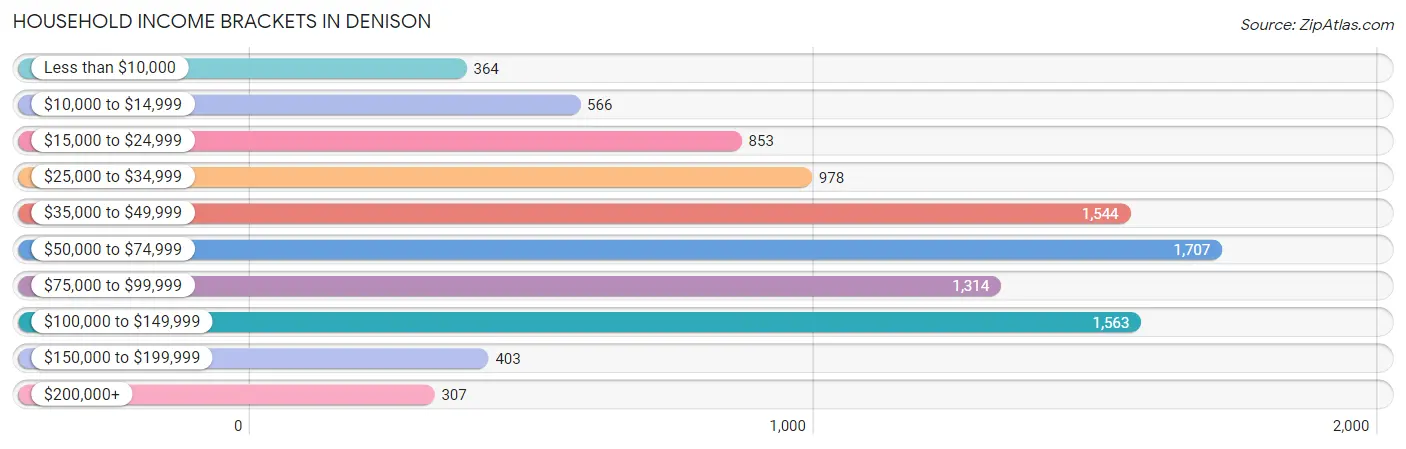
| Income Bracket | # Households | % Households |
| Less than $10,000 | 364 | 3.8% |
| $10,000 to $14,999 | 566 | 5.9% |
| $15,000 to $24,999 | 853 | 8.9% |
| $25,000 to $34,999 | 978 | 10.2% |
| $35,000 to $49,999 | 1,544 | 16.1% |
| $50,000 to $74,999 | 1,707 | 17.8% |
| $75,000 to $99,999 | 1,314 | 13.7% |
| $100,000 to $149,999 | 1,563 | 16.3% |
| $150,000 to $199,999 | 403 | 4.2% |
| $200,000+ | 307 | 3.2% |
Household Income by Householder Age in Denison
The median household income in Denison is $58,930, with the highest median household income of $69,488 found in the 45 to 64 years age bracket for the primary householder. A total of 3,533 households (36.8%) fall into this category. Meanwhile, the 15 to 24 years age bracket for the primary householder has the lowest median household income of $0, with 393 households (4.1%) in this group.
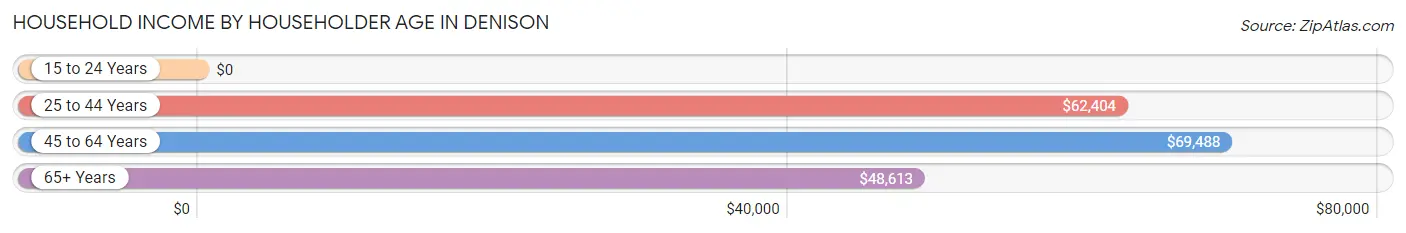
| Income Bracket | # Households | Median Income |
| 15 to 24 Years | 393 (4.1%) | $0 |
| 25 to 44 Years | 2,544 (26.5%) | $62,404 |
| 45 to 64 Years | 3,533 (36.8%) | $69,488 |
| 65+ Years | 3,118 (32.5%) | $48,613 |
| Total | 9,588 (100.0%) | $58,930 |
Poverty in Denison
Income Below Poverty by Sex and Age in Denison
With 18.1% poverty level for males and 18.0% for females among the residents of Denison, 12 to 14 year old males and 6 to 11 year old females are the most vulnerable to poverty, with 374 males (52.6%) and 347 females (39.3%) in their respective age groups living below the poverty level.
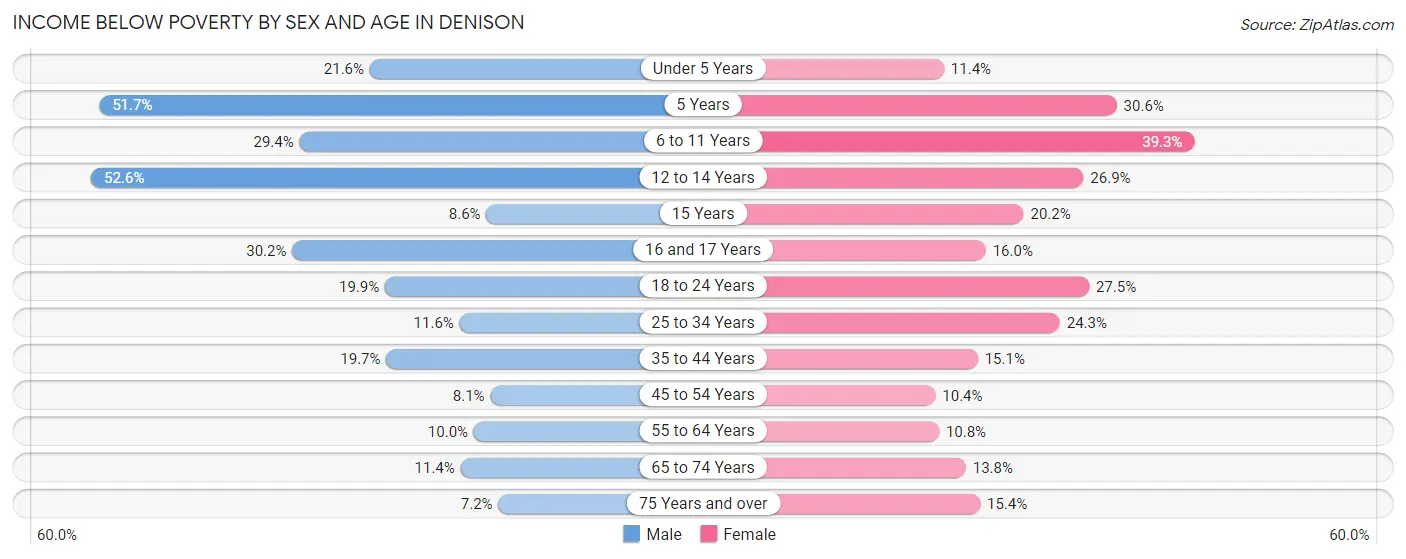
| Age Bracket | Male | Female |
| Under 5 Years | 170 (21.5%) | 84 (11.4%) |
| 5 Years | 61 (51.7%) | 15 (30.6%) |
| 6 to 11 Years | 344 (29.4%) | 347 (39.3%) |
| 12 to 14 Years | 374 (52.6%) | 141 (26.9%) |
| 15 Years | 21 (8.6%) | 50 (20.2%) |
| 16 and 17 Years | 109 (30.2%) | 50 (16.0%) |
| 18 to 24 Years | 234 (19.9%) | 258 (27.5%) |
| 25 to 34 Years | 114 (11.6%) | 398 (24.3%) |
| 35 to 44 Years | 232 (19.7%) | 189 (15.1%) |
| 45 to 54 Years | 136 (8.1%) | 191 (10.4%) |
| 55 to 64 Years | 155 (10.0%) | 172 (10.8%) |
| 65 to 74 Years | 107 (11.4%) | 195 (13.8%) |
| 75 Years and over | 55 (7.2%) | 208 (15.4%) |
| Total | 2,112 (18.1%) | 2,298 (18.0%) |
Income Above Poverty by Sex and Age in Denison
According to the poverty statistics in Denison, males aged 75 years and over and females aged 45 to 54 years are the age groups that are most secure financially, with 92.8% of males and 89.6% of females in these age groups living above the poverty line.
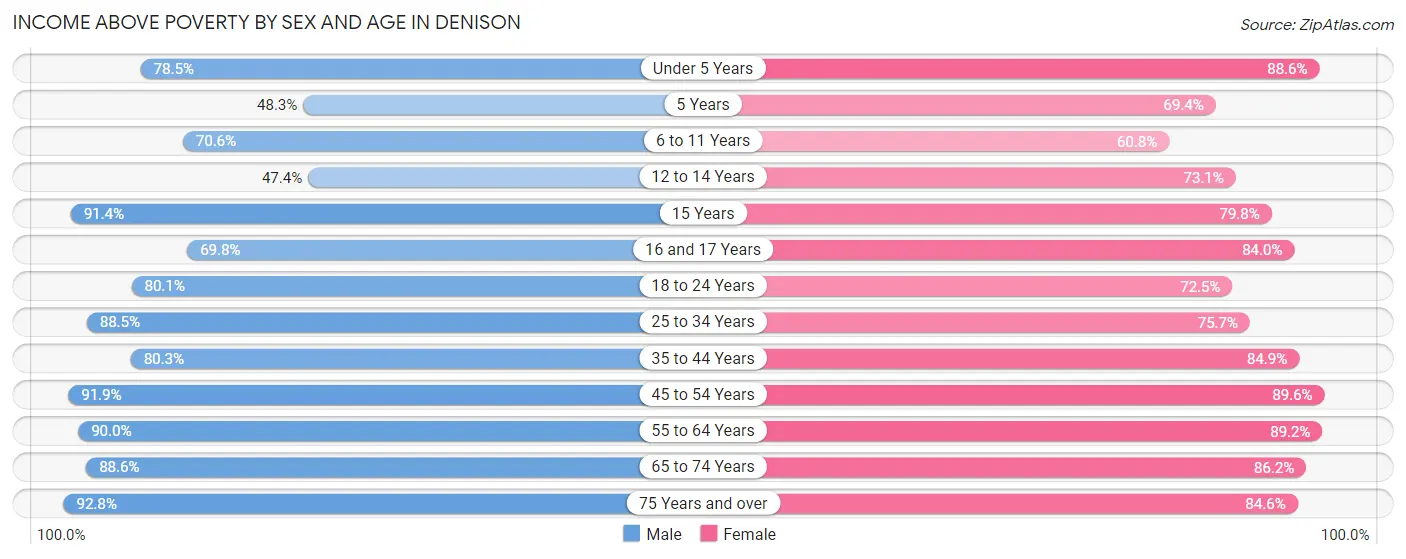
| Age Bracket | Male | Female |
| Under 5 Years | 619 (78.4%) | 655 (88.6%) |
| 5 Years | 57 (48.3%) | 34 (69.4%) |
| 6 to 11 Years | 827 (70.6%) | 537 (60.8%) |
| 12 to 14 Years | 337 (47.4%) | 383 (73.1%) |
| 15 Years | 224 (91.4%) | 197 (79.8%) |
| 16 and 17 Years | 252 (69.8%) | 262 (84.0%) |
| 18 to 24 Years | 944 (80.1%) | 679 (72.5%) |
| 25 to 34 Years | 873 (88.4%) | 1,241 (75.7%) |
| 35 to 44 Years | 945 (80.3%) | 1,059 (84.9%) |
| 45 to 54 Years | 1,538 (91.9%) | 1,642 (89.6%) |
| 55 to 64 Years | 1,402 (90.0%) | 1,417 (89.2%) |
| 65 to 74 Years | 828 (88.6%) | 1,217 (86.2%) |
| 75 Years and over | 706 (92.8%) | 1,143 (84.6%) |
| Total | 9,552 (81.9%) | 10,466 (82.0%) |
Income Below Poverty Among Married-Couple Families in Denison
The poverty statistics for married-couple families in Denison show that 5.8% or 246 of the total 4,239 families live below the poverty line. Families with 5 or more children have the highest poverty rate of 54.1%, comprising of 33 families. On the other hand, families with 1 or 2 children have the lowest poverty rate of 1.1%, which includes 15 families.
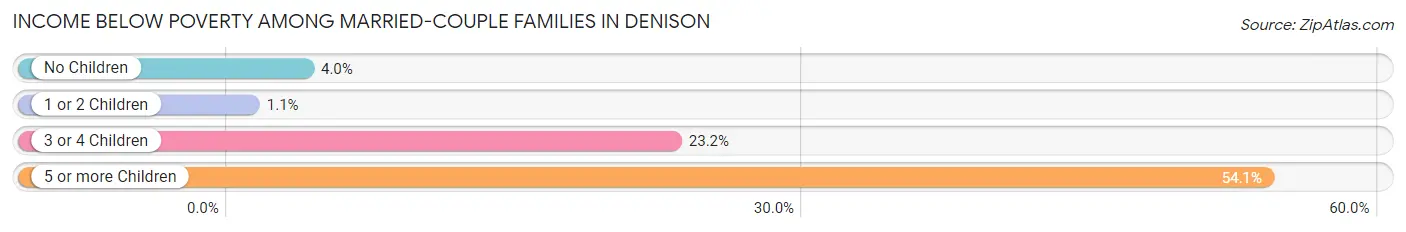
| Children | Above Poverty | Below Poverty |
| No Children | 2,325 (96.0%) | 96 (4.0%) |
| 1 or 2 Children | 1,302 (98.9%) | 15 (1.1%) |
| 3 or 4 Children | 338 (76.8%) | 102 (23.2%) |
| 5 or more Children | 28 (45.9%) | 33 (54.1%) |
| Total | 3,993 (94.2%) | 246 (5.8%) |
Income Below Poverty Among Single-Parent Households in Denison
According to the poverty data in Denison, 22.1% or 98 single-father households and 24.1% or 395 single-mother households are living below the poverty line. Among single-father households, those with 1 or 2 children have the highest poverty rate, with 77 households (30.1%) experiencing poverty. Likewise, among single-mother households, those with 3 or 4 children have the highest poverty rate, with 105 households (60.3%) falling below the poverty line.
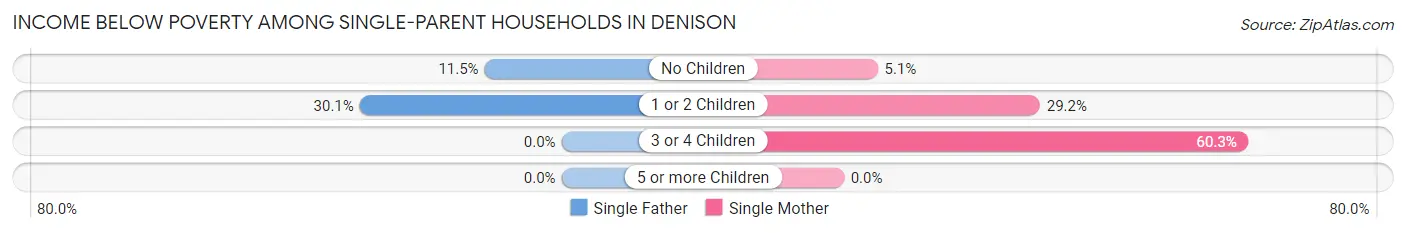
| Children | Single Father | Single Mother |
| No Children | 21 (11.5%) | 29 (5.1%) |
| 1 or 2 Children | 77 (30.1%) | 261 (29.2%) |
| 3 or 4 Children | 0 (0.0%) | 105 (60.3%) |
| 5 or more Children | 0 (0.0%) | 0 (0.0%) |
| Total | 98 (22.1%) | 395 (24.1%) |
Income Below Poverty Among Married-Couple vs Single-Parent Households in Denison
The poverty data for Denison shows that 246 of the married-couple family households (5.8%) and 493 of the single-parent households (23.7%) are living below the poverty level. Within the married-couple family households, those with 5 or more children have the highest poverty rate, with 33 households (54.1%) falling below the poverty line. Among the single-parent households, those with 3 or 4 children have the highest poverty rate, with 105 household (59.0%) living below poverty.
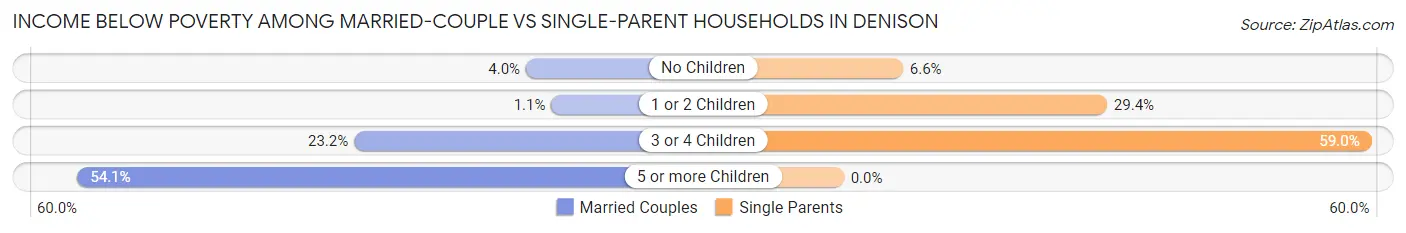
| Children | Married-Couple Families | Single-Parent Households |
| No Children | 96 (4.0%) | 50 (6.6%) |
| 1 or 2 Children | 15 (1.1%) | 338 (29.4%) |
| 3 or 4 Children | 102 (23.2%) | 105 (59.0%) |
| 5 or more Children | 33 (54.1%) | 0 (0.0%) |
| Total | 246 (5.8%) | 493 (23.7%) |
Race in Denison
The most populous races in Denison are White / Caucasian (20,142 | 81.0%), Hispanic or Latino (2,815 | 11.3%), and Two or more Races (1,856 | 7.5%).
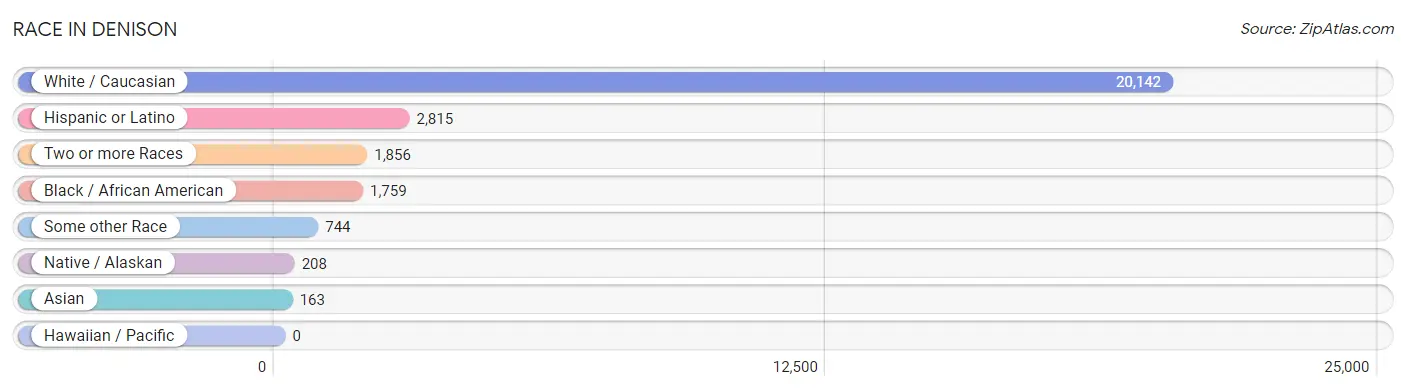
| Race | # Population | % Population |
| Asian | 163 | 0.7% |
| Black / African American | 1,759 | 7.1% |
| Hawaiian / Pacific | 0 | 0.0% |
| Hispanic or Latino | 2,815 | 11.3% |
| Native / Alaskan | 208 | 0.8% |
| White / Caucasian | 20,142 | 81.0% |
| Two or more Races | 1,856 | 7.5% |
| Some other Race | 744 | 3.0% |
| Total | 24,872 | 100.0% |
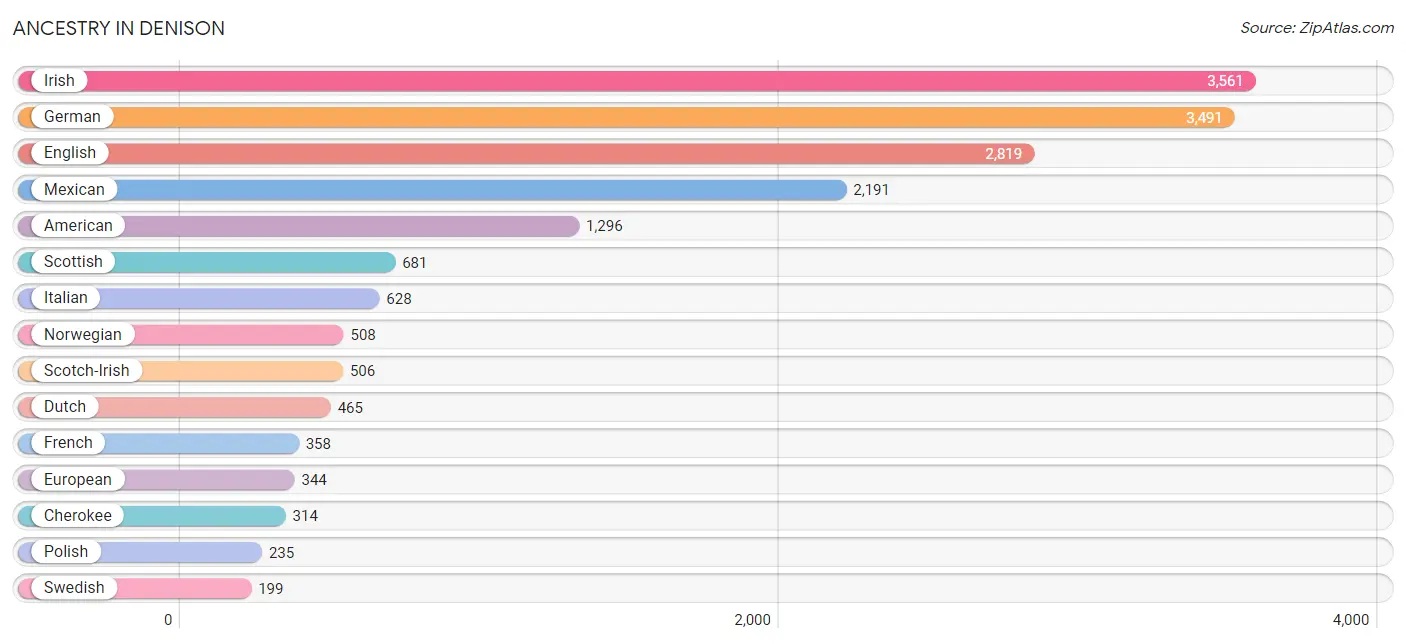
Ancestry in Denison
The most populous ancestries reported in Denison are Irish (3,561 | 14.3%), German (3,491 | 14.0%), English (2,819 | 11.3%), Mexican (2,191 | 8.8%), and American (1,296 | 5.2%), together accounting for 53.7% of all Denison residents.
| Ancestry | # Population | % Population |
| African | 35 | 0.1% |
| American | 1,296 | 5.2% |
| Austrian | 22 | 0.1% |
| Belgian | 11 | 0.0% |
| Bhutanese | 20 | 0.1% |
| British | 186 | 0.7% |
| British West Indian | 27 | 0.1% |
| Cajun | 8 | 0.0% |
| Celtic | 30 | 0.1% |
| Central American | 153 | 0.6% |
| Cherokee | 314 | 1.3% |
| Chickasaw | 160 | 0.6% |
| Choctaw | 170 | 0.7% |
| Colombian | 26 | 0.1% |
| Creek | 15 | 0.1% |
| Czech | 146 | 0.6% |
| Dutch | 465 | 1.9% |
| English | 2,819 | 11.3% |
| European | 344 | 1.4% |
| Finnish | 35 | 0.1% |
| French | 358 | 1.4% |
| French Canadian | 31 | 0.1% |
| German | 3,491 | 14.0% |
| Greek | 18 | 0.1% |
| Guatemalan | 77 | 0.3% |
| Honduran | 17 | 0.1% |
| Hungarian | 75 | 0.3% |
| Indian (Asian) | 21 | 0.1% |
| Irish | 3,561 | 14.3% |
| Italian | 628 | 2.5% |
| Korean | 47 | 0.2% |
| Lithuanian | 14 | 0.1% |
| Mexican | 2,191 | 8.8% |
| Mexican American Indian | 63 | 0.3% |
| Navajo | 49 | 0.2% |
| Nicaraguan | 21 | 0.1% |
| Northern European | 7 | 0.0% |
| Norwegian | 508 | 2.0% |
| Polish | 235 | 0.9% |
| Portuguese | 18 | 0.1% |
| Potawatomi | 4 | 0.0% |
| Puerto Rican | 78 | 0.3% |
| Russian | 23 | 0.1% |
| Salvadoran | 38 | 0.2% |
| Scandinavian | 91 | 0.4% |
| Scotch-Irish | 506 | 2.0% |
| Scottish | 681 | 2.7% |
| Sioux | 24 | 0.1% |
| South American | 26 | 0.1% |
| Spanish | 33 | 0.1% |
| Subsaharan African | 35 | 0.1% |
| Swedish | 199 | 0.8% |
| Thai | 140 | 0.6% |
| Tohono O'Odham | 21 | 0.1% |
| Ukrainian | 6 | 0.0% |
| Welsh | 48 | 0.2% | View All 56 Rows |
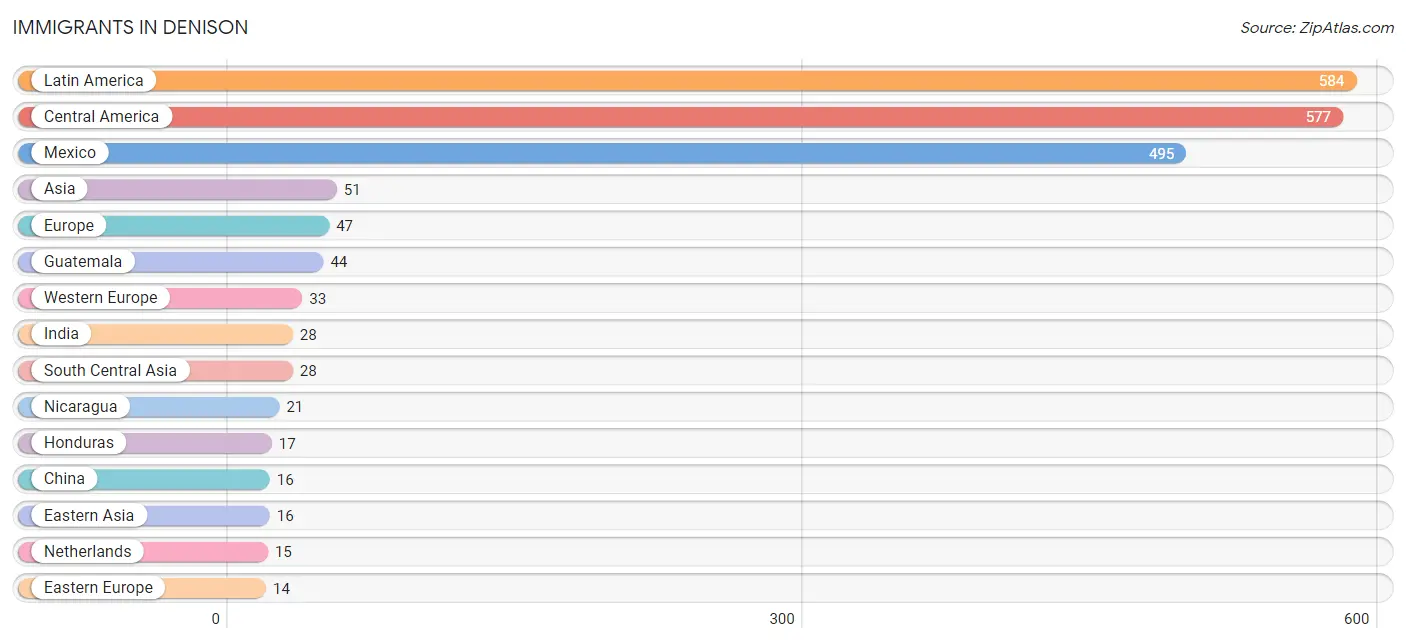
Immigrants in Denison
The most numerous immigrant groups reported in Denison came from Latin America (584 | 2.4%), Central America (577 | 2.3%), Mexico (495 | 2.0%), Asia (51 | 0.2%), and Europe (47 | 0.2%), together accounting for 7.1% of all Denison residents.
| Immigration Origin | # Population | % Population |
| Africa | 2 | 0.0% |
| Asia | 51 | 0.2% |
| Caribbean | 7 | 0.0% |
| Central America | 577 | 2.3% |
| China | 16 | 0.1% |
| Eastern Africa | 2 | 0.0% |
| Eastern Asia | 16 | 0.1% |
| Eastern Europe | 14 | 0.1% |
| Europe | 47 | 0.2% |
| France | 11 | 0.0% |
| Germany | 7 | 0.0% |
| Guatemala | 44 | 0.2% |
| Honduras | 17 | 0.1% |
| Hong Kong | 6 | 0.0% |
| India | 28 | 0.1% |
| Kenya | 2 | 0.0% |
| Latin America | 584 | 2.4% |
| Lithuania | 14 | 0.1% |
| Mexico | 495 | 2.0% |
| Netherlands | 15 | 0.1% |
| Nicaragua | 21 | 0.1% |
| Philippines | 7 | 0.0% |
| South Central Asia | 28 | 0.1% |
| South Eastern Asia | 7 | 0.0% |
| St. Vincent and the Grenadines | 7 | 0.0% |
| Taiwan | 10 | 0.0% |
| Western Europe | 33 | 0.1% | View All 27 Rows |
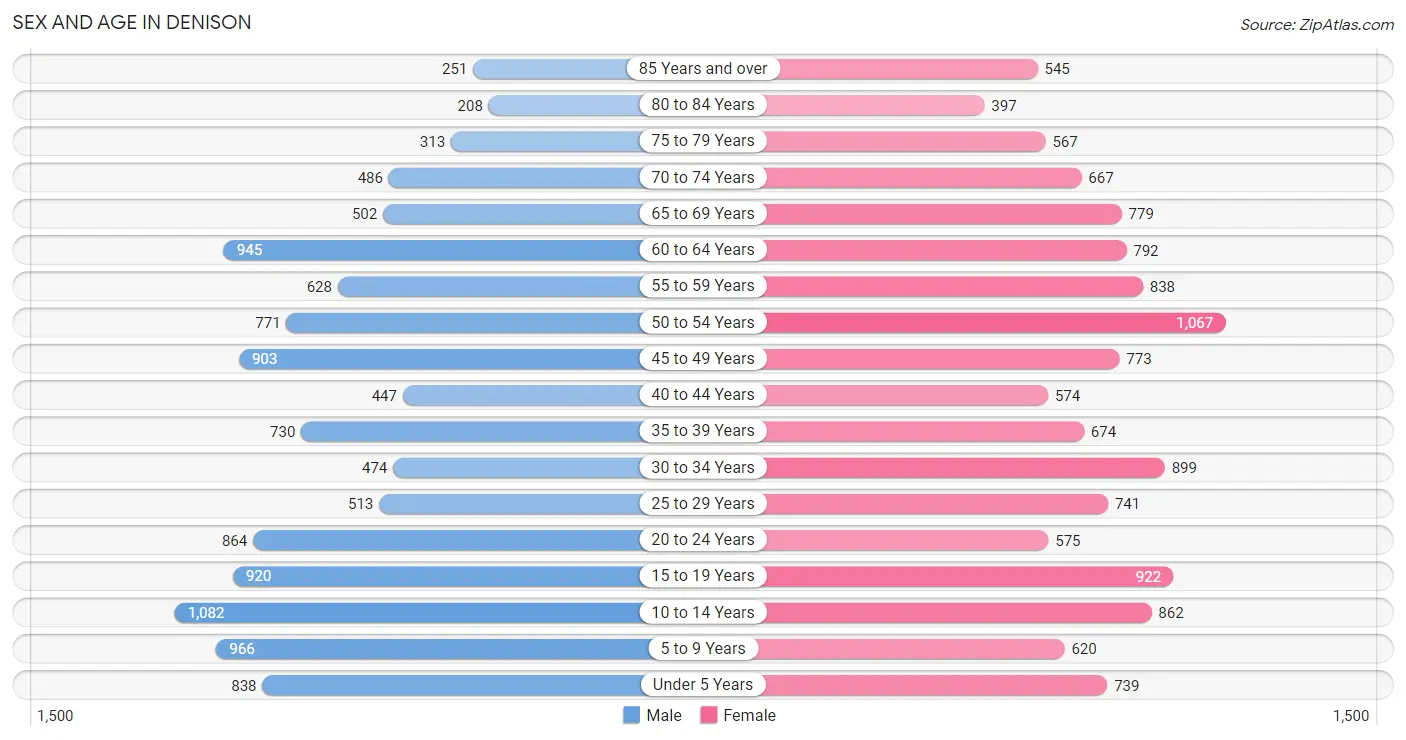
Sex and Age in Denison
Sex and Age in Denison
The most populous age groups in Denison are 10 to 14 Years (1,082 | 9.1%) for men and 50 to 54 Years (1,067 | 8.2%) for women.
| Age Bracket | Male | Female |
| Under 5 Years | 838 (7.1%) | 739 (5.7%) |
| 5 to 9 Years | 966 (8.2%) | 620 (4.8%) |
| 10 to 14 Years | 1,082 (9.1%) | 862 (6.6%) |
| 15 to 19 Years | 920 (7.8%) | 922 (7.1%) |
| 20 to 24 Years | 864 (7.3%) | 575 (4.4%) |
| 25 to 29 Years | 513 (4.3%) | 741 (5.7%) |
| 30 to 34 Years | 474 (4.0%) | 899 (6.9%) |
| 35 to 39 Years | 730 (6.2%) | 674 (5.2%) |
| 40 to 44 Years | 447 (3.8%) | 574 (4.4%) |
| 45 to 49 Years | 903 (7.6%) | 773 (5.9%) |
| 50 to 54 Years | 771 (6.5%) | 1,067 (8.2%) |
| 55 to 59 Years | 628 (5.3%) | 838 (6.4%) |
| 60 to 64 Years | 945 (8.0%) | 792 (6.1%) |
| 65 to 69 Years | 502 (4.2%) | 779 (6.0%) |
| 70 to 74 Years | 486 (4.1%) | 667 (5.1%) |
| 75 to 79 Years | 313 (2.6%) | 567 (4.3%) |
| 80 to 84 Years | 208 (1.8%) | 397 (3.0%) |
| 85 Years and over | 251 (2.1%) | 545 (4.2%) |
| Total | 11,841 (100.0%) | 13,031 (100.0%) |
Families and Households in Denison
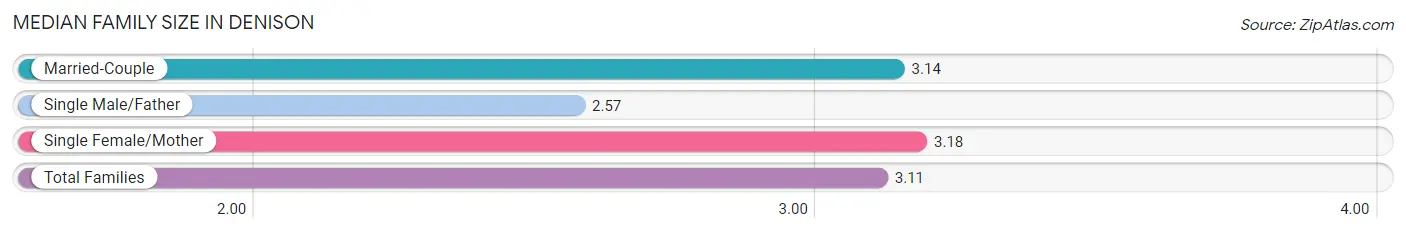
Median Family Size in Denison
The median family size in Denison is 3.11 persons per family, with single female/mother families (1,640 | 25.9%) accounting for the largest median family size of 3.18 persons per family. On the other hand, single male/father families (443 | 7.0%) represent the smallest median family size with 2.57 persons per family.
| Family Type | # Families | Family Size |
| Married-Couple | 4,239 (67.0%) | 3.14 |
| Single Male/Father | 443 (7.0%) | 2.57 |
| Single Female/Mother | 1,640 (25.9%) | 3.18 |
| Total Families | 6,322 (100.0%) | 3.11 |
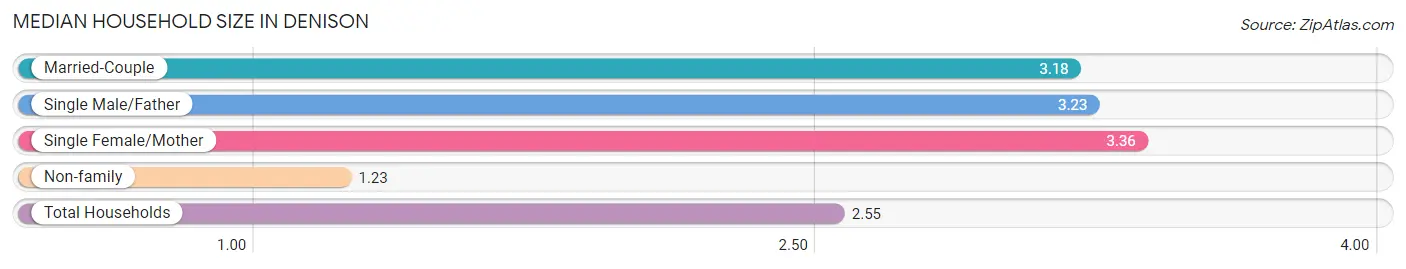
Median Household Size in Denison
The median household size in Denison is 2.55 persons per household, with single female/mother households (1,640 | 17.1%) accounting for the largest median household size of 3.36 persons per household. non-family households (3,266 | 34.1%) represent the smallest median household size with 1.23 persons per household.
| Household Type | # Households | Household Size |
| Married-Couple | 4,239 (44.2%) | 3.18 |
| Single Male/Father | 443 (4.6%) | 3.23 |
| Single Female/Mother | 1,640 (17.1%) | 3.36 |
| Non-family | 3,266 (34.1%) | 1.23 |
| Total Households | 9,588 (100.0%) | 2.55 |
Household Size by Marriage Status in Denison
Out of a total of 9,588 households in Denison, 6,322 (65.9%) are family households, while 3,266 (34.1%) are nonfamily households. The most numerous type of family households are 2-person households, comprising 2,500, and the most common type of nonfamily households are 1-person households, comprising 2,571.
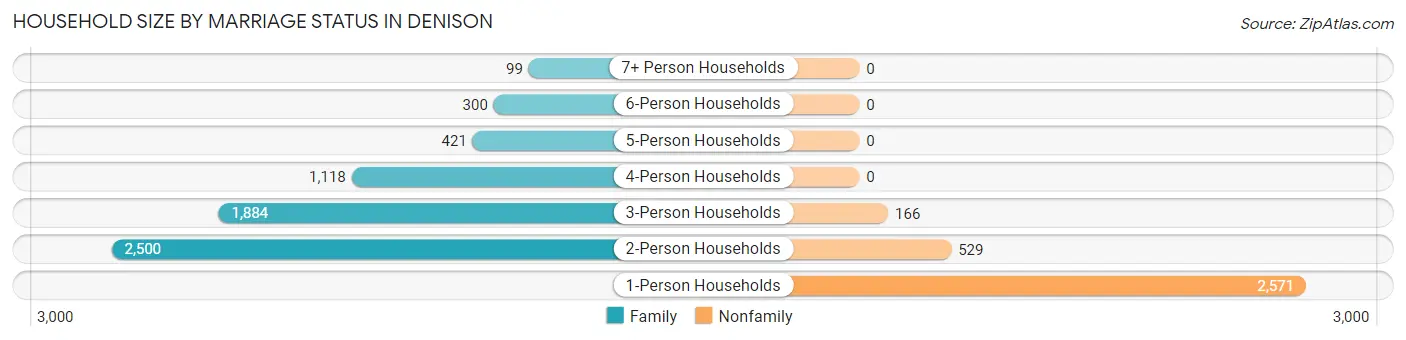
| Household Size | Family Households | Nonfamily Households |
| 1-Person Households | - | 2,571 (26.8%) |
| 2-Person Households | 2,500 (26.1%) | 529 (5.5%) |
| 3-Person Households | 1,884 (19.7%) | 166 (1.7%) |
| 4-Person Households | 1,118 (11.7%) | 0 (0.0%) |
| 5-Person Households | 421 (4.4%) | 0 (0.0%) |
| 6-Person Households | 300 (3.1%) | 0 (0.0%) |
| 7+ Person Households | 99 (1.0%) | 0 (0.0%) |
| Total | 6,322 (65.9%) | 3,266 (34.1%) |
Female Fertility in Denison
Fertility by Age in Denison
Average fertility rate in Denison is 51.0 births per 1,000 women. Women in the age bracket of 20 to 34 years have the highest fertility rate with 70.0 births per 1,000 women. Women in the age bracket of 20 to 34 years acount for 57.8% of all women with births.
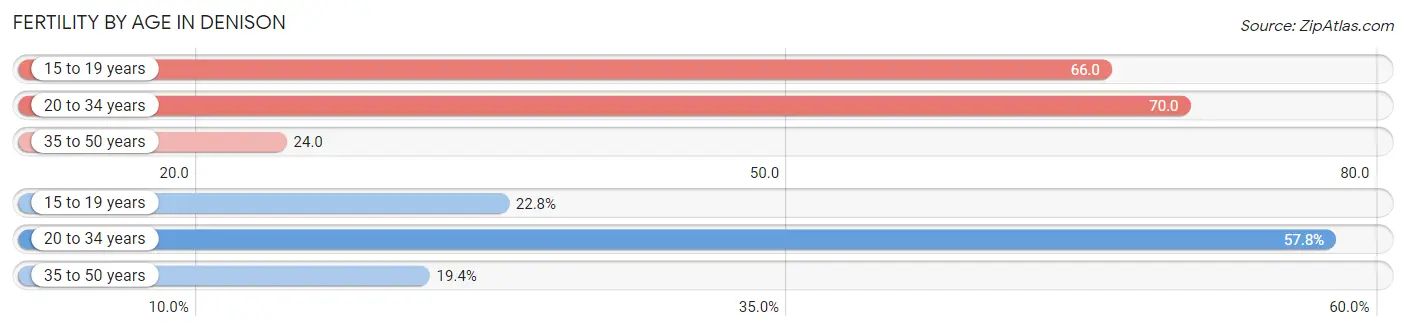
| Age Bracket | Women with Births | Births / 1,000 Women |
| 15 to 19 years | 61 (22.8%) | 66.0 |
| 20 to 34 years | 155 (57.8%) | 70.0 |
| 35 to 50 years | 52 (19.4%) | 24.0 |
| Total | 268 (100.0%) | 51.0 |
Fertility by Age by Marriage Status in Denison
54.1% of women with births (268) in Denison are married. The highest percentage of unmarried women with births falls into 15 to 19 years age bracket with 100.0% of them unmarried at the time of birth, while the lowest percentage of unmarried women with births belong to 35 to 50 years age bracket with 17.3% of them unmarried.
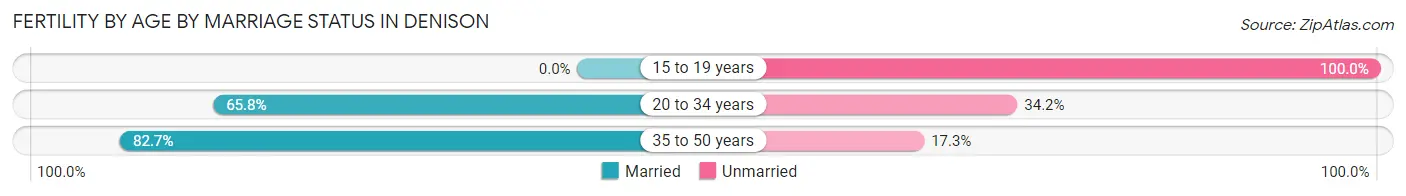
| Age Bracket | Married | Unmarried |
| 15 to 19 years | 0 (0.0%) | 61 (100.0%) |
| 20 to 34 years | 102 (65.8%) | 53 (34.2%) |
| 35 to 50 years | 43 (82.7%) | 9 (17.3%) |
| Total | 145 (54.1%) | 123 (45.9%) |
Fertility by Education in Denison
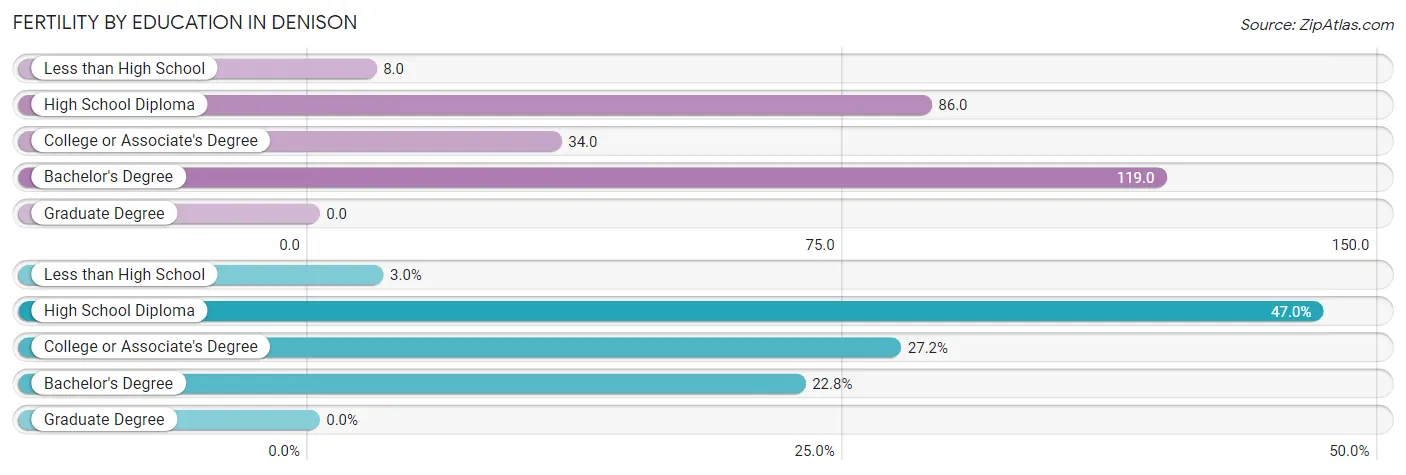
| Educational Attainment | Women with Births | Births / 1,000 Women |
| Less than High School | 8 (3.0%) | 8.0 |
| High School Diploma | 126 (47.0%) | 86.0 |
| College or Associate's Degree | 73 (27.2%) | 34.0 |
| Bachelor's Degree | 61 (22.8%) | 119.0 |
| Graduate Degree | 0 (0.0%) | 0.0 |
| Total | 268 (100.0%) | 51.0 |
Fertility by Education by Marriage Status in Denison
45.9% of women with births in Denison are unmarried. Women with the educational attainment of bachelor's degree are most likely to be married with 100.0% of them married at childbirth, while women with the educational attainment of less than high school are least likely to be married with 100.0% of them unmarried at childbirth.
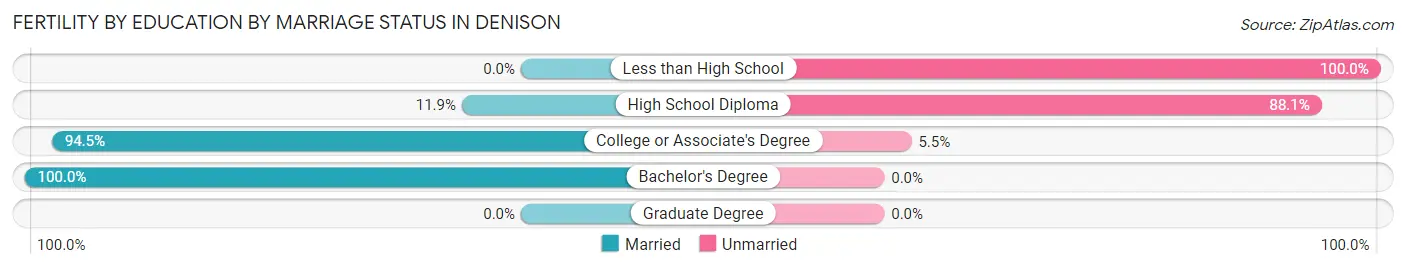
| Educational Attainment | Married | Unmarried |
| Less than High School | 0 (0.0%) | 8 (100.0%) |
| High School Diploma | 15 (11.9%) | 111 (88.1%) |
| College or Associate's Degree | 69 (94.5%) | 4 (5.5%) |
| Bachelor's Degree | 61 (100.0%) | 0 (0.0%) |
| Graduate Degree | 0 (0.0%) | 0 (0.0%) |
| Total | 145 (54.1%) | 123 (45.9%) |
Employment Characteristics in Denison
Employment by Class of Employer in Denison
Among the 10,633 employed individuals in Denison, private company employees (7,918 | 74.5%), local government employees (672 | 6.3%), and self-employed (not incorporated) (659 | 6.2%) make up the most common classes of employment.
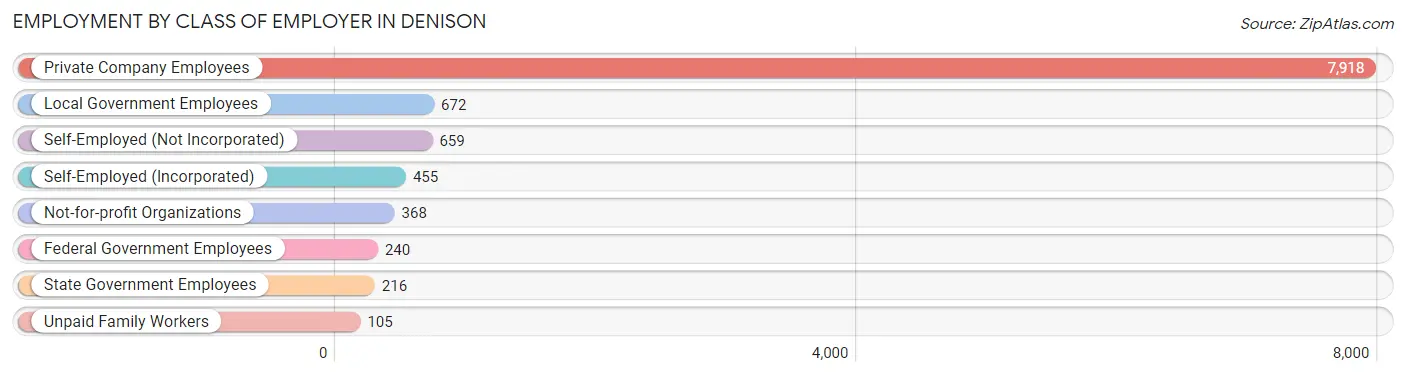
| Employer Class | # Employees | % Employees |
| Private Company Employees | 7,918 | 74.5% |
| Self-Employed (Incorporated) | 455 | 4.3% |
| Self-Employed (Not Incorporated) | 659 | 6.2% |
| Not-for-profit Organizations | 368 | 3.5% |
| Local Government Employees | 672 | 6.3% |
| State Government Employees | 216 | 2.0% |
| Federal Government Employees | 240 | 2.3% |
| Unpaid Family Workers | 105 | 1.0% |
| Total | 10,633 | 100.0% |
Employment Status by Age in Denison
According to the labor force statistics for Denison, out of the total population over 16 years of age (19,273), 58.9% or 11,352 individuals are in the labor force, with 5.2% or 590 of them unemployed. The age group with the highest labor force participation rate is 20 to 24 years, with 82.6% or 1,189 individuals in the labor force. Within the labor force, the 20 to 24 years age range has the highest percentage of unemployed individuals, with 9.8% or 117 of them being unemployed.
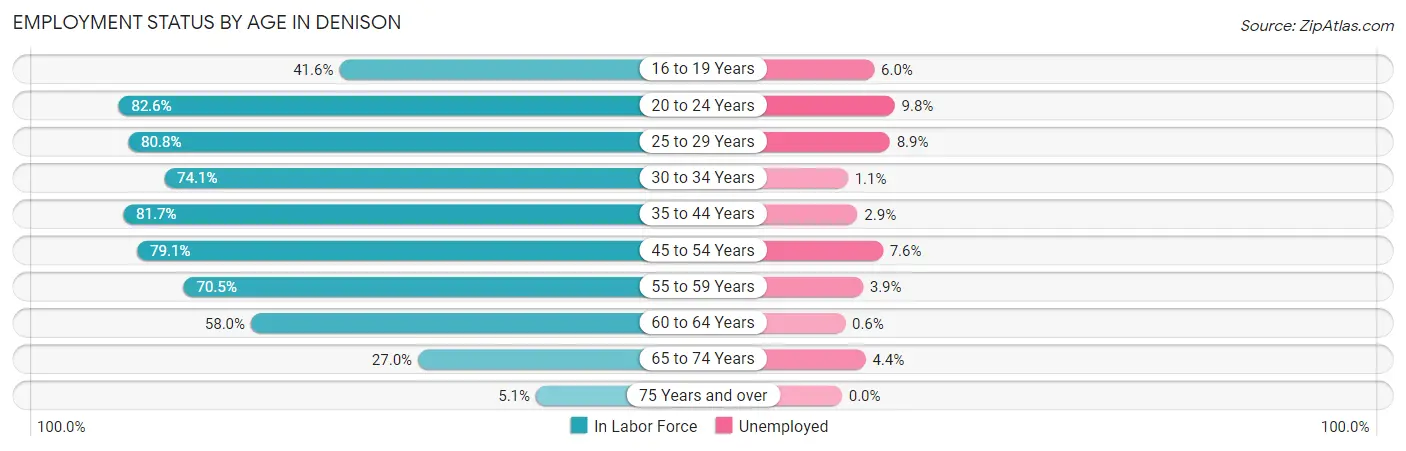
| Age Bracket | In Labor Force | Unemployed |
| 16 to 19 Years | 562 (41.6%) | 34 (6.0%) |
| 20 to 24 Years | 1,189 (82.6%) | 117 (9.8%) |
| 25 to 29 Years | 1,013 (80.8%) | 90 (8.9%) |
| 30 to 34 Years | 1,017 (74.1%) | 11 (1.1%) |
| 35 to 44 Years | 1,981 (81.7%) | 57 (2.9%) |
| 45 to 54 Years | 2,780 (79.1%) | 211 (7.6%) |
| 55 to 59 Years | 1,034 (70.5%) | 40 (3.9%) |
| 60 to 64 Years | 1,007 (58.0%) | 6 (0.6%) |
| 65 to 74 Years | 657 (27.0%) | 29 (4.4%) |
| 75 Years and over | 116 (5.1%) | 0 (0.0%) |
| Total | 11,352 (58.9%) | 590 (5.2%) |
Employment Status by Educational Attainment in Denison
According to labor force statistics for Denison, 75.1% of individuals (8,839) out of the total population between 25 and 64 years of age (11,769) are in the labor force, with 4.7% or 415 of them being unemployed. The group with the highest labor force participation rate are those with the educational attainment of bachelor's degree or higher, with 80.5% or 1,471 individuals in the labor force. Within the labor force, individuals with college / associate degree education have the highest percentage of unemployment, with 7.0% or 259 of them being unemployed.
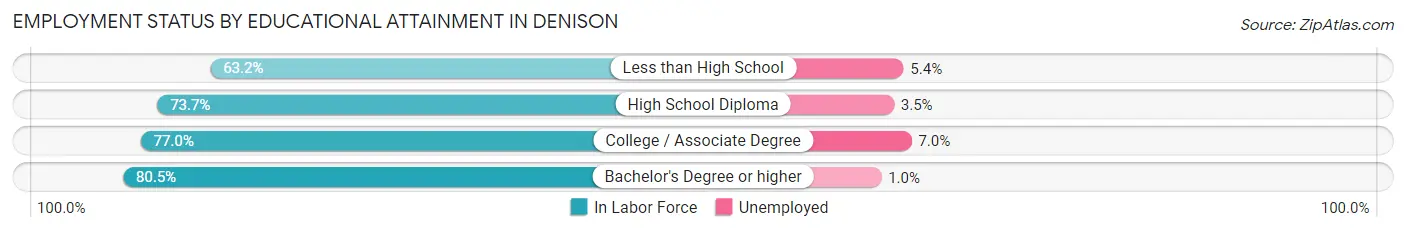
| Educational Attainment | In Labor Force | Unemployed |
| Less than High School | 736 (63.2%) | 63 (5.4%) |
| High School Diploma | 2,930 (73.7%) | 139 (3.5%) |
| College / Associate Degree | 3,698 (77.0%) | 336 (7.0%) |
| Bachelor's Degree or higher | 1,471 (80.5%) | 18 (1.0%) |
| Total | 8,839 (75.1%) | 553 (4.7%) |
Employment Occupations by Sex in Denison
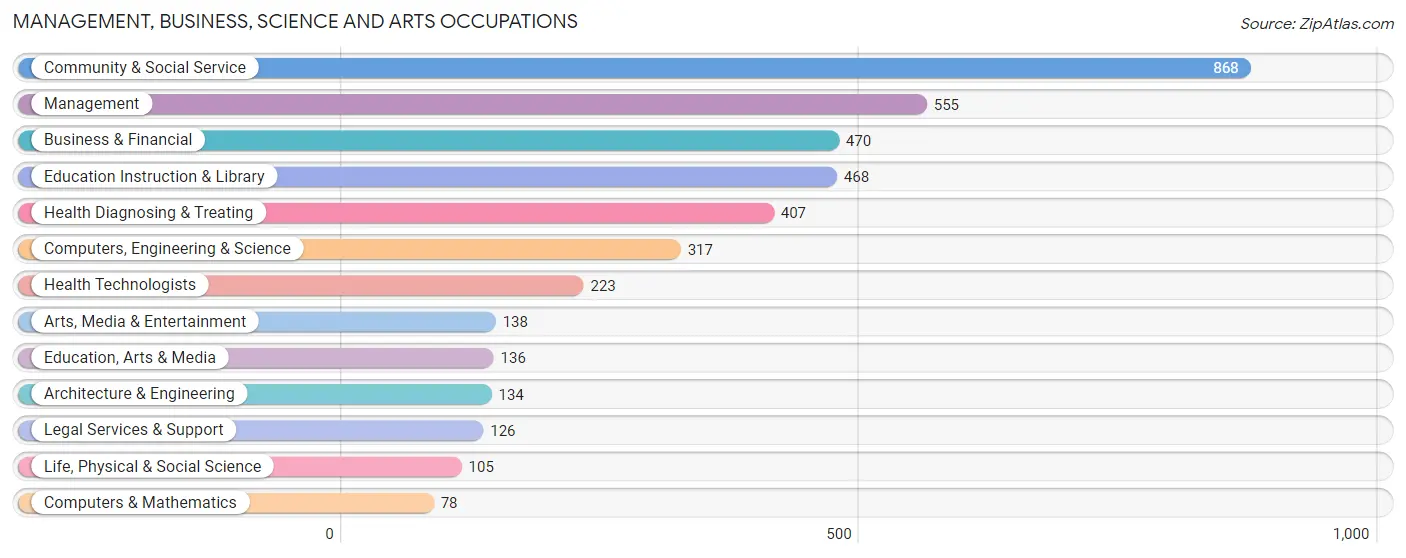
Management, Business, Science and Arts Occupations
The most common Management, Business, Science and Arts occupations in Denison are Community & Social Service (868 | 8.1%), Management (555 | 5.2%), Business & Financial (470 | 4.4%), Education Instruction & Library (468 | 4.4%), and Health Diagnosing & Treating (407 | 3.8%).
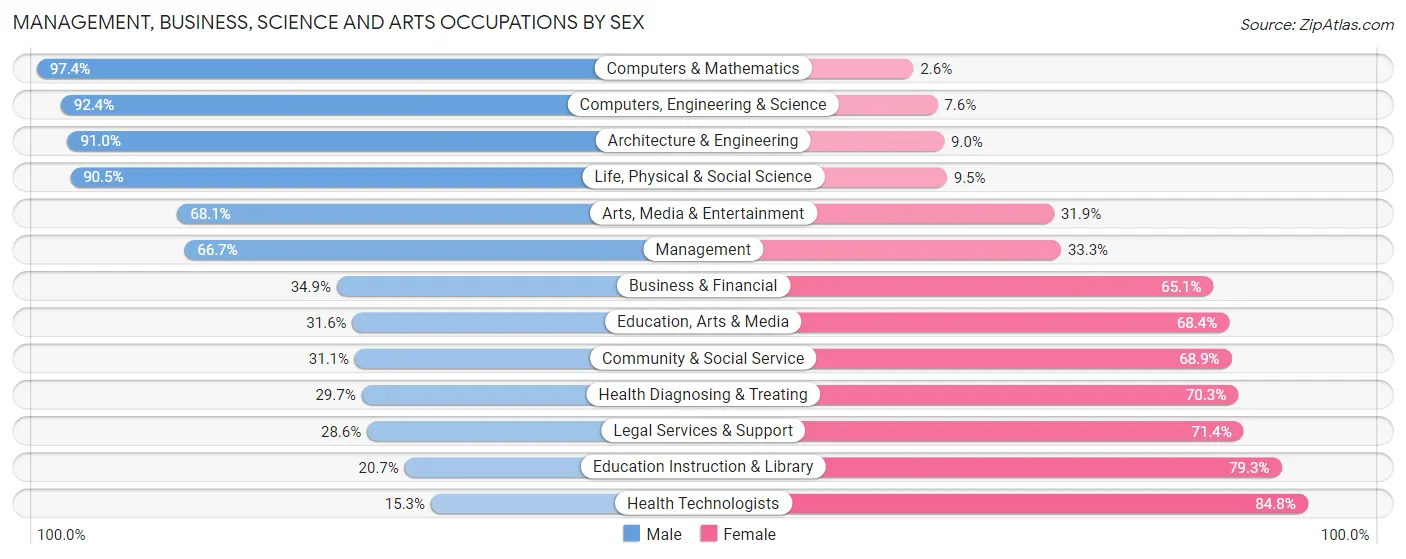
Management, Business, Science and Arts Occupations by Sex
Within the Management, Business, Science and Arts occupations in Denison, the most male-oriented occupations are Computers & Mathematics (97.4%), Computers, Engineering & Science (92.4%), and Architecture & Engineering (91.0%), while the most female-oriented occupations are Health Technologists (84.8%), Education Instruction & Library (79.3%), and Legal Services & Support (71.4%).
| Occupation | Male | Female |
| Management | 370 (66.7%) | 185 (33.3%) |
| Business & Financial | 164 (34.9%) | 306 (65.1%) |
| Computers, Engineering & Science | 293 (92.4%) | 24 (7.6%) |
| Computers & Mathematics | 76 (97.4%) | 2 (2.6%) |
| Architecture & Engineering | 122 (91.0%) | 12 (9.0%) |
| Life, Physical & Social Science | 95 (90.5%) | 10 (9.5%) |
| Community & Social Service | 270 (31.1%) | 598 (68.9%) |
| Education, Arts & Media | 43 (31.6%) | 93 (68.4%) |
| Legal Services & Support | 36 (28.6%) | 90 (71.4%) |
| Education Instruction & Library | 97 (20.7%) | 371 (79.3%) |
| Arts, Media & Entertainment | 94 (68.1%) | 44 (31.9%) |
| Health Diagnosing & Treating | 121 (29.7%) | 286 (70.3%) |
| Health Technologists | 34 (15.2%) | 189 (84.8%) |
| Total (Category) | 1,218 (46.5%) | 1,399 (53.5%) |
| Total (Overall) | 5,596 (52.1%) | 5,146 (47.9%) |
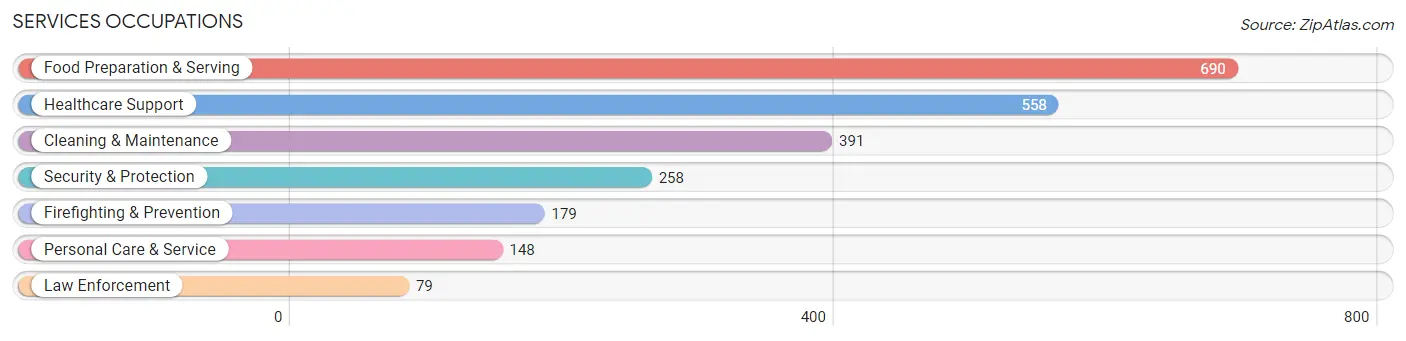
Services Occupations
The most common Services occupations in Denison are Food Preparation & Serving (690 | 6.4%), Healthcare Support (558 | 5.2%), Cleaning & Maintenance (391 | 3.6%), Security & Protection (258 | 2.4%), and Firefighting & Prevention (179 | 1.7%).
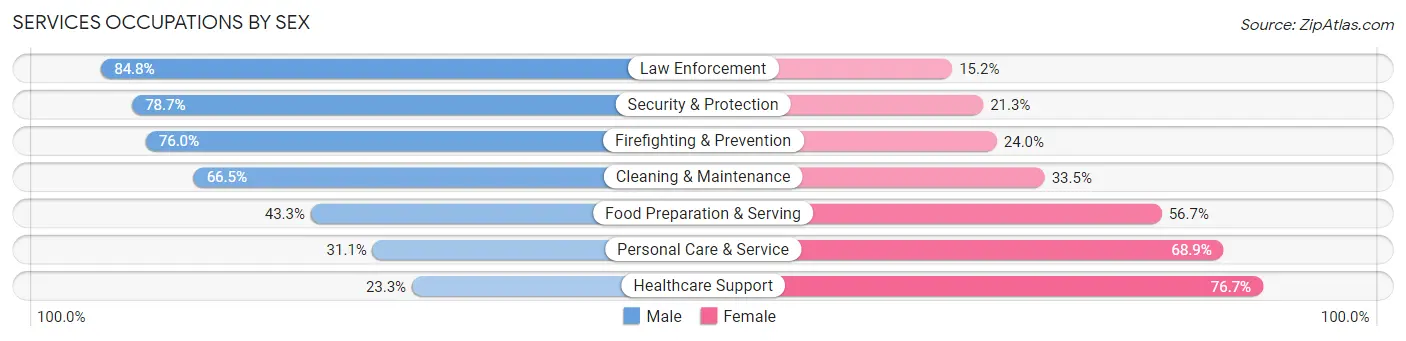
Services Occupations by Sex
Within the Services occupations in Denison, the most male-oriented occupations are Law Enforcement (84.8%), Security & Protection (78.7%), and Firefighting & Prevention (76.0%), while the most female-oriented occupations are Healthcare Support (76.7%), Personal Care & Service (68.9%), and Food Preparation & Serving (56.7%).
| Occupation | Male | Female |
| Healthcare Support | 130 (23.3%) | 428 (76.7%) |
| Security & Protection | 203 (78.7%) | 55 (21.3%) |
| Firefighting & Prevention | 136 (76.0%) | 43 (24.0%) |
| Law Enforcement | 67 (84.8%) | 12 (15.2%) |
| Food Preparation & Serving | 299 (43.3%) | 391 (56.7%) |
| Cleaning & Maintenance | 260 (66.5%) | 131 (33.5%) |
| Personal Care & Service | 46 (31.1%) | 102 (68.9%) |
| Total (Category) | 938 (45.9%) | 1,107 (54.1%) |
| Total (Overall) | 5,596 (52.1%) | 5,146 (47.9%) |
Sales and Office Occupations
The most common Sales and Office occupations in Denison are Office & Administration (1,578 | 14.7%), and Sales & Related (1,333 | 12.4%).

Sales and Office Occupations by Sex

| Occupation | Male | Female |
| Sales & Related | 536 (40.2%) | 797 (59.8%) |
| Office & Administration | 215 (13.6%) | 1,363 (86.4%) |
| Total (Category) | 751 (25.8%) | 2,160 (74.2%) |
| Total (Overall) | 5,596 (52.1%) | 5,146 (47.9%) |
Natural Resources, Construction and Maintenance Occupations
The most common Natural Resources, Construction and Maintenance occupations in Denison are Construction & Extraction (867 | 8.1%), Installation, Maintenance & Repair (275 | 2.6%), and Farming, Fishing & Forestry (81 | 0.7%).
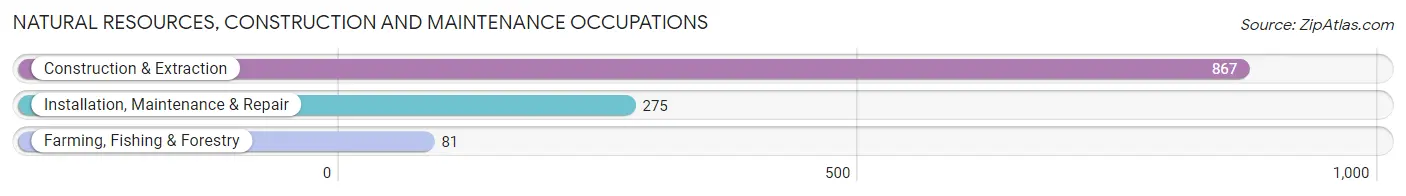
Natural Resources, Construction and Maintenance Occupations by Sex
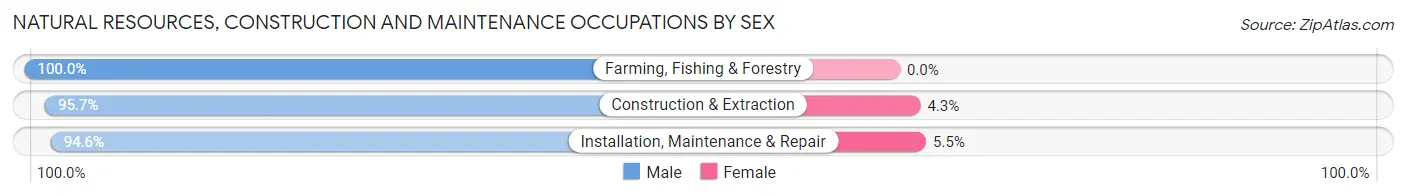
| Occupation | Male | Female |
| Farming, Fishing & Forestry | 81 (100.0%) | 0 (0.0%) |
| Construction & Extraction | 830 (95.7%) | 37 (4.3%) |
| Installation, Maintenance & Repair | 260 (94.6%) | 15 (5.4%) |
| Total (Category) | 1,171 (95.8%) | 52 (4.3%) |
| Total (Overall) | 5,596 (52.1%) | 5,146 (47.9%) |
Production, Transportation and Moving Occupations
The most common Production, Transportation and Moving occupations in Denison are Production (843 | 7.9%), Material Moving (651 | 6.1%), and Transportation (452 | 4.2%).
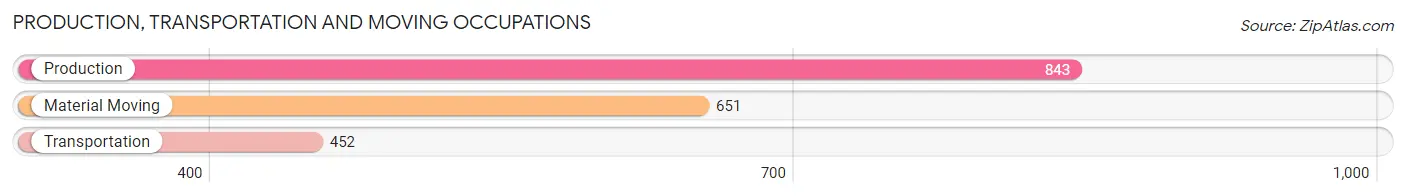
Production, Transportation and Moving Occupations by Sex
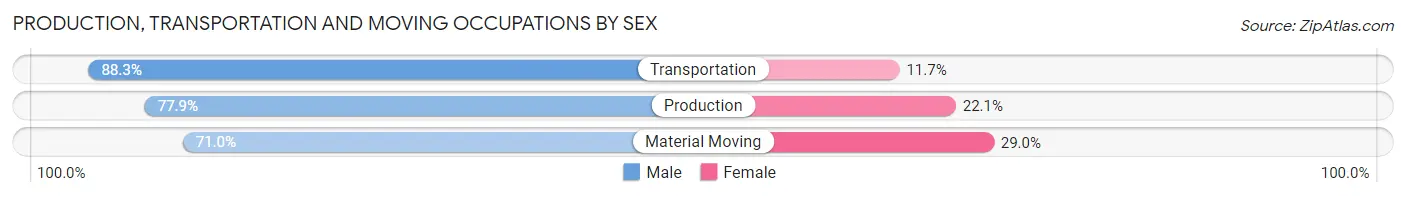
| Occupation | Male | Female |
| Production | 657 (77.9%) | 186 (22.1%) |
| Transportation | 399 (88.3%) | 53 (11.7%) |
| Material Moving | 462 (71.0%) | 189 (29.0%) |
| Total (Category) | 1,518 (78.0%) | 428 (22.0%) |
| Total (Overall) | 5,596 (52.1%) | 5,146 (47.9%) |
Employment Industries by Sex in Denison
Employment Industries in Denison
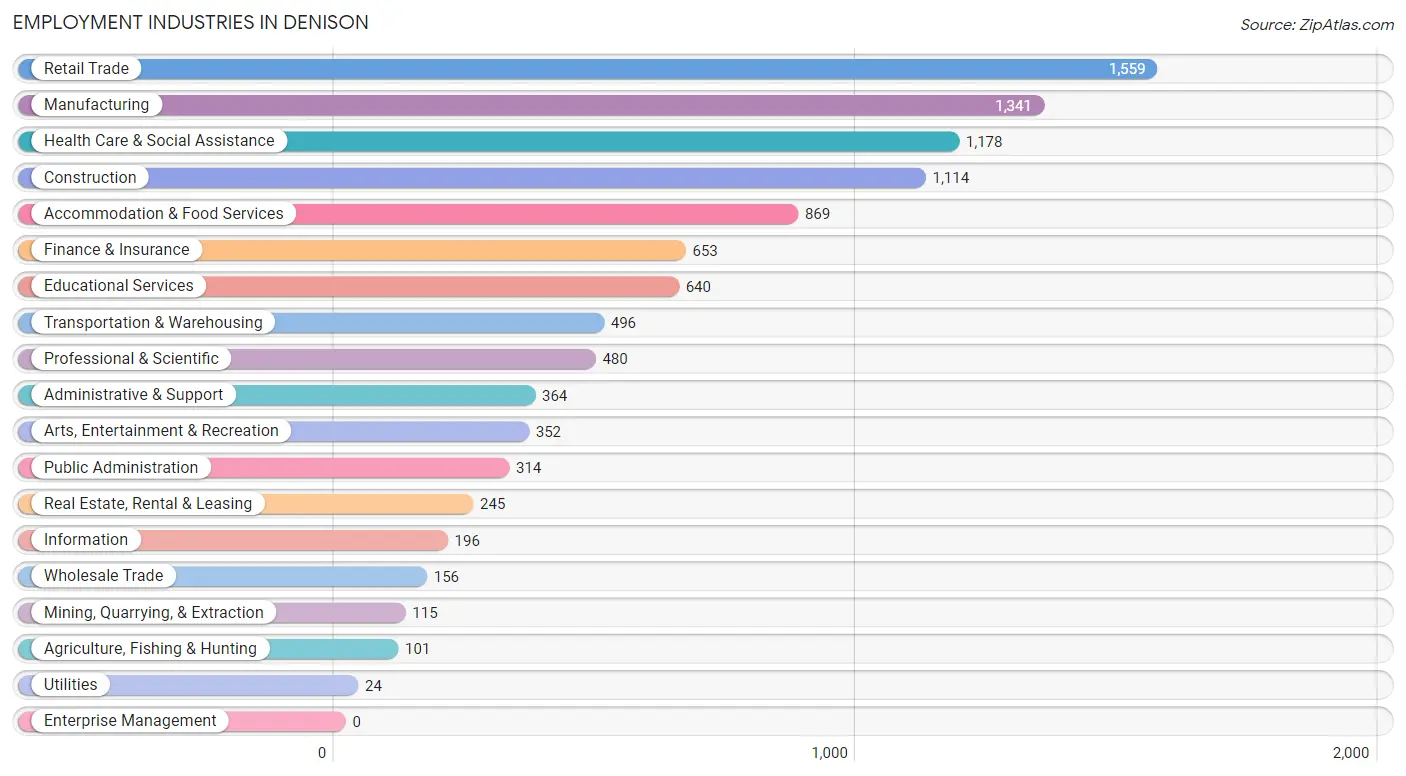
The major employment industries in Denison include Retail Trade (1,559 | 14.5%), Manufacturing (1,341 | 12.5%), Health Care & Social Assistance (1,178 | 11.0%), Construction (1,114 | 10.4%), and Accommodation & Food Services (869 | 8.1%).
Employment Industries by Sex in Denison
The Denison industries that see more men than women are Agriculture, Fishing & Hunting (100.0%), Mining, Quarrying, & Extraction (100.0%), and Utilities (100.0%), whereas the industries that tend to have a higher number of women are Educational Services (83.8%), Health Care & Social Assistance (82.2%), and Finance & Insurance (74.4%).
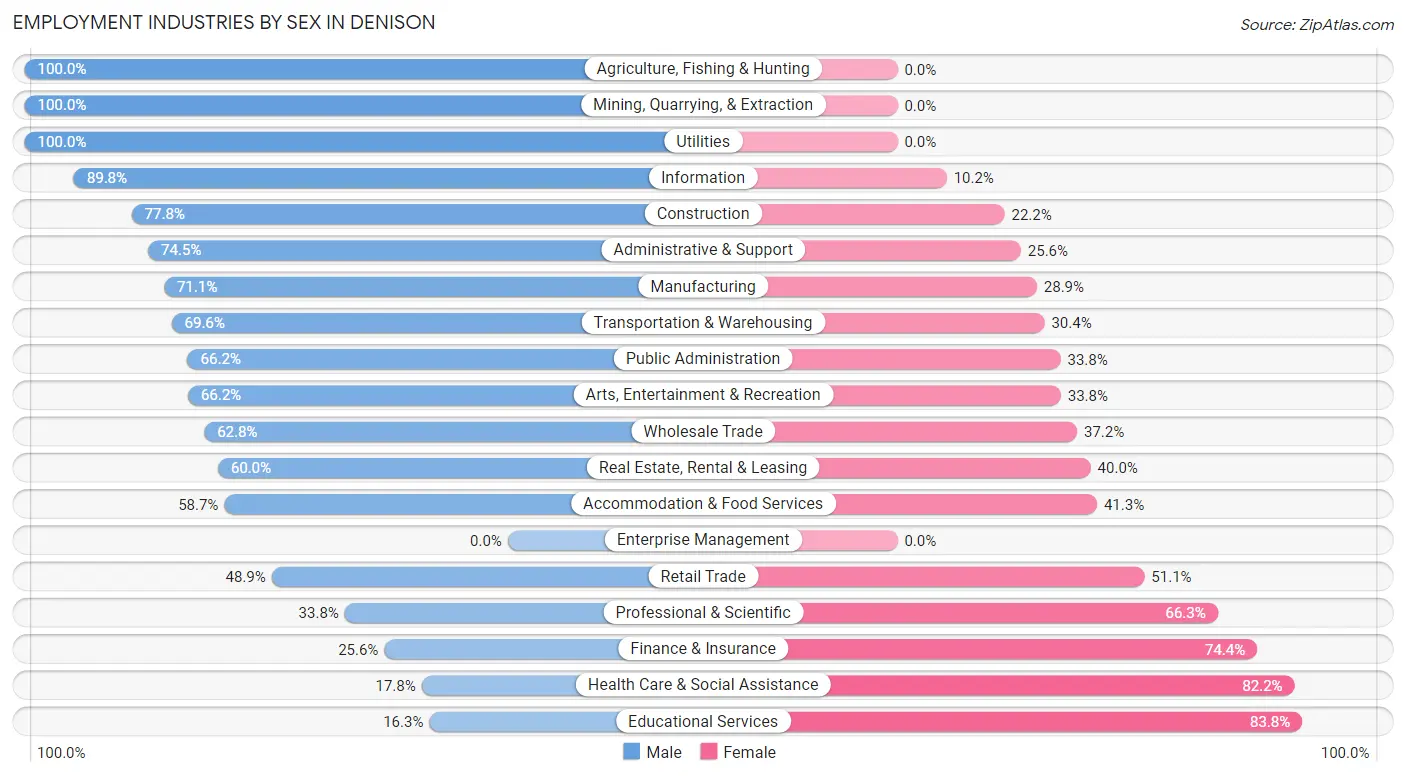
| Industry | Male | Female |
| Agriculture, Fishing & Hunting | 101 (100.0%) | 0 (0.0%) |
| Mining, Quarrying, & Extraction | 115 (100.0%) | 0 (0.0%) |
| Construction | 867 (77.8%) | 247 (22.2%) |
| Manufacturing | 954 (71.1%) | 387 (28.9%) |
| Wholesale Trade | 98 (62.8%) | 58 (37.2%) |
| Retail Trade | 762 (48.9%) | 797 (51.1%) |
| Transportation & Warehousing | 345 (69.6%) | 151 (30.4%) |
| Utilities | 24 (100.0%) | 0 (0.0%) |
| Information | 176 (89.8%) | 20 (10.2%) |
| Finance & Insurance | 167 (25.6%) | 486 (74.4%) |
| Real Estate, Rental & Leasing | 147 (60.0%) | 98 (40.0%) |
| Professional & Scientific | 162 (33.8%) | 318 (66.2%) |
| Enterprise Management | 0 (0.0%) | 0 (0.0%) |
| Administrative & Support | 271 (74.5%) | 93 (25.6%) |
| Educational Services | 104 (16.3%) | 536 (83.8%) |
| Health Care & Social Assistance | 210 (17.8%) | 968 (82.2%) |
| Arts, Entertainment & Recreation | 233 (66.2%) | 119 (33.8%) |
| Accommodation & Food Services | 510 (58.7%) | 359 (41.3%) |
| Public Administration | 208 (66.2%) | 106 (33.8%) |
| Total | 5,596 (52.1%) | 5,146 (47.9%) |
Education in Denison
School Enrollment in Denison
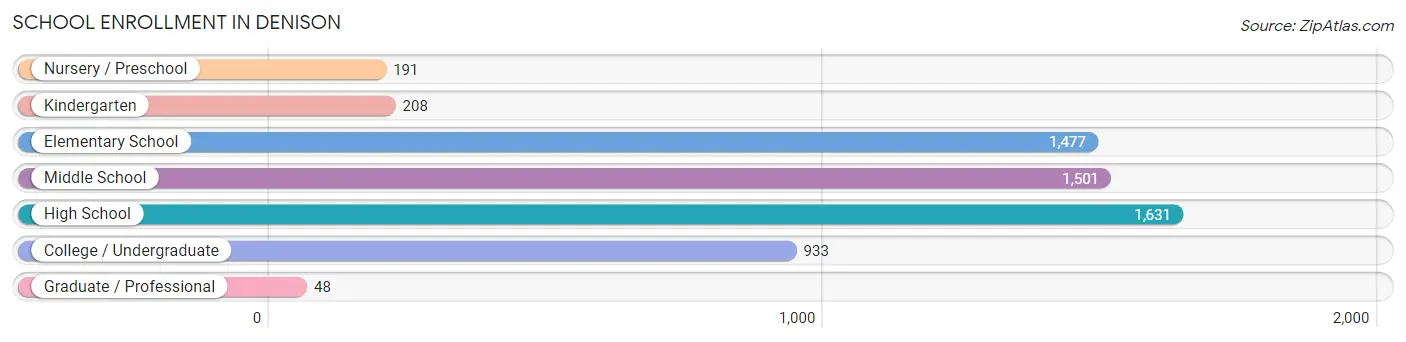
The most common levels of schooling among the 5,989 students in Denison are high school (1,631 | 27.2%), middle school (1,501 | 25.1%), and elementary school (1,477 | 24.7%).
| School Level | # Students | % Students |
| Nursery / Preschool | 191 | 3.2% |
| Kindergarten | 208 | 3.5% |
| Elementary School | 1,477 | 24.7% |
| Middle School | 1,501 | 25.1% |
| High School | 1,631 | 27.2% |
| College / Undergraduate | 933 | 15.6% |
| Graduate / Professional | 48 | 0.8% |
| Total | 5,989 | 100.0% |
School Enrollment by Age by Funding Source in Denison
Out of a total of 5,989 students who are enrolled in schools in Denison, 401 (6.7%) attend a private institution, while the remaining 5,588 (93.3%) are enrolled in public schools. The age group of 3 to 4 year olds has the highest likelihood of being enrolled in private schools, with 53 (36.3% in the age bracket) enrolled. Conversely, the age group of 18 to 19 year olds has the lowest likelihood of being enrolled in a private school, with 454 (100.0% in the age bracket) attending a public institution.
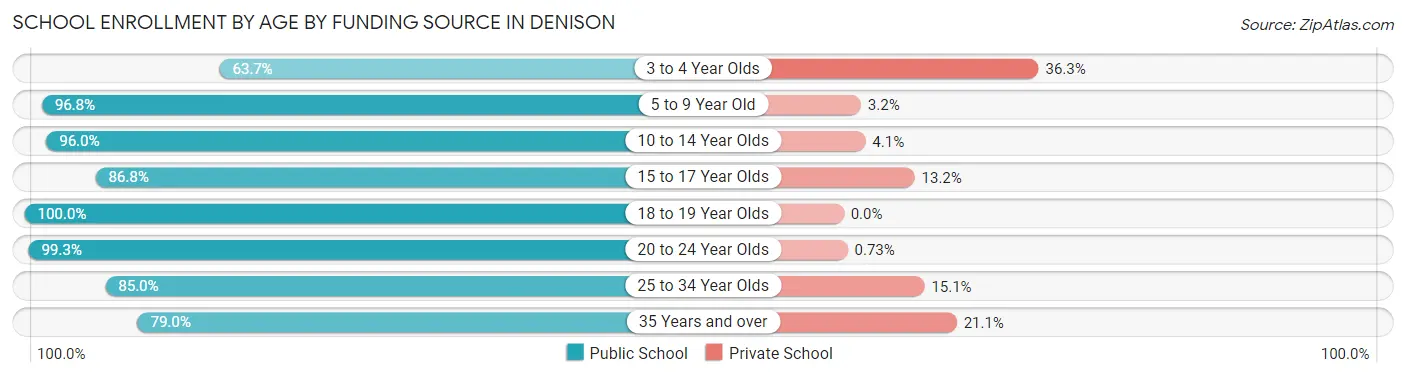
| Age Bracket | Public School | Private School |
| 3 to 4 Year Olds | 93 (63.7%) | 53 (36.3%) |
| 5 to 9 Year Old | 1,510 (96.8%) | 50 (3.2%) |
| 10 to 14 Year Olds | 1,846 (96.0%) | 78 (4.1%) |
| 15 to 17 Year Olds | 972 (86.8%) | 148 (13.2%) |
| 18 to 19 Year Olds | 454 (100.0%) | 0 (0.0%) |
| 20 to 24 Year Olds | 406 (99.3%) | 3 (0.7%) |
| 25 to 34 Year Olds | 158 (85.0%) | 28 (15.0%) |
| 35 Years and over | 150 (78.9%) | 40 (21.0%) |
| Total | 5,588 (93.3%) | 401 (6.7%) |
Educational Attainment by Field of Study in Denison
Business (557 | 17.6%), education (539 | 17.0%), science & technology (494 | 15.6%), arts & humanities (227 | 7.2%), and engineering (203 | 6.4%) are the most common fields of study among 3,171 individuals in Denison who have obtained a bachelor's degree or higher.
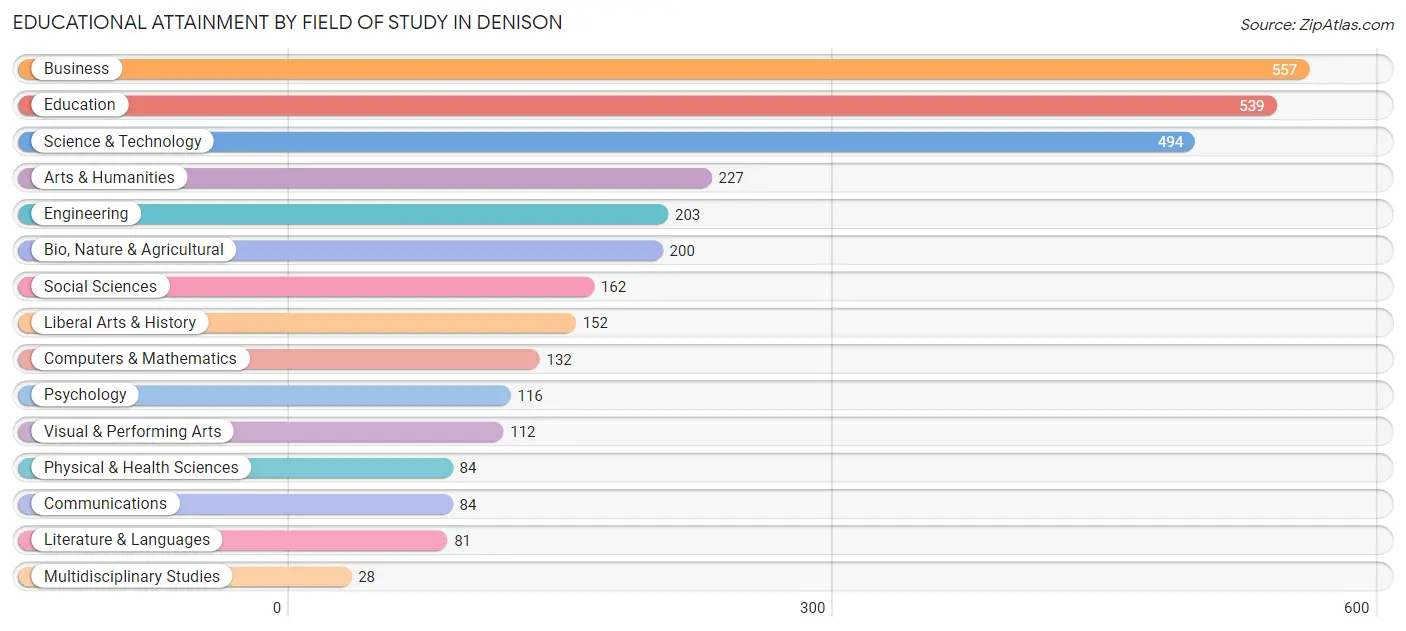
| Field of Study | # Graduates | % Graduates |
| Computers & Mathematics | 132 | 4.2% |
| Bio, Nature & Agricultural | 200 | 6.3% |
| Physical & Health Sciences | 84 | 2.6% |
| Psychology | 116 | 3.7% |
| Social Sciences | 162 | 5.1% |
| Engineering | 203 | 6.4% |
| Multidisciplinary Studies | 28 | 0.9% |
| Science & Technology | 494 | 15.6% |
| Business | 557 | 17.6% |
| Education | 539 | 17.0% |
| Literature & Languages | 81 | 2.5% |
| Liberal Arts & History | 152 | 4.8% |
| Visual & Performing Arts | 112 | 3.5% |
| Communications | 84 | 2.6% |
| Arts & Humanities | 227 | 7.2% |
| Total | 3,171 | 100.0% |
Transportation & Commute in Denison
Vehicle Availability by Sex in Denison
The most prevalent vehicle ownership categories in Denison are males with 2 vehicles (2,186, accounting for 39.4%) and females with 2 vehicles (1,899, making up 43.1%).
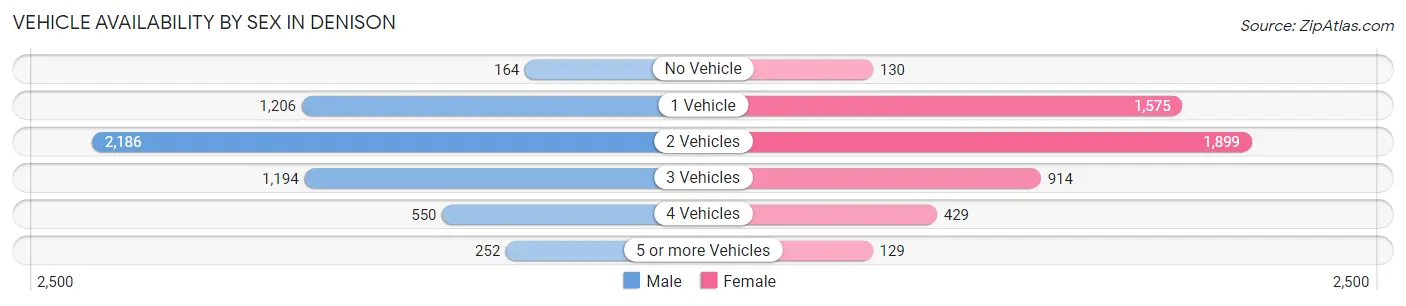
| Vehicles Available | Male | Female |
| No Vehicle | 164 (2.9%) | 130 (2.6%) |
| 1 Vehicle | 1,206 (21.7%) | 1,575 (31.0%) |
| 2 Vehicles | 2,186 (39.4%) | 1,899 (37.4%) |
| 3 Vehicles | 1,194 (21.5%) | 914 (18.0%) |
| 4 Vehicles | 550 (9.9%) | 429 (8.5%) |
| 5 or more Vehicles | 252 (4.5%) | 129 (2.5%) |
| Total | 5,552 (100.0%) | 5,076 (100.0%) |
Commute Time in Denison
The most frequently occuring commute durations in Denison are 10 to 14 minutes (2,140 commuters, 21.6%), 15 to 19 minutes (1,742 commuters, 17.6%), and 5 to 9 minutes (1,700 commuters, 17.2%).
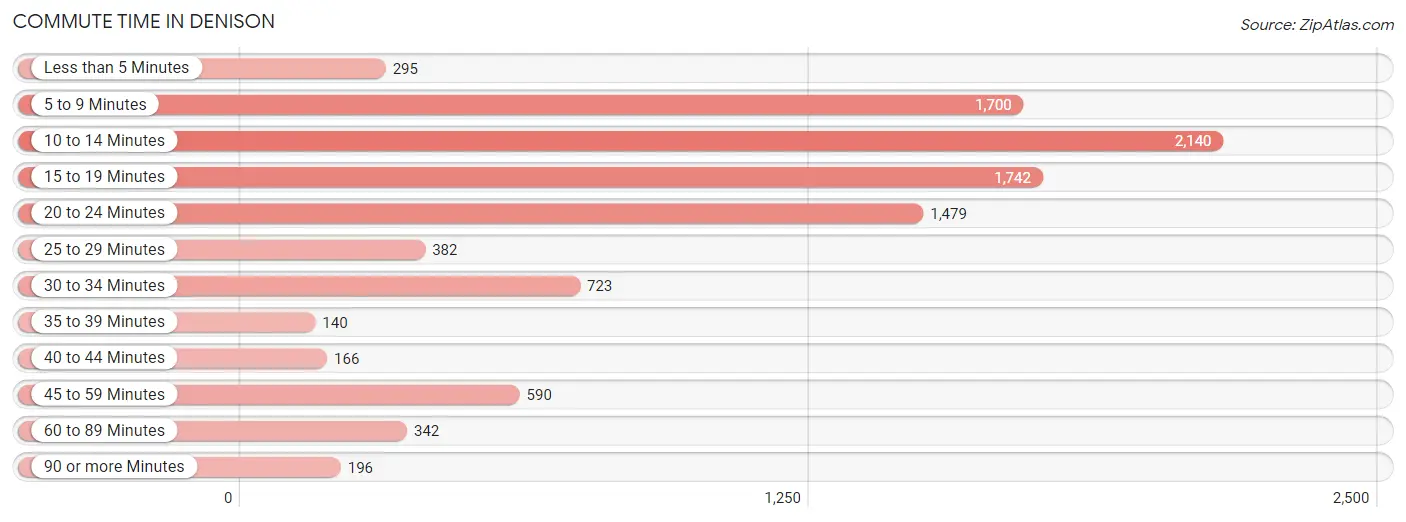
| Commute Time | # Commuters | % Commuters |
| Less than 5 Minutes | 295 | 3.0% |
| 5 to 9 Minutes | 1,700 | 17.2% |
| 10 to 14 Minutes | 2,140 | 21.6% |
| 15 to 19 Minutes | 1,742 | 17.6% |
| 20 to 24 Minutes | 1,479 | 14.9% |
| 25 to 29 Minutes | 382 | 3.9% |
| 30 to 34 Minutes | 723 | 7.3% |
| 35 to 39 Minutes | 140 | 1.4% |
| 40 to 44 Minutes | 166 | 1.7% |
| 45 to 59 Minutes | 590 | 6.0% |
| 60 to 89 Minutes | 342 | 3.5% |
| 90 or more Minutes | 196 | 2.0% |
Commute Time by Sex in Denison
The most common commute times in Denison are 10 to 14 minutes (1,116 commuters, 20.8%) for males and 5 to 9 minutes (1,094 commuters, 24.1%) for females.
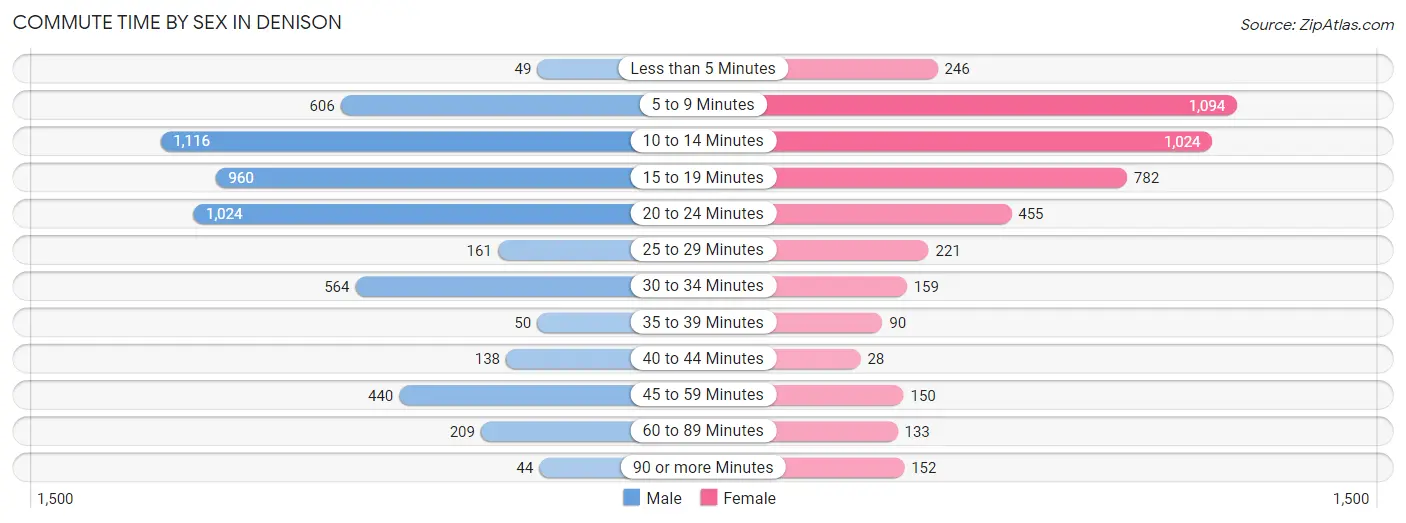
| Commute Time | Male | Female |
| Less than 5 Minutes | 49 (0.9%) | 246 (5.4%) |
| 5 to 9 Minutes | 606 (11.3%) | 1,094 (24.1%) |
| 10 to 14 Minutes | 1,116 (20.8%) | 1,024 (22.6%) |
| 15 to 19 Minutes | 960 (17.9%) | 782 (17.2%) |
| 20 to 24 Minutes | 1,024 (19.1%) | 455 (10.0%) |
| 25 to 29 Minutes | 161 (3.0%) | 221 (4.9%) |
| 30 to 34 Minutes | 564 (10.5%) | 159 (3.5%) |
| 35 to 39 Minutes | 50 (0.9%) | 90 (2.0%) |
| 40 to 44 Minutes | 138 (2.6%) | 28 (0.6%) |
| 45 to 59 Minutes | 440 (8.2%) | 150 (3.3%) |
| 60 to 89 Minutes | 209 (3.9%) | 133 (2.9%) |
| 90 or more Minutes | 44 (0.8%) | 152 (3.4%) |
Time of Departure to Work by Sex in Denison
The most frequent times of departure to work in Denison are 7:00 AM to 7:29 AM (818, 15.3%) for males and 7:30 AM to 7:59 AM (800, 17.6%) for females.
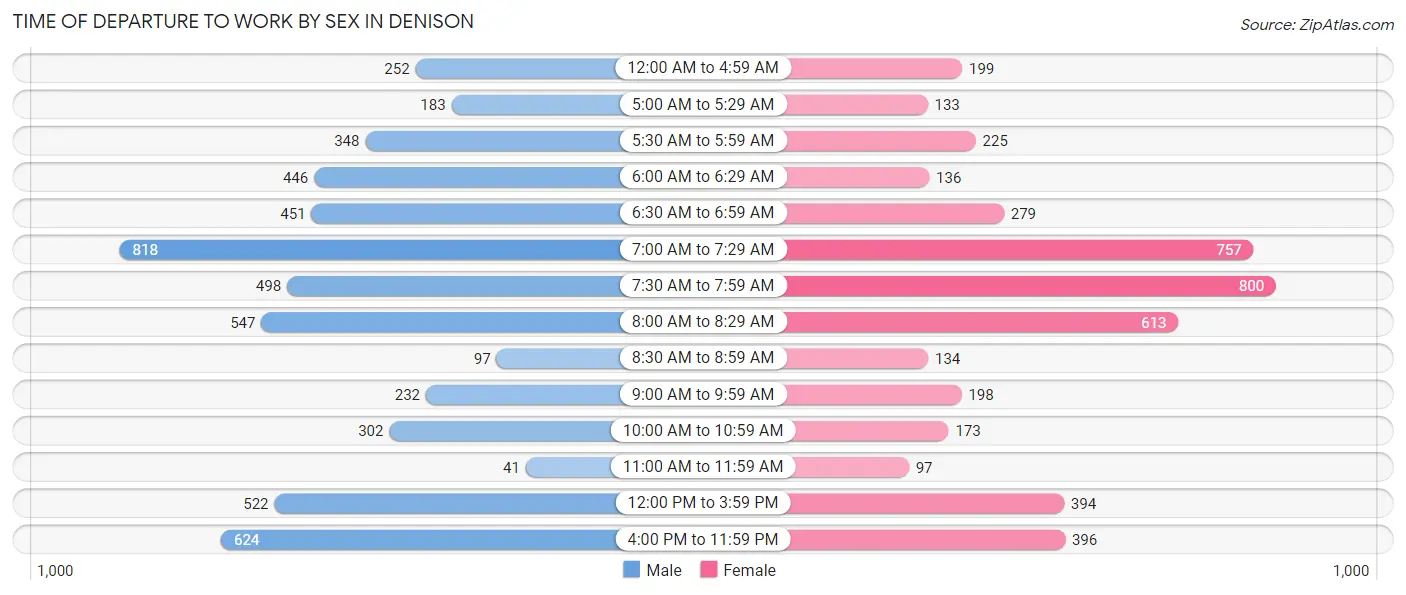
| Time of Departure | Male | Female |
| 12:00 AM to 4:59 AM | 252 (4.7%) | 199 (4.4%) |
| 5:00 AM to 5:29 AM | 183 (3.4%) | 133 (2.9%) |
| 5:30 AM to 5:59 AM | 348 (6.5%) | 225 (5.0%) |
| 6:00 AM to 6:29 AM | 446 (8.3%) | 136 (3.0%) |
| 6:30 AM to 6:59 AM | 451 (8.4%) | 279 (6.1%) |
| 7:00 AM to 7:29 AM | 818 (15.3%) | 757 (16.7%) |
| 7:30 AM to 7:59 AM | 498 (9.3%) | 800 (17.6%) |
| 8:00 AM to 8:29 AM | 547 (10.2%) | 613 (13.5%) |
| 8:30 AM to 8:59 AM | 97 (1.8%) | 134 (3.0%) |
| 9:00 AM to 9:59 AM | 232 (4.3%) | 198 (4.4%) |
| 10:00 AM to 10:59 AM | 302 (5.6%) | 173 (3.8%) |
| 11:00 AM to 11:59 AM | 41 (0.8%) | 97 (2.1%) |
| 12:00 PM to 3:59 PM | 522 (9.7%) | 394 (8.7%) |
| 4:00 PM to 11:59 PM | 624 (11.6%) | 396 (8.7%) |
| Total | 5,361 (100.0%) | 4,534 (100.0%) |
Housing Occupancy in Denison
Occupancy by Ownership in Denison
Of the total 9,588 dwellings in Denison, owner-occupied units account for 5,812 (60.6%), while renter-occupied units make up 3,776 (39.4%).
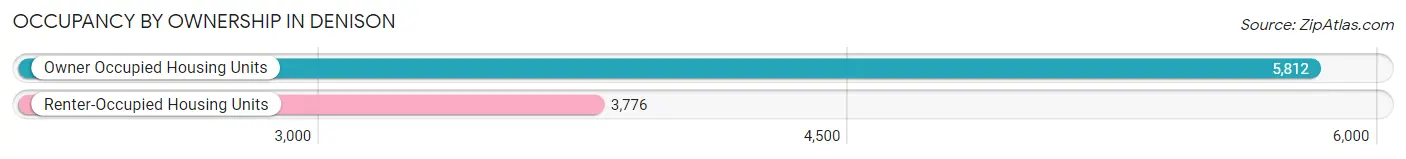
| Occupancy | # Housing Units | % Housing Units |
| Owner Occupied Housing Units | 5,812 | 60.6% |
| Renter-Occupied Housing Units | 3,776 | 39.4% |
| Total Occupied Housing Units | 9,588 | 100.0% |
Occupancy by Household Size in Denison
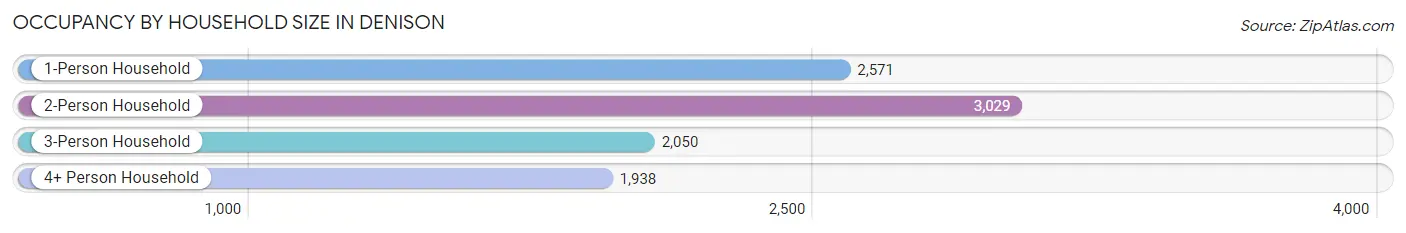
| Household Size | # Housing Units | % Housing Units |
| 1-Person Household | 2,571 | 26.8% |
| 2-Person Household | 3,029 | 31.6% |
| 3-Person Household | 2,050 | 21.4% |
| 4+ Person Household | 1,938 | 20.2% |
| Total Housing Units | 9,588 | 100.0% |
Occupancy by Ownership by Household Size in Denison
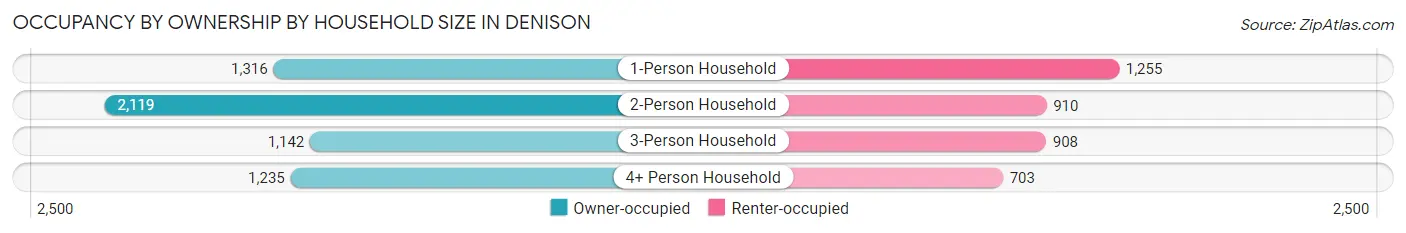
| Household Size | Owner-occupied | Renter-occupied |
| 1-Person Household | 1,316 (51.2%) | 1,255 (48.8%) |
| 2-Person Household | 2,119 (70.0%) | 910 (30.0%) |
| 3-Person Household | 1,142 (55.7%) | 908 (44.3%) |
| 4+ Person Household | 1,235 (63.7%) | 703 (36.3%) |
| Total Housing Units | 5,812 (60.6%) | 3,776 (39.4%) |
Occupancy by Educational Attainment in Denison
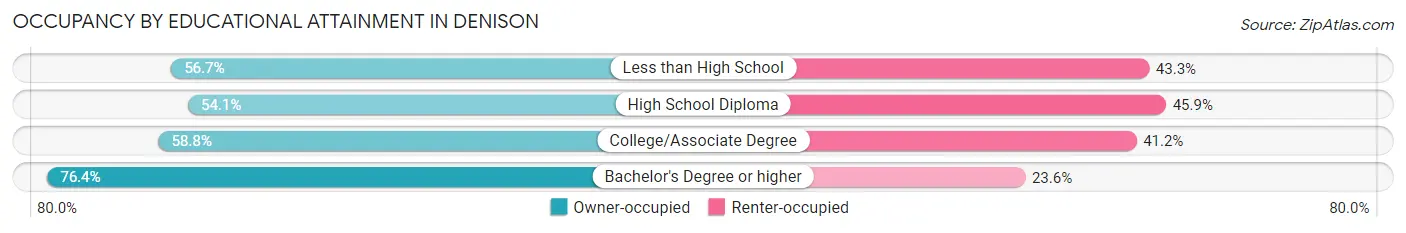
| Household Size | Owner-occupied | Renter-occupied |
| Less than High School | 505 (56.7%) | 385 (43.3%) |
| High School Diploma | 1,409 (54.1%) | 1,197 (45.9%) |
| College/Associate Degree | 2,519 (58.8%) | 1,768 (41.2%) |
| Bachelor's Degree or higher | 1,379 (76.4%) | 426 (23.6%) |
Occupancy by Age of Householder in Denison
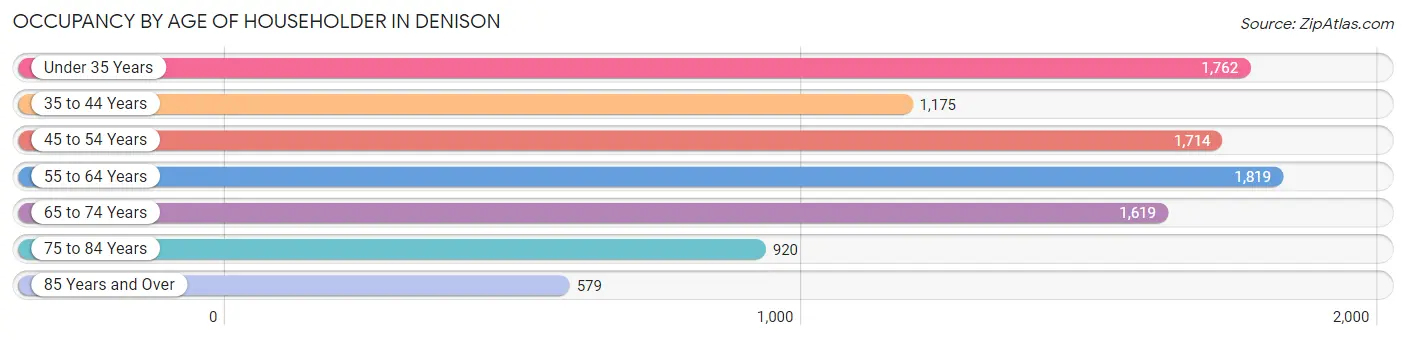
| Age Bracket | # Households | % Households |
| Under 35 Years | 1,762 | 18.4% |
| 35 to 44 Years | 1,175 | 12.2% |
| 45 to 54 Years | 1,714 | 17.9% |
| 55 to 64 Years | 1,819 | 19.0% |
| 65 to 74 Years | 1,619 | 16.9% |
| 75 to 84 Years | 920 | 9.6% |
| 85 Years and Over | 579 | 6.0% |
| Total | 9,588 | 100.0% |
Housing Finances in Denison
Median Income by Occupancy in Denison
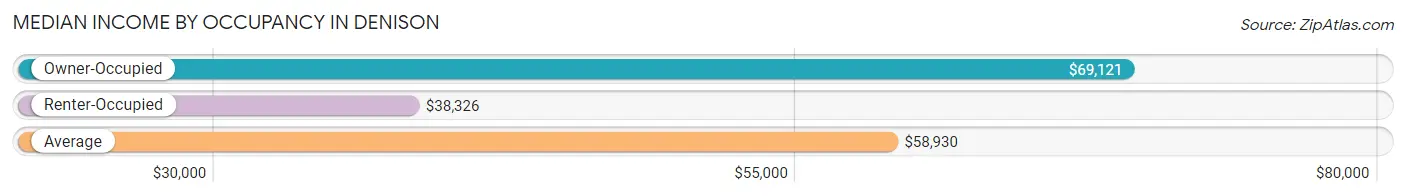
| Occupancy Type | # Households | Median Income |
| Owner-Occupied | 5,812 (60.6%) | $69,121 |
| Renter-Occupied | 3,776 (39.4%) | $38,326 |
| Average | 9,588 (100.0%) | $58,930 |
Occupancy by Householder Income Bracket in Denison
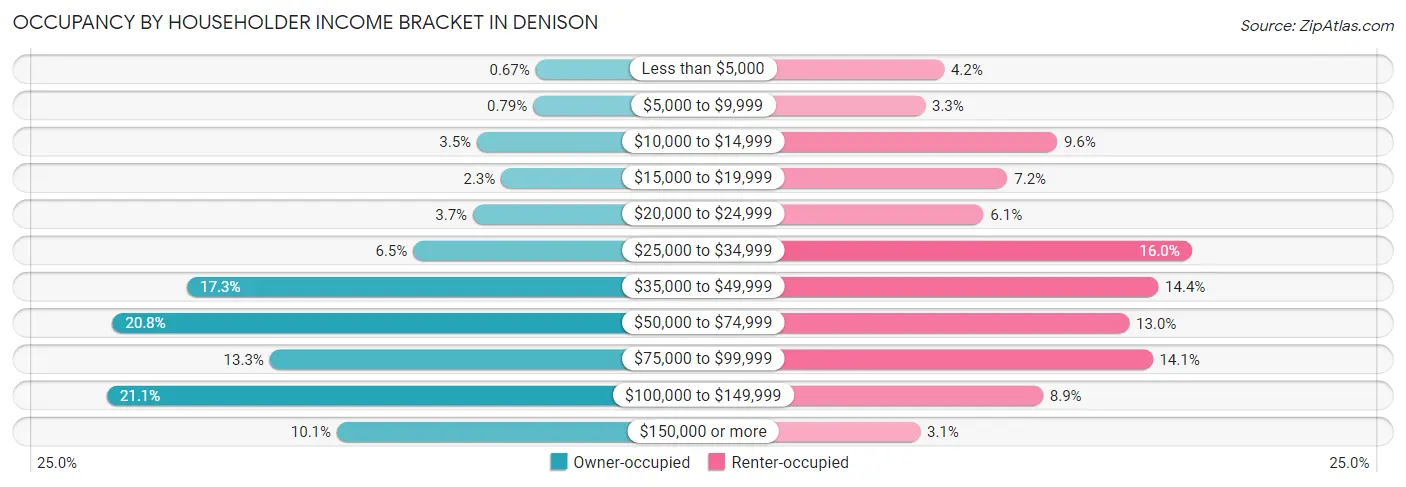
| Income Bracket | Owner-occupied | Renter-occupied |
| Less than $5,000 | 39 (0.7%) | 159 (4.2%) |
| $5,000 to $9,999 | 46 (0.8%) | 125 (3.3%) |
| $10,000 to $14,999 | 201 (3.5%) | 362 (9.6%) |
| $15,000 to $19,999 | 134 (2.3%) | 273 (7.2%) |
| $20,000 to $24,999 | 212 (3.6%) | 230 (6.1%) |
| $25,000 to $34,999 | 378 (6.5%) | 604 (16.0%) |
| $35,000 to $49,999 | 1,003 (17.3%) | 544 (14.4%) |
| $50,000 to $74,999 | 1,210 (20.8%) | 492 (13.0%) |
| $75,000 to $99,999 | 775 (13.3%) | 534 (14.1%) |
| $100,000 to $149,999 | 1,225 (21.1%) | 337 (8.9%) |
| $150,000 or more | 589 (10.1%) | 116 (3.1%) |
| Total | 5,812 (100.0%) | 3,776 (100.0%) |
Monthly Housing Cost Tiers in Denison
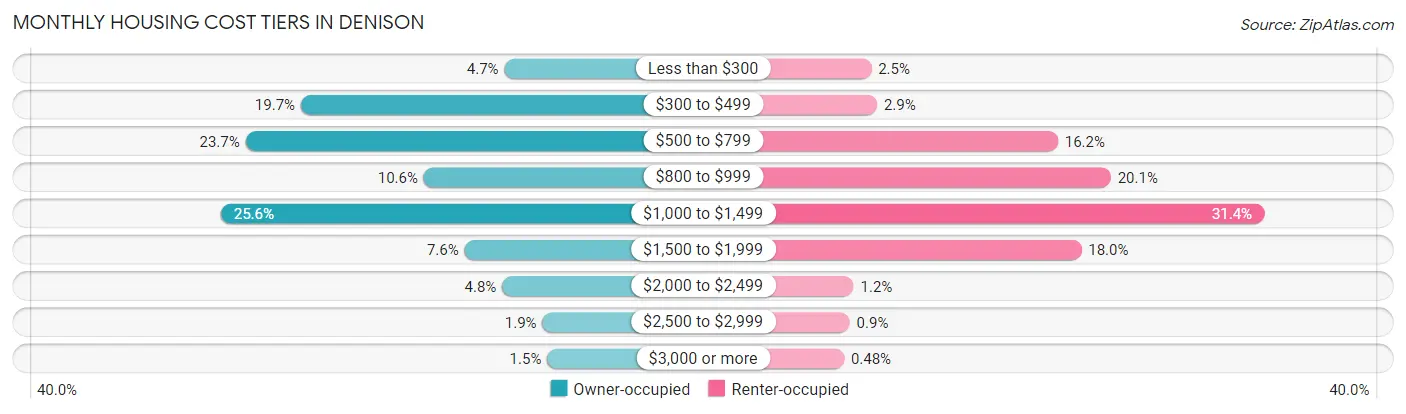
| Monthly Cost | Owner-occupied | Renter-occupied |
| Less than $300 | 271 (4.7%) | 94 (2.5%) |
| $300 to $499 | 1,142 (19.7%) | 110 (2.9%) |
| $500 to $799 | 1,379 (23.7%) | 613 (16.2%) |
| $800 to $999 | 616 (10.6%) | 760 (20.1%) |
| $1,000 to $1,499 | 1,485 (25.6%) | 1,186 (31.4%) |
| $1,500 to $1,999 | 442 (7.6%) | 678 (18.0%) |
| $2,000 to $2,499 | 281 (4.8%) | 45 (1.2%) |
| $2,500 to $2,999 | 108 (1.9%) | 34 (0.9%) |
| $3,000 or more | 88 (1.5%) | 18 (0.5%) |
| Total | 5,812 (100.0%) | 3,776 (100.0%) |
Physical Housing Characteristics in Denison
Housing Structures in Denison
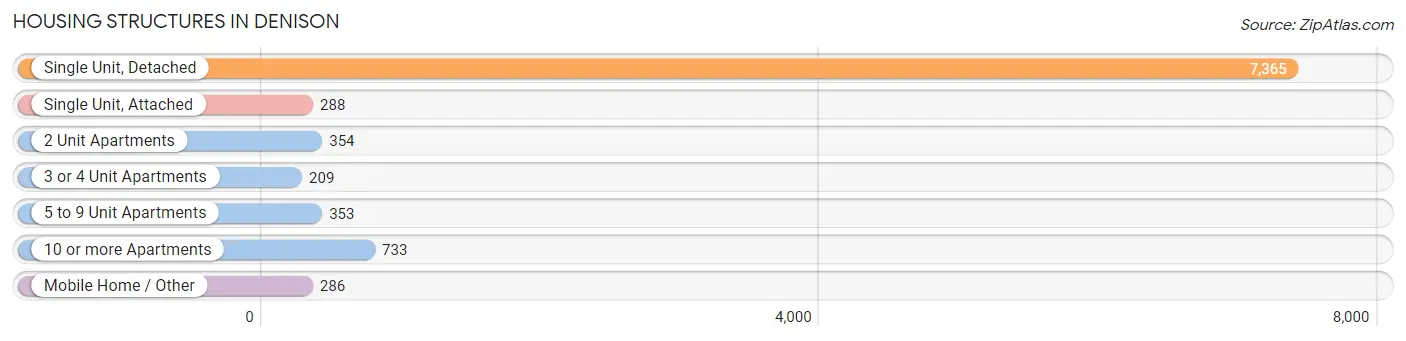
| Structure Type | # Housing Units | % Housing Units |
| Single Unit, Detached | 7,365 | 76.8% |
| Single Unit, Attached | 288 | 3.0% |
| 2 Unit Apartments | 354 | 3.7% |
| 3 or 4 Unit Apartments | 209 | 2.2% |
| 5 to 9 Unit Apartments | 353 | 3.7% |
| 10 or more Apartments | 733 | 7.6% |
| Mobile Home / Other | 286 | 3.0% |
| Total | 9,588 | 100.0% |
Housing Structures by Occupancy in Denison

| Structure Type | Owner-occupied | Renter-occupied |
| Single Unit, Detached | 5,612 (76.2%) | 1,753 (23.8%) |
| Single Unit, Attached | 87 (30.2%) | 201 (69.8%) |
| 2 Unit Apartments | 10 (2.8%) | 344 (97.2%) |
| 3 or 4 Unit Apartments | 0 (0.0%) | 209 (100.0%) |
| 5 to 9 Unit Apartments | 0 (0.0%) | 353 (100.0%) |
| 10 or more Apartments | 0 (0.0%) | 733 (100.0%) |
| Mobile Home / Other | 103 (36.0%) | 183 (64.0%) |
| Total | 5,812 (60.6%) | 3,776 (39.4%) |
Housing Structures by Number of Rooms in Denison
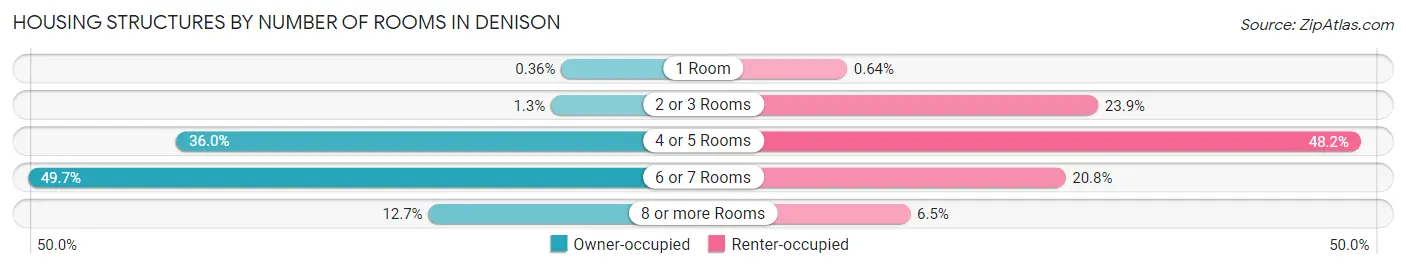
| Number of Rooms | Owner-occupied | Renter-occupied |
| 1 Room | 21 (0.4%) | 24 (0.6%) |
| 2 or 3 Rooms | 76 (1.3%) | 901 (23.9%) |
| 4 or 5 Rooms | 2,091 (36.0%) | 1,819 (48.2%) |
| 6 or 7 Rooms | 2,889 (49.7%) | 787 (20.8%) |
| 8 or more Rooms | 735 (12.7%) | 245 (6.5%) |
| Total | 5,812 (100.0%) | 3,776 (100.0%) |
Housing Structure by Heating Type in Denison
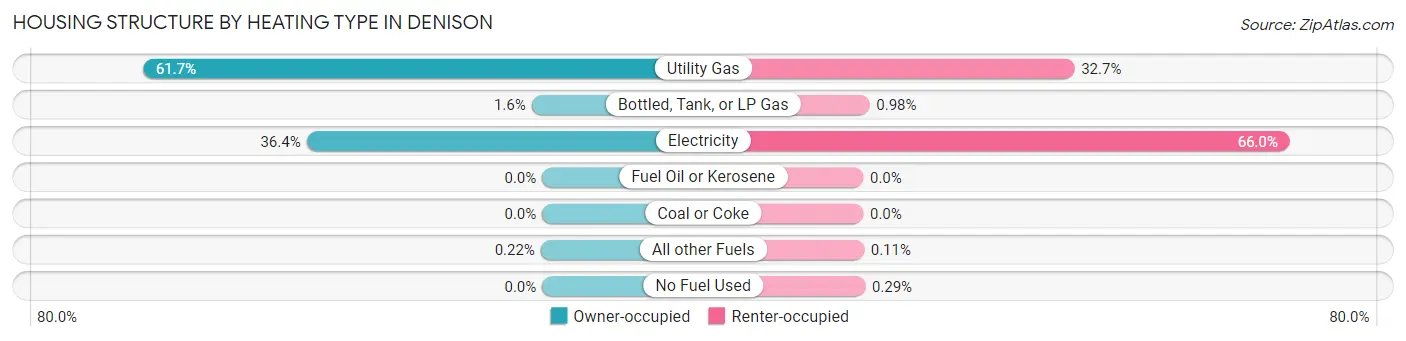
| Heating Type | Owner-occupied | Renter-occupied |
| Utility Gas | 3,587 (61.7%) | 1,233 (32.7%) |
| Bottled, Tank, or LP Gas | 95 (1.6%) | 37 (1.0%) |
| Electricity | 2,117 (36.4%) | 2,491 (66.0%) |
| Fuel Oil or Kerosene | 0 (0.0%) | 0 (0.0%) |
| Coal or Coke | 0 (0.0%) | 0 (0.0%) |
| All other Fuels | 13 (0.2%) | 4 (0.1%) |
| No Fuel Used | 0 (0.0%) | 11 (0.3%) |
| Total | 5,812 (100.0%) | 3,776 (100.0%) |
Household Vehicle Usage in Denison
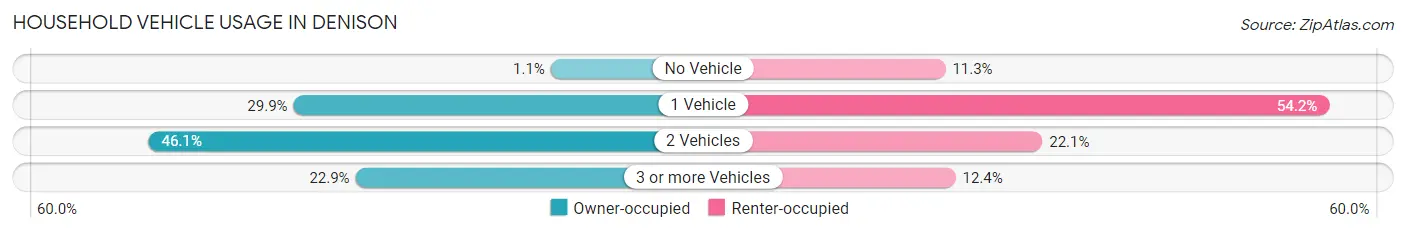
| Vehicles per Household | Owner-occupied | Renter-occupied |
| No Vehicle | 62 (1.1%) | 425 (11.3%) |
| 1 Vehicle | 1,737 (29.9%) | 2,048 (54.2%) |
| 2 Vehicles | 2,680 (46.1%) | 835 (22.1%) |
| 3 or more Vehicles | 1,333 (22.9%) | 468 (12.4%) |
| Total | 5,812 (100.0%) | 3,776 (100.0%) |
Real Estate & Mortgages in Denison
Real Estate and Mortgage Overview in Denison
| Characteristic | Without Mortgage | With Mortgage |
| Housing Units | 3,096 | 2,716 |
| Median Property Value | $137,100 | $147,400 |
| Median Household Income | $59,125 | $355 |
| Monthly Housing Costs | $534 | $88 |
| Real Estate Taxes | $1,853 | $77 |
Property Value by Mortgage Status in Denison
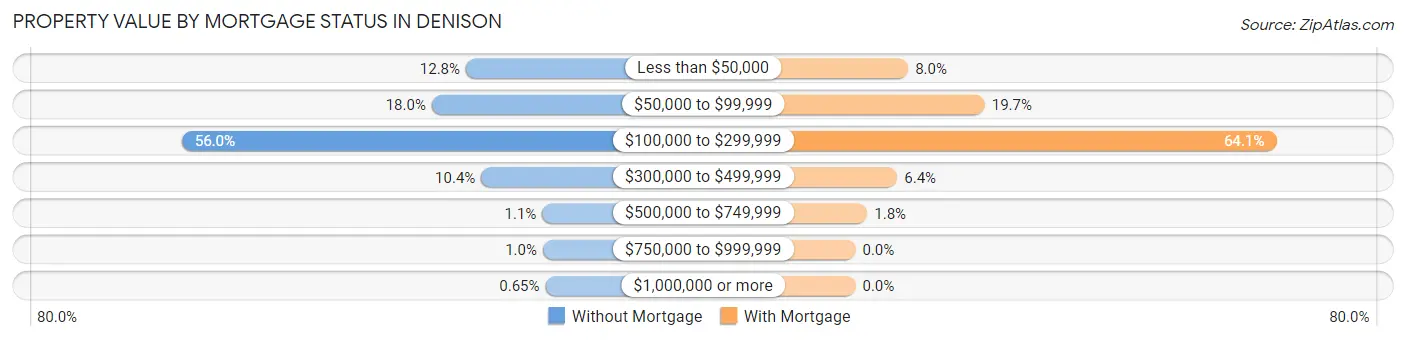
| Property Value | Without Mortgage | With Mortgage |
| Less than $50,000 | 395 (12.8%) | 218 (8.0%) |
| $50,000 to $99,999 | 556 (18.0%) | 535 (19.7%) |
| $100,000 to $299,999 | 1,735 (56.0%) | 1,741 (64.1%) |
| $300,000 to $499,999 | 323 (10.4%) | 173 (6.4%) |
| $500,000 to $749,999 | 35 (1.1%) | 49 (1.8%) |
| $750,000 to $999,999 | 32 (1.0%) | 0 (0.0%) |
| $1,000,000 or more | 20 (0.6%) | 0 (0.0%) |
| Total | 3,096 (100.0%) | 2,716 (100.0%) |
Household Income by Mortgage Status in Denison
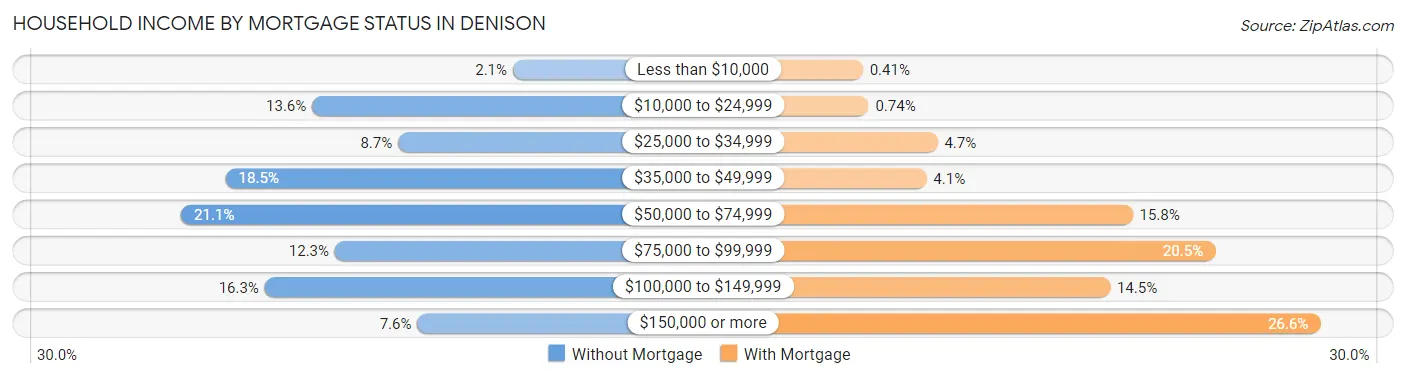
| Household Income | Without Mortgage | With Mortgage |
| Less than $10,000 | 65 (2.1%) | 11 (0.4%) |
| $10,000 to $24,999 | 420 (13.6%) | 20 (0.7%) |
| $25,000 to $34,999 | 268 (8.7%) | 127 (4.7%) |
| $35,000 to $49,999 | 573 (18.5%) | 110 (4.1%) |
| $50,000 to $74,999 | 652 (21.1%) | 430 (15.8%) |
| $75,000 to $99,999 | 380 (12.3%) | 558 (20.5%) |
| $100,000 to $149,999 | 504 (16.3%) | 395 (14.5%) |
| $150,000 or more | 234 (7.6%) | 721 (26.6%) |
| Total | 3,096 (100.0%) | 2,716 (100.0%) |
Property Value to Household Income Ratio in Denison
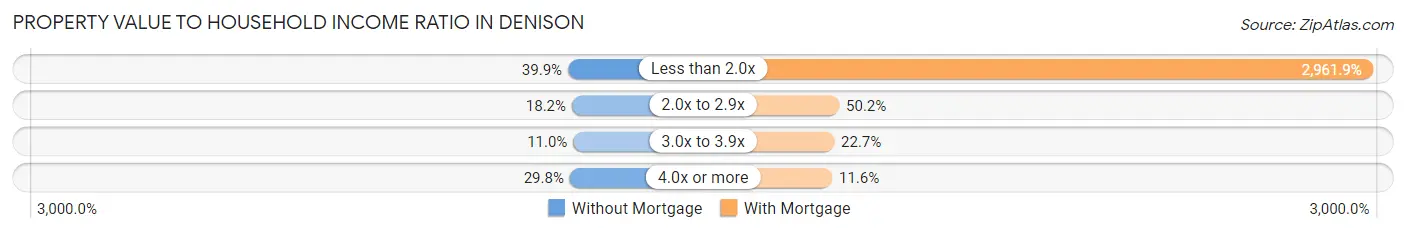
| Value-to-Income Ratio | Without Mortgage | With Mortgage |
| Less than 2.0x | 1,234 (39.9%) | 80,446 (2,961.9%) |
| 2.0x to 2.9x | 564 (18.2%) | 1,362 (50.1%) |
| 3.0x to 3.9x | 341 (11.0%) | 616 (22.7%) |
| 4.0x or more | 923 (29.8%) | 314 (11.6%) |
| Total | 3,096 (100.0%) | 2,716 (100.0%) |
Real Estate Taxes by Mortgage Status in Denison
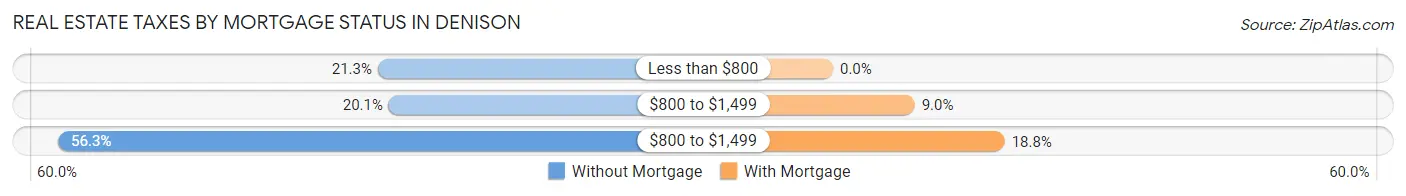
| Property Taxes | Without Mortgage | With Mortgage |
| Less than $800 | 659 (21.3%) | 0 (0.0%) |
| $800 to $1,499 | 622 (20.1%) | 243 (8.9%) |
| $800 to $1,499 | 1,744 (56.3%) | 511 (18.8%) |
| Total | 3,096 (100.0%) | 2,716 (100.0%) |
Health & Disability in Denison
Health Insurance Coverage by Age in Denison
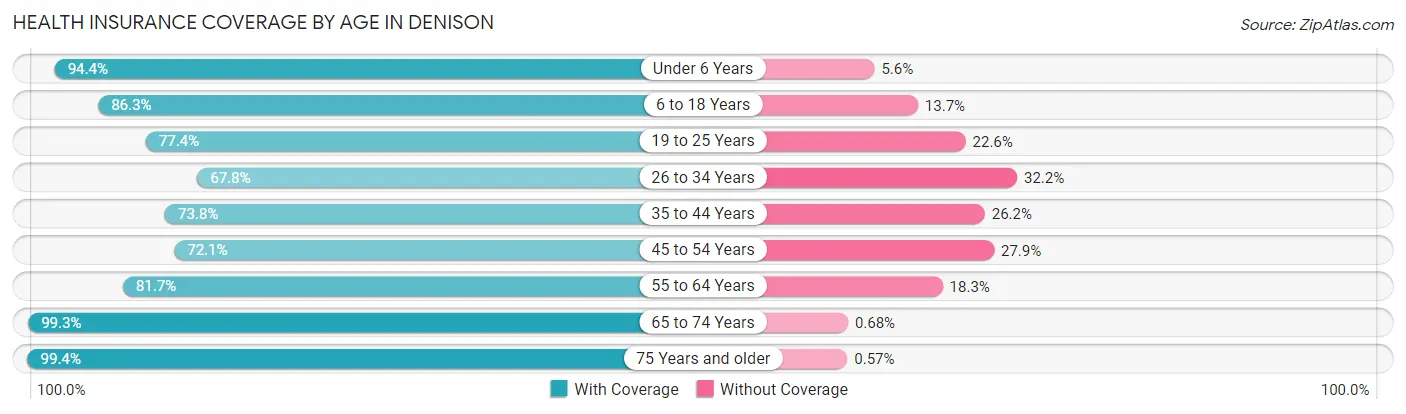
| Age Bracket | With Coverage | Without Coverage |
| Under 6 Years | 1,646 (94.4%) | 98 (5.6%) |
| 6 to 18 Years | 4,278 (86.3%) | 681 (13.7%) |
| 19 to 25 Years | 1,430 (77.4%) | 418 (22.6%) |
| 26 to 34 Years | 1,669 (67.8%) | 793 (32.2%) |
| 35 to 44 Years | 1,775 (73.8%) | 630 (26.2%) |
| 45 to 54 Years | 2,528 (72.1%) | 979 (27.9%) |
| 55 to 64 Years | 2,569 (81.7%) | 577 (18.3%) |
| 65 to 74 Years | 2,331 (99.3%) | 16 (0.7%) |
| 75 Years and older | 2,100 (99.4%) | 12 (0.6%) |
| Total | 20,326 (82.9%) | 4,204 (17.1%) |
Health Insurance Coverage by Citizenship Status in Denison
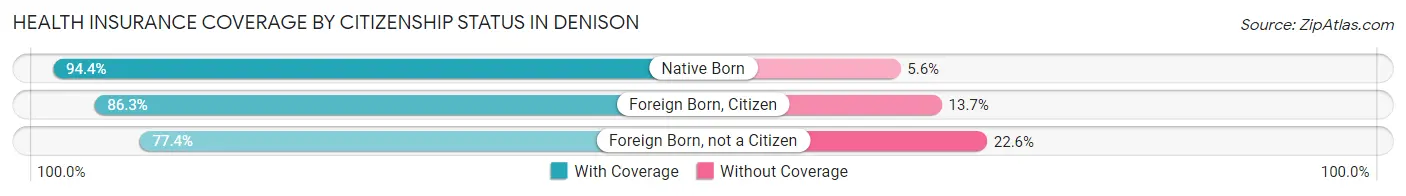
| Citizenship Status | With Coverage | Without Coverage |
| Native Born | 1,646 (94.4%) | 98 (5.6%) |
| Foreign Born, Citizen | 4,278 (86.3%) | 681 (13.7%) |
| Foreign Born, not a Citizen | 1,430 (77.4%) | 418 (22.6%) |
Health Insurance Coverage by Household Income in Denison
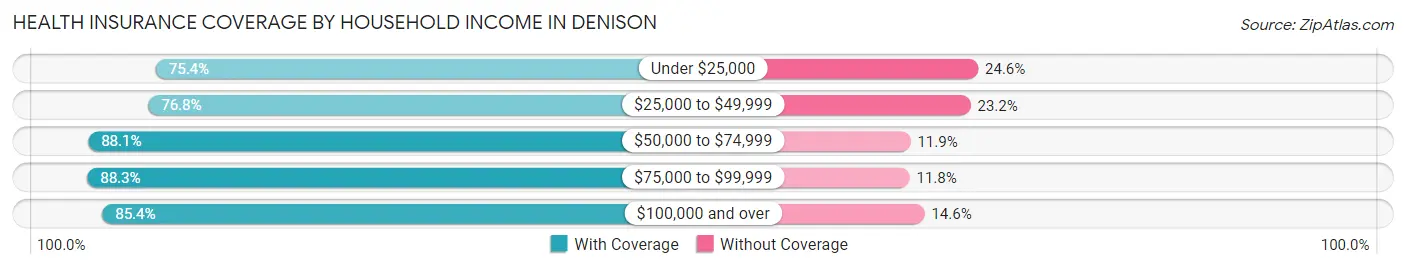
| Household Income | With Coverage | Without Coverage |
| Under $25,000 | 2,587 (75.4%) | 844 (24.6%) |
| $25,000 to $49,999 | 4,447 (76.8%) | 1,342 (23.2%) |
| $50,000 to $74,999 | 3,853 (88.1%) | 522 (11.9%) |
| $75,000 to $99,999 | 3,470 (88.2%) | 462 (11.7%) |
| $100,000 and over | 5,901 (85.4%) | 1,006 (14.6%) |
Public vs Private Health Insurance Coverage by Age in Denison
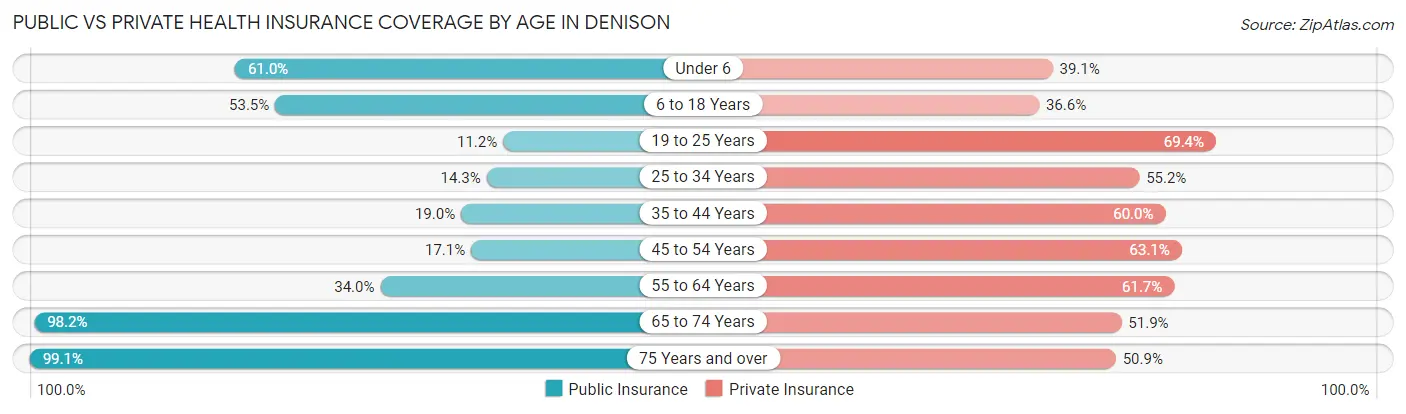
| Age Bracket | Public Insurance | Private Insurance |
| Under 6 | 1,063 (61.0%) | 682 (39.1%) |
| 6 to 18 Years | 2,653 (53.5%) | 1,815 (36.6%) |
| 19 to 25 Years | 207 (11.2%) | 1,283 (69.4%) |
| 25 to 34 Years | 351 (14.3%) | 1,359 (55.2%) |
| 35 to 44 Years | 457 (19.0%) | 1,444 (60.0%) |
| 45 to 54 Years | 601 (17.1%) | 2,212 (63.1%) |
| 55 to 64 Years | 1,069 (34.0%) | 1,940 (61.7%) |
| 65 to 74 Years | 2,305 (98.2%) | 1,218 (51.9%) |
| 75 Years and over | 2,092 (99.1%) | 1,074 (50.8%) |
| Total | 10,798 (44.0%) | 13,027 (53.1%) |
Disability Status by Sex by Age in Denison
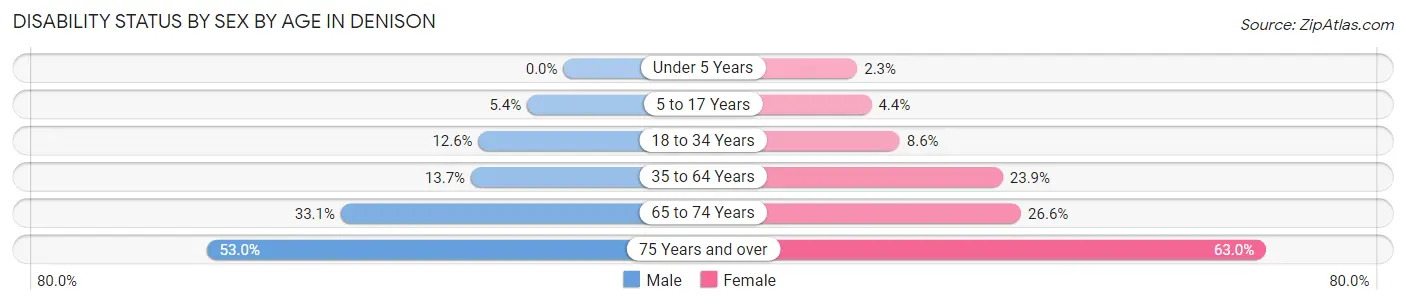
| Age Bracket | Male | Female |
| Under 5 Years | 0 (0.0%) | 17 (2.3%) |
| 5 to 17 Years | 143 (5.4%) | 90 (4.4%) |
| 18 to 34 Years | 273 (12.6%) | 222 (8.6%) |
| 35 to 64 Years | 602 (13.7%) | 1,117 (23.9%) |
| 65 to 74 Years | 309 (33.1%) | 376 (26.6%) |
| 75 Years and over | 403 (53.0%) | 851 (63.0%) |
Disability Class by Sex by Age in Denison
Disability Class: Hearing Difficulty
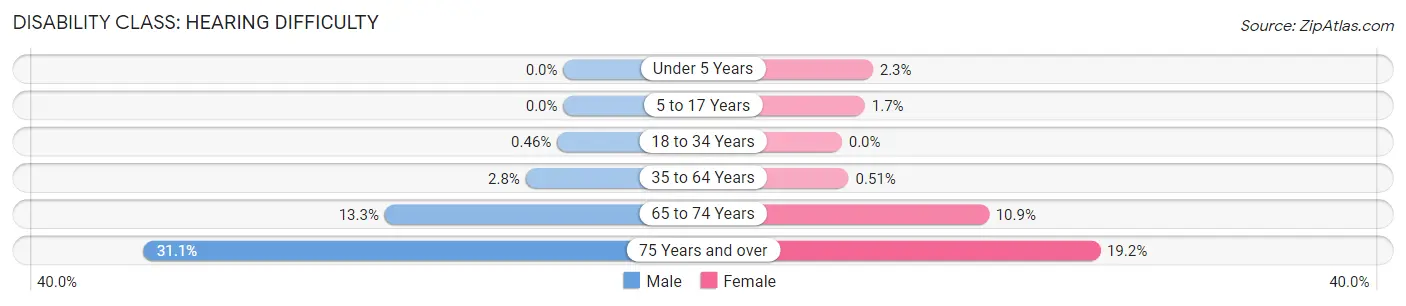
| Age Bracket | Male | Female |
| Under 5 Years | 0 (0.0%) | 17 (2.3%) |
| 5 to 17 Years | 0 (0.0%) | 35 (1.7%) |
| 18 to 34 Years | 10 (0.5%) | 0 (0.0%) |
| 35 to 64 Years | 123 (2.8%) | 24 (0.5%) |
| 65 to 74 Years | 124 (13.3%) | 154 (10.9%) |
| 75 Years and over | 237 (31.1%) | 259 (19.2%) |
Disability Class: Vision Difficulty
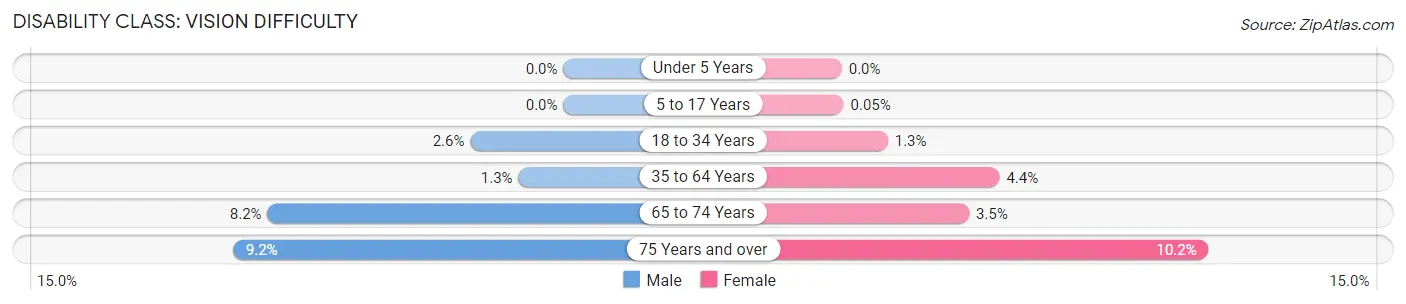
| Age Bracket | Male | Female |
| Under 5 Years | 0 (0.0%) | 0 (0.0%) |
| 5 to 17 Years | 0 (0.0%) | 1 (0.1%) |
| 18 to 34 Years | 56 (2.6%) | 33 (1.3%) |
| 35 to 64 Years | 55 (1.3%) | 205 (4.4%) |
| 65 to 74 Years | 77 (8.2%) | 50 (3.5%) |
| 75 Years and over | 70 (9.2%) | 138 (10.2%) |
Disability Class: Cognitive Difficulty
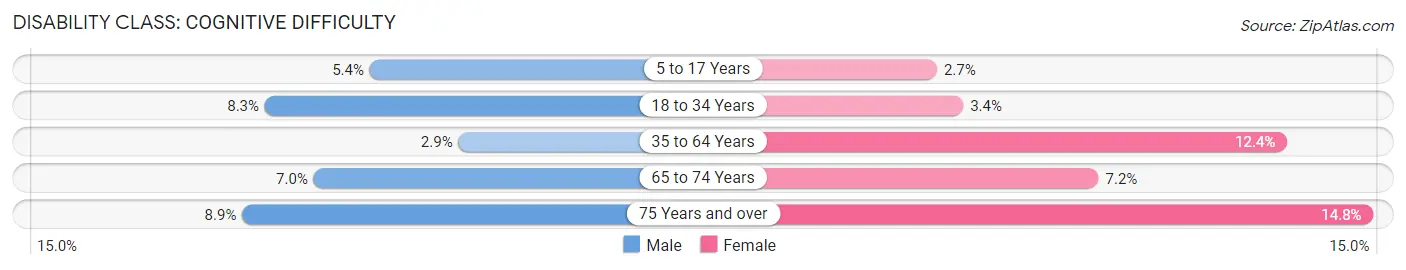
| Age Bracket | Male | Female |
| 5 to 17 Years | 143 (5.4%) | 54 (2.6%) |
| 18 to 34 Years | 180 (8.3%) | 87 (3.4%) |
| 35 to 64 Years | 128 (2.9%) | 579 (12.4%) |
| 65 to 74 Years | 65 (7.0%) | 101 (7.1%) |
| 75 Years and over | 68 (8.9%) | 200 (14.8%) |
Disability Class: Ambulatory Difficulty
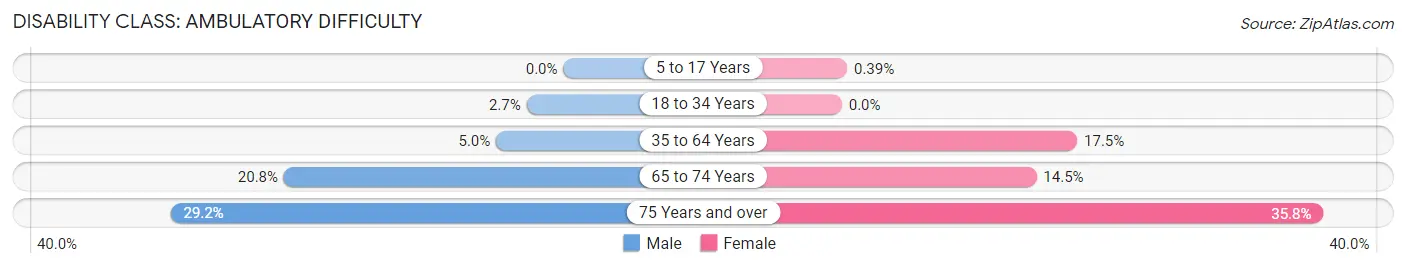
| Age Bracket | Male | Female |
| 5 to 17 Years | 0 (0.0%) | 8 (0.4%) |
| 18 to 34 Years | 59 (2.7%) | 0 (0.0%) |
| 35 to 64 Years | 219 (5.0%) | 816 (17.5%) |
| 65 to 74 Years | 194 (20.7%) | 204 (14.4%) |
| 75 Years and over | 222 (29.2%) | 483 (35.7%) |
Disability Class: Self-Care Difficulty
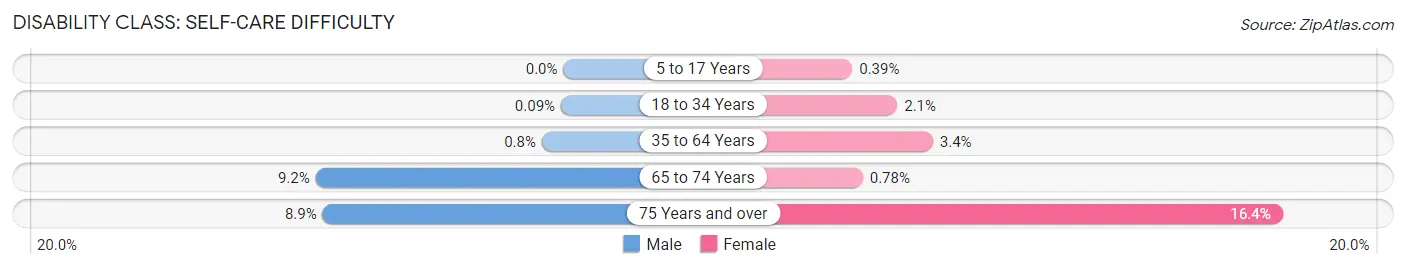
| Age Bracket | Male | Female |
| 5 to 17 Years | 0 (0.0%) | 8 (0.4%) |
| 18 to 34 Years | 2 (0.1%) | 53 (2.1%) |
| 35 to 64 Years | 35 (0.8%) | 158 (3.4%) |
| 65 to 74 Years | 86 (9.2%) | 11 (0.8%) |
| 75 Years and over | 68 (8.9%) | 221 (16.4%) |
Technology Access in Denison
Computing Device Access in Denison
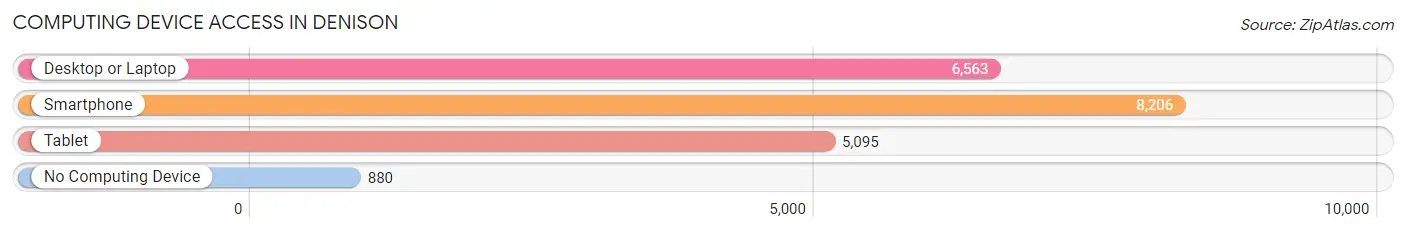
| Device Type | # Households | % Households |
| Desktop or Laptop | 6,563 | 68.4% |
| Smartphone | 8,206 | 85.6% |
| Tablet | 5,095 | 53.1% |
| No Computing Device | 880 | 9.2% |
| Total | 9,588 | 100.0% |
Internet Access in Denison
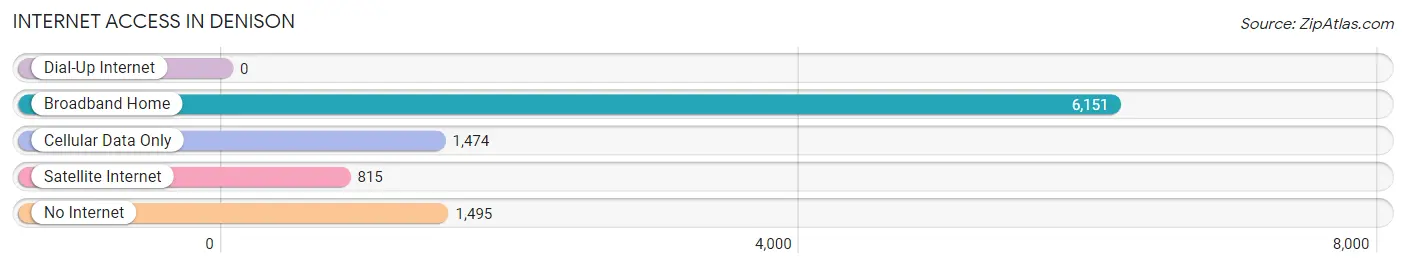
| Internet Type | # Households | % Households |
| Dial-Up Internet | 0 | 0.0% |
| Broadband Home | 6,151 | 64.1% |
| Cellular Data Only | 1,474 | 15.4% |
| Satellite Internet | 815 | 8.5% |
| No Internet | 1,495 | 15.6% |
| Total | 9,588 | 100.0% |
Denison Summary
Denison, Texas is a city located in Grayson County, Texas, United States. It is part of the Texoma region and is located 75 miles north of Dallas. The city is situated on the Red River and is the county seat of Grayson County. Denison is part of the Sherman-Denison Metropolitan Statistical Area, which is part of the larger Dallas-Fort Worth-Arlington Combined Statistical Area.
History
The area that is now Denison was first settled in 1872 by a group of settlers from Kentucky. The town was originally named “Bois d’Arc” after the Bois d’Arc trees that grew in the area. In 1873, the town was renamed Denison after the nearby Denison and Pacific Railway. The town was officially incorporated in 1875 and was designated as the county seat of Grayson County.
In the late 19th century, Denison was a major stop on the Texas and Pacific Railway. The city was also home to a large cotton mill, which was the largest employer in the area. The city experienced a period of growth in the early 20th century, with the population increasing from 4,000 in 1900 to over 10,000 by 1930.
During World War II, Denison was home to a large military base, Camp Howze. The base was used to train soldiers for the war effort and was the largest training camp in the United States. After the war, the base was closed and the population of Denison decreased.
Geography
Denison is located in Grayson County, Texas, at the intersection of U.S. Highway 75 and State Highway 91. The city is situated on the Red River and is bordered by the cities of Sherman, Pottsboro, and Whitesboro. Denison is located approximately 75 miles north of Dallas and is part of the Texoma region.
The city has a total area of 16.2 square miles, of which 16.1 square miles is land and 0.1 square miles is water. The terrain of Denison is mostly flat, with some rolling hills in the northern part of the city. The climate is humid subtropical, with hot summers and mild winters.
Economy
Denison’s economy is largely based on manufacturing and retail. The city is home to several large manufacturing companies, including Denison Industries, which produces automotive parts, and Denison Plastics, which produces plastic products. The city is also home to several retail stores, including Walmart, Target, and Lowe’s.
The city is also home to several educational institutions, including Grayson College and Austin College. The city is also home to a number of healthcare facilities, including Texoma Medical Center and Wilson N. Jones Regional Medical Center.
Demographics
As of the 2010 census, Denison had a population of 22,682. The racial makeup of the city was 75.3% White, 11.3% African American, 0.7% Native American, 0.9% Asian, 0.1% Pacific Islander, 9.2% from other races, and 2.5% from two or more races. Hispanic or Latino of any race were 20.2% of the population.
The median income for a household in Denison was $37,945, and the median income for a family was $45,945. The per capita income for the city was $20,845. About 14.3% of families and 17.7% of the population were below the poverty line, including 25.2% of those under age 18 and 10.2% of those age 65 or over.
Common Questions
What is Per Capita Income in Denison?
Per Capita income in Denison is $28,829.
What is the Median Family Income in Denison?
Median Family Income in Denison is $70,812.
What is the Median Household income in Denison?
Median Household Income in Denison is $58,930.
What is Income or Wage Gap in Denison?
Income or Wage Gap in Denison is 26.3%.
Women in Denison earn 73.7 cents for every dollar earned by a man.
What is Family Income Deficit in Denison?
Family Income Deficit in Denison is $10,019.
Families that are below poverty line in Denison earn $10,019 less on average than the poverty threshold level.
What is Inequality or Gini Index in Denison?
Inequality or Gini Index in Denison is 0.43.
What is the Total Population of Denison?
Total Population of Denison is 24,872.
What is the Total Male Population of Denison?
Total Male Population of Denison is 11,841.
What is the Total Female Population of Denison?
Total Female Population of Denison is 13,031.
What is the Ratio of Males per 100 Females in Denison?
There are 90.87 Males per 100 Females in Denison.
What is the Ratio of Females per 100 Males in Denison?
There are 110.05 Females per 100 Males in Denison.
What is the Median Population Age in Denison?
Median Population Age in Denison is 40.1 Years.
What is the Average Family Size in Denison
Average Family Size in Denison is 3.1 People.
What is the Average Household Size in Denison
Average Household Size in Denison is 2.5 People.
How Large is the Labor Force in Denison?
There are 11,352 People in the Labor Forcein in Denison.
What is the Percentage of People in the Labor Force in Denison?
58.9% of People are in the Labor Force in Denison.
What is the Unemployment Rate in Denison?
Unemployment Rate in Denison is 5.2%.