Copperas Cove, TX Map & Demographics
Copperas Cove Map
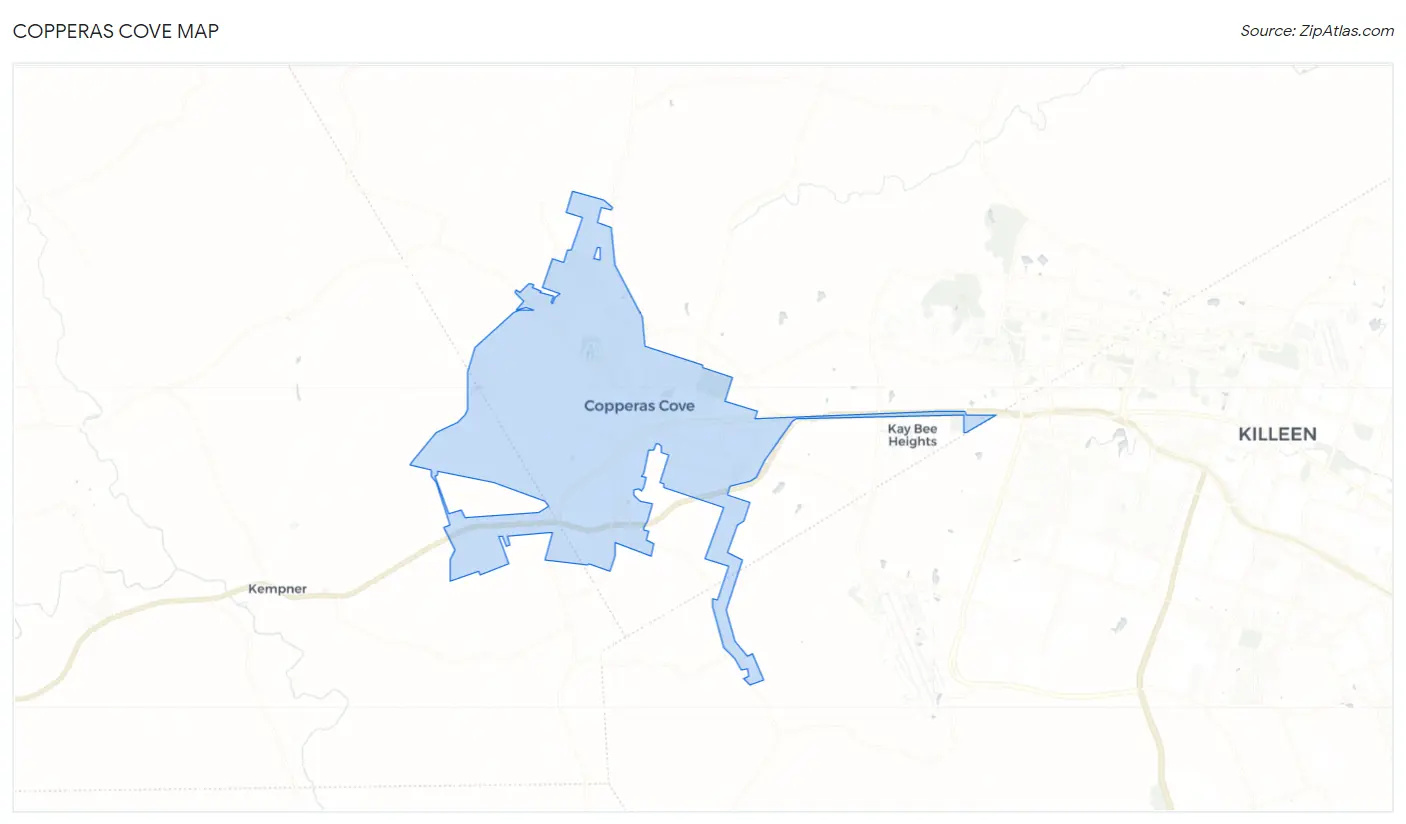
Copperas Cove Overview
$29,830
PER CAPITA INCOME
$71,100
AVG FAMILY INCOME
$64,798
AVG HOUSEHOLD INCOME
39.1%
WAGE / INCOME GAP [ % ]
60.9¢/ $1
WAGE / INCOME GAP [ $ ]
$10,829
FAMILY INCOME DEFICIT
0.39
INEQUALITY / GINI INDEX
36,436
TOTAL POPULATION
18,087
MALE POPULATION
18,349
FEMALE POPULATION
98.57
MALES / 100 FEMALES
101.45
FEMALES / 100 MALES
31.7
MEDIAN AGE
3.0
AVG FAMILY SIZE
2.6
AVG HOUSEHOLD SIZE
17,719
LABOR FORCE [ PEOPLE ]
64.1%
PERCENT IN LABOR FORCE
7.6%
UNEMPLOYMENT RATE
Copperas Cove Zip Codes
Copperas Cove Area Codes
Income in Copperas Cove
Income Overview in Copperas Cove
Per Capita Income in Copperas Cove is $29,830, while median incomes of families and households are $71,100 and $64,798 respectively.
| Characteristic | Number | Measure |
| Per Capita Income | 36,436 | $29,830 |
| Median Family Income | 9,859 | $71,100 |
| Mean Family Income | 9,859 | $83,569 |
| Median Household Income | 14,025 | $64,798 |
| Mean Household Income | 14,025 | $75,508 |
| Income Deficit | 9,859 | $10,829 |
| Wage / Income Gap (%) | 36,436 | 39.05% |
| Wage / Income Gap ($) | 36,436 | 60.95¢ per $1 |
| Gini / Inequality Index | 36,436 | 0.39 |
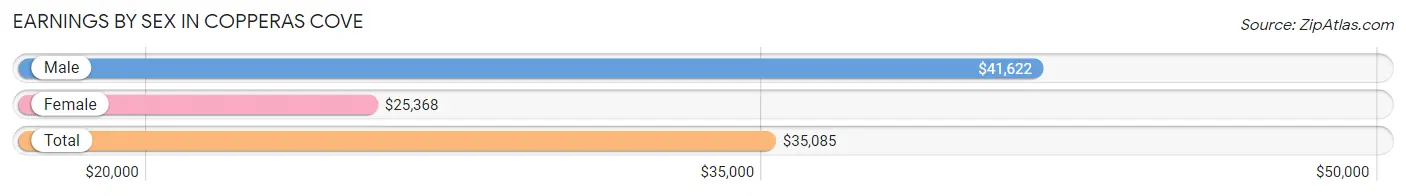
Earnings by Sex in Copperas Cove
Average Earnings in Copperas Cove are $35,085, $41,622 for men and $25,368 for women, a difference of 39.1%.
| Sex | Number | Average Earnings |
| Male | 9,751 (53.7%) | $41,622 |
| Female | 8,409 (46.3%) | $25,368 |
| Total | 18,160 (100.0%) | $35,085 |
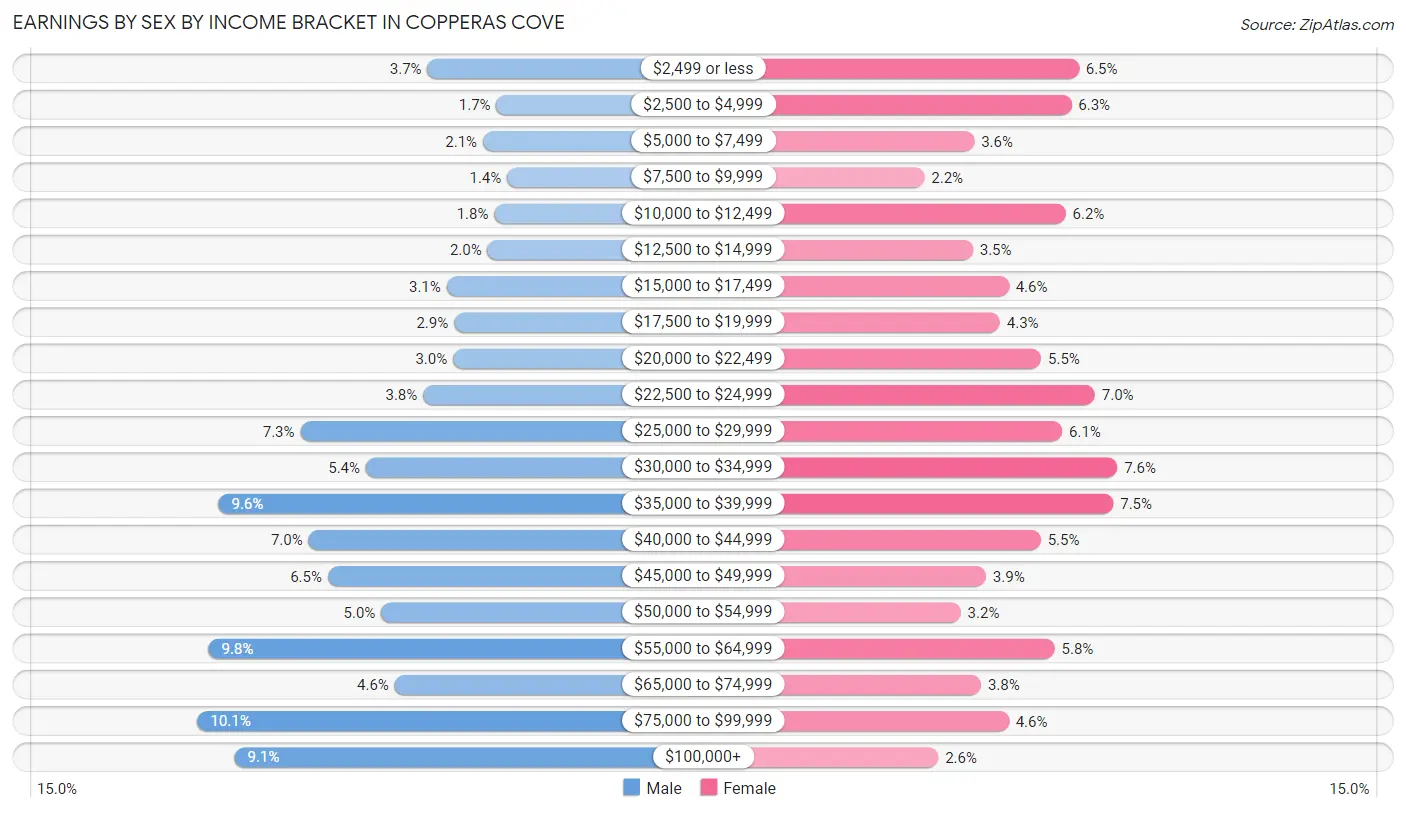
Earnings by Sex by Income Bracket in Copperas Cove
The most common earnings brackets in Copperas Cove are $75,000 to $99,999 for men (989 | 10.1%) and $30,000 to $34,999 for women (639 | 7.6%).
| Income | Male | Female |
| $2,499 or less | 359 (3.7%) | 548 (6.5%) |
| $2,500 to $4,999 | 170 (1.7%) | 531 (6.3%) |
| $5,000 to $7,499 | 207 (2.1%) | 301 (3.6%) |
| $7,500 to $9,999 | 140 (1.4%) | 183 (2.2%) |
| $10,000 to $12,499 | 176 (1.8%) | 517 (6.1%) |
| $12,500 to $14,999 | 194 (2.0%) | 298 (3.5%) |
| $15,000 to $17,499 | 306 (3.1%) | 383 (4.5%) |
| $17,500 to $19,999 | 286 (2.9%) | 362 (4.3%) |
| $20,000 to $22,499 | 289 (3.0%) | 459 (5.5%) |
| $22,500 to $24,999 | 371 (3.8%) | 586 (7.0%) |
| $25,000 to $29,999 | 707 (7.2%) | 509 (6.0%) |
| $30,000 to $34,999 | 528 (5.4%) | 639 (7.6%) |
| $35,000 to $39,999 | 931 (9.6%) | 630 (7.5%) |
| $40,000 to $44,999 | 685 (7.0%) | 458 (5.4%) |
| $45,000 to $49,999 | 632 (6.5%) | 329 (3.9%) |
| $50,000 to $54,999 | 486 (5.0%) | 269 (3.2%) |
| $55,000 to $64,999 | 959 (9.8%) | 491 (5.8%) |
| $65,000 to $74,999 | 449 (4.6%) | 317 (3.8%) |
| $75,000 to $99,999 | 989 (10.1%) | 383 (4.5%) |
| $100,000+ | 887 (9.1%) | 216 (2.6%) |
| Total | 9,751 (100.0%) | 8,409 (100.0%) |
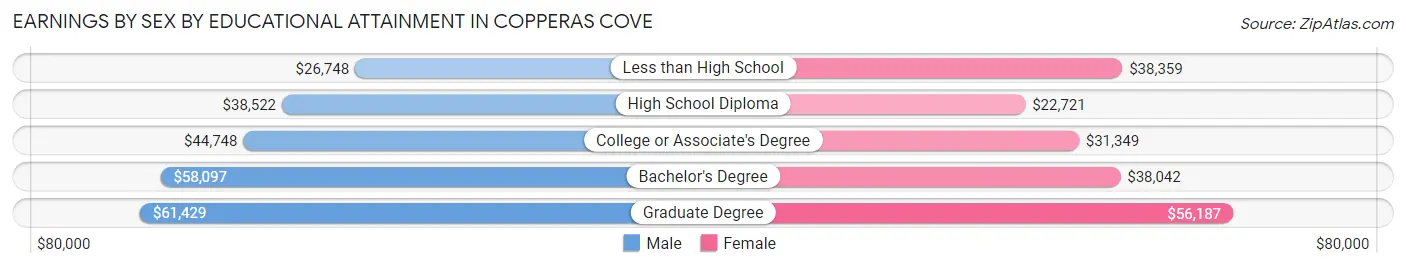
Earnings by Sex by Educational Attainment in Copperas Cove
Average earnings in Copperas Cove are $43,025 for men and $30,633 for women, a difference of 28.8%. Men with an educational attainment of graduate degree enjoy the highest average annual earnings of $61,429, while those with less than high school education earn the least with $26,748. Women with an educational attainment of graduate degree earn the most with the average annual earnings of $56,187, while those with high school diploma education have the smallest earnings of $22,721.
| Educational Attainment | Male Income | Female Income |
| Less than High School | $26,748 | $38,359 |
| High School Diploma | $38,522 | $22,721 |
| College or Associate's Degree | $44,748 | $31,349 |
| Bachelor's Degree | $58,097 | $38,042 |
| Graduate Degree | $61,429 | $56,187 |
| Total | $43,025 | $30,633 |
Family Income in Copperas Cove
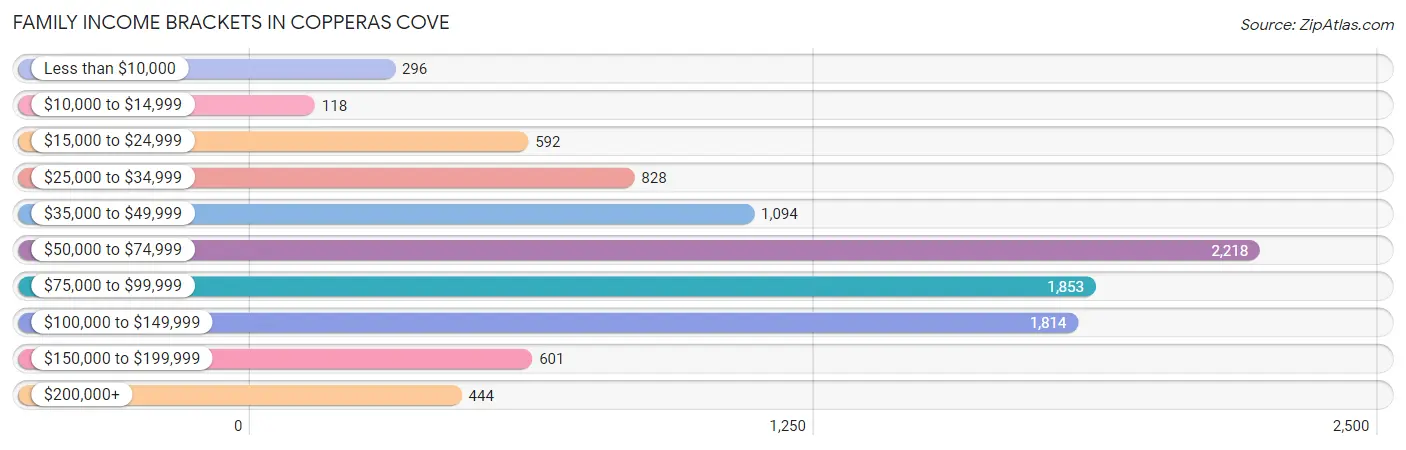
Family Income Brackets in Copperas Cove
According to the Copperas Cove family income data, there are 2,218 families falling into the $50,000 to $74,999 income range, which is the most common income bracket and makes up 22.5% of all families. Conversely, the $10,000 to $14,999 income bracket is the least frequent group with only 118 families (1.2%) belonging to this category.
| Income Bracket | # Families | % Families |
| Less than $10,000 | 296 | 3.0% |
| $10,000 to $14,999 | 118 | 1.2% |
| $15,000 to $24,999 | 592 | 6.0% |
| $25,000 to $34,999 | 828 | 8.4% |
| $35,000 to $49,999 | 1,094 | 11.1% |
| $50,000 to $74,999 | 2,218 | 22.5% |
| $75,000 to $99,999 | 1,853 | 18.8% |
| $100,000 to $149,999 | 1,814 | 18.4% |
| $150,000 to $199,999 | 601 | 6.1% |
| $200,000+ | 444 | 4.5% |
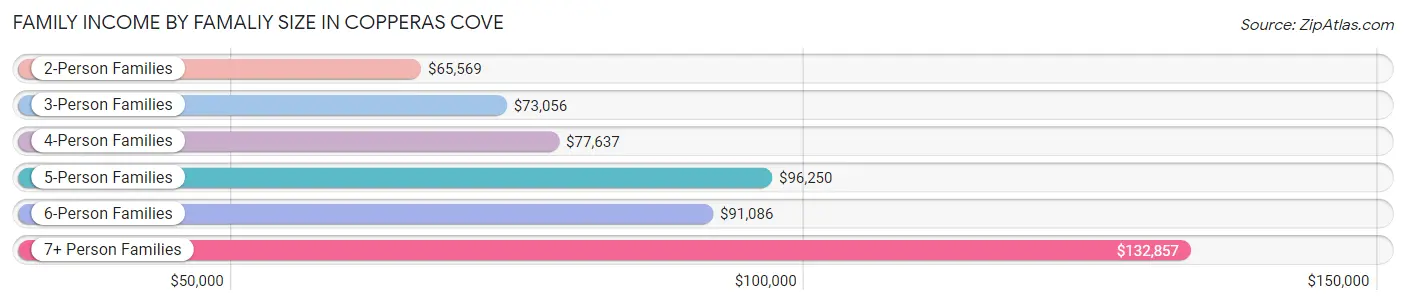
Family Income by Famaliy Size in Copperas Cove
7+ person families (136 | 1.4%) account for the highest median family income in Copperas Cove with $132,857 per family, while 2-person families (4,680 | 47.5%) have the highest median income of $32,784 per family member.
| Income Bracket | # Families | Median Income |
| 2-Person Families | 4,680 (47.5%) | $65,569 |
| 3-Person Families | 2,302 (23.4%) | $73,056 |
| 4-Person Families | 1,766 (17.9%) | $77,637 |
| 5-Person Families | 776 (7.9%) | $96,250 |
| 6-Person Families | 199 (2.0%) | $91,086 |
| 7+ Person Families | 136 (1.4%) | $132,857 |
| Total | 9,859 (100.0%) | $71,100 |
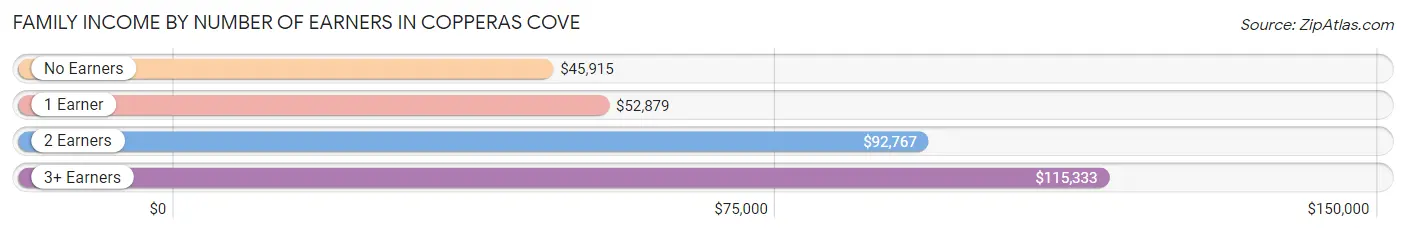
Family Income by Number of Earners in Copperas Cove
The median family income in Copperas Cove is $71,100, with families comprising 3+ earners (558) having the highest median family income of $115,333, while families with no earners (1,295) have the lowest median family income of $45,915, accounting for 5.7% and 13.1% of families, respectively.
| Number of Earners | # Families | Median Income |
| No Earners | 1,295 (13.1%) | $45,915 |
| 1 Earner | 4,210 (42.7%) | $52,879 |
| 2 Earners | 3,796 (38.5%) | $92,767 |
| 3+ Earners | 558 (5.7%) | $115,333 |
| Total | 9,859 (100.0%) | $71,100 |
Household Income in Copperas Cove
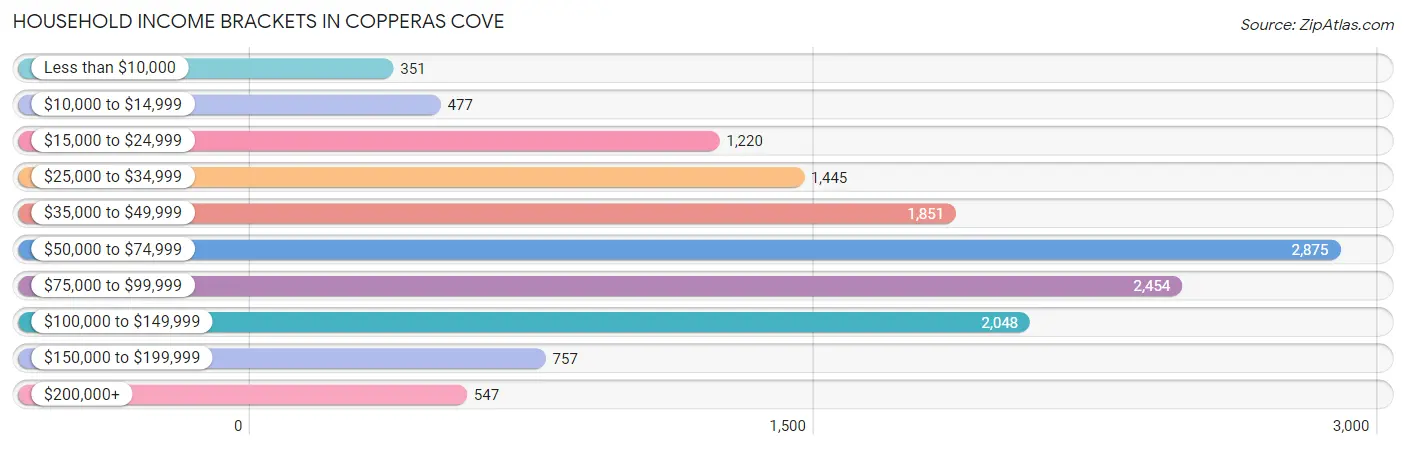
Household Income Brackets in Copperas Cove
With 2,875 households falling in the category, the $50,000 to $74,999 income range is the most frequent in Copperas Cove, accounting for 20.5% of all households. In contrast, only 351 households (2.5%) fall into the less than $10,000 income bracket, making it the least populous group.
| Income Bracket | # Households | % Households |
| Less than $10,000 | 351 | 2.5% |
| $10,000 to $14,999 | 477 | 3.4% |
| $15,000 to $24,999 | 1,220 | 8.7% |
| $25,000 to $34,999 | 1,445 | 10.3% |
| $35,000 to $49,999 | 1,851 | 13.2% |
| $50,000 to $74,999 | 2,875 | 20.5% |
| $75,000 to $99,999 | 2,454 | 17.5% |
| $100,000 to $149,999 | 2,048 | 14.6% |
| $150,000 to $199,999 | 757 | 5.4% |
| $200,000+ | 547 | 3.9% |
Household Income by Householder Age in Copperas Cove
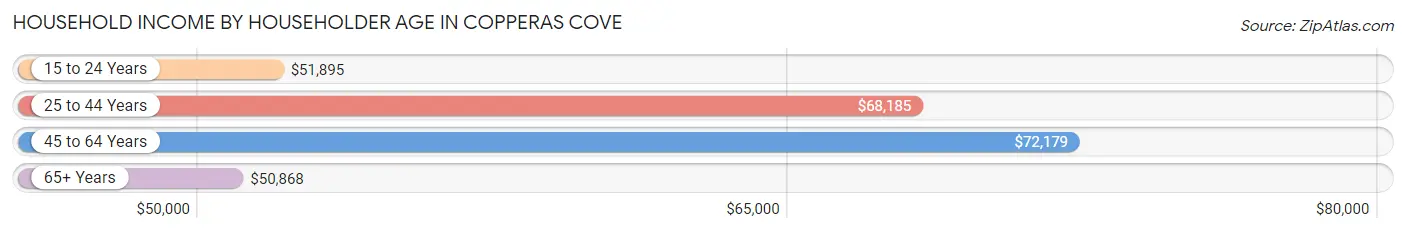
The median household income in Copperas Cove is $64,798, with the highest median household income of $72,179 found in the 45 to 64 years age bracket for the primary householder. A total of 4,249 households (30.3%) fall into this category. Meanwhile, the 65+ years age bracket for the primary householder has the lowest median household income of $50,868, with 2,643 households (18.8%) in this group.
| Income Bracket | # Households | Median Income |
| 15 to 24 Years | 1,033 (7.4%) | $51,895 |
| 25 to 44 Years | 6,100 (43.5%) | $68,185 |
| 45 to 64 Years | 4,249 (30.3%) | $72,179 |
| 65+ Years | 2,643 (18.8%) | $50,868 |
| Total | 14,025 (100.0%) | $64,798 |
Poverty in Copperas Cove
Income Below Poverty by Sex and Age in Copperas Cove
With 8.8% poverty level for males and 9.7% for females among the residents of Copperas Cove, 5 year old males and 65 to 74 year old females are the most vulnerable to poverty, with 61 males (20.6%) and 236 females (18.3%) in their respective age groups living below the poverty level.
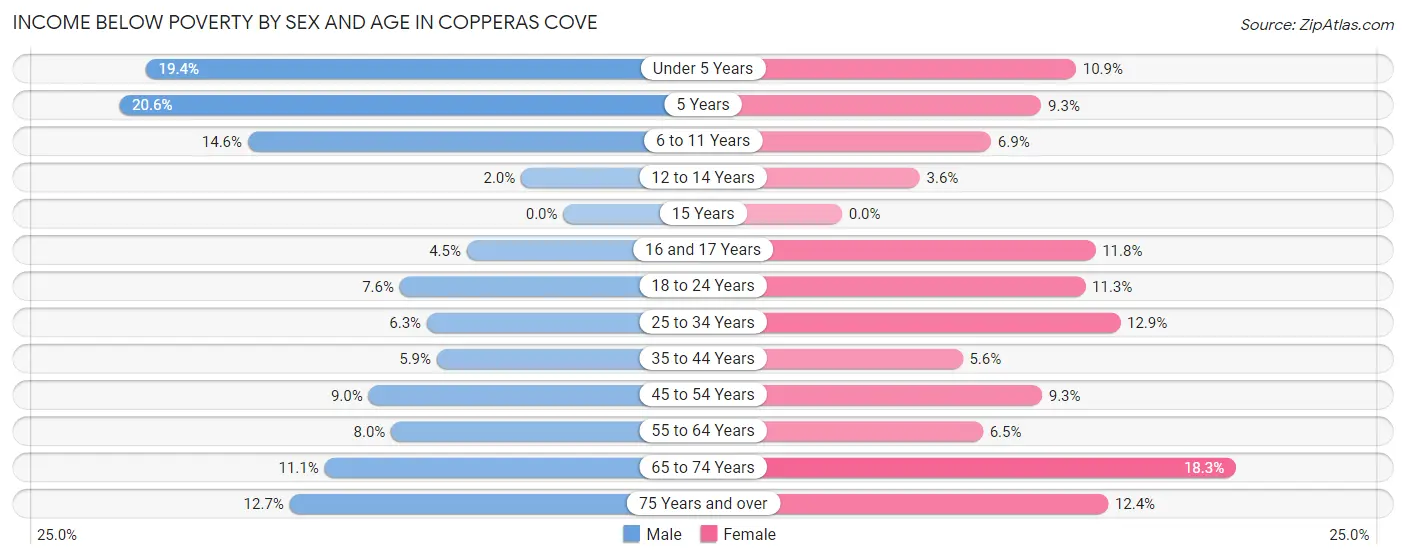
| Age Bracket | Male | Female |
| Under 5 Years | 250 (19.4%) | 112 (10.9%) |
| 5 Years | 61 (20.6%) | 26 (9.2%) |
| 6 to 11 Years | 239 (14.6%) | 112 (6.9%) |
| 12 to 14 Years | 18 (2.0%) | 30 (3.6%) |
| 15 Years | 0 (0.0%) | 0 (0.0%) |
| 16 and 17 Years | 19 (4.5%) | 50 (11.8%) |
| 18 to 24 Years | 99 (7.6%) | 259 (11.3%) |
| 25 to 34 Years | 234 (6.3%) | 389 (12.9%) |
| 35 to 44 Years | 179 (5.9%) | 142 (5.6%) |
| 45 to 54 Years | 180 (9.0%) | 197 (9.3%) |
| 55 to 64 Years | 111 (8.0%) | 91 (6.5%) |
| 65 to 74 Years | 131 (11.1%) | 236 (18.3%) |
| 75 Years and over | 47 (12.7%) | 113 (12.3%) |
| Total | 1,568 (8.8%) | 1,757 (9.7%) |
Income Above Poverty by Sex and Age in Copperas Cove
According to the poverty statistics in Copperas Cove, males aged 15 years and females aged 15 years are the age groups that are most secure financially, with 100.0% of males and 100.0% of females in these age groups living above the poverty line.
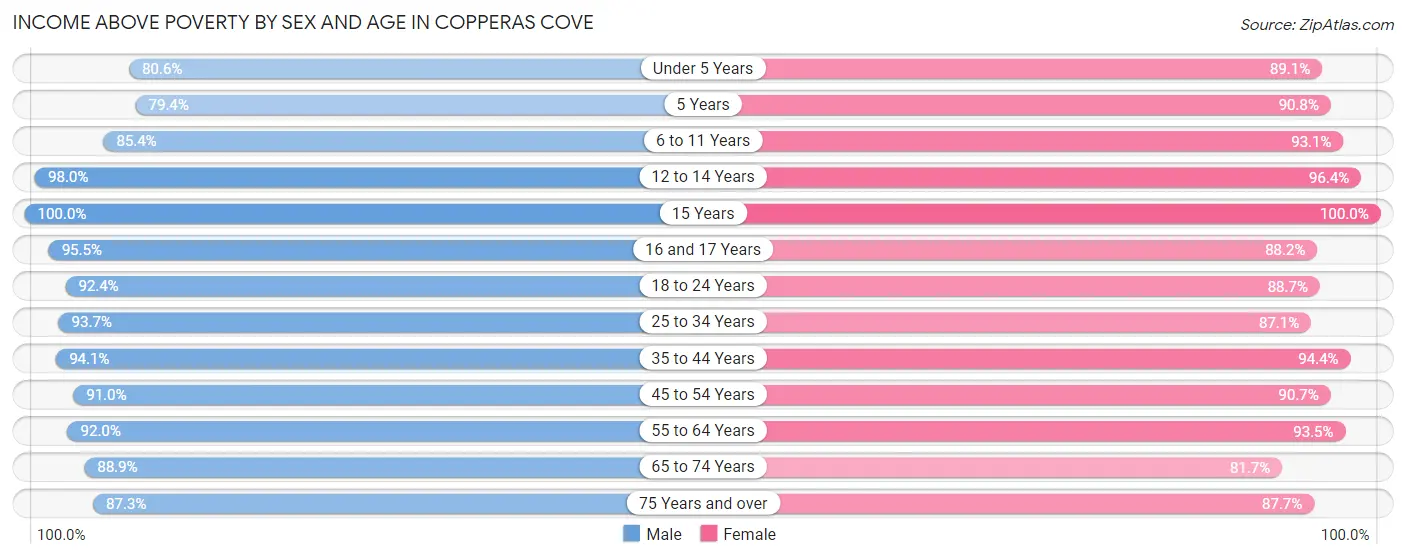
| Age Bracket | Male | Female |
| Under 5 Years | 1,040 (80.6%) | 919 (89.1%) |
| 5 Years | 235 (79.4%) | 255 (90.7%) |
| 6 to 11 Years | 1,394 (85.4%) | 1,507 (93.1%) |
| 12 to 14 Years | 902 (98.0%) | 801 (96.4%) |
| 15 Years | 285 (100.0%) | 298 (100.0%) |
| 16 and 17 Years | 405 (95.5%) | 375 (88.2%) |
| 18 to 24 Years | 1,205 (92.4%) | 2,035 (88.7%) |
| 25 to 34 Years | 3,463 (93.7%) | 2,624 (87.1%) |
| 35 to 44 Years | 2,869 (94.1%) | 2,392 (94.4%) |
| 45 to 54 Years | 1,812 (91.0%) | 1,926 (90.7%) |
| 55 to 64 Years | 1,278 (92.0%) | 1,301 (93.5%) |
| 65 to 74 Years | 1,051 (88.9%) | 1,054 (81.7%) |
| 75 Years and over | 323 (87.3%) | 802 (87.6%) |
| Total | 16,262 (91.2%) | 16,289 (90.3%) |
Income Below Poverty Among Married-Couple Families in Copperas Cove
The poverty statistics for married-couple families in Copperas Cove show that 5.5% or 370 of the total 6,705 families live below the poverty line. Families with no children have the highest poverty rate of 6.6%, comprising of 229 families. On the other hand, families with 5 or more children have the lowest poverty rate of 0.0%, which includes 0 families.
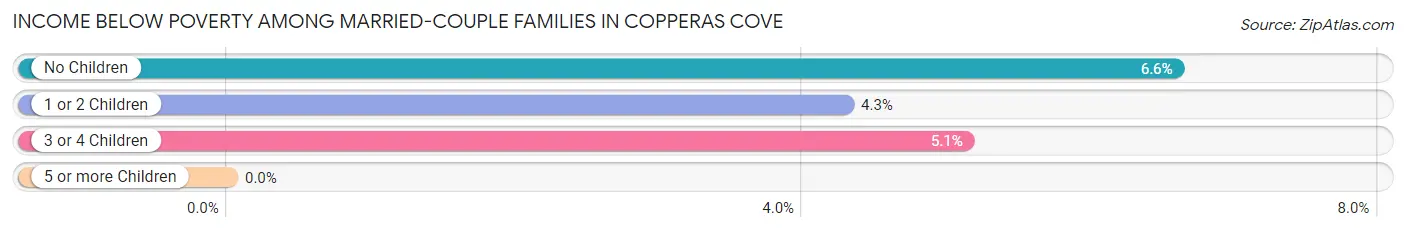
| Children | Above Poverty | Below Poverty |
| No Children | 3,244 (93.4%) | 229 (6.6%) |
| 1 or 2 Children | 2,519 (95.7%) | 113 (4.3%) |
| 3 or 4 Children | 518 (94.9%) | 28 (5.1%) |
| 5 or more Children | 54 (100.0%) | 0 (0.0%) |
| Total | 6,335 (94.5%) | 370 (5.5%) |
Income Below Poverty Among Single-Parent Households in Copperas Cove
According to the poverty data in Copperas Cove, 7.5% or 66 single-father households and 11.4% or 260 single-mother households are living below the poverty line. Among single-father households, those with 5 or more children have the highest poverty rate, with 14 households (100.0%) experiencing poverty. Likewise, among single-mother households, those with 5 or more children have the highest poverty rate, with 31 households (100.0%) falling below the poverty line.
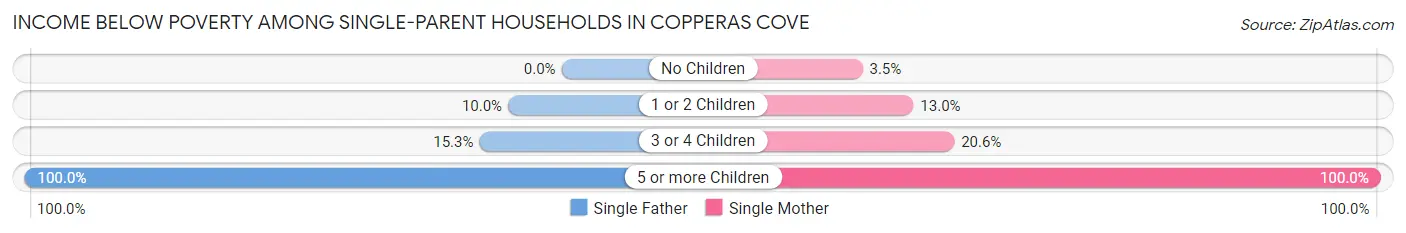
| Children | Single Father | Single Mother |
| No Children | 0 (0.0%) | 28 (3.5%) |
| 1 or 2 Children | 37 (10.0%) | 166 (13.0%) |
| 3 or 4 Children | 15 (15.3%) | 35 (20.6%) |
| 5 or more Children | 14 (100.0%) | 31 (100.0%) |
| Total | 66 (7.5%) | 260 (11.4%) |
Income Below Poverty Among Married-Couple vs Single-Parent Households in Copperas Cove
The poverty data for Copperas Cove shows that 370 of the married-couple family households (5.5%) and 326 of the single-parent households (10.3%) are living below the poverty level. Within the married-couple family households, those with no children have the highest poverty rate, with 229 households (6.6%) falling below the poverty line. Among the single-parent households, those with 5 or more children have the highest poverty rate, with 45 household (100.0%) living below poverty.
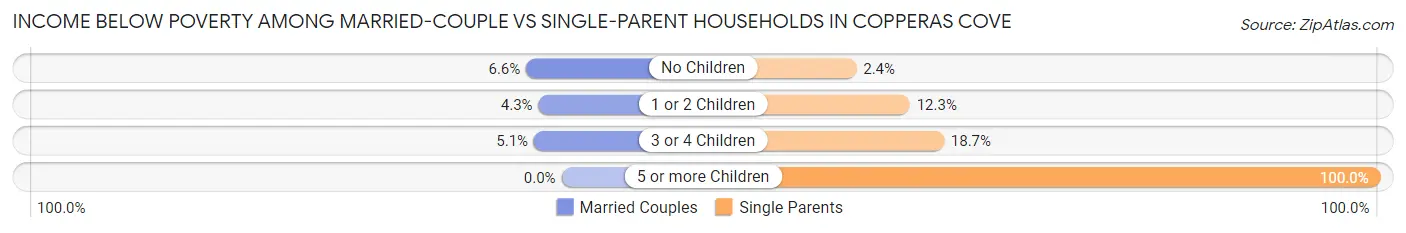
| Children | Married-Couple Families | Single-Parent Households |
| No Children | 229 (6.6%) | 28 (2.4%) |
| 1 or 2 Children | 113 (4.3%) | 203 (12.3%) |
| 3 or 4 Children | 28 (5.1%) | 50 (18.7%) |
| 5 or more Children | 0 (0.0%) | 45 (100.0%) |
| Total | 370 (5.5%) | 326 (10.3%) |
Race in Copperas Cove
The most populous races in Copperas Cove are White / Caucasian (21,885 | 60.1%), Hispanic or Latino (7,056 | 19.4%), and Two or more Races (6,589 | 18.1%).
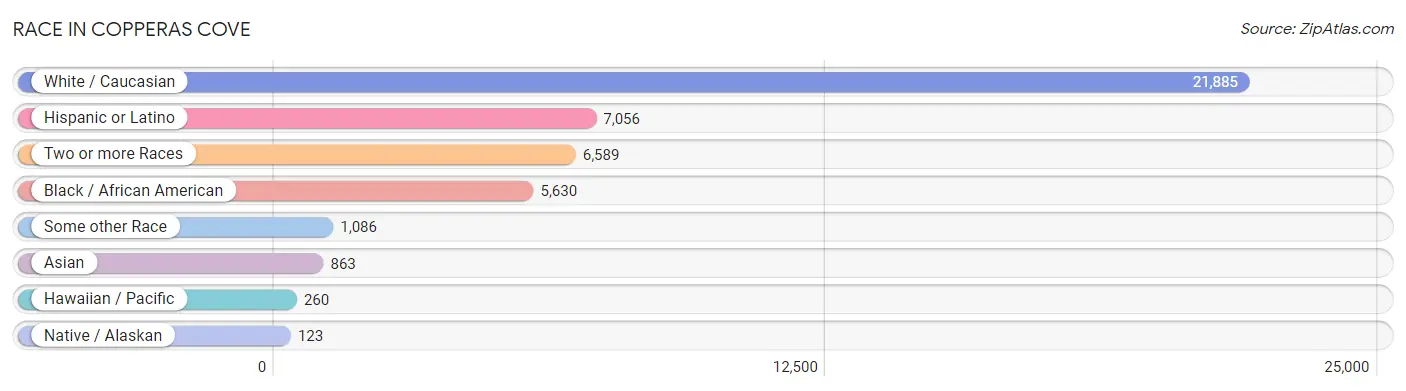
| Race | # Population | % Population |
| Asian | 863 | 2.4% |
| Black / African American | 5,630 | 15.4% |
| Hawaiian / Pacific | 260 | 0.7% |
| Hispanic or Latino | 7,056 | 19.4% |
| Native / Alaskan | 123 | 0.3% |
| White / Caucasian | 21,885 | 60.1% |
| Two or more Races | 6,589 | 18.1% |
| Some other Race | 1,086 | 3.0% |
| Total | 36,436 | 100.0% |
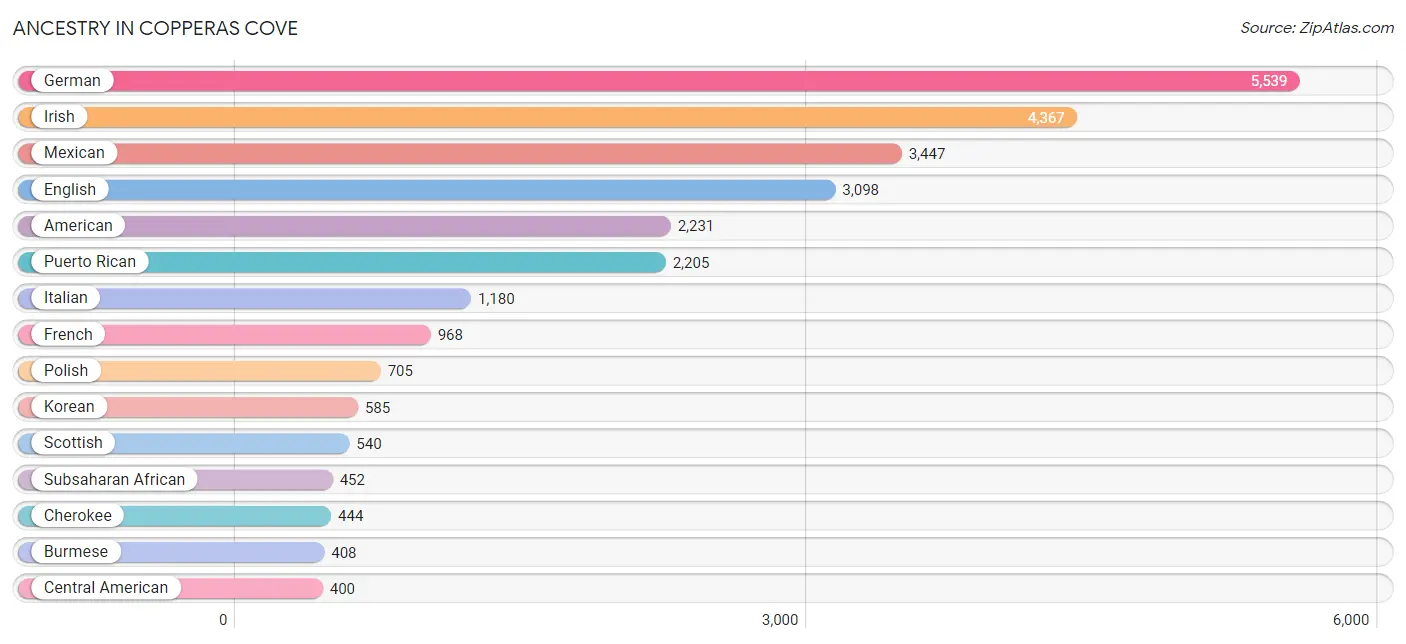
Ancestry in Copperas Cove
The most populous ancestries reported in Copperas Cove are German (5,539 | 15.2%), Irish (4,367 | 12.0%), Mexican (3,447 | 9.5%), English (3,098 | 8.5%), and American (2,231 | 6.1%), together accounting for 51.3% of all Copperas Cove residents.
| Ancestry | # Population | % Population |
| African | 255 | 0.7% |
| Albanian | 55 | 0.2% |
| American | 2,231 | 6.1% |
| Apache | 31 | 0.1% |
| Arab | 264 | 0.7% |
| Australian | 5 | 0.0% |
| Austrian | 98 | 0.3% |
| Belizean | 97 | 0.3% |
| Bhutanese | 148 | 0.4% |
| Blackfeet | 21 | 0.1% |
| Brazilian | 55 | 0.2% |
| British | 255 | 0.7% |
| British West Indian | 72 | 0.2% |
| Burmese | 408 | 1.1% |
| Canadian | 245 | 0.7% |
| Central American | 400 | 1.1% |
| Central American Indian | 17 | 0.1% |
| Cherokee | 444 | 1.2% |
| Chickasaw | 34 | 0.1% |
| Chippewa | 58 | 0.2% |
| Choctaw | 32 | 0.1% |
| Colombian | 148 | 0.4% |
| Comanche | 19 | 0.1% |
| Costa Rican | 26 | 0.1% |
| Creek | 12 | 0.0% |
| Cuban | 70 | 0.2% |
| Czech | 207 | 0.6% |
| Czechoslovakian | 55 | 0.2% |
| Danish | 123 | 0.3% |
| Delaware | 23 | 0.1% |
| Dominican | 211 | 0.6% |
| Dutch | 362 | 1.0% |
| Dutch West Indian | 5 | 0.0% |
| Eastern European | 9 | 0.0% |
| English | 3,098 | 8.5% |
| European | 358 | 1.0% |
| Fijian | 32 | 0.1% |
| Finnish | 66 | 0.2% |
| French | 968 | 2.7% |
| French Canadian | 252 | 0.7% |
| German | 5,539 | 15.2% |
| Greek | 25 | 0.1% |
| Guamanian / Chamorro | 207 | 0.6% |
| Guatemalan | 79 | 0.2% |
| Haitian | 15 | 0.0% |
| Honduran | 108 | 0.3% |
| Houma | 7 | 0.0% |
| Hungarian | 32 | 0.1% |
| Icelander | 29 | 0.1% |
| Indian (Asian) | 126 | 0.4% |
| Irish | 4,367 | 12.0% |
| Iroquois | 60 | 0.2% |
| Israeli | 85 | 0.2% |
| Italian | 1,180 | 3.2% |
| Jamaican | 120 | 0.3% |
| Japanese | 133 | 0.4% |
| Jordanian | 90 | 0.3% |
| Korean | 585 | 1.6% |
| Latvian | 7 | 0.0% |
| Lebanese | 150 | 0.4% |
| Lithuanian | 11 | 0.0% |
| Macedonian | 75 | 0.2% |
| Maltese | 130 | 0.4% |
| Mexican | 3,447 | 9.5% |
| Mexican American Indian | 142 | 0.4% |
| Native Hawaiian | 80 | 0.2% |
| Navajo | 36 | 0.1% |
| Nigerian | 129 | 0.4% |
| Northern European | 174 | 0.5% |
| Norwegian | 321 | 0.9% |
| Pakistani | 11 | 0.0% |
| Panamanian | 110 | 0.3% |
| Peruvian | 7 | 0.0% |
| Polish | 705 | 1.9% |
| Portuguese | 72 | 0.2% |
| Puerto Rican | 2,205 | 6.0% |
| Romanian | 40 | 0.1% |
| Russian | 97 | 0.3% |
| Salvadoran | 77 | 0.2% |
| Samoan | 124 | 0.3% |
| Scandinavian | 393 | 1.1% |
| Scotch-Irish | 273 | 0.7% |
| Scottish | 540 | 1.5% |
| Sioux | 17 | 0.1% |
| Slavic | 7 | 0.0% |
| Slovak | 10 | 0.0% |
| Slovene | 13 | 0.0% |
| South American | 206 | 0.6% |
| Spaniard | 306 | 0.8% |
| Spanish | 111 | 0.3% |
| Sri Lankan | 178 | 0.5% |
| Subsaharan African | 452 | 1.2% |
| Swedish | 269 | 0.7% |
| Swiss | 20 | 0.1% |
| Thai | 44 | 0.1% |
| Turkish | 22 | 0.1% |
| Ukrainian | 7 | 0.0% |
| Uruguayan | 12 | 0.0% |
| Ute | 134 | 0.4% |
| Venezuelan | 39 | 0.1% |
| Welsh | 124 | 0.3% |
| West Indian | 18 | 0.1% | View All 102 Rows |
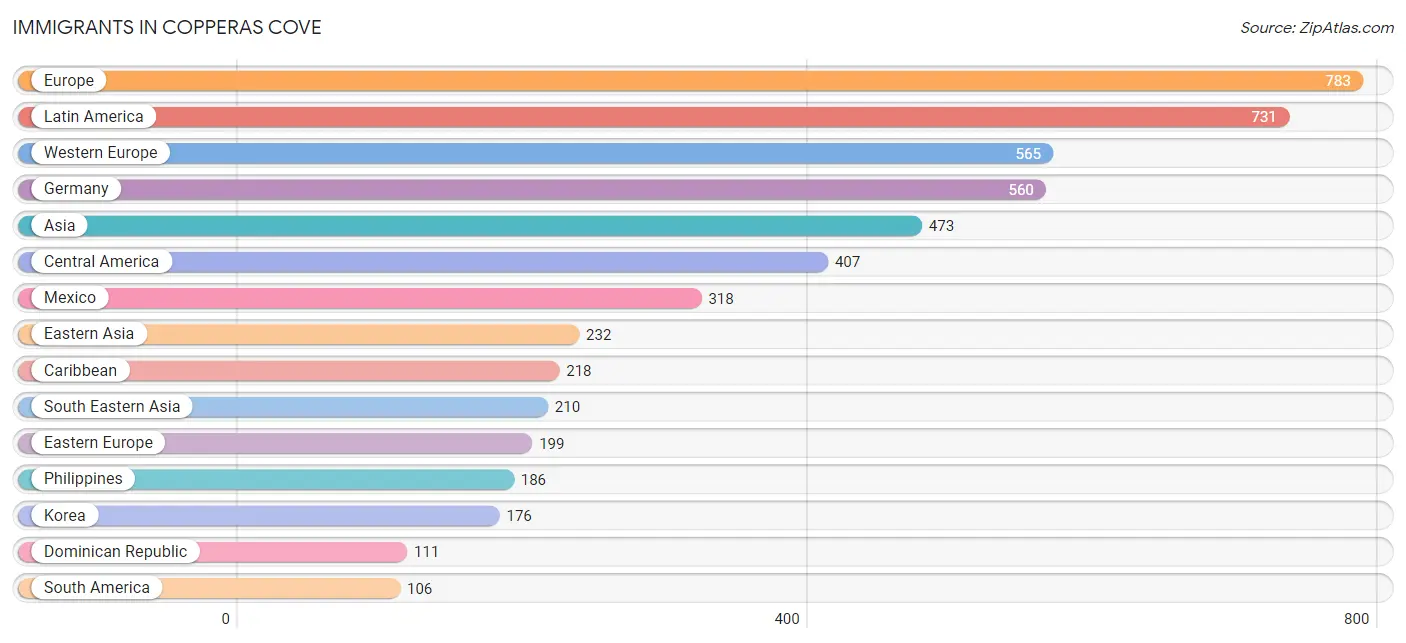
Immigrants in Copperas Cove
The most numerous immigrant groups reported in Copperas Cove came from Europe (783 | 2.1%), Latin America (731 | 2.0%), Western Europe (565 | 1.5%), Germany (560 | 1.5%), and Asia (473 | 1.3%), together accounting for 8.5% of all Copperas Cove residents.
| Immigration Origin | # Population | % Population |
| Africa | 36 | 0.1% |
| Asia | 473 | 1.3% |
| Belize | 30 | 0.1% |
| Brazil | 14 | 0.0% |
| Canada | 86 | 0.2% |
| Caribbean | 218 | 0.6% |
| Central America | 407 | 1.1% |
| China | 25 | 0.1% |
| Colombia | 52 | 0.1% |
| Cuba | 7 | 0.0% |
| Czechoslovakia | 29 | 0.1% |
| Denmark | 7 | 0.0% |
| Dominican Republic | 111 | 0.3% |
| Eastern Asia | 232 | 0.6% |
| Eastern Europe | 199 | 0.5% |
| El Salvador | 13 | 0.0% |
| Europe | 783 | 2.1% |
| France | 5 | 0.0% |
| Germany | 560 | 1.5% |
| Ghana | 29 | 0.1% |
| Guatemala | 6 | 0.0% |
| Haiti | 15 | 0.0% |
| Honduras | 15 | 0.0% |
| Hungary | 8 | 0.0% |
| Iraq | 15 | 0.0% |
| Italy | 12 | 0.0% |
| Jamaica | 68 | 0.2% |
| Japan | 31 | 0.1% |
| Korea | 176 | 0.5% |
| Latin America | 731 | 2.0% |
| Mexico | 318 | 0.9% |
| Nigeria | 7 | 0.0% |
| North Macedonia | 75 | 0.2% |
| Northern Europe | 7 | 0.0% |
| Oceania | 65 | 0.2% |
| Panama | 25 | 0.1% |
| Peru | 7 | 0.0% |
| Philippines | 186 | 0.5% |
| Poland | 28 | 0.1% |
| Romania | 11 | 0.0% |
| Russia | 42 | 0.1% |
| South America | 106 | 0.3% |
| South Eastern Asia | 210 | 0.6% |
| Southern Europe | 12 | 0.0% |
| St. Vincent and the Grenadines | 10 | 0.0% |
| Taiwan | 25 | 0.1% |
| Thailand | 11 | 0.0% |
| Trinidad and Tobago | 7 | 0.0% |
| Turkey | 16 | 0.0% |
| Uruguay | 12 | 0.0% |
| Venezuela | 21 | 0.1% |
| Vietnam | 13 | 0.0% |
| Western Africa | 36 | 0.1% |
| Western Asia | 31 | 0.1% |
| Western Europe | 565 | 1.5% | View All 55 Rows |
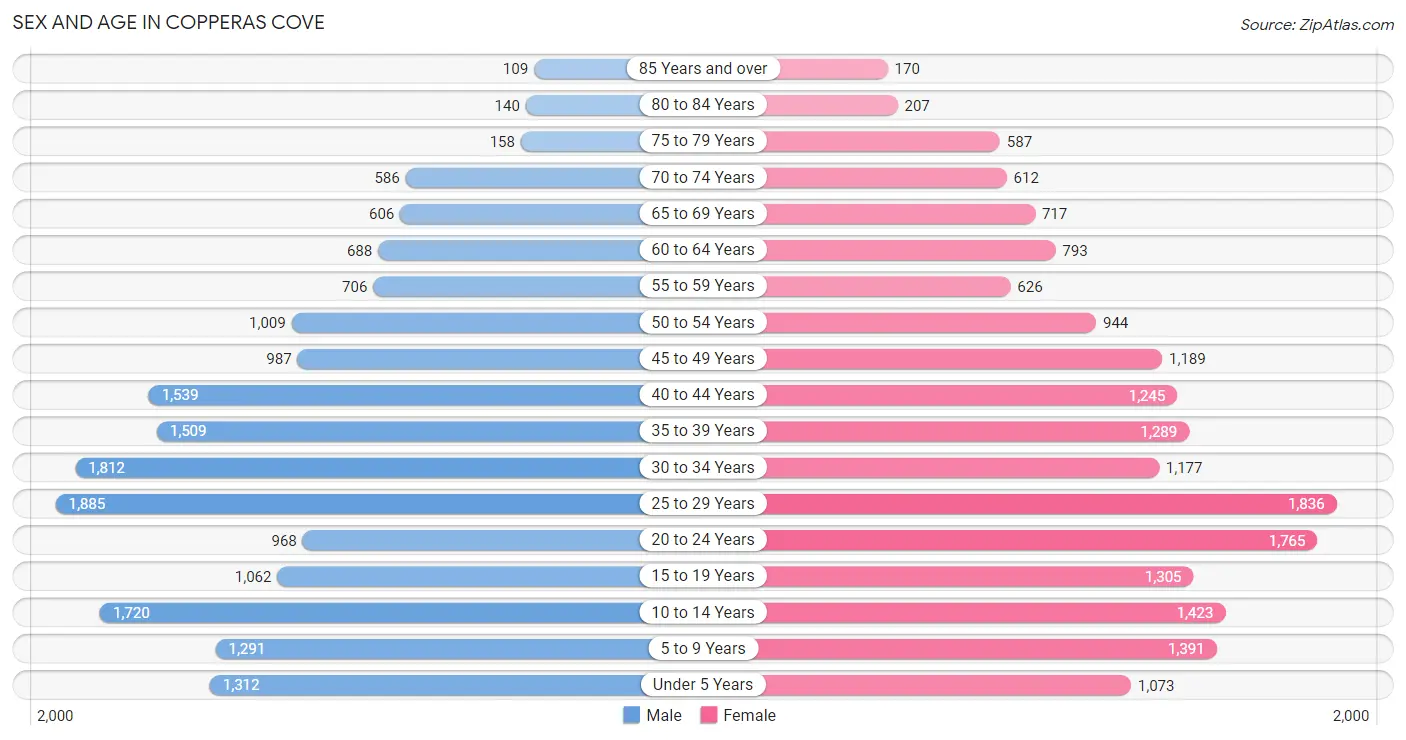
Sex and Age in Copperas Cove
Sex and Age in Copperas Cove
The most populous age groups in Copperas Cove are 25 to 29 Years (1,885 | 10.4%) for men and 25 to 29 Years (1,836 | 10.0%) for women.
| Age Bracket | Male | Female |
| Under 5 Years | 1,312 (7.2%) | 1,073 (5.9%) |
| 5 to 9 Years | 1,291 (7.1%) | 1,391 (7.6%) |
| 10 to 14 Years | 1,720 (9.5%) | 1,423 (7.8%) |
| 15 to 19 Years | 1,062 (5.9%) | 1,305 (7.1%) |
| 20 to 24 Years | 968 (5.3%) | 1,765 (9.6%) |
| 25 to 29 Years | 1,885 (10.4%) | 1,836 (10.0%) |
| 30 to 34 Years | 1,812 (10.0%) | 1,177 (6.4%) |
| 35 to 39 Years | 1,509 (8.3%) | 1,289 (7.0%) |
| 40 to 44 Years | 1,539 (8.5%) | 1,245 (6.8%) |
| 45 to 49 Years | 987 (5.5%) | 1,189 (6.5%) |
| 50 to 54 Years | 1,009 (5.6%) | 944 (5.1%) |
| 55 to 59 Years | 706 (3.9%) | 626 (3.4%) |
| 60 to 64 Years | 688 (3.8%) | 793 (4.3%) |
| 65 to 69 Years | 606 (3.4%) | 717 (3.9%) |
| 70 to 74 Years | 586 (3.2%) | 612 (3.3%) |
| 75 to 79 Years | 158 (0.9%) | 587 (3.2%) |
| 80 to 84 Years | 140 (0.8%) | 207 (1.1%) |
| 85 Years and over | 109 (0.6%) | 170 (0.9%) |
| Total | 18,087 (100.0%) | 18,349 (100.0%) |
Families and Households in Copperas Cove
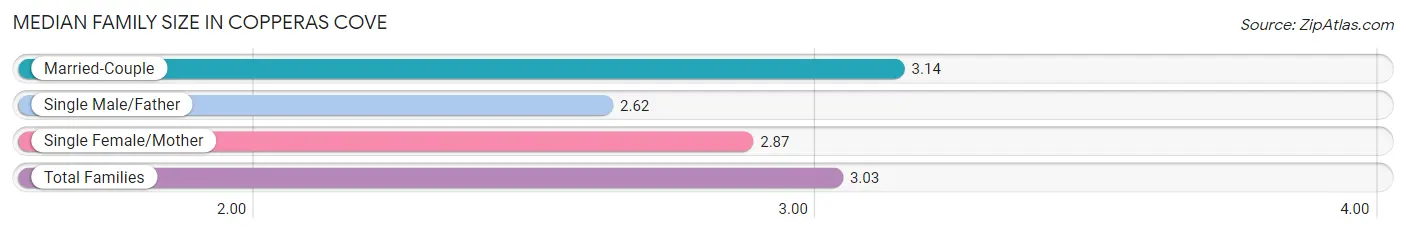
Median Family Size in Copperas Cove
The median family size in Copperas Cove is 3.03 persons per family, with married-couple families (6,705 | 68.0%) accounting for the largest median family size of 3.14 persons per family. On the other hand, single male/father families (877 | 8.9%) represent the smallest median family size with 2.62 persons per family.
| Family Type | # Families | Family Size |
| Married-Couple | 6,705 (68.0%) | 3.14 |
| Single Male/Father | 877 (8.9%) | 2.62 |
| Single Female/Mother | 2,277 (23.1%) | 2.87 |
| Total Families | 9,859 (100.0%) | 3.03 |
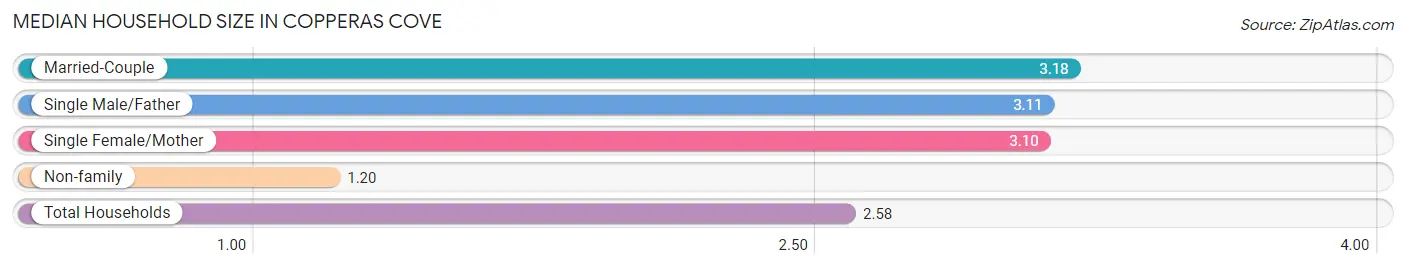
Median Household Size in Copperas Cove
The median household size in Copperas Cove is 2.58 persons per household, with married-couple households (6,705 | 47.8%) accounting for the largest median household size of 3.18 persons per household. non-family households (4,166 | 29.7%) represent the smallest median household size with 1.20 persons per household.
| Household Type | # Households | Household Size |
| Married-Couple | 6,705 (47.8%) | 3.18 |
| Single Male/Father | 877 (6.2%) | 3.11 |
| Single Female/Mother | 2,277 (16.2%) | 3.10 |
| Non-family | 4,166 (29.7%) | 1.20 |
| Total Households | 14,025 (100.0%) | 2.58 |
Household Size by Marriage Status in Copperas Cove
Out of a total of 14,025 households in Copperas Cove, 9,859 (70.3%) are family households, while 4,166 (29.7%) are nonfamily households. The most numerous type of family households are 2-person households, comprising 4,168, and the most common type of nonfamily households are 1-person households, comprising 3,515.
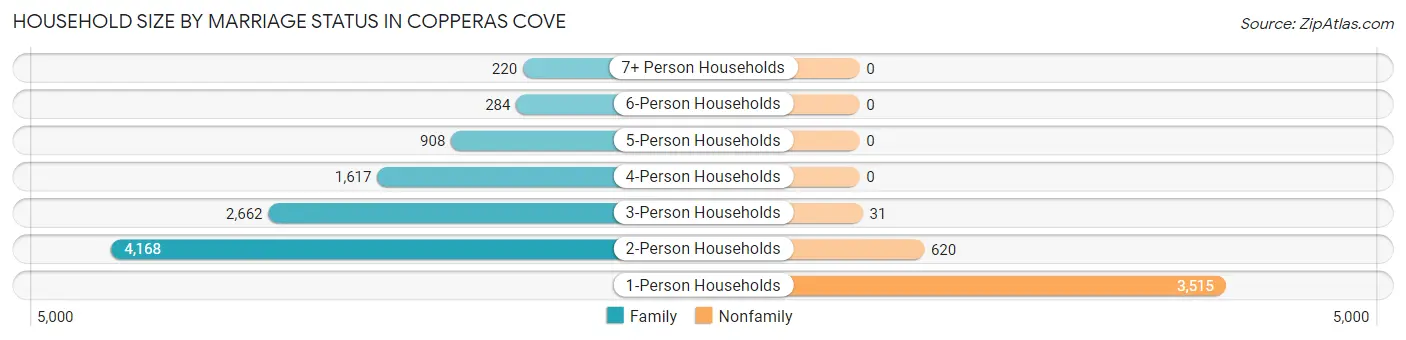
| Household Size | Family Households | Nonfamily Households |
| 1-Person Households | - | 3,515 (25.1%) |
| 2-Person Households | 4,168 (29.7%) | 620 (4.4%) |
| 3-Person Households | 2,662 (19.0%) | 31 (0.2%) |
| 4-Person Households | 1,617 (11.5%) | 0 (0.0%) |
| 5-Person Households | 908 (6.5%) | 0 (0.0%) |
| 6-Person Households | 284 (2.0%) | 0 (0.0%) |
| 7+ Person Households | 220 (1.6%) | 0 (0.0%) |
| Total | 9,859 (70.3%) | 4,166 (29.7%) |
Female Fertility in Copperas Cove
Fertility by Age in Copperas Cove
Average fertility rate in Copperas Cove is 65.0 births per 1,000 women. Women in the age bracket of 20 to 34 years have the highest fertility rate with 107.0 births per 1,000 women. Women in the age bracket of 20 to 34 years acount for 78.2% of all women with births.
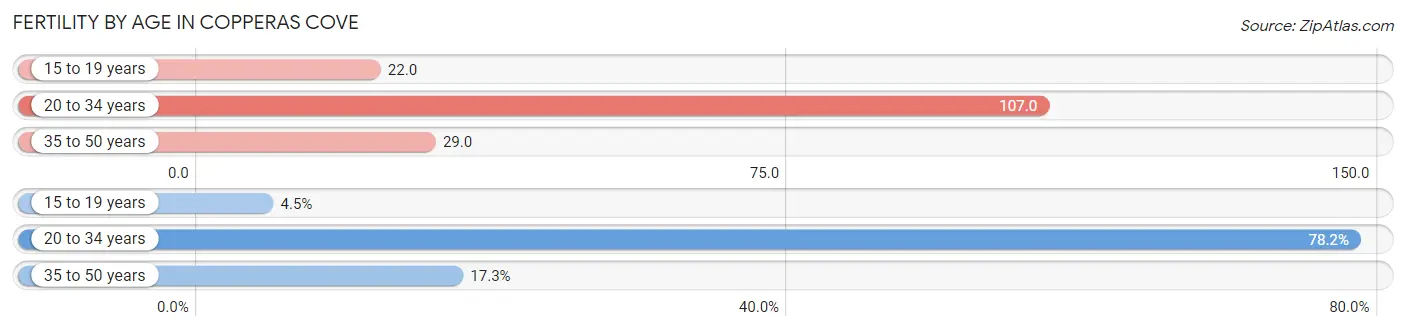
| Age Bracket | Women with Births | Births / 1,000 Women |
| 15 to 19 years | 29 (4.4%) | 22.0 |
| 20 to 34 years | 510 (78.2%) | 107.0 |
| 35 to 50 years | 113 (17.3%) | 29.0 |
| Total | 652 (100.0%) | 65.0 |
Fertility by Age by Marriage Status in Copperas Cove
75.3% of women with births (652) in Copperas Cove are married. The highest percentage of unmarried women with births falls into 20 to 34 years age bracket with 28.4% of them unmarried at the time of birth, while the lowest percentage of unmarried women with births belong to 15 to 19 years age bracket with 0.0% of them unmarried.
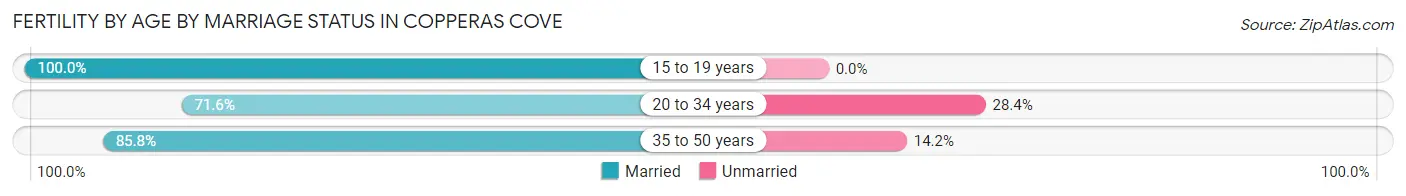
| Age Bracket | Married | Unmarried |
| 15 to 19 years | 29 (100.0%) | 0 (0.0%) |
| 20 to 34 years | 365 (71.6%) | 145 (28.4%) |
| 35 to 50 years | 97 (85.8%) | 16 (14.2%) |
| Total | 491 (75.3%) | 161 (24.7%) |
Fertility by Education in Copperas Cove
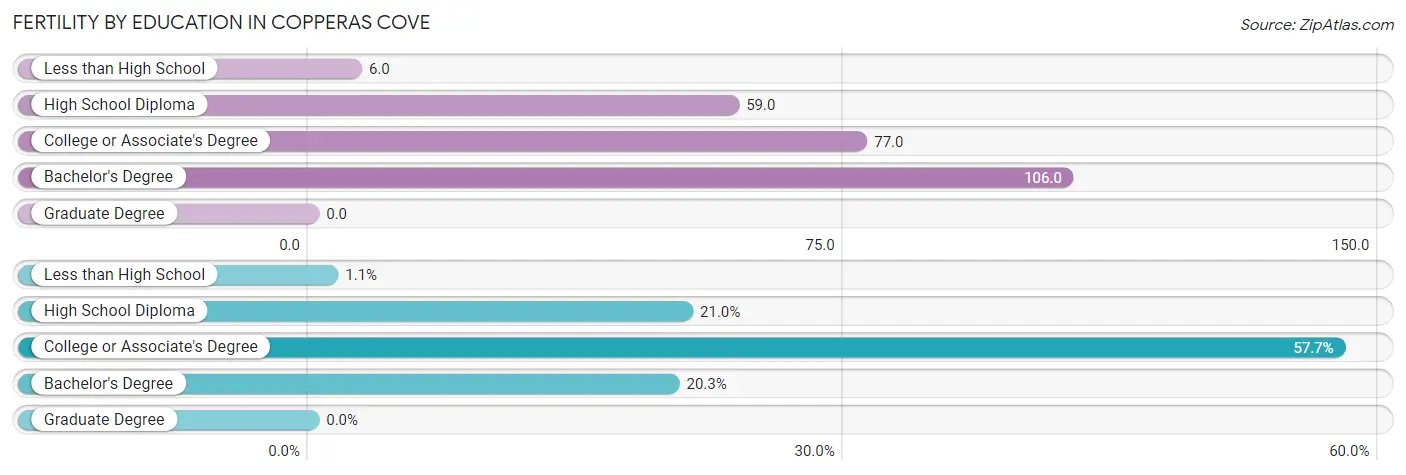
| Educational Attainment | Women with Births | Births / 1,000 Women |
| Less than High School | 7 (1.1%) | 6.0 |
| High School Diploma | 137 (21.0%) | 59.0 |
| College or Associate's Degree | 376 (57.7%) | 77.0 |
| Bachelor's Degree | 132 (20.3%) | 106.0 |
| Graduate Degree | 0 (0.0%) | 0.0 |
| Total | 652 (100.0%) | 65.0 |
Fertility by Education by Marriage Status in Copperas Cove
24.7% of women with births in Copperas Cove are unmarried. Women with the educational attainment of bachelor's degree are most likely to be married with 100.0% of them married at childbirth, while women with the educational attainment of less than high school are least likely to be married with 100.0% of them unmarried at childbirth.
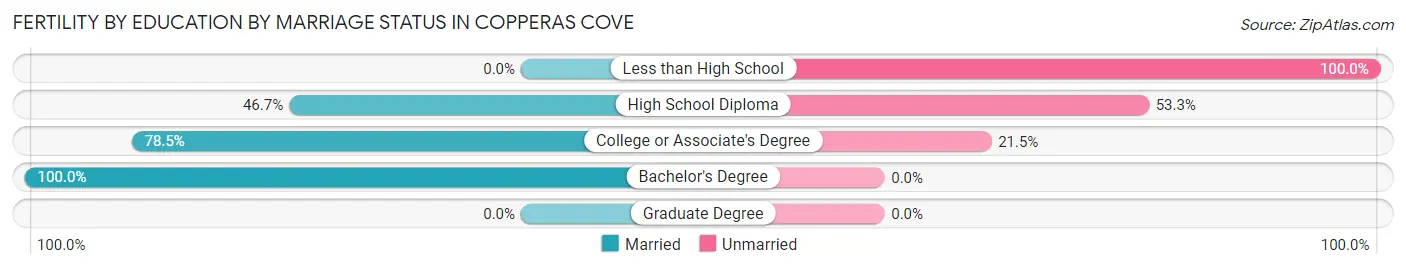
| Educational Attainment | Married | Unmarried |
| Less than High School | 0 (0.0%) | 7 (100.0%) |
| High School Diploma | 64 (46.7%) | 73 (53.3%) |
| College or Associate's Degree | 295 (78.5%) | 81 (21.5%) |
| Bachelor's Degree | 132 (100.0%) | 0 (0.0%) |
| Graduate Degree | 0 (0.0%) | 0 (0.0%) |
| Total | 491 (75.3%) | 161 (24.7%) |
Employment Characteristics in Copperas Cove
Employment by Class of Employer in Copperas Cove
Among the 16,212 employed individuals in Copperas Cove, private company employees (8,302 | 51.2%), federal government employees (3,569 | 22.0%), and local government employees (1,677 | 10.3%) make up the most common classes of employment.
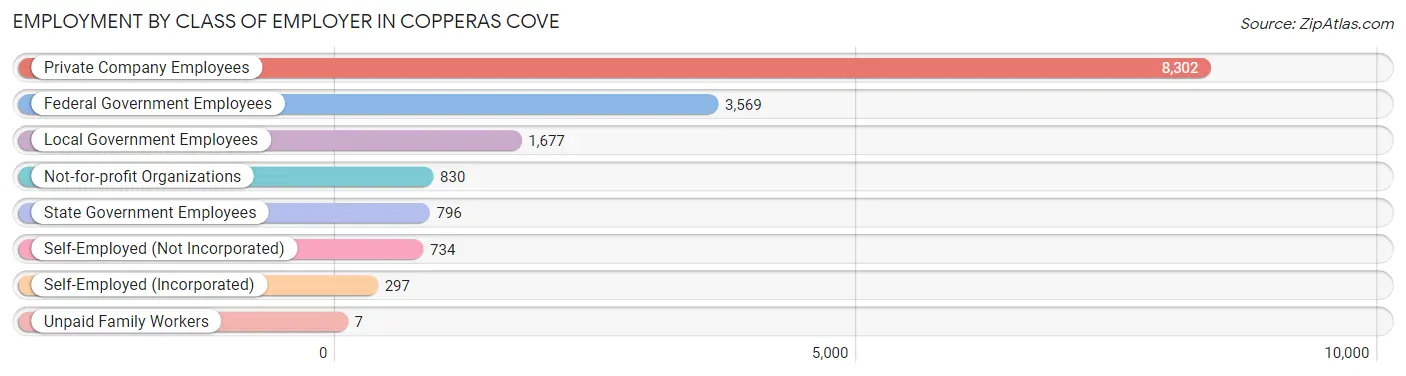
| Employer Class | # Employees | % Employees |
| Private Company Employees | 8,302 | 51.2% |
| Self-Employed (Incorporated) | 297 | 1.8% |
| Self-Employed (Not Incorporated) | 734 | 4.5% |
| Not-for-profit Organizations | 830 | 5.1% |
| Local Government Employees | 1,677 | 10.3% |
| State Government Employees | 796 | 4.9% |
| Federal Government Employees | 3,569 | 22.0% |
| Unpaid Family Workers | 7 | 0.0% |
| Total | 16,212 | 100.0% |
Employment Status by Age in Copperas Cove
According to the labor force statistics for Copperas Cove, out of the total population over 16 years of age (27,643), 64.1% or 17,719 individuals are in the labor force, with 7.6% or 1,347 of them unemployed. The age group with the highest labor force participation rate is 30 to 34 years, with 88.0% or 2,630 individuals in the labor force. Within the labor force, the 16 to 19 years age range has the highest percentage of unemployed individuals, with 18.7% or 119 of them being unemployed.
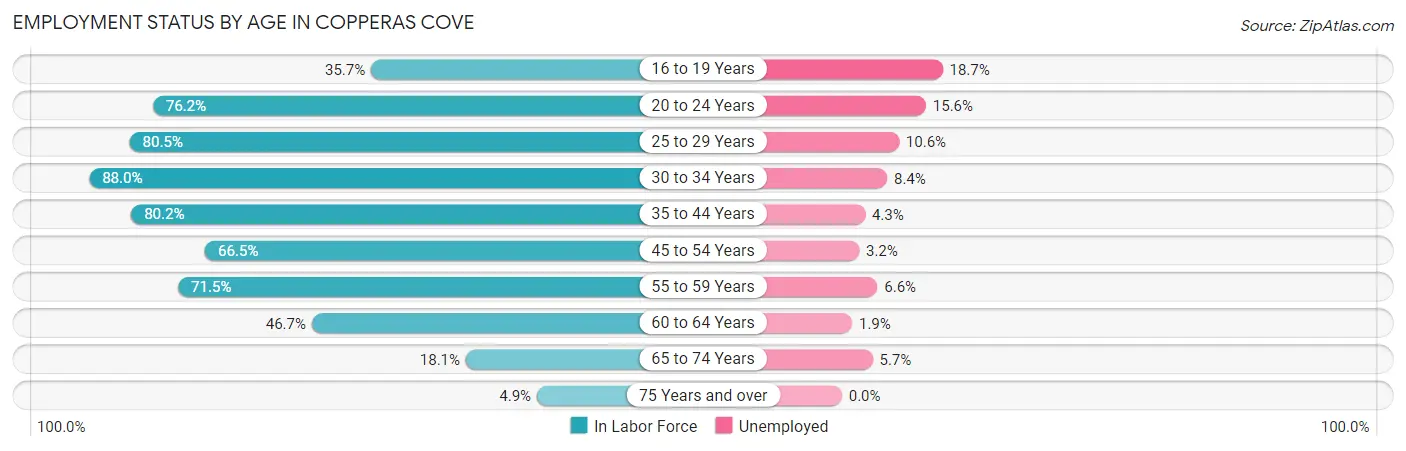
| Age Bracket | In Labor Force | Unemployed |
| 16 to 19 Years | 637 (35.7%) | 119 (18.7%) |
| 20 to 24 Years | 2,083 (76.2%) | 325 (15.6%) |
| 25 to 29 Years | 2,995 (80.5%) | 317 (10.6%) |
| 30 to 34 Years | 2,630 (88.0%) | 221 (8.4%) |
| 35 to 44 Years | 4,477 (80.2%) | 193 (4.3%) |
| 45 to 54 Years | 2,746 (66.5%) | 88 (3.2%) |
| 55 to 59 Years | 952 (71.5%) | 63 (6.6%) |
| 60 to 64 Years | 692 (46.7%) | 13 (1.9%) |
| 65 to 74 Years | 456 (18.1%) | 26 (5.7%) |
| 75 Years and over | 67 (4.9%) | 0 (0.0%) |
| Total | 17,719 (64.1%) | 1,347 (7.6%) |
Employment Status by Educational Attainment in Copperas Cove
According to labor force statistics for Copperas Cove, 75.3% of individuals (14,483) out of the total population between 25 and 64 years of age (19,234) are in the labor force, with 6.1% or 883 of them being unemployed. The group with the highest labor force participation rate are those with the educational attainment of bachelor's degree or higher, with 85.2% or 3,540 individuals in the labor force. Within the labor force, individuals with high school diploma education have the highest percentage of unemployment, with 9.8% or 349 of them being unemployed.
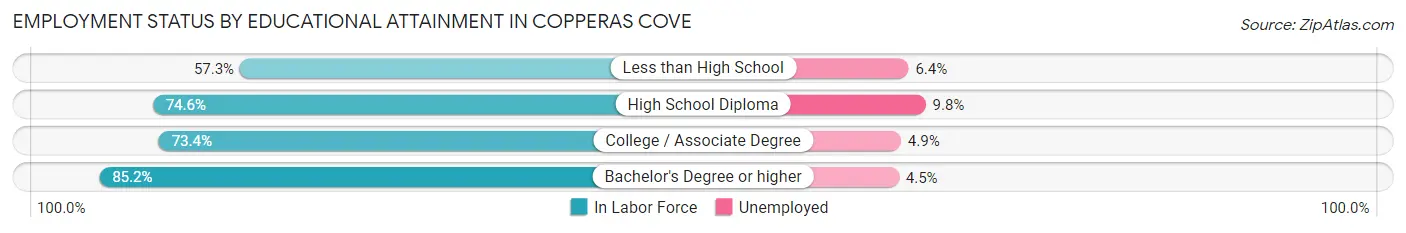
| Educational Attainment | In Labor Force | Unemployed |
| Less than High School | 613 (57.3%) | 68 (6.4%) |
| High School Diploma | 3,564 (74.6%) | 468 (9.8%) |
| College / Associate Degree | 6,776 (73.4%) | 452 (4.9%) |
| Bachelor's Degree or higher | 3,540 (85.2%) | 187 (4.5%) |
| Total | 14,483 (75.3%) | 1,173 (6.1%) |
Employment Occupations by Sex in Copperas Cove
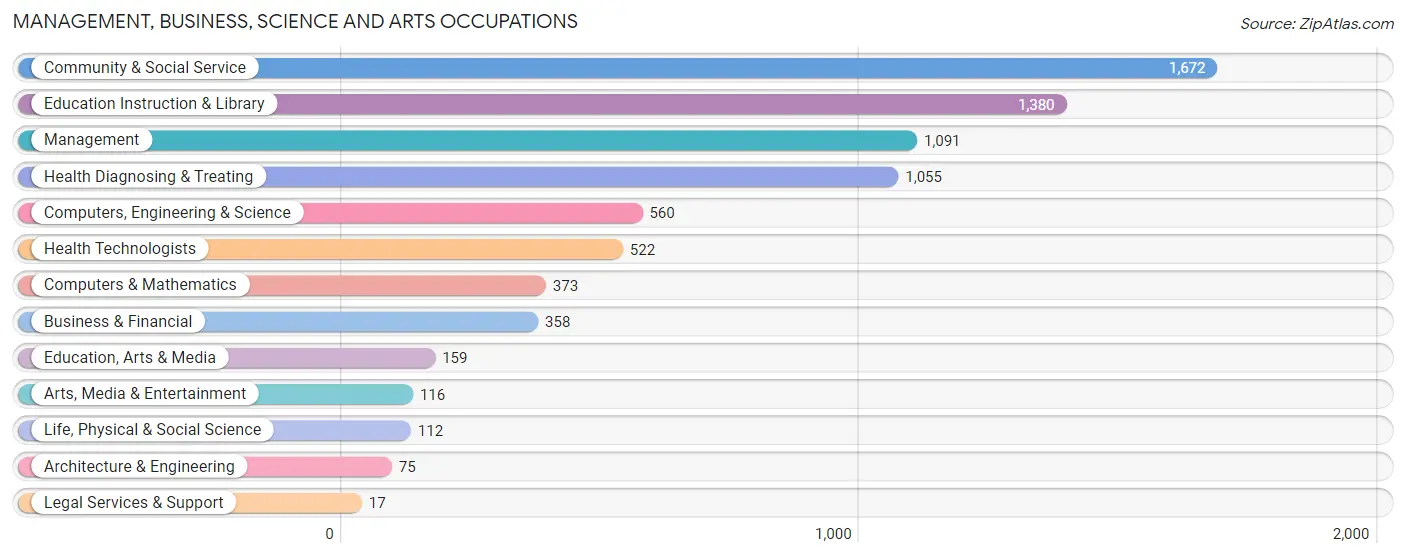
Management, Business, Science and Arts Occupations
The most common Management, Business, Science and Arts occupations in Copperas Cove are Community & Social Service (1,672 | 11.6%), Education Instruction & Library (1,380 | 9.6%), Management (1,091 | 7.6%), Health Diagnosing & Treating (1,055 | 7.3%), and Computers, Engineering & Science (560 | 3.9%).
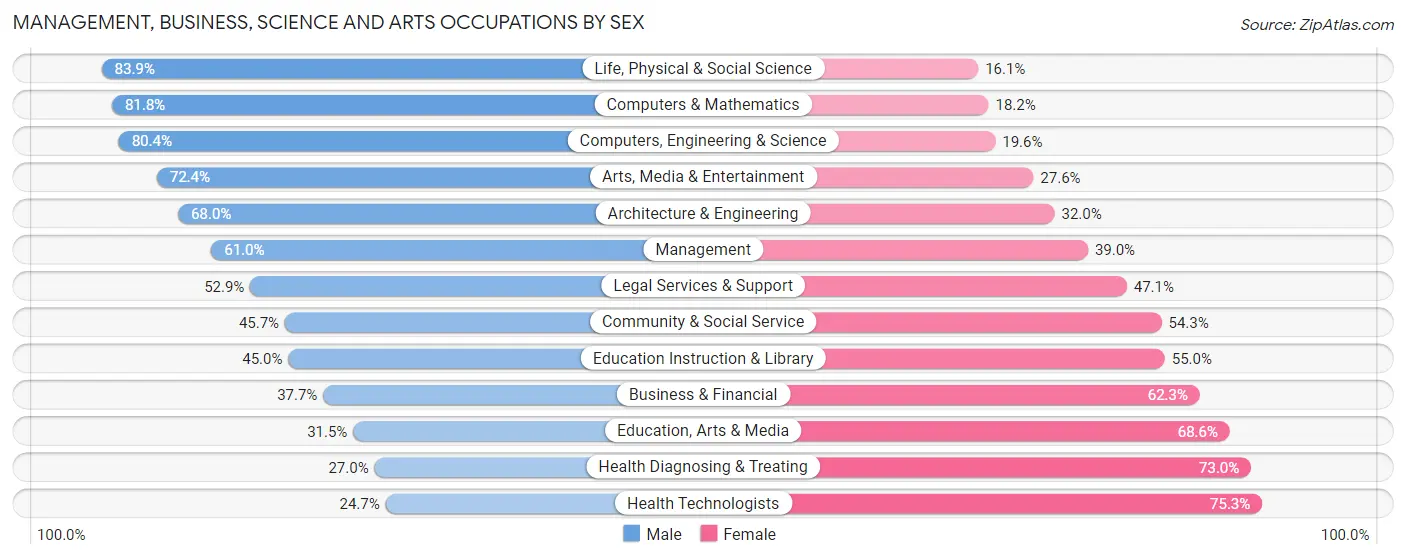
Management, Business, Science and Arts Occupations by Sex
Within the Management, Business, Science and Arts occupations in Copperas Cove, the most male-oriented occupations are Life, Physical & Social Science (83.9%), Computers & Mathematics (81.8%), and Computers, Engineering & Science (80.4%), while the most female-oriented occupations are Health Technologists (75.3%), Health Diagnosing & Treating (73.0%), and Education, Arts & Media (68.5%).
| Occupation | Male | Female |
| Management | 666 (61.0%) | 425 (39.0%) |
| Business & Financial | 135 (37.7%) | 223 (62.3%) |
| Computers, Engineering & Science | 450 (80.4%) | 110 (19.6%) |
| Computers & Mathematics | 305 (81.8%) | 68 (18.2%) |
| Architecture & Engineering | 51 (68.0%) | 24 (32.0%) |
| Life, Physical & Social Science | 94 (83.9%) | 18 (16.1%) |
| Community & Social Service | 764 (45.7%) | 908 (54.3%) |
| Education, Arts & Media | 50 (31.5%) | 109 (68.5%) |
| Legal Services & Support | 9 (52.9%) | 8 (47.1%) |
| Education Instruction & Library | 621 (45.0%) | 759 (55.0%) |
| Arts, Media & Entertainment | 84 (72.4%) | 32 (27.6%) |
| Health Diagnosing & Treating | 285 (27.0%) | 770 (73.0%) |
| Health Technologists | 129 (24.7%) | 393 (75.3%) |
| Total (Category) | 2,300 (48.6%) | 2,436 (51.4%) |
| Total (Overall) | 7,330 (50.8%) | 7,110 (49.2%) |
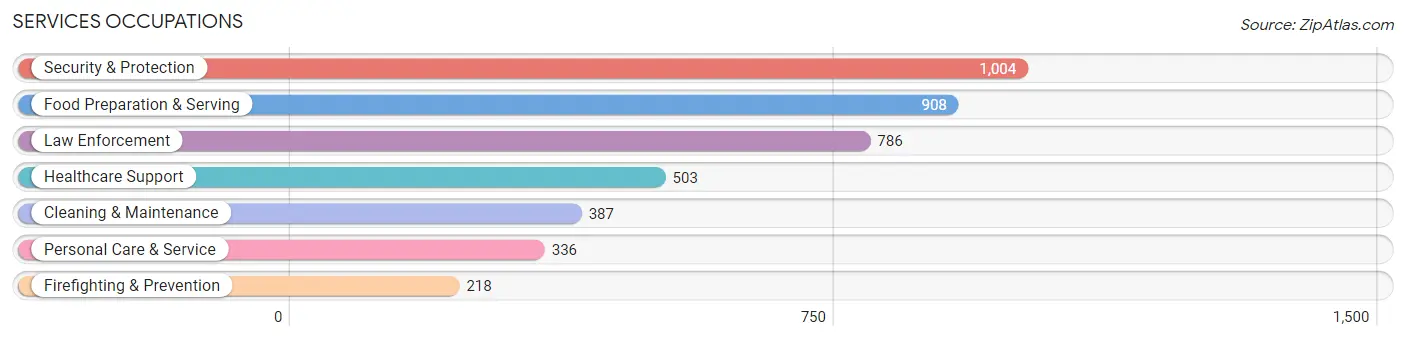
Services Occupations
The most common Services occupations in Copperas Cove are Security & Protection (1,004 | 7.0%), Food Preparation & Serving (908 | 6.3%), Law Enforcement (786 | 5.4%), Healthcare Support (503 | 3.5%), and Cleaning & Maintenance (387 | 2.7%).
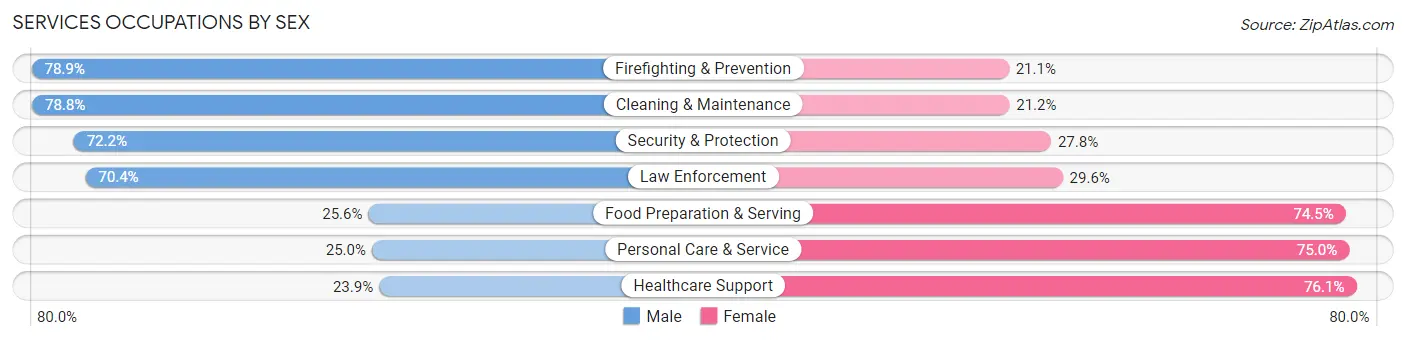
Services Occupations by Sex
Within the Services occupations in Copperas Cove, the most male-oriented occupations are Firefighting & Prevention (78.9%), Cleaning & Maintenance (78.8%), and Security & Protection (72.2%), while the most female-oriented occupations are Healthcare Support (76.1%), Personal Care & Service (75.0%), and Food Preparation & Serving (74.5%).
| Occupation | Male | Female |
| Healthcare Support | 120 (23.9%) | 383 (76.1%) |
| Security & Protection | 725 (72.2%) | 279 (27.8%) |
| Firefighting & Prevention | 172 (78.9%) | 46 (21.1%) |
| Law Enforcement | 553 (70.4%) | 233 (29.6%) |
| Food Preparation & Serving | 232 (25.6%) | 676 (74.5%) |
| Cleaning & Maintenance | 305 (78.8%) | 82 (21.2%) |
| Personal Care & Service | 84 (25.0%) | 252 (75.0%) |
| Total (Category) | 1,466 (46.7%) | 1,672 (53.3%) |
| Total (Overall) | 7,330 (50.8%) | 7,110 (49.2%) |
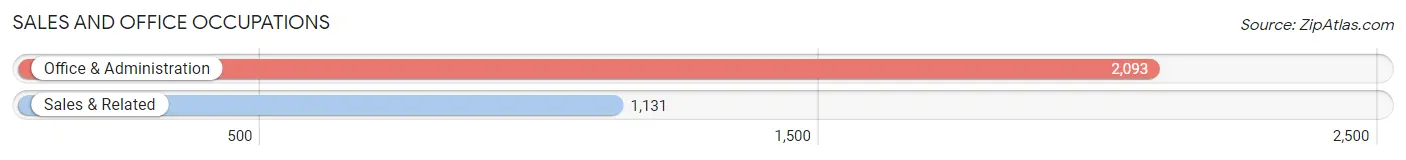
Sales and Office Occupations
The most common Sales and Office occupations in Copperas Cove are Office & Administration (2,093 | 14.5%), and Sales & Related (1,131 | 7.8%).
Sales and Office Occupations by Sex
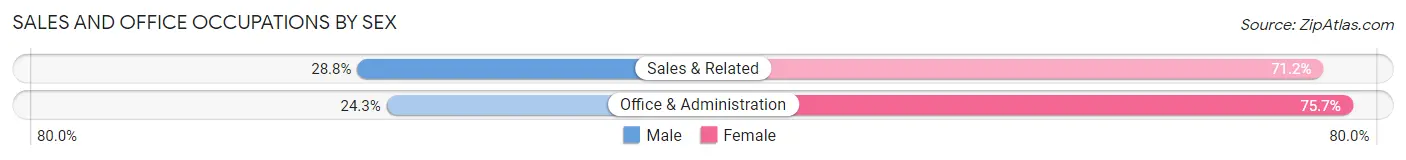
| Occupation | Male | Female |
| Sales & Related | 326 (28.8%) | 805 (71.2%) |
| Office & Administration | 509 (24.3%) | 1,584 (75.7%) |
| Total (Category) | 835 (25.9%) | 2,389 (74.1%) |
| Total (Overall) | 7,330 (50.8%) | 7,110 (49.2%) |
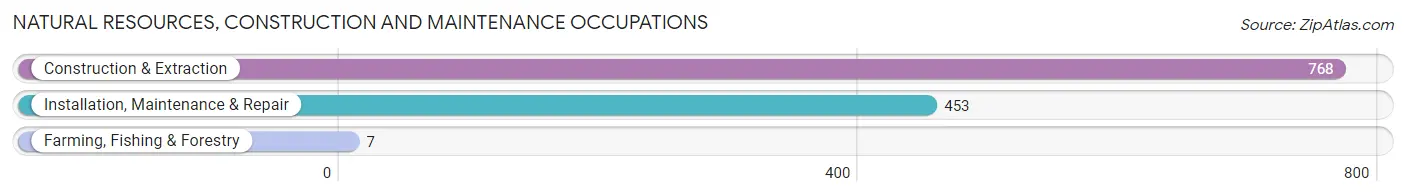
Natural Resources, Construction and Maintenance Occupations
The most common Natural Resources, Construction and Maintenance occupations in Copperas Cove are Construction & Extraction (768 | 5.3%), Installation, Maintenance & Repair (453 | 3.1%), and Farming, Fishing & Forestry (7 | 0.1%).
Natural Resources, Construction and Maintenance Occupations by Sex
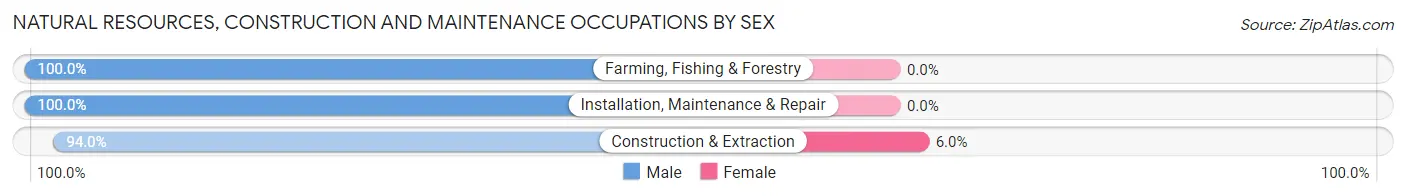
| Occupation | Male | Female |
| Farming, Fishing & Forestry | 7 (100.0%) | 0 (0.0%) |
| Construction & Extraction | 722 (94.0%) | 46 (6.0%) |
| Installation, Maintenance & Repair | 453 (100.0%) | 0 (0.0%) |
| Total (Category) | 1,182 (96.3%) | 46 (3.7%) |
| Total (Overall) | 7,330 (50.8%) | 7,110 (49.2%) |
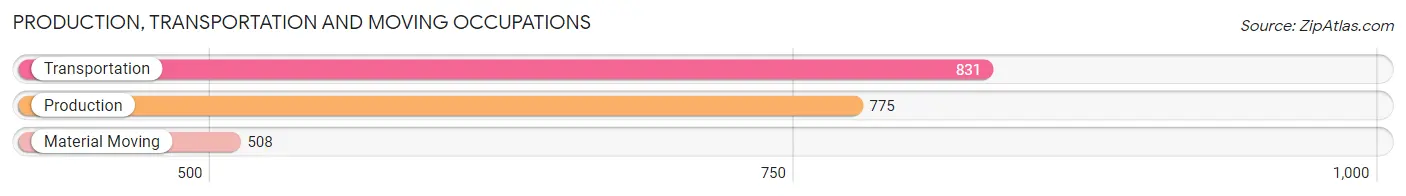
Production, Transportation and Moving Occupations
The most common Production, Transportation and Moving occupations in Copperas Cove are Transportation (831 | 5.8%), Production (775 | 5.4%), and Material Moving (508 | 3.5%).
Production, Transportation and Moving Occupations by Sex
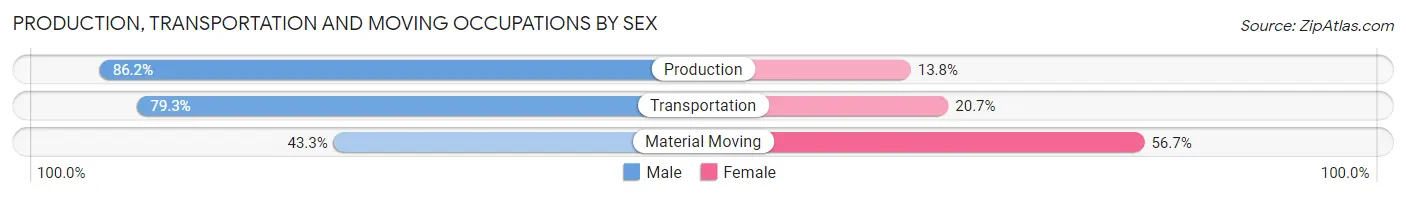
| Occupation | Male | Female |
| Production | 668 (86.2%) | 107 (13.8%) |
| Transportation | 659 (79.3%) | 172 (20.7%) |
| Material Moving | 220 (43.3%) | 288 (56.7%) |
| Total (Category) | 1,547 (73.2%) | 567 (26.8%) |
| Total (Overall) | 7,330 (50.8%) | 7,110 (49.2%) |
Employment Industries by Sex in Copperas Cove
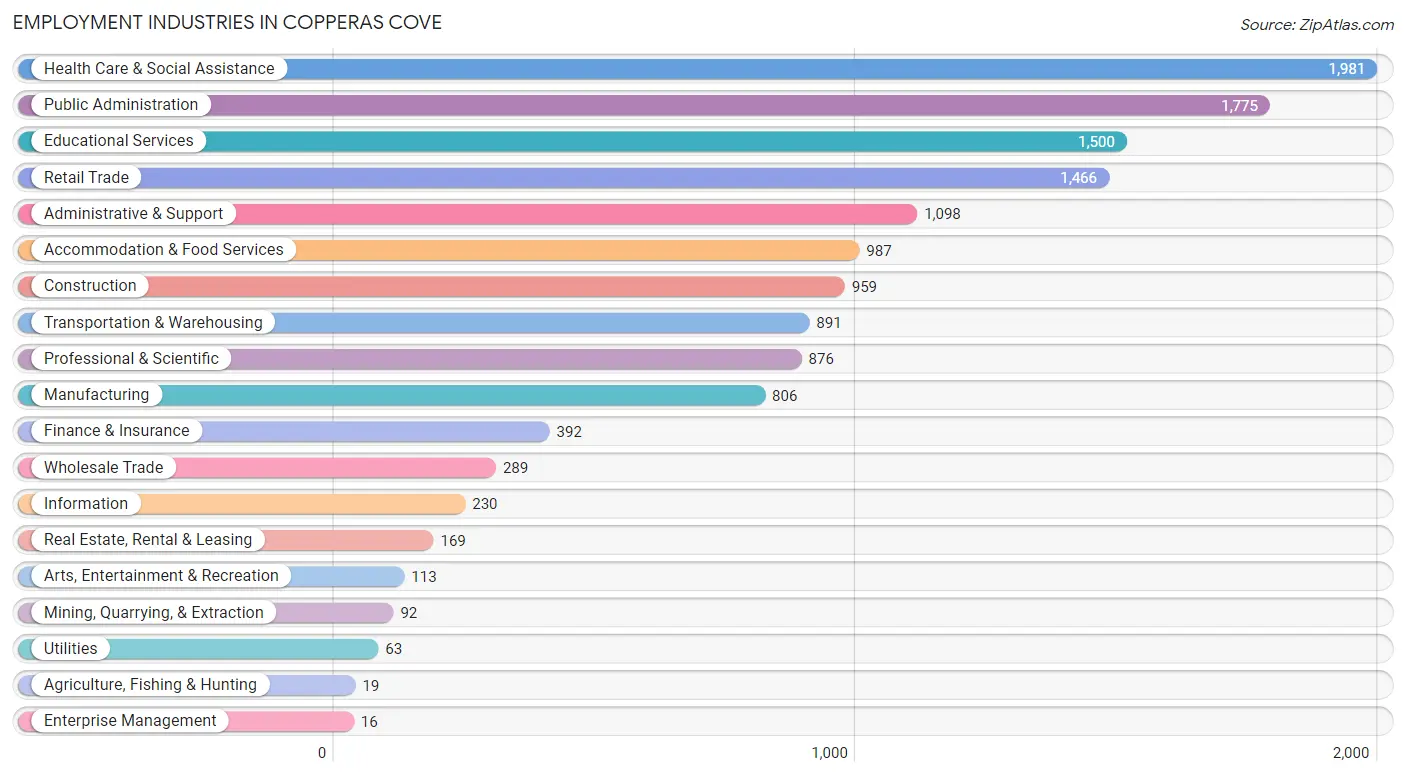
Employment Industries in Copperas Cove
The major employment industries in Copperas Cove include Health Care & Social Assistance (1,981 | 13.7%), Public Administration (1,775 | 12.3%), Educational Services (1,500 | 10.4%), Retail Trade (1,466 | 10.2%), and Administrative & Support (1,098 | 7.6%).
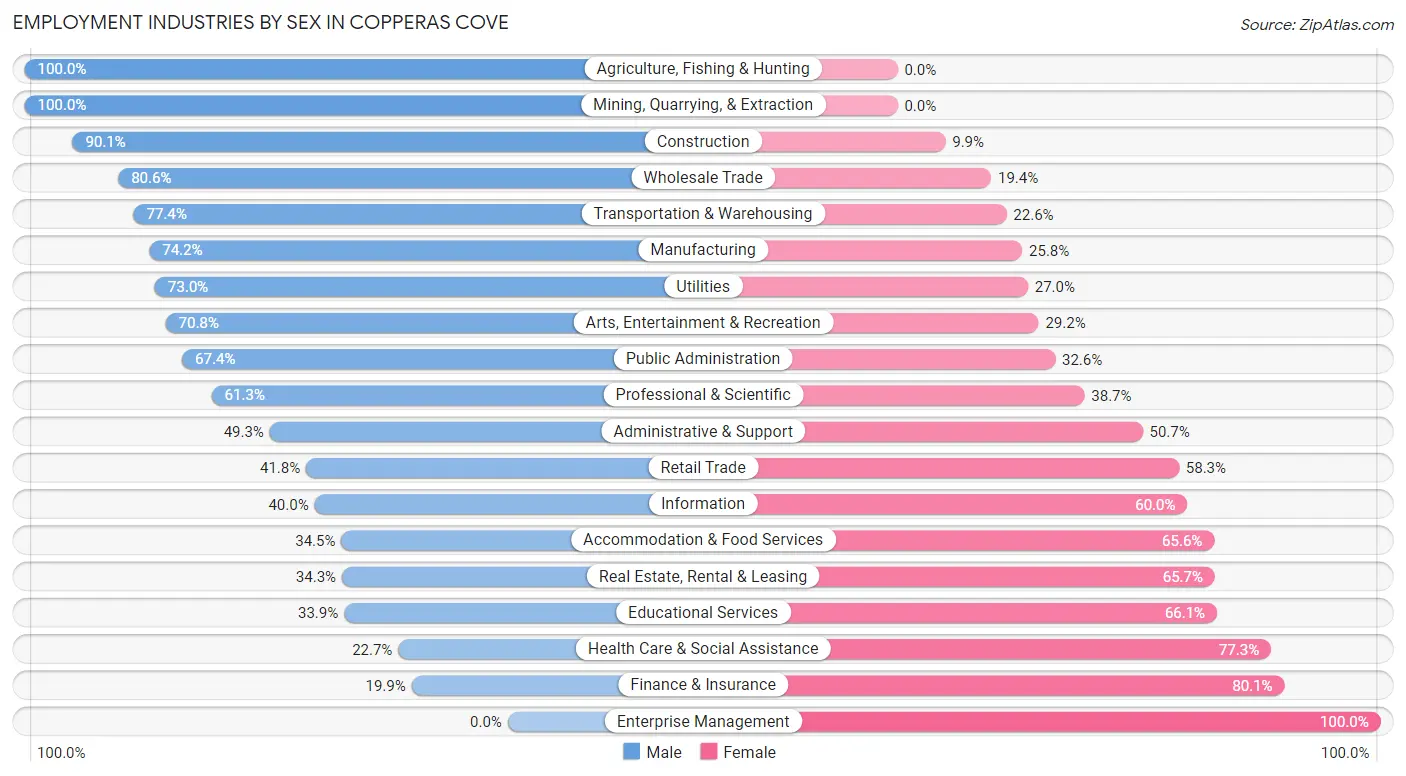
Employment Industries by Sex in Copperas Cove
The Copperas Cove industries that see more men than women are Agriculture, Fishing & Hunting (100.0%), Mining, Quarrying, & Extraction (100.0%), and Construction (90.1%), whereas the industries that tend to have a higher number of women are Enterprise Management (100.0%), Finance & Insurance (80.1%), and Health Care & Social Assistance (77.3%).
| Industry | Male | Female |
| Agriculture, Fishing & Hunting | 19 (100.0%) | 0 (0.0%) |
| Mining, Quarrying, & Extraction | 92 (100.0%) | 0 (0.0%) |
| Construction | 864 (90.1%) | 95 (9.9%) |
| Manufacturing | 598 (74.2%) | 208 (25.8%) |
| Wholesale Trade | 233 (80.6%) | 56 (19.4%) |
| Retail Trade | 612 (41.7%) | 854 (58.3%) |
| Transportation & Warehousing | 690 (77.4%) | 201 (22.6%) |
| Utilities | 46 (73.0%) | 17 (27.0%) |
| Information | 92 (40.0%) | 138 (60.0%) |
| Finance & Insurance | 78 (19.9%) | 314 (80.1%) |
| Real Estate, Rental & Leasing | 58 (34.3%) | 111 (65.7%) |
| Professional & Scientific | 537 (61.3%) | 339 (38.7%) |
| Enterprise Management | 0 (0.0%) | 16 (100.0%) |
| Administrative & Support | 541 (49.3%) | 557 (50.7%) |
| Educational Services | 508 (33.9%) | 992 (66.1%) |
| Health Care & Social Assistance | 449 (22.7%) | 1,532 (77.3%) |
| Arts, Entertainment & Recreation | 80 (70.8%) | 33 (29.2%) |
| Accommodation & Food Services | 340 (34.4%) | 647 (65.5%) |
| Public Administration | 1,196 (67.4%) | 579 (32.6%) |
| Total | 7,330 (50.8%) | 7,110 (49.2%) |
Education in Copperas Cove
School Enrollment in Copperas Cove
The most common levels of schooling among the 10,736 students in Copperas Cove are college / undergraduate (2,641 | 24.6%), middle school (2,596 | 24.2%), and high school (2,258 | 21.0%).
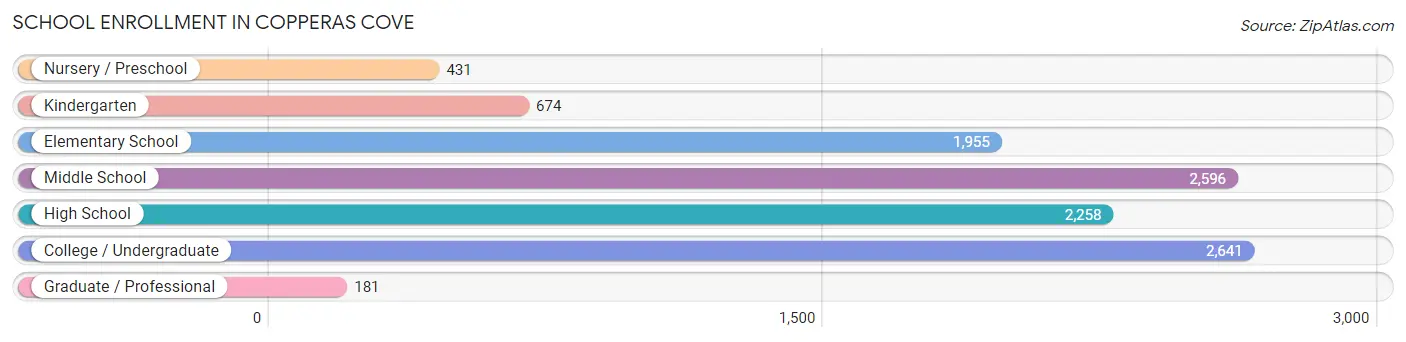
| School Level | # Students | % Students |
| Nursery / Preschool | 431 | 4.0% |
| Kindergarten | 674 | 6.3% |
| Elementary School | 1,955 | 18.2% |
| Middle School | 2,596 | 24.2% |
| High School | 2,258 | 21.0% |
| College / Undergraduate | 2,641 | 24.6% |
| Graduate / Professional | 181 | 1.7% |
| Total | 10,736 | 100.0% |
School Enrollment by Age by Funding Source in Copperas Cove
Out of a total of 10,736 students who are enrolled in schools in Copperas Cove, 623 (5.8%) attend a private institution, while the remaining 10,113 (94.2%) are enrolled in public schools. The age group of 35 years and over has the highest likelihood of being enrolled in private schools, with 167 (23.9% in the age bracket) enrolled. Conversely, the age group of 20 to 24 year olds has the lowest likelihood of being enrolled in a private school, with 848 (98.0% in the age bracket) attending a public institution.
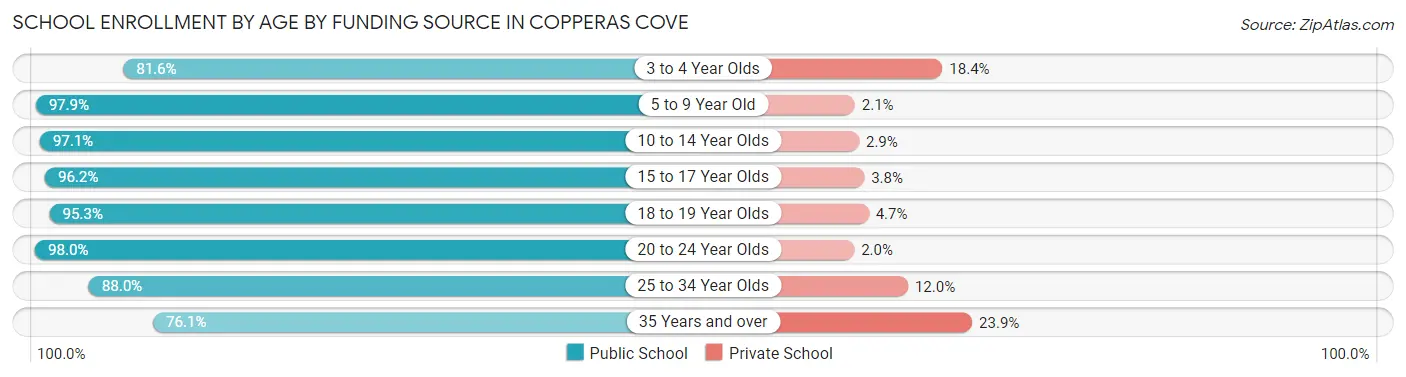
| Age Bracket | Public School | Private School |
| 3 to 4 Year Olds | 355 (81.6%) | 80 (18.4%) |
| 5 to 9 Year Old | 2,449 (97.9%) | 52 (2.1%) |
| 10 to 14 Year Olds | 3,053 (97.1%) | 90 (2.9%) |
| 15 to 17 Year Olds | 1,358 (96.2%) | 54 (3.8%) |
| 18 to 19 Year Olds | 553 (95.3%) | 27 (4.7%) |
| 20 to 24 Year Olds | 848 (98.0%) | 17 (2.0%) |
| 25 to 34 Year Olds | 970 (88.0%) | 132 (12.0%) |
| 35 Years and over | 531 (76.1%) | 167 (23.9%) |
| Total | 10,113 (94.2%) | 623 (5.8%) |
Educational Attainment by Field of Study in Copperas Cove
Business (793 | 15.7%), arts & humanities (722 | 14.3%), education (560 | 11.1%), psychology (533 | 10.5%), and liberal arts & history (504 | 10.0%) are the most common fields of study among 5,055 individuals in Copperas Cove who have obtained a bachelor's degree or higher.
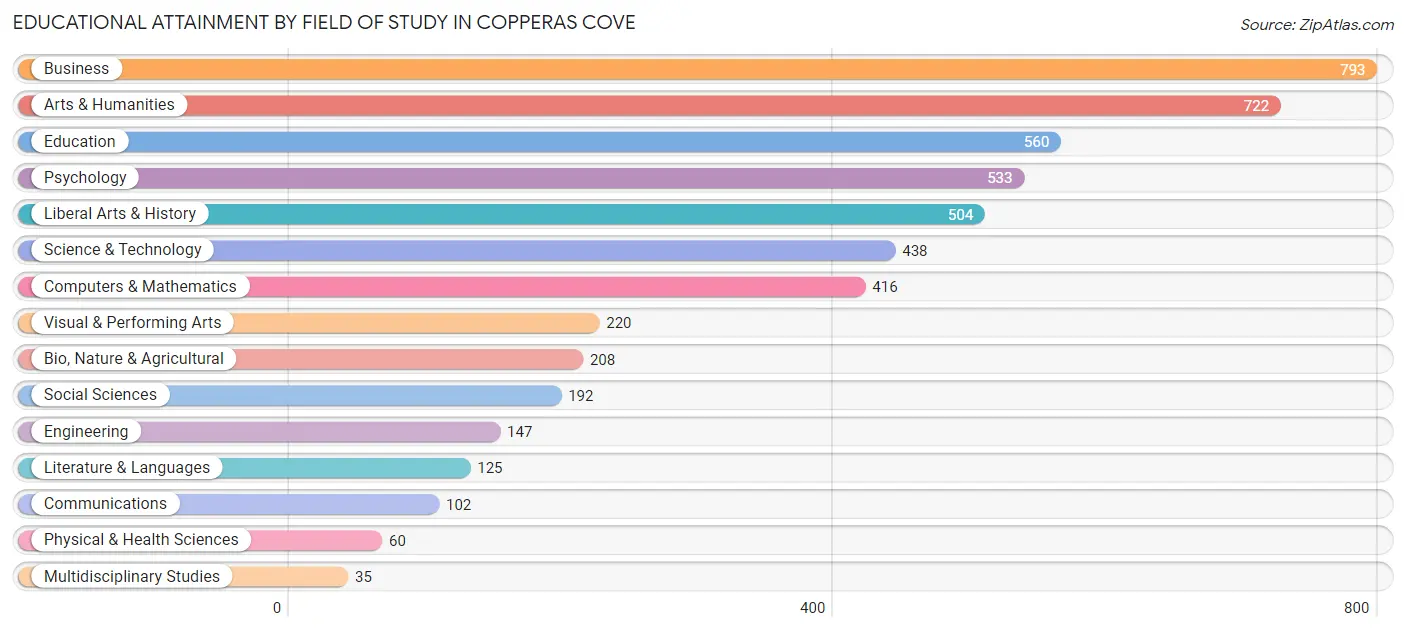
| Field of Study | # Graduates | % Graduates |
| Computers & Mathematics | 416 | 8.2% |
| Bio, Nature & Agricultural | 208 | 4.1% |
| Physical & Health Sciences | 60 | 1.2% |
| Psychology | 533 | 10.5% |
| Social Sciences | 192 | 3.8% |
| Engineering | 147 | 2.9% |
| Multidisciplinary Studies | 35 | 0.7% |
| Science & Technology | 438 | 8.7% |
| Business | 793 | 15.7% |
| Education | 560 | 11.1% |
| Literature & Languages | 125 | 2.5% |
| Liberal Arts & History | 504 | 10.0% |
| Visual & Performing Arts | 220 | 4.3% |
| Communications | 102 | 2.0% |
| Arts & Humanities | 722 | 14.3% |
| Total | 5,055 | 100.0% |
Transportation & Commute in Copperas Cove
Vehicle Availability by Sex in Copperas Cove
The most prevalent vehicle ownership categories in Copperas Cove are males with 2 vehicles (4,211, accounting for 46.1%) and females with 2 vehicles (3,084, making up 59.6%).
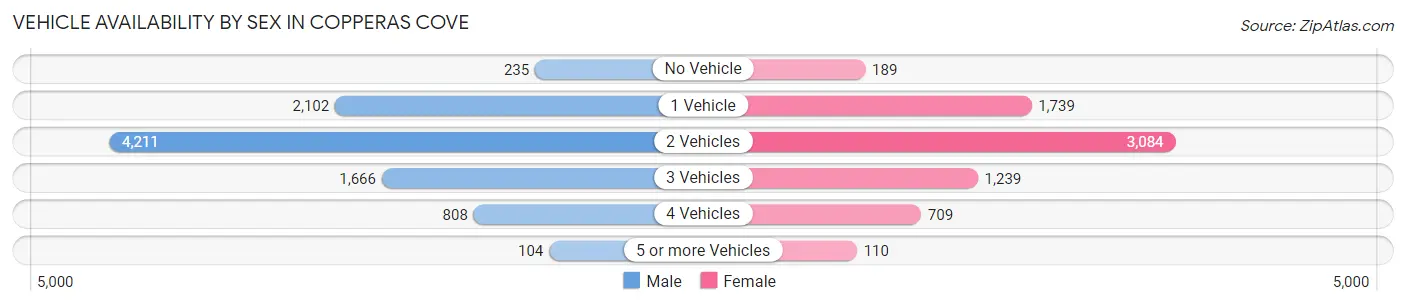
| Vehicles Available | Male | Female |
| No Vehicle | 235 (2.6%) | 189 (2.7%) |
| 1 Vehicle | 2,102 (23.0%) | 1,739 (24.6%) |
| 2 Vehicles | 4,211 (46.1%) | 3,084 (43.6%) |
| 3 Vehicles | 1,666 (18.3%) | 1,239 (17.5%) |
| 4 Vehicles | 808 (8.8%) | 709 (10.0%) |
| 5 or more Vehicles | 104 (1.1%) | 110 (1.6%) |
| Total | 9,126 (100.0%) | 7,070 (100.0%) |
Commute Time in Copperas Cove
The most frequently occuring commute durations in Copperas Cove are 15 to 19 minutes (2,781 commuters, 18.7%), 10 to 14 minutes (2,255 commuters, 15.1%), and 20 to 24 minutes (1,986 commuters, 13.3%).
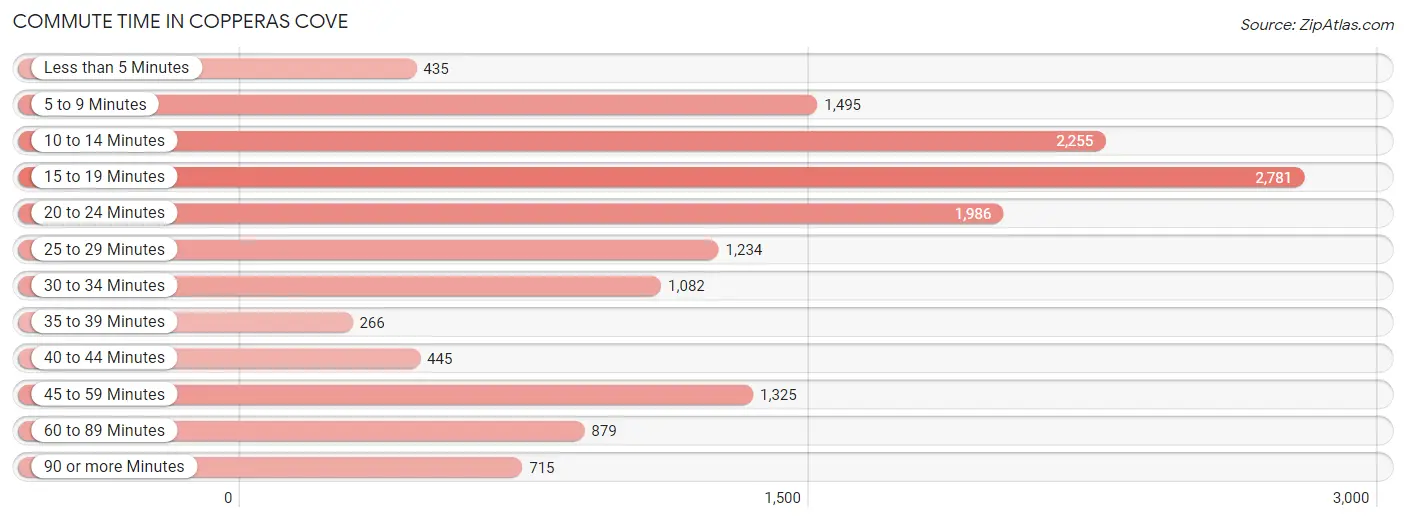
| Commute Time | # Commuters | % Commuters |
| Less than 5 Minutes | 435 | 2.9% |
| 5 to 9 Minutes | 1,495 | 10.0% |
| 10 to 14 Minutes | 2,255 | 15.1% |
| 15 to 19 Minutes | 2,781 | 18.7% |
| 20 to 24 Minutes | 1,986 | 13.3% |
| 25 to 29 Minutes | 1,234 | 8.3% |
| 30 to 34 Minutes | 1,082 | 7.3% |
| 35 to 39 Minutes | 266 | 1.8% |
| 40 to 44 Minutes | 445 | 3.0% |
| 45 to 59 Minutes | 1,325 | 8.9% |
| 60 to 89 Minutes | 879 | 5.9% |
| 90 or more Minutes | 715 | 4.8% |
Commute Time by Sex in Copperas Cove
The most common commute times in Copperas Cove are 15 to 19 minutes (1,529 commuters, 18.1%) for males and 15 to 19 minutes (1,252 commuters, 19.4%) for females.
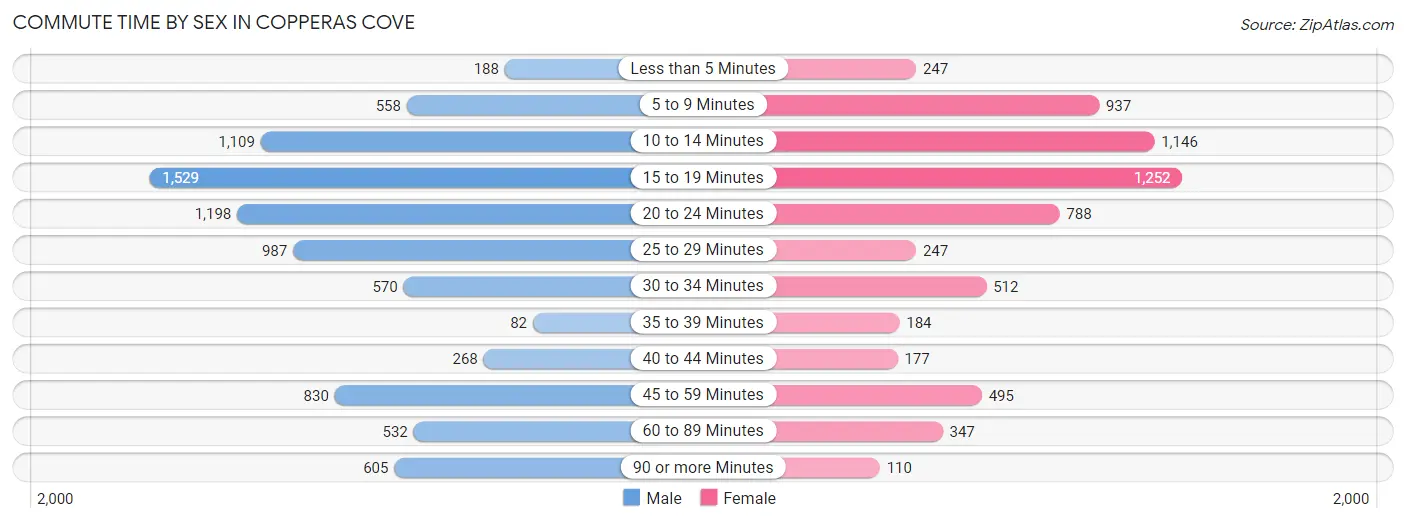
| Commute Time | Male | Female |
| Less than 5 Minutes | 188 (2.2%) | 247 (3.8%) |
| 5 to 9 Minutes | 558 (6.6%) | 937 (14.5%) |
| 10 to 14 Minutes | 1,109 (13.1%) | 1,146 (17.8%) |
| 15 to 19 Minutes | 1,529 (18.1%) | 1,252 (19.4%) |
| 20 to 24 Minutes | 1,198 (14.2%) | 788 (12.2%) |
| 25 to 29 Minutes | 987 (11.7%) | 247 (3.8%) |
| 30 to 34 Minutes | 570 (6.7%) | 512 (8.0%) |
| 35 to 39 Minutes | 82 (1.0%) | 184 (2.9%) |
| 40 to 44 Minutes | 268 (3.2%) | 177 (2.8%) |
| 45 to 59 Minutes | 830 (9.8%) | 495 (7.7%) |
| 60 to 89 Minutes | 532 (6.3%) | 347 (5.4%) |
| 90 or more Minutes | 605 (7.1%) | 110 (1.7%) |
Time of Departure to Work by Sex in Copperas Cove
The most frequent times of departure to work in Copperas Cove are 5:30 AM to 5:59 AM (1,424, 16.8%) for males and 6:30 AM to 6:59 AM (943, 14.6%) for females.
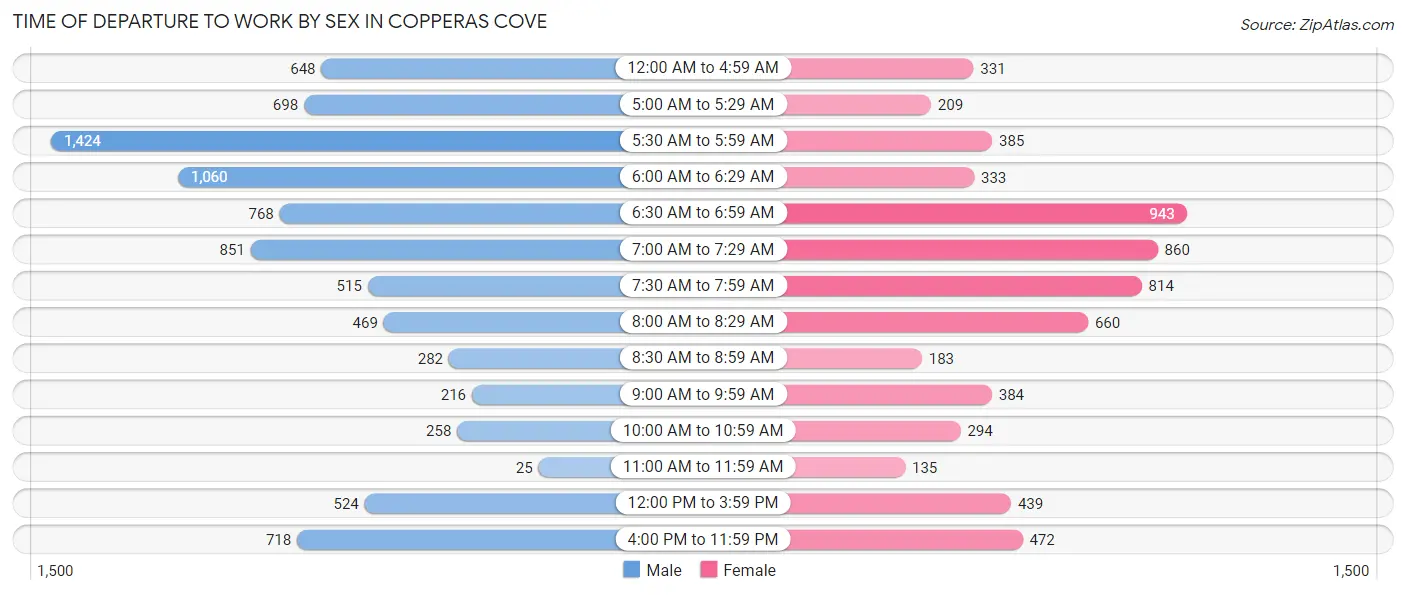
| Time of Departure | Male | Female |
| 12:00 AM to 4:59 AM | 648 (7.7%) | 331 (5.1%) |
| 5:00 AM to 5:29 AM | 698 (8.3%) | 209 (3.2%) |
| 5:30 AM to 5:59 AM | 1,424 (16.8%) | 385 (6.0%) |
| 6:00 AM to 6:29 AM | 1,060 (12.5%) | 333 (5.2%) |
| 6:30 AM to 6:59 AM | 768 (9.1%) | 943 (14.6%) |
| 7:00 AM to 7:29 AM | 851 (10.1%) | 860 (13.4%) |
| 7:30 AM to 7:59 AM | 515 (6.1%) | 814 (12.6%) |
| 8:00 AM to 8:29 AM | 469 (5.6%) | 660 (10.2%) |
| 8:30 AM to 8:59 AM | 282 (3.3%) | 183 (2.8%) |
| 9:00 AM to 9:59 AM | 216 (2.5%) | 384 (6.0%) |
| 10:00 AM to 10:59 AM | 258 (3.0%) | 294 (4.6%) |
| 11:00 AM to 11:59 AM | 25 (0.3%) | 135 (2.1%) |
| 12:00 PM to 3:59 PM | 524 (6.2%) | 439 (6.8%) |
| 4:00 PM to 11:59 PM | 718 (8.5%) | 472 (7.3%) |
| Total | 8,456 (100.0%) | 6,442 (100.0%) |
Housing Occupancy in Copperas Cove
Occupancy by Ownership in Copperas Cove
Of the total 14,025 dwellings in Copperas Cove, owner-occupied units account for 7,881 (56.2%), while renter-occupied units make up 6,144 (43.8%).
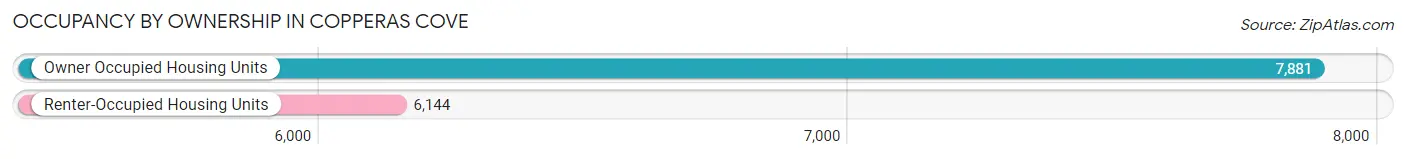
| Occupancy | # Housing Units | % Housing Units |
| Owner Occupied Housing Units | 7,881 | 56.2% |
| Renter-Occupied Housing Units | 6,144 | 43.8% |
| Total Occupied Housing Units | 14,025 | 100.0% |
Occupancy by Household Size in Copperas Cove
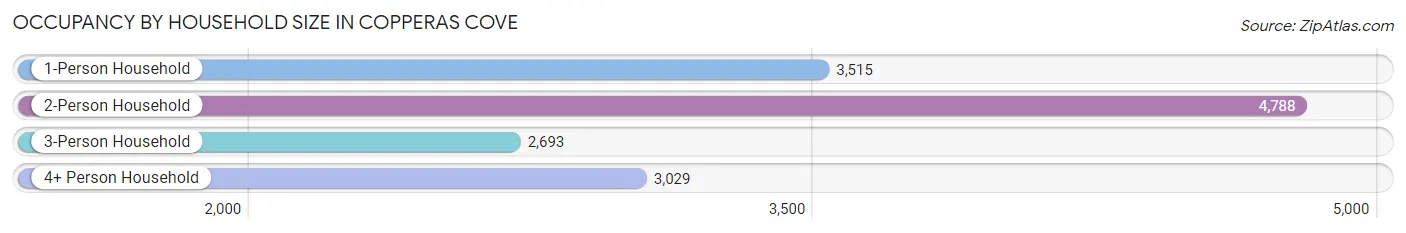
| Household Size | # Housing Units | % Housing Units |
| 1-Person Household | 3,515 | 25.1% |
| 2-Person Household | 4,788 | 34.1% |
| 3-Person Household | 2,693 | 19.2% |
| 4+ Person Household | 3,029 | 21.6% |
| Total Housing Units | 14,025 | 100.0% |
Occupancy by Ownership by Household Size in Copperas Cove
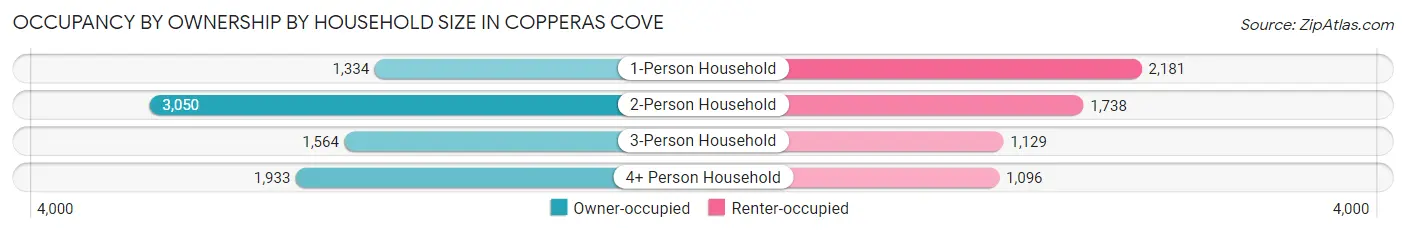
| Household Size | Owner-occupied | Renter-occupied |
| 1-Person Household | 1,334 (38.0%) | 2,181 (62.1%) |
| 2-Person Household | 3,050 (63.7%) | 1,738 (36.3%) |
| 3-Person Household | 1,564 (58.1%) | 1,129 (41.9%) |
| 4+ Person Household | 1,933 (63.8%) | 1,096 (36.2%) |
| Total Housing Units | 7,881 (56.2%) | 6,144 (43.8%) |
Occupancy by Educational Attainment in Copperas Cove
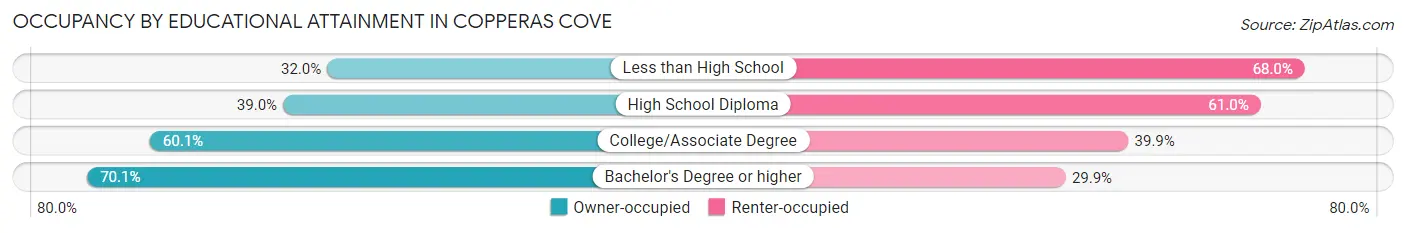
| Household Size | Owner-occupied | Renter-occupied |
| Less than High School | 189 (32.0%) | 401 (68.0%) |
| High School Diploma | 1,257 (39.0%) | 1,964 (61.0%) |
| College/Associate Degree | 4,362 (60.1%) | 2,893 (39.9%) |
| Bachelor's Degree or higher | 2,073 (70.1%) | 886 (29.9%) |
Occupancy by Age of Householder in Copperas Cove
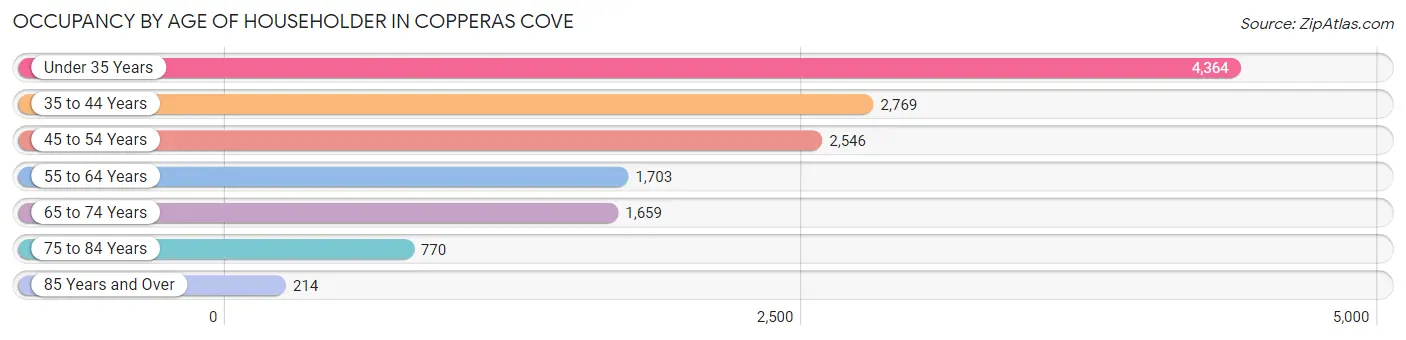
| Age Bracket | # Households | % Households |
| Under 35 Years | 4,364 | 31.1% |
| 35 to 44 Years | 2,769 | 19.7% |
| 45 to 54 Years | 2,546 | 18.1% |
| 55 to 64 Years | 1,703 | 12.1% |
| 65 to 74 Years | 1,659 | 11.8% |
| 75 to 84 Years | 770 | 5.5% |
| 85 Years and Over | 214 | 1.5% |
| Total | 14,025 | 100.0% |
Housing Finances in Copperas Cove
Median Income by Occupancy in Copperas Cove
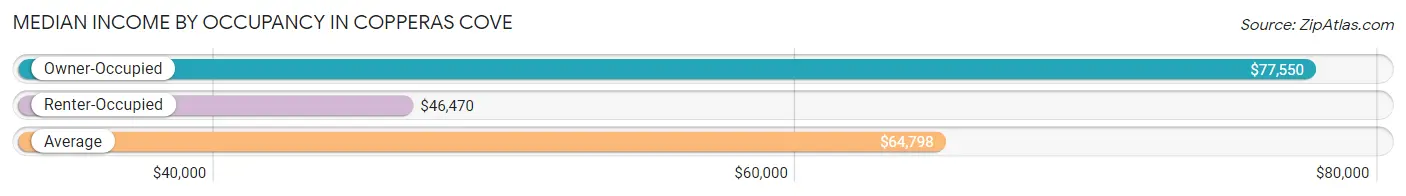
| Occupancy Type | # Households | Median Income |
| Owner-Occupied | 7,881 (56.2%) | $77,550 |
| Renter-Occupied | 6,144 (43.8%) | $46,470 |
| Average | 14,025 (100.0%) | $64,798 |
Occupancy by Householder Income Bracket in Copperas Cove
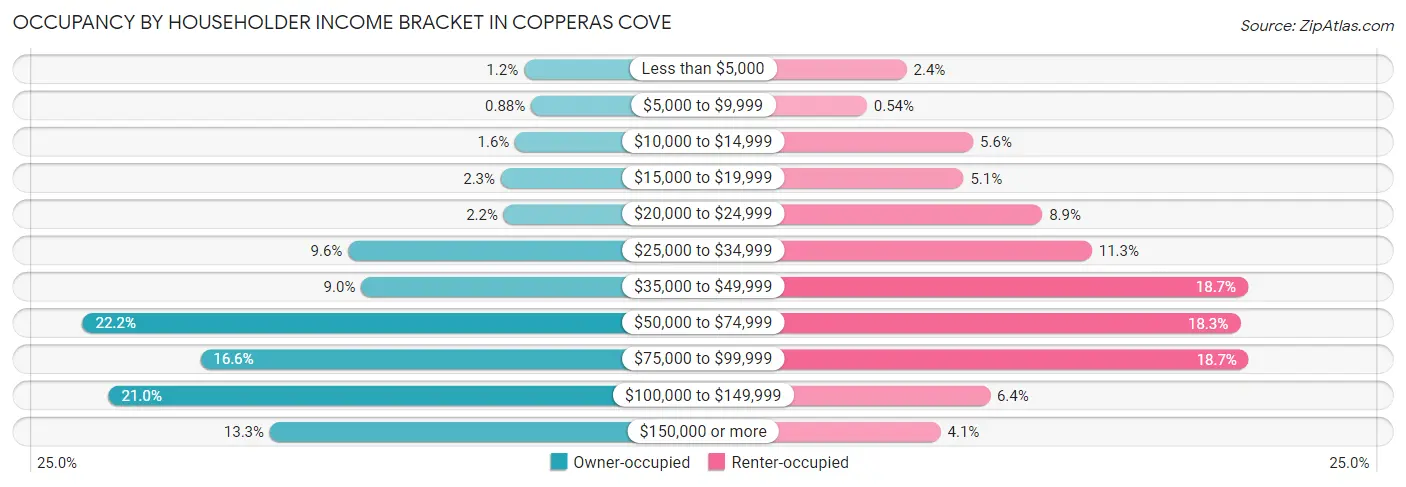
| Income Bracket | Owner-occupied | Renter-occupied |
| Less than $5,000 | 96 (1.2%) | 149 (2.4%) |
| $5,000 to $9,999 | 69 (0.9%) | 33 (0.5%) |
| $10,000 to $14,999 | 129 (1.6%) | 344 (5.6%) |
| $15,000 to $19,999 | 183 (2.3%) | 316 (5.1%) |
| $20,000 to $24,999 | 172 (2.2%) | 546 (8.9%) |
| $25,000 to $34,999 | 756 (9.6%) | 691 (11.3%) |
| $35,000 to $49,999 | 707 (9.0%) | 1,148 (18.7%) |
| $50,000 to $74,999 | 1,753 (22.2%) | 1,125 (18.3%) |
| $75,000 to $99,999 | 1,311 (16.6%) | 1,150 (18.7%) |
| $100,000 to $149,999 | 1,655 (21.0%) | 393 (6.4%) |
| $150,000 or more | 1,050 (13.3%) | 249 (4.1%) |
| Total | 7,881 (100.0%) | 6,144 (100.0%) |
Monthly Housing Cost Tiers in Copperas Cove
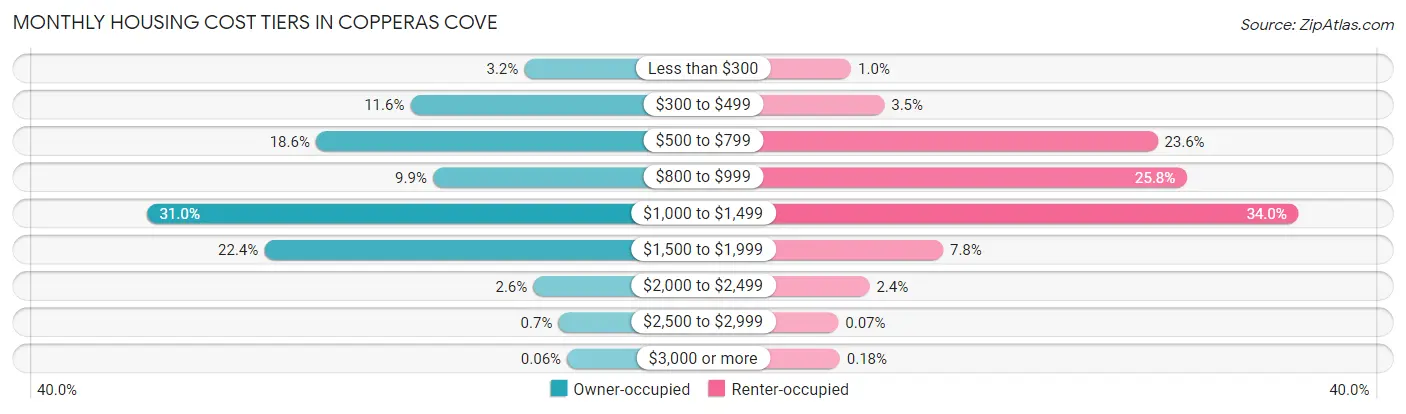
| Monthly Cost | Owner-occupied | Renter-occupied |
| Less than $300 | 253 (3.2%) | 62 (1.0%) |
| $300 to $499 | 914 (11.6%) | 212 (3.5%) |
| $500 to $799 | 1,463 (18.6%) | 1,448 (23.6%) |
| $800 to $999 | 783 (9.9%) | 1,582 (25.8%) |
| $1,000 to $1,499 | 2,445 (31.0%) | 2,087 (34.0%) |
| $1,500 to $1,999 | 1,762 (22.4%) | 478 (7.8%) |
| $2,000 to $2,499 | 201 (2.5%) | 145 (2.4%) |
| $2,500 to $2,999 | 55 (0.7%) | 4 (0.1%) |
| $3,000 or more | 5 (0.1%) | 11 (0.2%) |
| Total | 7,881 (100.0%) | 6,144 (100.0%) |
Physical Housing Characteristics in Copperas Cove
Housing Structures in Copperas Cove
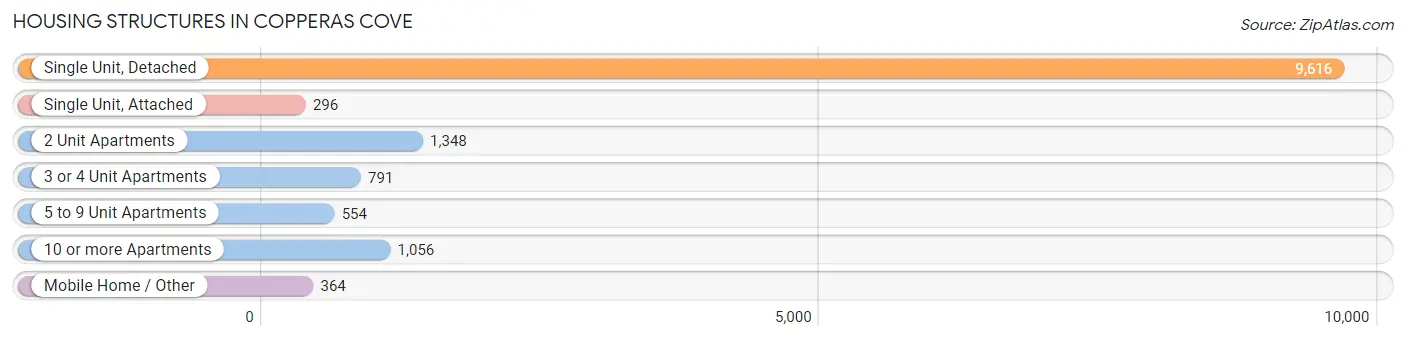
| Structure Type | # Housing Units | % Housing Units |
| Single Unit, Detached | 9,616 | 68.6% |
| Single Unit, Attached | 296 | 2.1% |
| 2 Unit Apartments | 1,348 | 9.6% |
| 3 or 4 Unit Apartments | 791 | 5.6% |
| 5 to 9 Unit Apartments | 554 | 4.0% |
| 10 or more Apartments | 1,056 | 7.5% |
| Mobile Home / Other | 364 | 2.6% |
| Total | 14,025 | 100.0% |
Housing Structures by Occupancy in Copperas Cove
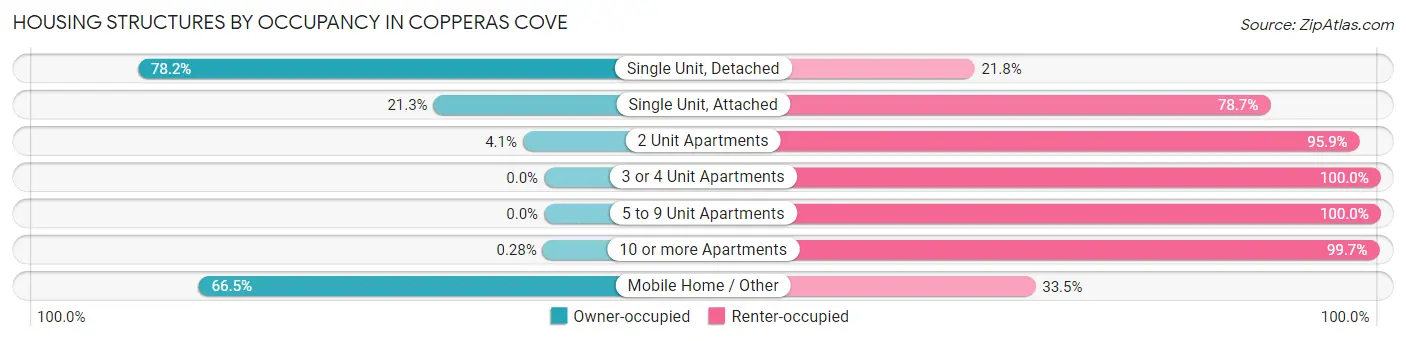
| Structure Type | Owner-occupied | Renter-occupied |
| Single Unit, Detached | 7,518 (78.2%) | 2,098 (21.8%) |
| Single Unit, Attached | 63 (21.3%) | 233 (78.7%) |
| 2 Unit Apartments | 55 (4.1%) | 1,293 (95.9%) |
| 3 or 4 Unit Apartments | 0 (0.0%) | 791 (100.0%) |
| 5 to 9 Unit Apartments | 0 (0.0%) | 554 (100.0%) |
| 10 or more Apartments | 3 (0.3%) | 1,053 (99.7%) |
| Mobile Home / Other | 242 (66.5%) | 122 (33.5%) |
| Total | 7,881 (56.2%) | 6,144 (43.8%) |
Housing Structures by Number of Rooms in Copperas Cove
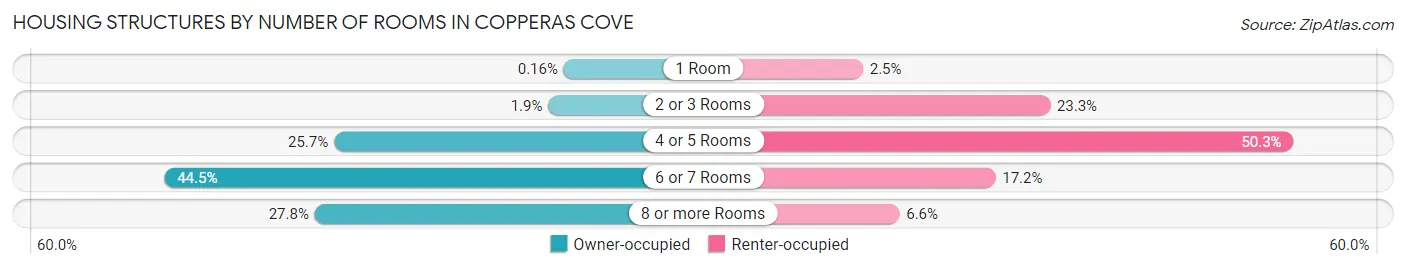
| Number of Rooms | Owner-occupied | Renter-occupied |
| 1 Room | 13 (0.2%) | 156 (2.5%) |
| 2 or 3 Rooms | 148 (1.9%) | 1,432 (23.3%) |
| 4 or 5 Rooms | 2,022 (25.7%) | 3,092 (50.3%) |
| 6 or 7 Rooms | 3,507 (44.5%) | 1,059 (17.2%) |
| 8 or more Rooms | 2,191 (27.8%) | 405 (6.6%) |
| Total | 7,881 (100.0%) | 6,144 (100.0%) |
Housing Structure by Heating Type in Copperas Cove
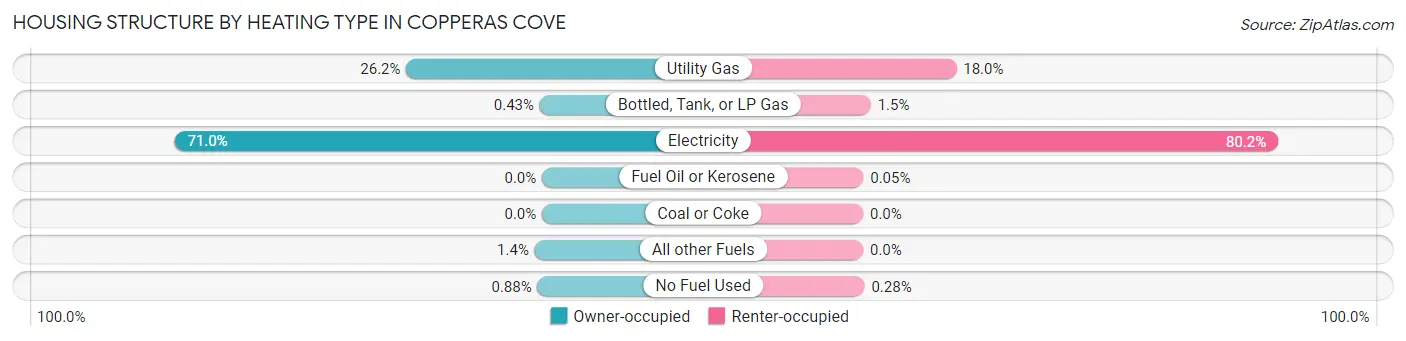
| Heating Type | Owner-occupied | Renter-occupied |
| Utility Gas | 2,067 (26.2%) | 1,107 (18.0%) |
| Bottled, Tank, or LP Gas | 34 (0.4%) | 91 (1.5%) |
| Electricity | 5,599 (71.0%) | 4,926 (80.2%) |
| Fuel Oil or Kerosene | 0 (0.0%) | 3 (0.1%) |
| Coal or Coke | 0 (0.0%) | 0 (0.0%) |
| All other Fuels | 112 (1.4%) | 0 (0.0%) |
| No Fuel Used | 69 (0.9%) | 17 (0.3%) |
| Total | 7,881 (100.0%) | 6,144 (100.0%) |
Household Vehicle Usage in Copperas Cove
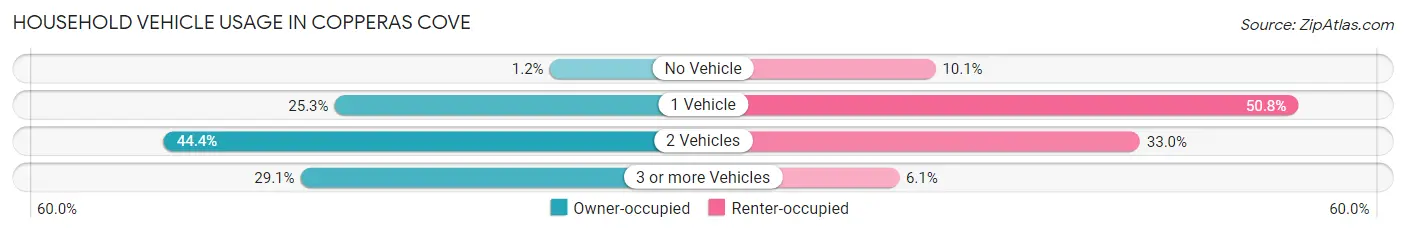
| Vehicles per Household | Owner-occupied | Renter-occupied |
| No Vehicle | 95 (1.2%) | 623 (10.1%) |
| 1 Vehicle | 1,994 (25.3%) | 3,119 (50.8%) |
| 2 Vehicles | 3,498 (44.4%) | 2,030 (33.0%) |
| 3 or more Vehicles | 2,294 (29.1%) | 372 (6.0%) |
| Total | 7,881 (100.0%) | 6,144 (100.0%) |
Real Estate & Mortgages in Copperas Cove
Real Estate and Mortgage Overview in Copperas Cove
| Characteristic | Without Mortgage | With Mortgage |
| Housing Units | 2,638 | 5,243 |
| Median Property Value | $125,200 | $157,200 |
| Median Household Income | $57,625 | $829 |
| Monthly Housing Costs | $534 | $5 |
| Real Estate Taxes | $2,216 | $861 |
Property Value by Mortgage Status in Copperas Cove
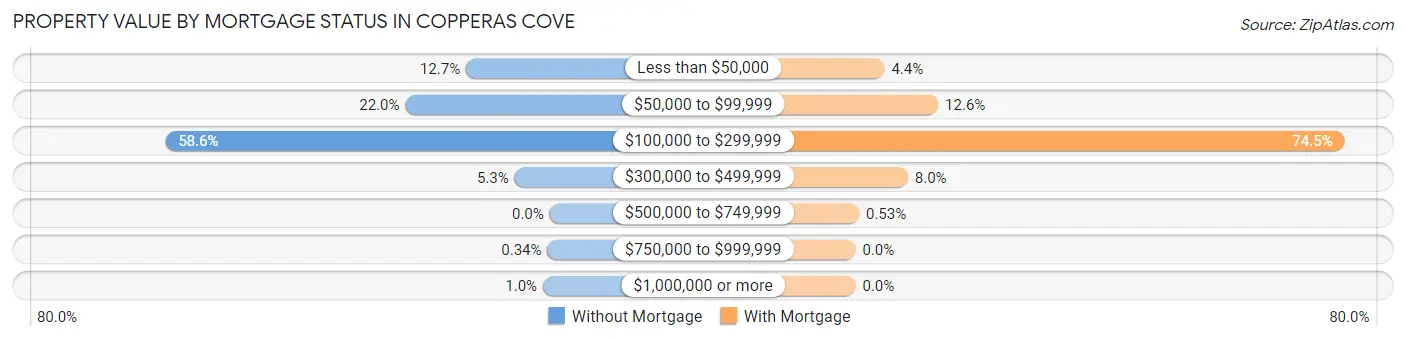
| Property Value | Without Mortgage | With Mortgage |
| Less than $50,000 | 336 (12.7%) | 231 (4.4%) |
| $50,000 to $99,999 | 580 (22.0%) | 660 (12.6%) |
| $100,000 to $299,999 | 1,545 (58.6%) | 3,906 (74.5%) |
| $300,000 to $499,999 | 141 (5.3%) | 418 (8.0%) |
| $500,000 to $749,999 | 0 (0.0%) | 28 (0.5%) |
| $750,000 to $999,999 | 9 (0.3%) | 0 (0.0%) |
| $1,000,000 or more | 27 (1.0%) | 0 (0.0%) |
| Total | 2,638 (100.0%) | 5,243 (100.0%) |
Household Income by Mortgage Status in Copperas Cove
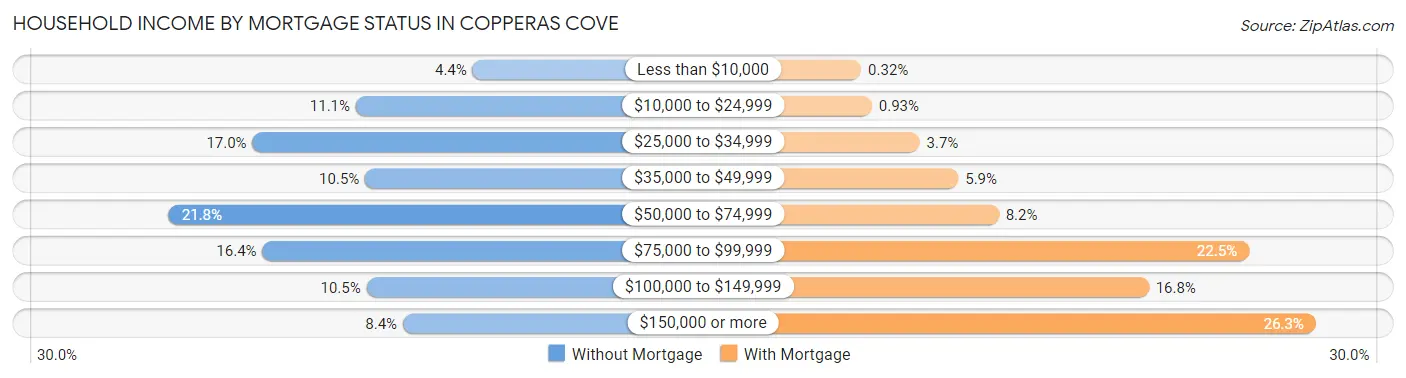
| Household Income | Without Mortgage | With Mortgage |
| Less than $10,000 | 116 (4.4%) | 17 (0.3%) |
| $10,000 to $24,999 | 292 (11.1%) | 49 (0.9%) |
| $25,000 to $34,999 | 448 (17.0%) | 192 (3.7%) |
| $35,000 to $49,999 | 278 (10.5%) | 308 (5.9%) |
| $50,000 to $74,999 | 574 (21.8%) | 429 (8.2%) |
| $75,000 to $99,999 | 433 (16.4%) | 1,179 (22.5%) |
| $100,000 to $149,999 | 276 (10.5%) | 878 (16.8%) |
| $150,000 or more | 221 (8.4%) | 1,379 (26.3%) |
| Total | 2,638 (100.0%) | 5,243 (100.0%) |
Property Value to Household Income Ratio in Copperas Cove
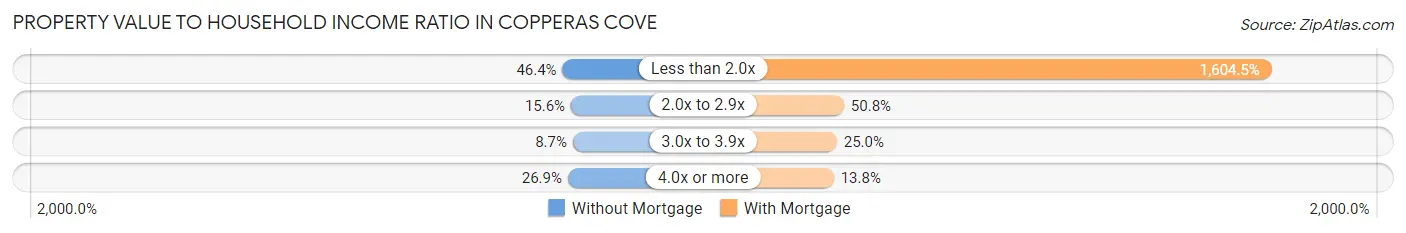
| Value-to-Income Ratio | Without Mortgage | With Mortgage |
| Less than 2.0x | 1,225 (46.4%) | 84,125 (1,604.5%) |
| 2.0x to 2.9x | 411 (15.6%) | 2,661 (50.7%) |
| 3.0x to 3.9x | 229 (8.7%) | 1,308 (24.9%) |
| 4.0x or more | 709 (26.9%) | 723 (13.8%) |
| Total | 2,638 (100.0%) | 5,243 (100.0%) |
Real Estate Taxes by Mortgage Status in Copperas Cove
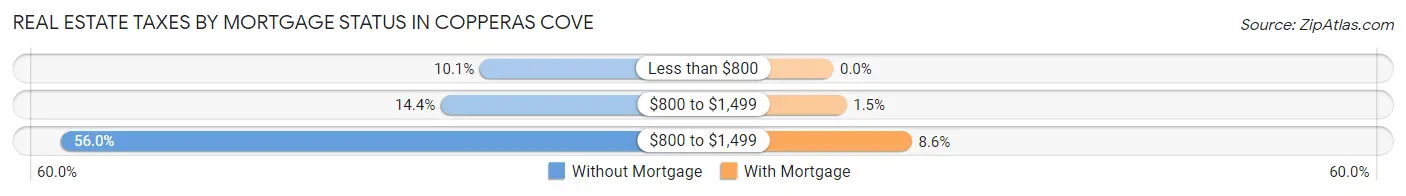
| Property Taxes | Without Mortgage | With Mortgage |
| Less than $800 | 266 (10.1%) | 0 (0.0%) |
| $800 to $1,499 | 379 (14.4%) | 76 (1.5%) |
| $800 to $1,499 | 1,477 (56.0%) | 451 (8.6%) |
| Total | 2,638 (100.0%) | 5,243 (100.0%) |
Health & Disability in Copperas Cove
Health Insurance Coverage by Age in Copperas Cove
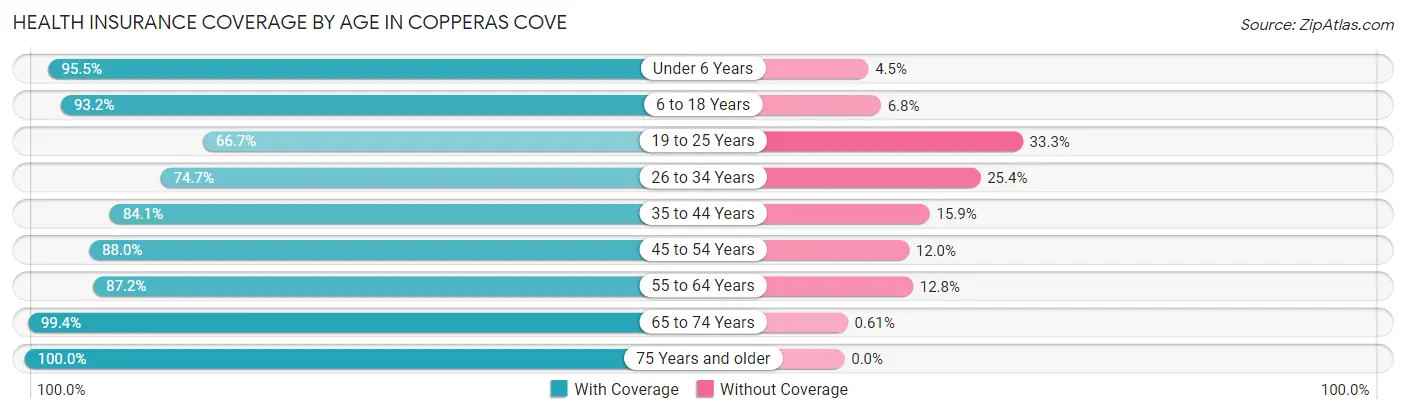
| Age Bracket | With Coverage | Without Coverage |
| Under 6 Years | 2,830 (95.5%) | 132 (4.5%) |
| 6 to 18 Years | 6,577 (93.2%) | 479 (6.8%) |
| 19 to 25 Years | 2,478 (66.7%) | 1,235 (33.3%) |
| 26 to 34 Years | 3,739 (74.7%) | 1,270 (25.4%) |
| 35 to 44 Years | 4,093 (84.1%) | 774 (15.9%) |
| 45 to 54 Years | 3,527 (88.0%) | 483 (12.0%) |
| 55 to 64 Years | 2,426 (87.2%) | 355 (12.8%) |
| 65 to 74 Years | 2,457 (99.4%) | 15 (0.6%) |
| 75 Years and older | 1,285 (100.0%) | 0 (0.0%) |
| Total | 29,412 (86.1%) | 4,743 (13.9%) |
Health Insurance Coverage by Citizenship Status in Copperas Cove
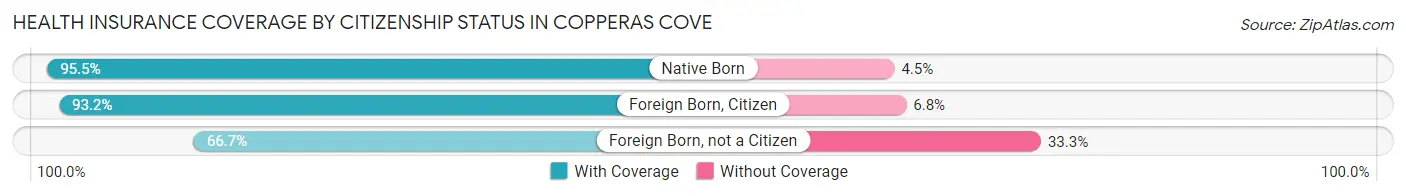
| Citizenship Status | With Coverage | Without Coverage |
| Native Born | 2,830 (95.5%) | 132 (4.5%) |
| Foreign Born, Citizen | 6,577 (93.2%) | 479 (6.8%) |
| Foreign Born, not a Citizen | 2,478 (66.7%) | 1,235 (33.3%) |
Health Insurance Coverage by Household Income in Copperas Cove
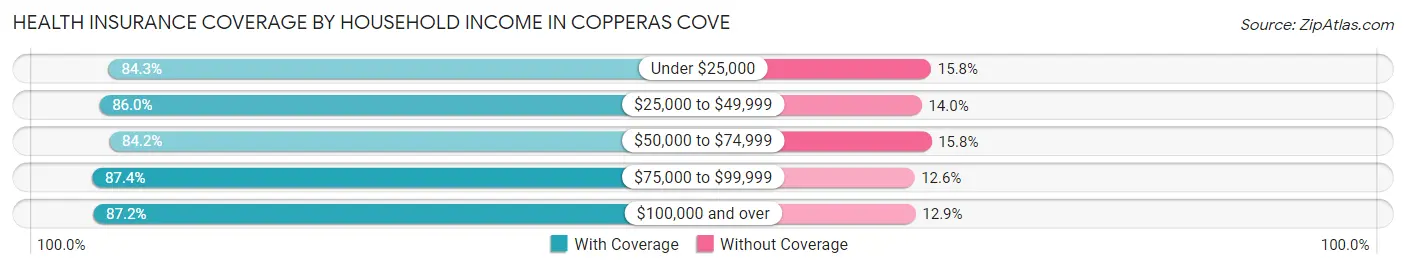
| Household Income | With Coverage | Without Coverage |
| Under $25,000 | 2,862 (84.3%) | 535 (15.8%) |
| $25,000 to $49,999 | 5,513 (86.0%) | 897 (14.0%) |
| $50,000 to $74,999 | 5,717 (84.2%) | 1,074 (15.8%) |
| $75,000 to $99,999 | 5,778 (87.4%) | 835 (12.6%) |
| $100,000 and over | 9,425 (87.2%) | 1,390 (12.9%) |
Public vs Private Health Insurance Coverage by Age in Copperas Cove
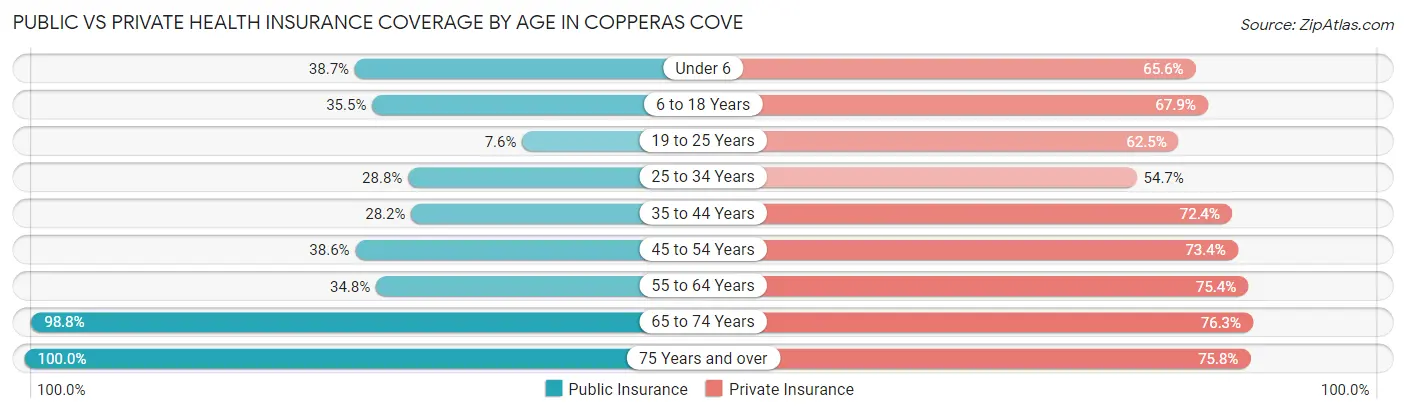
| Age Bracket | Public Insurance | Private Insurance |
| Under 6 | 1,146 (38.7%) | 1,944 (65.6%) |
| 6 to 18 Years | 2,503 (35.5%) | 4,791 (67.9%) |
| 19 to 25 Years | 283 (7.6%) | 2,321 (62.5%) |
| 25 to 34 Years | 1,443 (28.8%) | 2,741 (54.7%) |
| 35 to 44 Years | 1,374 (28.2%) | 3,523 (72.4%) |
| 45 to 54 Years | 1,548 (38.6%) | 2,945 (73.4%) |
| 55 to 64 Years | 967 (34.8%) | 2,097 (75.4%) |
| 65 to 74 Years | 2,441 (98.8%) | 1,886 (76.3%) |
| 75 Years and over | 1,285 (100.0%) | 974 (75.8%) |
| Total | 12,990 (38.0%) | 23,222 (68.0%) |
Disability Status by Sex by Age in Copperas Cove
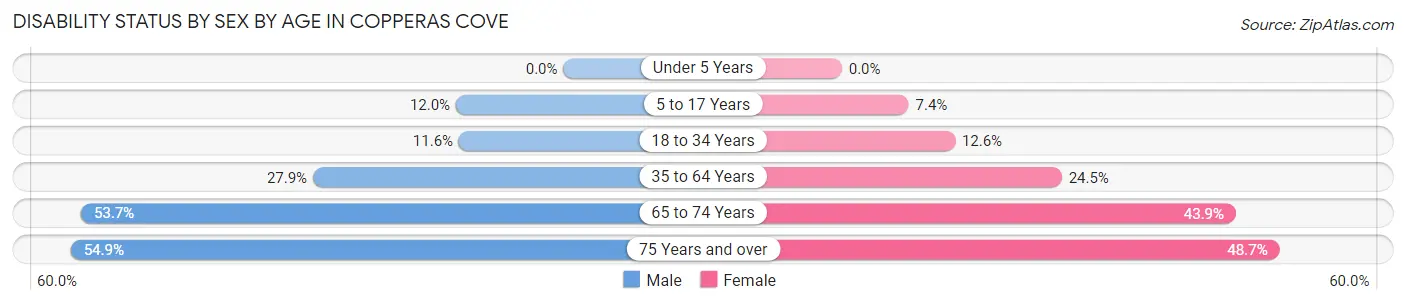
| Age Bracket | Male | Female |
| Under 5 Years | 0 (0.0%) | 0 (0.0%) |
| 5 to 17 Years | 445 (12.0%) | 263 (7.4%) |
| 18 to 34 Years | 457 (11.6%) | 651 (12.6%) |
| 35 to 64 Years | 1,582 (27.9%) | 1,466 (24.5%) |
| 65 to 74 Years | 635 (53.7%) | 566 (43.9%) |
| 75 Years and over | 203 (54.9%) | 446 (48.7%) |
Disability Class by Sex by Age in Copperas Cove
Disability Class: Hearing Difficulty
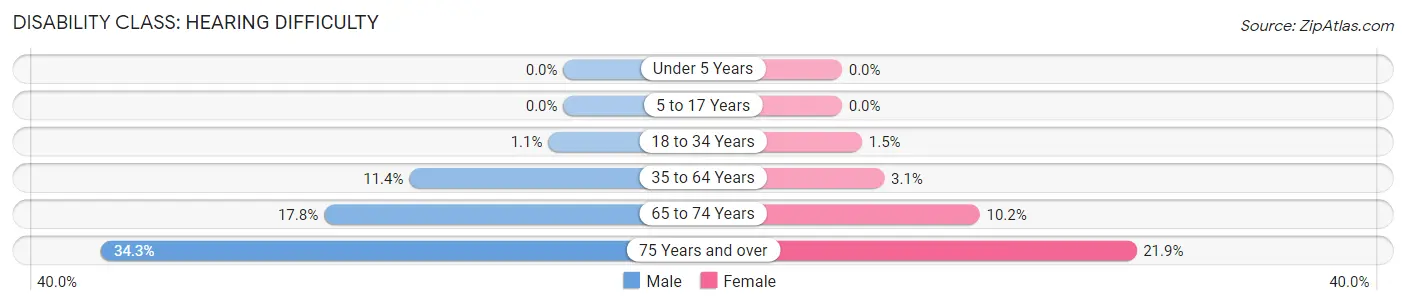
| Age Bracket | Male | Female |
| Under 5 Years | 0 (0.0%) | 0 (0.0%) |
| 5 to 17 Years | 0 (0.0%) | 0 (0.0%) |
| 18 to 34 Years | 44 (1.1%) | 77 (1.5%) |
| 35 to 64 Years | 649 (11.4%) | 188 (3.1%) |
| 65 to 74 Years | 210 (17.8%) | 132 (10.2%) |
| 75 Years and over | 127 (34.3%) | 200 (21.9%) |
Disability Class: Vision Difficulty
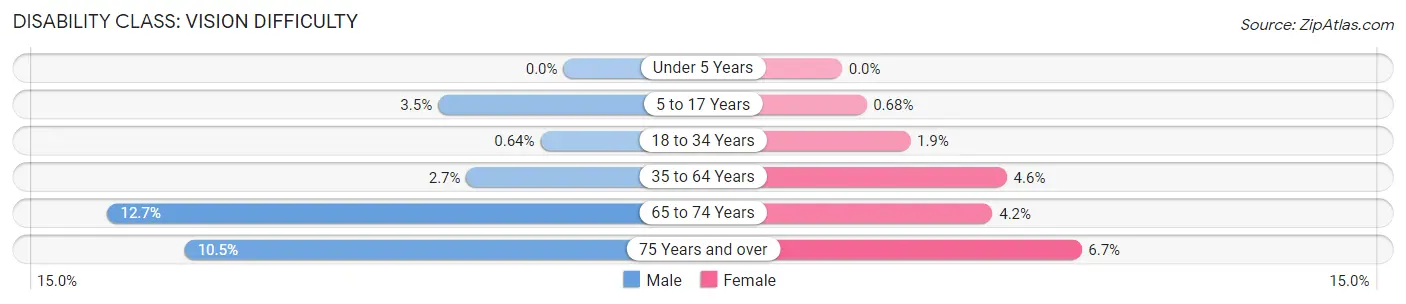
| Age Bracket | Male | Female |
| Under 5 Years | 0 (0.0%) | 0 (0.0%) |
| 5 to 17 Years | 130 (3.5%) | 24 (0.7%) |
| 18 to 34 Years | 25 (0.6%) | 98 (1.9%) |
| 35 to 64 Years | 153 (2.7%) | 275 (4.6%) |
| 65 to 74 Years | 150 (12.7%) | 54 (4.2%) |
| 75 Years and over | 39 (10.5%) | 61 (6.7%) |
Disability Class: Cognitive Difficulty
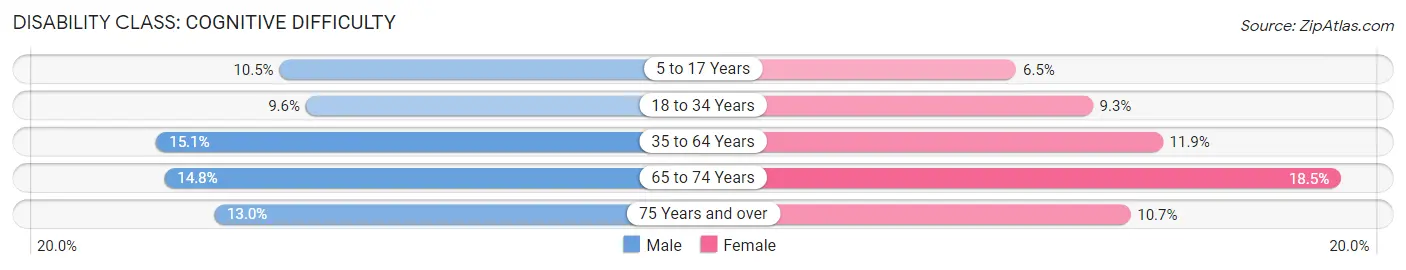
| Age Bracket | Male | Female |
| 5 to 17 Years | 392 (10.5%) | 229 (6.5%) |
| 18 to 34 Years | 376 (9.6%) | 481 (9.3%) |
| 35 to 64 Years | 857 (15.1%) | 713 (11.9%) |
| 65 to 74 Years | 175 (14.8%) | 239 (18.5%) |
| 75 Years and over | 48 (13.0%) | 98 (10.7%) |
Disability Class: Ambulatory Difficulty
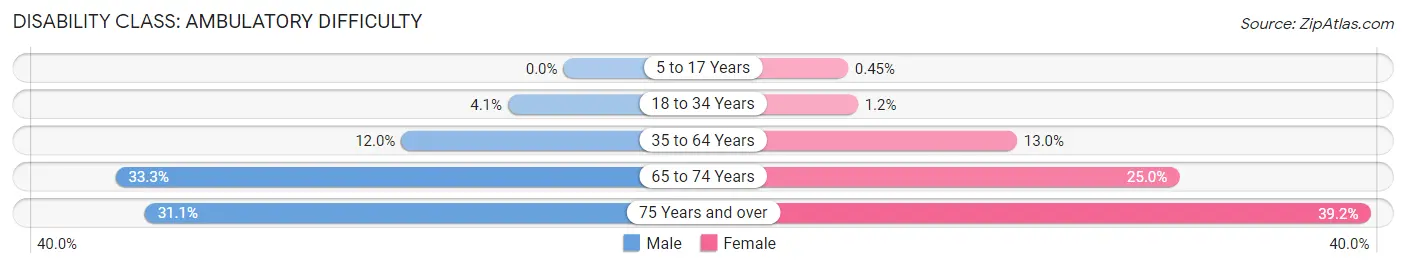
| Age Bracket | Male | Female |
| 5 to 17 Years | 0 (0.0%) | 16 (0.4%) |
| 18 to 34 Years | 162 (4.1%) | 61 (1.2%) |
| 35 to 64 Years | 683 (12.0%) | 778 (13.0%) |
| 65 to 74 Years | 393 (33.3%) | 323 (25.0%) |
| 75 Years and over | 115 (31.1%) | 359 (39.2%) |
Disability Class: Self-Care Difficulty
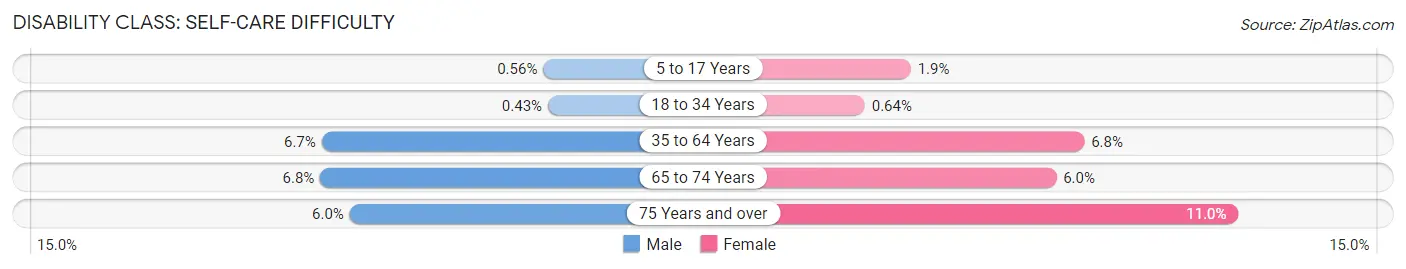
| Age Bracket | Male | Female |
| 5 to 17 Years | 21 (0.6%) | 68 (1.9%) |
| 18 to 34 Years | 17 (0.4%) | 33 (0.6%) |
| 35 to 64 Years | 382 (6.7%) | 404 (6.8%) |
| 65 to 74 Years | 80 (6.8%) | 77 (6.0%) |
| 75 Years and over | 22 (5.9%) | 101 (11.0%) |
Technology Access in Copperas Cove
Computing Device Access in Copperas Cove
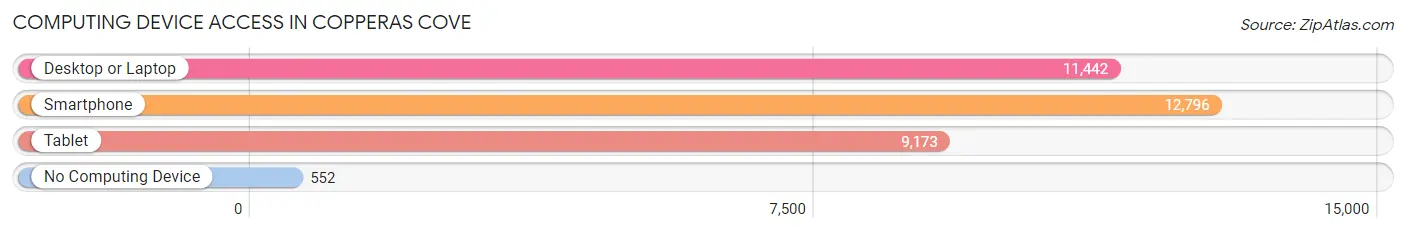
| Device Type | # Households | % Households |
| Desktop or Laptop | 11,442 | 81.6% |
| Smartphone | 12,796 | 91.2% |
| Tablet | 9,173 | 65.4% |
| No Computing Device | 552 | 3.9% |
| Total | 14,025 | 100.0% |
Internet Access in Copperas Cove
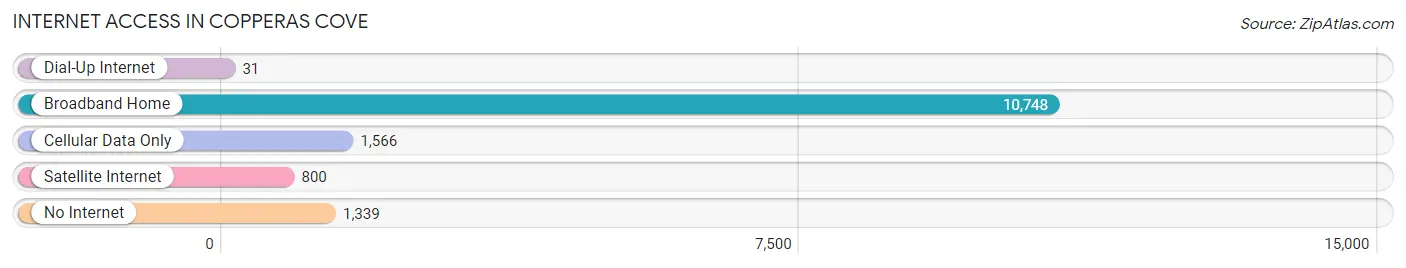
| Internet Type | # Households | % Households |
| Dial-Up Internet | 31 | 0.2% |
| Broadband Home | 10,748 | 76.6% |
| Cellular Data Only | 1,566 | 11.2% |
| Satellite Internet | 800 | 5.7% |
| No Internet | 1,339 | 9.6% |
| Total | 14,025 | 100.0% |
Copperas Cove Summary
Copperas Cove, Texas is a city located in Coryell County, Texas, United States. It is located about 30 miles (48 km) southwest of Waco and is part of the Killeen–Temple–Fort Hood Metropolitan Statistical Area. As of the 2010 census, the city population was 32,032, making it the largest city in Coryell County.
History
Copperas Cove was first settled in 1879 by ranchers and farmers. The city was named after nearby Copperas Creek, which was named for the copperas (iron sulfate) deposits found in the creek. The creek was so named by early settlers who found the creek water to be a greenish-blue color due to the copperas deposits.
The city was incorporated in 1887 and was the first city in Coryell County. The city was a major stop on the Gulf, Colorado and Santa Fe Railway, which ran through the city from 1881 to 1942. The city was also a major stop on the Fort Worth and Rio Grande Railway, which ran through the city from 1881 to 1891.
Geography
Copperas Cove is located at 31°7′25″N 97°51′17″W (31.123611, -97.854722). According to the United States Census Bureau, the city has a total area of 16.2 square miles (41.8 km2), of which 16.1 square miles (41.6 km2) is land and 0.1 square miles (0.2 km2) (0.62%) is water.
Economy
Copperas Cove is home to a variety of businesses, including retail stores, restaurants, and manufacturing companies. The city is also home to Fort Hood, the largest military installation in the world. Fort Hood is the largest employer in the city, with more than 40,000 military personnel and civilian employees.
The city is also home to several major employers, including the Copperas Cove Independent School District, the City of Copperas Cove, and the Central Texas College. The city is also home to several small businesses, including restaurants, retail stores, and service providers.
Demographics
As of the 2010 census, there were 32,032 people, 10,845 households, and 7,845 families residing in the city. The population density was 1,976.3 people per square mile (762.7/km2). There were 11,845 housing units at an average density of 735.2 per square mile (284.2/km2). The racial makeup of the city was 68.2% White, 16.3% African American, 0.7% Native American, 1.7% Asian, 0.1% Pacific Islander, 9.7% from other races, and 3.1% from two or more races. Hispanic or Latino of any race were 20.2% of the population.
There were 10,845 households, out of which 41.2% had children under the age of 18 living with them, 51.2% were married couples living together, 15.3% had a female householder with no husband present, and 27.2% were non-families. 22.2% of all households were made up of individuals, and 7.2% had someone living alone who was 65 years of age or older. The average household size was 2.90 and the average family size was 3.41.
In the city, the population was spread out, with 32.2% under the age of 18, 10.3% from 18 to 24, 30.2% from 25 to 44, 19.2% from 45 to 64, and 8.1% who were 65 years of age or older. The median age was 30 years. For every 100 females, there were 97.2 males. For every 100 females age 18 and over, there were 93.7 males.
The median income for a household in the city was $41,945, and the median income for a family was $47,945. Males had a median income of $35,945 versus $25,945 for females. The per capita income for the city was $17,945. About 11.2% of families and 14.2% of the population were below the poverty line, including 19.2% of those under age 18 and 8.2% of those age 65 or over.
Common Questions
What is Per Capita Income in Copperas Cove?
Per Capita income in Copperas Cove is $29,830.
What is the Median Family Income in Copperas Cove?
Median Family Income in Copperas Cove is $71,100.
What is the Median Household income in Copperas Cove?
Median Household Income in Copperas Cove is $64,798.
What is Income or Wage Gap in Copperas Cove?
Income or Wage Gap in Copperas Cove is 39.1%.
Women in Copperas Cove earn 60.9 cents for every dollar earned by a man.
What is Family Income Deficit in Copperas Cove?
Family Income Deficit in Copperas Cove is $10,829.
Families that are below poverty line in Copperas Cove earn $10,829 less on average than the poverty threshold level.
What is Inequality or Gini Index in Copperas Cove?
Inequality or Gini Index in Copperas Cove is 0.39.
What is the Total Population of Copperas Cove?
Total Population of Copperas Cove is 36,436.
What is the Total Male Population of Copperas Cove?
Total Male Population of Copperas Cove is 18,087.
What is the Total Female Population of Copperas Cove?
Total Female Population of Copperas Cove is 18,349.
What is the Ratio of Males per 100 Females in Copperas Cove?
There are 98.57 Males per 100 Females in Copperas Cove.
What is the Ratio of Females per 100 Males in Copperas Cove?
There are 101.45 Females per 100 Males in Copperas Cove.
What is the Median Population Age in Copperas Cove?
Median Population Age in Copperas Cove is 31.7 Years.
What is the Average Family Size in Copperas Cove
Average Family Size in Copperas Cove is 3.0 People.
What is the Average Household Size in Copperas Cove
Average Household Size in Copperas Cove is 2.6 People.
How Large is the Labor Force in Copperas Cove?
There are 17,719 People in the Labor Forcein in Copperas Cove.
What is the Percentage of People in the Labor Force in Copperas Cove?
64.1% of People are in the Labor Force in Copperas Cove.
What is the Unemployment Rate in Copperas Cove?
Unemployment Rate in Copperas Cove is 7.6%.