Horizon City, TX Map & Demographics
Horizon City Map
Horizon City Overview
$21,135
PER CAPITA INCOME
$59,171
AVG FAMILY INCOME
$61,194
AVG HOUSEHOLD INCOME
39.0%
WAGE / INCOME GAP [ % ]
61.0¢/ $1
WAGE / INCOME GAP [ $ ]
$8,643
FAMILY INCOME DEFICIT
0.38
INEQUALITY / GINI INDEX
22,537
TOTAL POPULATION
11,922
MALE POPULATION
10,615
FEMALE POPULATION
112.31
MALES / 100 FEMALES
89.04
FEMALES / 100 MALES
29.3
MEDIAN AGE
3.8
AVG FAMILY SIZE
3.4
AVG HOUSEHOLD SIZE
10,332
LABOR FORCE [ PEOPLE ]
64.7%
PERCENT IN LABOR FORCE
10.0%
UNEMPLOYMENT RATE
Horizon City Area Codes
Income in Horizon City
Income Overview in Horizon City
Per Capita Income in Horizon City is $21,135, while median incomes of families and households are $59,171 and $61,194 respectively.
| Characteristic | Number | Measure |
| Per Capita Income | 22,537 | $21,135 |
| Median Family Income | 5,414 | $59,171 |
| Mean Family Income | 5,414 | $70,458 |
| Median Household Income | 6,654 | $61,194 |
| Mean Household Income | 6,654 | $69,447 |
| Income Deficit | 5,414 | $8,643 |
| Wage / Income Gap (%) | 22,537 | 39.05% |
| Wage / Income Gap ($) | 22,537 | 60.95¢ per $1 |
| Gini / Inequality Index | 22,537 | 0.38 |
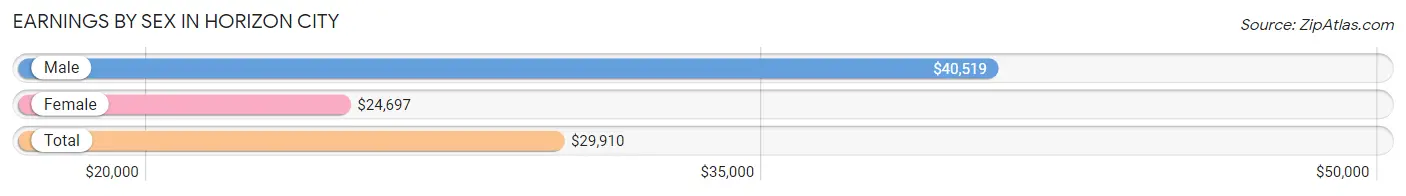
Earnings by Sex in Horizon City
Average Earnings in Horizon City are $29,910, $40,519 for men and $24,697 for women, a difference of 39.1%.
| Sex | Number | Average Earnings |
| Male | 5,878 (56.5%) | $40,519 |
| Female | 4,534 (43.5%) | $24,697 |
| Total | 10,412 (100.0%) | $29,910 |
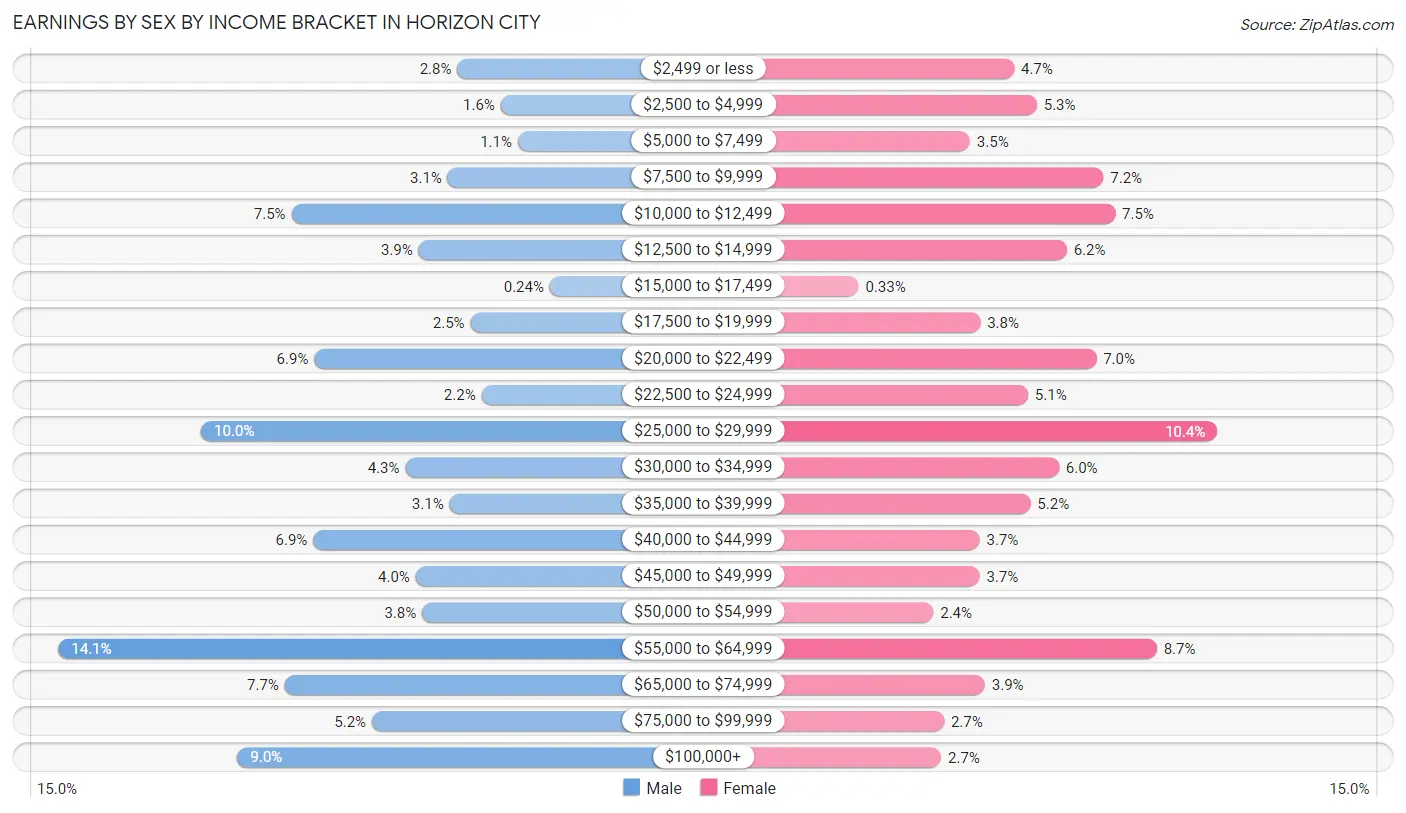
Earnings by Sex by Income Bracket in Horizon City
The most common earnings brackets in Horizon City are $55,000 to $64,999 for men (826 | 14.1%) and $25,000 to $29,999 for women (472 | 10.4%).
| Income | Male | Female |
| $2,499 or less | 167 (2.8%) | 213 (4.7%) |
| $2,500 to $4,999 | 95 (1.6%) | 242 (5.3%) |
| $5,000 to $7,499 | 67 (1.1%) | 157 (3.5%) |
| $7,500 to $9,999 | 183 (3.1%) | 327 (7.2%) |
| $10,000 to $12,499 | 441 (7.5%) | 342 (7.5%) |
| $12,500 to $14,999 | 231 (3.9%) | 280 (6.2%) |
| $15,000 to $17,499 | 14 (0.2%) | 15 (0.3%) |
| $17,500 to $19,999 | 145 (2.5%) | 170 (3.7%) |
| $20,000 to $22,499 | 403 (6.9%) | 318 (7.0%) |
| $22,500 to $24,999 | 127 (2.2%) | 231 (5.1%) |
| $25,000 to $29,999 | 590 (10.0%) | 472 (10.4%) |
| $30,000 to $34,999 | 253 (4.3%) | 270 (6.0%) |
| $35,000 to $39,999 | 180 (3.1%) | 234 (5.2%) |
| $40,000 to $44,999 | 405 (6.9%) | 169 (3.7%) |
| $45,000 to $49,999 | 236 (4.0%) | 169 (3.7%) |
| $50,000 to $54,999 | 225 (3.8%) | 110 (2.4%) |
| $55,000 to $64,999 | 826 (14.1%) | 395 (8.7%) |
| $65,000 to $74,999 | 452 (7.7%) | 176 (3.9%) |
| $75,000 to $99,999 | 308 (5.2%) | 124 (2.7%) |
| $100,000+ | 530 (9.0%) | 120 (2.6%) |
| Total | 5,878 (100.0%) | 4,534 (100.0%) |
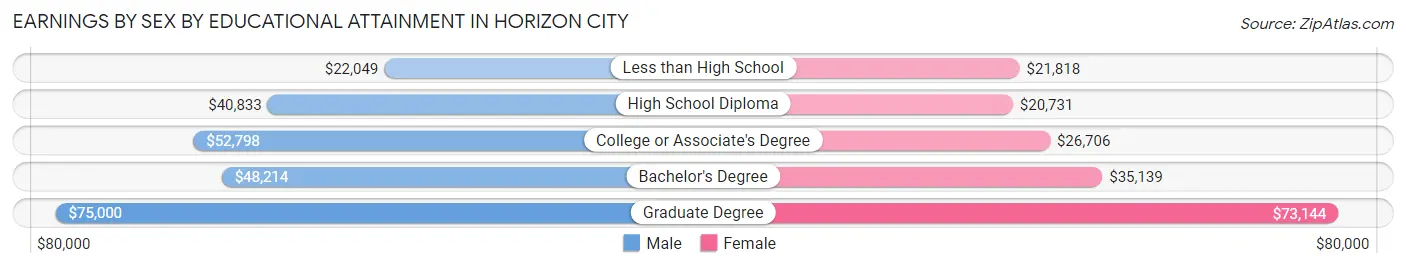
Earnings by Sex by Educational Attainment in Horizon City
Average earnings in Horizon City are $44,659 for men and $27,088 for women, a difference of 39.3%. Men with an educational attainment of graduate degree enjoy the highest average annual earnings of $75,000, while those with less than high school education earn the least with $22,049. Women with an educational attainment of graduate degree earn the most with the average annual earnings of $73,144, while those with high school diploma education have the smallest earnings of $20,731.
| Educational Attainment | Male Income | Female Income |
| Less than High School | $22,049 | $21,818 |
| High School Diploma | $40,833 | $20,731 |
| College or Associate's Degree | $52,798 | $26,706 |
| Bachelor's Degree | $48,214 | $35,139 |
| Graduate Degree | $75,000 | $73,144 |
| Total | $44,659 | $27,088 |
Family Income in Horizon City
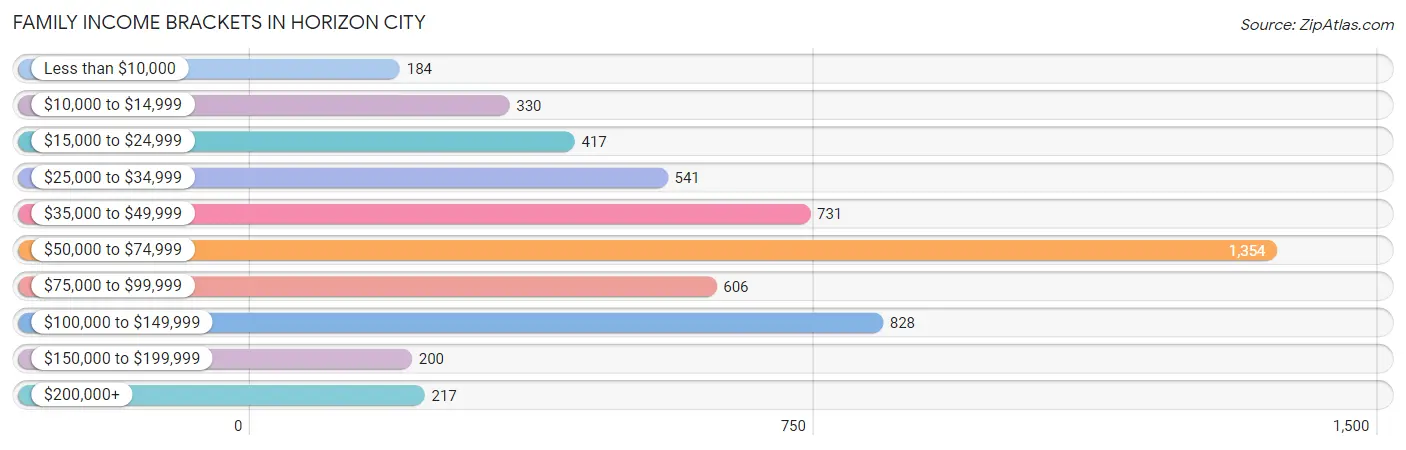
Family Income Brackets in Horizon City
According to the Horizon City family income data, there are 1,354 families falling into the $50,000 to $74,999 income range, which is the most common income bracket and makes up 25.0% of all families. Conversely, the less than $10,000 income bracket is the least frequent group with only 184 families (3.4%) belonging to this category.
| Income Bracket | # Families | % Families |
| Less than $10,000 | 184 | 3.4% |
| $10,000 to $14,999 | 330 | 6.1% |
| $15,000 to $24,999 | 417 | 7.7% |
| $25,000 to $34,999 | 541 | 10.0% |
| $35,000 to $49,999 | 731 | 13.5% |
| $50,000 to $74,999 | 1,354 | 25.0% |
| $75,000 to $99,999 | 606 | 11.2% |
| $100,000 to $149,999 | 828 | 15.3% |
| $150,000 to $199,999 | 200 | 3.7% |
| $200,000+ | 217 | 4.0% |
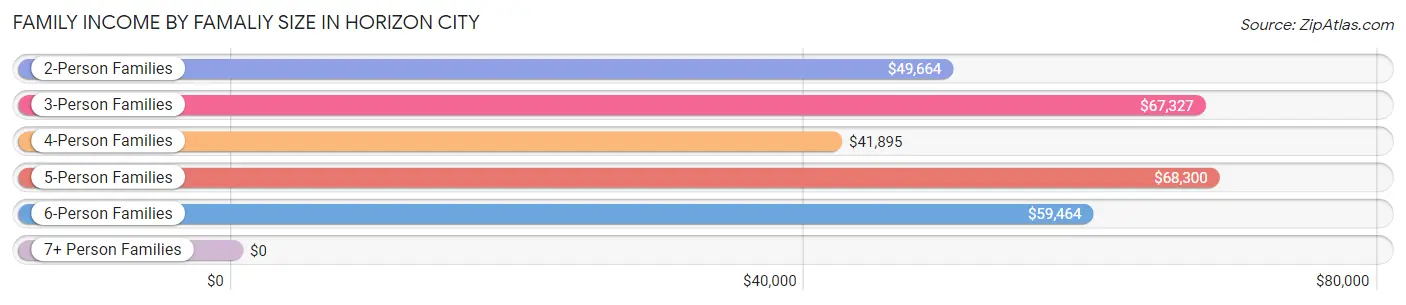
Family Income by Famaliy Size in Horizon City
5-person families (1,024 | 18.9%) account for the highest median family income in Horizon City with $68,300 per family, while 2-person families (1,606 | 29.7%) have the highest median income of $24,832 per family member.
| Income Bracket | # Families | Median Income |
| 2-Person Families | 1,606 (29.7%) | $49,664 |
| 3-Person Families | 1,363 (25.2%) | $67,327 |
| 4-Person Families | 831 (15.3%) | $41,895 |
| 5-Person Families | 1,024 (18.9%) | $68,300 |
| 6-Person Families | 489 (9.0%) | $59,464 |
| 7+ Person Families | 101 (1.9%) | $0 |
| Total | 5,414 (100.0%) | $59,171 |
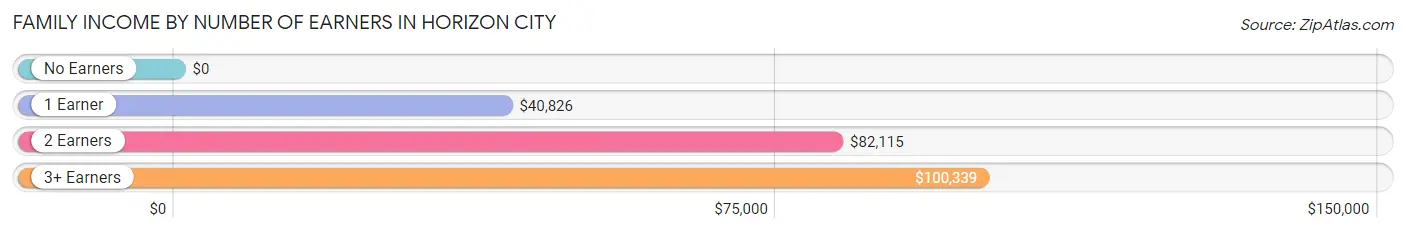
Family Income by Number of Earners in Horizon City
| Number of Earners | # Families | Median Income |
| No Earners | 507 (9.4%) | $0 |
| 1 Earner | 2,228 (41.1%) | $40,826 |
| 2 Earners | 1,832 (33.8%) | $82,115 |
| 3+ Earners | 847 (15.6%) | $100,339 |
| Total | 5,414 (100.0%) | $59,171 |
Household Income in Horizon City
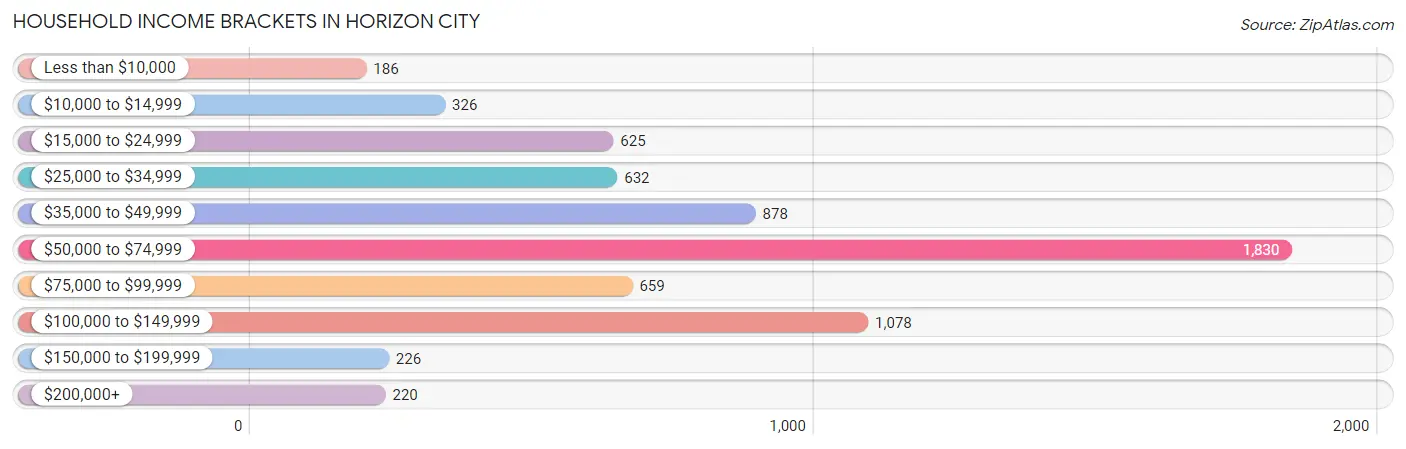
Household Income Brackets in Horizon City
With 1,830 households falling in the category, the $50,000 to $74,999 income range is the most frequent in Horizon City, accounting for 27.5% of all households. In contrast, only 186 households (2.8%) fall into the less than $10,000 income bracket, making it the least populous group.
| Income Bracket | # Households | % Households |
| Less than $10,000 | 186 | 2.8% |
| $10,000 to $14,999 | 326 | 4.9% |
| $15,000 to $24,999 | 625 | 9.4% |
| $25,000 to $34,999 | 632 | 9.5% |
| $35,000 to $49,999 | 878 | 13.2% |
| $50,000 to $74,999 | 1,830 | 27.5% |
| $75,000 to $99,999 | 659 | 9.9% |
| $100,000 to $149,999 | 1,078 | 16.2% |
| $150,000 to $199,999 | 226 | 3.4% |
| $200,000+ | 220 | 3.3% |
Household Income by Householder Age in Horizon City
The median household income in Horizon City is $61,194, with the highest median household income of $67,872 found in the 45 to 64 years age bracket for the primary householder. A total of 2,425 households (36.4%) fall into this category. Meanwhile, the 15 to 24 years age bracket for the primary householder has the lowest median household income of $0, with 10 households (0.2%) in this group.
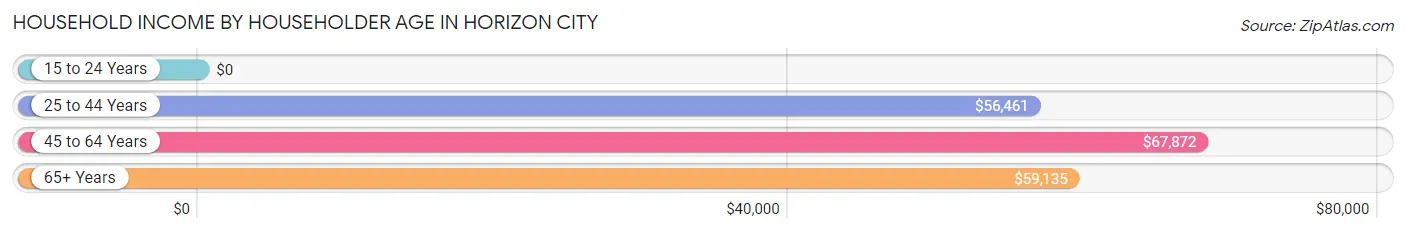
| Income Bracket | # Households | Median Income |
| 15 to 24 Years | 10 (0.2%) | $0 |
| 25 to 44 Years | 3,598 (54.1%) | $56,461 |
| 45 to 64 Years | 2,425 (36.4%) | $67,872 |
| 65+ Years | 621 (9.3%) | $59,135 |
| Total | 6,654 (100.0%) | $61,194 |
Poverty in Horizon City
Income Below Poverty by Sex and Age in Horizon City
With 19.5% poverty level for males and 21.0% for females among the residents of Horizon City, 12 to 14 year old males and 5 year old females are the most vulnerable to poverty, with 292 males (33.8%) and 120 females (67.8%) in their respective age groups living below the poverty level.
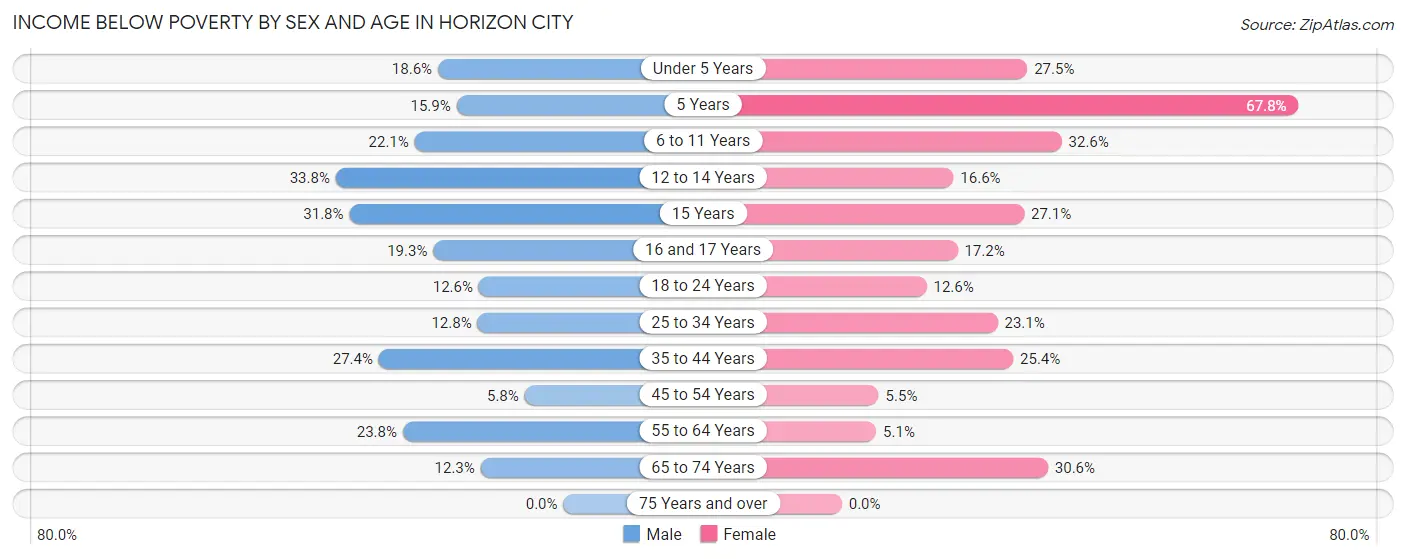
| Age Bracket | Male | Female |
| Under 5 Years | 171 (18.6%) | 222 (27.5%) |
| 5 Years | 79 (15.9%) | 120 (67.8%) |
| 6 to 11 Years | 309 (22.1%) | 376 (32.6%) |
| 12 to 14 Years | 292 (33.8%) | 57 (16.6%) |
| 15 Years | 34 (31.8%) | 82 (27.1%) |
| 16 and 17 Years | 119 (19.3%) | 94 (17.2%) |
| 18 to 24 Years | 124 (12.6%) | 143 (12.6%) |
| 25 to 34 Years | 195 (12.8%) | 364 (23.1%) |
| 35 to 44 Years | 601 (27.4%) | 532 (25.4%) |
| 45 to 54 Years | 64 (5.8%) | 61 (5.5%) |
| 55 to 64 Years | 273 (23.8%) | 34 (5.1%) |
| 65 to 74 Years | 59 (12.3%) | 149 (30.6%) |
| 75 Years and over | 0 (0.0%) | 0 (0.0%) |
| Total | 2,320 (19.5%) | 2,234 (21.0%) |
Income Above Poverty by Sex and Age in Horizon City
According to the poverty statistics in Horizon City, males aged 75 years and over and females aged 75 years and over are the age groups that are most secure financially, with 100.0% of males and 100.0% of females in these age groups living above the poverty line.
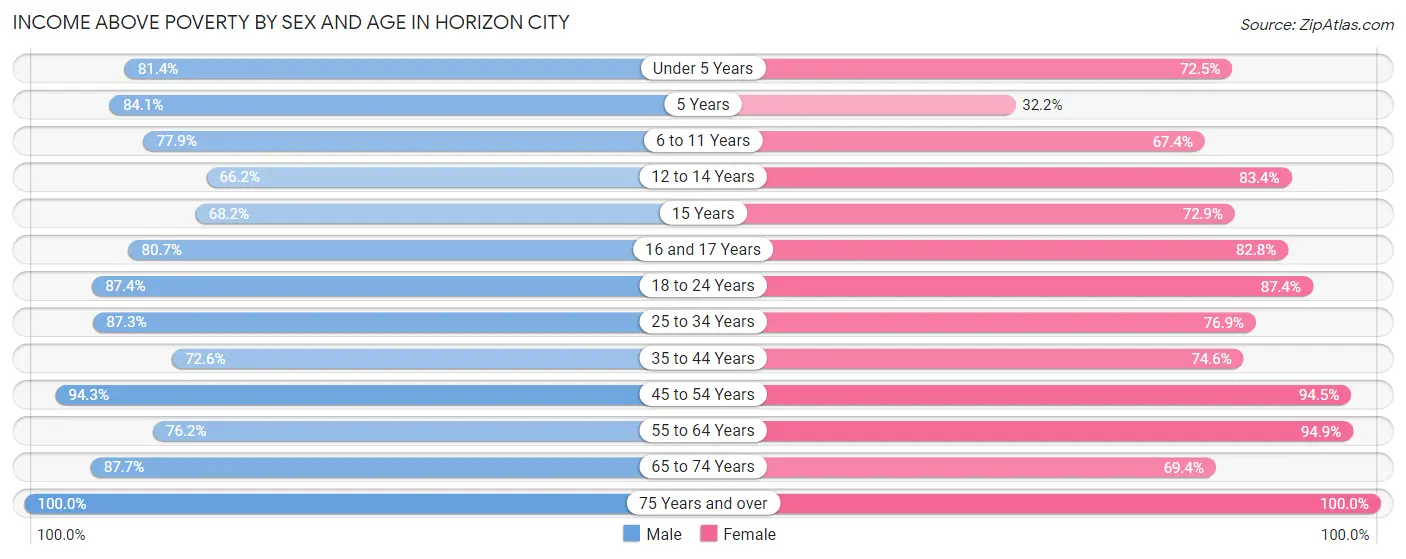
| Age Bracket | Male | Female |
| Under 5 Years | 747 (81.4%) | 584 (72.5%) |
| 5 Years | 419 (84.1%) | 57 (32.2%) |
| 6 to 11 Years | 1,090 (77.9%) | 776 (67.4%) |
| 12 to 14 Years | 572 (66.2%) | 287 (83.4%) |
| 15 Years | 73 (68.2%) | 221 (72.9%) |
| 16 and 17 Years | 497 (80.7%) | 453 (82.8%) |
| 18 to 24 Years | 863 (87.4%) | 994 (87.4%) |
| 25 to 34 Years | 1,335 (87.3%) | 1,210 (76.9%) |
| 35 to 44 Years | 1,592 (72.6%) | 1,559 (74.6%) |
| 45 to 54 Years | 1,050 (94.3%) | 1,054 (94.5%) |
| 55 to 64 Years | 872 (76.2%) | 633 (94.9%) |
| 65 to 74 Years | 421 (87.7%) | 338 (69.4%) |
| 75 Years and over | 71 (100.0%) | 215 (100.0%) |
| Total | 9,602 (80.5%) | 8,381 (78.9%) |
Income Below Poverty Among Married-Couple Families in Horizon City
The poverty statistics for married-couple families in Horizon City show that 17.9% or 678 of the total 3,784 families live below the poverty line. Families with 5 or more children have the highest poverty rate of 34.1%, comprising of 29 families. On the other hand, families with 1 or 2 children have the lowest poverty rate of 14.4%, which includes 247 families.
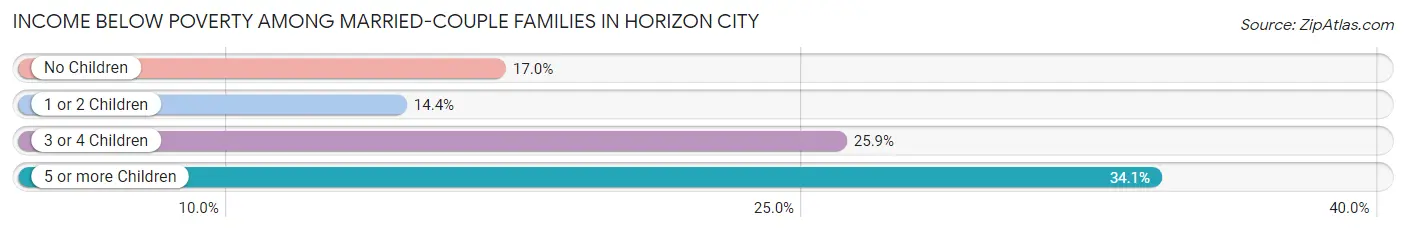
| Children | Above Poverty | Below Poverty |
| No Children | 1,045 (83.0%) | 214 (17.0%) |
| 1 or 2 Children | 1,467 (85.6%) | 247 (14.4%) |
| 3 or 4 Children | 538 (74.1%) | 188 (25.9%) |
| 5 or more Children | 56 (65.9%) | 29 (34.1%) |
| Total | 3,106 (82.1%) | 678 (17.9%) |
Income Below Poverty Among Single-Parent Households in Horizon City
According to the poverty data in Horizon City, 28.5% or 152 single-father households and 22.9% or 251 single-mother households are living below the poverty line. Among single-father households, those with 1 or 2 children have the highest poverty rate, with 152 households (44.2%) experiencing poverty. Likewise, among single-mother households, those with 3 or 4 children have the highest poverty rate, with 128 households (66.0%) falling below the poverty line.
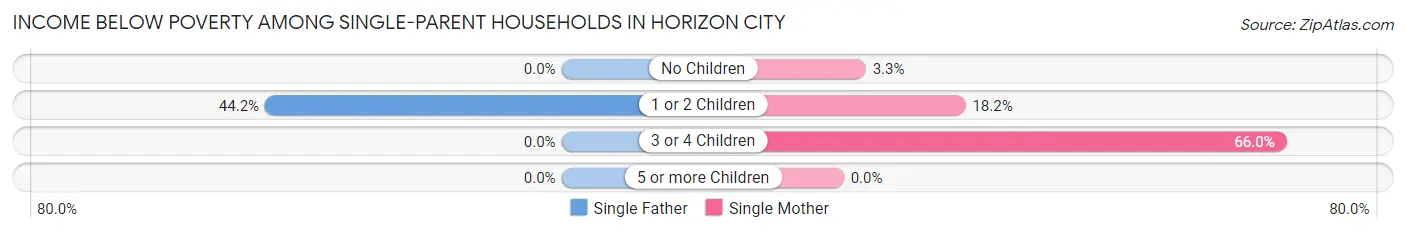
| Children | Single Father | Single Mother |
| No Children | 0 (0.0%) | 9 (3.3%) |
| 1 or 2 Children | 152 (44.2%) | 114 (18.1%) |
| 3 or 4 Children | 0 (0.0%) | 128 (66.0%) |
| 5 or more Children | 0 (0.0%) | 0 (0.0%) |
| Total | 152 (28.5%) | 251 (22.9%) |
Income Below Poverty Among Married-Couple vs Single-Parent Households in Horizon City
The poverty data for Horizon City shows that 678 of the married-couple family households (17.9%) and 403 of the single-parent households (24.7%) are living below the poverty level. Within the married-couple family households, those with 5 or more children have the highest poverty rate, with 29 households (34.1%) falling below the poverty line. Among the single-parent households, those with 3 or 4 children have the highest poverty rate, with 128 household (56.9%) living below poverty.
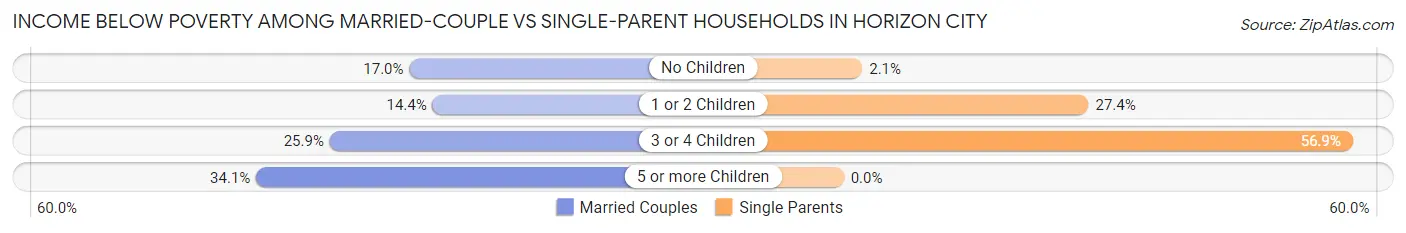
| Children | Married-Couple Families | Single-Parent Households |
| No Children | 214 (17.0%) | 9 (2.1%) |
| 1 or 2 Children | 247 (14.4%) | 266 (27.4%) |
| 3 or 4 Children | 188 (25.9%) | 128 (56.9%) |
| 5 or more Children | 29 (34.1%) | 0 (0.0%) |
| Total | 678 (17.9%) | 403 (24.7%) |
Race in Horizon City
The most populous races in Horizon City are Hispanic or Latino (20,333 | 90.2%), White / Caucasian (13,525 | 60.0%), and Two or more Races (4,602 | 20.4%).
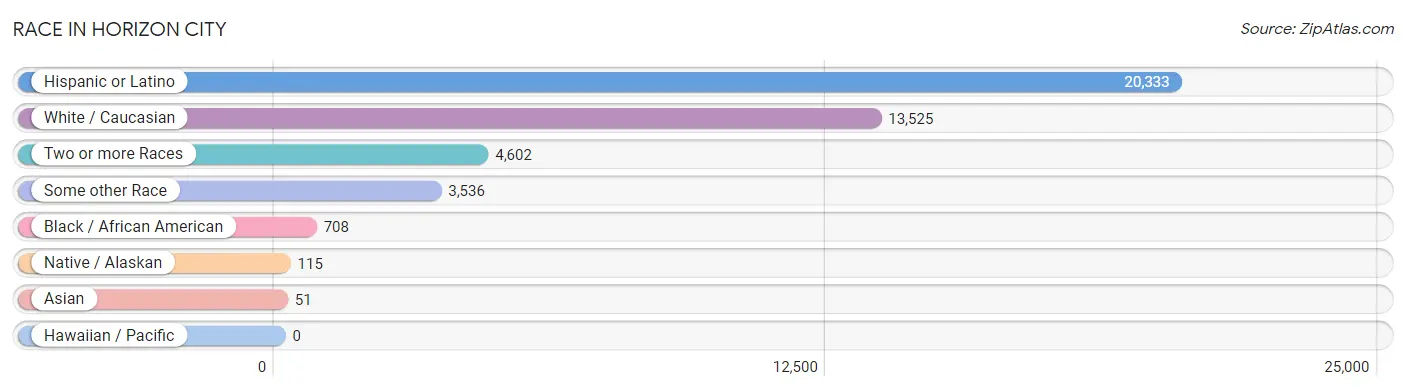
| Race | # Population | % Population |
| Asian | 51 | 0.2% |
| Black / African American | 708 | 3.1% |
| Hawaiian / Pacific | 0 | 0.0% |
| Hispanic or Latino | 20,333 | 90.2% |
| Native / Alaskan | 115 | 0.5% |
| White / Caucasian | 13,525 | 60.0% |
| Two or more Races | 4,602 | 20.4% |
| Some other Race | 3,536 | 15.7% |
| Total | 22,537 | 100.0% |
Ancestry in Horizon City
The most populous ancestries reported in Horizon City are Mexican (19,038 | 84.5%), American (480 | 2.1%), Irish (372 | 1.7%), Cuban (289 | 1.3%), and Puerto Rican (278 | 1.2%), together accounting for 90.8% of all Horizon City residents.
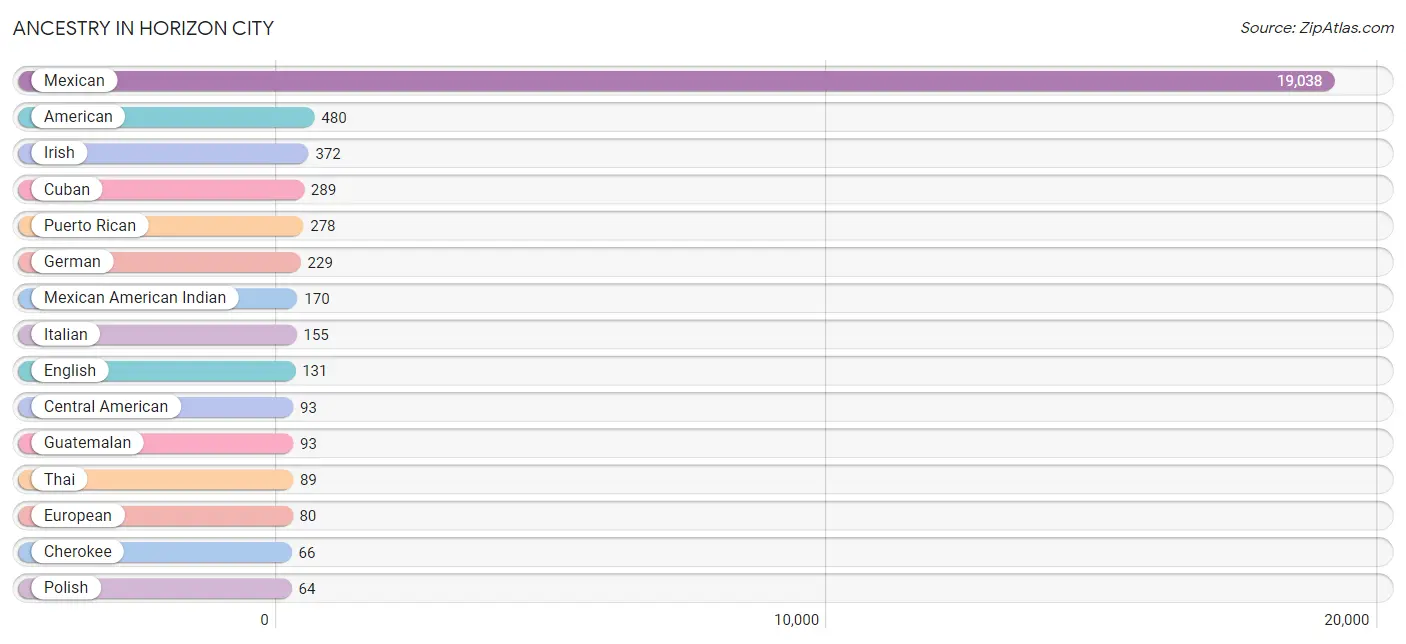
| Ancestry | # Population | % Population |
| American | 480 | 2.1% |
| Arab | 15 | 0.1% |
| Austrian | 13 | 0.1% |
| Canadian | 9 | 0.0% |
| Central American | 93 | 0.4% |
| Cherokee | 66 | 0.3% |
| Chilean | 24 | 0.1% |
| Comanche | 24 | 0.1% |
| Croatian | 16 | 0.1% |
| Cuban | 289 | 1.3% |
| English | 131 | 0.6% |
| European | 80 | 0.4% |
| French | 11 | 0.1% |
| German | 229 | 1.0% |
| Guatemalan | 93 | 0.4% |
| Indian (Asian) | 21 | 0.1% |
| Irish | 372 | 1.7% |
| Italian | 155 | 0.7% |
| Lebanese | 15 | 0.1% |
| Mexican | 19,038 | 84.5% |
| Mexican American Indian | 170 | 0.7% |
| Norwegian | 22 | 0.1% |
| Polish | 64 | 0.3% |
| Pueblo | 25 | 0.1% |
| Puerto Rican | 278 | 1.2% |
| Scandinavian | 15 | 0.1% |
| Scottish | 15 | 0.1% |
| South American | 24 | 0.1% |
| Spaniard | 21 | 0.1% |
| Spanish | 57 | 0.3% |
| Sri Lankan | 51 | 0.2% |
| Thai | 89 | 0.4% |
| Ukrainian | 15 | 0.1% |
| Yugoslavian | 15 | 0.1% | View All 34 Rows |
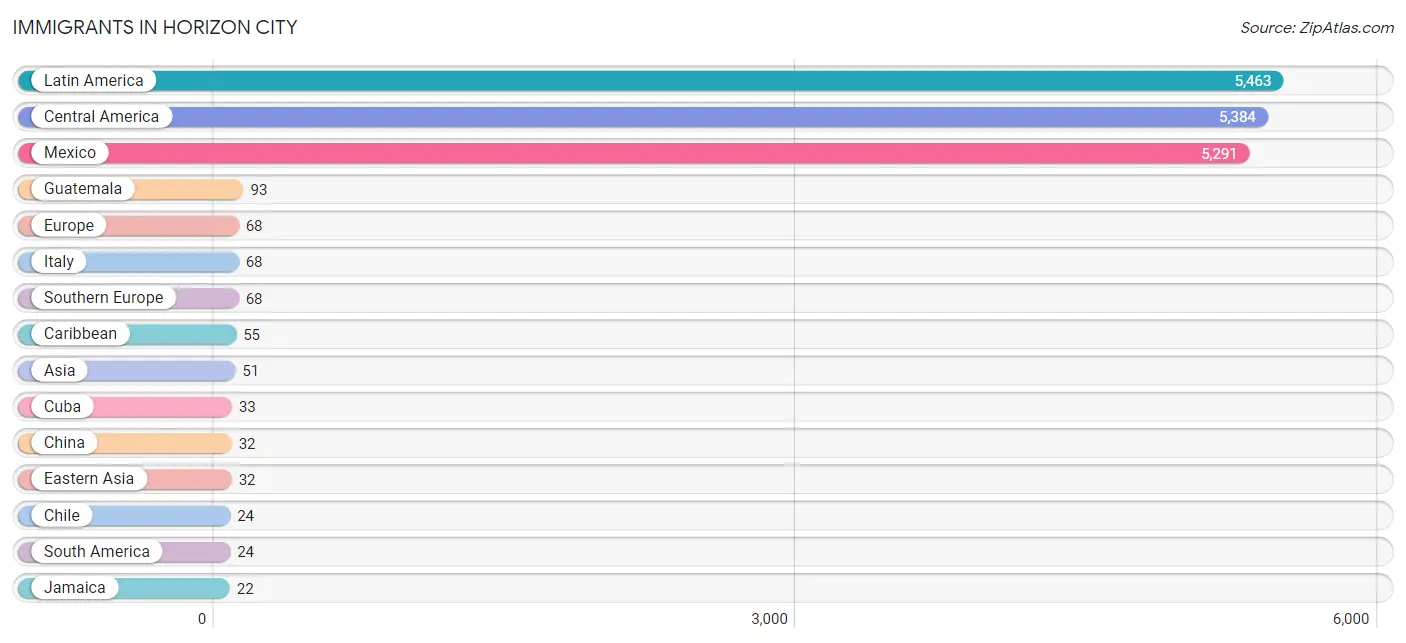
Immigrants in Horizon City
The most numerous immigrant groups reported in Horizon City came from Latin America (5,463 | 24.2%), Central America (5,384 | 23.9%), Mexico (5,291 | 23.5%), Guatemala (93 | 0.4%), and Europe (68 | 0.3%), together accounting for 72.3% of all Horizon City residents.
| Immigration Origin | # Population | % Population |
| Asia | 51 | 0.2% |
| Caribbean | 55 | 0.2% |
| Central America | 5,384 | 23.9% |
| Chile | 24 | 0.1% |
| China | 32 | 0.1% |
| Cuba | 33 | 0.2% |
| Eastern Asia | 32 | 0.1% |
| Europe | 68 | 0.3% |
| Guatemala | 93 | 0.4% |
| Italy | 68 | 0.3% |
| Jamaica | 22 | 0.1% |
| Latin America | 5,463 | 24.2% |
| Mexico | 5,291 | 23.5% |
| Philippines | 8 | 0.0% |
| South America | 24 | 0.1% |
| South Eastern Asia | 19 | 0.1% |
| Southern Europe | 68 | 0.3% |
| Vietnam | 11 | 0.1% | View All 18 Rows |
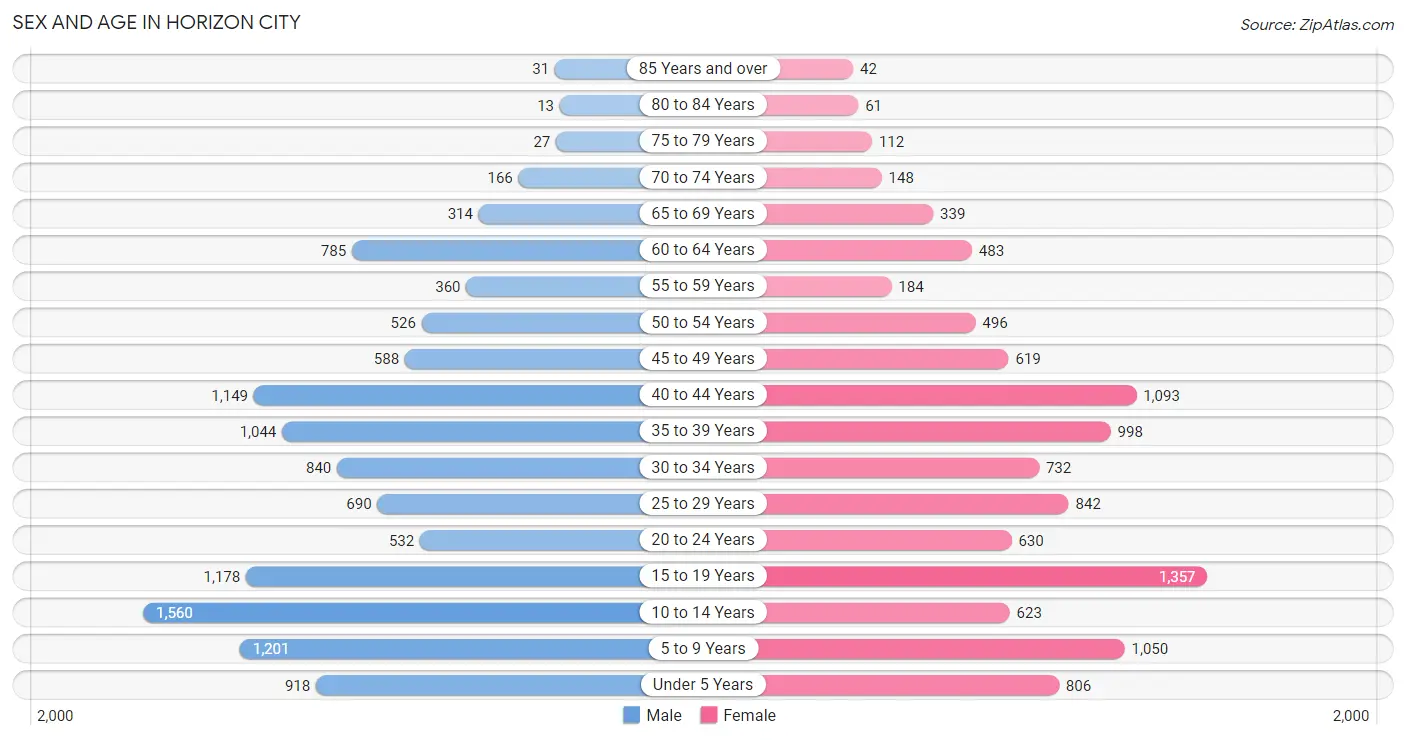
Sex and Age in Horizon City
Sex and Age in Horizon City
The most populous age groups in Horizon City are 10 to 14 Years (1,560 | 13.1%) for men and 15 to 19 Years (1,357 | 12.8%) for women.
| Age Bracket | Male | Female |
| Under 5 Years | 918 (7.7%) | 806 (7.6%) |
| 5 to 9 Years | 1,201 (10.1%) | 1,050 (9.9%) |
| 10 to 14 Years | 1,560 (13.1%) | 623 (5.9%) |
| 15 to 19 Years | 1,178 (9.9%) | 1,357 (12.8%) |
| 20 to 24 Years | 532 (4.5%) | 630 (5.9%) |
| 25 to 29 Years | 690 (5.8%) | 842 (7.9%) |
| 30 to 34 Years | 840 (7.0%) | 732 (6.9%) |
| 35 to 39 Years | 1,044 (8.8%) | 998 (9.4%) |
| 40 to 44 Years | 1,149 (9.6%) | 1,093 (10.3%) |
| 45 to 49 Years | 588 (4.9%) | 619 (5.8%) |
| 50 to 54 Years | 526 (4.4%) | 496 (4.7%) |
| 55 to 59 Years | 360 (3.0%) | 184 (1.7%) |
| 60 to 64 Years | 785 (6.6%) | 483 (4.5%) |
| 65 to 69 Years | 314 (2.6%) | 339 (3.2%) |
| 70 to 74 Years | 166 (1.4%) | 148 (1.4%) |
| 75 to 79 Years | 27 (0.2%) | 112 (1.1%) |
| 80 to 84 Years | 13 (0.1%) | 61 (0.6%) |
| 85 Years and over | 31 (0.3%) | 42 (0.4%) |
| Total | 11,922 (100.0%) | 10,615 (100.0%) |
Families and Households in Horizon City
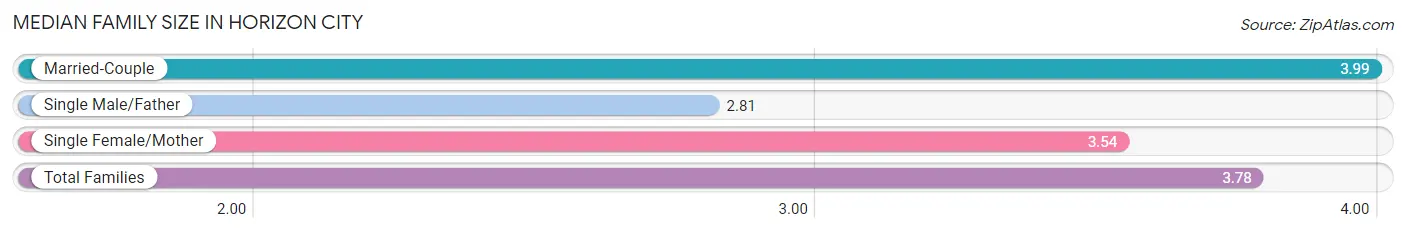
Median Family Size in Horizon City
The median family size in Horizon City is 3.78 persons per family, with married-couple families (3,784 | 69.9%) accounting for the largest median family size of 3.99 persons per family. On the other hand, single male/father families (534 | 9.9%) represent the smallest median family size with 2.81 persons per family.
| Family Type | # Families | Family Size |
| Married-Couple | 3,784 (69.9%) | 3.99 |
| Single Male/Father | 534 (9.9%) | 2.81 |
| Single Female/Mother | 1,096 (20.2%) | 3.54 |
| Total Families | 5,414 (100.0%) | 3.78 |
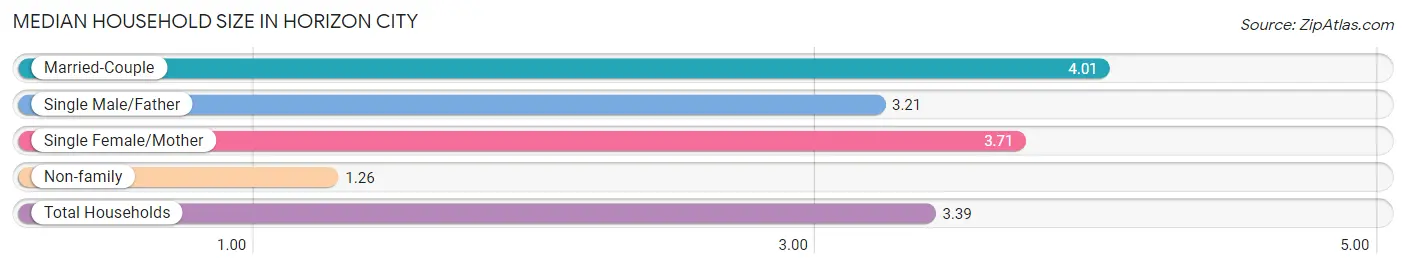
Median Household Size in Horizon City
The median household size in Horizon City is 3.39 persons per household, with married-couple households (3,784 | 56.9%) accounting for the largest median household size of 4.01 persons per household. non-family households (1,240 | 18.6%) represent the smallest median household size with 1.26 persons per household.
| Household Type | # Households | Household Size |
| Married-Couple | 3,784 (56.9%) | 4.01 |
| Single Male/Father | 534 (8.0%) | 3.21 |
| Single Female/Mother | 1,096 (16.5%) | 3.71 |
| Non-family | 1,240 (18.6%) | 1.26 |
| Total Households | 6,654 (100.0%) | 3.39 |
Household Size by Marriage Status in Horizon City
Out of a total of 6,654 households in Horizon City, 5,414 (81.4%) are family households, while 1,240 (18.6%) are nonfamily households. The most numerous type of family households are 3-person households, comprising 1,486, and the most common type of nonfamily households are 1-person households, comprising 924.
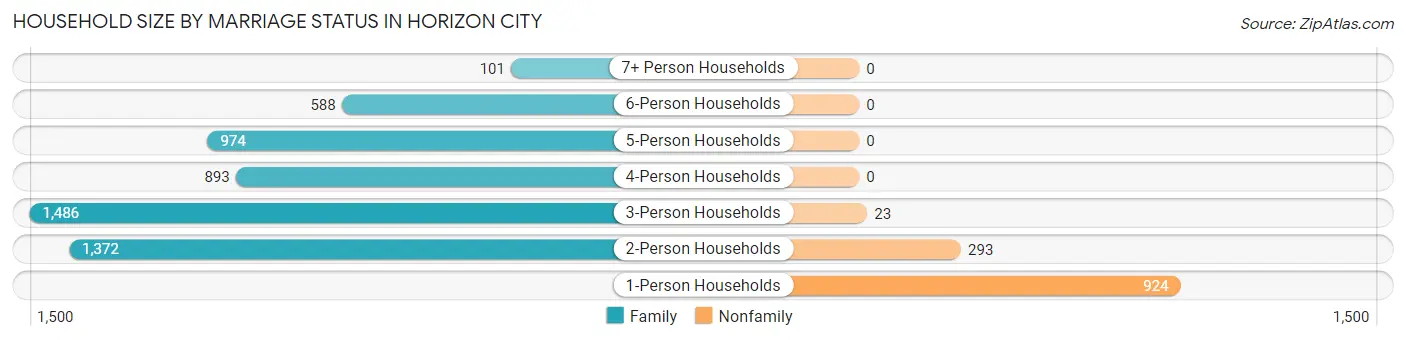
| Household Size | Family Households | Nonfamily Households |
| 1-Person Households | - | 924 (13.9%) |
| 2-Person Households | 1,372 (20.6%) | 293 (4.4%) |
| 3-Person Households | 1,486 (22.3%) | 23 (0.4%) |
| 4-Person Households | 893 (13.4%) | 0 (0.0%) |
| 5-Person Households | 974 (14.6%) | 0 (0.0%) |
| 6-Person Households | 588 (8.8%) | 0 (0.0%) |
| 7+ Person Households | 101 (1.5%) | 0 (0.0%) |
| Total | 5,414 (81.4%) | 1,240 (18.6%) |
Female Fertility in Horizon City
Fertility by Age in Horizon City
Average fertility rate in Horizon City is 57.0 births per 1,000 women. Women in the age bracket of 20 to 34 years have the highest fertility rate with 137.0 births per 1,000 women. Women in the age bracket of 20 to 34 years acount for 84.1% of all women with births.
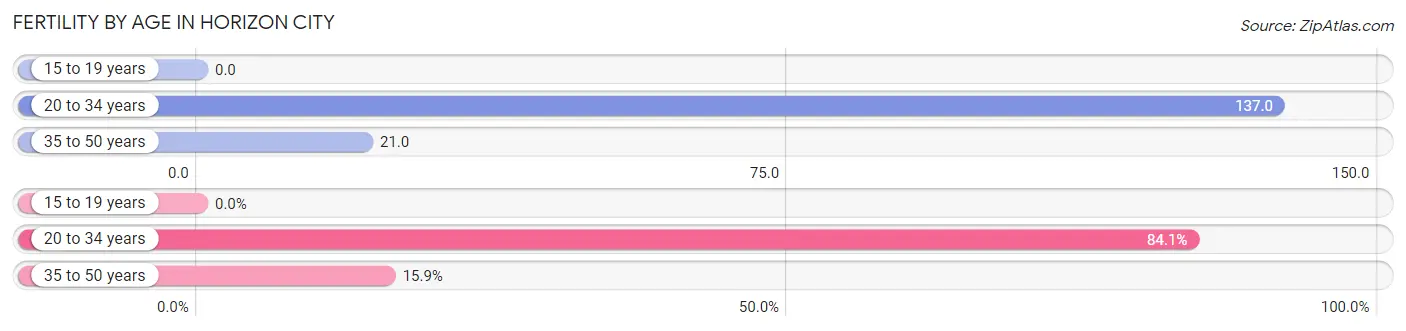
| Age Bracket | Women with Births | Births / 1,000 Women |
| 15 to 19 years | 0 (0.0%) | 0.0 |
| 20 to 34 years | 301 (84.1%) | 137.0 |
| 35 to 50 years | 57 (15.9%) | 21.0 |
| Total | 358 (100.0%) | 57.0 |
Fertility by Age by Marriage Status in Horizon City
54.2% of women with births (358) in Horizon City are married. The highest percentage of unmarried women with births falls into 20 to 34 years age bracket with 47.8% of them unmarried at the time of birth, while the lowest percentage of unmarried women with births belong to 35 to 50 years age bracket with 35.1% of them unmarried.
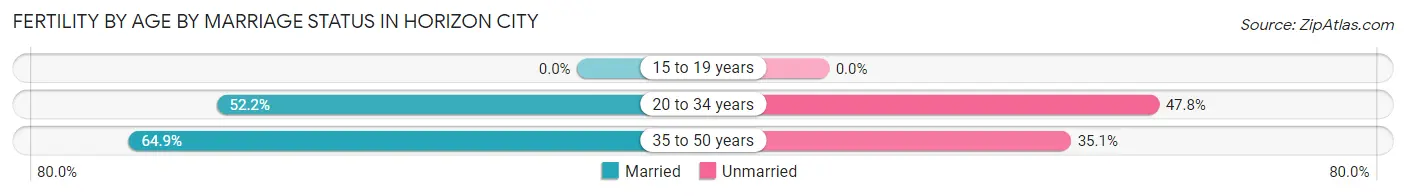
| Age Bracket | Married | Unmarried |
| 15 to 19 years | 0 (0.0%) | 0 (0.0%) |
| 20 to 34 years | 157 (52.2%) | 144 (47.8%) |
| 35 to 50 years | 37 (64.9%) | 20 (35.1%) |
| Total | 194 (54.2%) | 164 (45.8%) |
Fertility by Education in Horizon City
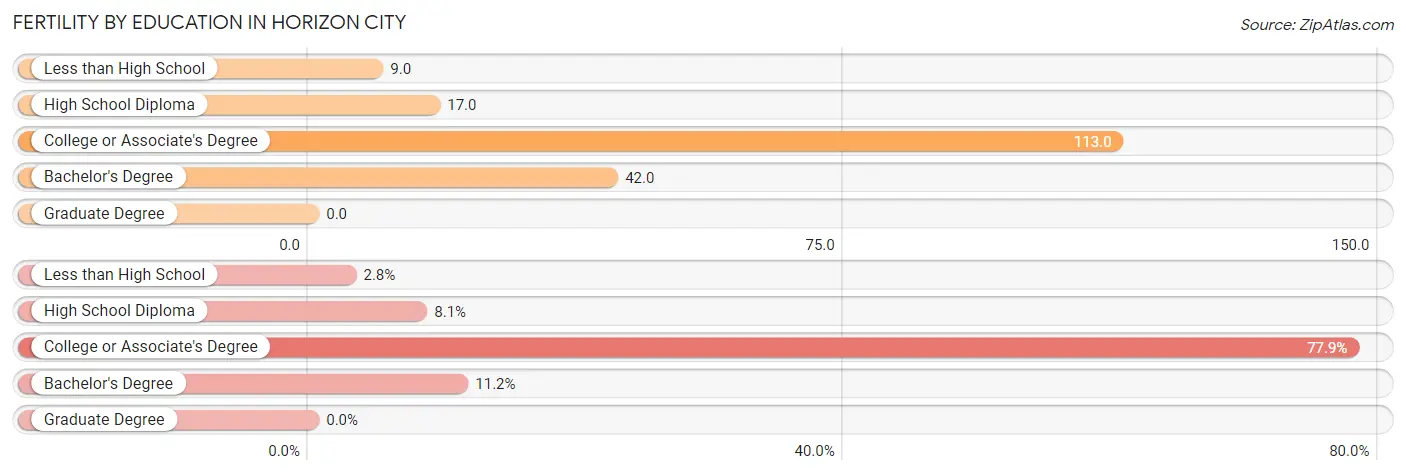
| Educational Attainment | Women with Births | Births / 1,000 Women |
| Less than High School | 10 (2.8%) | 9.0 |
| High School Diploma | 29 (8.1%) | 17.0 |
| College or Associate's Degree | 279 (77.9%) | 113.0 |
| Bachelor's Degree | 40 (11.2%) | 42.0 |
| Graduate Degree | 0 (0.0%) | 0.0 |
| Total | 358 (100.0%) | 57.0 |
Fertility by Education by Marriage Status in Horizon City
45.8% of women with births in Horizon City are unmarried. Women with the educational attainment of high school diploma are most likely to be married with 100.0% of them married at childbirth, while women with the educational attainment of less than high school are least likely to be married with 100.0% of them unmarried at childbirth.
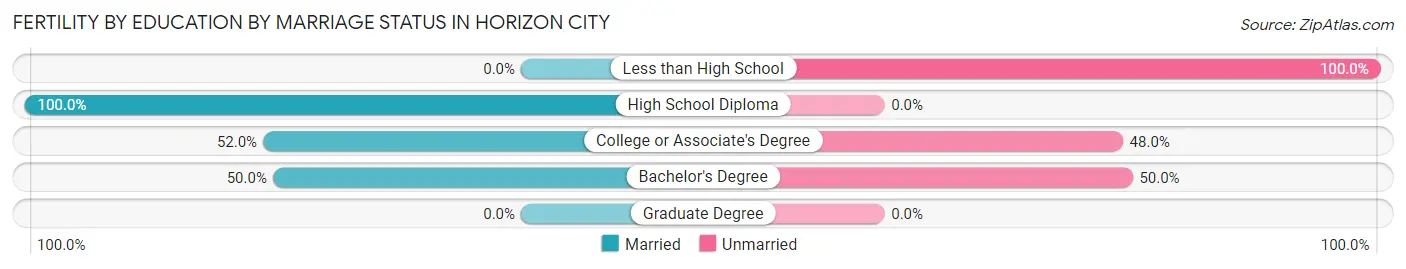
| Educational Attainment | Married | Unmarried |
| Less than High School | 0 (0.0%) | 10 (100.0%) |
| High School Diploma | 29 (100.0%) | 0 (0.0%) |
| College or Associate's Degree | 145 (52.0%) | 134 (48.0%) |
| Bachelor's Degree | 20 (50.0%) | 20 (50.0%) |
| Graduate Degree | 0 (0.0%) | 0 (0.0%) |
| Total | 194 (54.2%) | 164 (45.8%) |
Employment Characteristics in Horizon City
Employment by Class of Employer in Horizon City
Among the 9,049 employed individuals in Horizon City, private company employees (5,220 | 57.7%), local government employees (1,374 | 15.2%), and not-for-profit organizations (768 | 8.5%) make up the most common classes of employment.
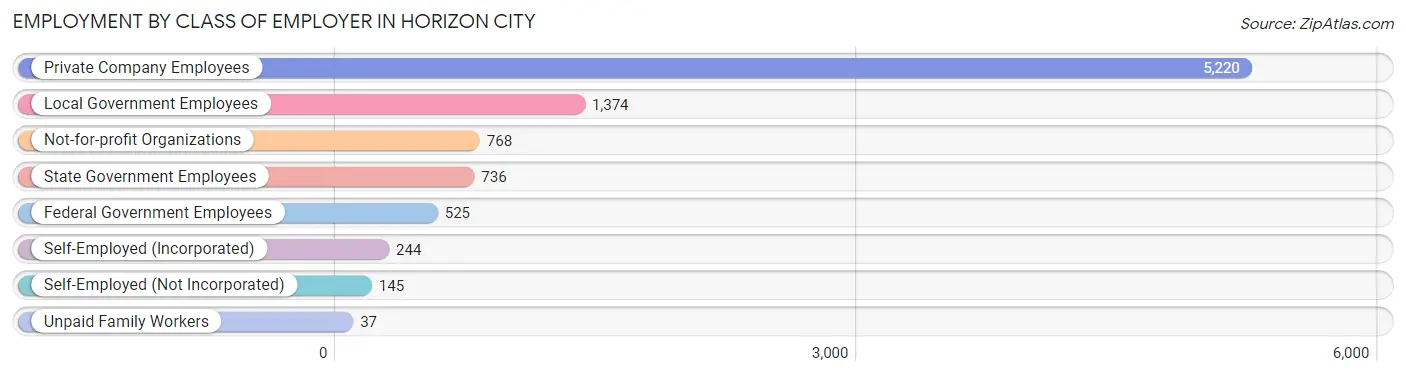
| Employer Class | # Employees | % Employees |
| Private Company Employees | 5,220 | 57.7% |
| Self-Employed (Incorporated) | 244 | 2.7% |
| Self-Employed (Not Incorporated) | 145 | 1.6% |
| Not-for-profit Organizations | 768 | 8.5% |
| Local Government Employees | 1,374 | 15.2% |
| State Government Employees | 736 | 8.1% |
| Federal Government Employees | 525 | 5.8% |
| Unpaid Family Workers | 37 | 0.4% |
| Total | 9,049 | 100.0% |
Employment Status by Age in Horizon City
According to the labor force statistics for Horizon City, out of the total population over 16 years of age (15,969), 64.7% or 10,332 individuals are in the labor force, with 10.0% or 1,033 of them unemployed. The age group with the highest labor force participation rate is 30 to 34 years, with 84.3% or 1,325 individuals in the labor force. Within the labor force, the 16 to 19 years age range has the highest percentage of unemployed individuals, with 33.5% or 129 of them being unemployed.
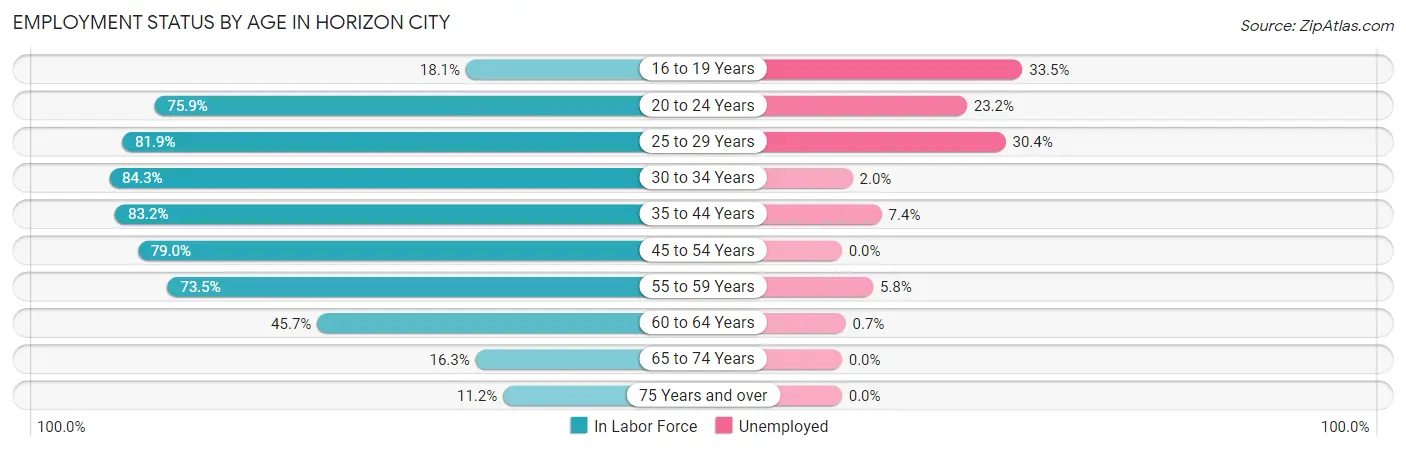
| Age Bracket | In Labor Force | Unemployed |
| 16 to 19 Years | 385 (18.1%) | 129 (33.5%) |
| 20 to 24 Years | 882 (75.9%) | 205 (23.2%) |
| 25 to 29 Years | 1,255 (81.9%) | 382 (30.4%) |
| 30 to 34 Years | 1,325 (84.3%) | 26 (2.0%) |
| 35 to 44 Years | 3,564 (83.2%) | 264 (7.4%) |
| 45 to 54 Years | 1,761 (79.0%) | 0 (0.0%) |
| 55 to 59 Years | 400 (73.5%) | 23 (5.8%) |
| 60 to 64 Years | 579 (45.7%) | 4 (0.7%) |
| 65 to 74 Years | 158 (16.3%) | 0 (0.0%) |
| 75 Years and over | 32 (11.2%) | 0 (0.0%) |
| Total | 10,332 (64.7%) | 1,033 (10.0%) |
Employment Status by Educational Attainment in Horizon City
According to labor force statistics for Horizon City, 77.7% of individuals (8,880) out of the total population between 25 and 64 years of age (11,429) are in the labor force, with 7.9% or 702 of them being unemployed. The group with the highest labor force participation rate are those with the educational attainment of bachelor's degree or higher, with 85.1% or 2,409 individuals in the labor force. Within the labor force, individuals with college / associate degree education have the highest percentage of unemployment, with 9.6% or 359 of them being unemployed.
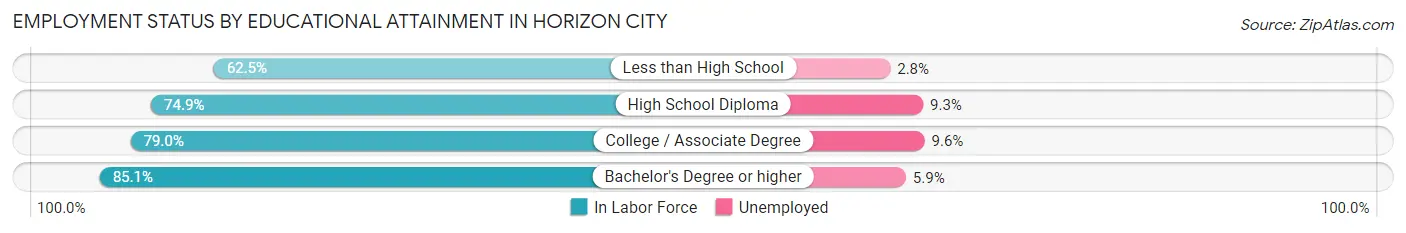
| Educational Attainment | In Labor Force | Unemployed |
| Less than High School | 816 (62.5%) | 37 (2.8%) |
| High School Diploma | 1,917 (74.9%) | 238 (9.3%) |
| College / Associate Degree | 3,740 (79.0%) | 454 (9.6%) |
| Bachelor's Degree or higher | 2,409 (85.1%) | 167 (5.9%) |
| Total | 8,880 (77.7%) | 903 (7.9%) |
Employment Occupations by Sex in Horizon City
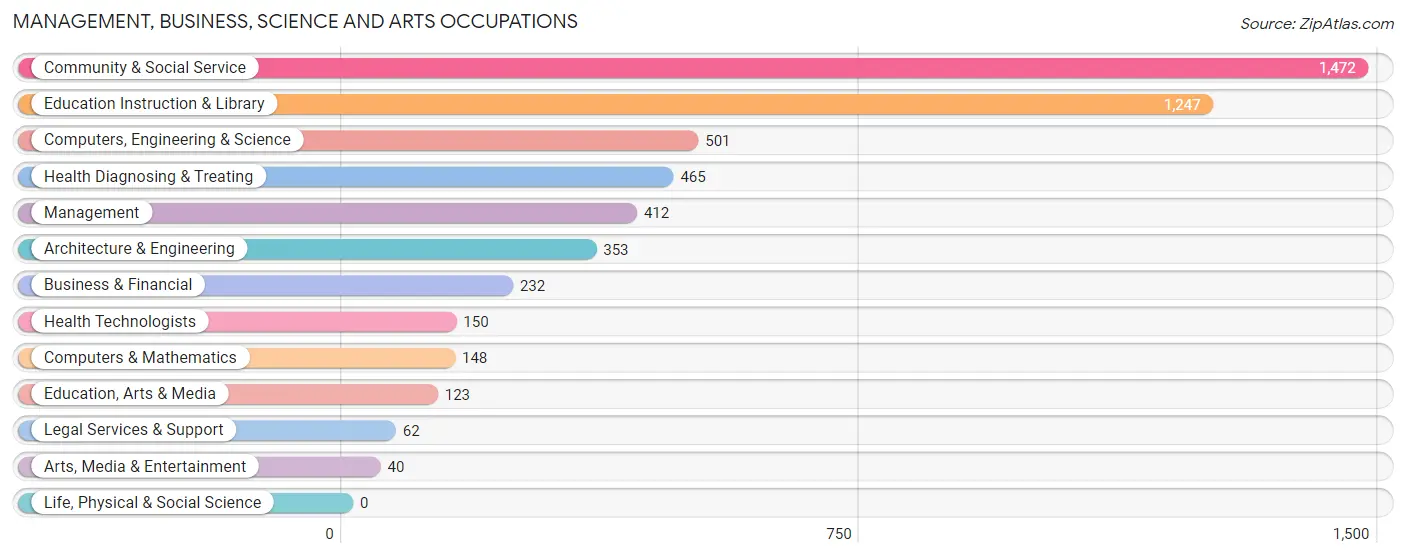
Management, Business, Science and Arts Occupations
The most common Management, Business, Science and Arts occupations in Horizon City are Community & Social Service (1,472 | 15.9%), Education Instruction & Library (1,247 | 13.5%), Computers, Engineering & Science (501 | 5.4%), Health Diagnosing & Treating (465 | 5.0%), and Management (412 | 4.4%).
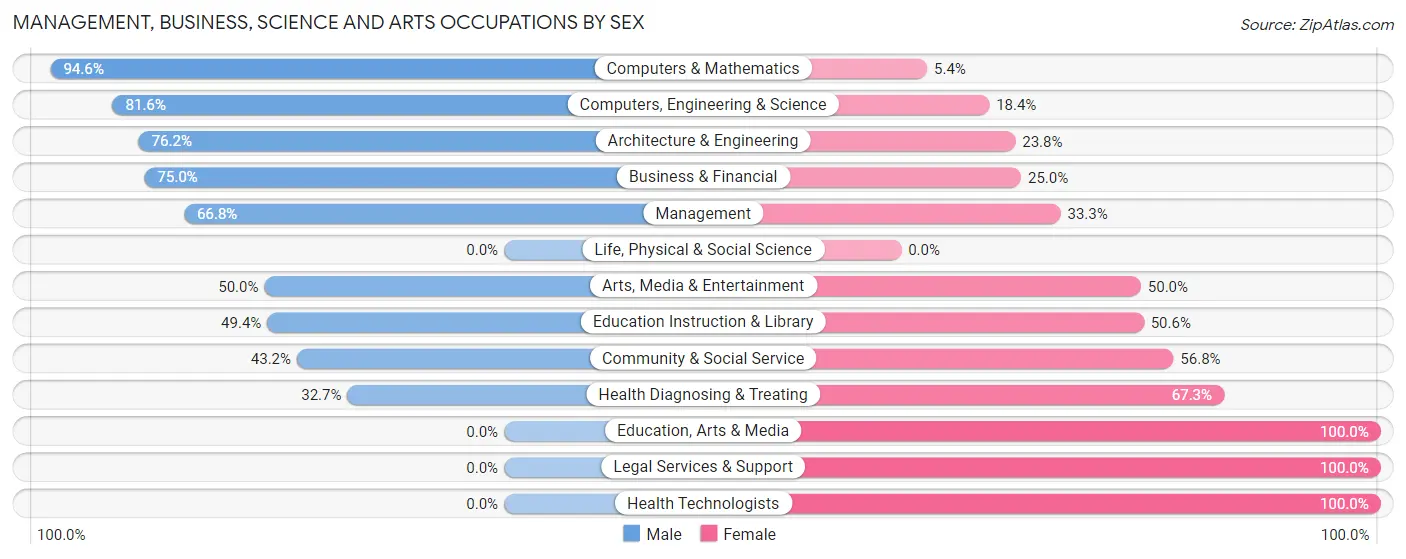
Management, Business, Science and Arts Occupations by Sex
Within the Management, Business, Science and Arts occupations in Horizon City, the most male-oriented occupations are Computers & Mathematics (94.6%), Computers, Engineering & Science (81.6%), and Architecture & Engineering (76.2%), while the most female-oriented occupations are Education, Arts & Media (100.0%), Legal Services & Support (100.0%), and Health Technologists (100.0%).
| Occupation | Male | Female |
| Management | 275 (66.7%) | 137 (33.3%) |
| Business & Financial | 174 (75.0%) | 58 (25.0%) |
| Computers, Engineering & Science | 409 (81.6%) | 92 (18.4%) |
| Computers & Mathematics | 140 (94.6%) | 8 (5.4%) |
| Architecture & Engineering | 269 (76.2%) | 84 (23.8%) |
| Life, Physical & Social Science | 0 (0.0%) | 0 (0.0%) |
| Community & Social Service | 636 (43.2%) | 836 (56.8%) |
| Education, Arts & Media | 0 (0.0%) | 123 (100.0%) |
| Legal Services & Support | 0 (0.0%) | 62 (100.0%) |
| Education Instruction & Library | 616 (49.4%) | 631 (50.6%) |
| Arts, Media & Entertainment | 20 (50.0%) | 20 (50.0%) |
| Health Diagnosing & Treating | 152 (32.7%) | 313 (67.3%) |
| Health Technologists | 0 (0.0%) | 150 (100.0%) |
| Total (Category) | 1,646 (53.4%) | 1,436 (46.6%) |
| Total (Overall) | 5,218 (56.4%) | 4,036 (43.6%) |
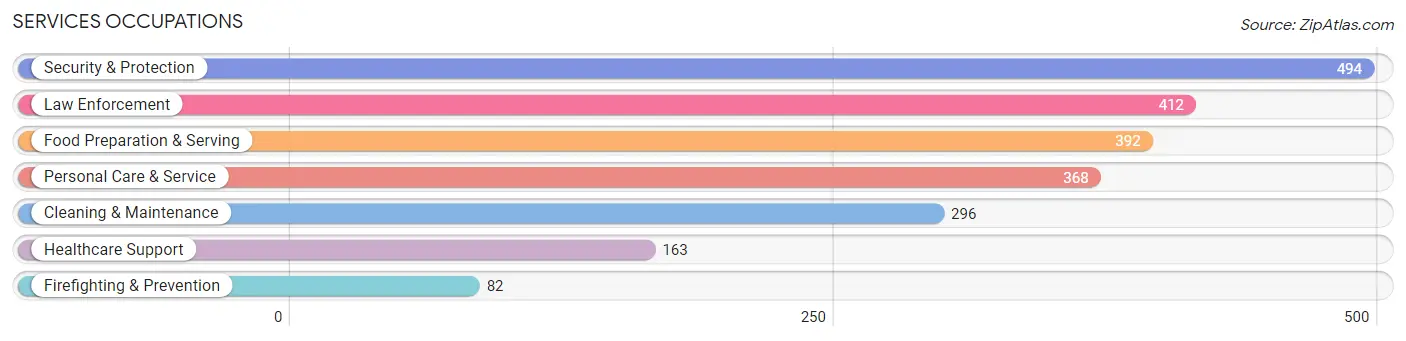
Services Occupations
The most common Services occupations in Horizon City are Security & Protection (494 | 5.3%), Law Enforcement (412 | 4.4%), Food Preparation & Serving (392 | 4.2%), Personal Care & Service (368 | 4.0%), and Cleaning & Maintenance (296 | 3.2%).
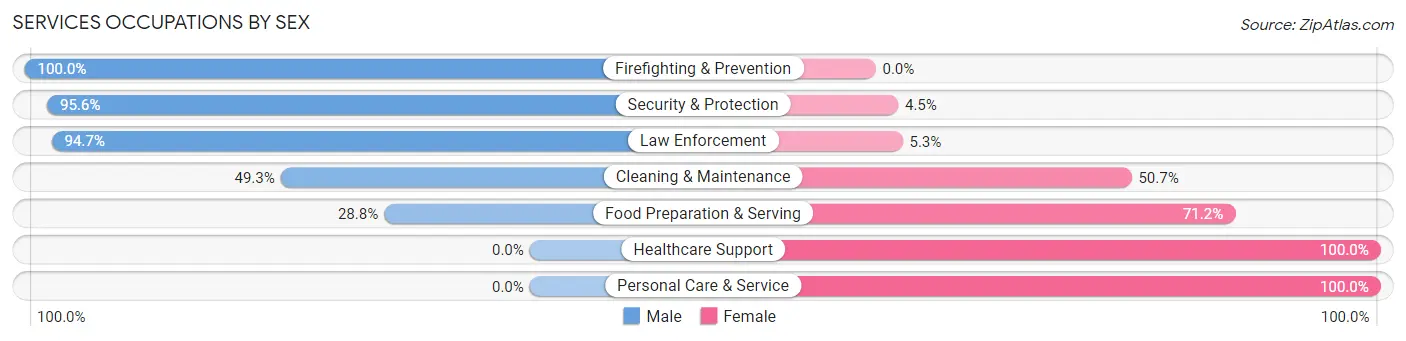
Services Occupations by Sex
Within the Services occupations in Horizon City, the most male-oriented occupations are Firefighting & Prevention (100.0%), Security & Protection (95.6%), and Law Enforcement (94.7%), while the most female-oriented occupations are Healthcare Support (100.0%), Personal Care & Service (100.0%), and Food Preparation & Serving (71.2%).
| Occupation | Male | Female |
| Healthcare Support | 0 (0.0%) | 163 (100.0%) |
| Security & Protection | 472 (95.6%) | 22 (4.4%) |
| Firefighting & Prevention | 82 (100.0%) | 0 (0.0%) |
| Law Enforcement | 390 (94.7%) | 22 (5.3%) |
| Food Preparation & Serving | 113 (28.8%) | 279 (71.2%) |
| Cleaning & Maintenance | 146 (49.3%) | 150 (50.7%) |
| Personal Care & Service | 0 (0.0%) | 368 (100.0%) |
| Total (Category) | 731 (42.7%) | 982 (57.3%) |
| Total (Overall) | 5,218 (56.4%) | 4,036 (43.6%) |
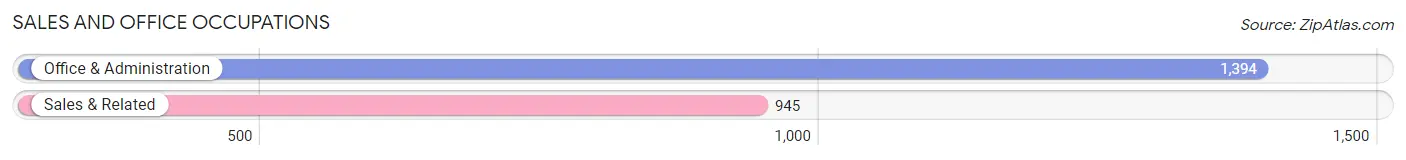
Sales and Office Occupations
The most common Sales and Office occupations in Horizon City are Office & Administration (1,394 | 15.1%), and Sales & Related (945 | 10.2%).
Sales and Office Occupations by Sex
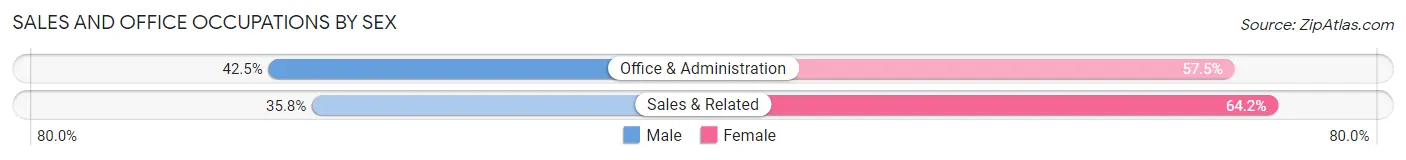
| Occupation | Male | Female |
| Sales & Related | 338 (35.8%) | 607 (64.2%) |
| Office & Administration | 592 (42.5%) | 802 (57.5%) |
| Total (Category) | 930 (39.8%) | 1,409 (60.2%) |
| Total (Overall) | 5,218 (56.4%) | 4,036 (43.6%) |
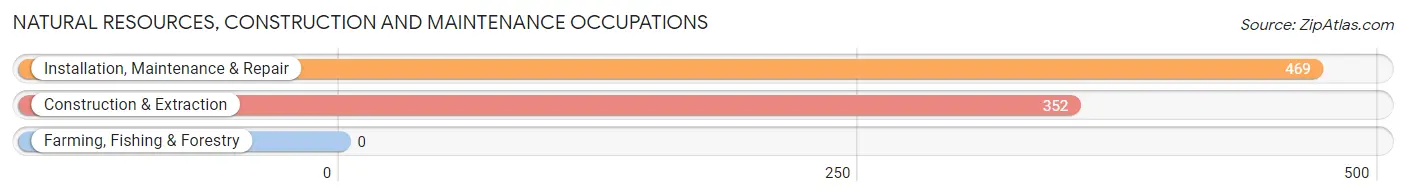
Natural Resources, Construction and Maintenance Occupations
The most common Natural Resources, Construction and Maintenance occupations in Horizon City are Installation, Maintenance & Repair (469 | 5.1%), and Construction & Extraction (352 | 3.8%).
Natural Resources, Construction and Maintenance Occupations by Sex
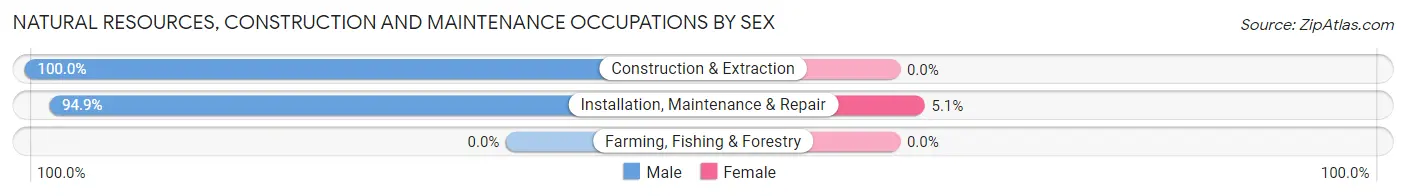
| Occupation | Male | Female |
| Farming, Fishing & Forestry | 0 (0.0%) | 0 (0.0%) |
| Construction & Extraction | 352 (100.0%) | 0 (0.0%) |
| Installation, Maintenance & Repair | 445 (94.9%) | 24 (5.1%) |
| Total (Category) | 797 (97.1%) | 24 (2.9%) |
| Total (Overall) | 5,218 (56.4%) | 4,036 (43.6%) |
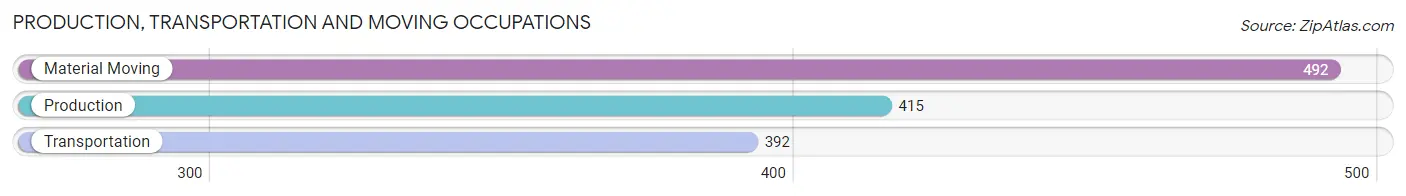
Production, Transportation and Moving Occupations
The most common Production, Transportation and Moving occupations in Horizon City are Material Moving (492 | 5.3%), Production (415 | 4.5%), and Transportation (392 | 4.2%).
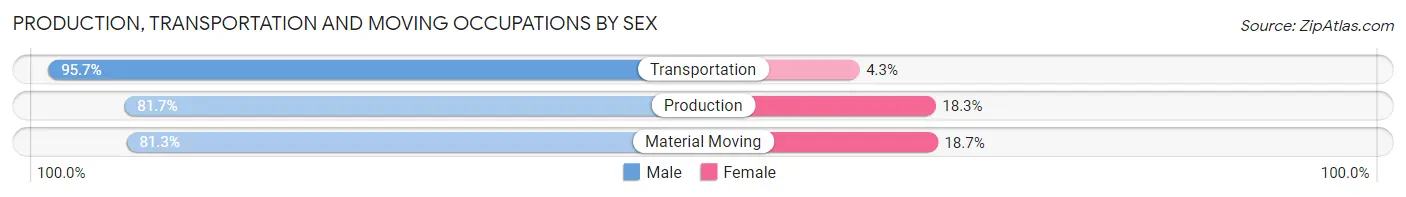
Production, Transportation and Moving Occupations by Sex
| Occupation | Male | Female |
| Production | 339 (81.7%) | 76 (18.3%) |
| Transportation | 375 (95.7%) | 17 (4.3%) |
| Material Moving | 400 (81.3%) | 92 (18.7%) |
| Total (Category) | 1,114 (85.8%) | 185 (14.2%) |
| Total (Overall) | 5,218 (56.4%) | 4,036 (43.6%) |
Employment Industries by Sex in Horizon City
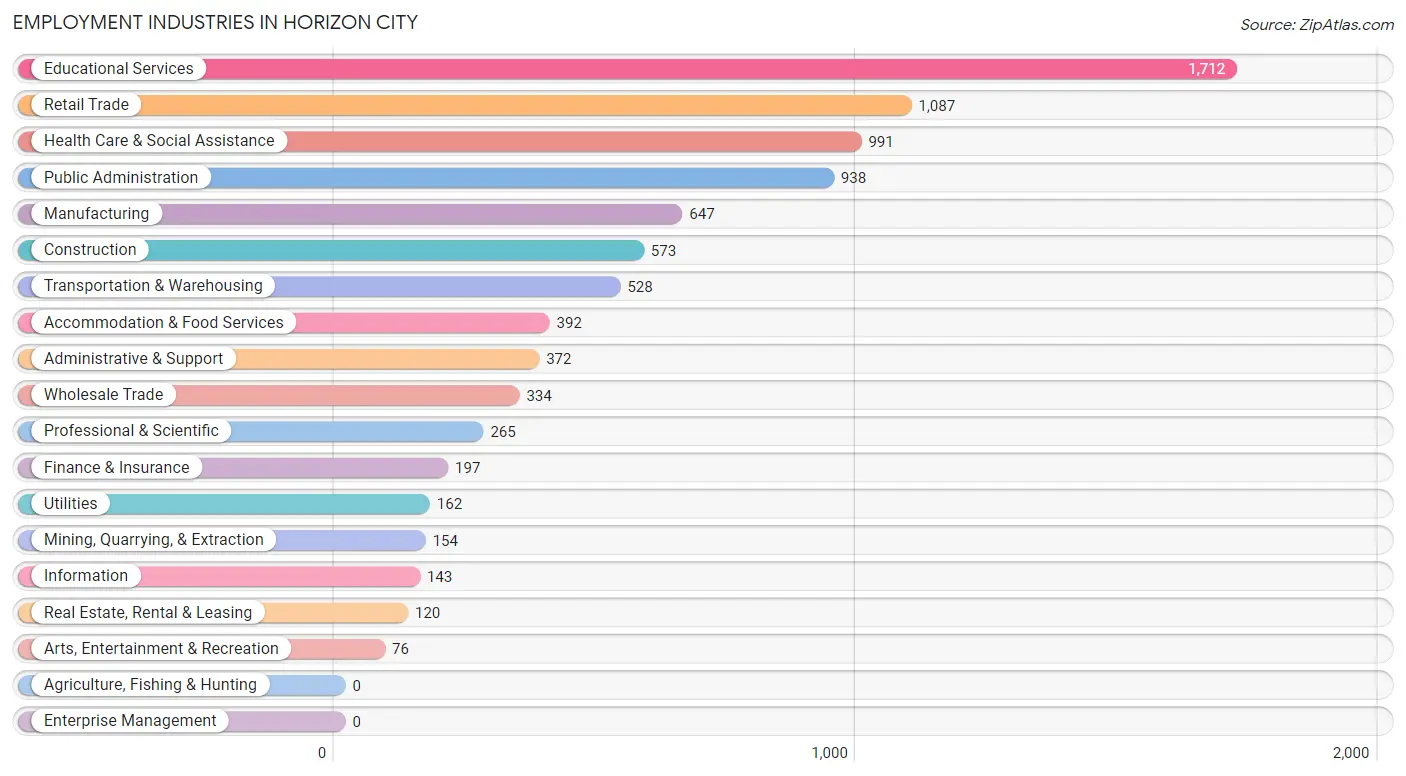
Employment Industries in Horizon City
The major employment industries in Horizon City include Educational Services (1,712 | 18.5%), Retail Trade (1,087 | 11.7%), Health Care & Social Assistance (991 | 10.7%), Public Administration (938 | 10.1%), and Manufacturing (647 | 7.0%).
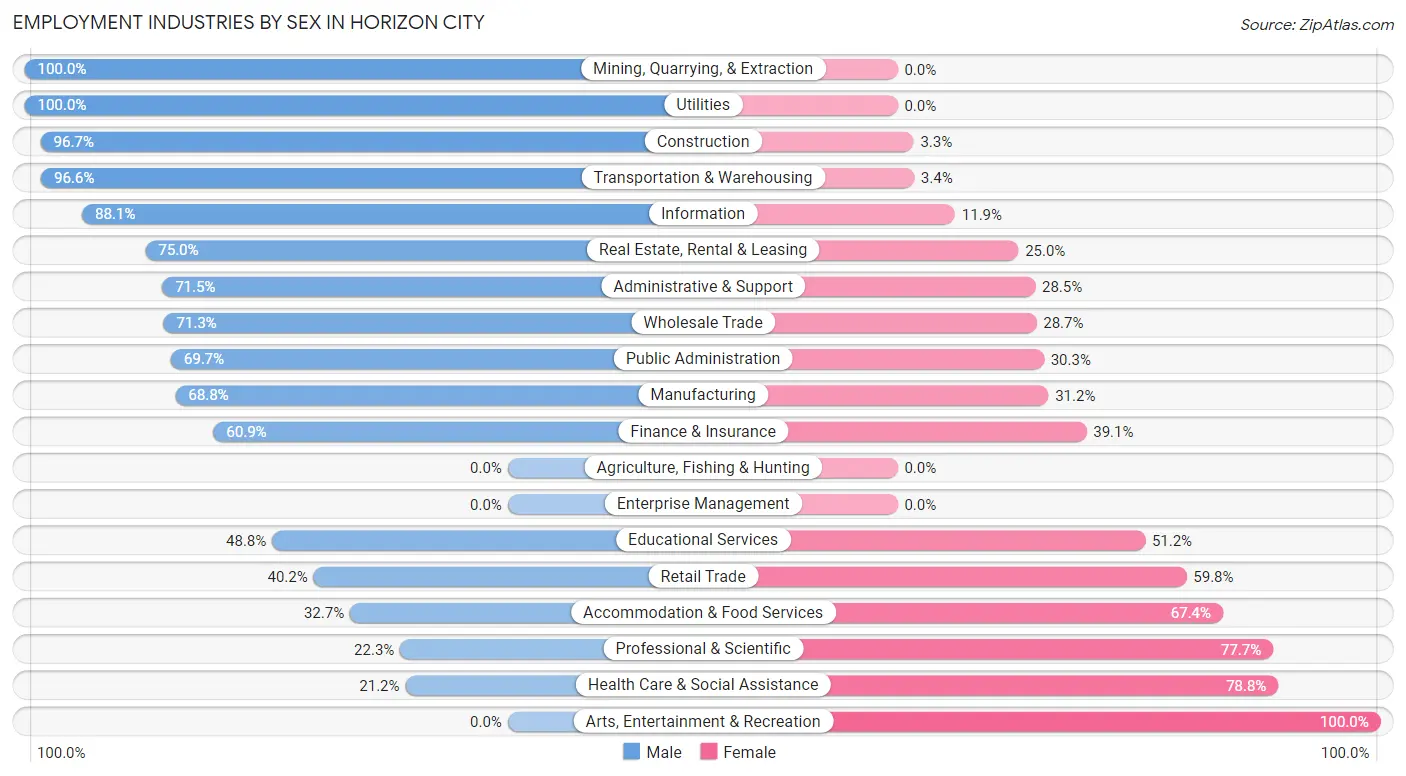
Employment Industries by Sex in Horizon City
The Horizon City industries that see more men than women are Mining, Quarrying, & Extraction (100.0%), Utilities (100.0%), and Construction (96.7%), whereas the industries that tend to have a higher number of women are Arts, Entertainment & Recreation (100.0%), Health Care & Social Assistance (78.8%), and Professional & Scientific (77.7%).
| Industry | Male | Female |
| Agriculture, Fishing & Hunting | 0 (0.0%) | 0 (0.0%) |
| Mining, Quarrying, & Extraction | 154 (100.0%) | 0 (0.0%) |
| Construction | 554 (96.7%) | 19 (3.3%) |
| Manufacturing | 445 (68.8%) | 202 (31.2%) |
| Wholesale Trade | 238 (71.3%) | 96 (28.7%) |
| Retail Trade | 437 (40.2%) | 650 (59.8%) |
| Transportation & Warehousing | 510 (96.6%) | 18 (3.4%) |
| Utilities | 162 (100.0%) | 0 (0.0%) |
| Information | 126 (88.1%) | 17 (11.9%) |
| Finance & Insurance | 120 (60.9%) | 77 (39.1%) |
| Real Estate, Rental & Leasing | 90 (75.0%) | 30 (25.0%) |
| Professional & Scientific | 59 (22.3%) | 206 (77.7%) |
| Enterprise Management | 0 (0.0%) | 0 (0.0%) |
| Administrative & Support | 266 (71.5%) | 106 (28.5%) |
| Educational Services | 835 (48.8%) | 877 (51.2%) |
| Health Care & Social Assistance | 210 (21.2%) | 781 (78.8%) |
| Arts, Entertainment & Recreation | 0 (0.0%) | 76 (100.0%) |
| Accommodation & Food Services | 128 (32.7%) | 264 (67.3%) |
| Public Administration | 654 (69.7%) | 284 (30.3%) |
| Total | 5,218 (56.4%) | 4,036 (43.6%) |
Education in Horizon City
School Enrollment in Horizon City
The most common levels of schooling among the 7,697 students in Horizon City are high school (2,112 | 27.4%), elementary school (1,752 | 22.8%), and college / undergraduate (1,477 | 19.2%).
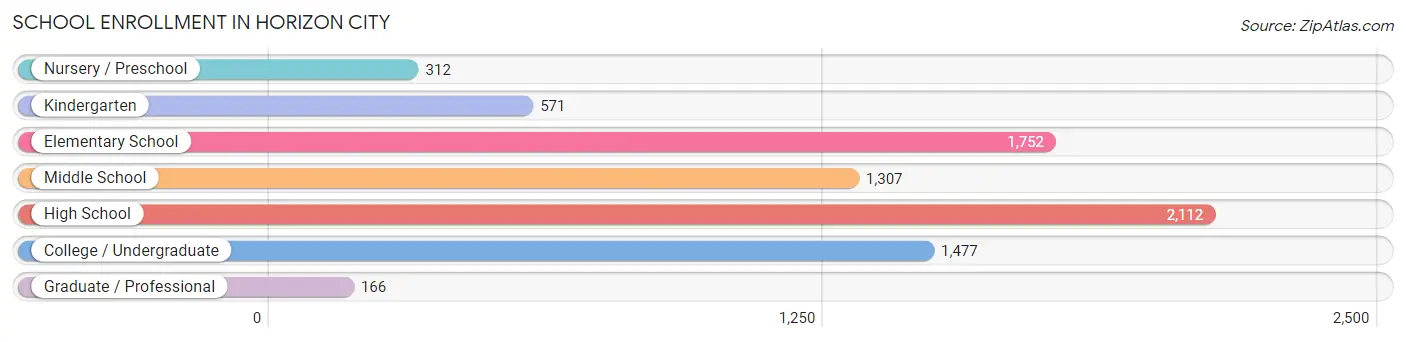
| School Level | # Students | % Students |
| Nursery / Preschool | 312 | 4.1% |
| Kindergarten | 571 | 7.4% |
| Elementary School | 1,752 | 22.8% |
| Middle School | 1,307 | 17.0% |
| High School | 2,112 | 27.4% |
| College / Undergraduate | 1,477 | 19.2% |
| Graduate / Professional | 166 | 2.2% |
| Total | 7,697 | 100.0% |
School Enrollment by Age by Funding Source in Horizon City
Out of a total of 7,697 students who are enrolled in schools in Horizon City, 385 (5.0%) attend a private institution, while the remaining 7,312 (95.0%) are enrolled in public schools. The age group of 3 to 4 year olds has the highest likelihood of being enrolled in private schools, with 117 (52.0% in the age bracket) enrolled. Conversely, the age group of 15 to 17 year olds has the lowest likelihood of being enrolled in a private school, with 1,494 (100.0% in the age bracket) attending a public institution.
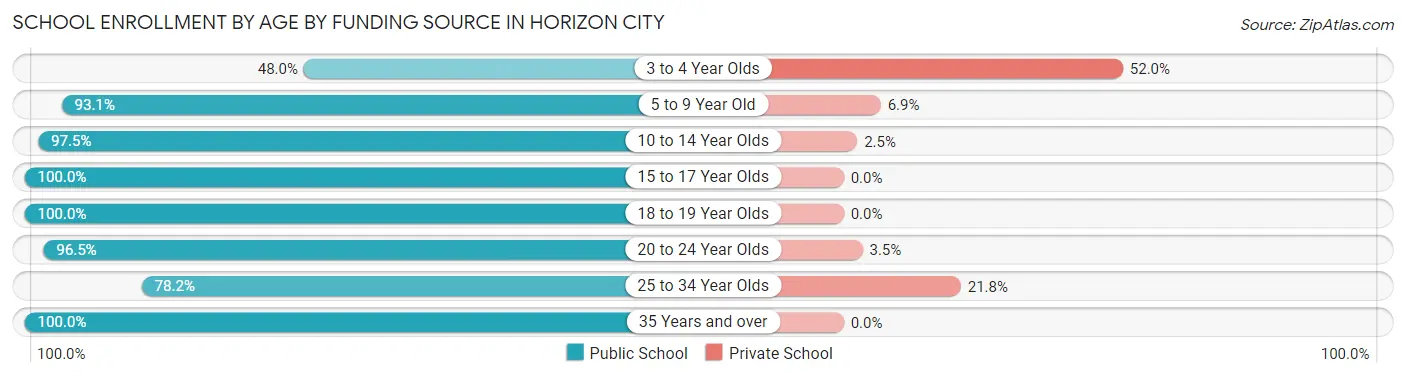
| Age Bracket | Public School | Private School |
| 3 to 4 Year Olds | 108 (48.0%) | 117 (52.0%) |
| 5 to 9 Year Old | 1,970 (93.1%) | 146 (6.9%) |
| 10 to 14 Year Olds | 1,933 (97.5%) | 50 (2.5%) |
| 15 to 17 Year Olds | 1,494 (100.0%) | 0 (0.0%) |
| 18 to 19 Year Olds | 786 (100.0%) | 0 (0.0%) |
| 20 to 24 Year Olds | 605 (96.5%) | 22 (3.5%) |
| 25 to 34 Year Olds | 190 (78.2%) | 53 (21.8%) |
| 35 Years and over | 223 (100.0%) | 0 (0.0%) |
| Total | 7,312 (95.0%) | 385 (5.0%) |
Educational Attainment by Field of Study in Horizon City
Engineering (655 | 19.8%), business (564 | 17.0%), education (536 | 16.2%), arts & humanities (349 | 10.5%), and science & technology (321 | 9.7%) are the most common fields of study among 3,312 individuals in Horizon City who have obtained a bachelor's degree or higher.
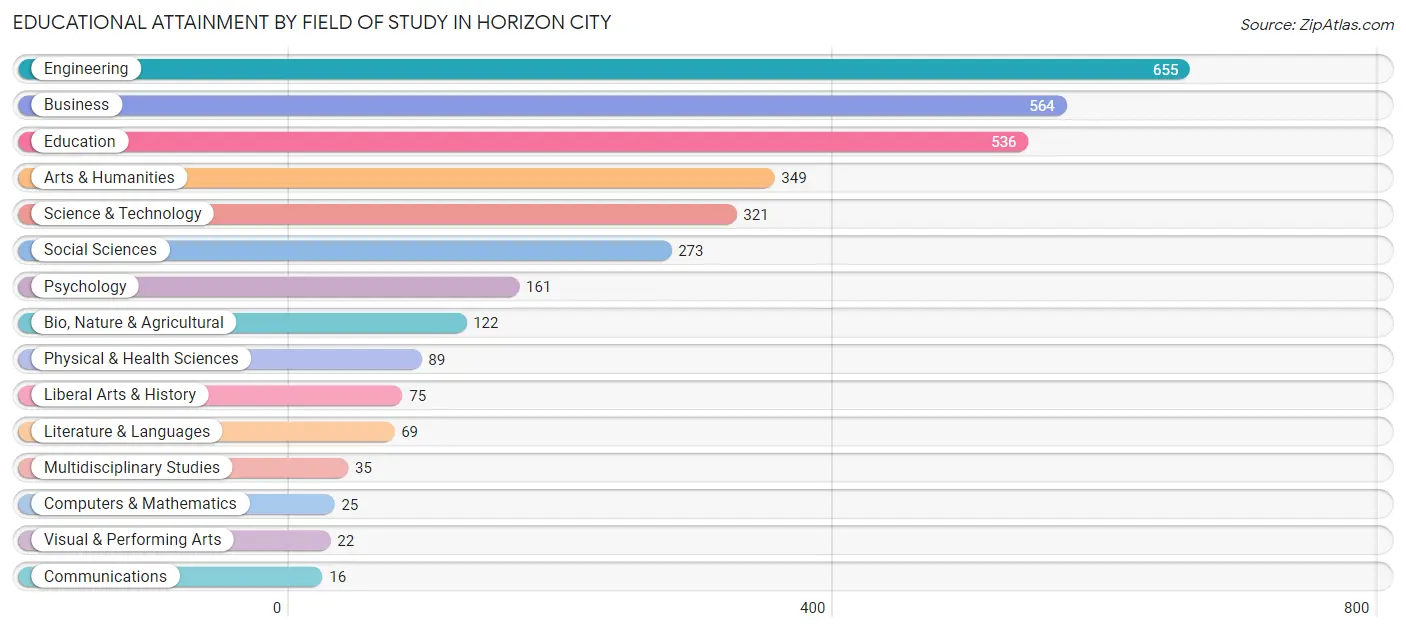
| Field of Study | # Graduates | % Graduates |
| Computers & Mathematics | 25 | 0.7% |
| Bio, Nature & Agricultural | 122 | 3.7% |
| Physical & Health Sciences | 89 | 2.7% |
| Psychology | 161 | 4.9% |
| Social Sciences | 273 | 8.2% |
| Engineering | 655 | 19.8% |
| Multidisciplinary Studies | 35 | 1.1% |
| Science & Technology | 321 | 9.7% |
| Business | 564 | 17.0% |
| Education | 536 | 16.2% |
| Literature & Languages | 69 | 2.1% |
| Liberal Arts & History | 75 | 2.3% |
| Visual & Performing Arts | 22 | 0.7% |
| Communications | 16 | 0.5% |
| Arts & Humanities | 349 | 10.5% |
| Total | 3,312 | 100.0% |
Transportation & Commute in Horizon City
Vehicle Availability by Sex in Horizon City
The most prevalent vehicle ownership categories in Horizon City are males with 2 vehicles (2,089, accounting for 40.5%) and females with 2 vehicles (1,822, making up 53.7%).
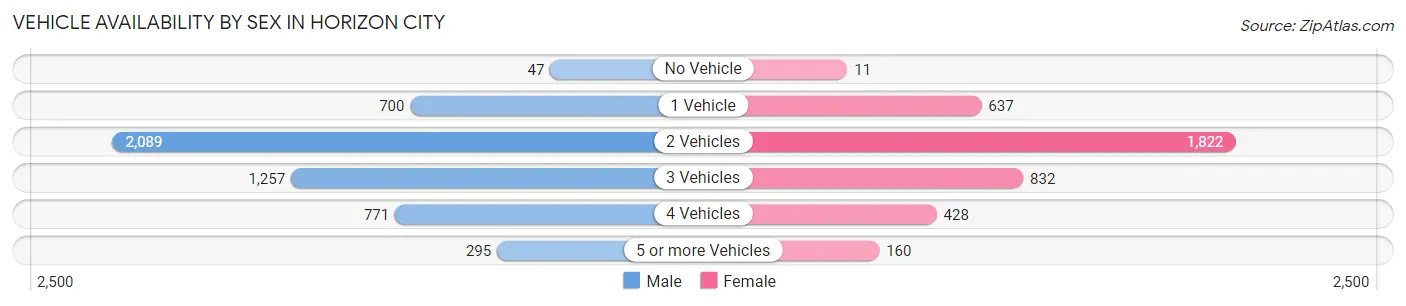
| Vehicles Available | Male | Female |
| No Vehicle | 47 (0.9%) | 11 (0.3%) |
| 1 Vehicle | 700 (13.6%) | 637 (16.4%) |
| 2 Vehicles | 2,089 (40.5%) | 1,822 (46.8%) |
| 3 Vehicles | 1,257 (24.4%) | 832 (21.4%) |
| 4 Vehicles | 771 (14.9%) | 428 (11.0%) |
| 5 or more Vehicles | 295 (5.7%) | 160 (4.1%) |
| Total | 5,159 (100.0%) | 3,890 (100.0%) |
Commute Time in Horizon City
The most frequently occuring commute durations in Horizon City are 30 to 34 minutes (2,086 commuters, 25.1%), 25 to 29 minutes (1,438 commuters, 17.3%), and 20 to 24 minutes (1,249 commuters, 15.0%).
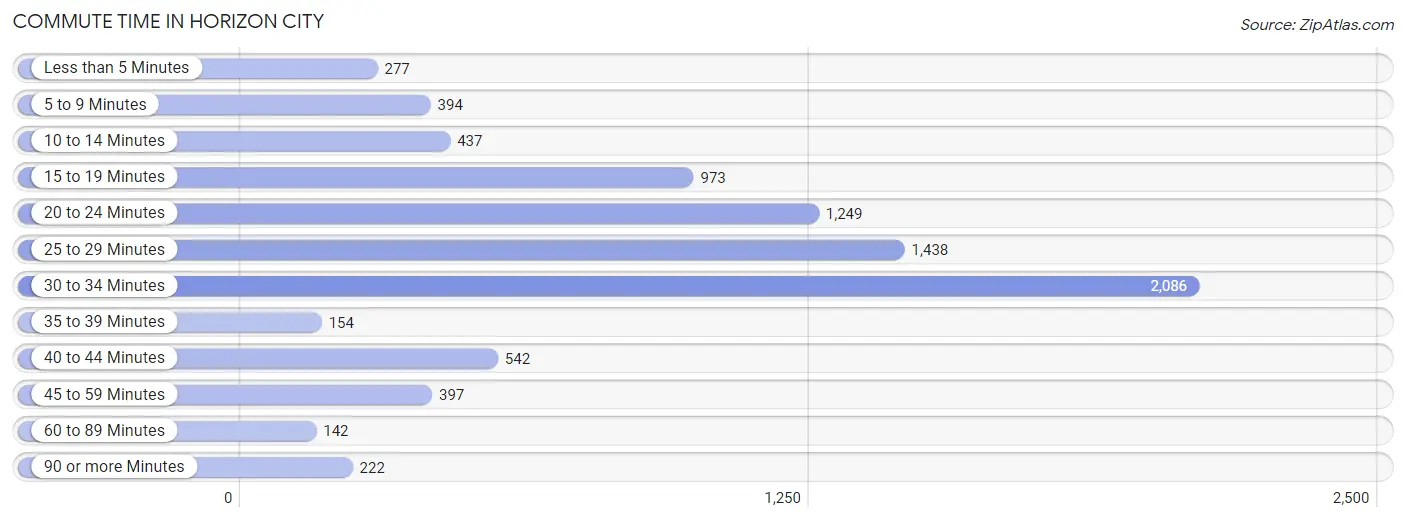
| Commute Time | # Commuters | % Commuters |
| Less than 5 Minutes | 277 | 3.3% |
| 5 to 9 Minutes | 394 | 4.7% |
| 10 to 14 Minutes | 437 | 5.3% |
| 15 to 19 Minutes | 973 | 11.7% |
| 20 to 24 Minutes | 1,249 | 15.0% |
| 25 to 29 Minutes | 1,438 | 17.3% |
| 30 to 34 Minutes | 2,086 | 25.1% |
| 35 to 39 Minutes | 154 | 1.8% |
| 40 to 44 Minutes | 542 | 6.5% |
| 45 to 59 Minutes | 397 | 4.8% |
| 60 to 89 Minutes | 142 | 1.7% |
| 90 or more Minutes | 222 | 2.7% |
Commute Time by Sex in Horizon City
The most common commute times in Horizon City are 30 to 34 minutes (1,204 commuters, 25.5%) for males and 30 to 34 minutes (882 commuters, 24.5%) for females.
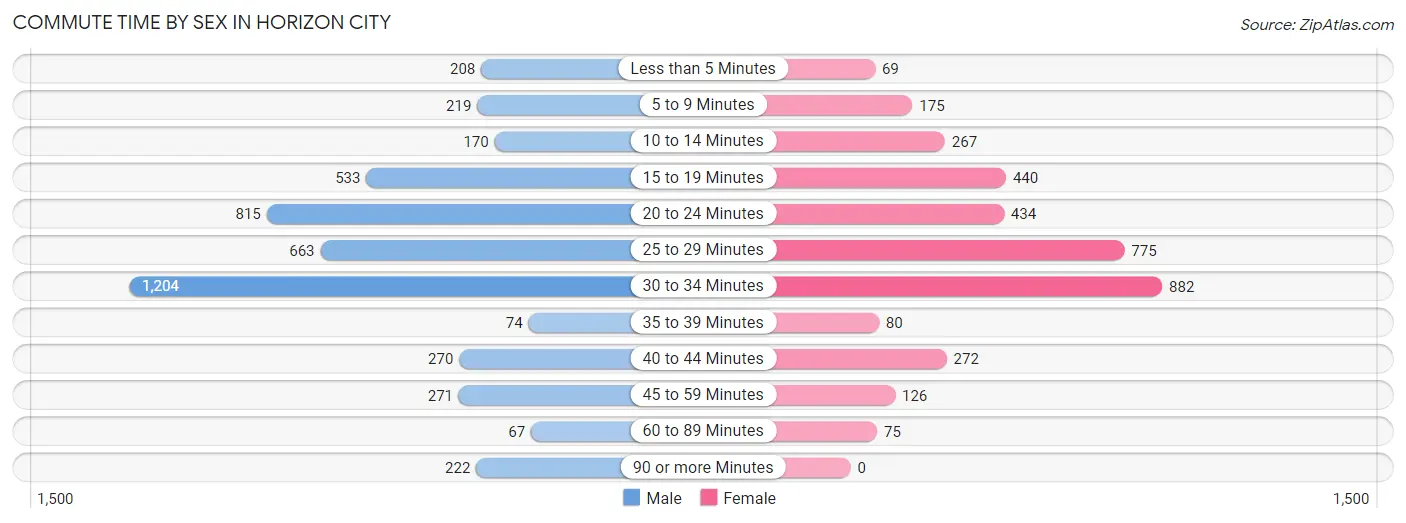
| Commute Time | Male | Female |
| Less than 5 Minutes | 208 (4.4%) | 69 (1.9%) |
| 5 to 9 Minutes | 219 (4.6%) | 175 (4.9%) |
| 10 to 14 Minutes | 170 (3.6%) | 267 (7.4%) |
| 15 to 19 Minutes | 533 (11.3%) | 440 (12.2%) |
| 20 to 24 Minutes | 815 (17.3%) | 434 (12.1%) |
| 25 to 29 Minutes | 663 (14.1%) | 775 (21.6%) |
| 30 to 34 Minutes | 1,204 (25.5%) | 882 (24.5%) |
| 35 to 39 Minutes | 74 (1.6%) | 80 (2.2%) |
| 40 to 44 Minutes | 270 (5.7%) | 272 (7.6%) |
| 45 to 59 Minutes | 271 (5.8%) | 126 (3.5%) |
| 60 to 89 Minutes | 67 (1.4%) | 75 (2.1%) |
| 90 or more Minutes | 222 (4.7%) | 0 (0.0%) |
Time of Departure to Work by Sex in Horizon City
The most frequent times of departure to work in Horizon City are 6:30 AM to 6:59 AM (1,018, 21.6%) for males and 6:30 AM to 6:59 AM (813, 22.6%) for females.
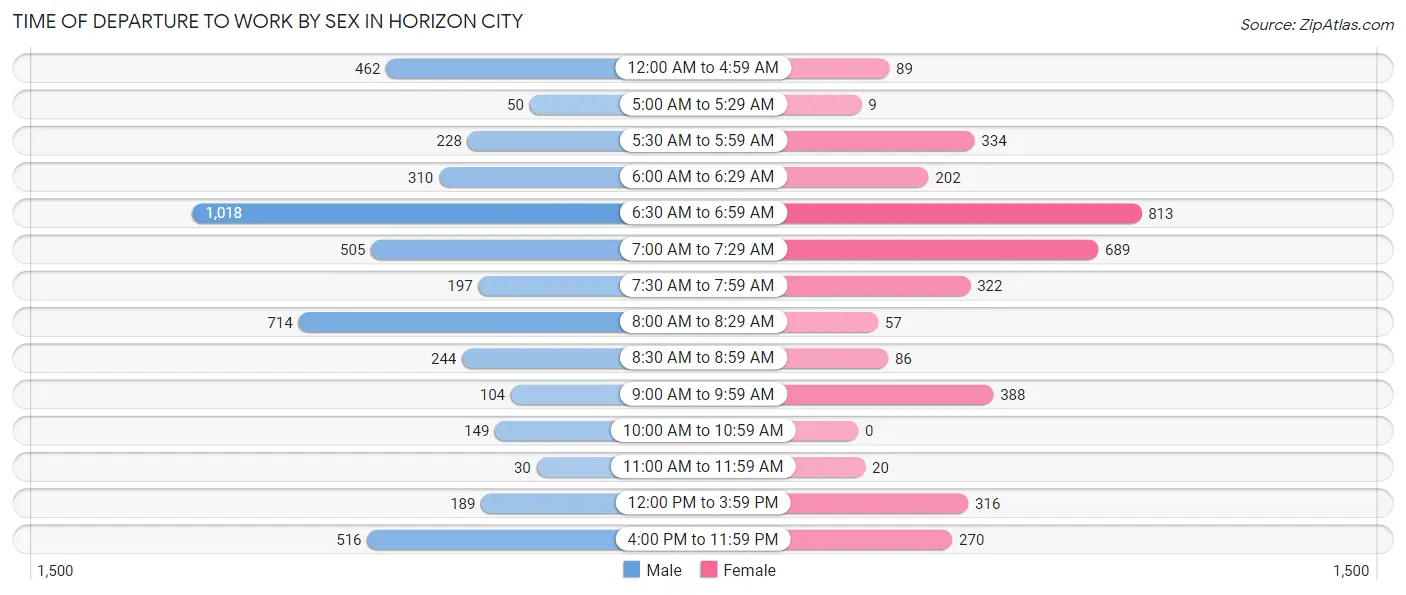
| Time of Departure | Male | Female |
| 12:00 AM to 4:59 AM | 462 (9.8%) | 89 (2.5%) |
| 5:00 AM to 5:29 AM | 50 (1.1%) | 9 (0.3%) |
| 5:30 AM to 5:59 AM | 228 (4.8%) | 334 (9.3%) |
| 6:00 AM to 6:29 AM | 310 (6.6%) | 202 (5.6%) |
| 6:30 AM to 6:59 AM | 1,018 (21.6%) | 813 (22.6%) |
| 7:00 AM to 7:29 AM | 505 (10.7%) | 689 (19.2%) |
| 7:30 AM to 7:59 AM | 197 (4.2%) | 322 (9.0%) |
| 8:00 AM to 8:29 AM | 714 (15.1%) | 57 (1.6%) |
| 8:30 AM to 8:59 AM | 244 (5.2%) | 86 (2.4%) |
| 9:00 AM to 9:59 AM | 104 (2.2%) | 388 (10.8%) |
| 10:00 AM to 10:59 AM | 149 (3.2%) | 0 (0.0%) |
| 11:00 AM to 11:59 AM | 30 (0.6%) | 20 (0.6%) |
| 12:00 PM to 3:59 PM | 189 (4.0%) | 316 (8.8%) |
| 4:00 PM to 11:59 PM | 516 (10.9%) | 270 (7.5%) |
| Total | 4,716 (100.0%) | 3,595 (100.0%) |
Housing Occupancy in Horizon City
Occupancy by Ownership in Horizon City
Of the total 6,654 dwellings in Horizon City, owner-occupied units account for 5,687 (85.5%), while renter-occupied units make up 967 (14.5%).
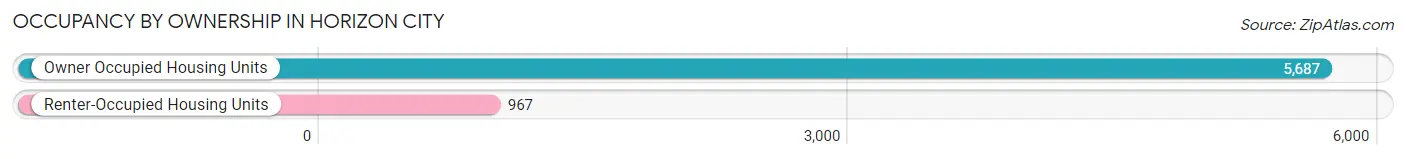
| Occupancy | # Housing Units | % Housing Units |
| Owner Occupied Housing Units | 5,687 | 85.5% |
| Renter-Occupied Housing Units | 967 | 14.5% |
| Total Occupied Housing Units | 6,654 | 100.0% |
Occupancy by Household Size in Horizon City
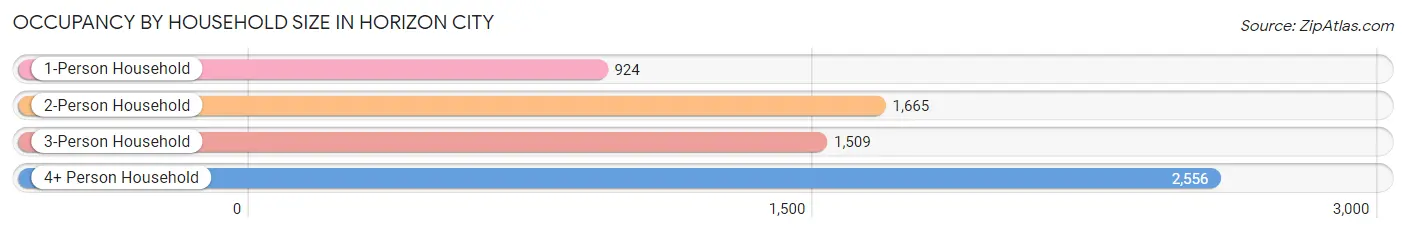
| Household Size | # Housing Units | % Housing Units |
| 1-Person Household | 924 | 13.9% |
| 2-Person Household | 1,665 | 25.0% |
| 3-Person Household | 1,509 | 22.7% |
| 4+ Person Household | 2,556 | 38.4% |
| Total Housing Units | 6,654 | 100.0% |
Occupancy by Ownership by Household Size in Horizon City
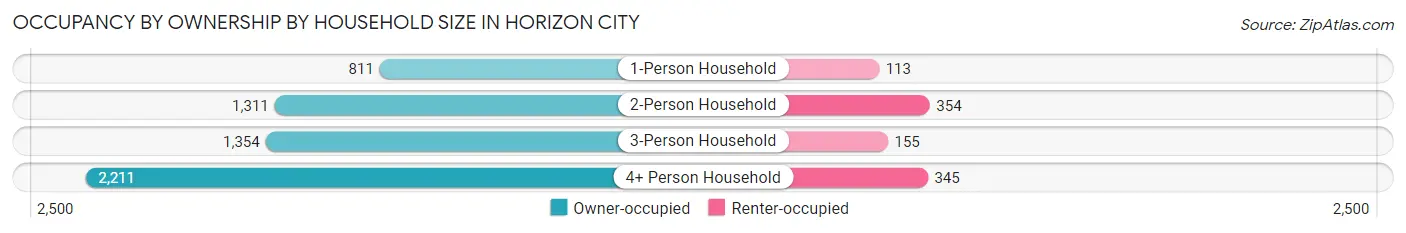
| Household Size | Owner-occupied | Renter-occupied |
| 1-Person Household | 811 (87.8%) | 113 (12.2%) |
| 2-Person Household | 1,311 (78.7%) | 354 (21.3%) |
| 3-Person Household | 1,354 (89.7%) | 155 (10.3%) |
| 4+ Person Household | 2,211 (86.5%) | 345 (13.5%) |
| Total Housing Units | 5,687 (85.5%) | 967 (14.5%) |
Occupancy by Educational Attainment in Horizon City
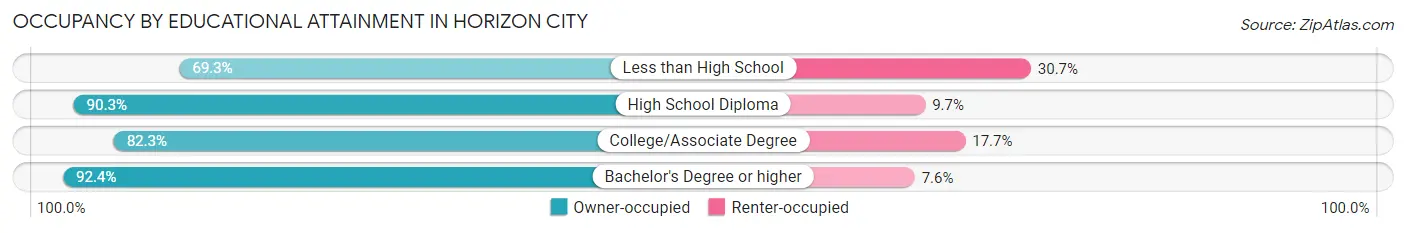
| Household Size | Owner-occupied | Renter-occupied |
| Less than High School | 373 (69.3%) | 165 (30.7%) |
| High School Diploma | 1,346 (90.3%) | 145 (9.7%) |
| College/Associate Degree | 2,493 (82.3%) | 535 (17.7%) |
| Bachelor's Degree or higher | 1,475 (92.4%) | 122 (7.6%) |
Occupancy by Age of Householder in Horizon City
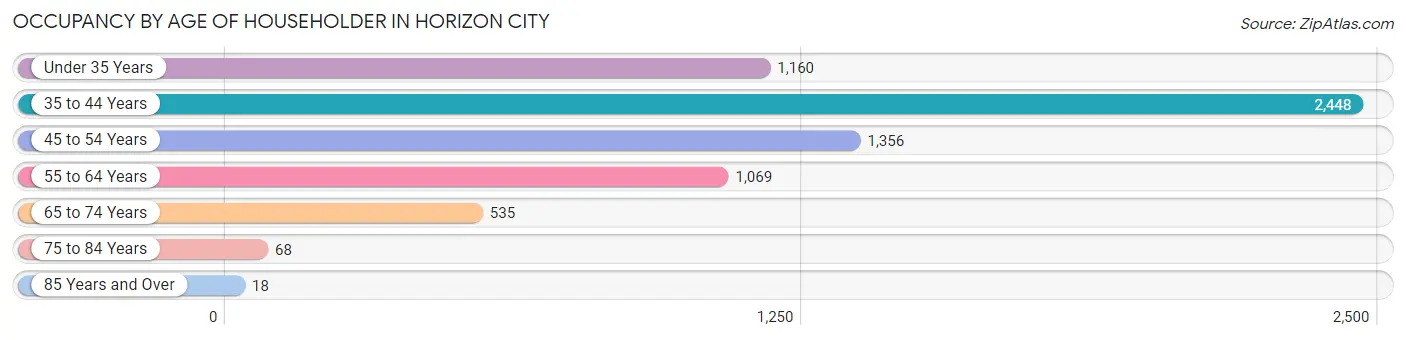
| Age Bracket | # Households | % Households |
| Under 35 Years | 1,160 | 17.4% |
| 35 to 44 Years | 2,448 | 36.8% |
| 45 to 54 Years | 1,356 | 20.4% |
| 55 to 64 Years | 1,069 | 16.1% |
| 65 to 74 Years | 535 | 8.0% |
| 75 to 84 Years | 68 | 1.0% |
| 85 Years and Over | 18 | 0.3% |
| Total | 6,654 | 100.0% |
Housing Finances in Horizon City
Median Income by Occupancy in Horizon City
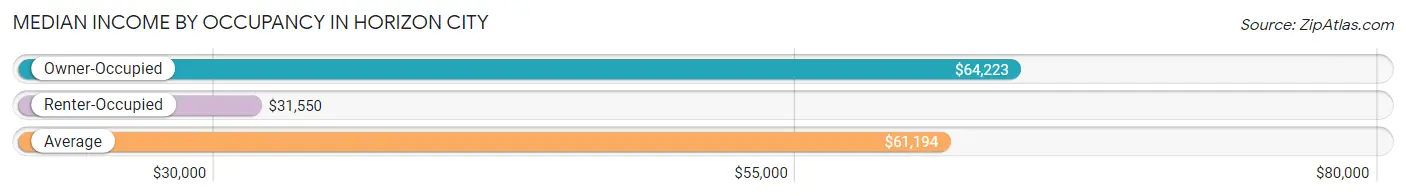
| Occupancy Type | # Households | Median Income |
| Owner-Occupied | 5,687 (85.5%) | $64,223 |
| Renter-Occupied | 967 (14.5%) | $31,550 |
| Average | 6,654 (100.0%) | $61,194 |
Occupancy by Householder Income Bracket in Horizon City
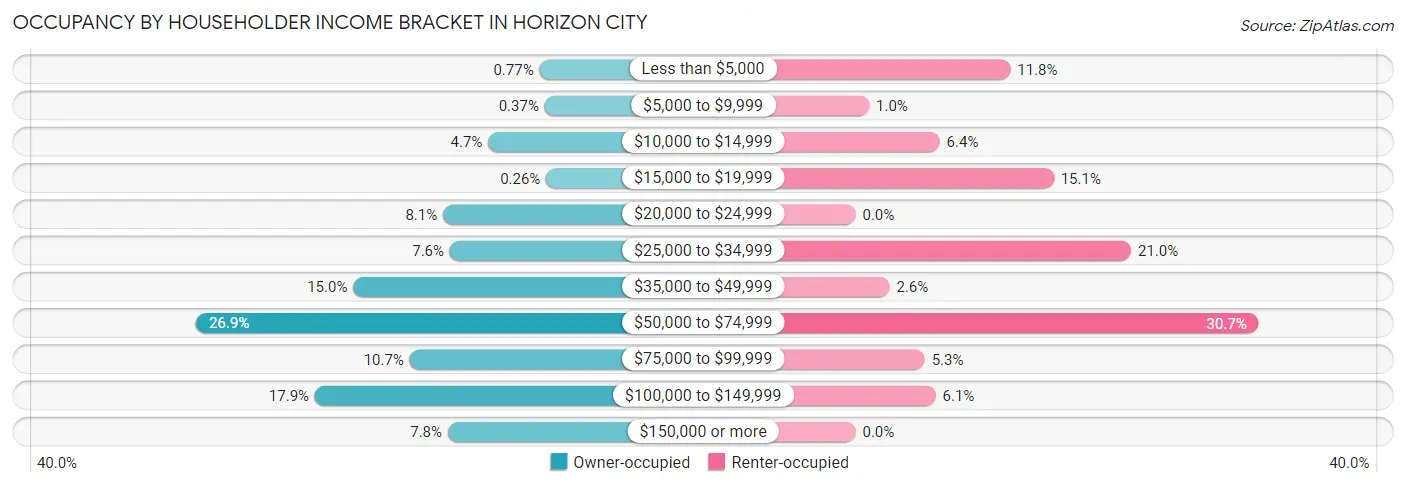
| Income Bracket | Owner-occupied | Renter-occupied |
| Less than $5,000 | 44 (0.8%) | 114 (11.8%) |
| $5,000 to $9,999 | 21 (0.4%) | 10 (1.0%) |
| $10,000 to $14,999 | 266 (4.7%) | 62 (6.4%) |
| $15,000 to $19,999 | 15 (0.3%) | 146 (15.1%) |
| $20,000 to $24,999 | 462 (8.1%) | 0 (0.0%) |
| $25,000 to $34,999 | 432 (7.6%) | 203 (21.0%) |
| $35,000 to $49,999 | 851 (15.0%) | 25 (2.6%) |
| $50,000 to $74,999 | 1,532 (26.9%) | 297 (30.7%) |
| $75,000 to $99,999 | 606 (10.7%) | 51 (5.3%) |
| $100,000 to $149,999 | 1,017 (17.9%) | 59 (6.1%) |
| $150,000 or more | 441 (7.7%) | 0 (0.0%) |
| Total | 5,687 (100.0%) | 967 (100.0%) |
Monthly Housing Cost Tiers in Horizon City
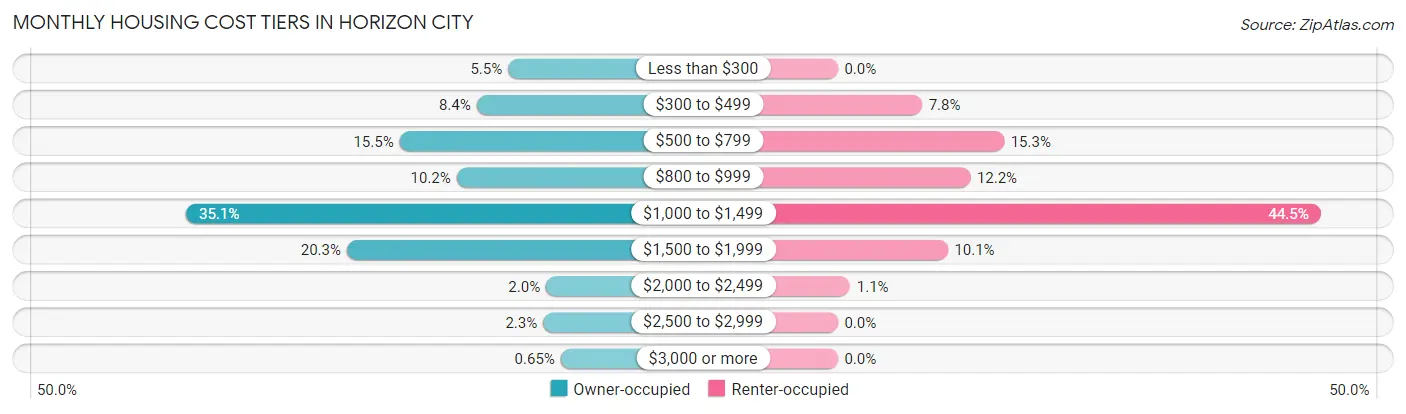
| Monthly Cost | Owner-occupied | Renter-occupied |
| Less than $300 | 312 (5.5%) | 0 (0.0%) |
| $300 to $499 | 477 (8.4%) | 75 (7.8%) |
| $500 to $799 | 881 (15.5%) | 148 (15.3%) |
| $800 to $999 | 582 (10.2%) | 118 (12.2%) |
| $1,000 to $1,499 | 1,998 (35.1%) | 430 (44.5%) |
| $1,500 to $1,999 | 1,157 (20.3%) | 98 (10.1%) |
| $2,000 to $2,499 | 114 (2.0%) | 11 (1.1%) |
| $2,500 to $2,999 | 129 (2.3%) | 0 (0.0%) |
| $3,000 or more | 37 (0.6%) | 0 (0.0%) |
| Total | 5,687 (100.0%) | 967 (100.0%) |
Physical Housing Characteristics in Horizon City
Housing Structures in Horizon City
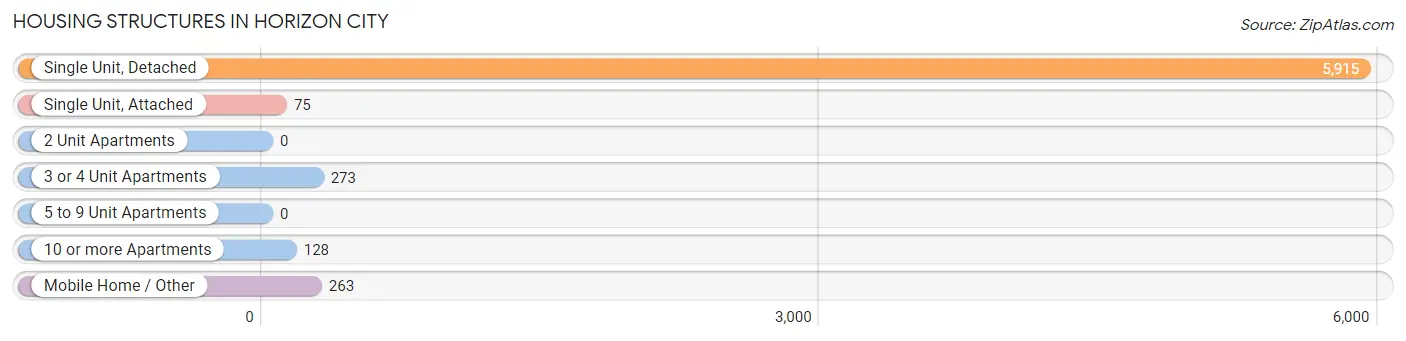
| Structure Type | # Housing Units | % Housing Units |
| Single Unit, Detached | 5,915 | 88.9% |
| Single Unit, Attached | 75 | 1.1% |
| 2 Unit Apartments | 0 | 0.0% |
| 3 or 4 Unit Apartments | 273 | 4.1% |
| 5 to 9 Unit Apartments | 0 | 0.0% |
| 10 or more Apartments | 128 | 1.9% |
| Mobile Home / Other | 263 | 4.0% |
| Total | 6,654 | 100.0% |
Housing Structures by Occupancy in Horizon City
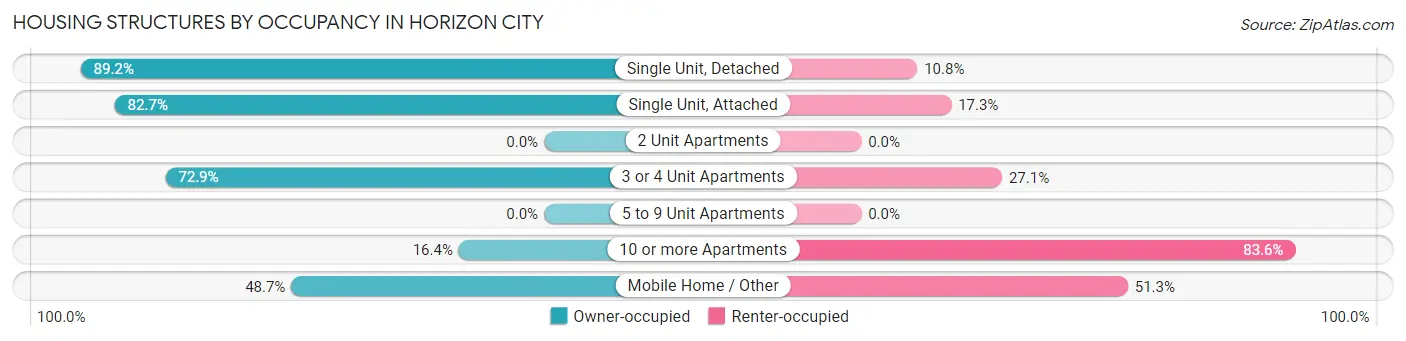
| Structure Type | Owner-occupied | Renter-occupied |
| Single Unit, Detached | 5,277 (89.2%) | 638 (10.8%) |
| Single Unit, Attached | 62 (82.7%) | 13 (17.3%) |
| 2 Unit Apartments | 0 (0.0%) | 0 (0.0%) |
| 3 or 4 Unit Apartments | 199 (72.9%) | 74 (27.1%) |
| 5 to 9 Unit Apartments | 0 (0.0%) | 0 (0.0%) |
| 10 or more Apartments | 21 (16.4%) | 107 (83.6%) |
| Mobile Home / Other | 128 (48.7%) | 135 (51.3%) |
| Total | 5,687 (85.5%) | 967 (14.5%) |
Housing Structures by Number of Rooms in Horizon City
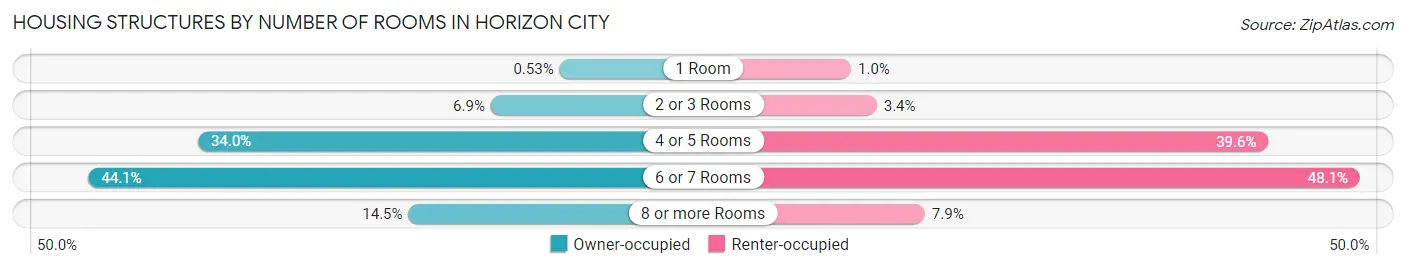
| Number of Rooms | Owner-occupied | Renter-occupied |
| 1 Room | 30 (0.5%) | 10 (1.0%) |
| 2 or 3 Rooms | 392 (6.9%) | 33 (3.4%) |
| 4 or 5 Rooms | 1,932 (34.0%) | 383 (39.6%) |
| 6 or 7 Rooms | 2,508 (44.1%) | 465 (48.1%) |
| 8 or more Rooms | 825 (14.5%) | 76 (7.9%) |
| Total | 5,687 (100.0%) | 967 (100.0%) |
Housing Structure by Heating Type in Horizon City
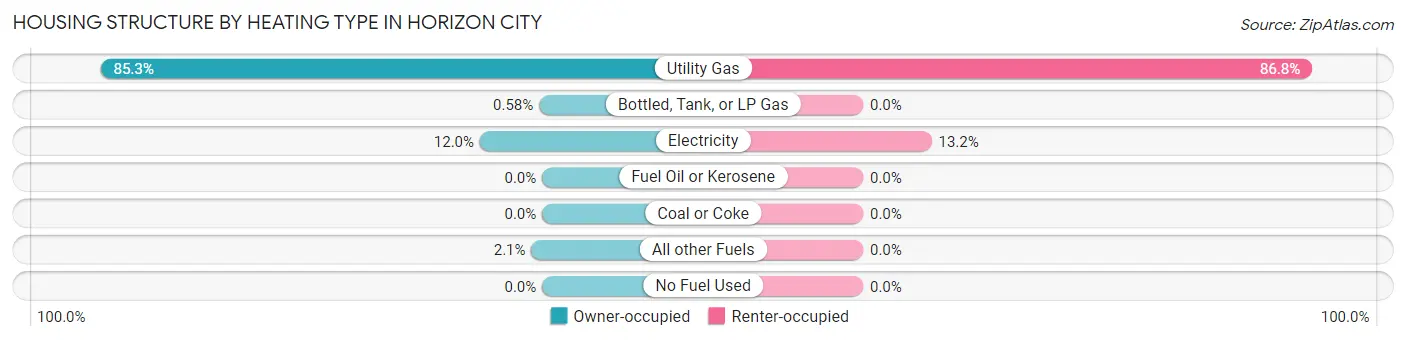
| Heating Type | Owner-occupied | Renter-occupied |
| Utility Gas | 4,852 (85.3%) | 839 (86.8%) |
| Bottled, Tank, or LP Gas | 33 (0.6%) | 0 (0.0%) |
| Electricity | 684 (12.0%) | 128 (13.2%) |
| Fuel Oil or Kerosene | 0 (0.0%) | 0 (0.0%) |
| Coal or Coke | 0 (0.0%) | 0 (0.0%) |
| All other Fuels | 118 (2.1%) | 0 (0.0%) |
| No Fuel Used | 0 (0.0%) | 0 (0.0%) |
| Total | 5,687 (100.0%) | 967 (100.0%) |
Household Vehicle Usage in Horizon City
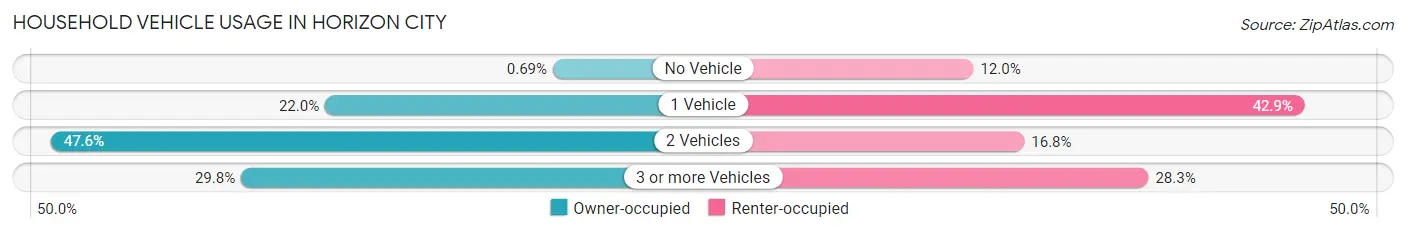
| Vehicles per Household | Owner-occupied | Renter-occupied |
| No Vehicle | 39 (0.7%) | 116 (12.0%) |
| 1 Vehicle | 1,249 (22.0%) | 415 (42.9%) |
| 2 Vehicles | 2,704 (47.5%) | 162 (16.8%) |
| 3 or more Vehicles | 1,695 (29.8%) | 274 (28.3%) |
| Total | 5,687 (100.0%) | 967 (100.0%) |
Real Estate & Mortgages in Horizon City
Real Estate and Mortgage Overview in Horizon City
| Characteristic | Without Mortgage | With Mortgage |
| Housing Units | 1,702 | 3,985 |
| Median Property Value | $135,700 | $140,800 |
| Median Household Income | $53,594 | $322 |
| Monthly Housing Costs | $536 | $37 |
| Real Estate Taxes | $3,859 | $198 |
Property Value by Mortgage Status in Horizon City
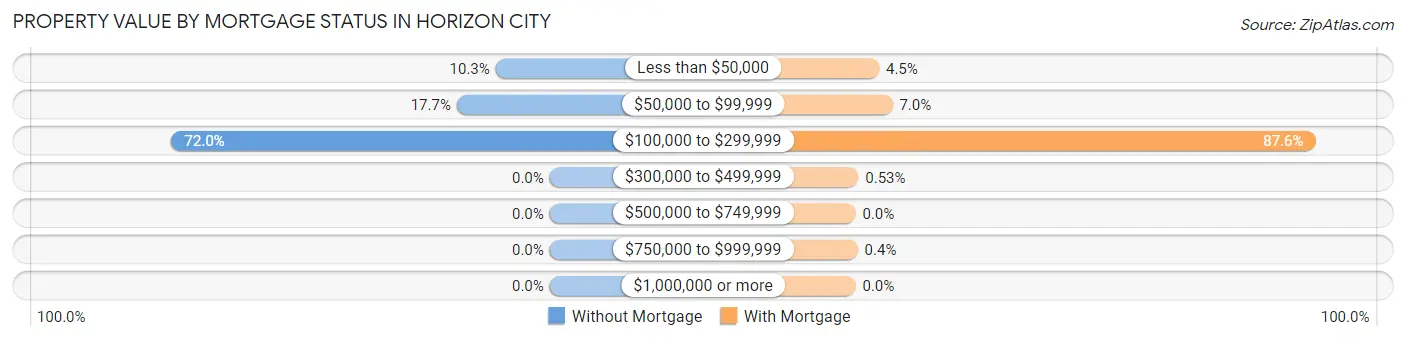
| Property Value | Without Mortgage | With Mortgage |
| Less than $50,000 | 175 (10.3%) | 178 (4.5%) |
| $50,000 to $99,999 | 301 (17.7%) | 280 (7.0%) |
| $100,000 to $299,999 | 1,226 (72.0%) | 3,490 (87.6%) |
| $300,000 to $499,999 | 0 (0.0%) | 21 (0.5%) |
| $500,000 to $749,999 | 0 (0.0%) | 0 (0.0%) |
| $750,000 to $999,999 | 0 (0.0%) | 16 (0.4%) |
| $1,000,000 or more | 0 (0.0%) | 0 (0.0%) |
| Total | 1,702 (100.0%) | 3,985 (100.0%) |
Household Income by Mortgage Status in Horizon City
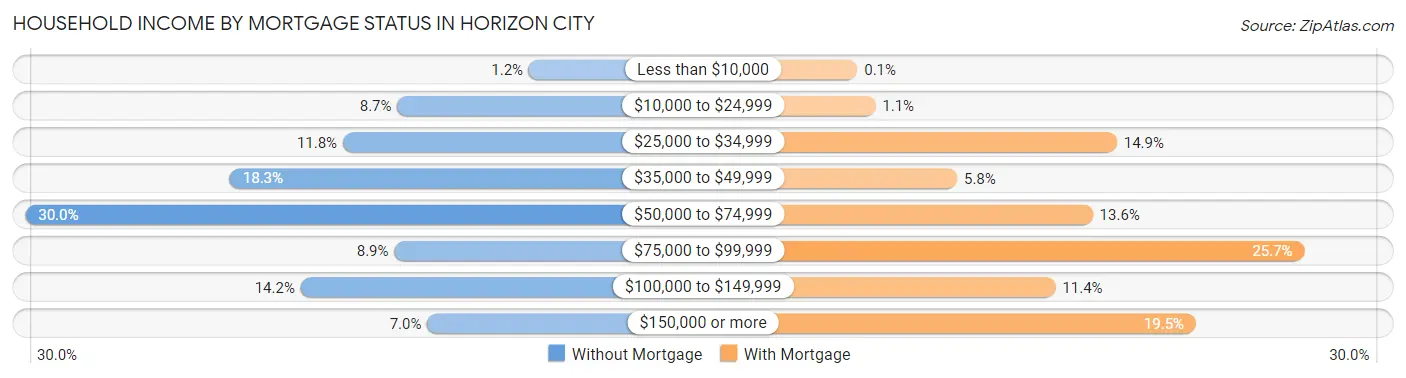
| Household Income | Without Mortgage | With Mortgage |
| Less than $10,000 | 20 (1.2%) | 4 (0.1%) |
| $10,000 to $24,999 | 148 (8.7%) | 45 (1.1%) |
| $25,000 to $34,999 | 201 (11.8%) | 595 (14.9%) |
| $35,000 to $49,999 | 311 (18.3%) | 231 (5.8%) |
| $50,000 to $74,999 | 510 (30.0%) | 540 (13.6%) |
| $75,000 to $99,999 | 151 (8.9%) | 1,022 (25.7%) |
| $100,000 to $149,999 | 242 (14.2%) | 455 (11.4%) |
| $150,000 or more | 119 (7.0%) | 775 (19.5%) |
| Total | 1,702 (100.0%) | 3,985 (100.0%) |
Property Value to Household Income Ratio in Horizon City
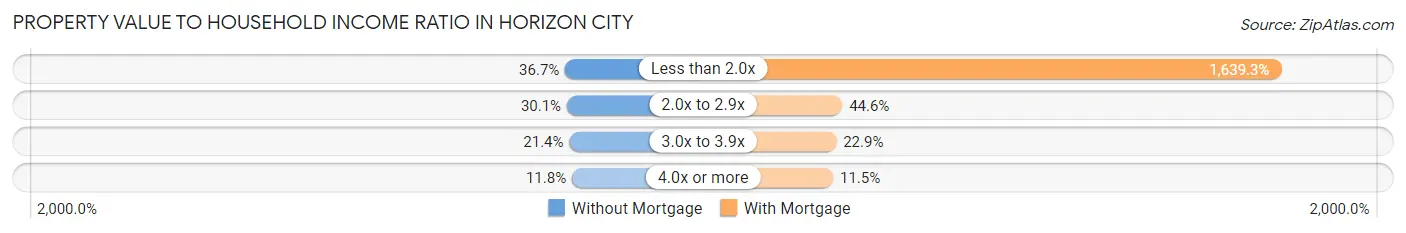
| Value-to-Income Ratio | Without Mortgage | With Mortgage |
| Less than 2.0x | 624 (36.7%) | 65,327 (1,639.3%) |
| 2.0x to 2.9x | 513 (30.1%) | 1,778 (44.6%) |
| 3.0x to 3.9x | 364 (21.4%) | 914 (22.9%) |
| 4.0x or more | 201 (11.8%) | 458 (11.5%) |
| Total | 1,702 (100.0%) | 3,985 (100.0%) |
Real Estate Taxes by Mortgage Status in Horizon City
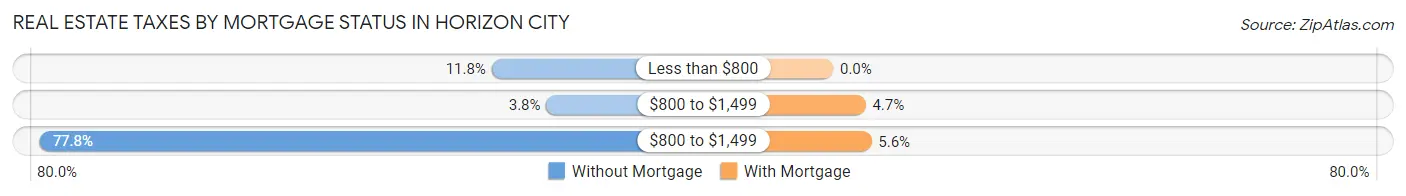
| Property Taxes | Without Mortgage | With Mortgage |
| Less than $800 | 200 (11.7%) | 0 (0.0%) |
| $800 to $1,499 | 64 (3.8%) | 189 (4.7%) |
| $800 to $1,499 | 1,324 (77.8%) | 223 (5.6%) |
| Total | 1,702 (100.0%) | 3,985 (100.0%) |
Health & Disability in Horizon City
Health Insurance Coverage by Age in Horizon City
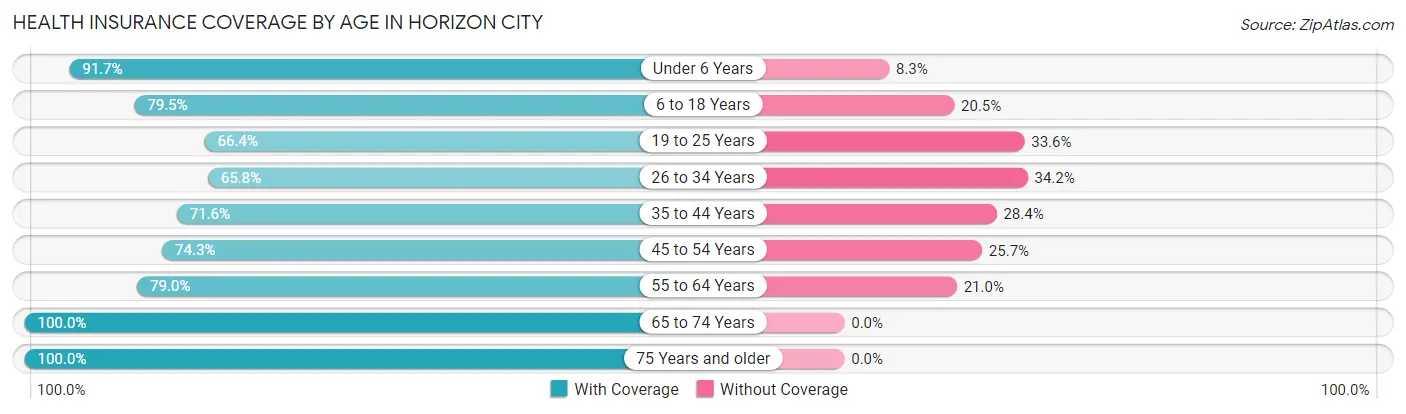
| Age Bracket | With Coverage | Without Coverage |
| Under 6 Years | 2,199 (91.7%) | 200 (8.3%) |
| 6 to 18 Years | 4,655 (79.5%) | 1,199 (20.5%) |
| 19 to 25 Years | 1,360 (66.4%) | 687 (33.6%) |
| 26 to 34 Years | 1,715 (65.8%) | 890 (34.2%) |
| 35 to 44 Years | 3,068 (71.6%) | 1,216 (28.4%) |
| 45 to 54 Years | 1,657 (74.3%) | 572 (25.7%) |
| 55 to 64 Years | 1,432 (79.0%) | 380 (21.0%) |
| 65 to 74 Years | 967 (100.0%) | 0 (0.0%) |
| 75 Years and older | 286 (100.0%) | 0 (0.0%) |
| Total | 17,339 (77.1%) | 5,144 (22.9%) |
Health Insurance Coverage by Citizenship Status in Horizon City
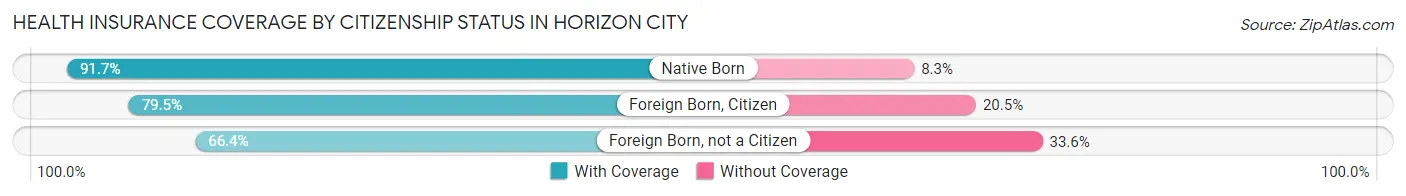
| Citizenship Status | With Coverage | Without Coverage |
| Native Born | 2,199 (91.7%) | 200 (8.3%) |
| Foreign Born, Citizen | 4,655 (79.5%) | 1,199 (20.5%) |
| Foreign Born, not a Citizen | 1,360 (66.4%) | 687 (33.6%) |
Health Insurance Coverage by Household Income in Horizon City
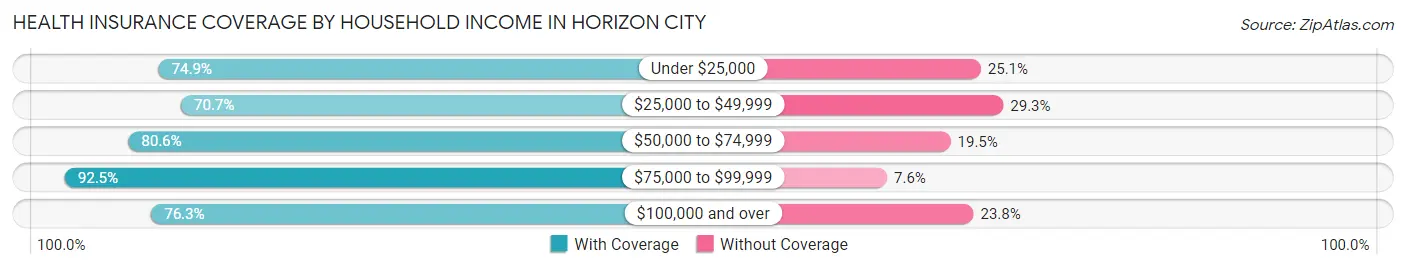
| Household Income | With Coverage | Without Coverage |
| Under $25,000 | 2,152 (74.9%) | 722 (25.1%) |
| $25,000 to $49,999 | 4,005 (70.7%) | 1,662 (29.3%) |
| $50,000 to $74,999 | 4,540 (80.5%) | 1,096 (19.5%) |
| $75,000 to $99,999 | 1,763 (92.4%) | 144 (7.5%) |
| $100,000 and over | 4,879 (76.2%) | 1,520 (23.7%) |
Public vs Private Health Insurance Coverage by Age in Horizon City
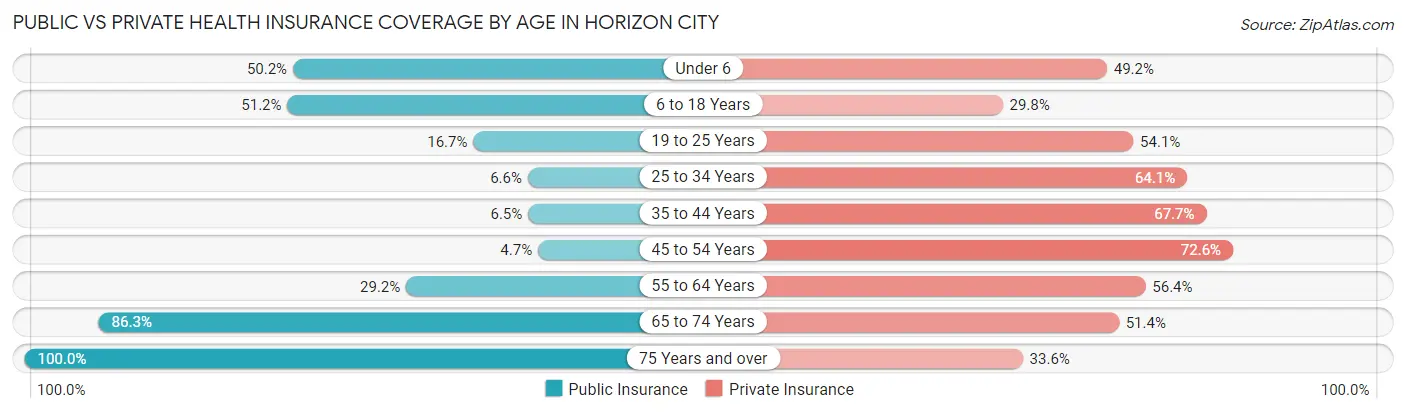
| Age Bracket | Public Insurance | Private Insurance |
| Under 6 | 1,204 (50.2%) | 1,180 (49.2%) |
| 6 to 18 Years | 2,999 (51.2%) | 1,746 (29.8%) |
| 19 to 25 Years | 342 (16.7%) | 1,107 (54.1%) |
| 25 to 34 Years | 172 (6.6%) | 1,669 (64.1%) |
| 35 to 44 Years | 280 (6.5%) | 2,898 (67.6%) |
| 45 to 54 Years | 105 (4.7%) | 1,618 (72.6%) |
| 55 to 64 Years | 529 (29.2%) | 1,021 (56.4%) |
| 65 to 74 Years | 834 (86.3%) | 497 (51.4%) |
| 75 Years and over | 286 (100.0%) | 96 (33.6%) |
| Total | 6,751 (30.0%) | 11,832 (52.6%) |
Disability Status by Sex by Age in Horizon City
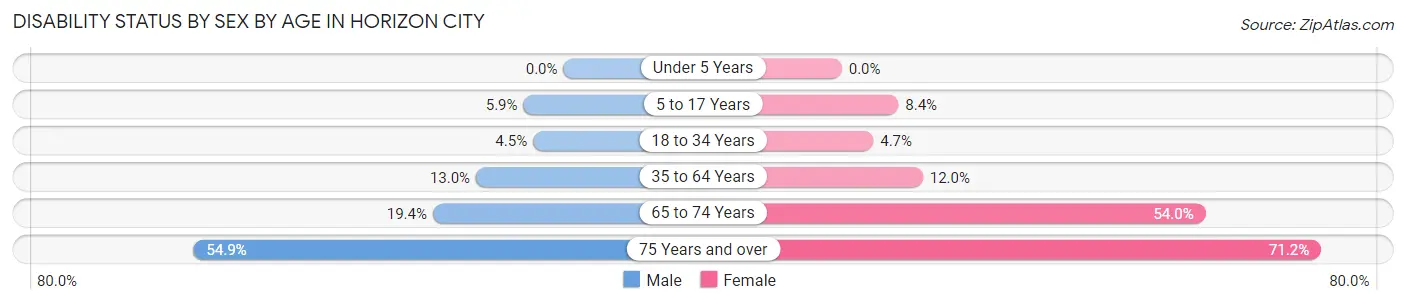
| Age Bracket | Male | Female |
| Under 5 Years | 0 (0.0%) | 0 (0.0%) |
| 5 to 17 Years | 207 (5.9%) | 212 (8.4%) |
| 18 to 34 Years | 111 (4.5%) | 127 (4.7%) |
| 35 to 64 Years | 578 (13.0%) | 466 (12.0%) |
| 65 to 74 Years | 93 (19.4%) | 263 (54.0%) |
| 75 Years and over | 39 (54.9%) | 153 (71.2%) |
Disability Class by Sex by Age in Horizon City
Disability Class: Hearing Difficulty
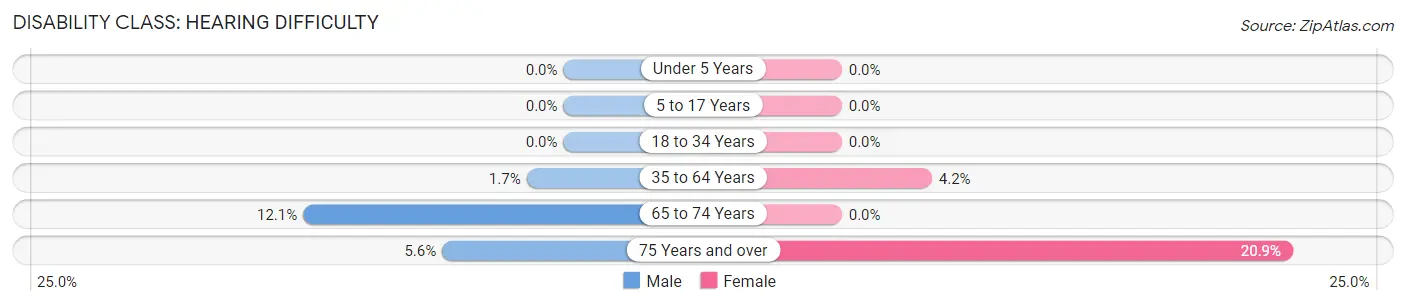
| Age Bracket | Male | Female |
| Under 5 Years | 0 (0.0%) | 0 (0.0%) |
| 5 to 17 Years | 0 (0.0%) | 0 (0.0%) |
| 18 to 34 Years | 0 (0.0%) | 0 (0.0%) |
| 35 to 64 Years | 76 (1.7%) | 162 (4.2%) |
| 65 to 74 Years | 58 (12.1%) | 0 (0.0%) |
| 75 Years and over | 4 (5.6%) | 45 (20.9%) |
Disability Class: Vision Difficulty
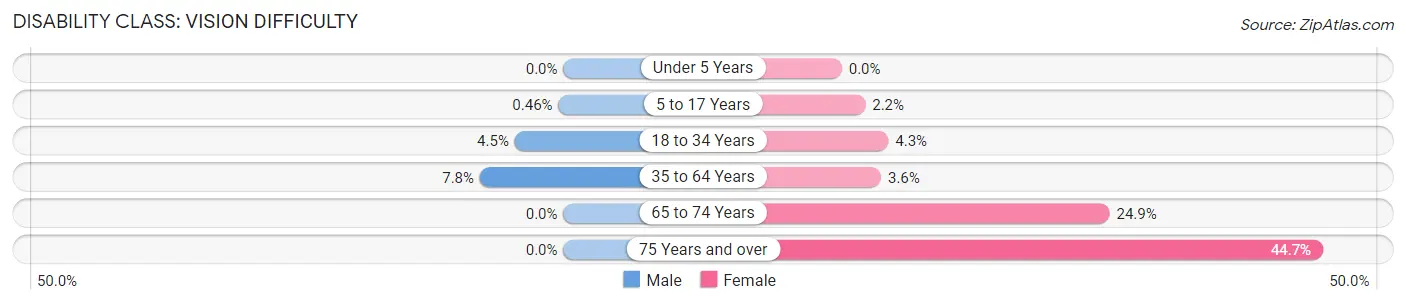
| Age Bracket | Male | Female |
| Under 5 Years | 0 (0.0%) | 0 (0.0%) |
| 5 to 17 Years | 16 (0.5%) | 55 (2.2%) |
| 18 to 34 Years | 111 (4.5%) | 117 (4.3%) |
| 35 to 64 Years | 345 (7.7%) | 141 (3.6%) |
| 65 to 74 Years | 0 (0.0%) | 121 (24.8%) |
| 75 Years and over | 0 (0.0%) | 96 (44.7%) |
Disability Class: Cognitive Difficulty
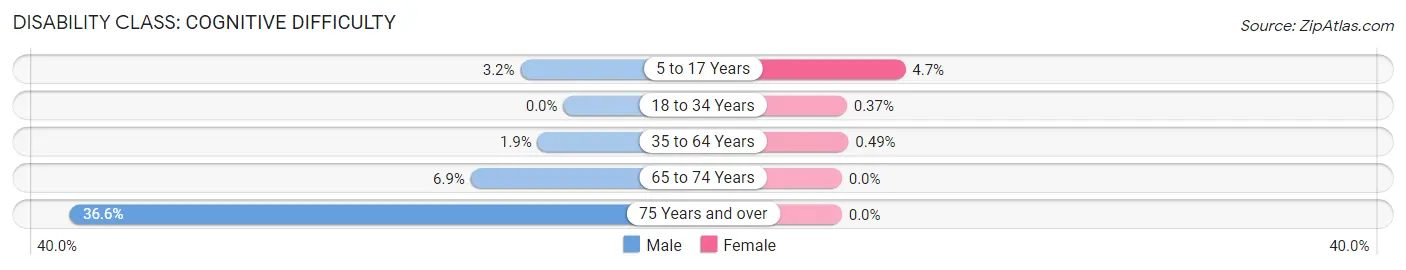
| Age Bracket | Male | Female |
| 5 to 17 Years | 111 (3.2%) | 119 (4.7%) |
| 18 to 34 Years | 0 (0.0%) | 10 (0.4%) |
| 35 to 64 Years | 85 (1.9%) | 19 (0.5%) |
| 65 to 74 Years | 33 (6.9%) | 0 (0.0%) |
| 75 Years and over | 26 (36.6%) | 0 (0.0%) |
Disability Class: Ambulatory Difficulty
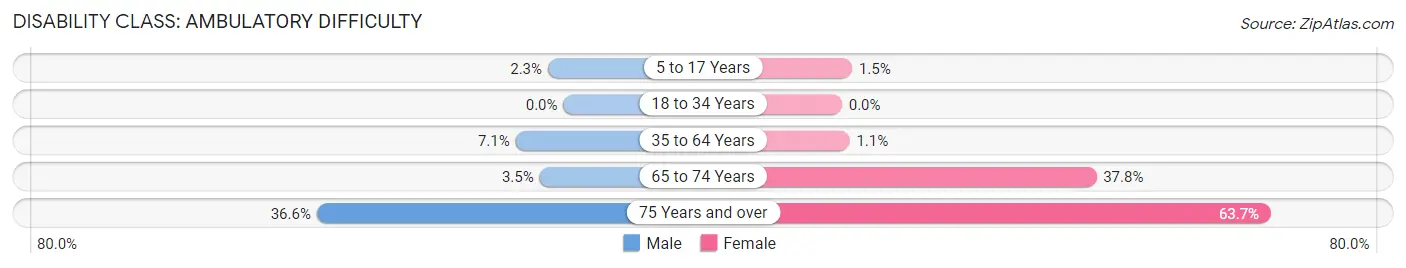
| Age Bracket | Male | Female |
| 5 to 17 Years | 80 (2.3%) | 38 (1.5%) |
| 18 to 34 Years | 0 (0.0%) | 0 (0.0%) |
| 35 to 64 Years | 316 (7.1%) | 44 (1.1%) |
| 65 to 74 Years | 17 (3.5%) | 184 (37.8%) |
| 75 Years and over | 26 (36.6%) | 137 (63.7%) |
Disability Class: Self-Care Difficulty
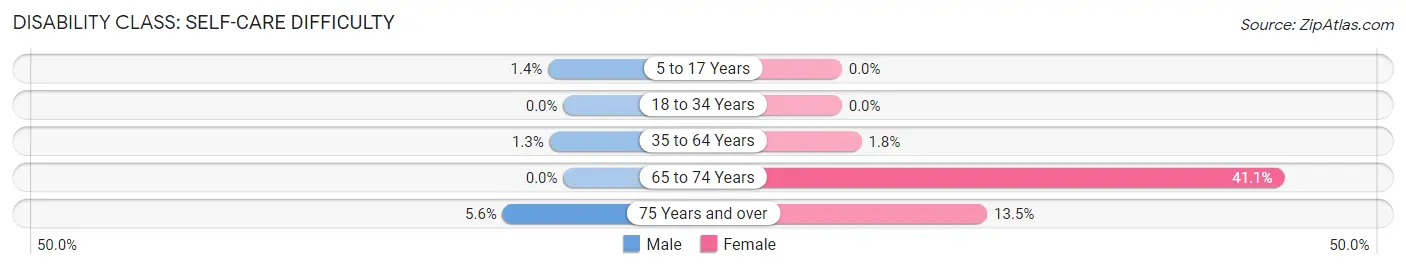
| Age Bracket | Male | Female |
| 5 to 17 Years | 49 (1.4%) | 0 (0.0%) |
| 18 to 34 Years | 0 (0.0%) | 0 (0.0%) |
| 35 to 64 Years | 57 (1.3%) | 71 (1.8%) |
| 65 to 74 Years | 0 (0.0%) | 200 (41.1%) |
| 75 Years and over | 4 (5.6%) | 29 (13.5%) |
Technology Access in Horizon City
Computing Device Access in Horizon City
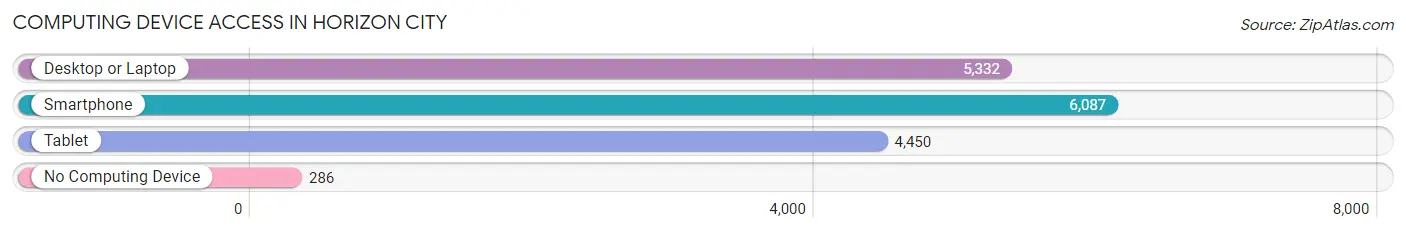
| Device Type | # Households | % Households |
| Desktop or Laptop | 5,332 | 80.1% |
| Smartphone | 6,087 | 91.5% |
| Tablet | 4,450 | 66.9% |
| No Computing Device | 286 | 4.3% |
| Total | 6,654 | 100.0% |
Internet Access in Horizon City
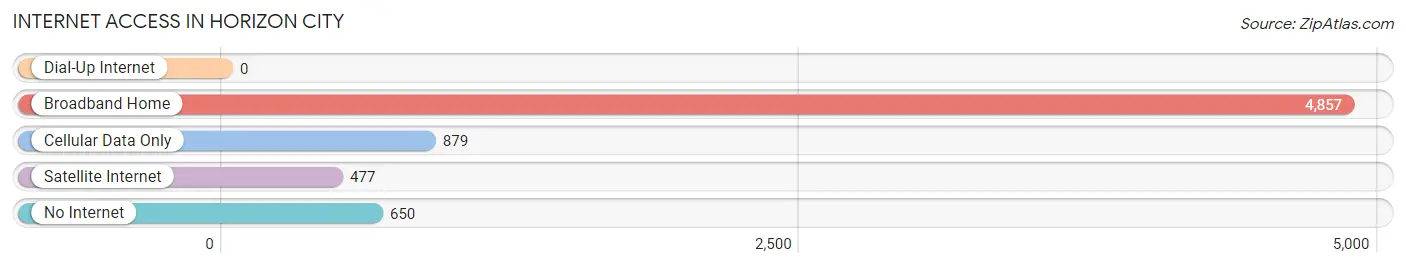
| Internet Type | # Households | % Households |
| Dial-Up Internet | 0 | 0.0% |
| Broadband Home | 4,857 | 73.0% |
| Cellular Data Only | 879 | 13.2% |
| Satellite Internet | 477 | 7.2% |
| No Internet | 650 | 9.8% |
| Total | 6,654 | 100.0% |
Horizon City Summary
Horizon City is a city located in El Paso County, Texas, United States. It is part of the El Paso Metropolitan Statistical Area. The population was estimated to be 16,735 in 2019.
History
Horizon City was founded in the late 1950s by developer Robert H. Anderson. Anderson had purchased a large tract of land in the area and began developing it into a residential community. The city was incorporated in 1961 and was named after the nearby mountain range, the Horizon Mountains.
Geography
Horizon City is located in El Paso County, Texas, United States. It is part of the El Paso Metropolitan Statistical Area. The city is situated in the Chihuahuan Desert, at an elevation of 3,845 feet (1,172 m). The city covers an area of 8.3 square miles (21.5 km2).
Economy
Horizon City's economy is largely based on retail and services. The city is home to several large retail stores, including Walmart, Target, and Lowe's. The city also has a number of restaurants, banks, and other businesses.
The city is also home to several industrial and manufacturing companies, including El Paso Electric, El Paso Refinery, and El Paso Natural Gas. The city is also home to the Horizon City Industrial Park, which is home to several businesses, including a distribution center for the United States Postal Service.
Demographics
As of the 2019 census, the population of Horizon City was estimated to be 16,735. The racial makeup of the city was 79.2% White, 1.2% African American, 0.7% Native American, 0.7% Asian, 0.1% Pacific Islander, 15.3% from other races, and 3.0% from two or more races. Hispanic or Latino of any race were 81.2% of the population.
The median household income in Horizon City was $37,945, and the median family income was $41,945. The per capita income for the city was $17,845. About 17.2% of families and 20.2% of the population were below the poverty line, including 28.2% of those under age 18 and 11.2% of those age 65 or over.
Conclusion
Horizon City is a city located in El Paso County, Texas, United States. It is part of the El Paso Metropolitan Statistical Area. The population was estimated to be 16,735 in 2019. The city was founded in the late 1950s by developer Robert H. Anderson and was incorporated in 1961. The economy of Horizon City is largely based on retail and services, with several large retail stores, restaurants, banks, and industrial and manufacturing companies located in the city. The population of Horizon City is largely Hispanic or Latino, with a median household income of $37,945 and a median family income of $41,945.
Common Questions
What is Per Capita Income in Horizon City?
Per Capita income in Horizon City is $21,135.
What is the Median Family Income in Horizon City?
Median Family Income in Horizon City is $59,171.
What is the Median Household income in Horizon City?
Median Household Income in Horizon City is $61,194.
What is Income or Wage Gap in Horizon City?
Income or Wage Gap in Horizon City is 39.0%.
Women in Horizon City earn 61.0 cents for every dollar earned by a man.
What is Family Income Deficit in Horizon City?
Family Income Deficit in Horizon City is $8,643.
Families that are below poverty line in Horizon City earn $8,643 less on average than the poverty threshold level.
What is Inequality or Gini Index in Horizon City?
Inequality or Gini Index in Horizon City is 0.38.
What is the Total Population of Horizon City?
Total Population of Horizon City is 22,537.
What is the Total Male Population of Horizon City?
Total Male Population of Horizon City is 11,922.
What is the Total Female Population of Horizon City?
Total Female Population of Horizon City is 10,615.
What is the Ratio of Males per 100 Females in Horizon City?
There are 112.31 Males per 100 Females in Horizon City.
What is the Ratio of Females per 100 Males in Horizon City?
There are 89.04 Females per 100 Males in Horizon City.
What is the Median Population Age in Horizon City?
Median Population Age in Horizon City is 29.3 Years.
What is the Average Family Size in Horizon City
Average Family Size in Horizon City is 3.8 People.
What is the Average Household Size in Horizon City
Average Household Size in Horizon City is 3.4 People.
How Large is the Labor Force in Horizon City?
There are 10,332 People in the Labor Forcein in Horizon City.
What is the Percentage of People in the Labor Force in Horizon City?
64.7% of People are in the Labor Force in Horizon City.
What is the Unemployment Rate in Horizon City?
Unemployment Rate in Horizon City is 10.0%.