Paint Rock, TX Map & Demographics
Paint Rock Map
Paint Rock Overview
$21,160
PER CAPITA INCOME
$63,942
AVG FAMILY INCOME
$63,365
AVG HOUSEHOLD INCOME
26.4%
WAGE / INCOME GAP [ % ]
73.6¢/ $1
WAGE / INCOME GAP [ $ ]
0.31
INEQUALITY / GINI INDEX
310
TOTAL POPULATION
148
MALE POPULATION
162
FEMALE POPULATION
91.36
MALES / 100 FEMALES
109.46
FEMALES / 100 MALES
29.9
MEDIAN AGE
4.7
AVG FAMILY SIZE
4.4
AVG HOUSEHOLD SIZE
112
LABOR FORCE [ PEOPLE ]
61.2%
PERCENT IN LABOR FORCE
Paint Rock Zip Codes
Paint Rock Area Codes
Income in Paint Rock
Income Overview in Paint Rock
Per Capita Income in Paint Rock is $21,160, while median incomes of families and households are $63,942 and $63,365 respectively.
| Characteristic | Number | Measure |
| Per Capita Income | 310 | $21,160 |
| Median Family Income | 65 | $63,942 |
| Mean Family Income | 65 | $69,795 |
| Median Household Income | 71 | $63,365 |
| Mean Household Income | 71 | $67,827 |
| Income Deficit | 65 | $0 |
| Wage / Income Gap (%) | 310 | 26.35% |
| Wage / Income Gap ($) | 310 | 73.65¢ per $1 |
| Gini / Inequality Index | 310 | 0.31 |
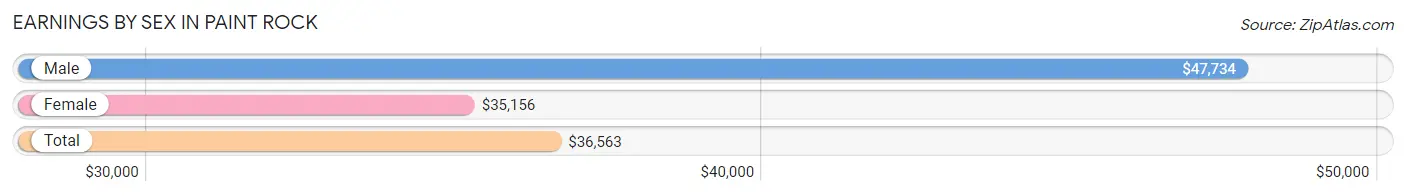
Earnings by Sex in Paint Rock
Average Earnings in Paint Rock are $36,563, $47,734 for men and $35,156 for women, a difference of 26.4%.
| Sex | Number | Average Earnings |
| Male | 51 (44.7%) | $47,734 |
| Female | 63 (55.3%) | $35,156 |
| Total | 114 (100.0%) | $36,563 |
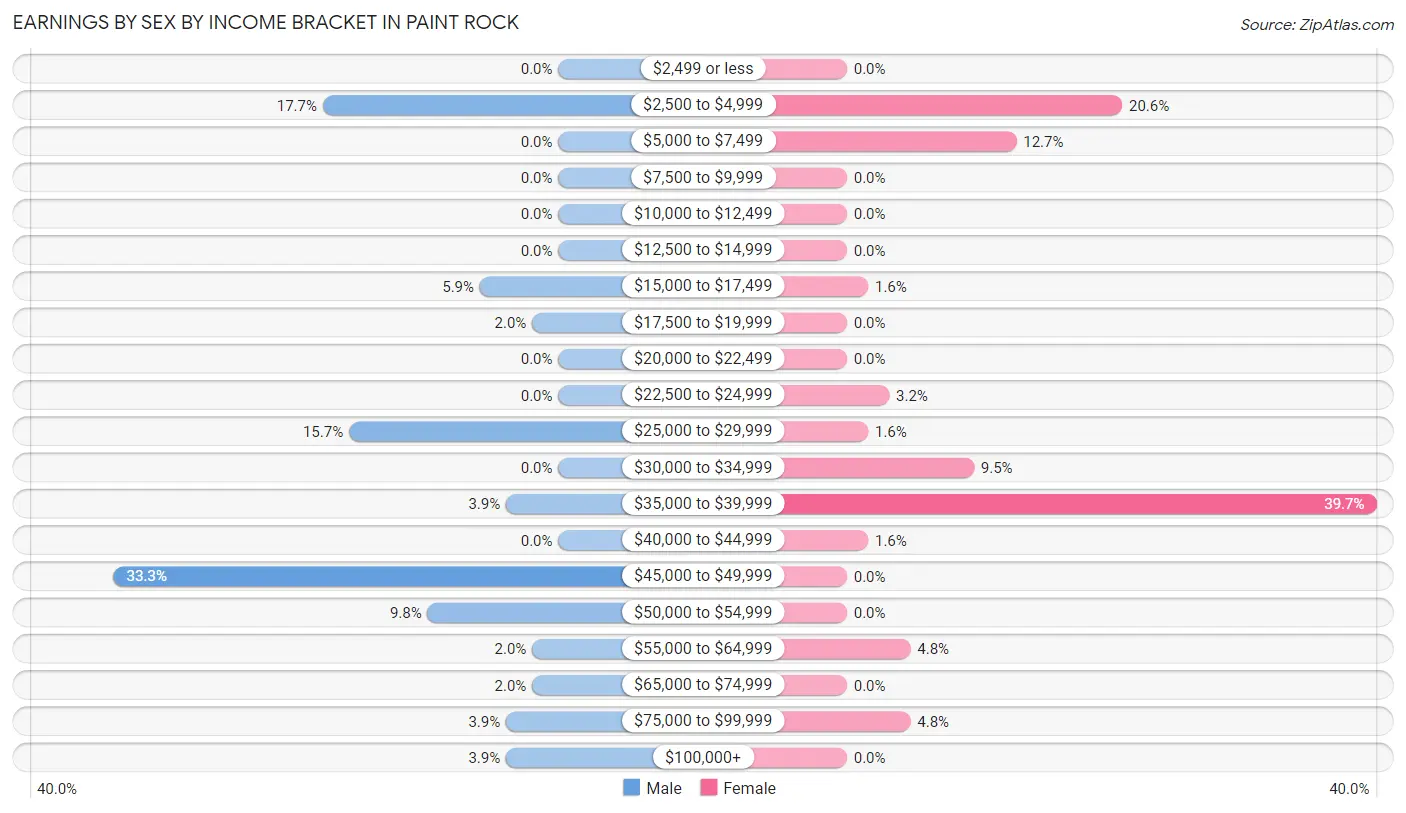
Earnings by Sex by Income Bracket in Paint Rock
The most common earnings brackets in Paint Rock are $45,000 to $49,999 for men (17 | 33.3%) and $35,000 to $39,999 for women (25 | 39.7%).
| Income | Male | Female |
| $2,499 or less | 0 (0.0%) | 0 (0.0%) |
| $2,500 to $4,999 | 9 (17.6%) | 13 (20.6%) |
| $5,000 to $7,499 | 0 (0.0%) | 8 (12.7%) |
| $7,500 to $9,999 | 0 (0.0%) | 0 (0.0%) |
| $10,000 to $12,499 | 0 (0.0%) | 0 (0.0%) |
| $12,500 to $14,999 | 0 (0.0%) | 0 (0.0%) |
| $15,000 to $17,499 | 3 (5.9%) | 1 (1.6%) |
| $17,500 to $19,999 | 1 (2.0%) | 0 (0.0%) |
| $20,000 to $22,499 | 0 (0.0%) | 0 (0.0%) |
| $22,500 to $24,999 | 0 (0.0%) | 2 (3.2%) |
| $25,000 to $29,999 | 8 (15.7%) | 1 (1.6%) |
| $30,000 to $34,999 | 0 (0.0%) | 6 (9.5%) |
| $35,000 to $39,999 | 2 (3.9%) | 25 (39.7%) |
| $40,000 to $44,999 | 0 (0.0%) | 1 (1.6%) |
| $45,000 to $49,999 | 17 (33.3%) | 0 (0.0%) |
| $50,000 to $54,999 | 5 (9.8%) | 0 (0.0%) |
| $55,000 to $64,999 | 1 (2.0%) | 3 (4.8%) |
| $65,000 to $74,999 | 1 (2.0%) | 0 (0.0%) |
| $75,000 to $99,999 | 2 (3.9%) | 3 (4.8%) |
| $100,000+ | 2 (3.9%) | 0 (0.0%) |
| Total | 51 (100.0%) | 63 (100.0%) |
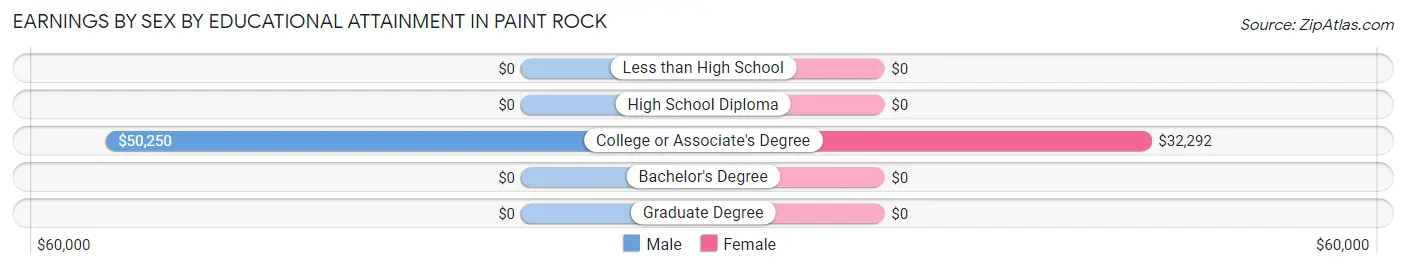
Earnings by Sex by Educational Attainment in Paint Rock
Average earnings in Paint Rock are $47,891 for men and $36,406 for women, a difference of 24.0%. Men with an educational attainment of college or associate's degree enjoy the highest average annual earnings of $50,250, while those with college or associate's degree education earn the least with $50,250. Women with an educational attainment of college or associate's degree earn the most with the average annual earnings of $32,292, while those with college or associate's degree education have the smallest earnings of $32,292.
| Educational Attainment | Male Income | Female Income |
| Less than High School | - | - |
| High School Diploma | - | - |
| College or Associate's Degree | $50,250 | $32,292 |
| Bachelor's Degree | - | - |
| Graduate Degree | - | - |
| Total | $47,891 | $36,406 |
Family Income in Paint Rock
Family Income Brackets in Paint Rock
According to the Paint Rock family income data, there are 24 families falling into the $50,000 to $74,999 income range, which is the most common income bracket and makes up 36.9% of all families.
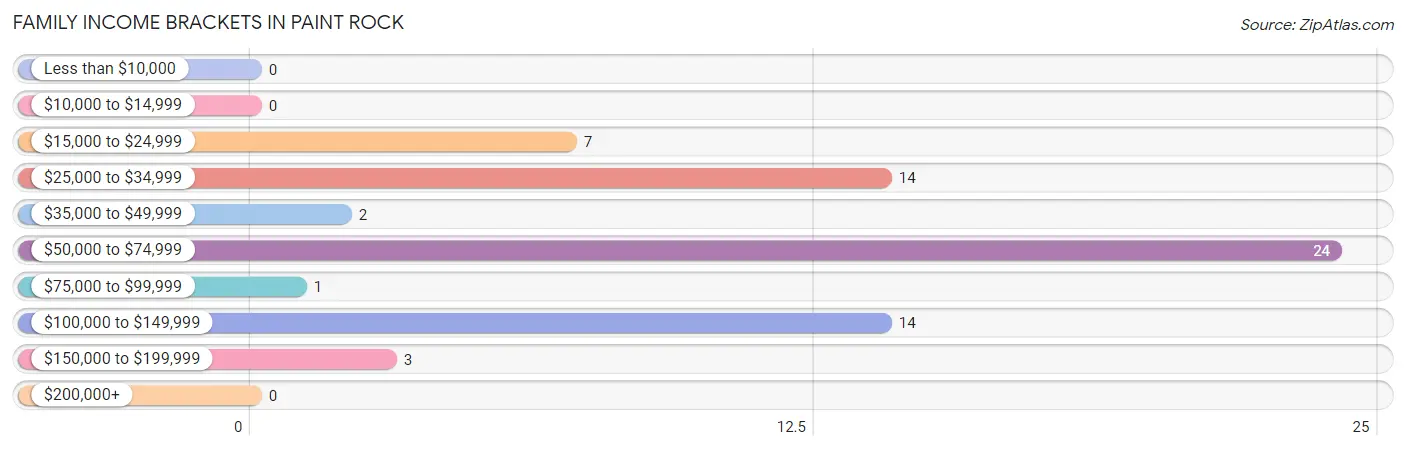
| Income Bracket | # Families | % Families |
| Less than $10,000 | 0 | 0.0% |
| $10,000 to $14,999 | 0 | 0.0% |
| $15,000 to $24,999 | 7 | 10.8% |
| $25,000 to $34,999 | 14 | 21.5% |
| $35,000 to $49,999 | 2 | 3.1% |
| $50,000 to $74,999 | 24 | 36.9% |
| $75,000 to $99,999 | 1 | 1.5% |
| $100,000 to $149,999 | 14 | 21.5% |
| $150,000 to $199,999 | 3 | 4.6% |
| $200,000+ | 0 | 0.0% |
Family Income by Famaliy Size in Paint Rock
3-person families (12 | 18.5%) account for the highest median family income in Paint Rock with $101,667 per family, while 3-person families (12 | 18.5%) have the highest median income of $33,889 per family member.
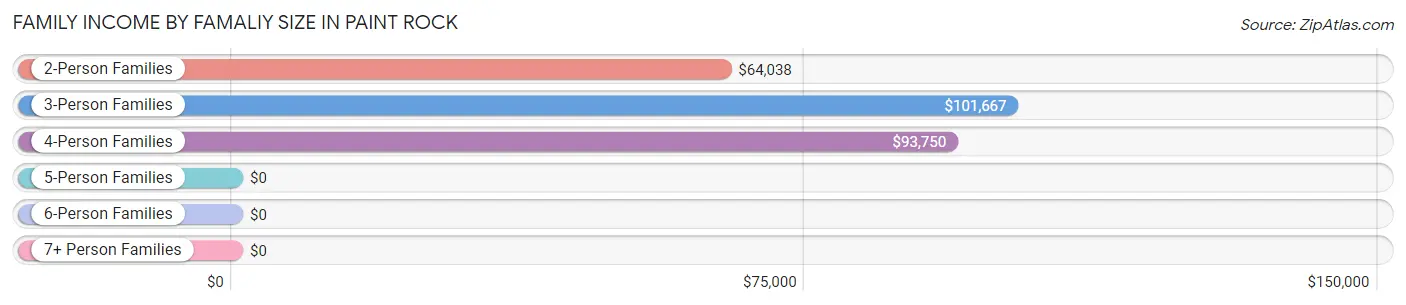
| Income Bracket | # Families | Median Income |
| 2-Person Families | 36 (55.4%) | $64,038 |
| 3-Person Families | 12 (18.5%) | $101,667 |
| 4-Person Families | 4 (6.1%) | $93,750 |
| 5-Person Families | 0 (0.0%) | $0 |
| 6-Person Families | 0 (0.0%) | $0 |
| 7+ Person Families | 13 (20.0%) | $0 |
| Total | 65 (100.0%) | $63,942 |
Family Income by Number of Earners in Paint Rock
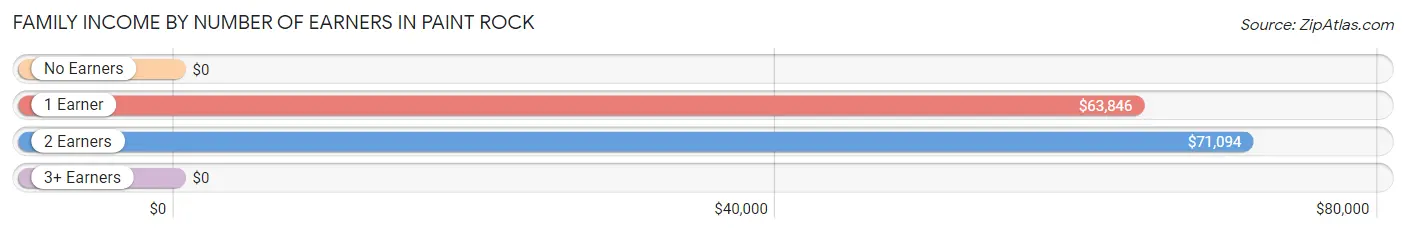
| Number of Earners | # Families | Median Income |
| No Earners | 11 (16.9%) | $0 |
| 1 Earner | 18 (27.7%) | $63,846 |
| 2 Earners | 35 (53.8%) | $71,094 |
| 3+ Earners | 1 (1.5%) | $0 |
| Total | 65 (100.0%) | $63,942 |
Household Income in Paint Rock
Household Income Brackets in Paint Rock
With 27 households falling in the category, the $50,000 to $74,999 income range is the most frequent in Paint Rock, accounting for 38.0% of all households.
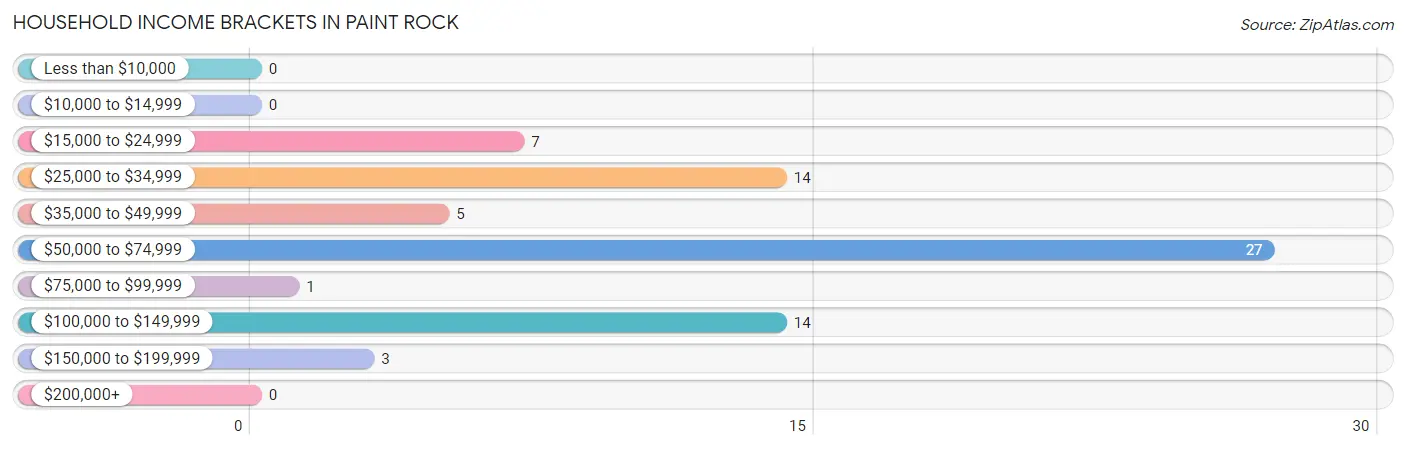
| Income Bracket | # Households | % Households |
| Less than $10,000 | 0 | 0.0% |
| $10,000 to $14,999 | 0 | 0.0% |
| $15,000 to $24,999 | 7 | 9.9% |
| $25,000 to $34,999 | 14 | 19.7% |
| $35,000 to $49,999 | 5 | 7.0% |
| $50,000 to $74,999 | 27 | 38.0% |
| $75,000 to $99,999 | 1 | 1.4% |
| $100,000 to $149,999 | 14 | 19.7% |
| $150,000 to $199,999 | 3 | 4.2% |
| $200,000+ | 0 | 0.0% |
Household Income by Householder Age in Paint Rock
The median household income in Paint Rock is $63,365, with the highest median household income of $100,833 found in the 45 to 64 years age bracket for the primary householder. A total of 20 households (28.2%) fall into this category.
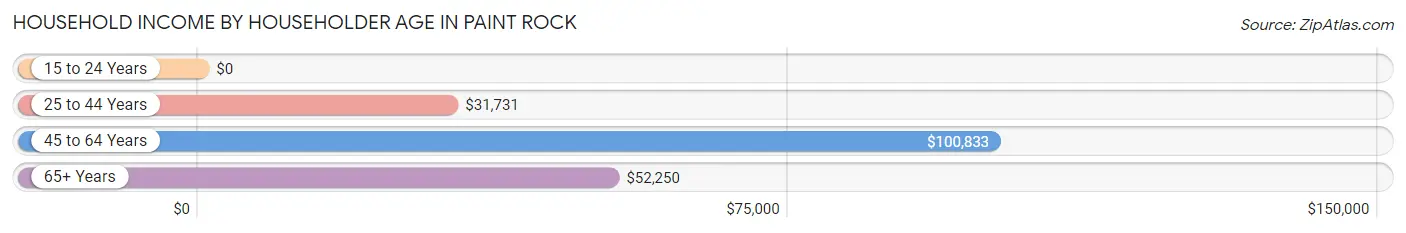
| Income Bracket | # Households | Median Income |
| 15 to 24 Years | 0 (0.0%) | $0 |
| 25 to 44 Years | 18 (25.4%) | $31,731 |
| 45 to 64 Years | 20 (28.2%) | $100,833 |
| 65+ Years | 33 (46.5%) | $52,250 |
| Total | 71 (100.0%) | $63,365 |
Poverty in Paint Rock
Income Below Poverty by Sex and Age in Paint Rock
With 31.1% poverty level for males and 44.4% for females among the residents of Paint Rock, 6 to 11 year old males and under 5 year old females are the most vulnerable to poverty, with 29 males (100.0%) and 47 females (100.0%) in their respective age groups living below the poverty level.
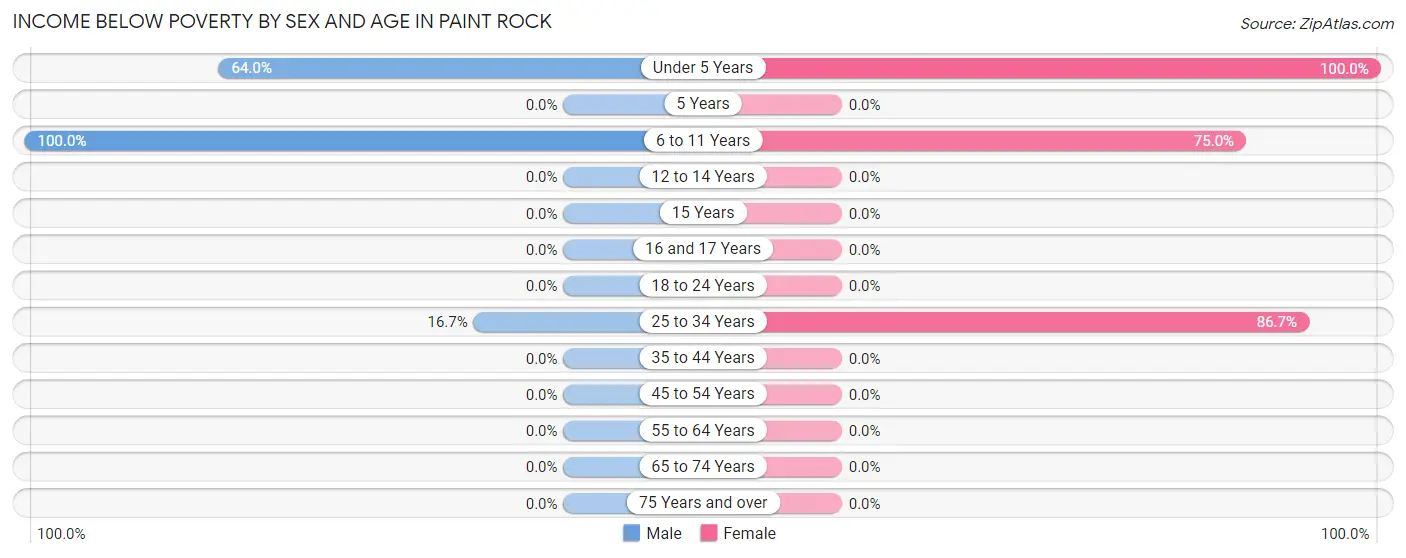
| Age Bracket | Male | Female |
| Under 5 Years | 16 (64.0%) | 47 (100.0%) |
| 5 Years | 0 (0.0%) | 0 (0.0%) |
| 6 to 11 Years | 29 (100.0%) | 12 (75.0%) |
| 12 to 14 Years | 0 (0.0%) | 0 (0.0%) |
| 15 Years | 0 (0.0%) | 0 (0.0%) |
| 16 and 17 Years | 0 (0.0%) | 0 (0.0%) |
| 18 to 24 Years | 0 (0.0%) | 0 (0.0%) |
| 25 to 34 Years | 1 (16.7%) | 13 (86.7%) |
| 35 to 44 Years | 0 (0.0%) | 0 (0.0%) |
| 45 to 54 Years | 0 (0.0%) | 0 (0.0%) |
| 55 to 64 Years | 0 (0.0%) | 0 (0.0%) |
| 65 to 74 Years | 0 (0.0%) | 0 (0.0%) |
| 75 Years and over | 0 (0.0%) | 0 (0.0%) |
| Total | 46 (31.1%) | 72 (44.4%) |
Income Above Poverty by Sex and Age in Paint Rock
According to the poverty statistics in Paint Rock, males aged 5 years and females aged 15 years are the age groups that are most secure financially, with 100.0% of males and 100.0% of females in these age groups living above the poverty line.
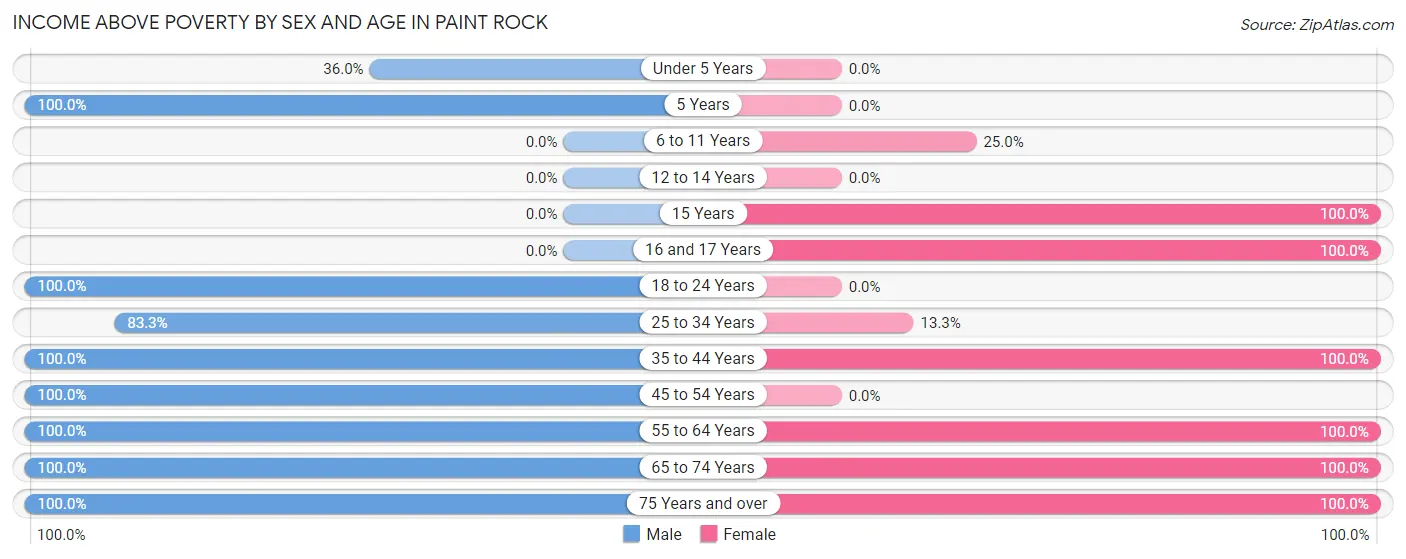
| Age Bracket | Male | Female |
| Under 5 Years | 9 (36.0%) | 0 (0.0%) |
| 5 Years | 4 (100.0%) | 0 (0.0%) |
| 6 to 11 Years | 0 (0.0%) | 4 (25.0%) |
| 12 to 14 Years | 0 (0.0%) | 0 (0.0%) |
| 15 Years | 0 (0.0%) | 6 (100.0%) |
| 16 and 17 Years | 0 (0.0%) | 10 (100.0%) |
| 18 to 24 Years | 2 (100.0%) | 0 (0.0%) |
| 25 to 34 Years | 5 (83.3%) | 2 (13.3%) |
| 35 to 44 Years | 4 (100.0%) | 20 (100.0%) |
| 45 to 54 Years | 17 (100.0%) | 0 (0.0%) |
| 55 to 64 Years | 12 (100.0%) | 19 (100.0%) |
| 65 to 74 Years | 30 (100.0%) | 9 (100.0%) |
| 75 Years and over | 19 (100.0%) | 20 (100.0%) |
| Total | 102 (68.9%) | 90 (55.6%) |
Income Below Poverty Among Married-Couple Families in Paint Rock
The poverty statistics for married-couple families in Paint Rock show that 28.3% or 13 of the total 46 families live below the poverty line. Families with 5 or more children have the highest poverty rate of 100.0%, comprising of 13 families. On the other hand, families with no children have the lowest poverty rate of 0.0%, which includes 0 families.
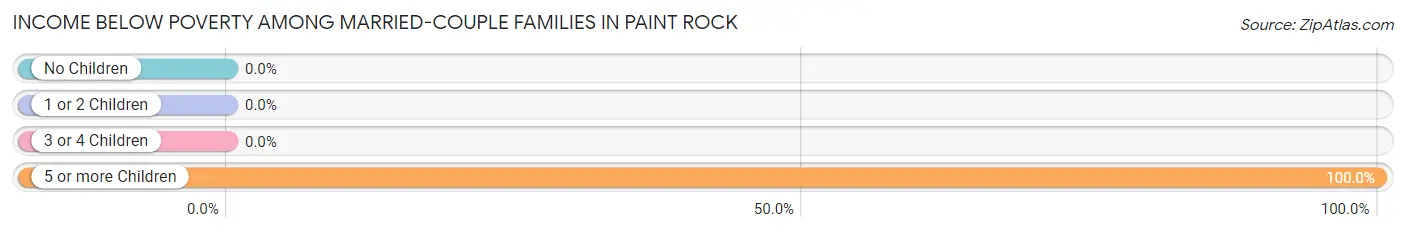
| Children | Above Poverty | Below Poverty |
| No Children | 29 (100.0%) | 0 (0.0%) |
| 1 or 2 Children | 4 (100.0%) | 0 (0.0%) |
| 3 or 4 Children | 0 (0.0%) | 0 (0.0%) |
| 5 or more Children | 0 (0.0%) | 13 (100.0%) |
| Total | 33 (71.7%) | 13 (28.3%) |
Income Below Poverty Among Single-Parent Households in Paint Rock
| Children | Single Father | Single Mother |
| No Children | 0 (0.0%) | 0 (0.0%) |
| 1 or 2 Children | 0 (0.0%) | 0 (0.0%) |
| 3 or 4 Children | 0 (0.0%) | 0 (0.0%) |
| 5 or more Children | 0 (0.0%) | 0 (0.0%) |
| Total | 0 (0.0%) | 0 (0.0%) |
Income Below Poverty Among Married-Couple vs Single-Parent Households in Paint Rock
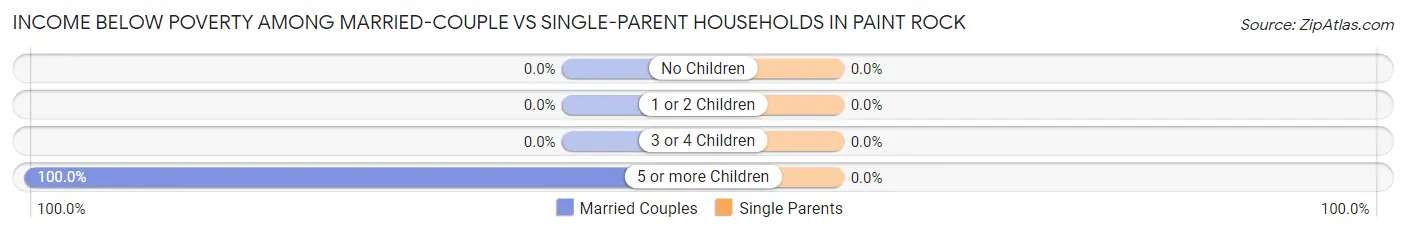
| Children | Married-Couple Families | Single-Parent Households |
| No Children | 0 (0.0%) | 0 (0.0%) |
| 1 or 2 Children | 0 (0.0%) | 0 (0.0%) |
| 3 or 4 Children | 0 (0.0%) | 0 (0.0%) |
| 5 or more Children | 13 (100.0%) | 0 (0.0%) |
| Total | 13 (28.3%) | 0 (0.0%) |
Race in Paint Rock
The most populous races in Paint Rock are White / Caucasian (290 | 93.5%), Two or more Races (16 | 5.2%), and Hispanic or Latino (11 | 3.5%).
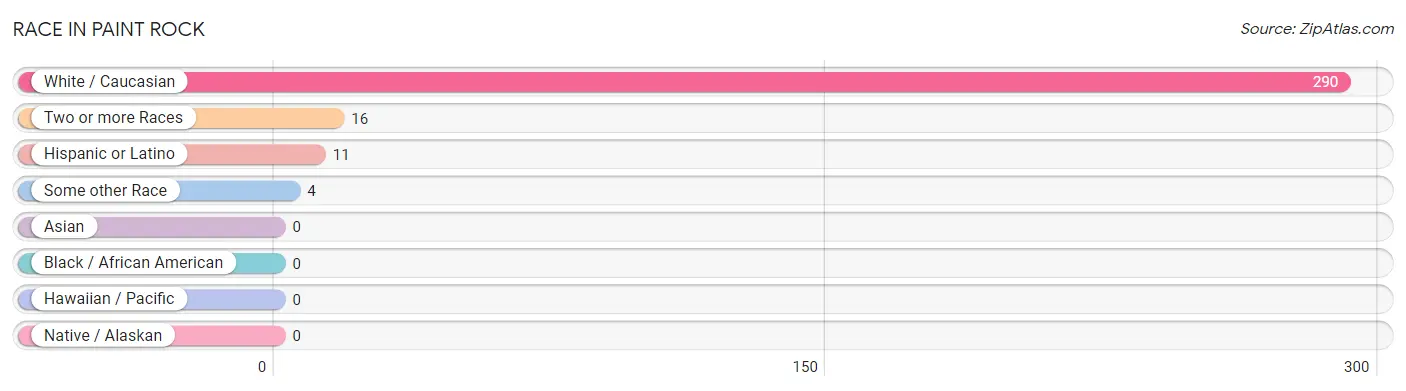
| Race | # Population | % Population |
| Asian | 0 | 0.0% |
| Black / African American | 0 | 0.0% |
| Hawaiian / Pacific | 0 | 0.0% |
| Hispanic or Latino | 11 | 3.5% |
| Native / Alaskan | 0 | 0.0% |
| White / Caucasian | 290 | 93.5% |
| Two or more Races | 16 | 5.2% |
| Some other Race | 4 | 1.3% |
| Total | 310 | 100.0% |
Ancestry in Paint Rock
The most populous ancestries reported in Paint Rock are European (147 | 47.4%), German (63 | 20.3%), French (34 | 11.0%), Irish (17 | 5.5%), and Mexican (11 | 3.5%), together accounting for 87.7% of all Paint Rock residents.
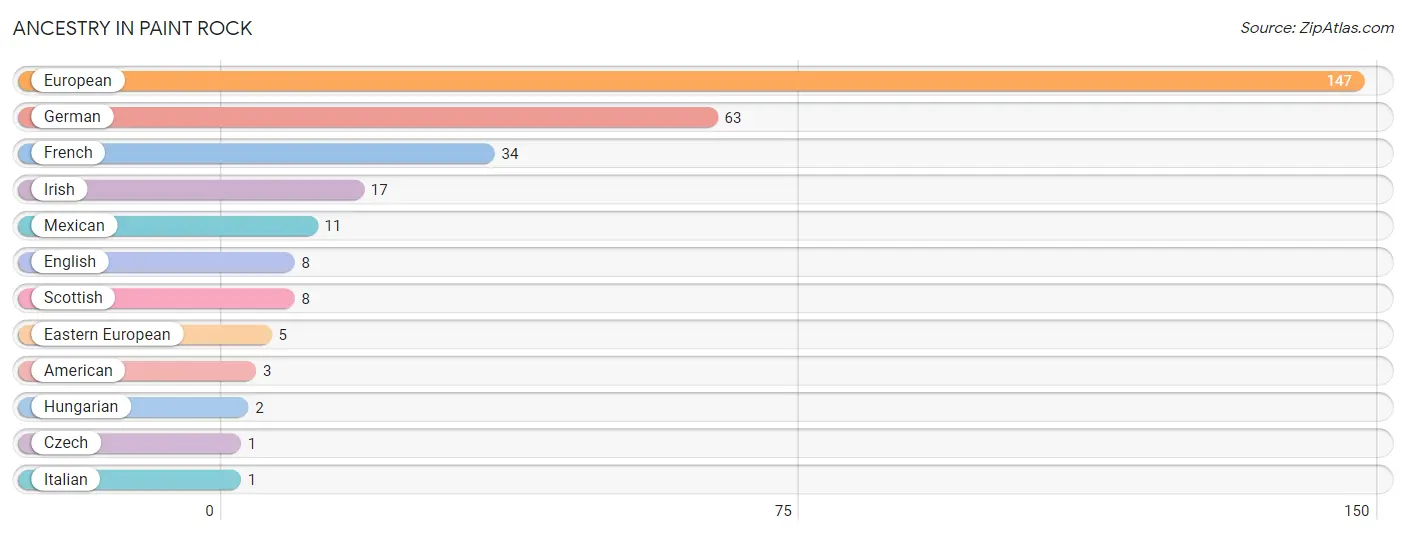
| Ancestry | # Population | % Population |
| American | 3 | 1.0% |
| Czech | 1 | 0.3% |
| Eastern European | 5 | 1.6% |
| English | 8 | 2.6% |
| European | 147 | 47.4% |
| French | 34 | 11.0% |
| German | 63 | 20.3% |
| Hungarian | 2 | 0.6% |
| Irish | 17 | 5.5% |
| Italian | 1 | 0.3% |
| Mexican | 11 | 3.5% |
| Scottish | 8 | 2.6% | View All 12 Rows |
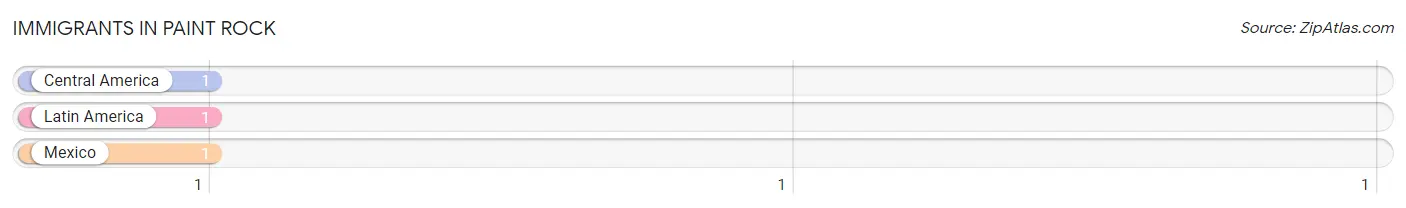
Immigrants in Paint Rock
The most numerous immigrant groups reported in Paint Rock came from Central America (1 | 0.3%), Latin America (1 | 0.3%), and Mexico (1 | 0.3%), together accounting for 1.0% of all Paint Rock residents.
| Immigration Origin | # Population | % Population |
| Central America | 1 | 0.3% |
| Latin America | 1 | 0.3% |
| Mexico | 1 | 0.3% | View All 3 Rows |
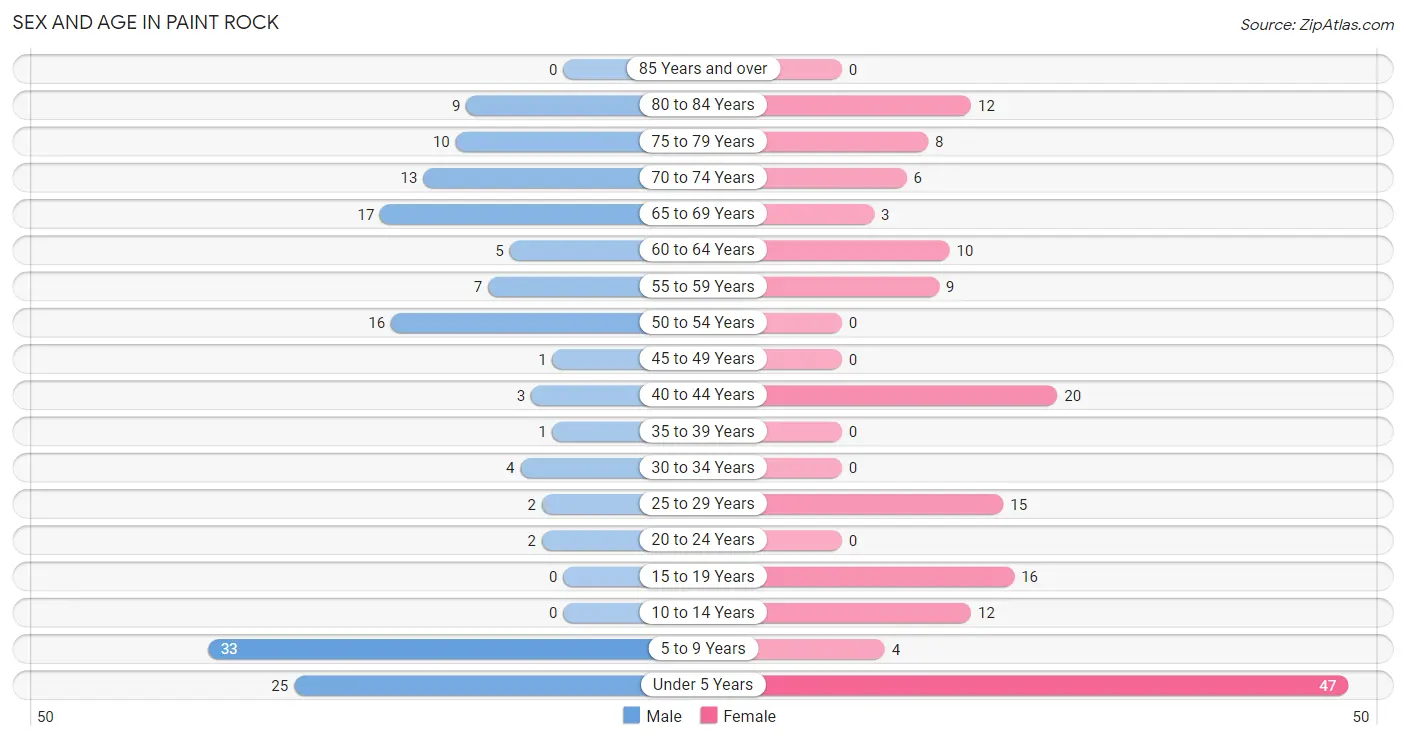
Sex and Age in Paint Rock
Sex and Age in Paint Rock
The most populous age groups in Paint Rock are 5 to 9 Years (33 | 22.3%) for men and Under 5 Years (47 | 29.0%) for women.
| Age Bracket | Male | Female |
| Under 5 Years | 25 (16.9%) | 47 (29.0%) |
| 5 to 9 Years | 33 (22.3%) | 4 (2.5%) |
| 10 to 14 Years | 0 (0.0%) | 12 (7.4%) |
| 15 to 19 Years | 0 (0.0%) | 16 (9.9%) |
| 20 to 24 Years | 2 (1.3%) | 0 (0.0%) |
| 25 to 29 Years | 2 (1.3%) | 15 (9.3%) |
| 30 to 34 Years | 4 (2.7%) | 0 (0.0%) |
| 35 to 39 Years | 1 (0.7%) | 0 (0.0%) |
| 40 to 44 Years | 3 (2.0%) | 20 (12.3%) |
| 45 to 49 Years | 1 (0.7%) | 0 (0.0%) |
| 50 to 54 Years | 16 (10.8%) | 0 (0.0%) |
| 55 to 59 Years | 7 (4.7%) | 9 (5.6%) |
| 60 to 64 Years | 5 (3.4%) | 10 (6.2%) |
| 65 to 69 Years | 17 (11.5%) | 3 (1.8%) |
| 70 to 74 Years | 13 (8.8%) | 6 (3.7%) |
| 75 to 79 Years | 10 (6.8%) | 8 (4.9%) |
| 80 to 84 Years | 9 (6.1%) | 12 (7.4%) |
| 85 Years and over | 0 (0.0%) | 0 (0.0%) |
| Total | 148 (100.0%) | 162 (100.0%) |
Families and Households in Paint Rock
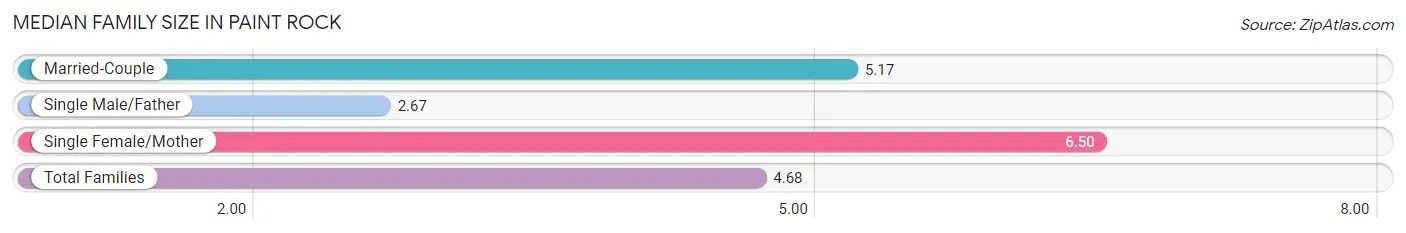
Median Family Size in Paint Rock
The median family size in Paint Rock is 4.68 persons per family, with single female/mother families (4 | 6.1%) accounting for the largest median family size of 6.5 persons per family. On the other hand, single male/father families (15 | 23.1%) represent the smallest median family size with 2.67 persons per family.
| Family Type | # Families | Family Size |
| Married-Couple | 46 (70.8%) | 5.17 |
| Single Male/Father | 15 (23.1%) | 2.67 |
| Single Female/Mother | 4 (6.1%) | 6.50 |
| Total Families | 65 (100.0%) | 4.68 |
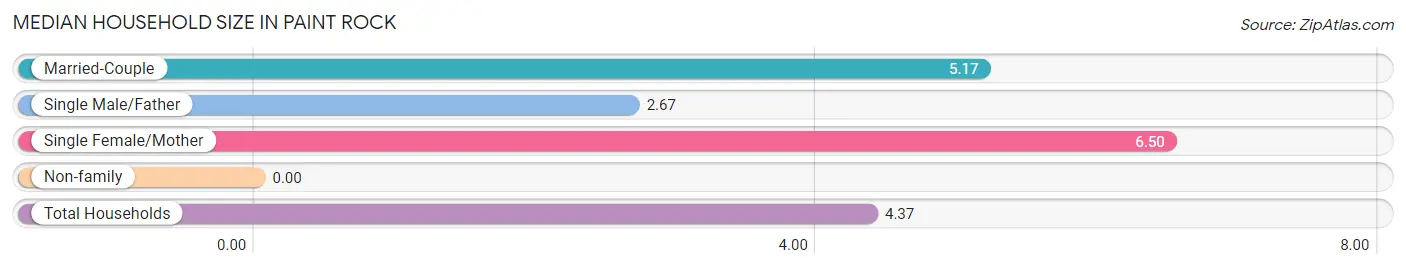
Median Household Size in Paint Rock
| Household Type | # Households | Household Size |
| Married-Couple | 46 (64.8%) | 5.17 |
| Single Male/Father | 15 (21.1%) | 2.67 |
| Single Female/Mother | 4 (5.6%) | 6.50 |
| Non-family | 6 (8.5%) | - |
| Total Households | 71 (100.0%) | 4.37 |
Household Size by Marriage Status in Paint Rock
Out of a total of 71 households in Paint Rock, 65 (91.5%) are family households, while 6 (8.5%) are nonfamily households. The most numerous type of family households are 2-person households, comprising 36, and the most common type of nonfamily households are 1-person households, comprising 6.
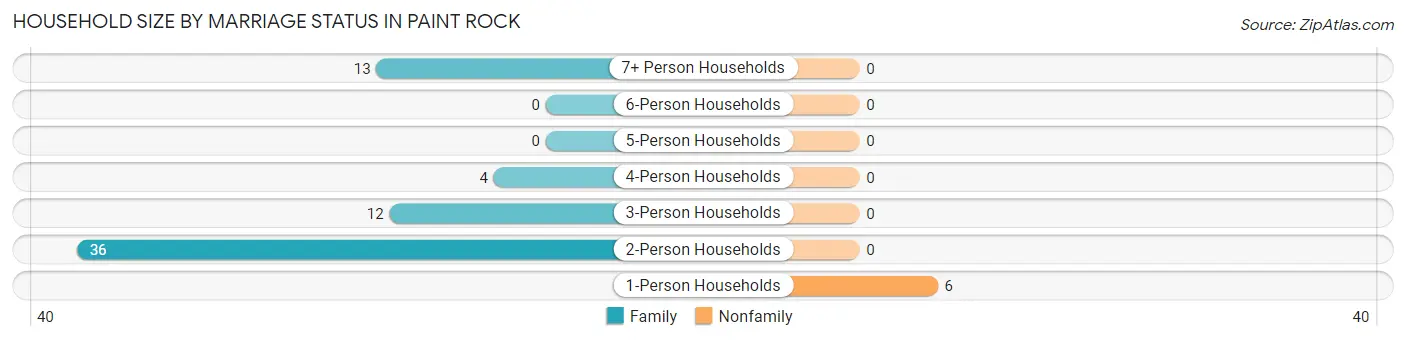
| Household Size | Family Households | Nonfamily Households |
| 1-Person Households | - | 6 (8.5%) |
| 2-Person Households | 36 (50.7%) | 0 (0.0%) |
| 3-Person Households | 12 (16.9%) | 0 (0.0%) |
| 4-Person Households | 4 (5.6%) | 0 (0.0%) |
| 5-Person Households | 0 (0.0%) | 0 (0.0%) |
| 6-Person Households | 0 (0.0%) | 0 (0.0%) |
| 7+ Person Households | 13 (18.3%) | 0 (0.0%) |
| Total | 65 (91.5%) | 6 (8.5%) |
Female Fertility in Paint Rock
Fertility by Age in Paint Rock
Average fertility rate in Paint Rock is 255.0 births per 1,000 women. Women in the age bracket of 20 to 34 years have the highest fertility rate with 867.0 births per 1,000 women. Women in the age bracket of 20 to 34 years acount for 100.0% of all women with births.
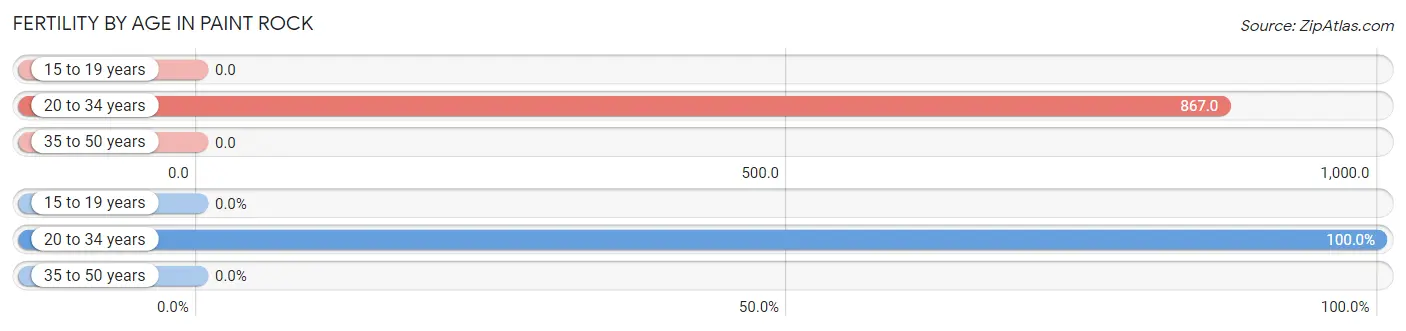
| Age Bracket | Women with Births | Births / 1,000 Women |
| 15 to 19 years | 0 (0.0%) | 0.0 |
| 20 to 34 years | 13 (100.0%) | 867.0 |
| 35 to 50 years | 0 (0.0%) | 0.0 |
| Total | 13 (100.0%) | 255.0 |
Fertility by Age by Marriage Status in Paint Rock
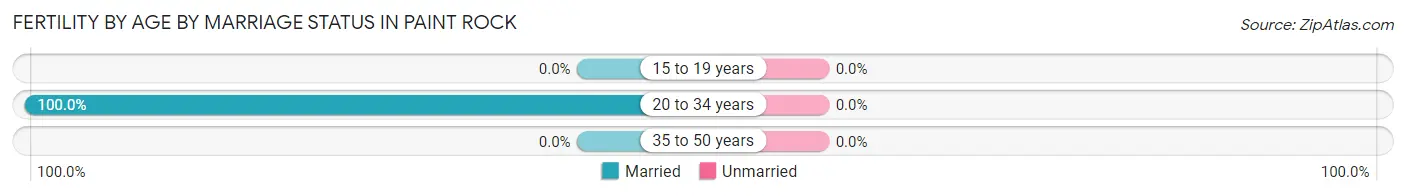
| Age Bracket | Married | Unmarried |
| 15 to 19 years | 0 (0.0%) | 0 (0.0%) |
| 20 to 34 years | 13 (100.0%) | 0 (0.0%) |
| 35 to 50 years | 0 (0.0%) | 0 (0.0%) |
| Total | 13 (100.0%) | 0 (0.0%) |
Fertility by Education in Paint Rock
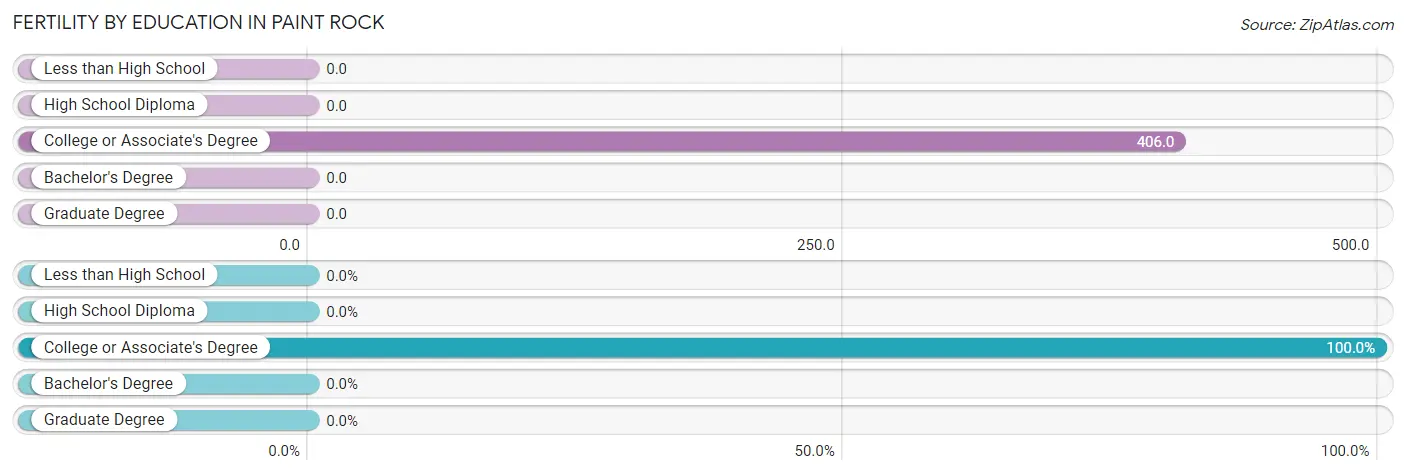
| Educational Attainment | Women with Births | Births / 1,000 Women |
| Less than High School | 0 (0.0%) | 0.0 |
| High School Diploma | 0 (0.0%) | 0.0 |
| College or Associate's Degree | 13 (100.0%) | 406.0 |
| Bachelor's Degree | 0 (0.0%) | 0.0 |
| Graduate Degree | 0 (0.0%) | 0.0 |
| Total | 13 (100.0%) | 255.0 |
Fertility by Education by Marriage Status in Paint Rock
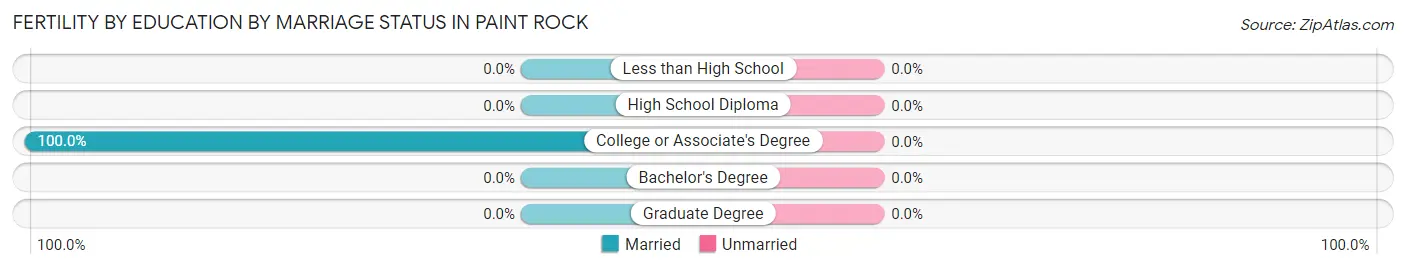
| Educational Attainment | Married | Unmarried |
| Less than High School | 0 (0.0%) | 0 (0.0%) |
| High School Diploma | 0 (0.0%) | 0 (0.0%) |
| College or Associate's Degree | 13 (100.0%) | 0 (0.0%) |
| Bachelor's Degree | 0 (0.0%) | 0 (0.0%) |
| Graduate Degree | 0 (0.0%) | 0 (0.0%) |
| Total | 13 (100.0%) | 0 (0.0%) |
Employment Characteristics in Paint Rock
Employment by Class of Employer in Paint Rock
Among the 112 employed individuals in Paint Rock, private company employees (55 | 49.1%), local government employees (22 | 19.6%), and self-employed (incorporated) (15 | 13.4%) make up the most common classes of employment.
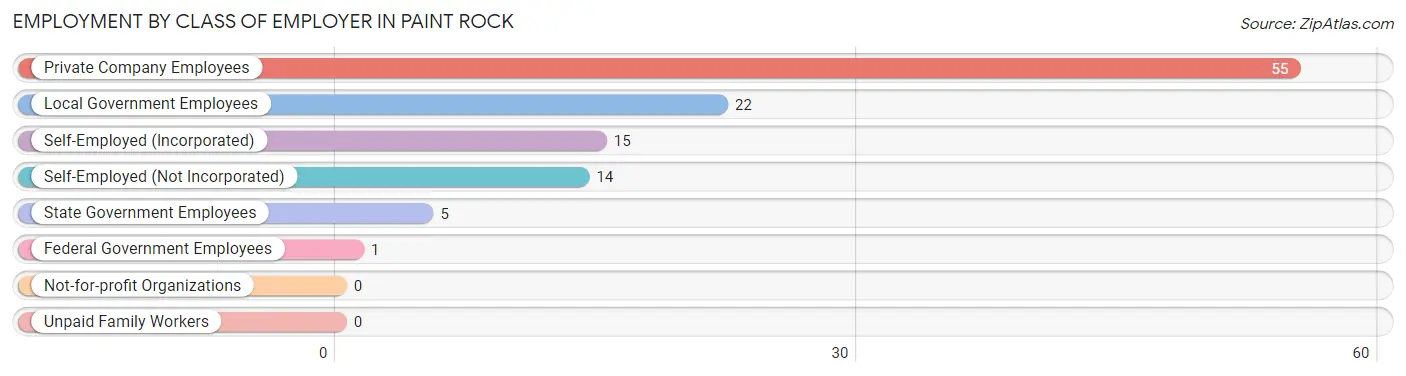
| Employer Class | # Employees | % Employees |
| Private Company Employees | 55 | 49.1% |
| Self-Employed (Incorporated) | 15 | 13.4% |
| Self-Employed (Not Incorporated) | 14 | 12.5% |
| Not-for-profit Organizations | 0 | 0.0% |
| Local Government Employees | 22 | 19.6% |
| State Government Employees | 5 | 4.5% |
| Federal Government Employees | 1 | 0.9% |
| Unpaid Family Workers | 0 | 0.0% |
| Total | 112 | 100.0% |
Employment Status by Age in Paint Rock
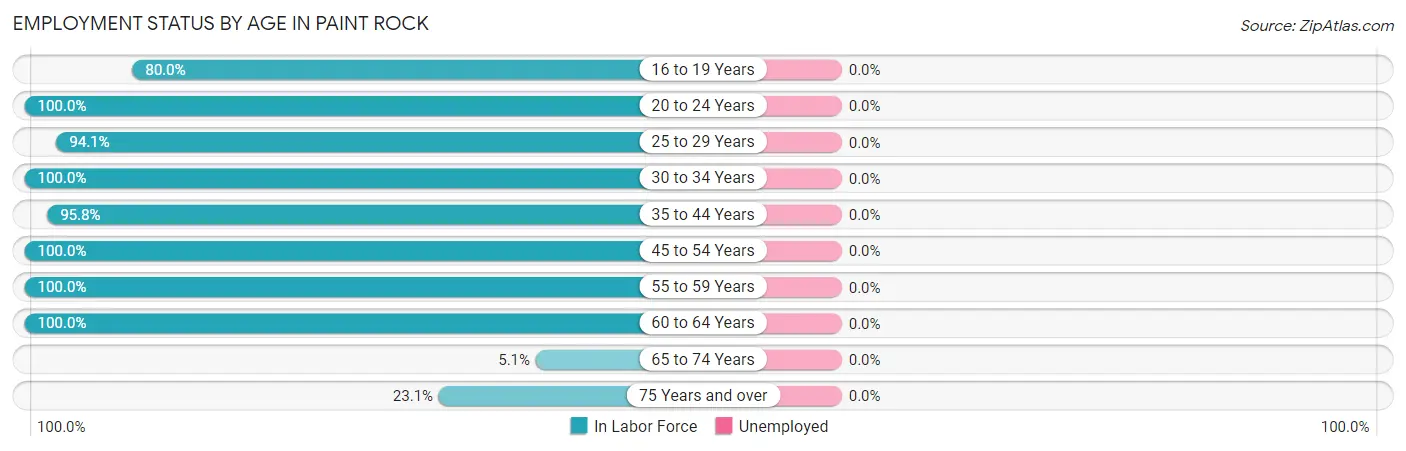
| Age Bracket | In Labor Force | Unemployed |
| 16 to 19 Years | 8 (80.0%) | 0 (0.0%) |
| 20 to 24 Years | 2 (100.0%) | 0 (0.0%) |
| 25 to 29 Years | 16 (94.1%) | 0 (0.0%) |
| 30 to 34 Years | 4 (100.0%) | 0 (0.0%) |
| 35 to 44 Years | 23 (95.8%) | 0 (0.0%) |
| 45 to 54 Years | 17 (100.0%) | 0 (0.0%) |
| 55 to 59 Years | 16 (100.0%) | 0 (0.0%) |
| 60 to 64 Years | 15 (100.0%) | 0 (0.0%) |
| 65 to 74 Years | 2 (5.1%) | 0 (0.0%) |
| 75 Years and over | 9 (23.1%) | 0 (0.0%) |
| Total | 112 (61.2%) | 0 (0.0%) |
Employment Status by Educational Attainment in Paint Rock
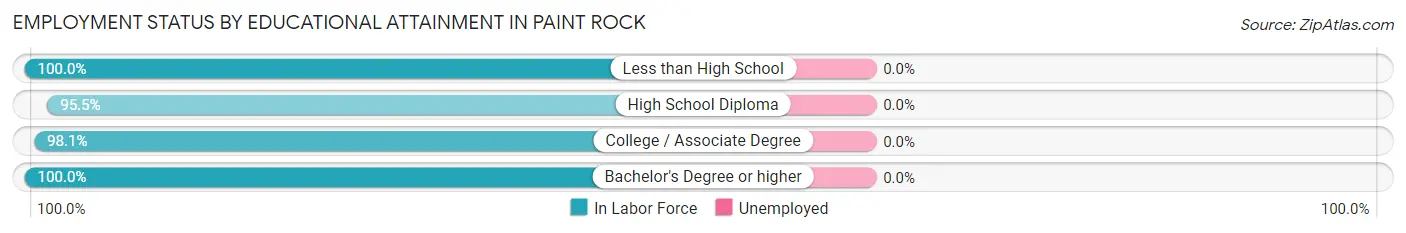
| Educational Attainment | In Labor Force | Unemployed |
| Less than High School | 5 (100.0%) | 0 (0.0%) |
| High School Diploma | 21 (95.5%) | 0 (0.0%) |
| College / Associate Degree | 53 (98.1%) | 0 (0.0%) |
| Bachelor's Degree or higher | 12 (100.0%) | 0 (0.0%) |
| Total | 91 (97.8%) | 0 (0.0%) |
Employment Occupations by Sex in Paint Rock
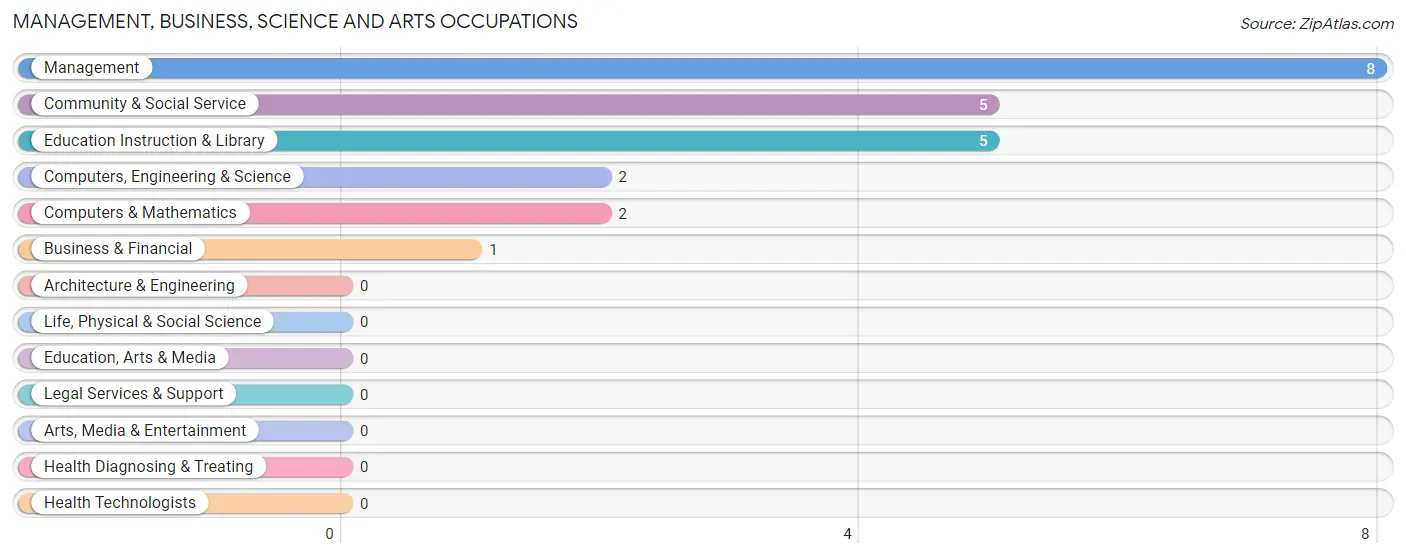
Management, Business, Science and Arts Occupations
The most common Management, Business, Science and Arts occupations in Paint Rock are Management (8 | 7.1%), Community & Social Service (5 | 4.5%), Education Instruction & Library (5 | 4.5%), Computers, Engineering & Science (2 | 1.8%), and Computers & Mathematics (2 | 1.8%).
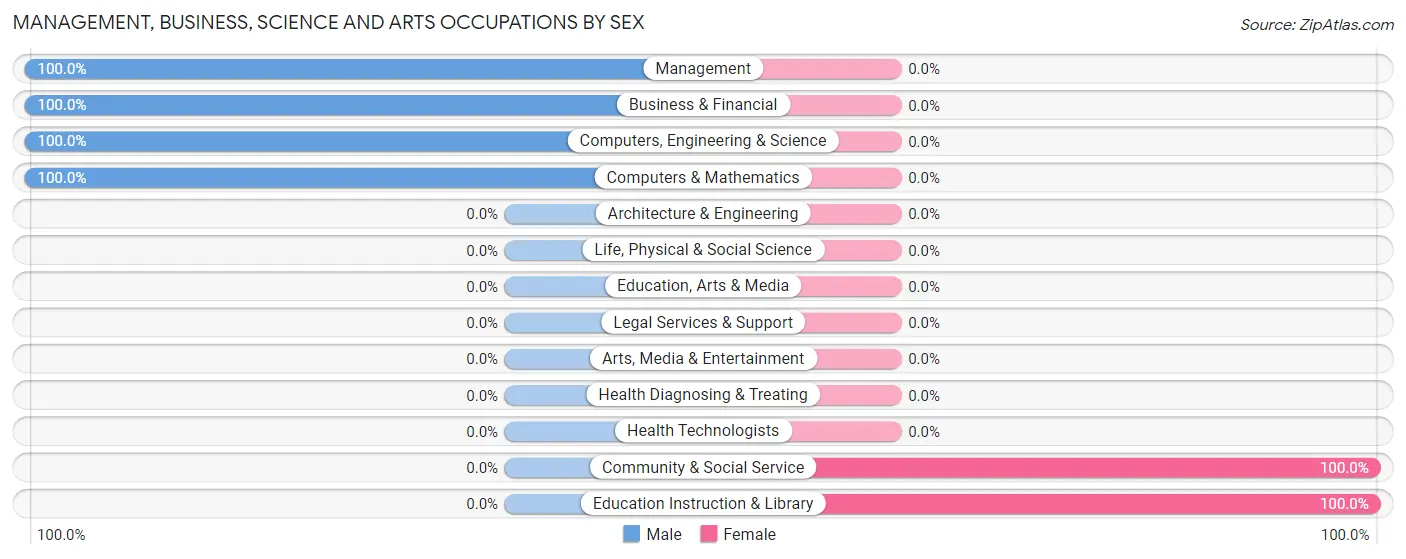
Management, Business, Science and Arts Occupations by Sex
Within the Management, Business, Science and Arts occupations in Paint Rock, the most male-oriented occupations are Management (100.0%), Business & Financial (100.0%), and Computers, Engineering & Science (100.0%), while the most female-oriented occupations are Community & Social Service (100.0%), and Education Instruction & Library (100.0%).
| Occupation | Male | Female |
| Management | 8 (100.0%) | 0 (0.0%) |
| Business & Financial | 1 (100.0%) | 0 (0.0%) |
| Computers, Engineering & Science | 2 (100.0%) | 0 (0.0%) |
| Computers & Mathematics | 2 (100.0%) | 0 (0.0%) |
| Architecture & Engineering | 0 (0.0%) | 0 (0.0%) |
| Life, Physical & Social Science | 0 (0.0%) | 0 (0.0%) |
| Community & Social Service | 0 (0.0%) | 5 (100.0%) |
| Education, Arts & Media | 0 (0.0%) | 0 (0.0%) |
| Legal Services & Support | 0 (0.0%) | 0 (0.0%) |
| Education Instruction & Library | 0 (0.0%) | 5 (100.0%) |
| Arts, Media & Entertainment | 0 (0.0%) | 0 (0.0%) |
| Health Diagnosing & Treating | 0 (0.0%) | 0 (0.0%) |
| Health Technologists | 0 (0.0%) | 0 (0.0%) |
| Total (Category) | 11 (68.8%) | 5 (31.2%) |
| Total (Overall) | 50 (44.6%) | 62 (55.4%) |
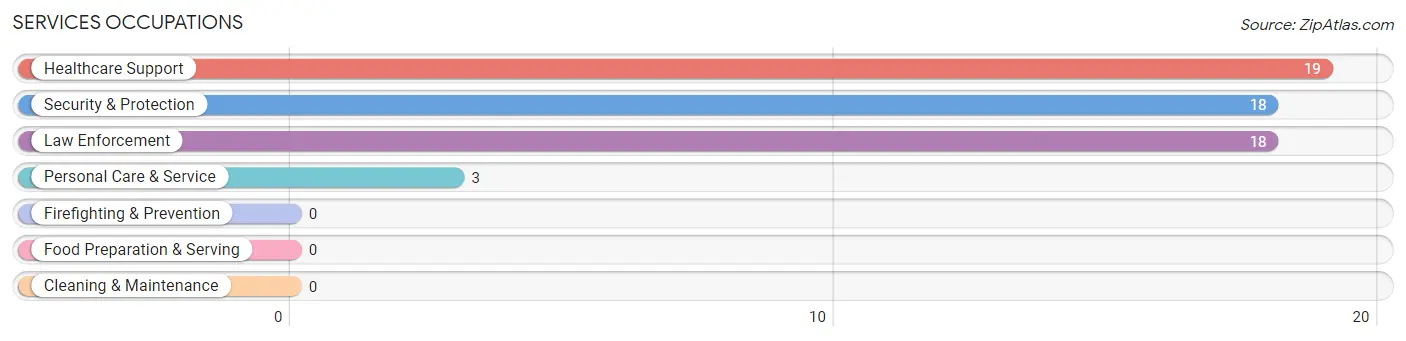
Services Occupations
The most common Services occupations in Paint Rock are Healthcare Support (19 | 17.0%), Security & Protection (18 | 16.1%), Law Enforcement (18 | 16.1%), and Personal Care & Service (3 | 2.7%).
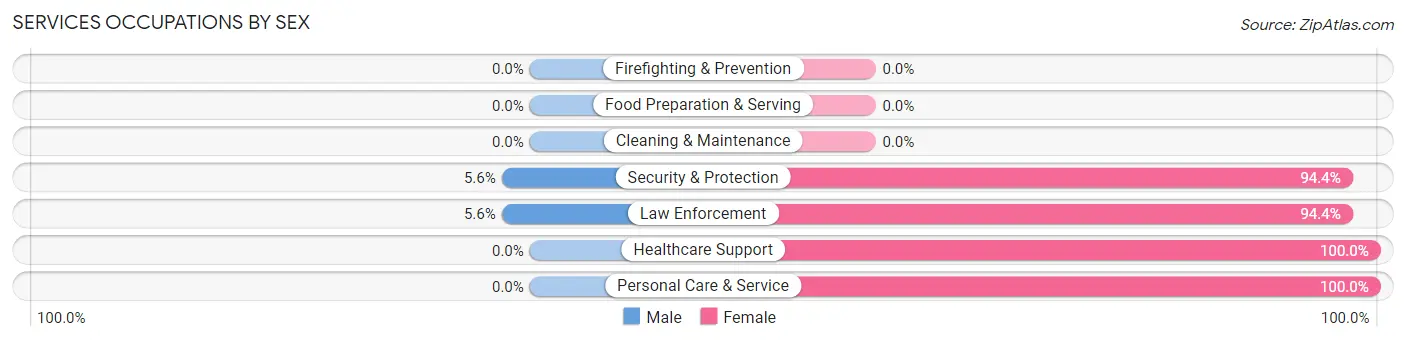
Services Occupations by Sex
Within the Services occupations in Paint Rock, the most male-oriented occupations are Security & Protection (5.6%), and Law Enforcement (5.6%), while the most female-oriented occupations are Healthcare Support (100.0%), Personal Care & Service (100.0%), and Security & Protection (94.4%).
| Occupation | Male | Female |
| Healthcare Support | 0 (0.0%) | 19 (100.0%) |
| Security & Protection | 1 (5.6%) | 17 (94.4%) |
| Firefighting & Prevention | 0 (0.0%) | 0 (0.0%) |
| Law Enforcement | 1 (5.6%) | 17 (94.4%) |
| Food Preparation & Serving | 0 (0.0%) | 0 (0.0%) |
| Cleaning & Maintenance | 0 (0.0%) | 0 (0.0%) |
| Personal Care & Service | 0 (0.0%) | 3 (100.0%) |
| Total (Category) | 1 (2.5%) | 39 (97.5%) |
| Total (Overall) | 50 (44.6%) | 62 (55.4%) |
Sales and Office Occupations
The most common Sales and Office occupations in Paint Rock are Office & Administration (10 | 8.9%), and Sales & Related (8 | 7.1%).
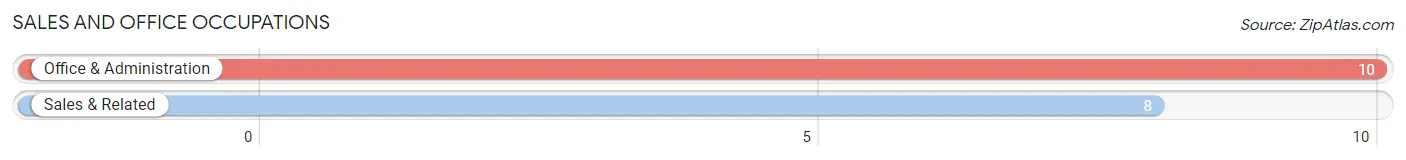
Sales and Office Occupations by Sex
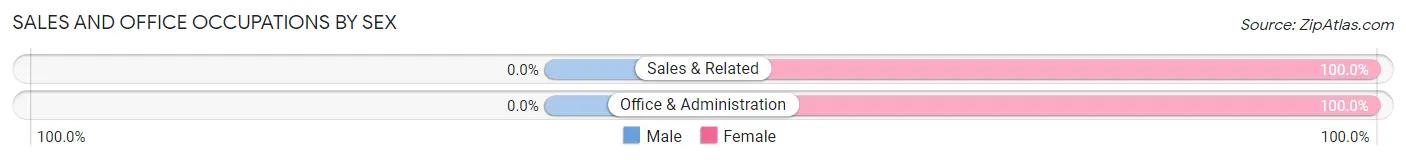
| Occupation | Male | Female |
| Sales & Related | 0 (0.0%) | 8 (100.0%) |
| Office & Administration | 0 (0.0%) | 10 (100.0%) |
| Total (Category) | 0 (0.0%) | 18 (100.0%) |
| Total (Overall) | 50 (44.6%) | 62 (55.4%) |
Natural Resources, Construction and Maintenance Occupations
The most common Natural Resources, Construction and Maintenance occupations in Paint Rock are Construction & Extraction (20 | 17.9%), and Installation, Maintenance & Repair (2 | 1.8%).
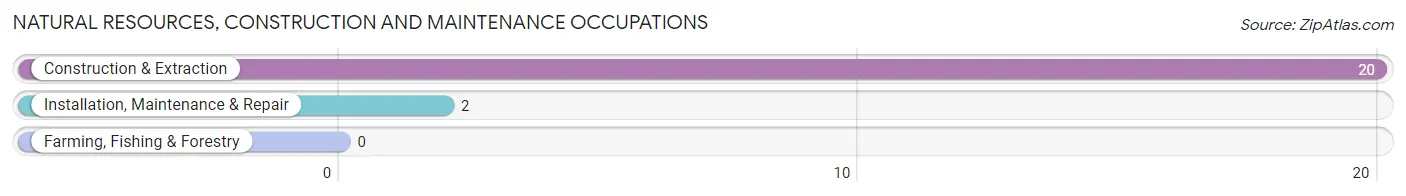
Natural Resources, Construction and Maintenance Occupations by Sex
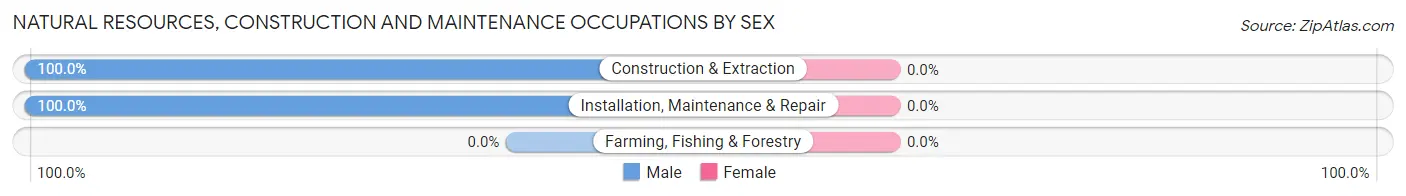
| Occupation | Male | Female |
| Farming, Fishing & Forestry | 0 (0.0%) | 0 (0.0%) |
| Construction & Extraction | 20 (100.0%) | 0 (0.0%) |
| Installation, Maintenance & Repair | 2 (100.0%) | 0 (0.0%) |
| Total (Category) | 22 (100.0%) | 0 (0.0%) |
| Total (Overall) | 50 (44.6%) | 62 (55.4%) |
Production, Transportation and Moving Occupations
The most common Production, Transportation and Moving occupations in Paint Rock are Production (14 | 12.5%), and Transportation (2 | 1.8%).
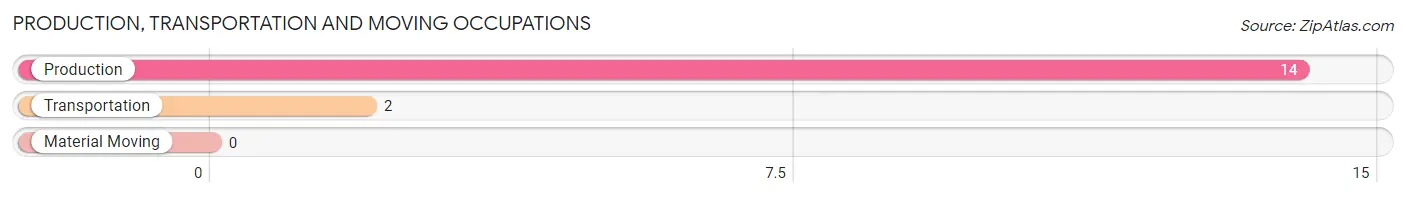
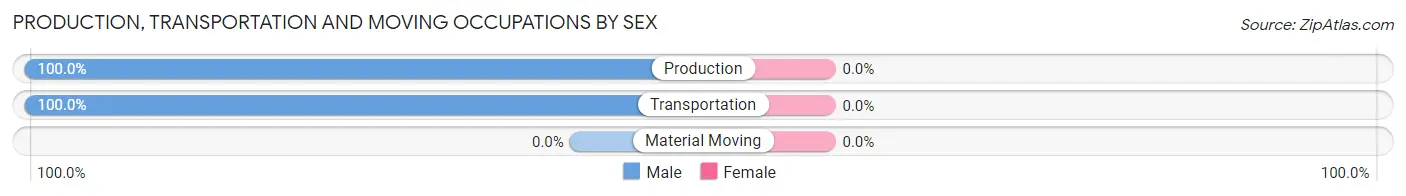
Production, Transportation and Moving Occupations by Sex
| Occupation | Male | Female |
| Production | 14 (100.0%) | 0 (0.0%) |
| Transportation | 2 (100.0%) | 0 (0.0%) |
| Material Moving | 0 (0.0%) | 0 (0.0%) |
| Total (Category) | 16 (100.0%) | 0 (0.0%) |
| Total (Overall) | 50 (44.6%) | 62 (55.4%) |
Employment Industries by Sex in Paint Rock
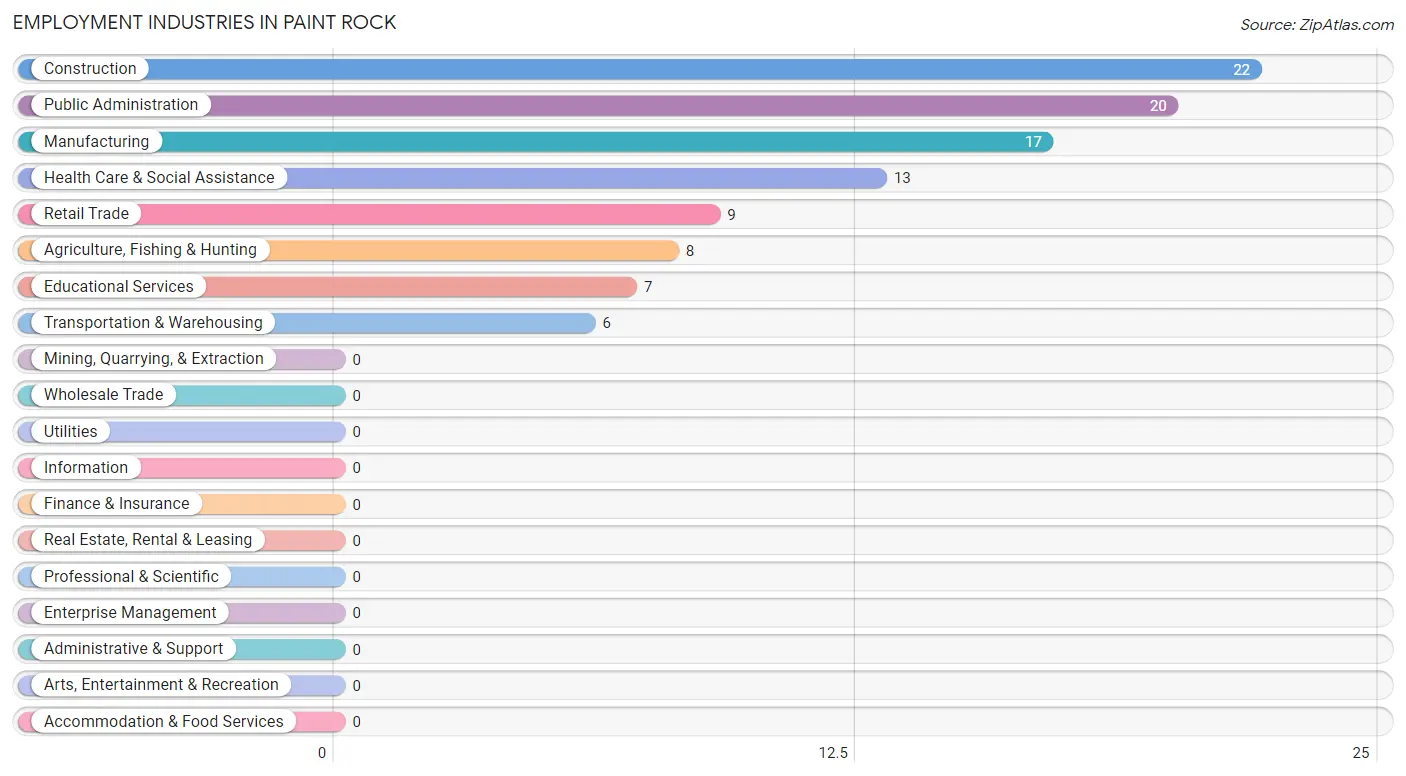
Employment Industries in Paint Rock
The major employment industries in Paint Rock include Construction (22 | 19.6%), Public Administration (20 | 17.9%), Manufacturing (17 | 15.2%), Health Care & Social Assistance (13 | 11.6%), and Retail Trade (9 | 8.0%).
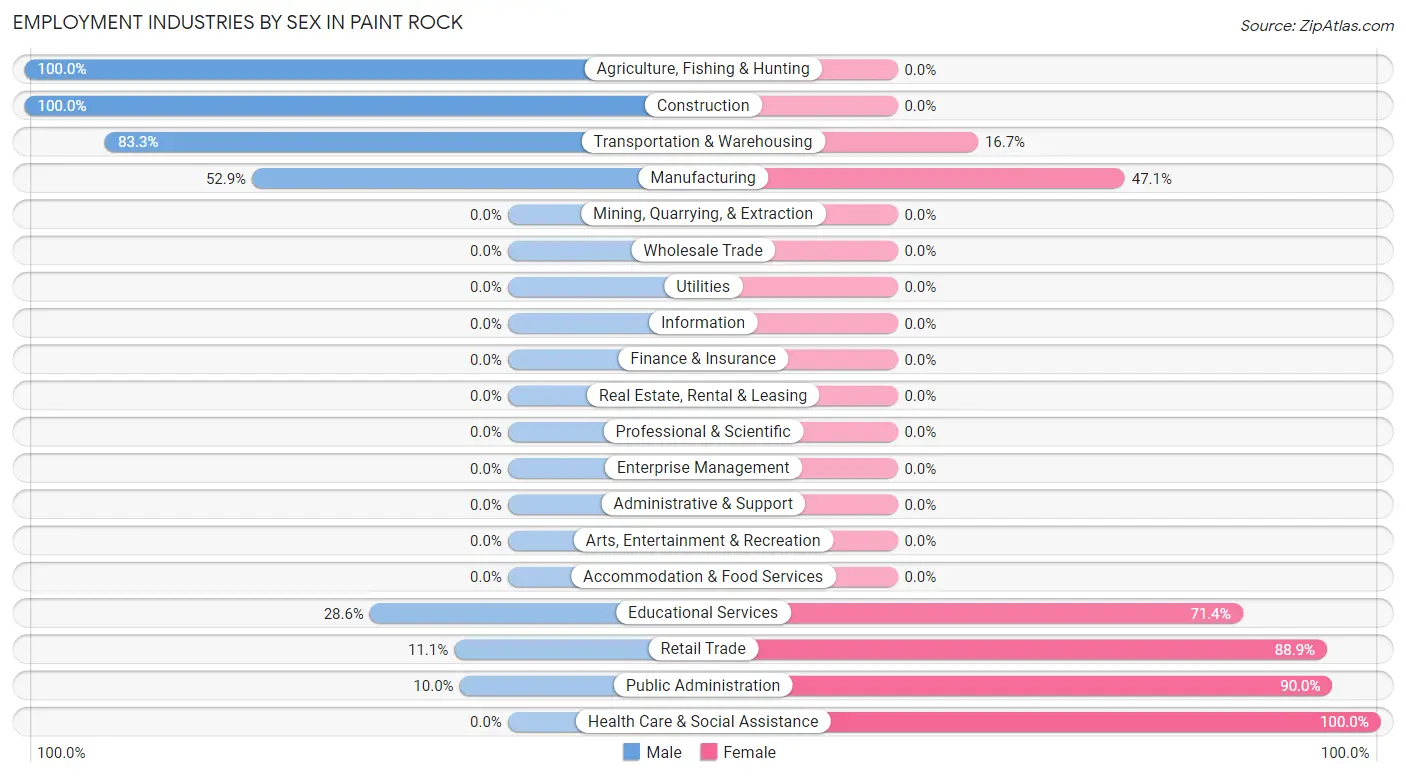
Employment Industries by Sex in Paint Rock
The Paint Rock industries that see more men than women are Agriculture, Fishing & Hunting (100.0%), Construction (100.0%), and Transportation & Warehousing (83.3%), whereas the industries that tend to have a higher number of women are Health Care & Social Assistance (100.0%), Public Administration (90.0%), and Retail Trade (88.9%).
| Industry | Male | Female |
| Agriculture, Fishing & Hunting | 8 (100.0%) | 0 (0.0%) |
| Mining, Quarrying, & Extraction | 0 (0.0%) | 0 (0.0%) |
| Construction | 22 (100.0%) | 0 (0.0%) |
| Manufacturing | 9 (52.9%) | 8 (47.1%) |
| Wholesale Trade | 0 (0.0%) | 0 (0.0%) |
| Retail Trade | 1 (11.1%) | 8 (88.9%) |
| Transportation & Warehousing | 5 (83.3%) | 1 (16.7%) |
| Utilities | 0 (0.0%) | 0 (0.0%) |
| Information | 0 (0.0%) | 0 (0.0%) |
| Finance & Insurance | 0 (0.0%) | 0 (0.0%) |
| Real Estate, Rental & Leasing | 0 (0.0%) | 0 (0.0%) |
| Professional & Scientific | 0 (0.0%) | 0 (0.0%) |
| Enterprise Management | 0 (0.0%) | 0 (0.0%) |
| Administrative & Support | 0 (0.0%) | 0 (0.0%) |
| Educational Services | 2 (28.6%) | 5 (71.4%) |
| Health Care & Social Assistance | 0 (0.0%) | 13 (100.0%) |
| Arts, Entertainment & Recreation | 0 (0.0%) | 0 (0.0%) |
| Accommodation & Food Services | 0 (0.0%) | 0 (0.0%) |
| Public Administration | 2 (10.0%) | 18 (90.0%) |
| Total | 50 (44.6%) | 62 (55.4%) |
Education in Paint Rock
School Enrollment in Paint Rock
The most common levels of schooling among the 67 students in Paint Rock are elementary school (33 | 49.2%), high school (16 | 23.9%), and middle school (12 | 17.9%).
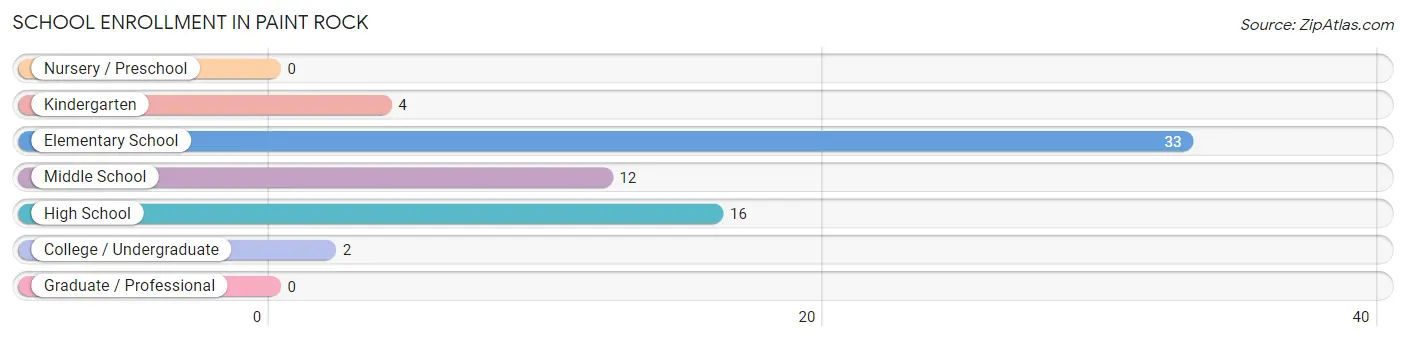
| School Level | # Students | % Students |
| Nursery / Preschool | 0 | 0.0% |
| Kindergarten | 4 | 6.0% |
| Elementary School | 33 | 49.2% |
| Middle School | 12 | 17.9% |
| High School | 16 | 23.9% |
| College / Undergraduate | 2 | 3.0% |
| Graduate / Professional | 0 | 0.0% |
| Total | 67 | 100.0% |
School Enrollment by Age by Funding Source in Paint Rock
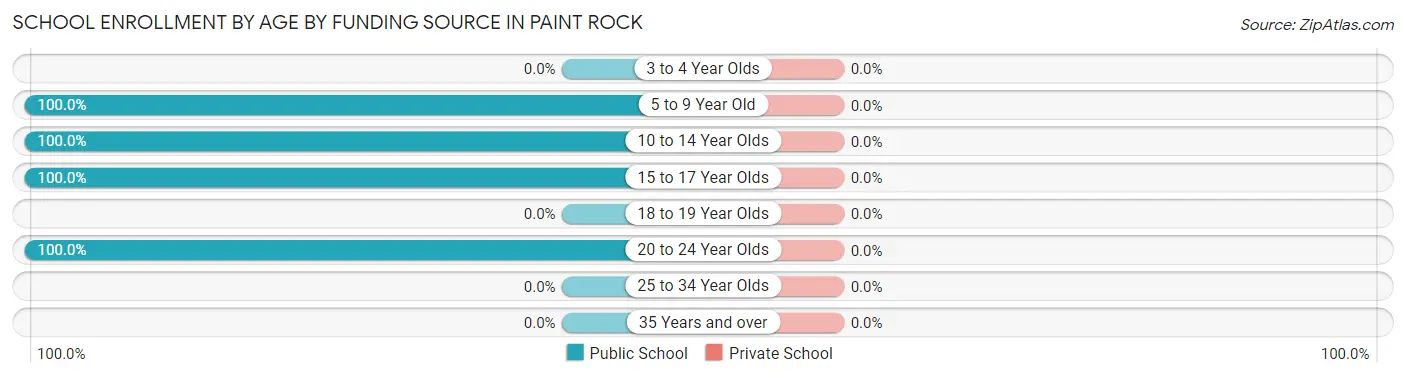
| Age Bracket | Public School | Private School |
| 3 to 4 Year Olds | 0 (0.0%) | 0 (0.0%) |
| 5 to 9 Year Old | 37 (100.0%) | 0 (0.0%) |
| 10 to 14 Year Olds | 12 (100.0%) | 0 (0.0%) |
| 15 to 17 Year Olds | 16 (100.0%) | 0 (0.0%) |
| 18 to 19 Year Olds | 0 (0.0%) | 0 (0.0%) |
| 20 to 24 Year Olds | 2 (100.0%) | 0 (0.0%) |
| 25 to 34 Year Olds | 0 (0.0%) | 0 (0.0%) |
| 35 Years and over | 0 (0.0%) | 0 (0.0%) |
| Total | 67 (100.0%) | 0 (0.0%) |
Educational Attainment by Field of Study in Paint Rock
Social sciences (8 | 61.5%), communications (4 | 30.8%), and arts & humanities (1 | 7.7%) are the most common fields of study among 13 individuals in Paint Rock who have obtained a bachelor's degree or higher.
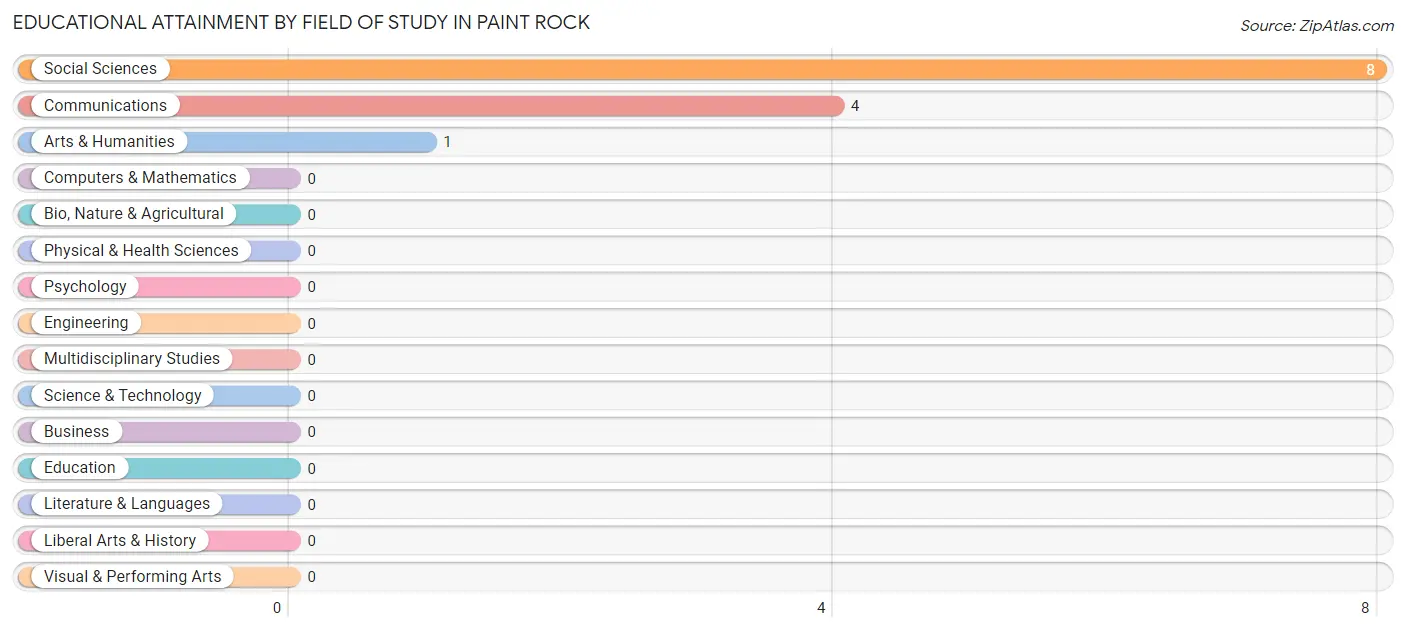
| Field of Study | # Graduates | % Graduates |
| Computers & Mathematics | 0 | 0.0% |
| Bio, Nature & Agricultural | 0 | 0.0% |
| Physical & Health Sciences | 0 | 0.0% |
| Psychology | 0 | 0.0% |
| Social Sciences | 8 | 61.5% |
| Engineering | 0 | 0.0% |
| Multidisciplinary Studies | 0 | 0.0% |
| Science & Technology | 0 | 0.0% |
| Business | 0 | 0.0% |
| Education | 0 | 0.0% |
| Literature & Languages | 0 | 0.0% |
| Liberal Arts & History | 0 | 0.0% |
| Visual & Performing Arts | 0 | 0.0% |
| Communications | 4 | 30.8% |
| Arts & Humanities | 1 | 7.7% |
| Total | 13 | 100.0% |
Transportation & Commute in Paint Rock
Vehicle Availability by Sex in Paint Rock
The most prevalent vehicle ownership categories in Paint Rock are males with 2 vehicles (28, accounting for 56.0%) and females with 2 vehicles (24, making up 45.2%).
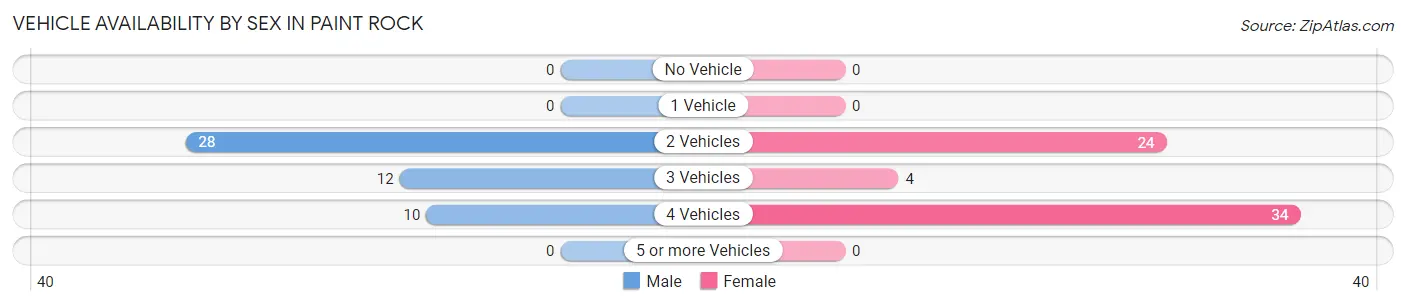
| Vehicles Available | Male | Female |
| No Vehicle | 0 (0.0%) | 0 (0.0%) |
| 1 Vehicle | 0 (0.0%) | 0 (0.0%) |
| 2 Vehicles | 28 (56.0%) | 24 (38.7%) |
| 3 Vehicles | 12 (24.0%) | 4 (6.5%) |
| 4 Vehicles | 10 (20.0%) | 34 (54.8%) |
| 5 or more Vehicles | 0 (0.0%) | 0 (0.0%) |
| Total | 50 (100.0%) | 62 (100.0%) |
Commute Time in Paint Rock
The most frequently occuring commute durations in Paint Rock are less than 5 minutes (31 commuters, 27.7%), 5 to 9 minutes (21 commuters, 18.8%), and 20 to 24 minutes (21 commuters, 18.8%).
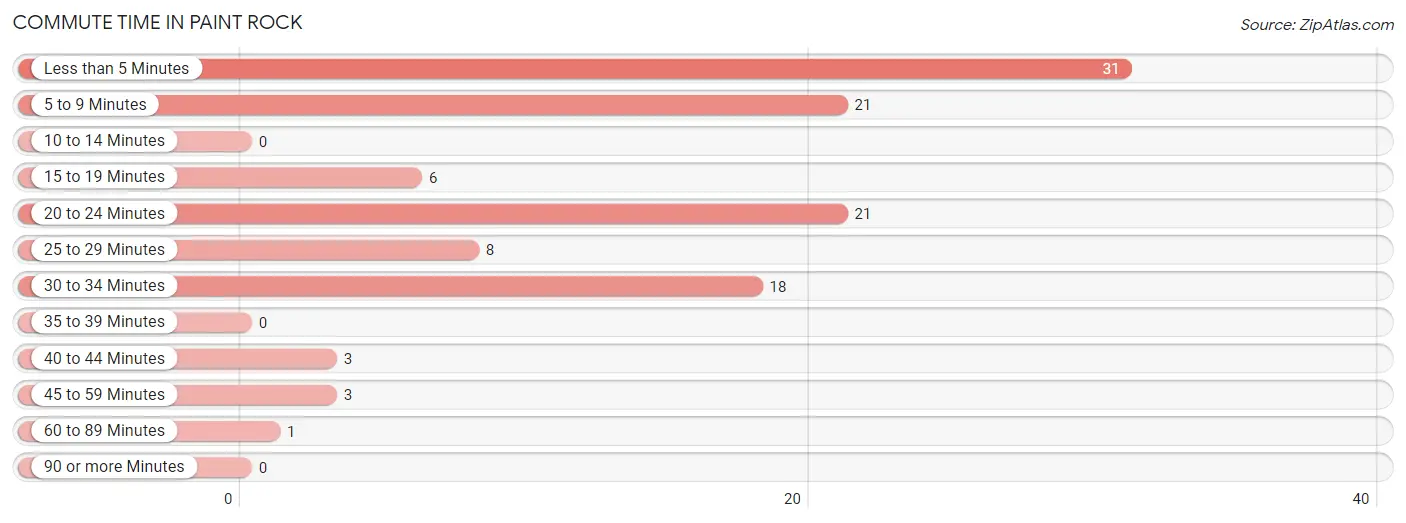
| Commute Time | # Commuters | % Commuters |
| Less than 5 Minutes | 31 | 27.7% |
| 5 to 9 Minutes | 21 | 18.8% |
| 10 to 14 Minutes | 0 | 0.0% |
| 15 to 19 Minutes | 6 | 5.4% |
| 20 to 24 Minutes | 21 | 18.8% |
| 25 to 29 Minutes | 8 | 7.1% |
| 30 to 34 Minutes | 18 | 16.1% |
| 35 to 39 Minutes | 0 | 0.0% |
| 40 to 44 Minutes | 3 | 2.7% |
| 45 to 59 Minutes | 3 | 2.7% |
| 60 to 89 Minutes | 1 | 0.9% |
| 90 or more Minutes | 0 | 0.0% |
Commute Time by Sex in Paint Rock
The most common commute times in Paint Rock are 30 to 34 minutes (18 commuters, 36.0%) for males and less than 5 minutes (28 commuters, 45.2%) for females.
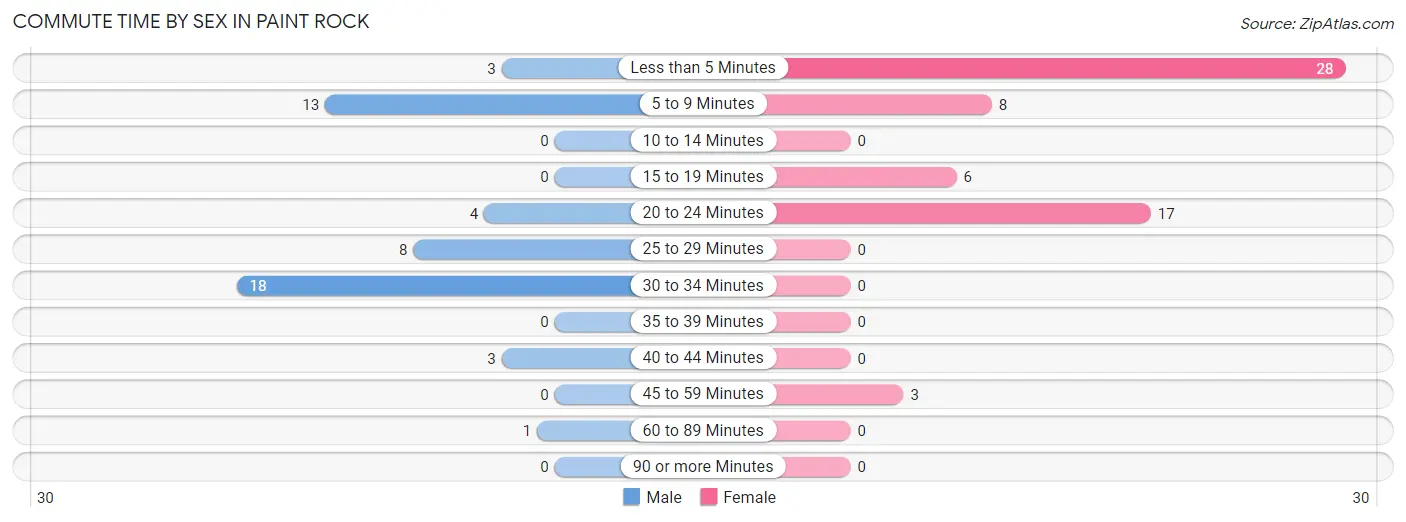
| Commute Time | Male | Female |
| Less than 5 Minutes | 3 (6.0%) | 28 (45.2%) |
| 5 to 9 Minutes | 13 (26.0%) | 8 (12.9%) |
| 10 to 14 Minutes | 0 (0.0%) | 0 (0.0%) |
| 15 to 19 Minutes | 0 (0.0%) | 6 (9.7%) |
| 20 to 24 Minutes | 4 (8.0%) | 17 (27.4%) |
| 25 to 29 Minutes | 8 (16.0%) | 0 (0.0%) |
| 30 to 34 Minutes | 18 (36.0%) | 0 (0.0%) |
| 35 to 39 Minutes | 0 (0.0%) | 0 (0.0%) |
| 40 to 44 Minutes | 3 (6.0%) | 0 (0.0%) |
| 45 to 59 Minutes | 0 (0.0%) | 3 (4.8%) |
| 60 to 89 Minutes | 1 (2.0%) | 0 (0.0%) |
| 90 or more Minutes | 0 (0.0%) | 0 (0.0%) |
Time of Departure to Work by Sex in Paint Rock
The most frequent times of departure to work in Paint Rock are 6:00 AM to 6:29 AM (18, 36.0%) for males and 4:00 PM to 11:59 PM (25, 40.3%) for females.
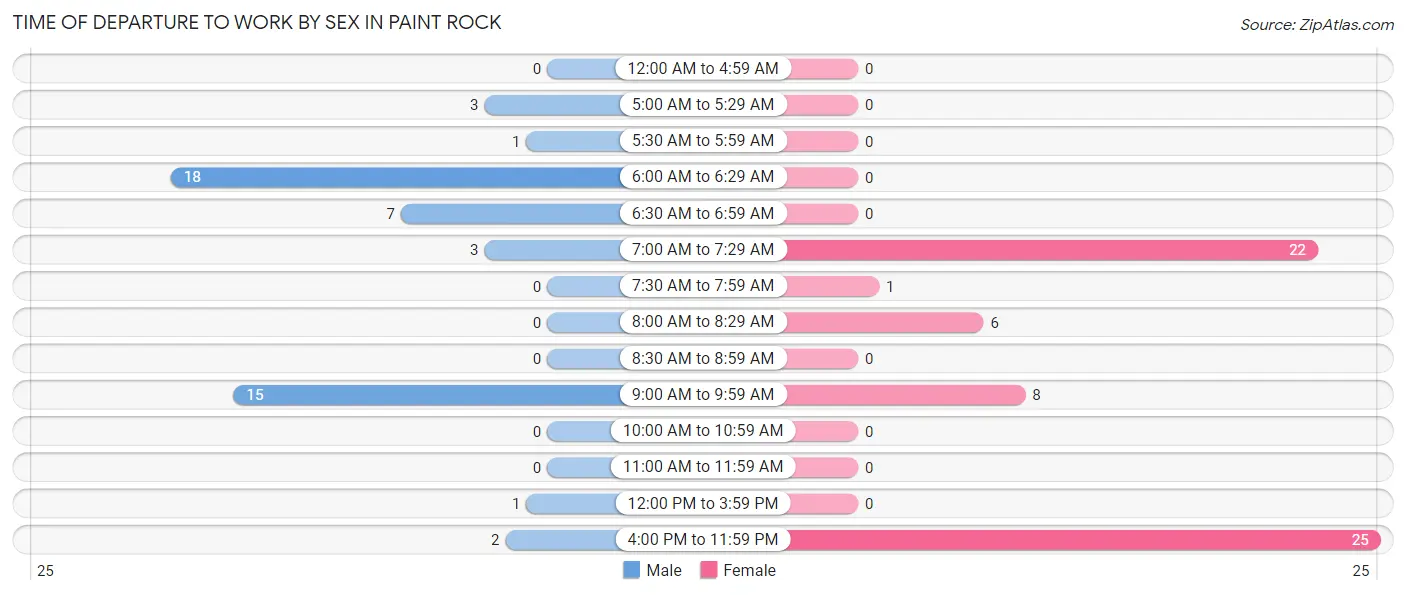
| Time of Departure | Male | Female |
| 12:00 AM to 4:59 AM | 0 (0.0%) | 0 (0.0%) |
| 5:00 AM to 5:29 AM | 3 (6.0%) | 0 (0.0%) |
| 5:30 AM to 5:59 AM | 1 (2.0%) | 0 (0.0%) |
| 6:00 AM to 6:29 AM | 18 (36.0%) | 0 (0.0%) |
| 6:30 AM to 6:59 AM | 7 (14.0%) | 0 (0.0%) |
| 7:00 AM to 7:29 AM | 3 (6.0%) | 22 (35.5%) |
| 7:30 AM to 7:59 AM | 0 (0.0%) | 1 (1.6%) |
| 8:00 AM to 8:29 AM | 0 (0.0%) | 6 (9.7%) |
| 8:30 AM to 8:59 AM | 0 (0.0%) | 0 (0.0%) |
| 9:00 AM to 9:59 AM | 15 (30.0%) | 8 (12.9%) |
| 10:00 AM to 10:59 AM | 0 (0.0%) | 0 (0.0%) |
| 11:00 AM to 11:59 AM | 0 (0.0%) | 0 (0.0%) |
| 12:00 PM to 3:59 PM | 1 (2.0%) | 0 (0.0%) |
| 4:00 PM to 11:59 PM | 2 (4.0%) | 25 (40.3%) |
| Total | 50 (100.0%) | 62 (100.0%) |
Housing Occupancy in Paint Rock
Occupancy by Ownership in Paint Rock
Of the total 71 dwellings in Paint Rock, owner-occupied units account for 57 (80.3%), while renter-occupied units make up 14 (19.7%).
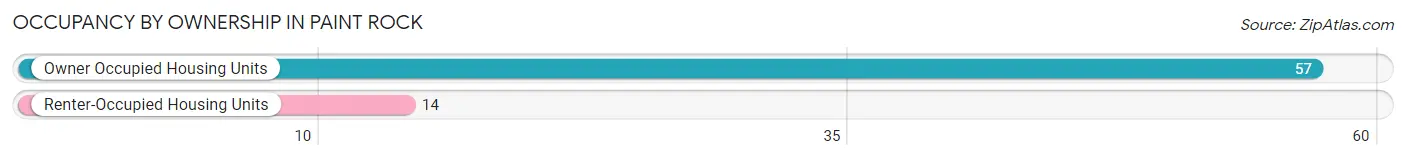
| Occupancy | # Housing Units | % Housing Units |
| Owner Occupied Housing Units | 57 | 80.3% |
| Renter-Occupied Housing Units | 14 | 19.7% |
| Total Occupied Housing Units | 71 | 100.0% |
Occupancy by Household Size in Paint Rock
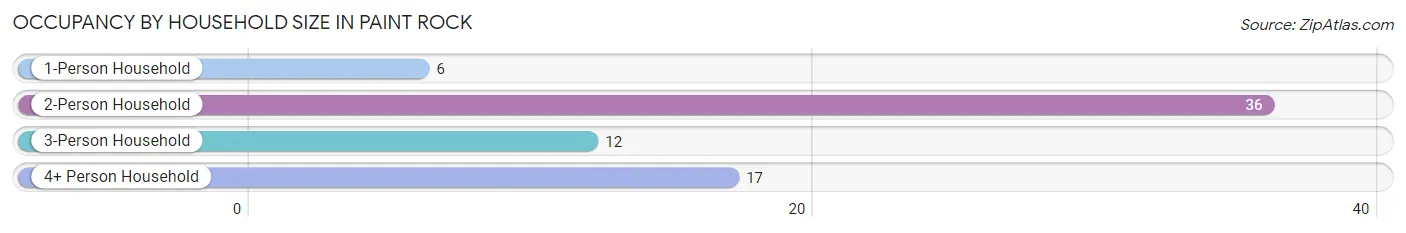
| Household Size | # Housing Units | % Housing Units |
| 1-Person Household | 6 | 8.5% |
| 2-Person Household | 36 | 50.7% |
| 3-Person Household | 12 | 16.9% |
| 4+ Person Household | 17 | 23.9% |
| Total Housing Units | 71 | 100.0% |
Occupancy by Ownership by Household Size in Paint Rock
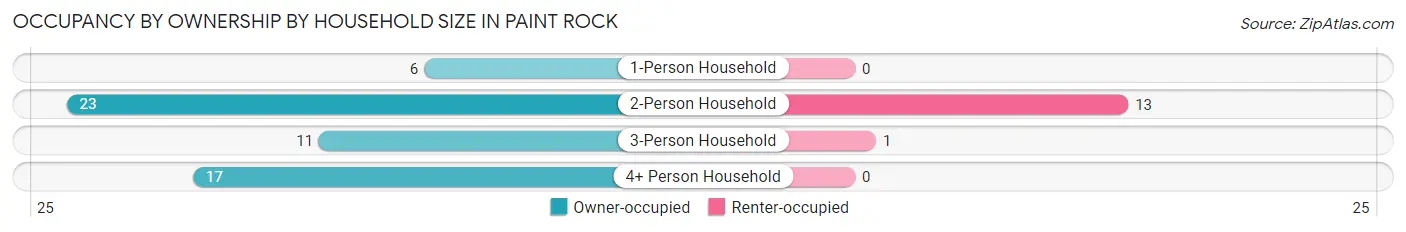
| Household Size | Owner-occupied | Renter-occupied |
| 1-Person Household | 6 (100.0%) | 0 (0.0%) |
| 2-Person Household | 23 (63.9%) | 13 (36.1%) |
| 3-Person Household | 11 (91.7%) | 1 (8.3%) |
| 4+ Person Household | 17 (100.0%) | 0 (0.0%) |
| Total Housing Units | 57 (80.3%) | 14 (19.7%) |
Occupancy by Educational Attainment in Paint Rock
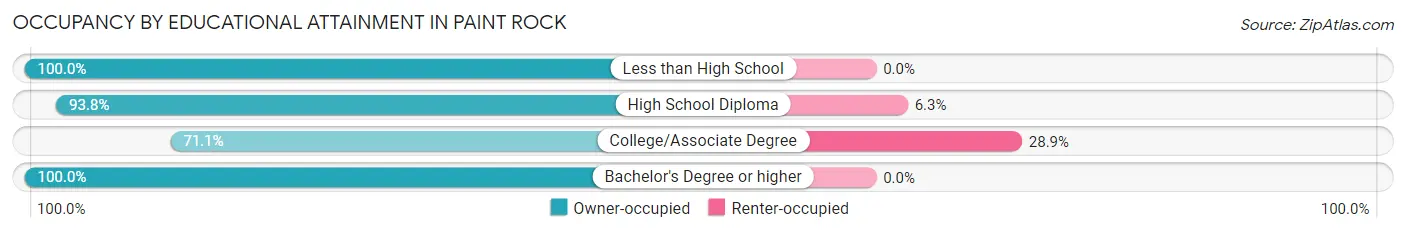
| Household Size | Owner-occupied | Renter-occupied |
| Less than High School | 1 (100.0%) | 0 (0.0%) |
| High School Diploma | 15 (93.8%) | 1 (6.2%) |
| College/Associate Degree | 32 (71.1%) | 13 (28.9%) |
| Bachelor's Degree or higher | 9 (100.0%) | 0 (0.0%) |
Occupancy by Age of Householder in Paint Rock
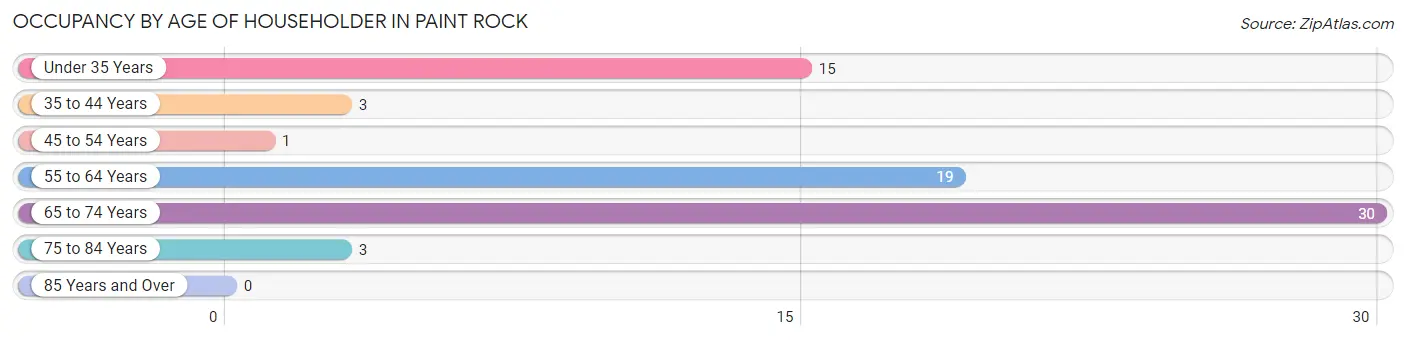
| Age Bracket | # Households | % Households |
| Under 35 Years | 15 | 21.1% |
| 35 to 44 Years | 3 | 4.2% |
| 45 to 54 Years | 1 | 1.4% |
| 55 to 64 Years | 19 | 26.8% |
| 65 to 74 Years | 30 | 42.2% |
| 75 to 84 Years | 3 | 4.2% |
| 85 Years and Over | 0 | 0.0% |
| Total | 71 | 100.0% |
Housing Finances in Paint Rock
Median Income by Occupancy in Paint Rock
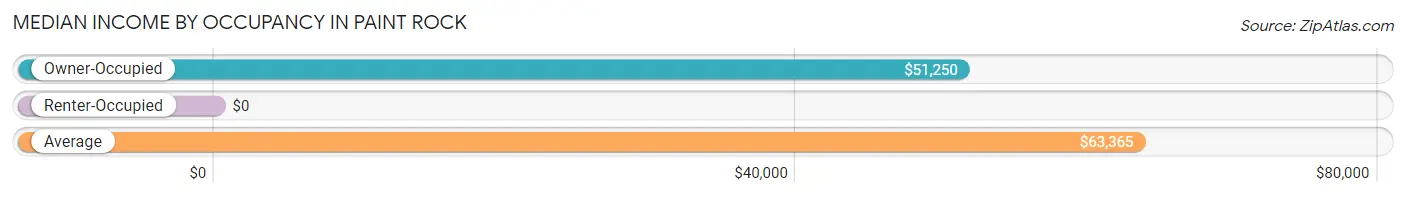
| Occupancy Type | # Households | Median Income |
| Owner-Occupied | 57 (80.3%) | $51,250 |
| Renter-Occupied | 14 (19.7%) | $0 |
| Average | 71 (100.0%) | $63,365 |
Occupancy by Householder Income Bracket in Paint Rock
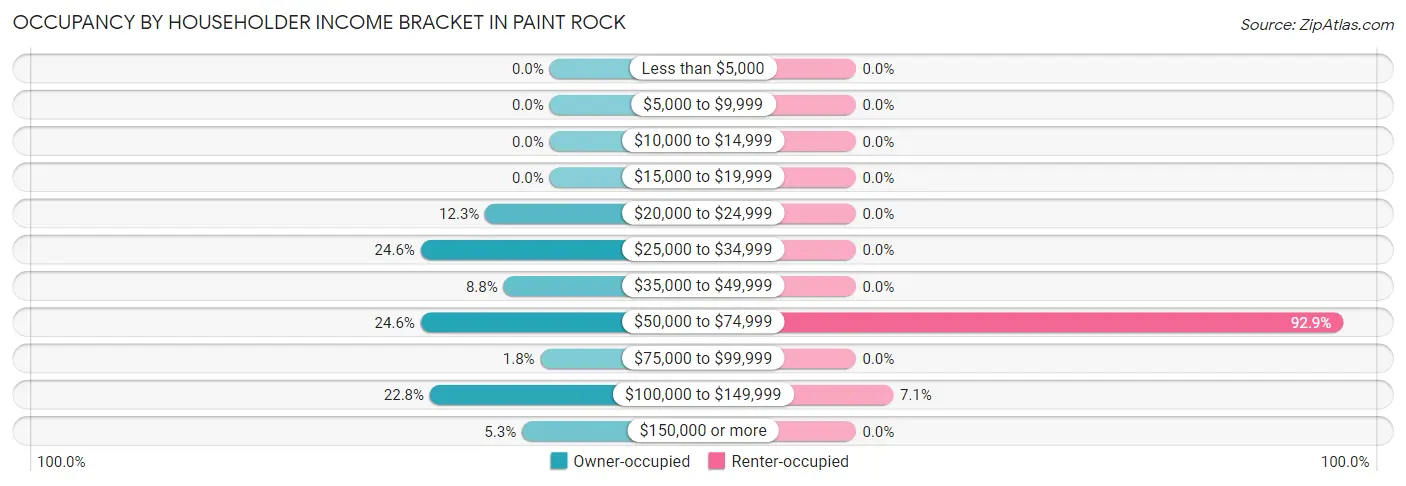
| Income Bracket | Owner-occupied | Renter-occupied |
| Less than $5,000 | 0 (0.0%) | 0 (0.0%) |
| $5,000 to $9,999 | 0 (0.0%) | 0 (0.0%) |
| $10,000 to $14,999 | 0 (0.0%) | 0 (0.0%) |
| $15,000 to $19,999 | 0 (0.0%) | 0 (0.0%) |
| $20,000 to $24,999 | 7 (12.3%) | 0 (0.0%) |
| $25,000 to $34,999 | 14 (24.6%) | 0 (0.0%) |
| $35,000 to $49,999 | 5 (8.8%) | 0 (0.0%) |
| $50,000 to $74,999 | 14 (24.6%) | 13 (92.9%) |
| $75,000 to $99,999 | 1 (1.8%) | 0 (0.0%) |
| $100,000 to $149,999 | 13 (22.8%) | 1 (7.1%) |
| $150,000 or more | 3 (5.3%) | 0 (0.0%) |
| Total | 57 (100.0%) | 14 (100.0%) |
Monthly Housing Cost Tiers in Paint Rock
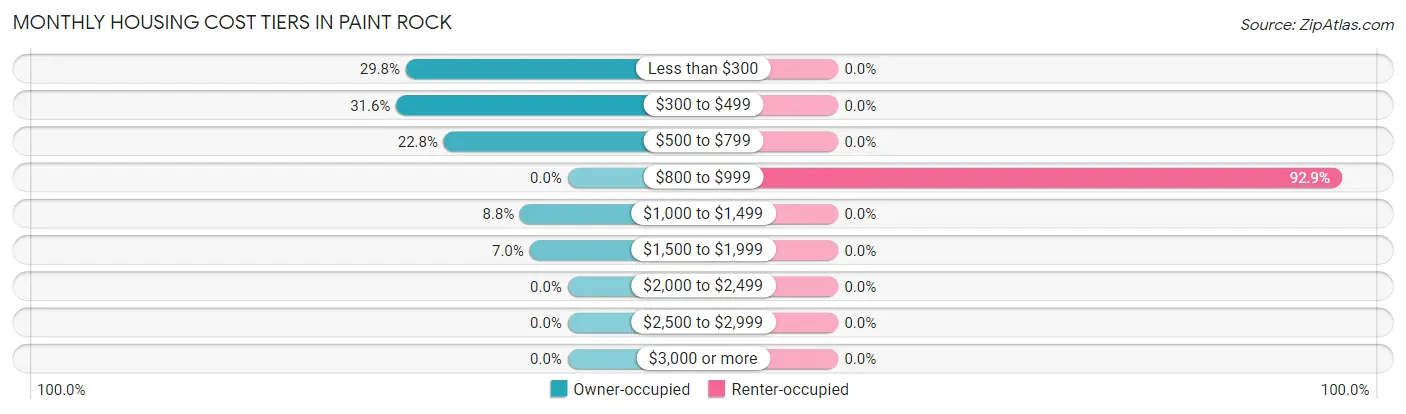
| Monthly Cost | Owner-occupied | Renter-occupied |
| Less than $300 | 17 (29.8%) | 0 (0.0%) |
| $300 to $499 | 18 (31.6%) | 0 (0.0%) |
| $500 to $799 | 13 (22.8%) | 0 (0.0%) |
| $800 to $999 | 0 (0.0%) | 13 (92.9%) |
| $1,000 to $1,499 | 5 (8.8%) | 0 (0.0%) |
| $1,500 to $1,999 | 4 (7.0%) | 0 (0.0%) |
| $2,000 to $2,499 | 0 (0.0%) | 0 (0.0%) |
| $2,500 to $2,999 | 0 (0.0%) | 0 (0.0%) |
| $3,000 or more | 0 (0.0%) | 0 (0.0%) |
| Total | 57 (100.0%) | 14 (100.0%) |
Physical Housing Characteristics in Paint Rock
Housing Structures in Paint Rock
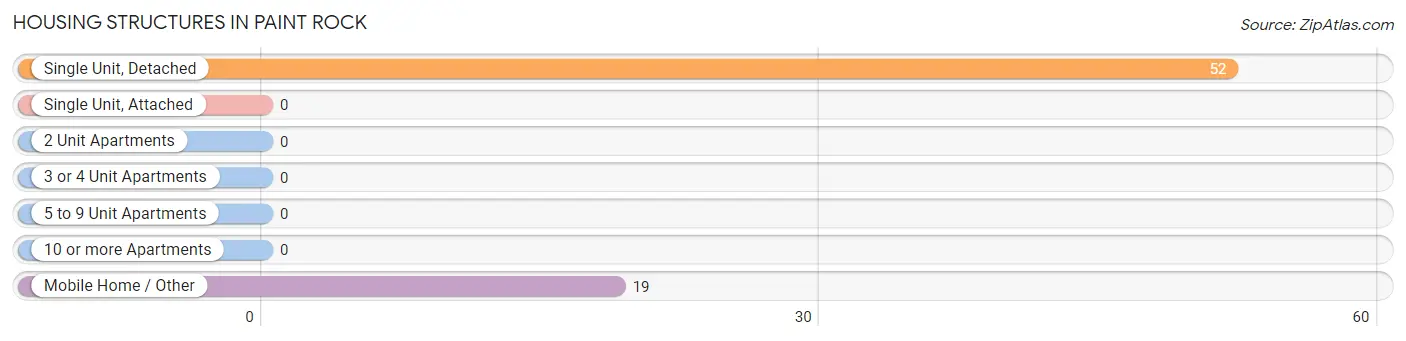
| Structure Type | # Housing Units | % Housing Units |
| Single Unit, Detached | 52 | 73.2% |
| Single Unit, Attached | 0 | 0.0% |
| 2 Unit Apartments | 0 | 0.0% |
| 3 or 4 Unit Apartments | 0 | 0.0% |
| 5 to 9 Unit Apartments | 0 | 0.0% |
| 10 or more Apartments | 0 | 0.0% |
| Mobile Home / Other | 19 | 26.8% |
| Total | 71 | 100.0% |
Housing Structures by Occupancy in Paint Rock
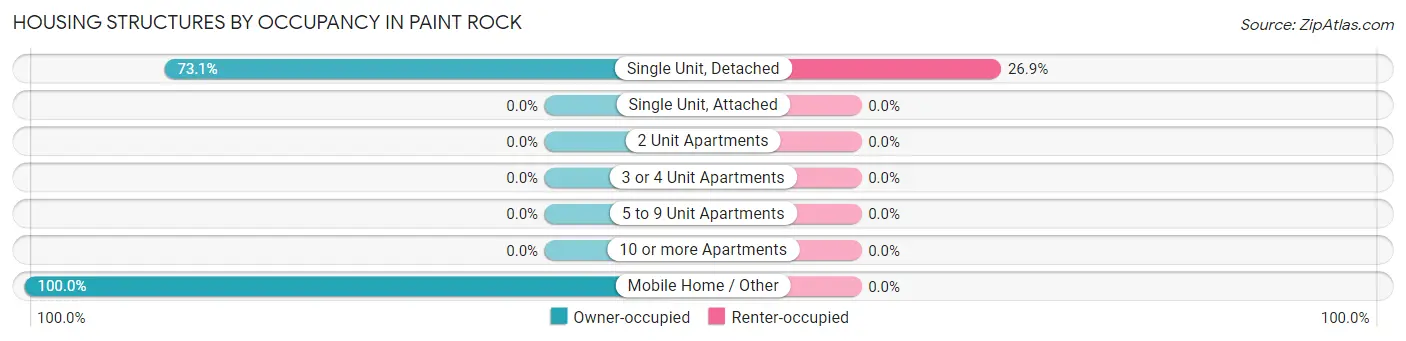
| Structure Type | Owner-occupied | Renter-occupied |
| Single Unit, Detached | 38 (73.1%) | 14 (26.9%) |
| Single Unit, Attached | 0 (0.0%) | 0 (0.0%) |
| 2 Unit Apartments | 0 (0.0%) | 0 (0.0%) |
| 3 or 4 Unit Apartments | 0 (0.0%) | 0 (0.0%) |
| 5 to 9 Unit Apartments | 0 (0.0%) | 0 (0.0%) |
| 10 or more Apartments | 0 (0.0%) | 0 (0.0%) |
| Mobile Home / Other | 19 (100.0%) | 0 (0.0%) |
| Total | 57 (80.3%) | 14 (19.7%) |
Housing Structures by Number of Rooms in Paint Rock
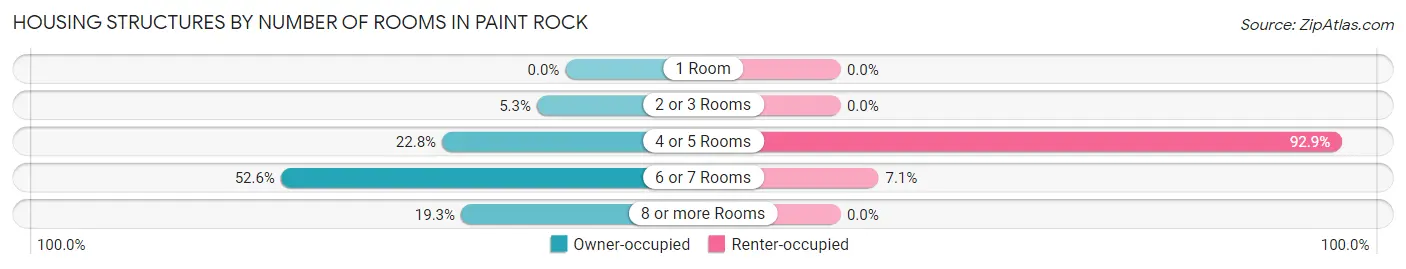
| Number of Rooms | Owner-occupied | Renter-occupied |
| 1 Room | 0 (0.0%) | 0 (0.0%) |
| 2 or 3 Rooms | 3 (5.3%) | 0 (0.0%) |
| 4 or 5 Rooms | 13 (22.8%) | 13 (92.9%) |
| 6 or 7 Rooms | 30 (52.6%) | 1 (7.1%) |
| 8 or more Rooms | 11 (19.3%) | 0 (0.0%) |
| Total | 57 (100.0%) | 14 (100.0%) |
Housing Structure by Heating Type in Paint Rock
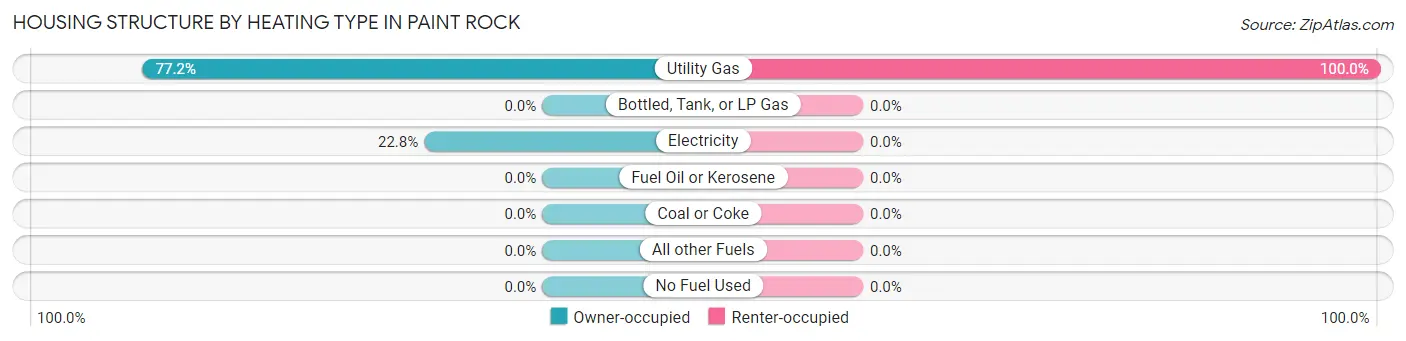
| Heating Type | Owner-occupied | Renter-occupied |
| Utility Gas | 44 (77.2%) | 14 (100.0%) |
| Bottled, Tank, or LP Gas | 0 (0.0%) | 0 (0.0%) |
| Electricity | 13 (22.8%) | 0 (0.0%) |
| Fuel Oil or Kerosene | 0 (0.0%) | 0 (0.0%) |
| Coal or Coke | 0 (0.0%) | 0 (0.0%) |
| All other Fuels | 0 (0.0%) | 0 (0.0%) |
| No Fuel Used | 0 (0.0%) | 0 (0.0%) |
| Total | 57 (100.0%) | 14 (100.0%) |
Household Vehicle Usage in Paint Rock
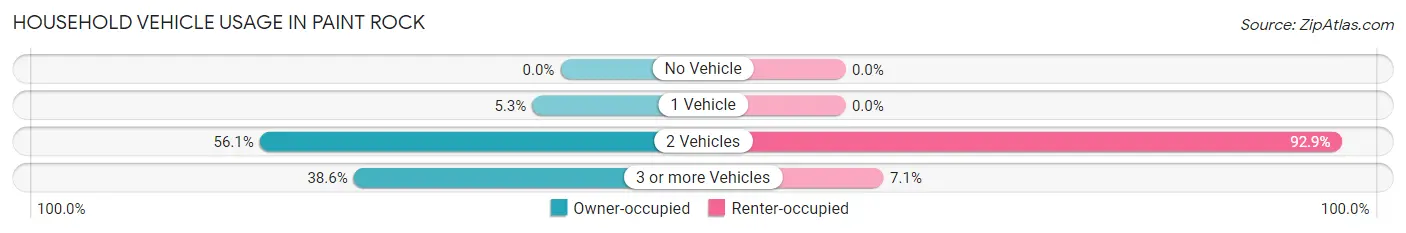
| Vehicles per Household | Owner-occupied | Renter-occupied |
| No Vehicle | 0 (0.0%) | 0 (0.0%) |
| 1 Vehicle | 3 (5.3%) | 0 (0.0%) |
| 2 Vehicles | 32 (56.1%) | 13 (92.9%) |
| 3 or more Vehicles | 22 (38.6%) | 1 (7.1%) |
| Total | 57 (100.0%) | 14 (100.0%) |
Real Estate & Mortgages in Paint Rock
Real Estate and Mortgage Overview in Paint Rock
| Characteristic | Without Mortgage | With Mortgage |
| Housing Units | 47 | 10 |
| Median Property Value | $49,400 | $125,000 |
| Median Household Income | $50,750 | $1 |
| Monthly Housing Costs | $423 | $0 |
| Real Estate Taxes | $824 | $0 |
Property Value by Mortgage Status in Paint Rock
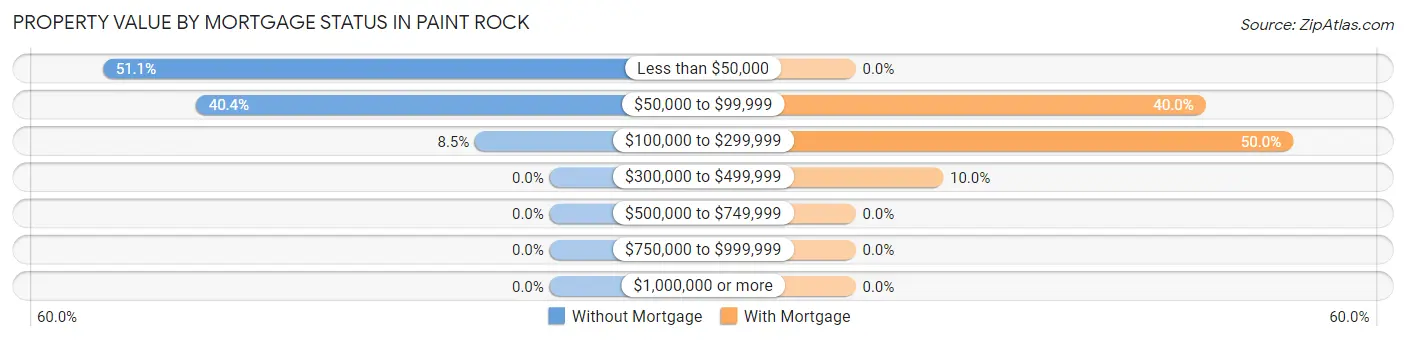
| Property Value | Without Mortgage | With Mortgage |
| Less than $50,000 | 24 (51.1%) | 0 (0.0%) |
| $50,000 to $99,999 | 19 (40.4%) | 4 (40.0%) |
| $100,000 to $299,999 | 4 (8.5%) | 5 (50.0%) |
| $300,000 to $499,999 | 0 (0.0%) | 1 (10.0%) |
| $500,000 to $749,999 | 0 (0.0%) | 0 (0.0%) |
| $750,000 to $999,999 | 0 (0.0%) | 0 (0.0%) |
| $1,000,000 or more | 0 (0.0%) | 0 (0.0%) |
| Total | 47 (100.0%) | 10 (100.0%) |
Household Income by Mortgage Status in Paint Rock
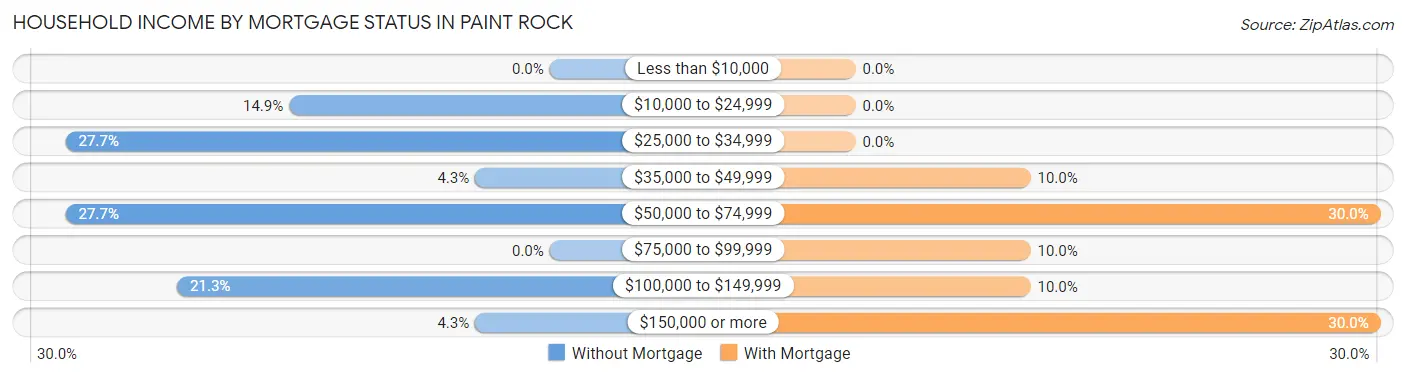
| Household Income | Without Mortgage | With Mortgage |
| Less than $10,000 | 0 (0.0%) | 0 (0.0%) |
| $10,000 to $24,999 | 7 (14.9%) | 0 (0.0%) |
| $25,000 to $34,999 | 13 (27.7%) | 0 (0.0%) |
| $35,000 to $49,999 | 2 (4.3%) | 1 (10.0%) |
| $50,000 to $74,999 | 13 (27.7%) | 3 (30.0%) |
| $75,000 to $99,999 | 0 (0.0%) | 1 (10.0%) |
| $100,000 to $149,999 | 10 (21.3%) | 1 (10.0%) |
| $150,000 or more | 2 (4.3%) | 3 (30.0%) |
| Total | 47 (100.0%) | 10 (100.0%) |
Property Value to Household Income Ratio in Paint Rock
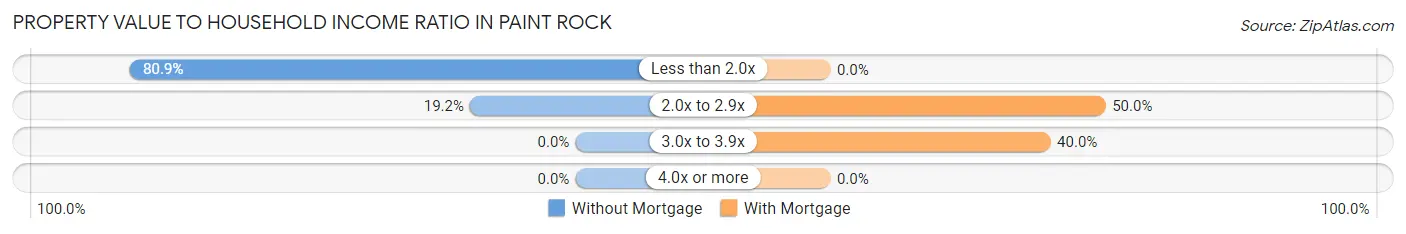
| Value-to-Income Ratio | Without Mortgage | With Mortgage |
| Less than 2.0x | 38 (80.8%) | 0 (0.0%) |
| 2.0x to 2.9x | 9 (19.2%) | 5 (50.0%) |
| 3.0x to 3.9x | 0 (0.0%) | 4 (40.0%) |
| 4.0x or more | 0 (0.0%) | 0 (0.0%) |
| Total | 47 (100.0%) | 10 (100.0%) |
Real Estate Taxes by Mortgage Status in Paint Rock
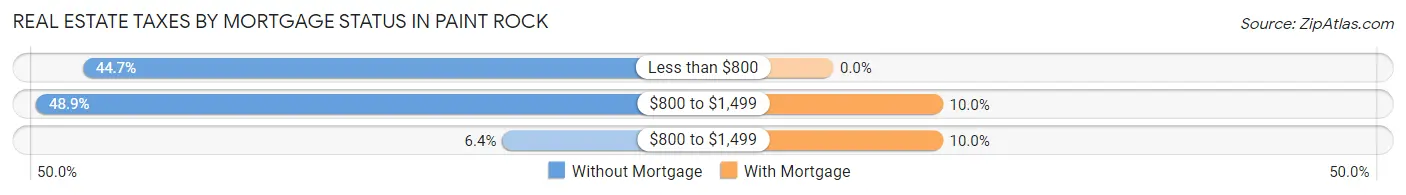
| Property Taxes | Without Mortgage | With Mortgage |
| Less than $800 | 21 (44.7%) | 0 (0.0%) |
| $800 to $1,499 | 23 (48.9%) | 1 (10.0%) |
| $800 to $1,499 | 3 (6.4%) | 1 (10.0%) |
| Total | 47 (100.0%) | 10 (100.0%) |
Health & Disability in Paint Rock
Health Insurance Coverage by Age in Paint Rock
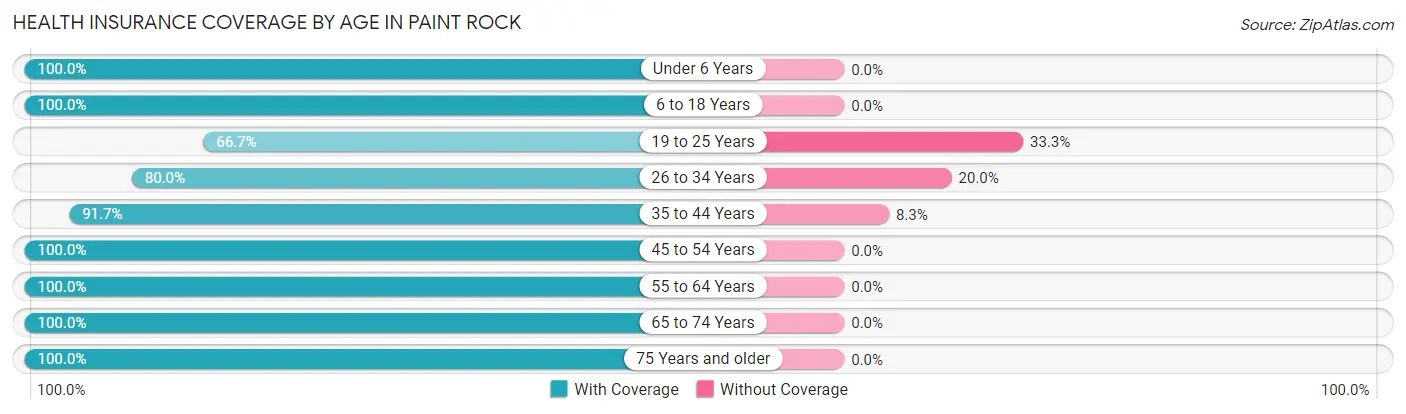
| Age Bracket | With Coverage | Without Coverage |
| Under 6 Years | 76 (100.0%) | 0 (0.0%) |
| 6 to 18 Years | 61 (100.0%) | 0 (0.0%) |
| 19 to 25 Years | 2 (66.7%) | 1 (33.3%) |
| 26 to 34 Years | 16 (80.0%) | 4 (20.0%) |
| 35 to 44 Years | 22 (91.7%) | 2 (8.3%) |
| 45 to 54 Years | 17 (100.0%) | 0 (0.0%) |
| 55 to 64 Years | 31 (100.0%) | 0 (0.0%) |
| 65 to 74 Years | 39 (100.0%) | 0 (0.0%) |
| 75 Years and older | 39 (100.0%) | 0 (0.0%) |
| Total | 303 (97.7%) | 7 (2.3%) |
Health Insurance Coverage by Citizenship Status in Paint Rock
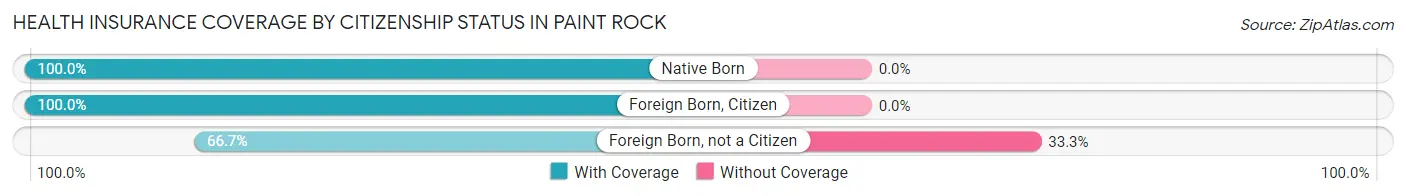
| Citizenship Status | With Coverage | Without Coverage |
| Native Born | 76 (100.0%) | 0 (0.0%) |
| Foreign Born, Citizen | 61 (100.0%) | 0 (0.0%) |
| Foreign Born, not a Citizen | 2 (66.7%) | 1 (33.3%) |
Health Insurance Coverage by Household Income in Paint Rock
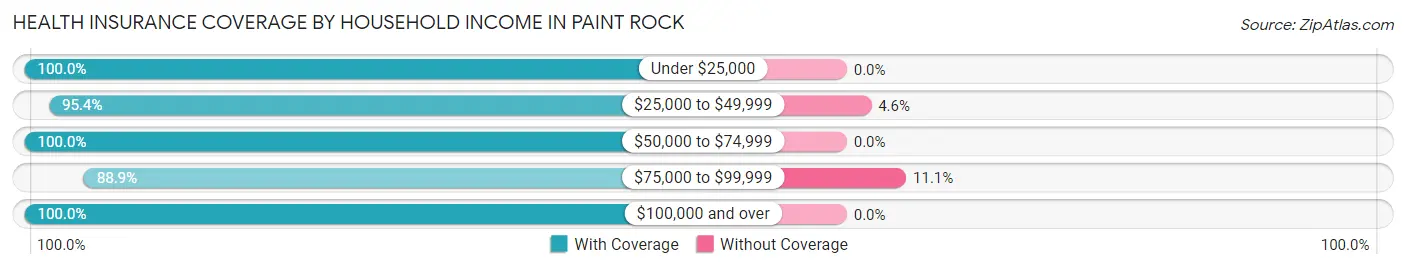
| Household Income | With Coverage | Without Coverage |
| Under $25,000 | 9 (100.0%) | 0 (0.0%) |
| $25,000 to $49,999 | 125 (95.4%) | 6 (4.6%) |
| $50,000 to $74,999 | 60 (100.0%) | 0 (0.0%) |
| $75,000 to $99,999 | 8 (88.9%) | 1 (11.1%) |
| $100,000 and over | 101 (100.0%) | 0 (0.0%) |
Public vs Private Health Insurance Coverage by Age in Paint Rock
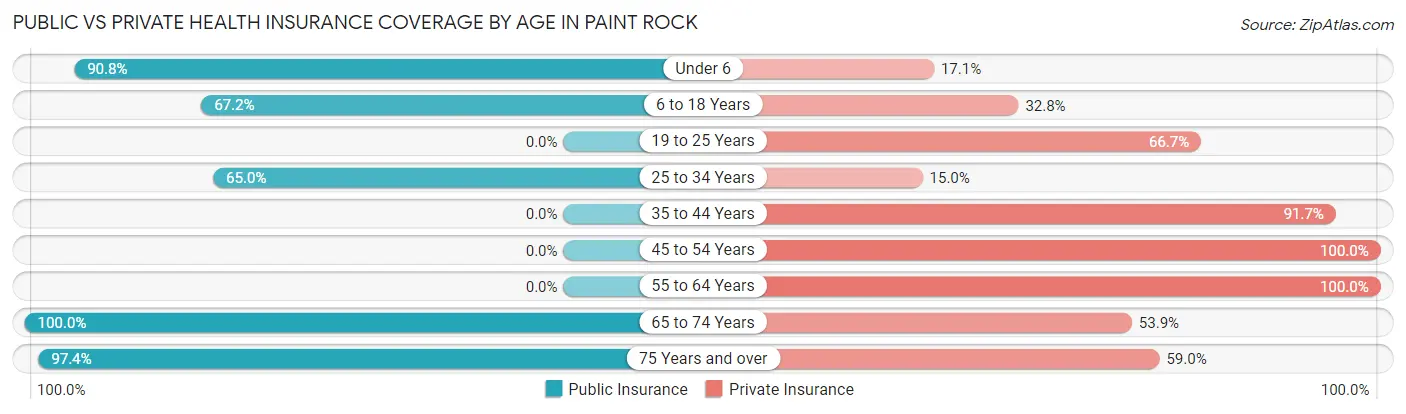
| Age Bracket | Public Insurance | Private Insurance |
| Under 6 | 69 (90.8%) | 13 (17.1%) |
| 6 to 18 Years | 41 (67.2%) | 20 (32.8%) |
| 19 to 25 Years | 0 (0.0%) | 2 (66.7%) |
| 25 to 34 Years | 13 (65.0%) | 3 (15.0%) |
| 35 to 44 Years | 0 (0.0%) | 22 (91.7%) |
| 45 to 54 Years | 0 (0.0%) | 17 (100.0%) |
| 55 to 64 Years | 0 (0.0%) | 31 (100.0%) |
| 65 to 74 Years | 39 (100.0%) | 21 (53.8%) |
| 75 Years and over | 38 (97.4%) | 23 (59.0%) |
| Total | 200 (64.5%) | 152 (49.0%) |
Disability Status by Sex by Age in Paint Rock
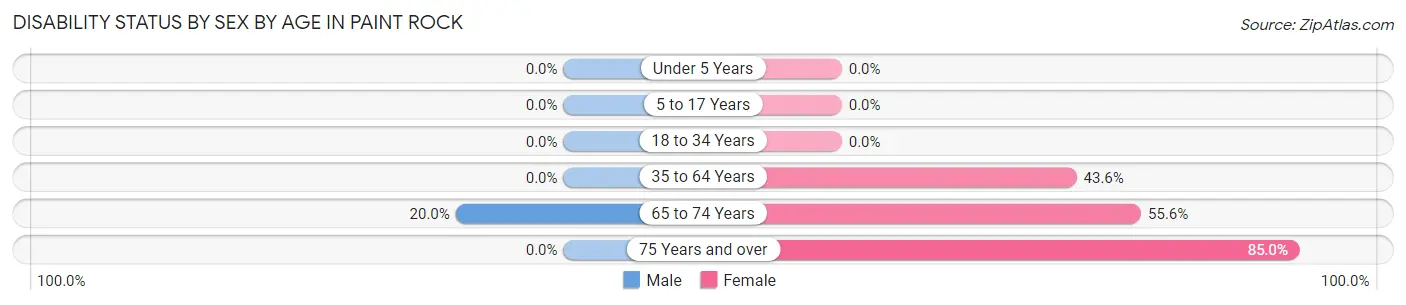
| Age Bracket | Male | Female |
| Under 5 Years | 0 (0.0%) | 0 (0.0%) |
| 5 to 17 Years | 0 (0.0%) | 0 (0.0%) |
| 18 to 34 Years | 0 (0.0%) | 0 (0.0%) |
| 35 to 64 Years | 0 (0.0%) | 17 (43.6%) |
| 65 to 74 Years | 6 (20.0%) | 5 (55.6%) |
| 75 Years and over | 0 (0.0%) | 17 (85.0%) |
Disability Class by Sex by Age in Paint Rock
Disability Class: Hearing Difficulty
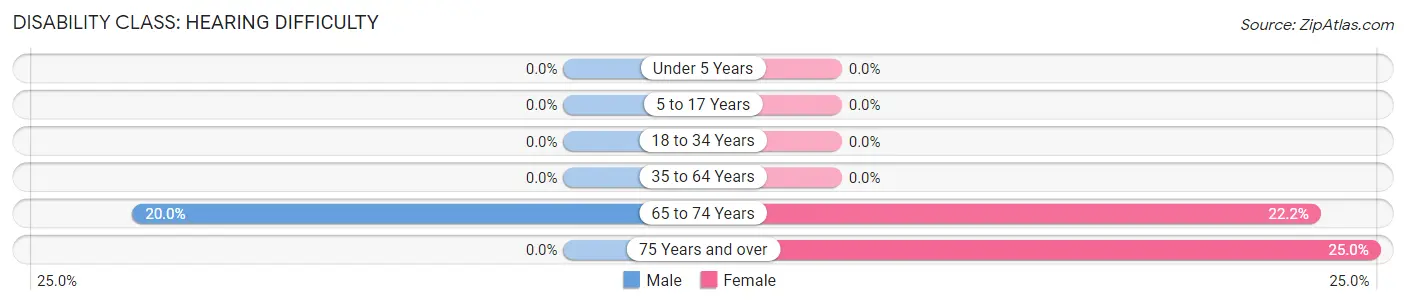
| Age Bracket | Male | Female |
| Under 5 Years | 0 (0.0%) | 0 (0.0%) |
| 5 to 17 Years | 0 (0.0%) | 0 (0.0%) |
| 18 to 34 Years | 0 (0.0%) | 0 (0.0%) |
| 35 to 64 Years | 0 (0.0%) | 0 (0.0%) |
| 65 to 74 Years | 6 (20.0%) | 2 (22.2%) |
| 75 Years and over | 0 (0.0%) | 5 (25.0%) |
Disability Class: Vision Difficulty
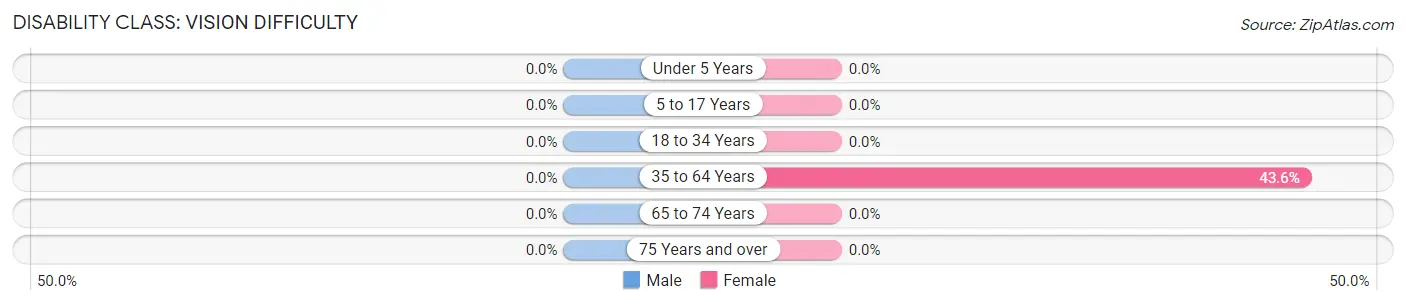
| Age Bracket | Male | Female |
| Under 5 Years | 0 (0.0%) | 0 (0.0%) |
| 5 to 17 Years | 0 (0.0%) | 0 (0.0%) |
| 18 to 34 Years | 0 (0.0%) | 0 (0.0%) |
| 35 to 64 Years | 0 (0.0%) | 17 (43.6%) |
| 65 to 74 Years | 0 (0.0%) | 0 (0.0%) |
| 75 Years and over | 0 (0.0%) | 0 (0.0%) |
Disability Class: Cognitive Difficulty
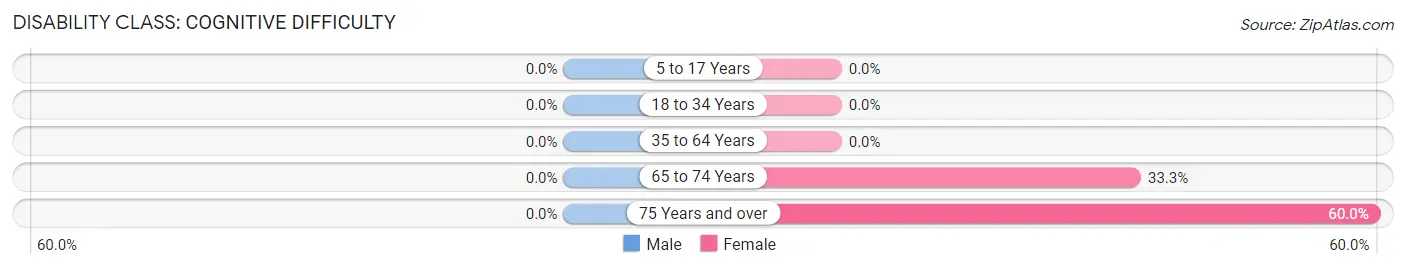
| Age Bracket | Male | Female |
| 5 to 17 Years | 0 (0.0%) | 0 (0.0%) |
| 18 to 34 Years | 0 (0.0%) | 0 (0.0%) |
| 35 to 64 Years | 0 (0.0%) | 0 (0.0%) |
| 65 to 74 Years | 0 (0.0%) | 3 (33.3%) |
| 75 Years and over | 0 (0.0%) | 12 (60.0%) |
Disability Class: Ambulatory Difficulty
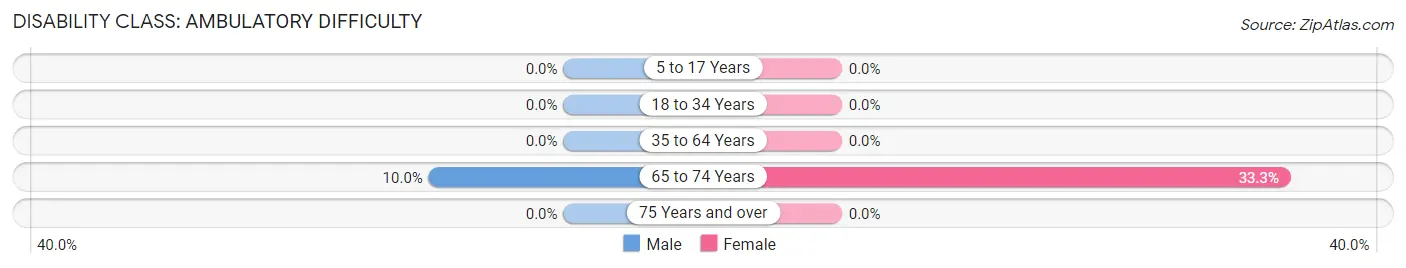
| Age Bracket | Male | Female |
| 5 to 17 Years | 0 (0.0%) | 0 (0.0%) |
| 18 to 34 Years | 0 (0.0%) | 0 (0.0%) |
| 35 to 64 Years | 0 (0.0%) | 0 (0.0%) |
| 65 to 74 Years | 3 (10.0%) | 3 (33.3%) |
| 75 Years and over | 0 (0.0%) | 0 (0.0%) |
Disability Class: Self-Care Difficulty
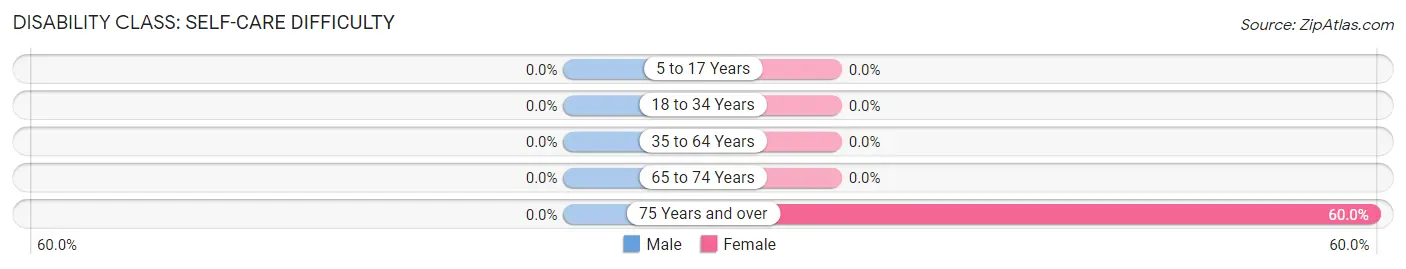
| Age Bracket | Male | Female |
| 5 to 17 Years | 0 (0.0%) | 0 (0.0%) |
| 18 to 34 Years | 0 (0.0%) | 0 (0.0%) |
| 35 to 64 Years | 0 (0.0%) | 0 (0.0%) |
| 65 to 74 Years | 0 (0.0%) | 0 (0.0%) |
| 75 Years and over | 0 (0.0%) | 12 (60.0%) |
Technology Access in Paint Rock
Computing Device Access in Paint Rock
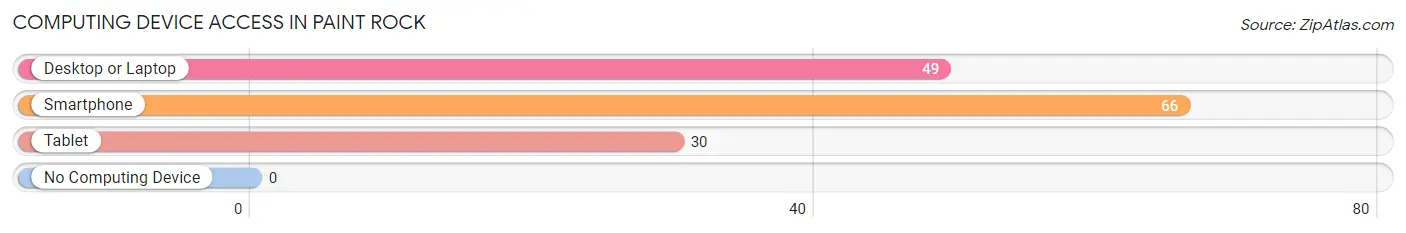
| Device Type | # Households | % Households |
| Desktop or Laptop | 49 | 69.0% |
| Smartphone | 66 | 93.0% |
| Tablet | 30 | 42.2% |
| No Computing Device | 0 | 0.0% |
| Total | 71 | 100.0% |
Internet Access in Paint Rock
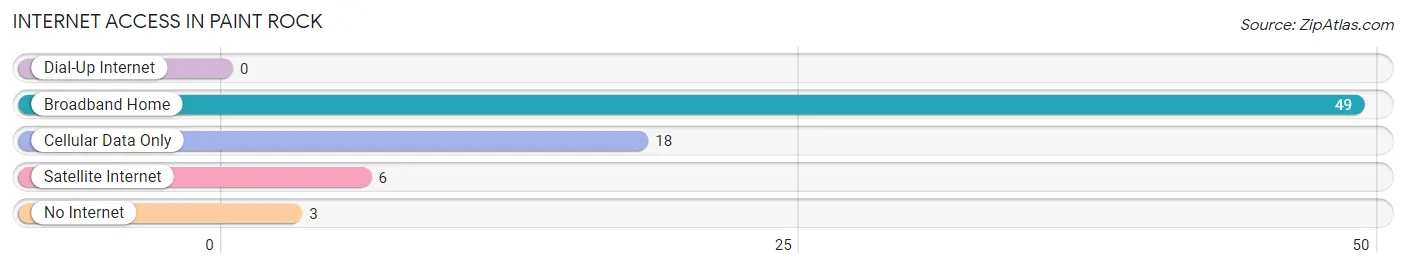
| Internet Type | # Households | % Households |
| Dial-Up Internet | 0 | 0.0% |
| Broadband Home | 49 | 69.0% |
| Cellular Data Only | 18 | 25.4% |
| Satellite Internet | 6 | 8.5% |
| No Internet | 3 | 4.2% |
| Total | 71 | 100.0% |
Paint Rock Summary
Paint Rock is a small unincorporated community located in Concho County, Texas, United States. It is situated along the banks of the Concho River, approximately 20 miles north of San Angelo. The town was established in 1875 and is named after a nearby rock formation that was painted by Native Americans.
History
The area around Paint Rock was first inhabited by Native Americans, including the Comanche, Kiowa, and Apache tribes. The rock formation that gives the town its name was painted by these tribes, and is believed to have been used as a marker for a nearby trading post.
The first settlers in the area were ranchers, who began arriving in the late 1800s. The town of Paint Rock was officially established in 1875, and the first post office was opened in 1876. The town quickly grew, and by the early 1900s, it had become a bustling center of commerce.
Geography
Paint Rock is located in Concho County, Texas, approximately 20 miles north of San Angelo. The town is situated along the banks of the Concho River, and is surrounded by rolling hills and grasslands. The climate is semi-arid, with hot summers and mild winters.
Economy
The economy of Paint Rock is largely based on agriculture and ranching. The town is home to several large ranches, and the surrounding area is used for raising cattle and growing crops such as cotton, corn, and wheat.
The town also has a small manufacturing sector, with several small businesses producing a variety of goods. These include furniture, clothing, and leather goods.
Demographics
As of the 2010 census, the population of Paint Rock was 545. The racial makeup of the town was 94.2% White, 0.2% African American, 0.4% Native American, 0.2% Asian, 0.2% Pacific Islander, 3.3% from other races, and 1.5% from two or more races. Hispanic or Latino of any race were 6.2% of the population.
The median household income in Paint Rock was $31,250, and the median family income was $37,500. The per capita income for the town was $14,945. About 17.2% of families and 20.2% of the population were below the poverty line, including 28.3% of those under age 18 and 10.3% of those age 65 or over.
Conclusion
Paint Rock is a small unincorporated community located in Concho County, Texas. It was established in 1875 and is named after a nearby rock formation that was painted by Native Americans. The town is situated along the banks of the Concho River, and is surrounded by rolling hills and grasslands. The economy of Paint Rock is largely based on agriculture and ranching, and the town also has a small manufacturing sector. As of the 2010 census, the population of Paint Rock was 545.
Common Questions
What is Per Capita Income in Paint Rock?
Per Capita income in Paint Rock is $21,160.
What is the Median Family Income in Paint Rock?
Median Family Income in Paint Rock is $63,942.
What is the Median Household income in Paint Rock?
Median Household Income in Paint Rock is $63,365.
What is Income or Wage Gap in Paint Rock?
Income or Wage Gap in Paint Rock is 26.4%.
Women in Paint Rock earn 73.6 cents for every dollar earned by a man.
What is Inequality or Gini Index in Paint Rock?
Inequality or Gini Index in Paint Rock is 0.31.
What is the Total Population of Paint Rock?
Total Population of Paint Rock is 310.
What is the Total Male Population of Paint Rock?
Total Male Population of Paint Rock is 148.
What is the Total Female Population of Paint Rock?
Total Female Population of Paint Rock is 162.
What is the Ratio of Males per 100 Females in Paint Rock?
There are 91.36 Males per 100 Females in Paint Rock.
What is the Ratio of Females per 100 Males in Paint Rock?
There are 109.46 Females per 100 Males in Paint Rock.
What is the Median Population Age in Paint Rock?
Median Population Age in Paint Rock is 29.9 Years.
What is the Average Family Size in Paint Rock
Average Family Size in Paint Rock is 4.7 People.
What is the Average Household Size in Paint Rock
Average Household Size in Paint Rock is 4.4 People.
How Large is the Labor Force in Paint Rock?
There are 112 People in the Labor Forcein in Paint Rock.
What is the Percentage of People in the Labor Force in Paint Rock?
61.2% of People are in the Labor Force in Paint Rock.