Zip Codes with the Highest Poverty Level Among Children Under the Age of 5 in San Antonio, TX

RELATED REPORTS & OPTIONS

Highest Poverty | Child 0-5
Population
Families and Households
Female Fertility
Female Fertility (Unmarried)
Race (Community Size)
Race (Percentage)
Ancestry (Community Size)
AfghanAfricanAlbanianAleutAlsatianAmericanApacheArabArgentineanArmenianAustralianAustrianBahamianBangladeshiBarbadianBasqueBelgianBelizeanBhutaneseBlackfeetBolivianBrazilianBritishBritish West IndianBulgarianBurmeseCajunCambodianCanadianCape VerdeanCelticCentral AmericanCentral American IndianCherokeeCheyenneChickasawChileanChineseChippewaChoctawColombianComancheCosta RicanCreekCroatianCubanCzechCzechoslovakianDanishDelawareDominicanDutchDutch West IndianEastern EuropeanEcuadorianEgyptianEnglishEstonianEthiopianEuropeanFilipinoFinnishFrenchFrench American IndianFrench CanadianGermanGerman RussianGhanaianGreekGuamanian / ChamorroGuatemalanGuyaneseHaitianHonduranHopiHungarianIcelanderIndian (Asian)IndonesianInupiatIranianIraqiIrishIroquoisIsraeliItalianJamaicanJapaneseJordanianKenyanKoreanLaotianLatvianLebaneseLiberianLithuanianLumbeeLuxembourgerMacedonianMalaysianMexicanMexican American IndianMongolianMoroccanNative HawaiianNavajoNew ZealanderNicaraguanNigerianNorthern EuropeanNorwegianOkinawanOsageOttawaPakistaniPalestinianPanamanianParaguayanPennsylvania GermanPeruvianPimaPolishPortuguesePotawatomiPuebloPuerto RicanRomanianRussianSalvadoranSamoanScandinavianScotch-IrishScottishSeminoleSerbianShoshoneSierra LeoneanSiouxSlavicSlovakSloveneSomaliSouth AfricanSouth AmericanSouth American IndianSoviet UnionSpaniardSpanishSpanish AmericanSpanish American IndianSri LankanSubsaharan AfricanSudaneseSwedishSwissSyrianThaiTrinidadian and TobagonianTurkishU.S. Virgin IslanderUgandanUkrainianUruguayanUteVenezuelanVietnameseWelshWest IndianYaquiYugoslavian
Ancestry (Percentage)
AfghanAfricanAlbanianAleutAlsatianAmericanApacheArabArgentineanArmenianAustralianAustrianBahamianBangladeshiBarbadianBasqueBelgianBelizeanBhutaneseBlackfeetBolivianBrazilianBritishBritish West IndianBulgarianBurmeseCajunCambodianCanadianCape VerdeanCelticCentral AmericanCentral American IndianCherokeeCheyenneChickasawChileanChineseChippewaChoctawColombianComancheCosta RicanCreekCroatianCubanCzechCzechoslovakianDanishDelawareDominicanDutchDutch West IndianEastern EuropeanEcuadorianEgyptianEnglishEstonianEthiopianEuropeanFilipinoFinnishFrenchFrench American IndianFrench CanadianGermanGerman RussianGhanaianGreekGuamanian / ChamorroGuatemalanGuyaneseHaitianHonduranHopiHungarianIcelanderIndian (Asian)IndonesianInupiatIranianIraqiIrishIroquoisIsraeliItalianJamaicanJapaneseJordanianKenyanKoreanLaotianLatvianLebaneseLiberianLithuanianLumbeeLuxembourgerMacedonianMalaysianMexicanMexican American IndianMongolianMoroccanNative HawaiianNavajoNew ZealanderNicaraguanNigerianNorthern EuropeanNorwegianOkinawanOsageOttawaPakistaniPalestinianPanamanianParaguayanPennsylvania GermanPeruvianPimaPolishPortuguesePotawatomiPuebloPuerto RicanRomanianRussianSalvadoranSamoanScandinavianScotch-IrishScottishSeminoleSerbianShoshoneSierra LeoneanSiouxSlavicSlovakSloveneSomaliSouth AfricanSouth AmericanSouth American IndianSoviet UnionSpaniardSpanishSpanish AmericanSpanish American IndianSri LankanSubsaharan AfricanSudaneseSwedishSwissSyrianThaiTrinidadian and TobagonianTurkishU.S. Virgin IslanderUgandanUkrainianUruguayanUteVenezuelanVietnameseWelshWest IndianYaquiYugoslavian
Immigrant Origin (Total)
AfghanistanAfricaArgentinaAsiaAustraliaAustriaBangladeshBarbadosBelizeBoliviaBrazilBulgariaBurma / MyanmarCambodiaCameroonCanadaCaribbeanCentral AmericaChileChinaColombiaCongoCosta RicaCubaCzechoslovakiaDenmarkDominican RepublicEastern AfricaEastern AsiaEastern EuropeEcuadorEgyptEl SalvadorEnglandEritreaEthiopiaEuropeFijiFranceGermanyGhanaGreeceGuatemalaGuyanaHaitiHondurasHong KongHungaryIndiaIndonesiaIranIraqIrelandIsraelItalyJamaicaJapanJordanKazakhstanKenyaKoreaKuwaitLaosLatin AmericaLatviaLebanonLiberiaLithuaniaMalaysiaMexicoMiddle AfricaMoldovaMoroccoNepalNetherlandsNicaraguaNigeriaNorthern AfricaNorthern EuropeNorwayOceaniaPakistanPanamaPeruPhilippinesPolandPortugalRomaniaRussiaSaudi ArabiaScotlandSerbiaSierra LeoneSingaporeSomaliaSouth AfricaSouth AmericaSouth Central AsiaSouth Eastern AsiaSouthern EuropeSpainSri LankaSudanSwedenSwitzerlandSyriaTaiwanThailandTrinidad and TobagoTurkeyUgandaUkraineUruguayUzbekistanVenezuelaVietnamWestern AfricaWestern AsiaWestern EuropeZaireZimbabwe
Immigrant Origin (Percentage)
AfghanistanAfricaArgentinaAsiaAustraliaAustriaBangladeshBarbadosBelizeBoliviaBrazilBulgariaBurma / MyanmarCambodiaCameroonCanadaCaribbeanCentral AmericaChileChinaColombiaCongoCosta RicaCubaCzechoslovakiaDenmarkDominican RepublicEastern AfricaEastern AsiaEastern EuropeEcuadorEgyptEl SalvadorEnglandEritreaEthiopiaEuropeFijiFranceGermanyGhanaGreeceGuatemalaGuyanaHaitiHondurasHong KongHungaryIndiaIndonesiaIranIraqIrelandIsraelItalyJamaicaJapanJordanKazakhstanKenyaKoreaKuwaitLaosLatin AmericaLatviaLebanonLiberiaLithuaniaMalaysiaMexicoMiddle AfricaMoldovaMoroccoNepalNetherlandsNicaraguaNigeriaNorthern AfricaNorthern EuropeNorwayOceaniaPakistanPanamaPeruPhilippinesPolandPortugalRomaniaRussiaSaudi ArabiaScotlandSerbiaSierra LeoneSingaporeSomaliaSouth AfricaSouth AmericaSouth Central AsiaSouth Eastern AsiaSouthern EuropeSpainSri LankaSudanSwedenSwitzerlandSyriaTaiwanThailandTrinidad and TobagoTurkeyUgandaUkraineUruguayUzbekistanVenezuelaVietnamWestern AfricaWestern AsiaWestern EuropeZaireZimbabwe
Income
Income (Families)
Income (Households)
Poverty
Poverty (Families)
Unemployment
Employment Occupations
Employment Industries
Employer Class
Commute Time
Commute Means
School Enrollment
Education by Degree Field
Occupancy
Finances
Physical Characteristics
San Antonio
Compare Zip Codes
Comparison Subject

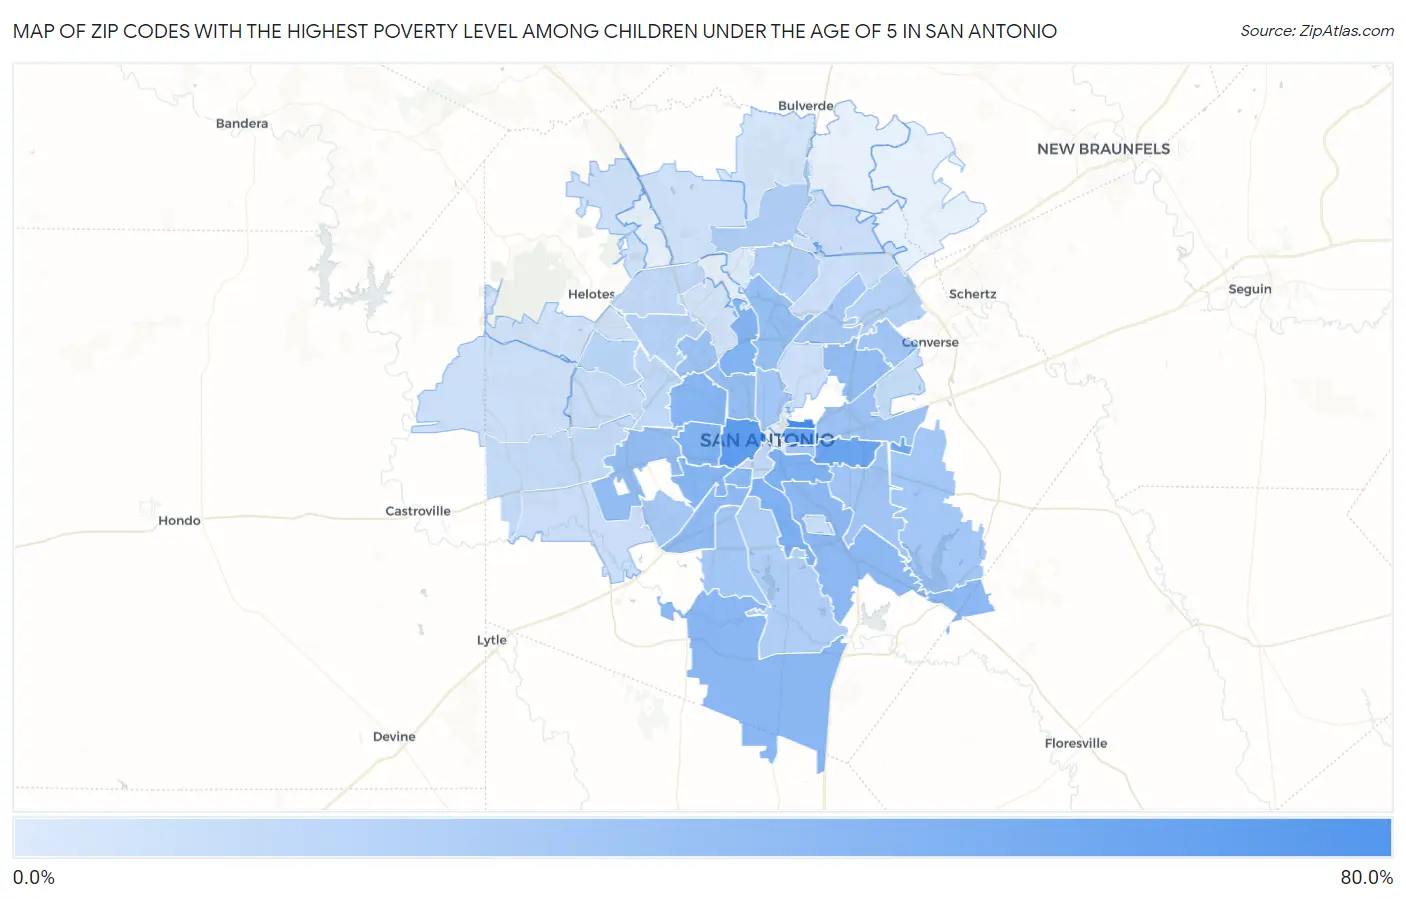
Map of Zip Codes with the Highest Poverty Level Among Children Under the Age of 5 in San Antonio

0.0%
80.0%
Zip Codes with the Highest Poverty Level Among Children Under the Age of 5 in San Antonio Map

Zip Codes with the Highest Poverty Level Among Children Under the Age of 5 in San Antonio, TX

Zip Code Child Poverty vs State vs National
1.7820879.2%21.1%(+58.1)#3518.1%(+61.1)#840
2.7820764.2%21.1%(+43.1)#6718.1%(+46.2)#1,437
3.7820257.1%21.1%(+36.0)#9918.1%(+39.0)#1,899
4.7822056.3%21.1%(+35.2)#10418.1%(+38.3)#1,964
5.7821045.2%21.1%(+24.1)#17718.1%(+27.1)#3,158
6.7821444.8%21.1%(+23.7)#18218.1%(+26.7)#3,210
7.7823744.5%21.1%(+23.4)#18518.1%(+26.5)#3,246
8.7821344.0%21.1%(+22.9)#19218.1%(+25.9)#3,340
9.7822841.8%21.1%(+20.8)#21918.1%(+23.8)#3,680
10.7822639.9%21.1%(+18.8)#25518.1%(+21.9)#4,048
11.7826439.3%21.1%(+18.2)#26518.1%(+21.2)#4,159
12.7822538.5%21.1%(+17.4)#28218.1%(+20.4)#4,303
13.7822337.5%21.1%(+16.4)#29518.1%(+19.4)#4,510
14.7821136.6%21.1%(+15.5)#30818.1%(+18.6)#4,668
15.7822734.3%21.1%(+13.2)#34918.1%(+16.2)#5,238
16.7821834.1%21.1%(+13.0)#35218.1%(+16.0)#5,277
17.7821633.4%21.1%(+12.3)#37118.1%(+15.3)#5,423
18.7820133.0%21.1%(+11.9)#37618.1%(+14.9)#5,585
19.7821931.3%21.1%(+10.2)#41218.1%(+13.2)#5,999
20.7822930.1%21.1%(+8.98)#44118.1%(+12.0)#6,327
21.7820327.8%21.1%(+6.75)#50318.1%(+9.78)#7,009
22.7823927.8%21.1%(+6.69)#50818.1%(+9.71)#7,042
23.7822227.3%21.1%(+6.24)#52418.1%(+9.26)#7,201
24.7821226.5%21.1%(+5.46)#54518.1%(+8.49)#7,463
25.7826326.0%21.1%(+4.88)#56018.1%(+7.90)#7,653
26.7822426.0%21.1%(+4.87)#56118.1%(+7.89)#7,655
27.7824224.8%21.1%(+3.74)#58918.1%(+6.77)#8,078
28.7821724.8%21.1%(+3.68)#59218.1%(+6.70)#8,097
29.7825821.3%21.1%(+0.168)#68318.1%(+3.19)#9,507
30.7823220.4%21.1%(-0.663)#70518.1%(+2.36)#9,838
31.7822120.4%21.1%(-0.716)#70718.1%(+2.31)#9,857
32.7823318.9%21.1%(-2.21)#74618.1%(+0.816)#10,554
33.7824017.6%21.1%(-3.48)#78418.1%(-0.461)#11,154
34.7825015.8%21.1%(-5.29)#84018.1%(-2.26)#12,019
35.7820413.8%21.1%(-7.25)#91318.1%(-4.22)#13,136
36.7823813.7%21.1%(-7.39)#91918.1%(-4.37)#13,220
37.7824912.8%21.1%(-8.32)#95018.1%(-5.30)#13,773
38.7824511.6%21.1%(-9.52)#99518.1%(-6.49)#14,486
39.7824410.7%21.1%(-10.4)#1,02918.1%(-7.35)#14,988
40.7823510.3%21.1%(-10.8)#1,04618.1%(-7.77)#15,227
41.782519.9%21.1%(-11.1)#1,06118.1%(-8.11)#15,457
42.782599.1%21.1%(-12.0)#1,08918.1%(-9.00)#16,018
43.782528.6%21.1%(-12.5)#1,10718.1%(-9.48)#16,359
44.782538.4%21.1%(-12.7)#1,11118.1%(-9.69)#16,507
45.782098.2%21.1%(-12.8)#1,11518.1%(-9.82)#16,603
46.782477.7%21.1%(-13.4)#1,13118.1%(-10.4)#16,971
47.782577.3%21.1%(-13.8)#1,14618.1%(-10.8)#17,207
48.782557.3%21.1%(-13.8)#1,14718.1%(-10.8)#17,215
49.782306.3%21.1%(-14.8)#1,18318.1%(-11.7)#17,838
50.782545.7%21.1%(-15.4)#1,21218.1%(-12.4)#18,291
51.782605.2%21.1%(-15.9)#1,22218.1%(-12.9)#18,661
52.782481.6%21.1%(-19.5)#1,33618.1%(-16.5)#21,078

Common Questions

What are the Top 10 Zip Codes with the Highest Poverty Level Among Children Under the Age of 5 in San Antonio, TX?
Top 10 Zip Codes with the Highest Poverty Level Among Children Under the Age of 5 in San Antonio, TX are:
#1
79.2%
#2
64.2%
#3
57.1%
#4
56.3%
#5
45.2%
#6
44.8%
#7
44.5%
#8
44.0%
#9
41.8%
#10
39.9%
What zip code has the Highest Poverty Level Among Children Under the Age of 5 in San Antonio, TX?
78208 has the Highest Poverty Level Among Children Under the Age of 5 in San Antonio, TX with 79.2%.
What is the Poverty Level Among Children Under the Age of 5 in San Antonio, TX?
Poverty Level Among Children Under the Age of 5 in San Antonio is 27.0%.
What is the Poverty Level Among Children Under the Age of 5 in Texas?
Poverty Level Among Children Under the Age of 5 in Texas is 21.1%.
What is the Poverty Level Among Children Under the Age of 5 in the United States?
Poverty Level Among Children Under the Age of 5 in the United States is 18.1%.