Johnson City, TX Map & Demographics
Johnson City Map
Johnson City Overview
$28,155
PER CAPITA INCOME
$53,750
AVG FAMILY INCOME
$45,160
AVG HOUSEHOLD INCOME
12.0%
WAGE / INCOME GAP [ % ]
88.0¢/ $1
WAGE / INCOME GAP [ $ ]
0.48
INEQUALITY / GINI INDEX
1,755
TOTAL POPULATION
743
MALE POPULATION
1,012
FEMALE POPULATION
73.42
MALES / 100 FEMALES
136.20
FEMALES / 100 MALES
43.5
MEDIAN AGE
3.0
AVG FAMILY SIZE
2.2
AVG HOUSEHOLD SIZE
887
LABOR FORCE [ PEOPLE ]
62.1%
PERCENT IN LABOR FORCE
4.5%
UNEMPLOYMENT RATE
Johnson City Zip Codes
Johnson City Area Codes
Income in Johnson City
Income Overview in Johnson City
Per Capita Income in Johnson City is $28,155, while median incomes of families and households are $53,750 and $45,160 respectively.
| Characteristic | Number | Measure |
| Per Capita Income | 1,755 | $28,155 |
| Median Family Income | 436 | $53,750 |
| Mean Family Income | 436 | $79,877 |
| Median Household Income | 759 | $45,160 |
| Mean Household Income | 759 | $61,830 |
| Income Deficit | 436 | $0 |
| Wage / Income Gap (%) | 1,755 | 11.97% |
| Wage / Income Gap ($) | 1,755 | 88.03¢ per $1 |
| Gini / Inequality Index | 1,755 | 0.48 |
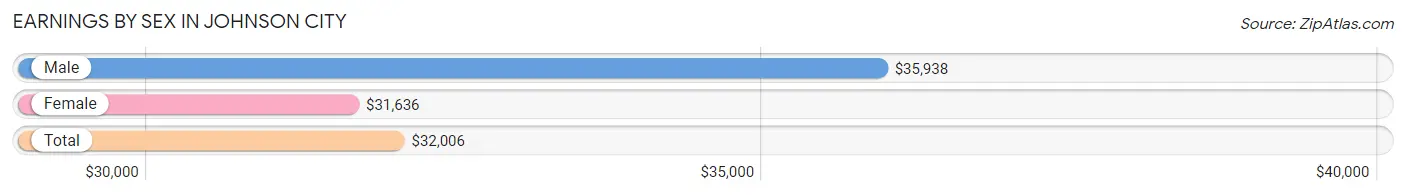
Earnings by Sex in Johnson City
Average Earnings in Johnson City are $32,006, $35,938 for men and $31,636 for women, a difference of 12.0%.
| Sex | Number | Average Earnings |
| Male | 534 (54.7%) | $35,938 |
| Female | 442 (45.3%) | $31,636 |
| Total | 976 (100.0%) | $32,006 |
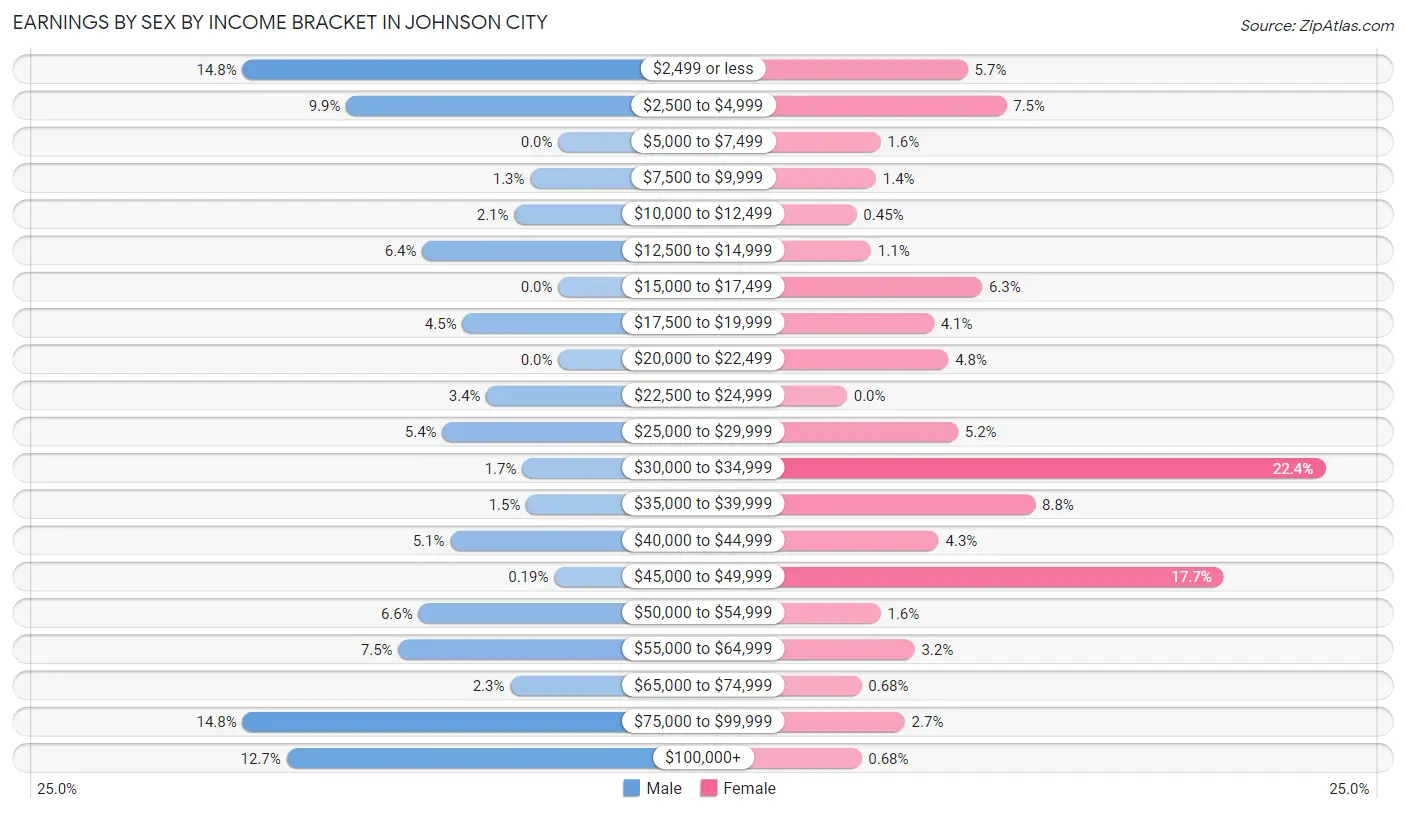
Earnings by Sex by Income Bracket in Johnson City
The most common earnings brackets in Johnson City are $2,499 or less for men (79 | 14.8%) and $30,000 to $34,999 for women (99 | 22.4%).
| Income | Male | Female |
| $2,499 or less | 79 (14.8%) | 25 (5.7%) |
| $2,500 to $4,999 | 53 (9.9%) | 33 (7.5%) |
| $5,000 to $7,499 | 0 (0.0%) | 7 (1.6%) |
| $7,500 to $9,999 | 7 (1.3%) | 6 (1.4%) |
| $10,000 to $12,499 | 11 (2.1%) | 2 (0.4%) |
| $12,500 to $14,999 | 34 (6.4%) | 5 (1.1%) |
| $15,000 to $17,499 | 0 (0.0%) | 28 (6.3%) |
| $17,500 to $19,999 | 24 (4.5%) | 18 (4.1%) |
| $20,000 to $22,499 | 0 (0.0%) | 21 (4.8%) |
| $22,500 to $24,999 | 18 (3.4%) | 0 (0.0%) |
| $25,000 to $29,999 | 29 (5.4%) | 23 (5.2%) |
| $30,000 to $34,999 | 9 (1.7%) | 99 (22.4%) |
| $35,000 to $39,999 | 8 (1.5%) | 39 (8.8%) |
| $40,000 to $44,999 | 27 (5.1%) | 19 (4.3%) |
| $45,000 to $49,999 | 1 (0.2%) | 78 (17.6%) |
| $50,000 to $54,999 | 35 (6.6%) | 7 (1.6%) |
| $55,000 to $64,999 | 40 (7.5%) | 14 (3.2%) |
| $65,000 to $74,999 | 12 (2.2%) | 3 (0.7%) |
| $75,000 to $99,999 | 79 (14.8%) | 12 (2.7%) |
| $100,000+ | 68 (12.7%) | 3 (0.7%) |
| Total | 534 (100.0%) | 442 (100.0%) |
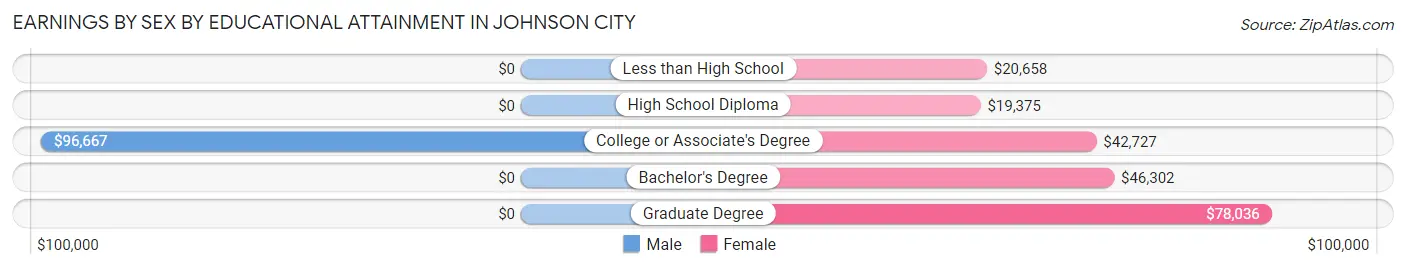
Earnings by Sex by Educational Attainment in Johnson City
Average earnings in Johnson City are $52,464 for men and $32,127 for women, a difference of 38.8%. Men with an educational attainment of college or associate's degree enjoy the highest average annual earnings of $96,667, while those with college or associate's degree education earn the least with $96,667. Women with an educational attainment of graduate degree earn the most with the average annual earnings of $78,036, while those with high school diploma education have the smallest earnings of $19,375.
| Educational Attainment | Male Income | Female Income |
| Less than High School | - | - |
| High School Diploma | - | - |
| College or Associate's Degree | $96,667 | $42,727 |
| Bachelor's Degree | - | - |
| Graduate Degree | - | - |
| Total | $52,464 | $32,127 |
Family Income in Johnson City
Family Income Brackets in Johnson City
According to the Johnson City family income data, there are 94 families falling into the $100,000 to $149,999 income range, which is the most common income bracket and makes up 21.6% of all families.
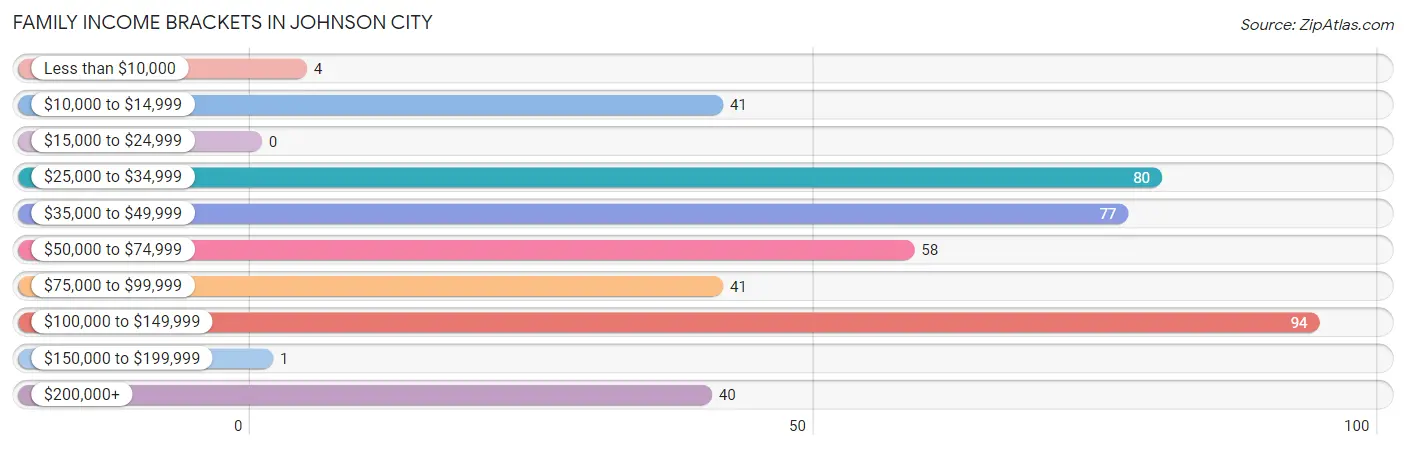
| Income Bracket | # Families | % Families |
| Less than $10,000 | 4 | 0.9% |
| $10,000 to $14,999 | 41 | 9.4% |
| $15,000 to $24,999 | 0 | 0.0% |
| $25,000 to $34,999 | 80 | 18.3% |
| $35,000 to $49,999 | 77 | 17.7% |
| $50,000 to $74,999 | 58 | 13.3% |
| $75,000 to $99,999 | 41 | 9.4% |
| $100,000 to $149,999 | 94 | 21.6% |
| $150,000 to $199,999 | 1 | 0.2% |
| $200,000+ | 40 | 9.2% |
Family Income by Famaliy Size in Johnson City
4-person families (34 | 7.8%) account for the highest median family income in Johnson City with $105,577 per family, while 4-person families (34 | 7.8%) have the highest median income of $26,394 per family member.
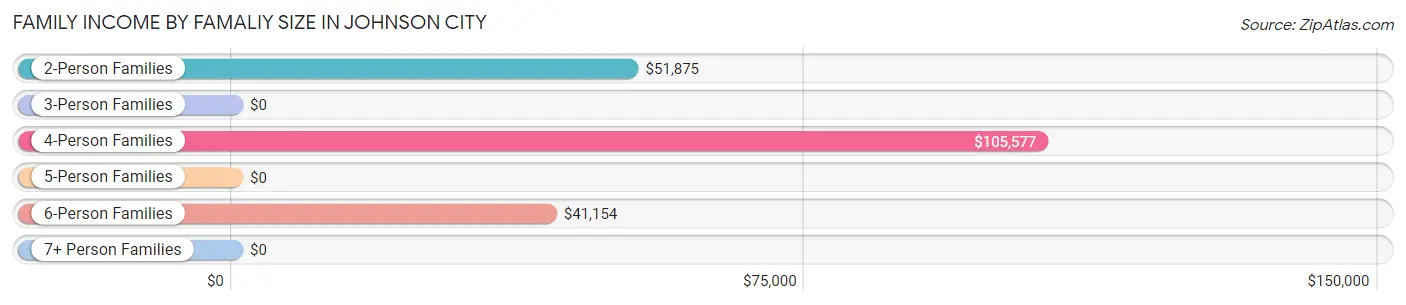
| Income Bracket | # Families | Median Income |
| 2-Person Families | 200 (45.9%) | $51,875 |
| 3-Person Families | 102 (23.4%) | $0 |
| 4-Person Families | 34 (7.8%) | $105,577 |
| 5-Person Families | 80 (18.3%) | $0 |
| 6-Person Families | 20 (4.6%) | $41,154 |
| 7+ Person Families | 0 (0.0%) | $0 |
| Total | 436 (100.0%) | $53,750 |
Family Income by Number of Earners in Johnson City
The median family income in Johnson City is $53,750, with families comprising 3+ earners (67) having the highest median family income of $128,125, while families with 1 earner (182) have the lowest median family income of $32,325, accounting for 15.4% and 41.7% of families, respectively.
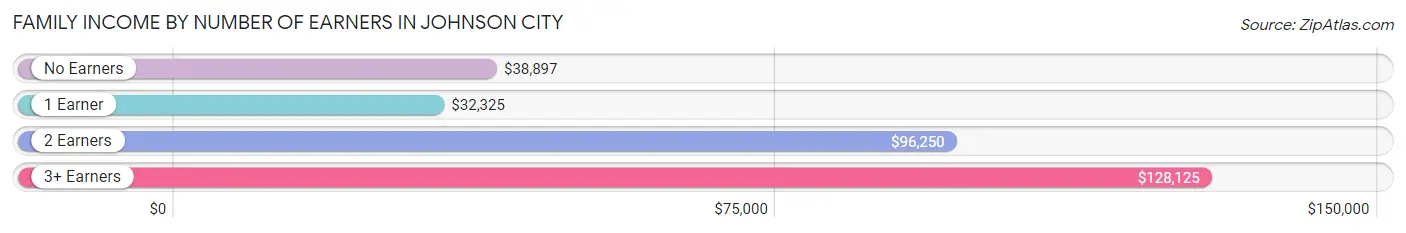
| Number of Earners | # Families | Median Income |
| No Earners | 39 (8.9%) | $38,897 |
| 1 Earner | 182 (41.7%) | $32,325 |
| 2 Earners | 148 (33.9%) | $96,250 |
| 3+ Earners | 67 (15.4%) | $128,125 |
| Total | 436 (100.0%) | $53,750 |
Household Income in Johnson City
Household Income Brackets in Johnson City
With 116 households falling in the category, the $25,000 to $34,999 income range is the most frequent in Johnson City, accounting for 15.3% of all households. In contrast, only 1 households (0.1%) fall into the $150,000 to $199,999 income bracket, making it the least populous group.
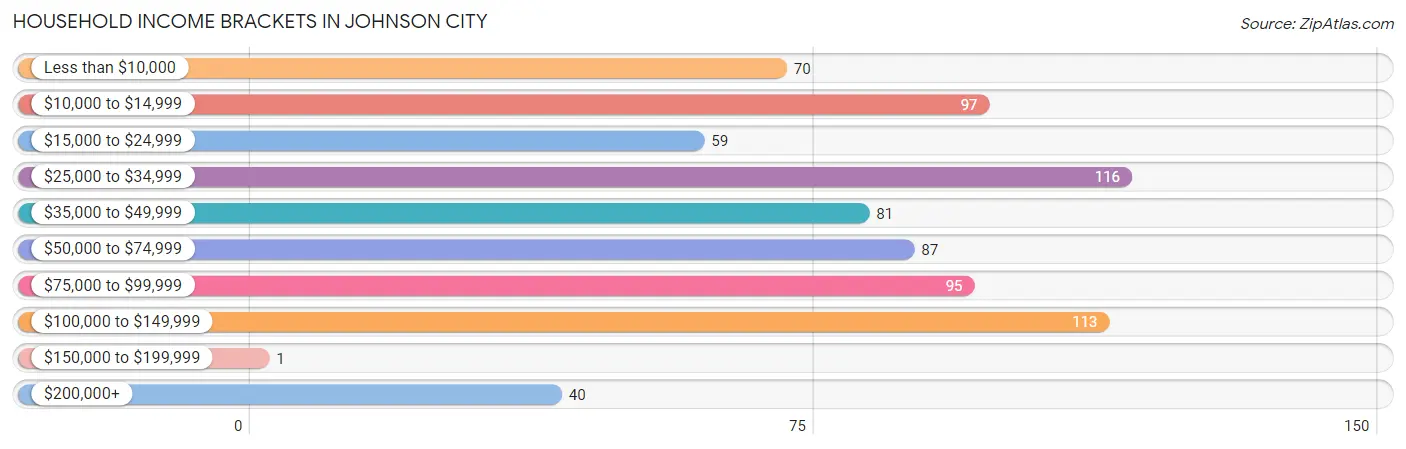
| Income Bracket | # Households | % Households |
| Less than $10,000 | 70 | 9.2% |
| $10,000 to $14,999 | 97 | 12.8% |
| $15,000 to $24,999 | 59 | 7.8% |
| $25,000 to $34,999 | 116 | 15.3% |
| $35,000 to $49,999 | 81 | 10.7% |
| $50,000 to $74,999 | 87 | 11.5% |
| $75,000 to $99,999 | 95 | 12.5% |
| $100,000 to $149,999 | 113 | 14.9% |
| $150,000 to $199,999 | 1 | 0.1% |
| $200,000+ | 40 | 5.3% |
Household Income by Householder Age in Johnson City
The median household income in Johnson City is $45,160, with the highest median household income of $59,250 found in the 45 to 64 years age bracket for the primary householder. A total of 314 households (41.4%) fall into this category. Meanwhile, the 15 to 24 years age bracket for the primary householder has the lowest median household income of $0, with 31 households (4.1%) in this group.
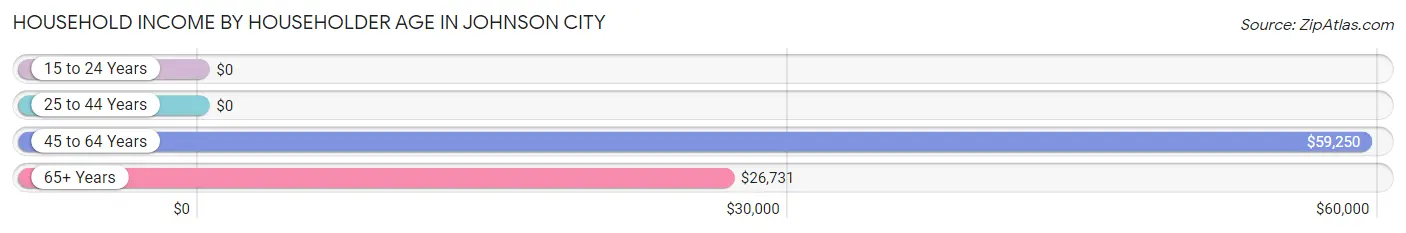
| Income Bracket | # Households | Median Income |
| 15 to 24 Years | 31 (4.1%) | $0 |
| 25 to 44 Years | 204 (26.9%) | $0 |
| 45 to 64 Years | 314 (41.4%) | $59,250 |
| 65+ Years | 210 (27.7%) | $26,731 |
| Total | 759 (100.0%) | $45,160 |
Poverty in Johnson City
Income Below Poverty by Sex and Age in Johnson City
With 15.3% poverty level for males and 26.8% for females among the residents of Johnson City, under 5 year old males and under 5 year old females are the most vulnerable to poverty, with 25 males (64.1%) and 40 females (72.7%) in their respective age groups living below the poverty level.
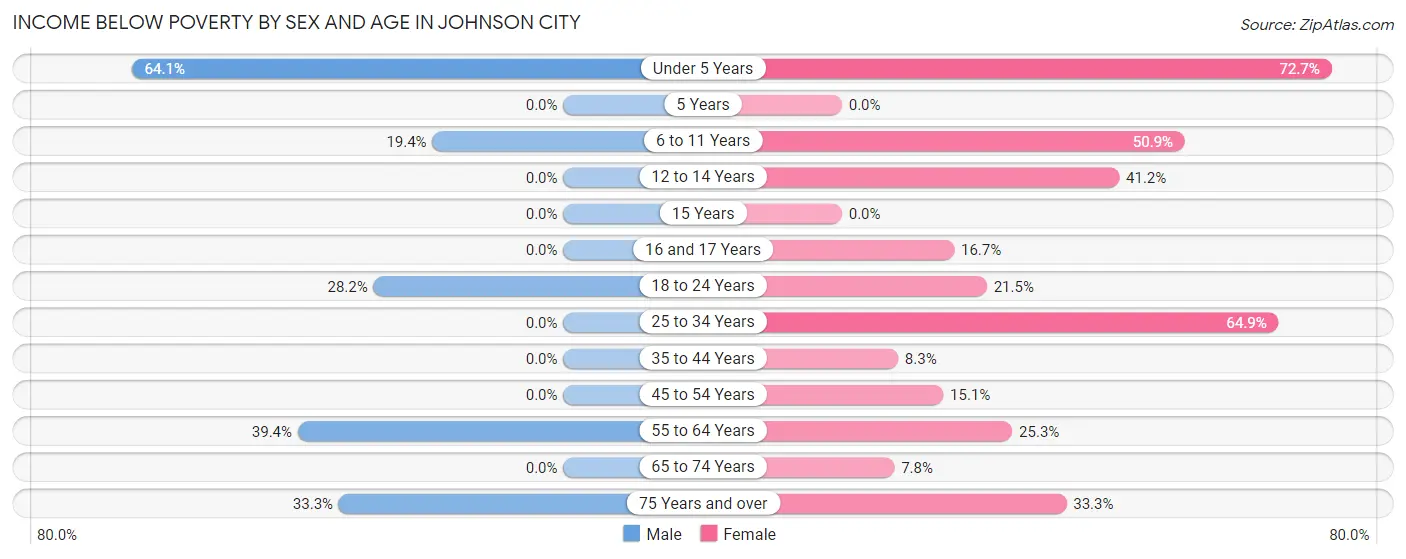
| Age Bracket | Male | Female |
| Under 5 Years | 25 (64.1%) | 40 (72.7%) |
| 5 Years | 0 (0.0%) | 0 (0.0%) |
| 6 to 11 Years | 7 (19.4%) | 54 (50.9%) |
| 12 to 14 Years | 0 (0.0%) | 14 (41.2%) |
| 15 Years | 0 (0.0%) | 0 (0.0%) |
| 16 and 17 Years | 0 (0.0%) | 6 (16.7%) |
| 18 to 24 Years | 31 (28.2%) | 17 (21.5%) |
| 25 to 34 Years | 0 (0.0%) | 48 (64.9%) |
| 35 to 44 Years | 0 (0.0%) | 5 (8.3%) |
| 45 to 54 Years | 0 (0.0%) | 28 (15.0%) |
| 55 to 64 Years | 41 (39.4%) | 21 (25.3%) |
| 65 to 74 Years | 0 (0.0%) | 14 (7.8%) |
| 75 Years and over | 2 (33.3%) | 17 (33.3%) |
| Total | 106 (15.3%) | 264 (26.8%) |
Income Above Poverty by Sex and Age in Johnson City
According to the poverty statistics in Johnson City, males aged 12 to 14 years and females aged 5 years are the age groups that are most secure financially, with 100.0% of males and 100.0% of females in these age groups living above the poverty line.
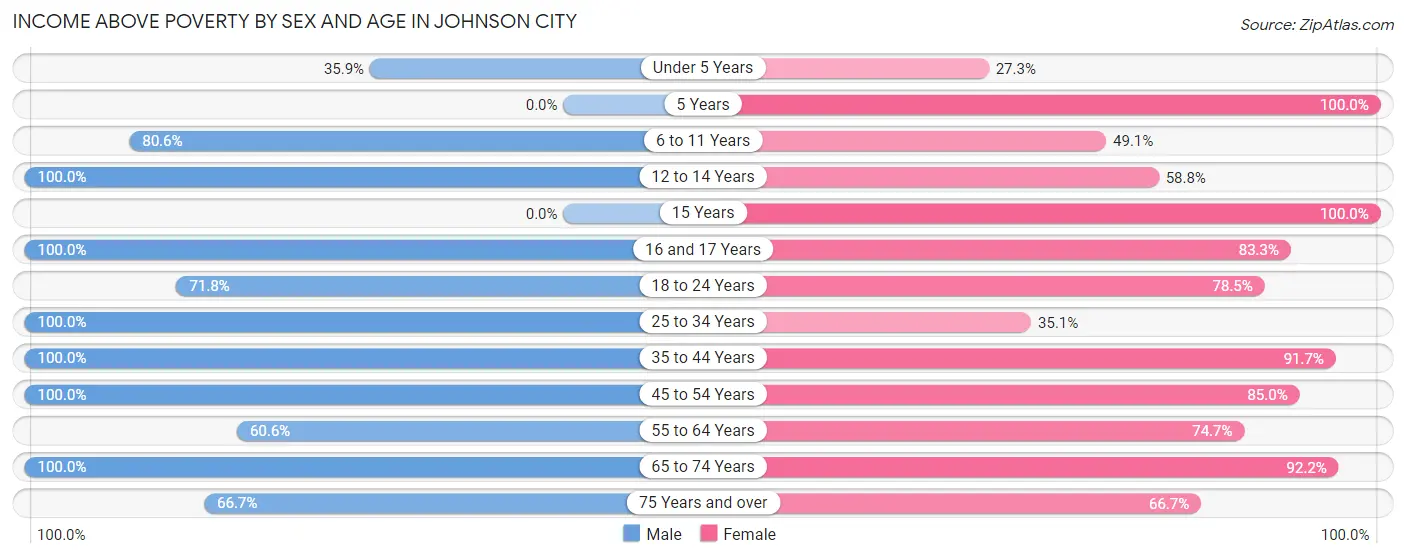
| Age Bracket | Male | Female |
| Under 5 Years | 14 (35.9%) | 15 (27.3%) |
| 5 Years | 0 (0.0%) | 16 (100.0%) |
| 6 to 11 Years | 29 (80.6%) | 52 (49.1%) |
| 12 to 14 Years | 13 (100.0%) | 20 (58.8%) |
| 15 Years | 0 (0.0%) | 27 (100.0%) |
| 16 and 17 Years | 31 (100.0%) | 30 (83.3%) |
| 18 to 24 Years | 79 (71.8%) | 62 (78.5%) |
| 25 to 34 Years | 82 (100.0%) | 26 (35.1%) |
| 35 to 44 Years | 73 (100.0%) | 55 (91.7%) |
| 45 to 54 Years | 142 (100.0%) | 158 (85.0%) |
| 55 to 64 Years | 63 (60.6%) | 62 (74.7%) |
| 65 to 74 Years | 58 (100.0%) | 166 (92.2%) |
| 75 Years and over | 4 (66.7%) | 34 (66.7%) |
| Total | 588 (84.7%) | 723 (73.3%) |
Income Below Poverty Among Married-Couple Families in Johnson City
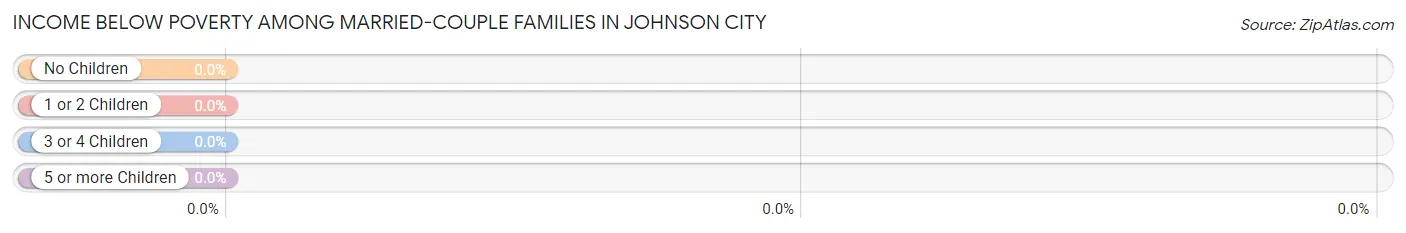
| Children | Above Poverty | Below Poverty |
| No Children | 146 (100.0%) | 0 (0.0%) |
| 1 or 2 Children | 62 (100.0%) | 0 (0.0%) |
| 3 or 4 Children | 15 (100.0%) | 0 (0.0%) |
| 5 or more Children | 0 (0.0%) | 0 (0.0%) |
| Total | 223 (100.0%) | 0 (0.0%) |
Income Below Poverty Among Single-Parent Households in Johnson City
According to the poverty data in Johnson City, 43.1% or 31 single-father households and 41.1% or 58 single-mother households are living below the poverty line. Among single-father households, those with 1 or 2 children have the highest poverty rate, with 31 households (100.0%) experiencing poverty. Likewise, among single-mother households, those with 5 or more children have the highest poverty rate, with 4 households (100.0%) falling below the poverty line.
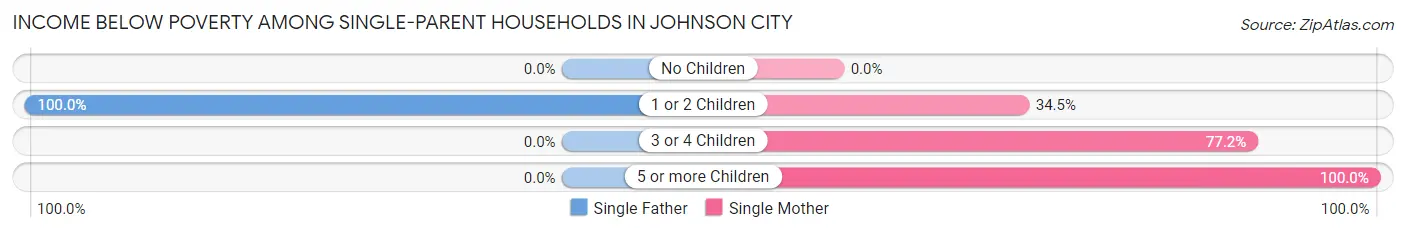
| Children | Single Father | Single Mother |
| No Children | 0 (0.0%) | 0 (0.0%) |
| 1 or 2 Children | 31 (100.0%) | 10 (34.5%) |
| 3 or 4 Children | 0 (0.0%) | 44 (77.2%) |
| 5 or more Children | 0 (0.0%) | 4 (100.0%) |
| Total | 31 (43.1%) | 58 (41.1%) |
Income Below Poverty Among Married-Couple vs Single-Parent Households in Johnson City
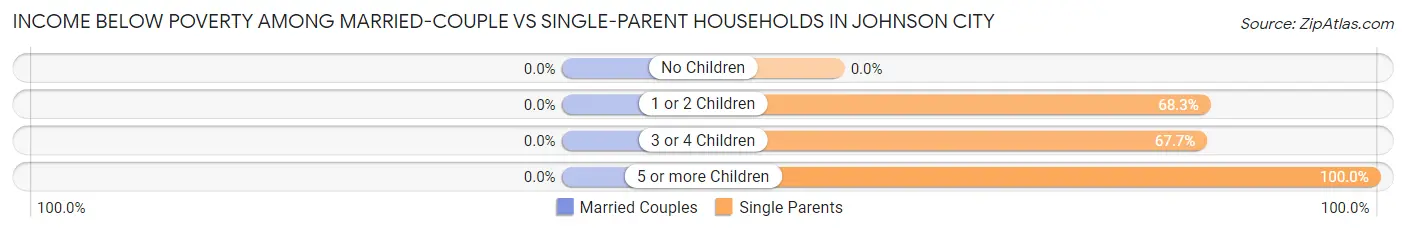
| Children | Married-Couple Families | Single-Parent Households |
| No Children | 0 (0.0%) | 0 (0.0%) |
| 1 or 2 Children | 0 (0.0%) | 41 (68.3%) |
| 3 or 4 Children | 0 (0.0%) | 44 (67.7%) |
| 5 or more Children | 0 (0.0%) | 4 (100.0%) |
| Total | 0 (0.0%) | 89 (41.8%) |
Race in Johnson City
The most populous races in Johnson City are White / Caucasian (1,247 | 71.1%), Hispanic or Latino (518 | 29.5%), and Two or more Races (333 | 19.0%).
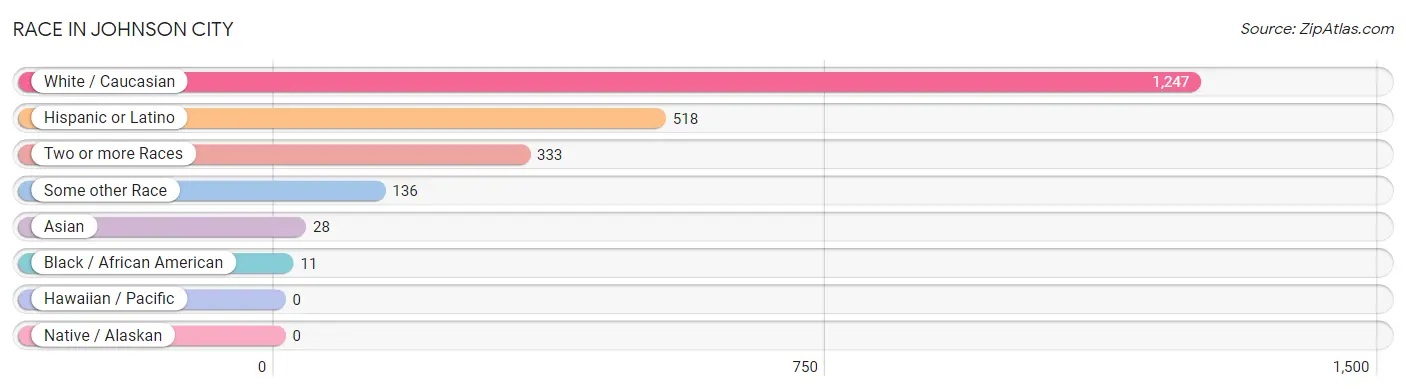
| Race | # Population | % Population |
| Asian | 28 | 1.6% |
| Black / African American | 11 | 0.6% |
| Hawaiian / Pacific | 0 | 0.0% |
| Hispanic or Latino | 518 | 29.5% |
| Native / Alaskan | 0 | 0.0% |
| White / Caucasian | 1,247 | 71.1% |
| Two or more Races | 333 | 19.0% |
| Some other Race | 136 | 7.7% |
| Total | 1,755 | 100.0% |
Ancestry in Johnson City
The most populous ancestries reported in Johnson City are Mexican (431 | 24.6%), German (382 | 21.8%), English (279 | 15.9%), Irish (141 | 8.0%), and American (123 | 7.0%), together accounting for 77.3% of all Johnson City residents.
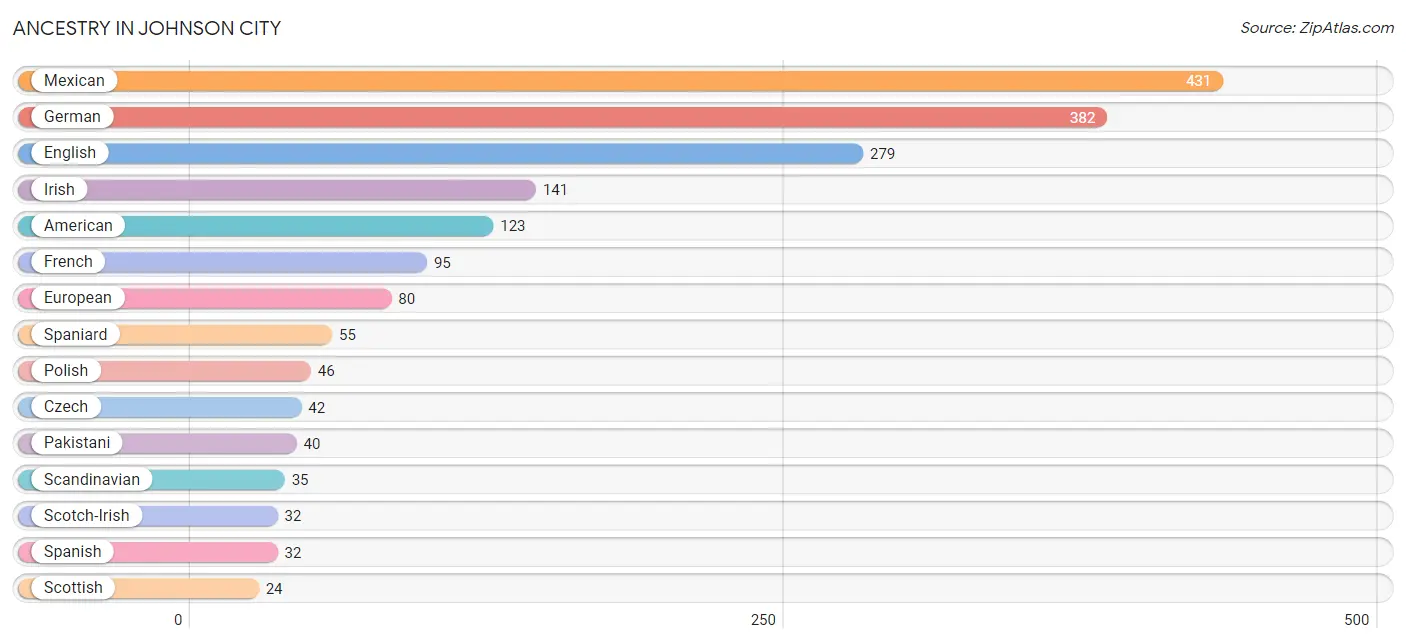
| Ancestry | # Population | % Population |
| American | 123 | 7.0% |
| Bhutanese | 7 | 0.4% |
| British | 14 | 0.8% |
| Czech | 42 | 2.4% |
| Czechoslovakian | 2 | 0.1% |
| Danish | 14 | 0.8% |
| Eastern European | 2 | 0.1% |
| English | 279 | 15.9% |
| European | 80 | 4.6% |
| French | 95 | 5.4% |
| German | 382 | 21.8% |
| Greek | 10 | 0.6% |
| Irish | 141 | 8.0% |
| Korean | 8 | 0.5% |
| Mexican | 431 | 24.6% |
| Norwegian | 7 | 0.4% |
| Pakistani | 40 | 2.3% |
| Polish | 46 | 2.6% |
| Scandinavian | 35 | 2.0% |
| Scotch-Irish | 32 | 1.8% |
| Scottish | 24 | 1.4% |
| Spaniard | 55 | 3.1% |
| Spanish | 32 | 1.8% |
| Swedish | 9 | 0.5% |
| Ukrainian | 4 | 0.2% |
| Welsh | 7 | 0.4% | View All 26 Rows |
Immigrants in Johnson City
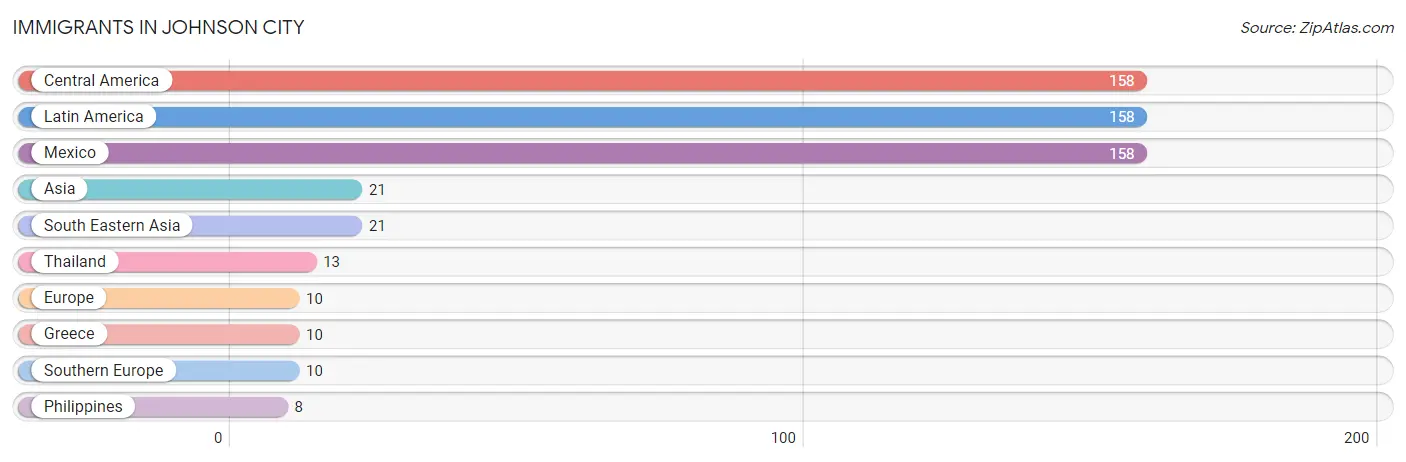
The most numerous immigrant groups reported in Johnson City came from Central America (158 | 9.0%), Latin America (158 | 9.0%), Mexico (158 | 9.0%), Asia (21 | 1.2%), and South Eastern Asia (21 | 1.2%), together accounting for 29.4% of all Johnson City residents.
| Immigration Origin | # Population | % Population |
| Asia | 21 | 1.2% |
| Central America | 158 | 9.0% |
| Europe | 10 | 0.6% |
| Greece | 10 | 0.6% |
| Latin America | 158 | 9.0% |
| Mexico | 158 | 9.0% |
| Philippines | 8 | 0.5% |
| South Eastern Asia | 21 | 1.2% |
| Southern Europe | 10 | 0.6% |
| Thailand | 13 | 0.7% | View All 10 Rows |
Sex and Age in Johnson City
Sex and Age in Johnson City
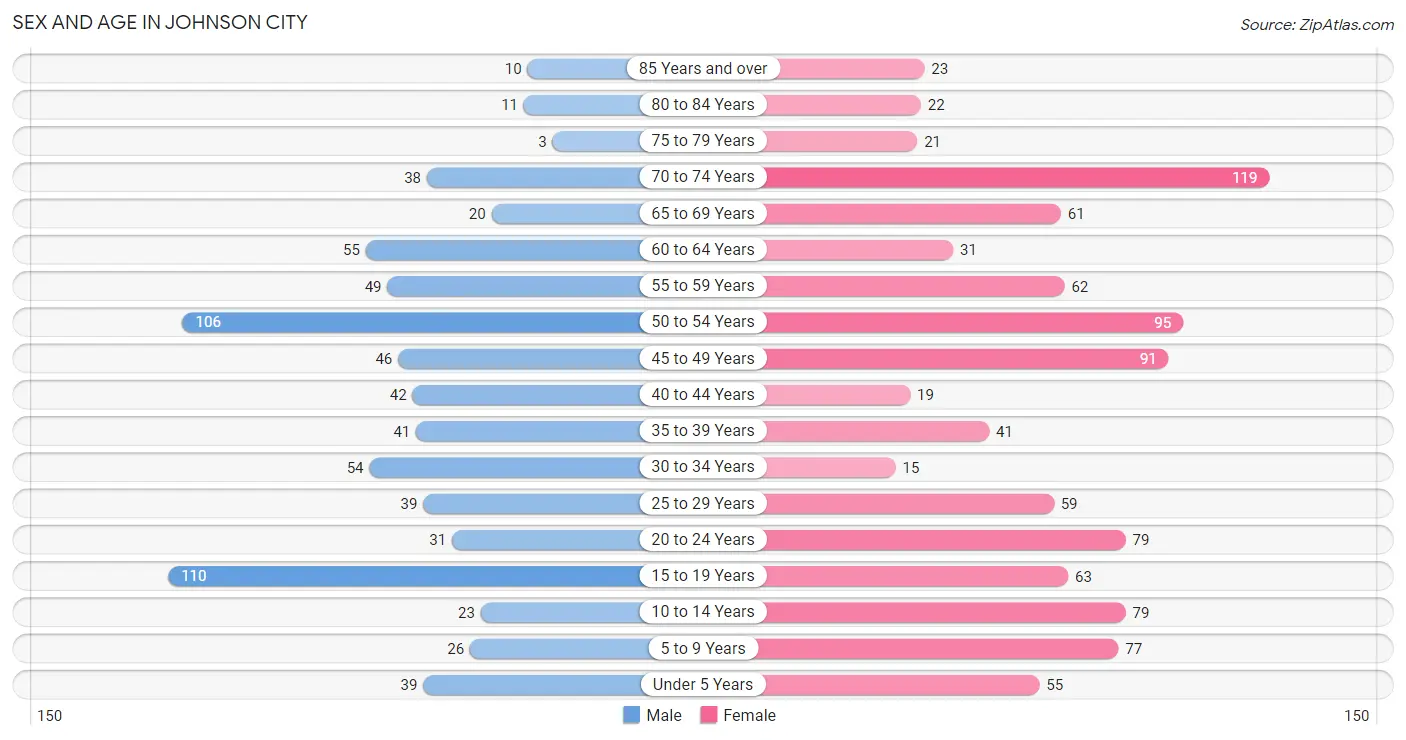
The most populous age groups in Johnson City are 15 to 19 Years (110 | 14.8%) for men and 70 to 74 Years (119 | 11.8%) for women.
| Age Bracket | Male | Female |
| Under 5 Years | 39 (5.2%) | 55 (5.4%) |
| 5 to 9 Years | 26 (3.5%) | 77 (7.6%) |
| 10 to 14 Years | 23 (3.1%) | 79 (7.8%) |
| 15 to 19 Years | 110 (14.8%) | 63 (6.2%) |
| 20 to 24 Years | 31 (4.2%) | 79 (7.8%) |
| 25 to 29 Years | 39 (5.2%) | 59 (5.8%) |
| 30 to 34 Years | 54 (7.3%) | 15 (1.5%) |
| 35 to 39 Years | 41 (5.5%) | 41 (4.1%) |
| 40 to 44 Years | 42 (5.7%) | 19 (1.9%) |
| 45 to 49 Years | 46 (6.2%) | 91 (9.0%) |
| 50 to 54 Years | 106 (14.3%) | 95 (9.4%) |
| 55 to 59 Years | 49 (6.6%) | 62 (6.1%) |
| 60 to 64 Years | 55 (7.4%) | 31 (3.1%) |
| 65 to 69 Years | 20 (2.7%) | 61 (6.0%) |
| 70 to 74 Years | 38 (5.1%) | 119 (11.8%) |
| 75 to 79 Years | 3 (0.4%) | 21 (2.1%) |
| 80 to 84 Years | 11 (1.5%) | 22 (2.2%) |
| 85 Years and over | 10 (1.3%) | 23 (2.3%) |
| Total | 743 (100.0%) | 1,012 (100.0%) |
Families and Households in Johnson City
Median Family Size in Johnson City
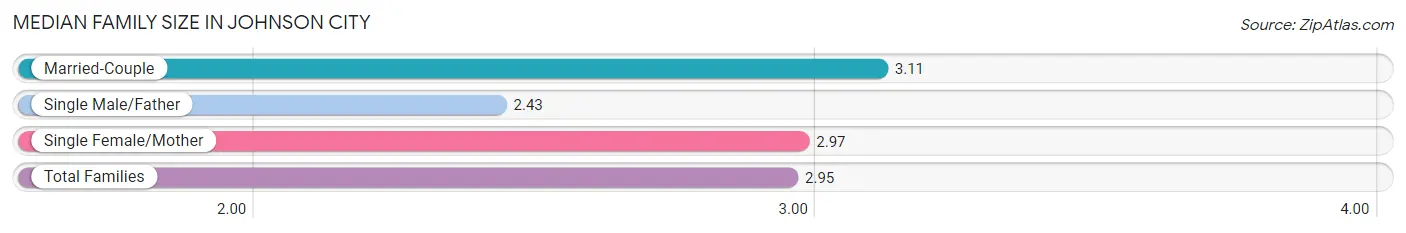
The median family size in Johnson City is 2.95 persons per family, with married-couple families (223 | 51.1%) accounting for the largest median family size of 3.11 persons per family. On the other hand, single male/father families (72 | 16.5%) represent the smallest median family size with 2.43 persons per family.
| Family Type | # Families | Family Size |
| Married-Couple | 223 (51.1%) | 3.11 |
| Single Male/Father | 72 (16.5%) | 2.43 |
| Single Female/Mother | 141 (32.3%) | 2.97 |
| Total Families | 436 (100.0%) | 2.95 |
Median Household Size in Johnson City
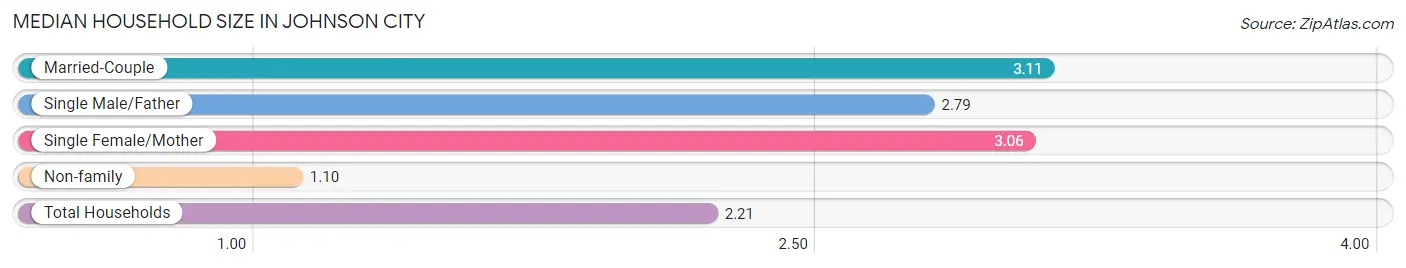
The median household size in Johnson City is 2.21 persons per household, with married-couple households (223 | 29.4%) accounting for the largest median household size of 3.11 persons per household. non-family households (323 | 42.6%) represent the smallest median household size with 1.10 persons per household.
| Household Type | # Households | Household Size |
| Married-Couple | 223 (29.4%) | 3.11 |
| Single Male/Father | 72 (9.5%) | 2.79 |
| Single Female/Mother | 141 (18.6%) | 3.06 |
| Non-family | 323 (42.6%) | 1.10 |
| Total Households | 759 (100.0%) | 2.21 |
Household Size by Marriage Status in Johnson City
Out of a total of 759 households in Johnson City, 436 (57.4%) are family households, while 323 (42.6%) are nonfamily households. The most numerous type of family households are 2-person households, comprising 200, and the most common type of nonfamily households are 1-person households, comprising 290.
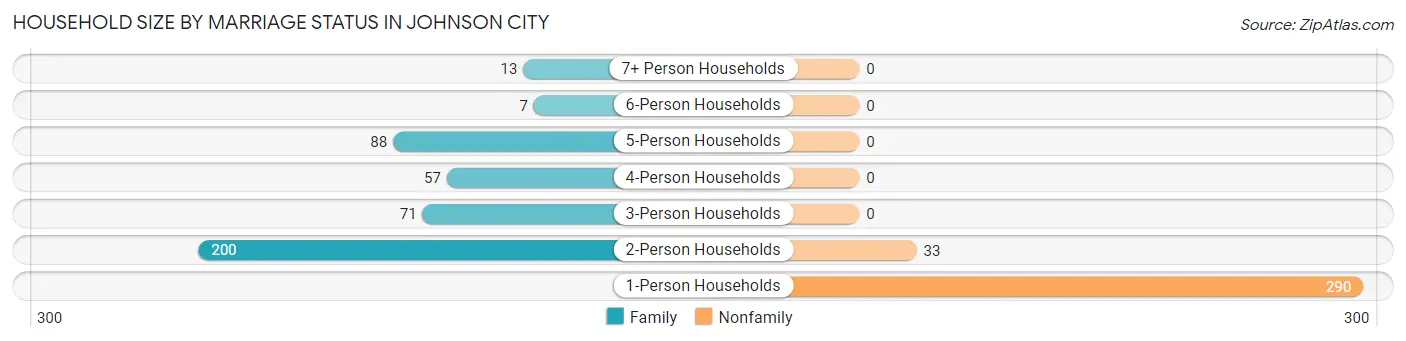
| Household Size | Family Households | Nonfamily Households |
| 1-Person Households | - | 290 (38.2%) |
| 2-Person Households | 200 (26.4%) | 33 (4.3%) |
| 3-Person Households | 71 (9.3%) | 0 (0.0%) |
| 4-Person Households | 57 (7.5%) | 0 (0.0%) |
| 5-Person Households | 88 (11.6%) | 0 (0.0%) |
| 6-Person Households | 7 (0.9%) | 0 (0.0%) |
| 7+ Person Households | 13 (1.7%) | 0 (0.0%) |
| Total | 436 (57.4%) | 323 (42.6%) |
Female Fertility in Johnson City
Fertility by Age in Johnson City
Average fertility rate in Johnson City is 43.0 births per 1,000 women. Women in the age bracket of 20 to 34 years have the highest fertility rate with 111.0 births per 1,000 women. Women in the age bracket of 20 to 34 years acount for 100.0% of all women with births.
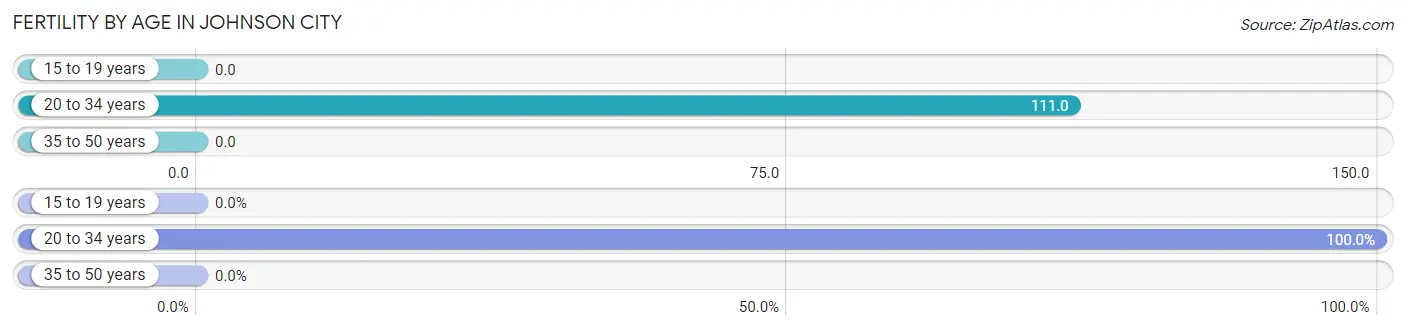
| Age Bracket | Women with Births | Births / 1,000 Women |
| 15 to 19 years | 0 (0.0%) | 0.0 |
| 20 to 34 years | 17 (100.0%) | 111.0 |
| 35 to 50 years | 0 (0.0%) | 0.0 |
| Total | 17 (100.0%) | 43.0 |
Fertility by Age by Marriage Status in Johnson City
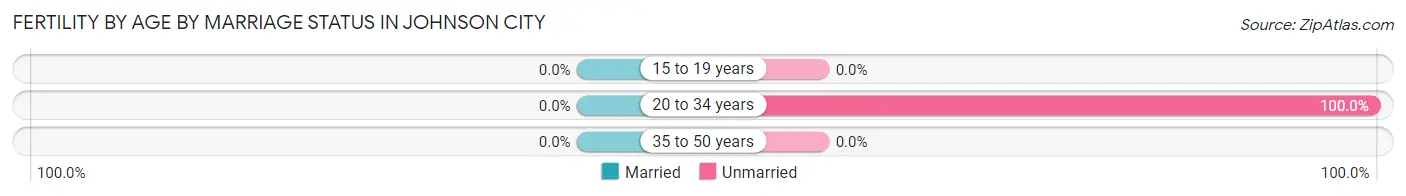
| Age Bracket | Married | Unmarried |
| 15 to 19 years | 0 (0.0%) | 0 (0.0%) |
| 20 to 34 years | 0 (0.0%) | 17 (100.0%) |
| 35 to 50 years | 0 (0.0%) | 0 (0.0%) |
| Total | 0 (0.0%) | 17 (100.0%) |
Fertility by Education in Johnson City
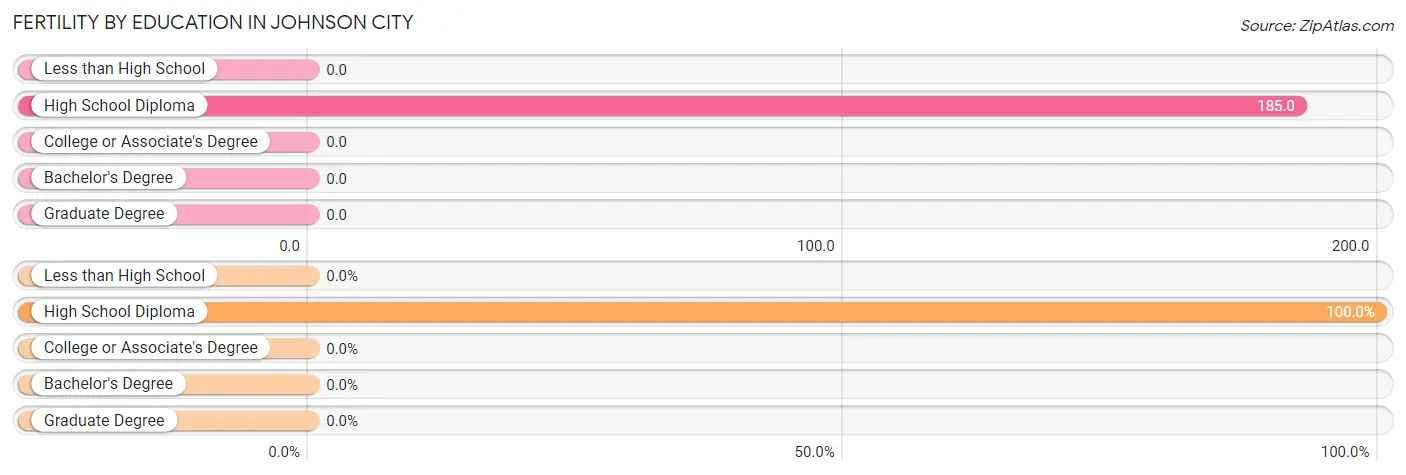
| Educational Attainment | Women with Births | Births / 1,000 Women |
| Less than High School | 0 (0.0%) | 0.0 |
| High School Diploma | 17 (100.0%) | 185.0 |
| College or Associate's Degree | 0 (0.0%) | 0.0 |
| Bachelor's Degree | 0 (0.0%) | 0.0 |
| Graduate Degree | 0 (0.0%) | 0.0 |
| Total | 17 (100.0%) | 43.0 |
Fertility by Education by Marriage Status in Johnson City
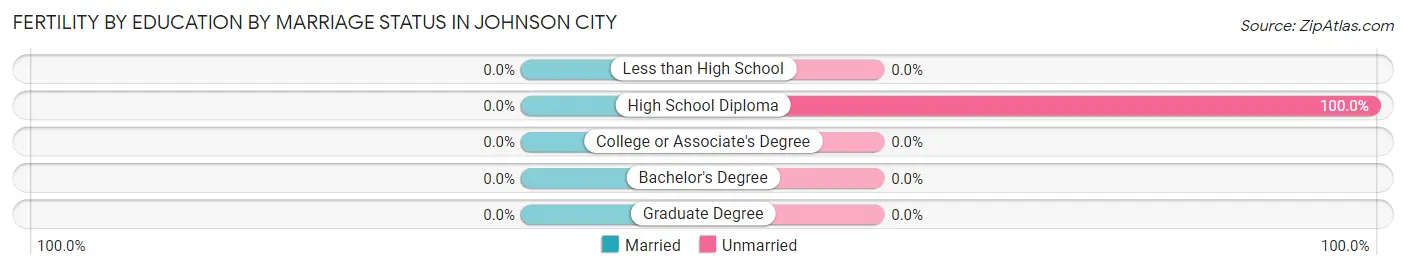
| Educational Attainment | Married | Unmarried |
| Less than High School | 0 (0.0%) | 0 (0.0%) |
| High School Diploma | 0 (0.0%) | 17 (100.0%) |
| College or Associate's Degree | 0 (0.0%) | 0 (0.0%) |
| Bachelor's Degree | 0 (0.0%) | 0 (0.0%) |
| Graduate Degree | 0 (0.0%) | 0 (0.0%) |
| Total | 0 (0.0%) | 17 (100.0%) |
Employment Characteristics in Johnson City
Employment by Class of Employer in Johnson City
Among the 829 employed individuals in Johnson City, private company employees (545 | 65.7%), local government employees (110 | 13.3%), and self-employed (not incorporated) (90 | 10.9%) make up the most common classes of employment.
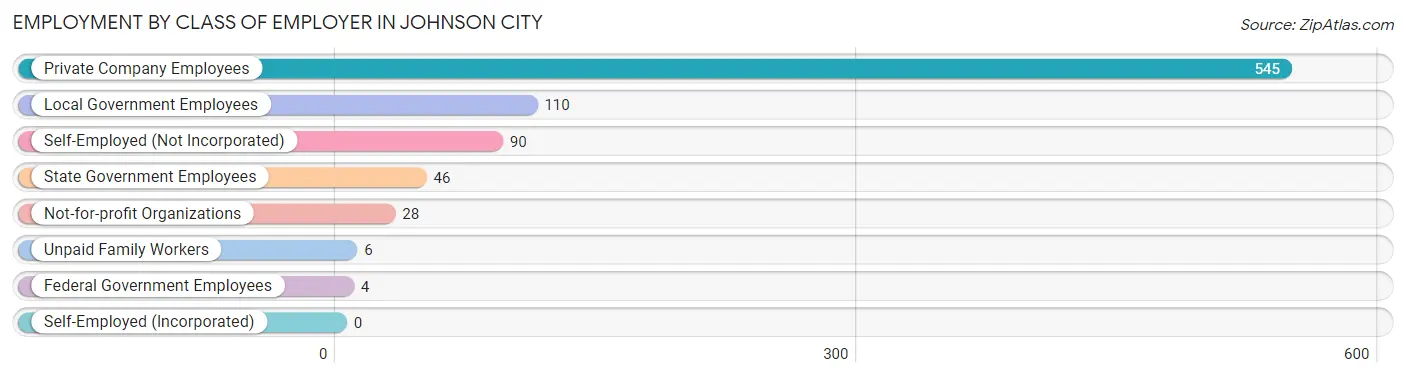
| Employer Class | # Employees | % Employees |
| Private Company Employees | 545 | 65.7% |
| Self-Employed (Incorporated) | 0 | 0.0% |
| Self-Employed (Not Incorporated) | 90 | 10.9% |
| Not-for-profit Organizations | 28 | 3.4% |
| Local Government Employees | 110 | 13.3% |
| State Government Employees | 46 | 5.6% |
| Federal Government Employees | 4 | 0.5% |
| Unpaid Family Workers | 6 | 0.7% |
| Total | 829 | 100.0% |
Employment Status by Age in Johnson City
According to the labor force statistics for Johnson City, out of the total population over 16 years of age (1,429), 62.1% or 887 individuals are in the labor force, with 4.5% or 40 of them unemployed. The age group with the highest labor force participation rate is 30 to 34 years, with 98.6% or 68 individuals in the labor force. Within the labor force, the 60 to 64 years age range has the highest percentage of unemployed individuals, with 19.0% or 8 of them being unemployed.
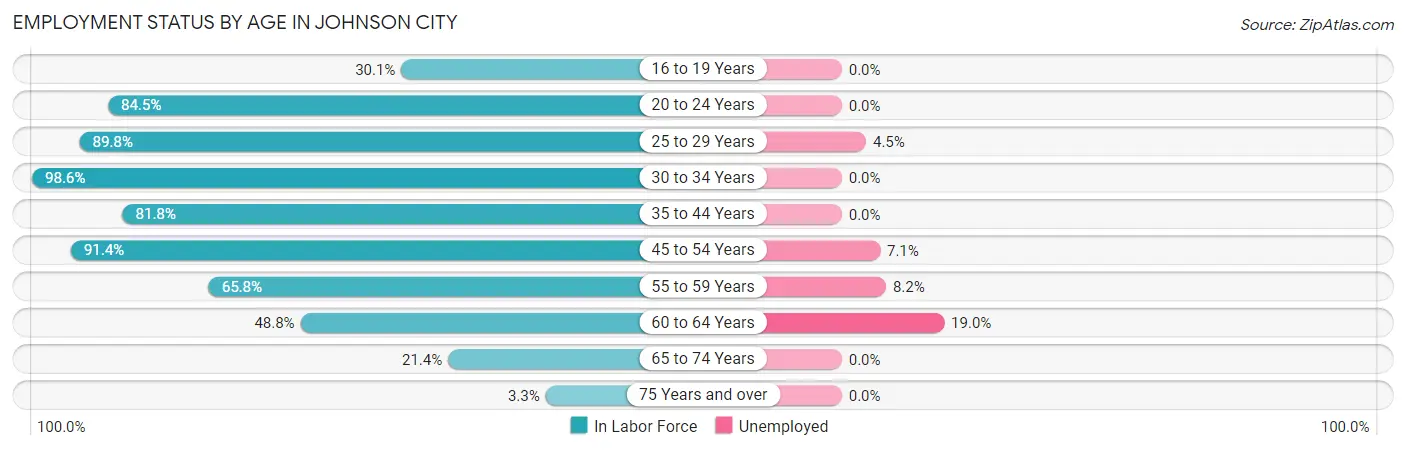
| Age Bracket | In Labor Force | Unemployed |
| 16 to 19 Years | 44 (30.1%) | 0 (0.0%) |
| 20 to 24 Years | 93 (84.5%) | 0 (0.0%) |
| 25 to 29 Years | 88 (89.8%) | 4 (4.5%) |
| 30 to 34 Years | 68 (98.6%) | 0 (0.0%) |
| 35 to 44 Years | 117 (81.8%) | 0 (0.0%) |
| 45 to 54 Years | 309 (91.4%) | 22 (7.1%) |
| 55 to 59 Years | 73 (65.8%) | 6 (8.2%) |
| 60 to 64 Years | 42 (48.8%) | 8 (19.0%) |
| 65 to 74 Years | 51 (21.4%) | 0 (0.0%) |
| 75 Years and over | 3 (3.3%) | 0 (0.0%) |
| Total | 887 (62.1%) | 40 (4.5%) |
Employment Status by Educational Attainment in Johnson City
According to labor force statistics for Johnson City, 82.5% of individuals (697) out of the total population between 25 and 64 years of age (845) are in the labor force, with 5.7% or 40 of them being unemployed. The group with the highest labor force participation rate are those with the educational attainment of less than high school, with 90.1% or 136 individuals in the labor force. Within the labor force, individuals with high school diploma education have the highest percentage of unemployment, with 17.8% or 34 of them being unemployed.
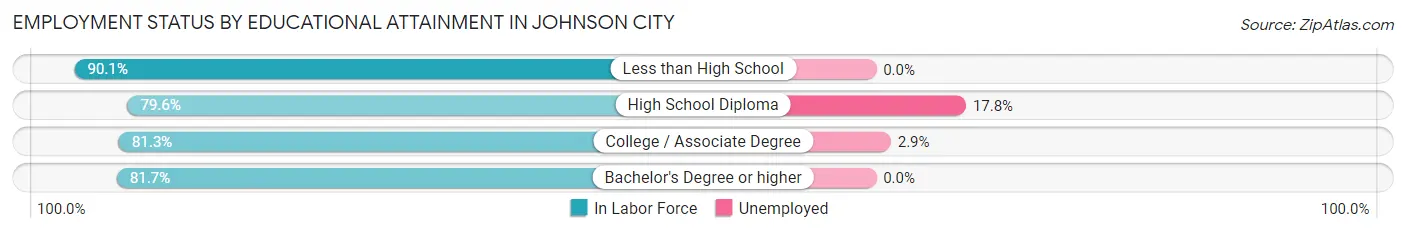
| Educational Attainment | In Labor Force | Unemployed |
| Less than High School | 136 (90.1%) | 0 (0.0%) |
| High School Diploma | 191 (79.6%) | 43 (17.8%) |
| College / Associate Degree | 209 (81.3%) | 7 (2.9%) |
| Bachelor's Degree or higher | 161 (81.7%) | 0 (0.0%) |
| Total | 697 (82.5%) | 48 (5.7%) |
Employment Occupations by Sex in Johnson City
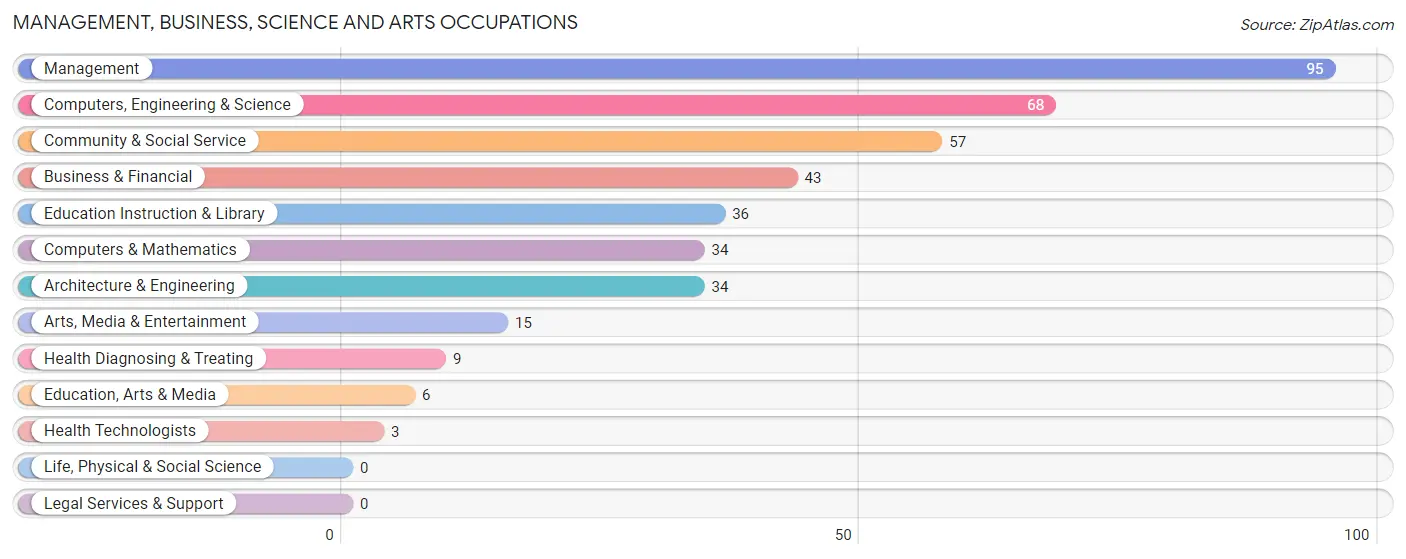
Management, Business, Science and Arts Occupations
The most common Management, Business, Science and Arts occupations in Johnson City are Management (95 | 11.2%), Computers, Engineering & Science (68 | 8.0%), Community & Social Service (57 | 6.7%), Business & Financial (43 | 5.1%), and Education Instruction & Library (36 | 4.3%).
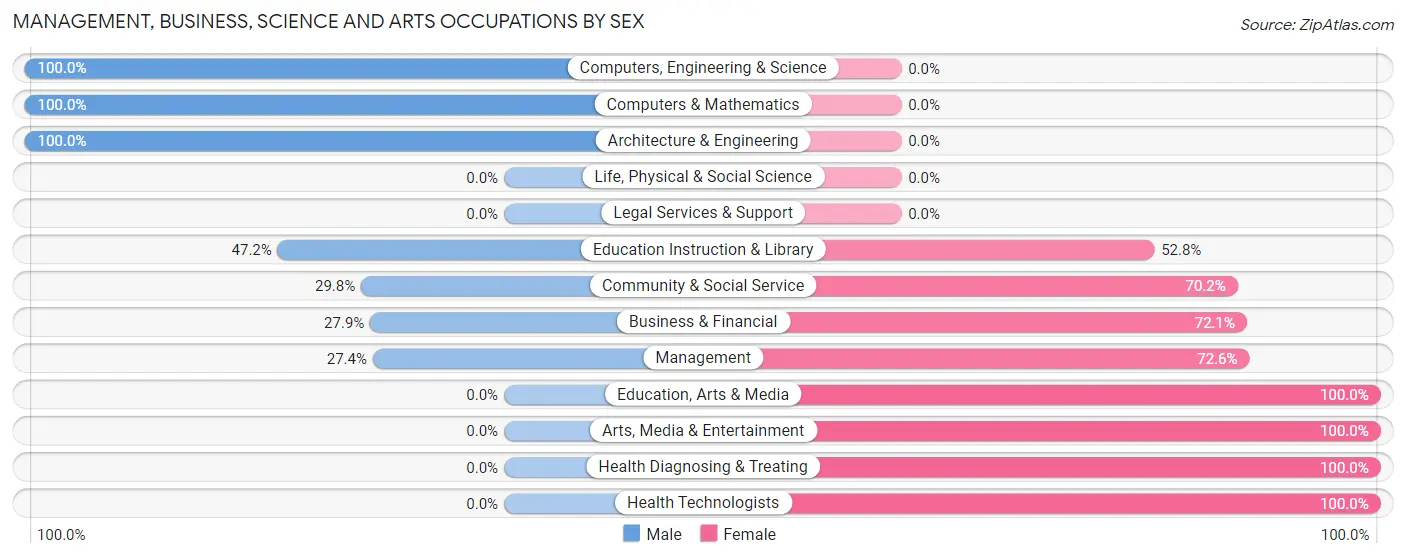
Management, Business, Science and Arts Occupations by Sex
Within the Management, Business, Science and Arts occupations in Johnson City, the most male-oriented occupations are Computers, Engineering & Science (100.0%), Computers & Mathematics (100.0%), and Architecture & Engineering (100.0%), while the most female-oriented occupations are Education, Arts & Media (100.0%), Arts, Media & Entertainment (100.0%), and Health Diagnosing & Treating (100.0%).
| Occupation | Male | Female |
| Management | 26 (27.4%) | 69 (72.6%) |
| Business & Financial | 12 (27.9%) | 31 (72.1%) |
| Computers, Engineering & Science | 68 (100.0%) | 0 (0.0%) |
| Computers & Mathematics | 34 (100.0%) | 0 (0.0%) |
| Architecture & Engineering | 34 (100.0%) | 0 (0.0%) |
| Life, Physical & Social Science | 0 (0.0%) | 0 (0.0%) |
| Community & Social Service | 17 (29.8%) | 40 (70.2%) |
| Education, Arts & Media | 0 (0.0%) | 6 (100.0%) |
| Legal Services & Support | 0 (0.0%) | 0 (0.0%) |
| Education Instruction & Library | 17 (47.2%) | 19 (52.8%) |
| Arts, Media & Entertainment | 0 (0.0%) | 15 (100.0%) |
| Health Diagnosing & Treating | 0 (0.0%) | 9 (100.0%) |
| Health Technologists | 0 (0.0%) | 3 (100.0%) |
| Total (Category) | 123 (45.2%) | 149 (54.8%) |
| Total (Overall) | 439 (51.8%) | 409 (48.2%) |
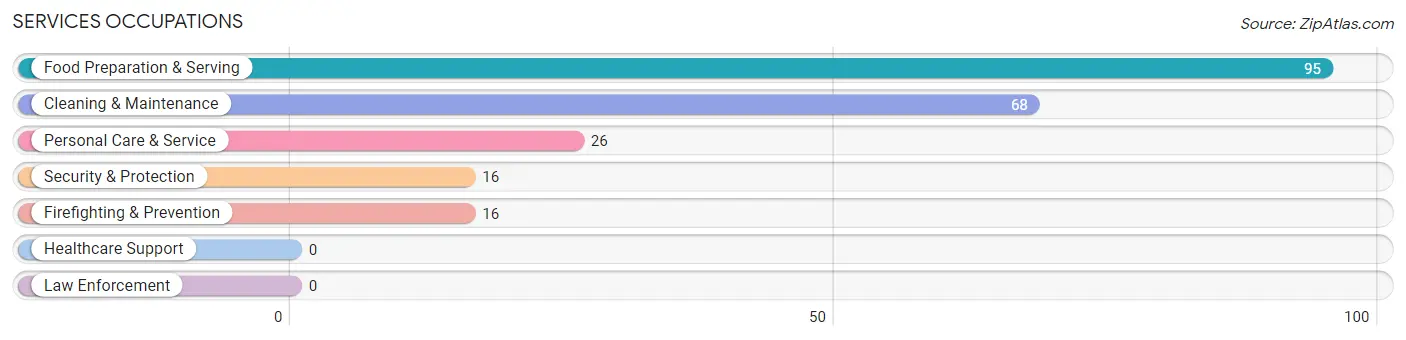
Services Occupations
The most common Services occupations in Johnson City are Food Preparation & Serving (95 | 11.2%), Cleaning & Maintenance (68 | 8.0%), Personal Care & Service (26 | 3.1%), Security & Protection (16 | 1.9%), and Firefighting & Prevention (16 | 1.9%).
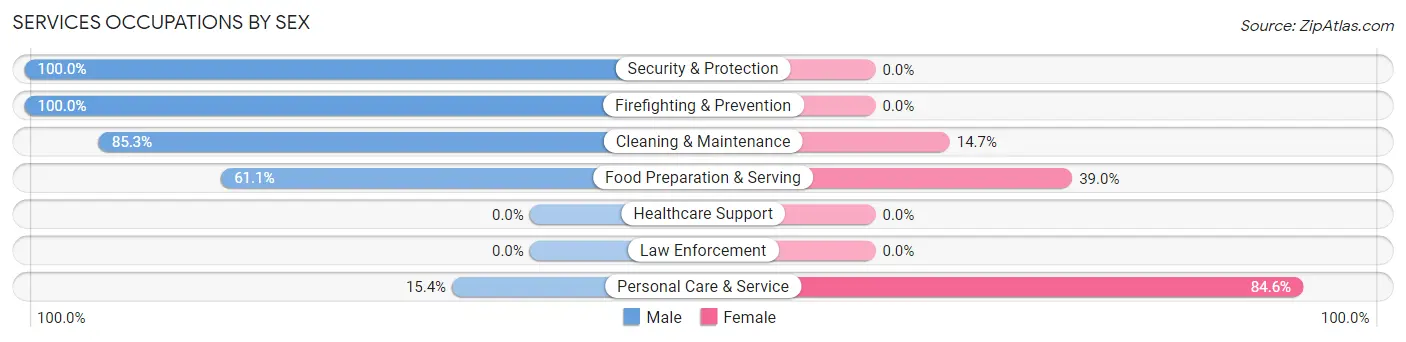
Services Occupations by Sex
Within the Services occupations in Johnson City, the most male-oriented occupations are Security & Protection (100.0%), Firefighting & Prevention (100.0%), and Cleaning & Maintenance (85.3%), while the most female-oriented occupations are Personal Care & Service (84.6%), Food Preparation & Serving (39.0%), and Cleaning & Maintenance (14.7%).
| Occupation | Male | Female |
| Healthcare Support | 0 (0.0%) | 0 (0.0%) |
| Security & Protection | 16 (100.0%) | 0 (0.0%) |
| Firefighting & Prevention | 16 (100.0%) | 0 (0.0%) |
| Law Enforcement | 0 (0.0%) | 0 (0.0%) |
| Food Preparation & Serving | 58 (61.1%) | 37 (39.0%) |
| Cleaning & Maintenance | 58 (85.3%) | 10 (14.7%) |
| Personal Care & Service | 4 (15.4%) | 22 (84.6%) |
| Total (Category) | 136 (66.3%) | 69 (33.7%) |
| Total (Overall) | 439 (51.8%) | 409 (48.2%) |
Sales and Office Occupations
The most common Sales and Office occupations in Johnson City are Office & Administration (123 | 14.5%), and Sales & Related (73 | 8.6%).
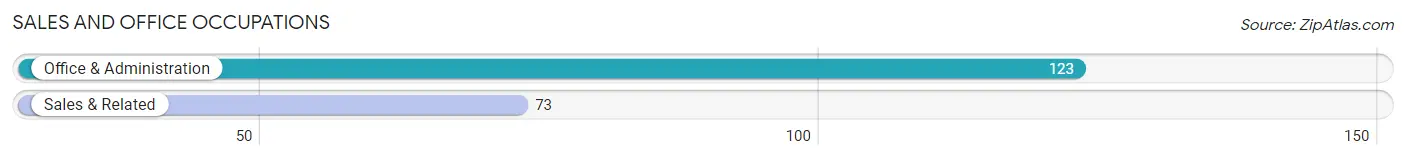
Sales and Office Occupations by Sex
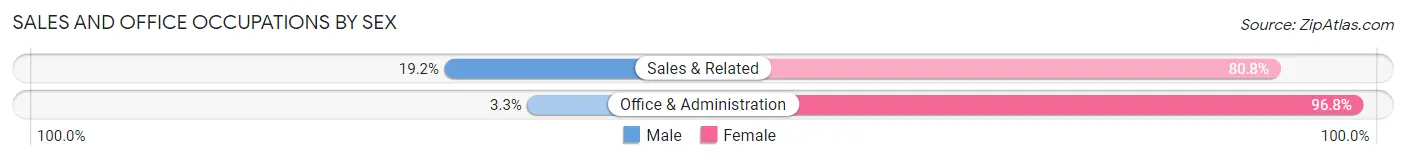
| Occupation | Male | Female |
| Sales & Related | 14 (19.2%) | 59 (80.8%) |
| Office & Administration | 4 (3.3%) | 119 (96.8%) |
| Total (Category) | 18 (9.2%) | 178 (90.8%) |
| Total (Overall) | 439 (51.8%) | 409 (48.2%) |
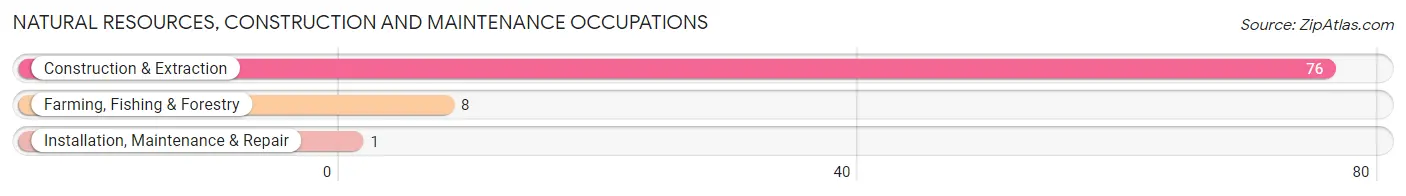
Natural Resources, Construction and Maintenance Occupations
The most common Natural Resources, Construction and Maintenance occupations in Johnson City are Construction & Extraction (76 | 9.0%), Farming, Fishing & Forestry (8 | 0.9%), and Installation, Maintenance & Repair (1 | 0.1%).
Natural Resources, Construction and Maintenance Occupations by Sex
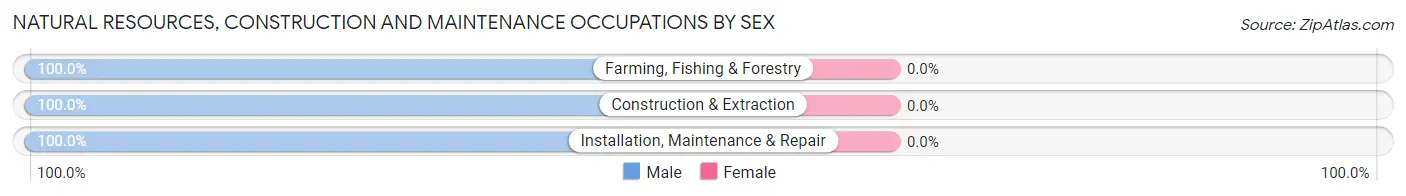
| Occupation | Male | Female |
| Farming, Fishing & Forestry | 8 (100.0%) | 0 (0.0%) |
| Construction & Extraction | 76 (100.0%) | 0 (0.0%) |
| Installation, Maintenance & Repair | 1 (100.0%) | 0 (0.0%) |
| Total (Category) | 85 (100.0%) | 0 (0.0%) |
| Total (Overall) | 439 (51.8%) | 409 (48.2%) |
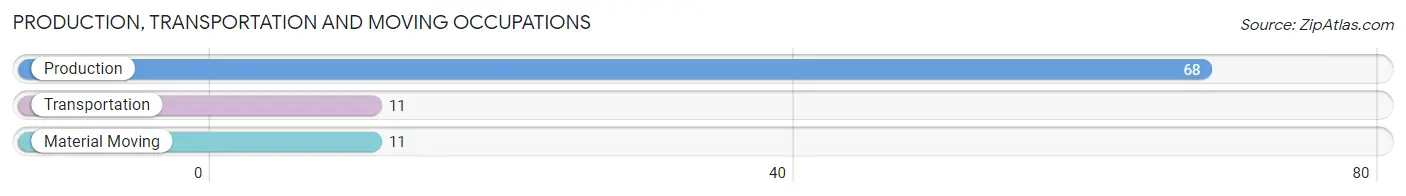
Production, Transportation and Moving Occupations
The most common Production, Transportation and Moving occupations in Johnson City are Production (68 | 8.0%), Transportation (11 | 1.3%), and Material Moving (11 | 1.3%).
Production, Transportation and Moving Occupations by Sex
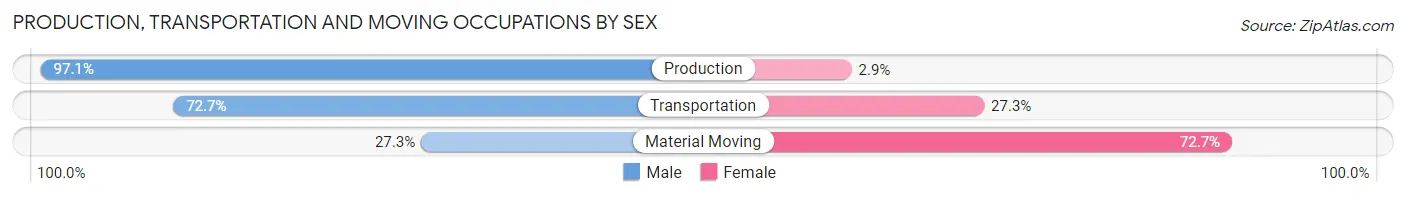
| Occupation | Male | Female |
| Production | 66 (97.1%) | 2 (2.9%) |
| Transportation | 8 (72.7%) | 3 (27.3%) |
| Material Moving | 3 (27.3%) | 8 (72.7%) |
| Total (Category) | 77 (85.6%) | 13 (14.4%) |
| Total (Overall) | 439 (51.8%) | 409 (48.2%) |
Employment Industries by Sex in Johnson City
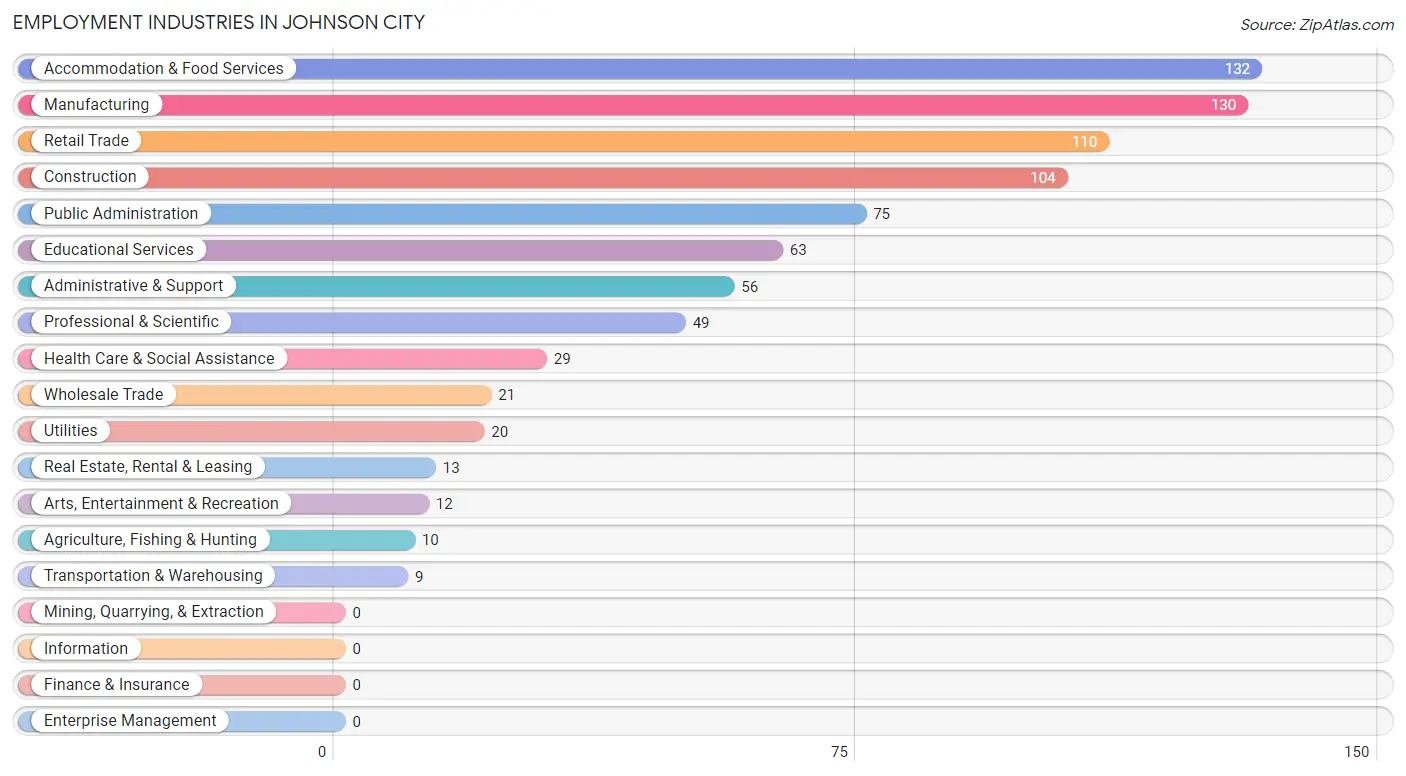
Employment Industries in Johnson City
The major employment industries in Johnson City include Accommodation & Food Services (132 | 15.6%), Manufacturing (130 | 15.3%), Retail Trade (110 | 13.0%), Construction (104 | 12.3%), and Public Administration (75 | 8.8%).
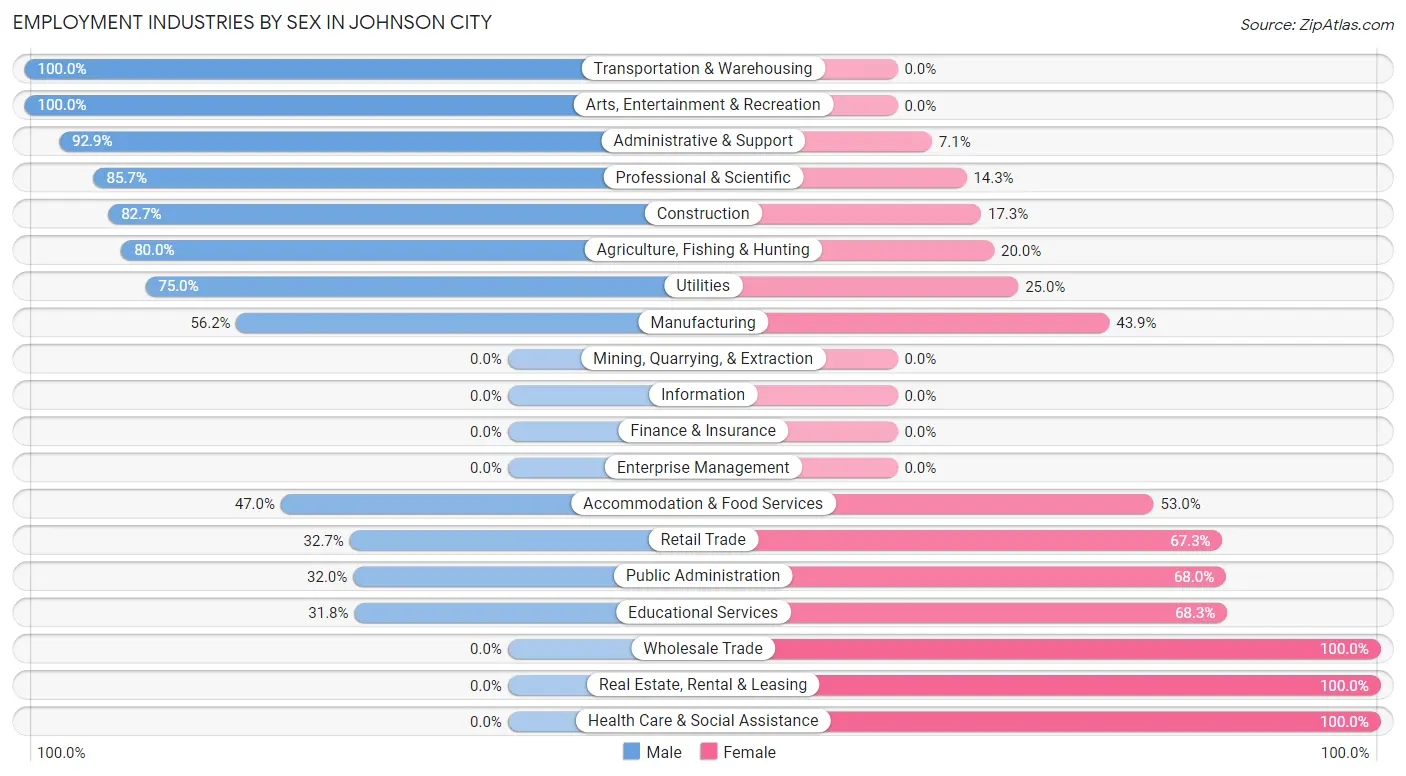
Employment Industries by Sex in Johnson City
The Johnson City industries that see more men than women are Transportation & Warehousing (100.0%), Arts, Entertainment & Recreation (100.0%), and Administrative & Support (92.9%), whereas the industries that tend to have a higher number of women are Wholesale Trade (100.0%), Real Estate, Rental & Leasing (100.0%), and Health Care & Social Assistance (100.0%).
| Industry | Male | Female |
| Agriculture, Fishing & Hunting | 8 (80.0%) | 2 (20.0%) |
| Mining, Quarrying, & Extraction | 0 (0.0%) | 0 (0.0%) |
| Construction | 86 (82.7%) | 18 (17.3%) |
| Manufacturing | 73 (56.1%) | 57 (43.9%) |
| Wholesale Trade | 0 (0.0%) | 21 (100.0%) |
| Retail Trade | 36 (32.7%) | 74 (67.3%) |
| Transportation & Warehousing | 9 (100.0%) | 0 (0.0%) |
| Utilities | 15 (75.0%) | 5 (25.0%) |
| Information | 0 (0.0%) | 0 (0.0%) |
| Finance & Insurance | 0 (0.0%) | 0 (0.0%) |
| Real Estate, Rental & Leasing | 0 (0.0%) | 13 (100.0%) |
| Professional & Scientific | 42 (85.7%) | 7 (14.3%) |
| Enterprise Management | 0 (0.0%) | 0 (0.0%) |
| Administrative & Support | 52 (92.9%) | 4 (7.1%) |
| Educational Services | 20 (31.8%) | 43 (68.2%) |
| Health Care & Social Assistance | 0 (0.0%) | 29 (100.0%) |
| Arts, Entertainment & Recreation | 12 (100.0%) | 0 (0.0%) |
| Accommodation & Food Services | 62 (47.0%) | 70 (53.0%) |
| Public Administration | 24 (32.0%) | 51 (68.0%) |
| Total | 439 (51.8%) | 409 (48.2%) |
Education in Johnson City
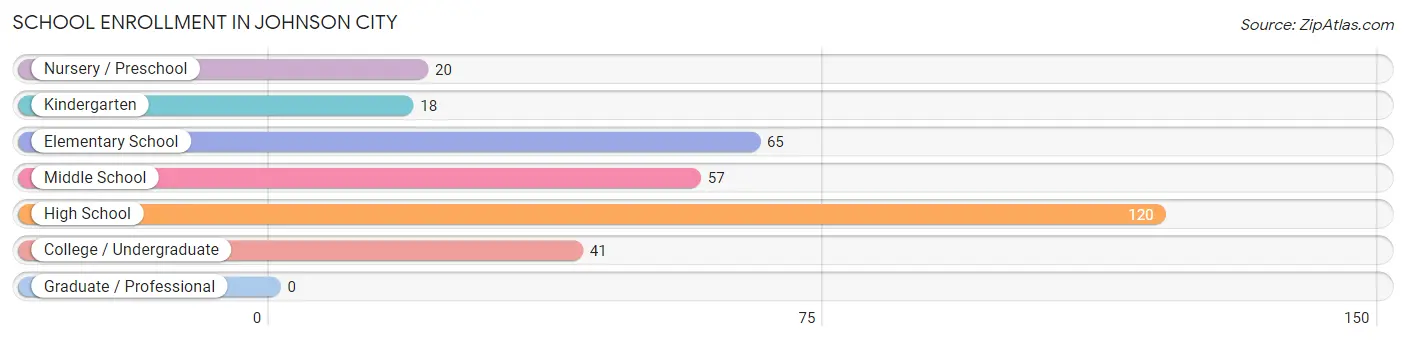
School Enrollment in Johnson City
The most common levels of schooling among the 321 students in Johnson City are high school (120 | 37.4%), elementary school (65 | 20.3%), and middle school (57 | 17.8%).
| School Level | # Students | % Students |
| Nursery / Preschool | 20 | 6.2% |
| Kindergarten | 18 | 5.6% |
| Elementary School | 65 | 20.3% |
| Middle School | 57 | 17.8% |
| High School | 120 | 37.4% |
| College / Undergraduate | 41 | 12.8% |
| Graduate / Professional | 0 | 0.0% |
| Total | 321 | 100.0% |
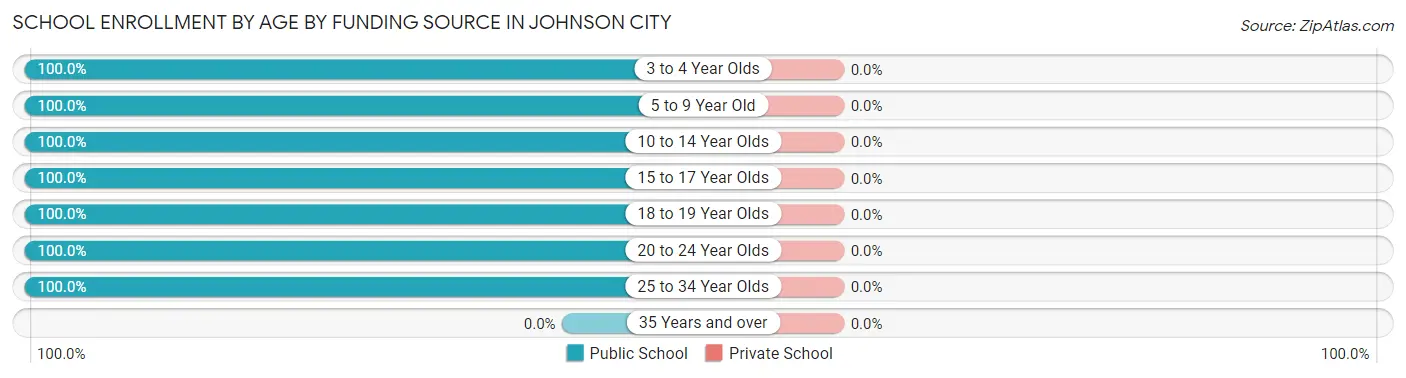
School Enrollment by Age by Funding Source in Johnson City
| Age Bracket | Public School | Private School |
| 3 to 4 Year Olds | 9 (100.0%) | 0 (0.0%) |
| 5 to 9 Year Old | 64 (100.0%) | 0 (0.0%) |
| 10 to 14 Year Olds | 87 (100.0%) | 0 (0.0%) |
| 15 to 17 Year Olds | 68 (100.0%) | 0 (0.0%) |
| 18 to 19 Year Olds | 71 (100.0%) | 0 (0.0%) |
| 20 to 24 Year Olds | 17 (100.0%) | 0 (0.0%) |
| 25 to 34 Year Olds | 5 (100.0%) | 0 (0.0%) |
| 35 Years and over | 0 (0.0%) | 0 (0.0%) |
| Total | 321 (100.0%) | 0 (0.0%) |
Educational Attainment by Field of Study in Johnson City
Education (49 | 18.9%), computers & mathematics (29 | 11.2%), business (29 | 11.2%), bio, nature & agricultural (25 | 9.6%), and literature & languages (25 | 9.6%) are the most common fields of study among 260 individuals in Johnson City who have obtained a bachelor's degree or higher.
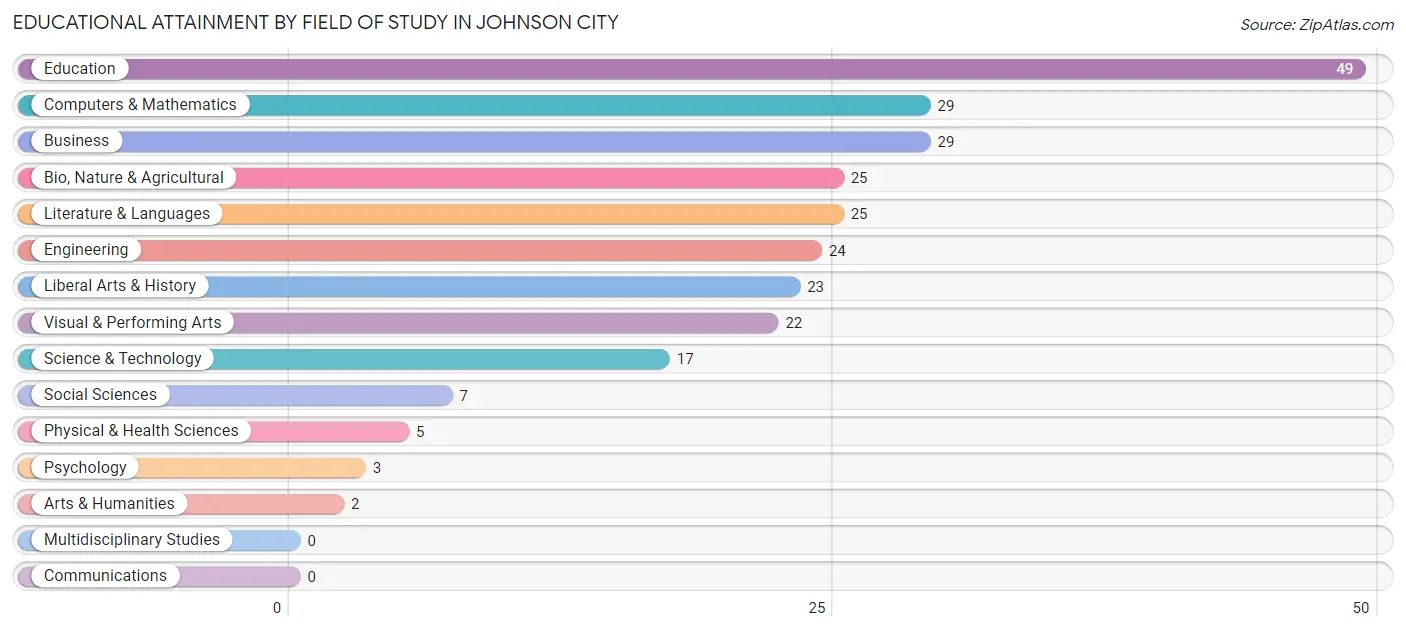
| Field of Study | # Graduates | % Graduates |
| Computers & Mathematics | 29 | 11.2% |
| Bio, Nature & Agricultural | 25 | 9.6% |
| Physical & Health Sciences | 5 | 1.9% |
| Psychology | 3 | 1.1% |
| Social Sciences | 7 | 2.7% |
| Engineering | 24 | 9.2% |
| Multidisciplinary Studies | 0 | 0.0% |
| Science & Technology | 17 | 6.5% |
| Business | 29 | 11.2% |
| Education | 49 | 18.9% |
| Literature & Languages | 25 | 9.6% |
| Liberal Arts & History | 23 | 8.8% |
| Visual & Performing Arts | 22 | 8.5% |
| Communications | 0 | 0.0% |
| Arts & Humanities | 2 | 0.8% |
| Total | 260 | 100.0% |
Transportation & Commute in Johnson City
Vehicle Availability by Sex in Johnson City
The most prevalent vehicle ownership categories in Johnson City are males with 3 vehicles (122, accounting for 29.0%) and females with 3 vehicles (134, making up 29.8%).
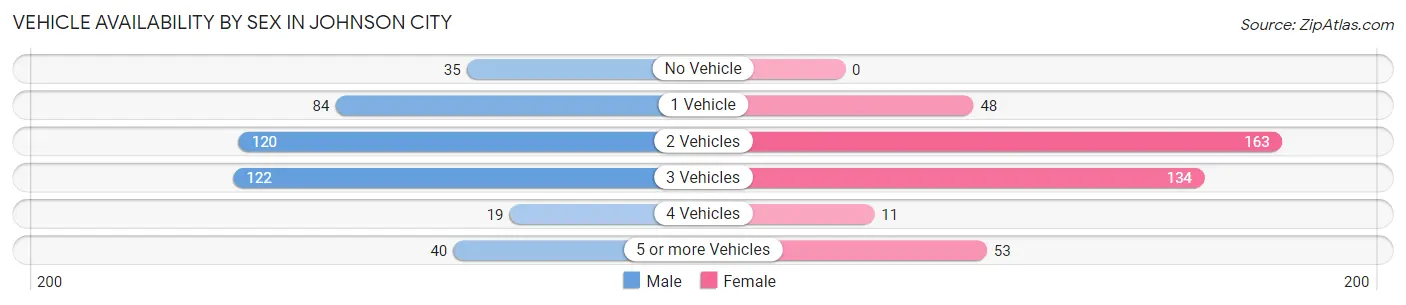
| Vehicles Available | Male | Female |
| No Vehicle | 35 (8.3%) | 0 (0.0%) |
| 1 Vehicle | 84 (20.0%) | 48 (11.7%) |
| 2 Vehicles | 120 (28.6%) | 163 (39.9%) |
| 3 Vehicles | 122 (29.0%) | 134 (32.8%) |
| 4 Vehicles | 19 (4.5%) | 11 (2.7%) |
| 5 or more Vehicles | 40 (9.5%) | 53 (13.0%) |
| Total | 420 (100.0%) | 409 (100.0%) |
Commute Time in Johnson City
The most frequently occuring commute durations in Johnson City are 5 to 9 minutes (255 commuters, 32.9%), less than 5 minutes (134 commuters, 17.3%), and 15 to 19 minutes (93 commuters, 12.0%).
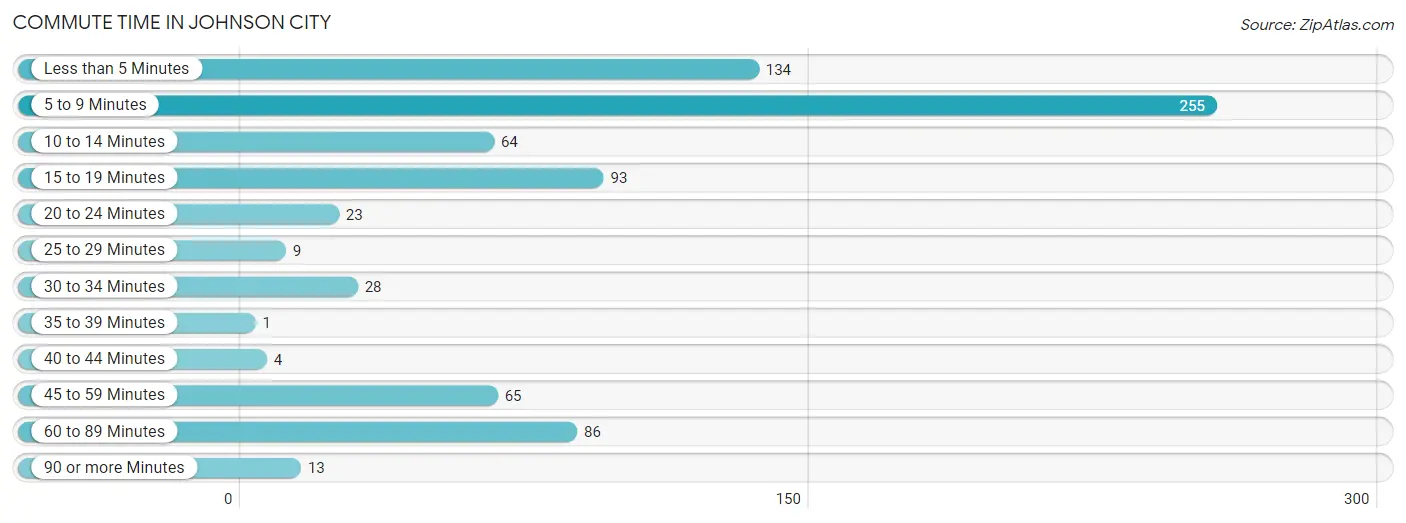
| Commute Time | # Commuters | % Commuters |
| Less than 5 Minutes | 134 | 17.3% |
| 5 to 9 Minutes | 255 | 32.9% |
| 10 to 14 Minutes | 64 | 8.3% |
| 15 to 19 Minutes | 93 | 12.0% |
| 20 to 24 Minutes | 23 | 3.0% |
| 25 to 29 Minutes | 9 | 1.2% |
| 30 to 34 Minutes | 28 | 3.6% |
| 35 to 39 Minutes | 1 | 0.1% |
| 40 to 44 Minutes | 4 | 0.5% |
| 45 to 59 Minutes | 65 | 8.4% |
| 60 to 89 Minutes | 86 | 11.1% |
| 90 or more Minutes | 13 | 1.7% |
Commute Time by Sex in Johnson City
The most common commute times in Johnson City are 5 to 9 minutes (111 commuters, 28.8%) for males and 5 to 9 minutes (144 commuters, 37.0%) for females.
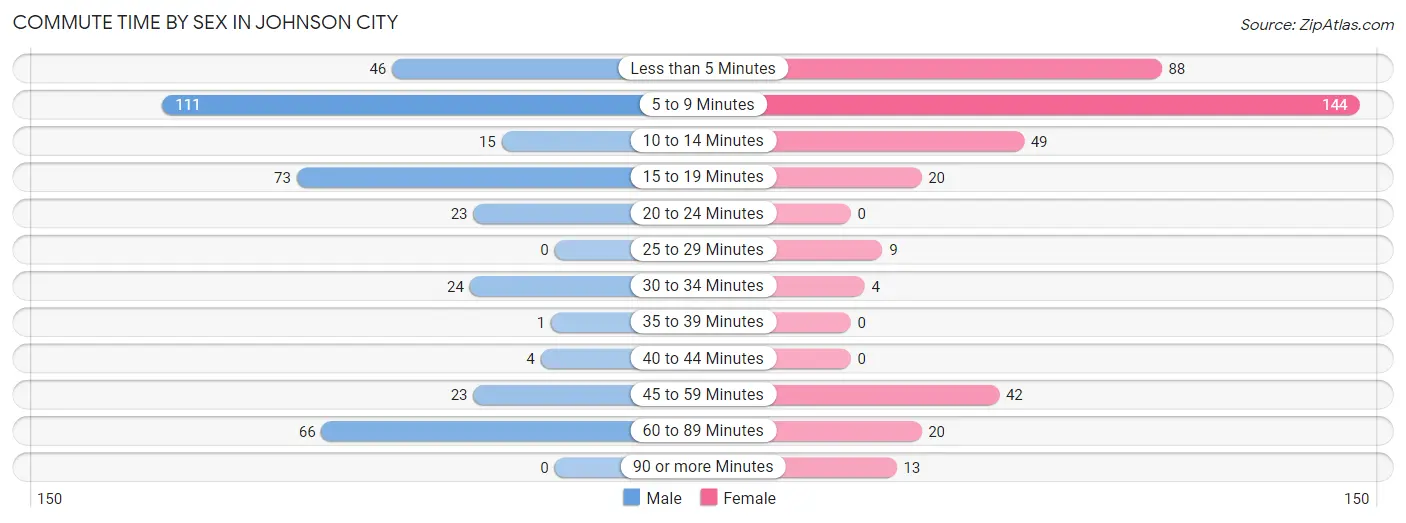
| Commute Time | Male | Female |
| Less than 5 Minutes | 46 (11.9%) | 88 (22.6%) |
| 5 to 9 Minutes | 111 (28.8%) | 144 (37.0%) |
| 10 to 14 Minutes | 15 (3.9%) | 49 (12.6%) |
| 15 to 19 Minutes | 73 (18.9%) | 20 (5.1%) |
| 20 to 24 Minutes | 23 (6.0%) | 0 (0.0%) |
| 25 to 29 Minutes | 0 (0.0%) | 9 (2.3%) |
| 30 to 34 Minutes | 24 (6.2%) | 4 (1.0%) |
| 35 to 39 Minutes | 1 (0.3%) | 0 (0.0%) |
| 40 to 44 Minutes | 4 (1.0%) | 0 (0.0%) |
| 45 to 59 Minutes | 23 (6.0%) | 42 (10.8%) |
| 60 to 89 Minutes | 66 (17.1%) | 20 (5.1%) |
| 90 or more Minutes | 0 (0.0%) | 13 (3.3%) |
Time of Departure to Work by Sex in Johnson City
The most frequent times of departure to work in Johnson City are 6:00 AM to 6:29 AM (92, 23.8%) for males and 7:30 AM to 7:59 AM (120, 30.8%) for females.
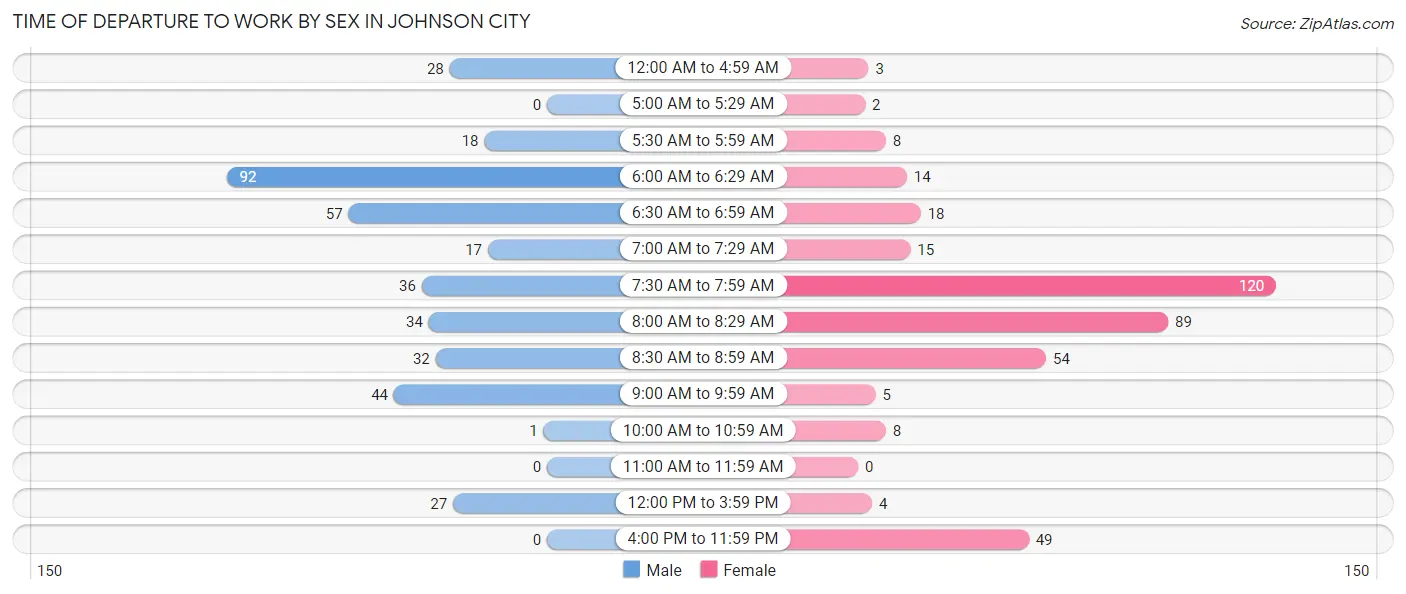
| Time of Departure | Male | Female |
| 12:00 AM to 4:59 AM | 28 (7.2%) | 3 (0.8%) |
| 5:00 AM to 5:29 AM | 0 (0.0%) | 2 (0.5%) |
| 5:30 AM to 5:59 AM | 18 (4.7%) | 8 (2.1%) |
| 6:00 AM to 6:29 AM | 92 (23.8%) | 14 (3.6%) |
| 6:30 AM to 6:59 AM | 57 (14.8%) | 18 (4.6%) |
| 7:00 AM to 7:29 AM | 17 (4.4%) | 15 (3.9%) |
| 7:30 AM to 7:59 AM | 36 (9.3%) | 120 (30.8%) |
| 8:00 AM to 8:29 AM | 34 (8.8%) | 89 (22.9%) |
| 8:30 AM to 8:59 AM | 32 (8.3%) | 54 (13.9%) |
| 9:00 AM to 9:59 AM | 44 (11.4%) | 5 (1.3%) |
| 10:00 AM to 10:59 AM | 1 (0.3%) | 8 (2.1%) |
| 11:00 AM to 11:59 AM | 0 (0.0%) | 0 (0.0%) |
| 12:00 PM to 3:59 PM | 27 (7.0%) | 4 (1.0%) |
| 4:00 PM to 11:59 PM | 0 (0.0%) | 49 (12.6%) |
| Total | 386 (100.0%) | 389 (100.0%) |
Housing Occupancy in Johnson City
Occupancy by Ownership in Johnson City
Of the total 759 dwellings in Johnson City, owner-occupied units account for 413 (54.4%), while renter-occupied units make up 346 (45.6%).
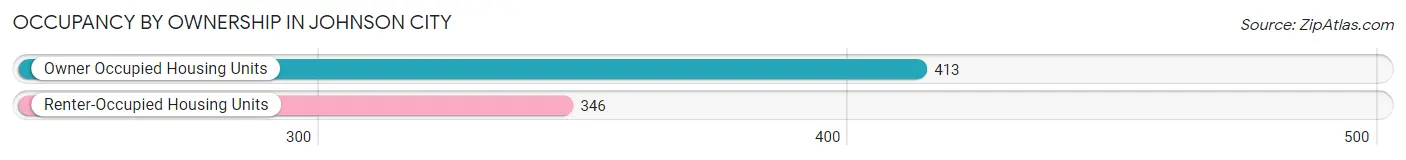
| Occupancy | # Housing Units | % Housing Units |
| Owner Occupied Housing Units | 413 | 54.4% |
| Renter-Occupied Housing Units | 346 | 45.6% |
| Total Occupied Housing Units | 759 | 100.0% |
Occupancy by Household Size in Johnson City
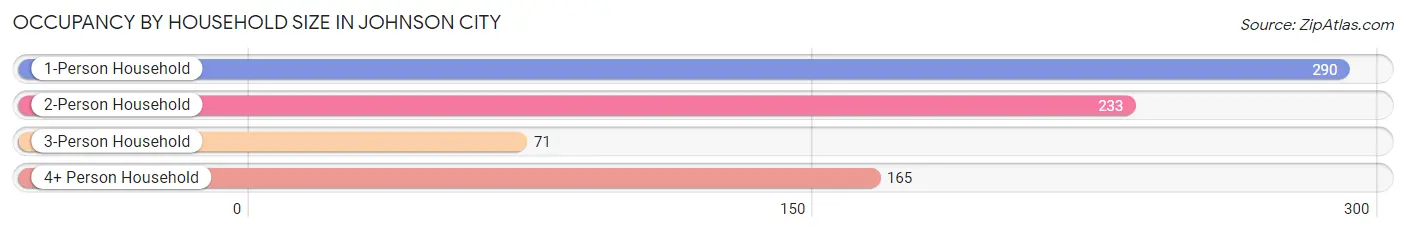
| Household Size | # Housing Units | % Housing Units |
| 1-Person Household | 290 | 38.2% |
| 2-Person Household | 233 | 30.7% |
| 3-Person Household | 71 | 9.3% |
| 4+ Person Household | 165 | 21.7% |
| Total Housing Units | 759 | 100.0% |
Occupancy by Ownership by Household Size in Johnson City
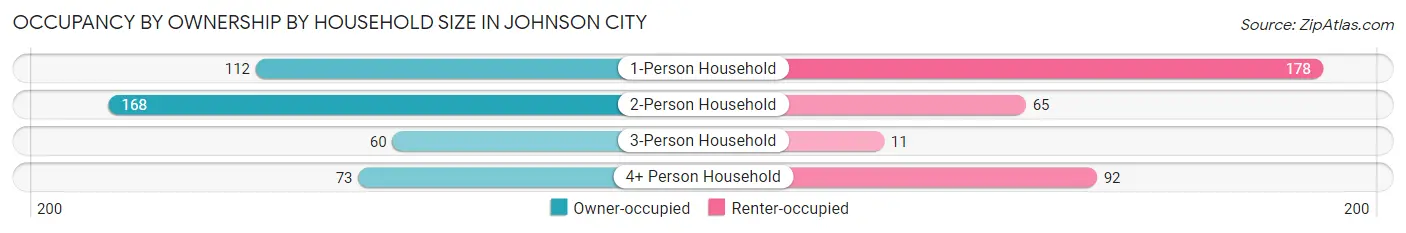
| Household Size | Owner-occupied | Renter-occupied |
| 1-Person Household | 112 (38.6%) | 178 (61.4%) |
| 2-Person Household | 168 (72.1%) | 65 (27.9%) |
| 3-Person Household | 60 (84.5%) | 11 (15.5%) |
| 4+ Person Household | 73 (44.2%) | 92 (55.8%) |
| Total Housing Units | 413 (54.4%) | 346 (45.6%) |
Occupancy by Educational Attainment in Johnson City
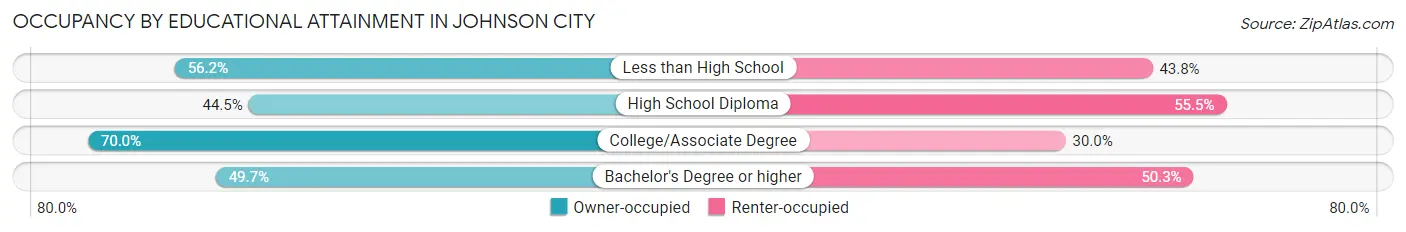
| Household Size | Owner-occupied | Renter-occupied |
| Less than High School | 50 (56.2%) | 39 (43.8%) |
| High School Diploma | 129 (44.5%) | 161 (55.5%) |
| College/Associate Degree | 156 (70.0%) | 67 (30.0%) |
| Bachelor's Degree or higher | 78 (49.7%) | 79 (50.3%) |
Occupancy by Age of Householder in Johnson City
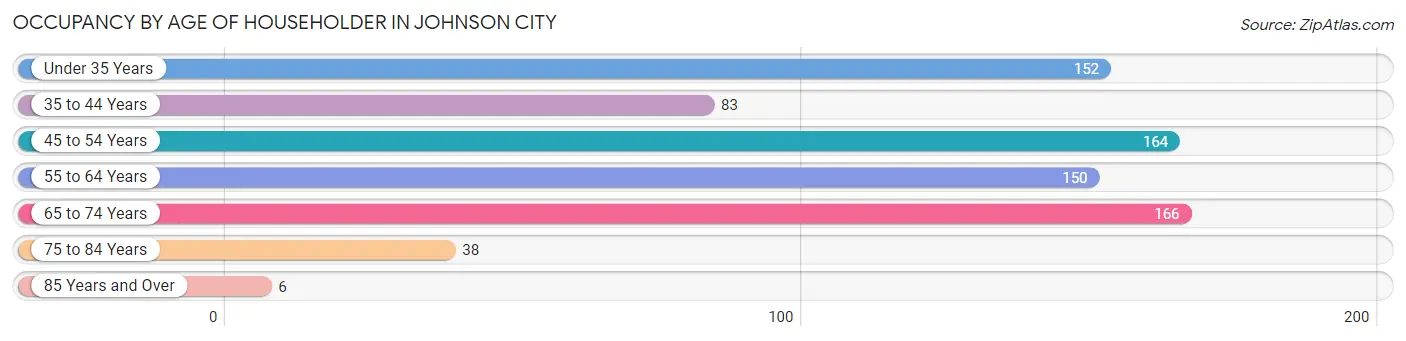
| Age Bracket | # Households | % Households |
| Under 35 Years | 152 | 20.0% |
| 35 to 44 Years | 83 | 10.9% |
| 45 to 54 Years | 164 | 21.6% |
| 55 to 64 Years | 150 | 19.8% |
| 65 to 74 Years | 166 | 21.9% |
| 75 to 84 Years | 38 | 5.0% |
| 85 Years and Over | 6 | 0.8% |
| Total | 759 | 100.0% |
Housing Finances in Johnson City
Median Income by Occupancy in Johnson City
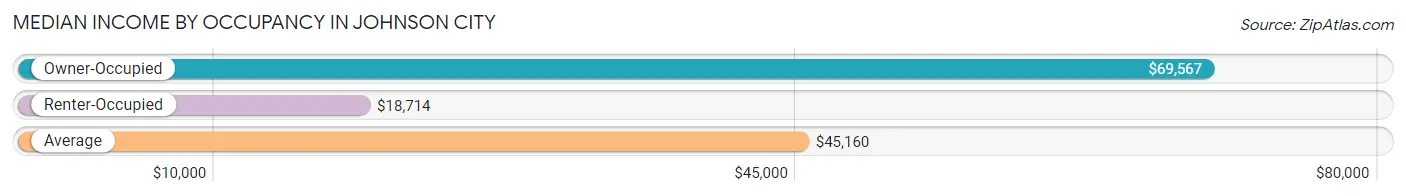
| Occupancy Type | # Households | Median Income |
| Owner-Occupied | 413 (54.4%) | $69,567 |
| Renter-Occupied | 346 (45.6%) | $18,714 |
| Average | 759 (100.0%) | $45,160 |
Occupancy by Householder Income Bracket in Johnson City
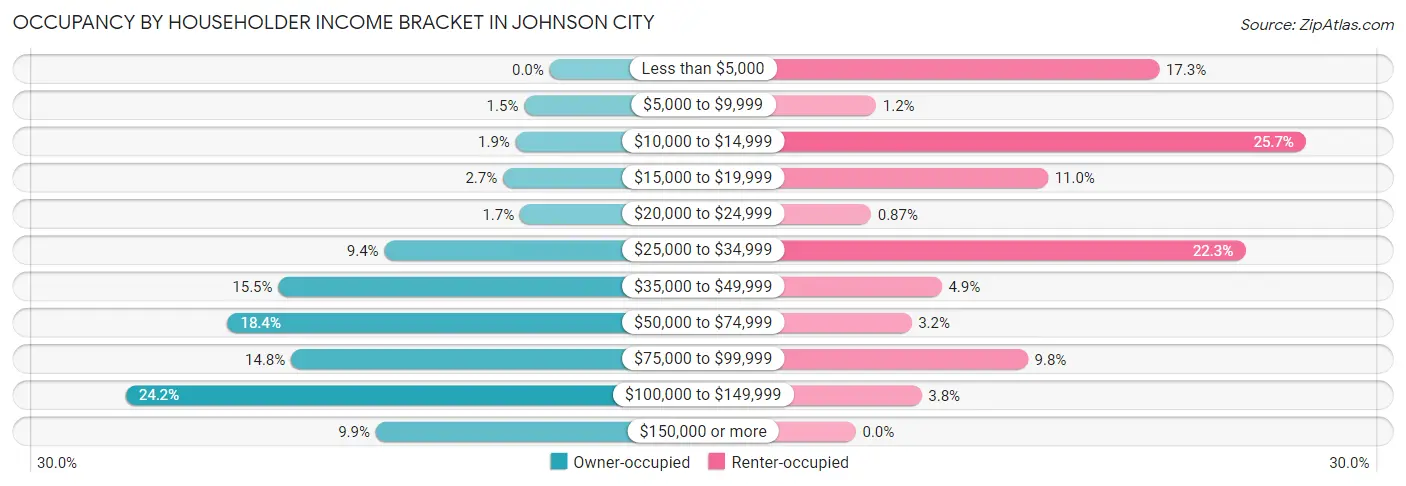
| Income Bracket | Owner-occupied | Renter-occupied |
| Less than $5,000 | 0 (0.0%) | 60 (17.3%) |
| $5,000 to $9,999 | 6 (1.5%) | 4 (1.2%) |
| $10,000 to $14,999 | 8 (1.9%) | 89 (25.7%) |
| $15,000 to $19,999 | 11 (2.7%) | 38 (11.0%) |
| $20,000 to $24,999 | 7 (1.7%) | 3 (0.9%) |
| $25,000 to $34,999 | 39 (9.4%) | 77 (22.3%) |
| $35,000 to $49,999 | 64 (15.5%) | 17 (4.9%) |
| $50,000 to $74,999 | 76 (18.4%) | 11 (3.2%) |
| $75,000 to $99,999 | 61 (14.8%) | 34 (9.8%) |
| $100,000 to $149,999 | 100 (24.2%) | 13 (3.8%) |
| $150,000 or more | 41 (9.9%) | 0 (0.0%) |
| Total | 413 (100.0%) | 346 (100.0%) |
Monthly Housing Cost Tiers in Johnson City
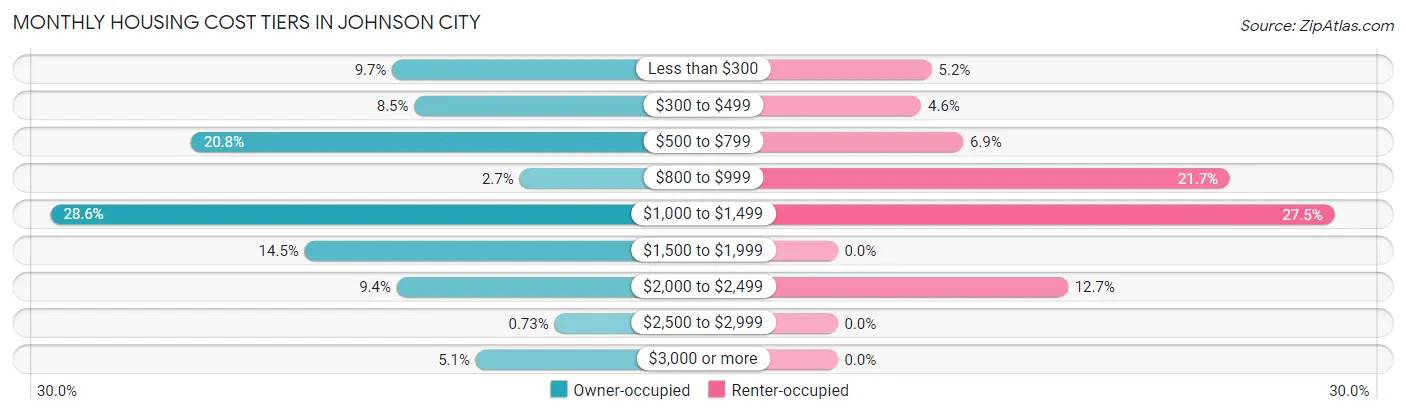
| Monthly Cost | Owner-occupied | Renter-occupied |
| Less than $300 | 40 (9.7%) | 18 (5.2%) |
| $300 to $499 | 35 (8.5%) | 16 (4.6%) |
| $500 to $799 | 86 (20.8%) | 24 (6.9%) |
| $800 to $999 | 11 (2.7%) | 75 (21.7%) |
| $1,000 to $1,499 | 118 (28.6%) | 95 (27.5%) |
| $1,500 to $1,999 | 60 (14.5%) | 0 (0.0%) |
| $2,000 to $2,499 | 39 (9.4%) | 44 (12.7%) |
| $2,500 to $2,999 | 3 (0.7%) | 0 (0.0%) |
| $3,000 or more | 21 (5.1%) | 0 (0.0%) |
| Total | 413 (100.0%) | 346 (100.0%) |
Physical Housing Characteristics in Johnson City
Housing Structures in Johnson City
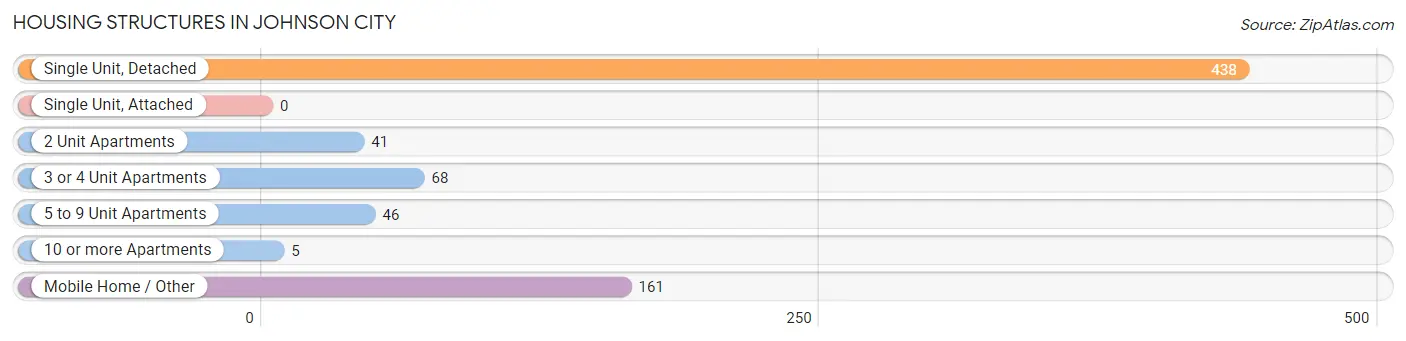
| Structure Type | # Housing Units | % Housing Units |
| Single Unit, Detached | 438 | 57.7% |
| Single Unit, Attached | 0 | 0.0% |
| 2 Unit Apartments | 41 | 5.4% |
| 3 or 4 Unit Apartments | 68 | 9.0% |
| 5 to 9 Unit Apartments | 46 | 6.1% |
| 10 or more Apartments | 5 | 0.7% |
| Mobile Home / Other | 161 | 21.2% |
| Total | 759 | 100.0% |
Housing Structures by Occupancy in Johnson City
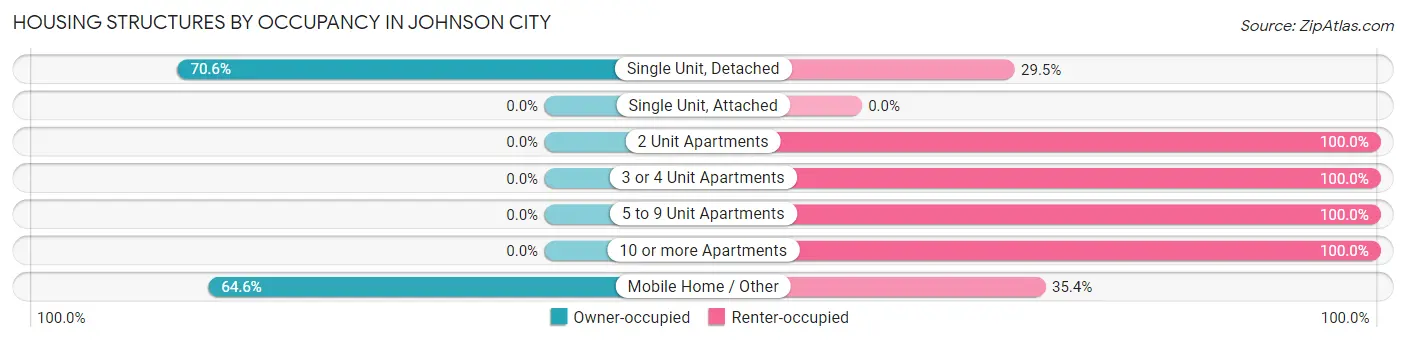
| Structure Type | Owner-occupied | Renter-occupied |
| Single Unit, Detached | 309 (70.6%) | 129 (29.4%) |
| Single Unit, Attached | 0 (0.0%) | 0 (0.0%) |
| 2 Unit Apartments | 0 (0.0%) | 41 (100.0%) |
| 3 or 4 Unit Apartments | 0 (0.0%) | 68 (100.0%) |
| 5 to 9 Unit Apartments | 0 (0.0%) | 46 (100.0%) |
| 10 or more Apartments | 0 (0.0%) | 5 (100.0%) |
| Mobile Home / Other | 104 (64.6%) | 57 (35.4%) |
| Total | 413 (54.4%) | 346 (45.6%) |
Housing Structures by Number of Rooms in Johnson City
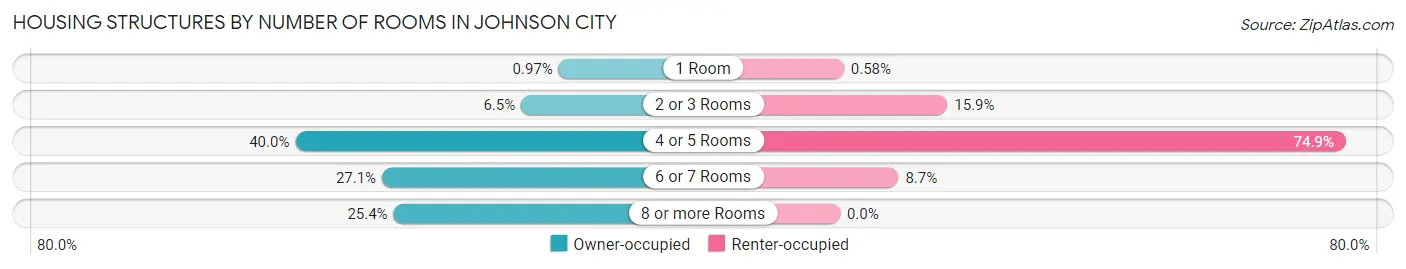
| Number of Rooms | Owner-occupied | Renter-occupied |
| 1 Room | 4 (1.0%) | 2 (0.6%) |
| 2 or 3 Rooms | 27 (6.5%) | 55 (15.9%) |
| 4 or 5 Rooms | 165 (40.0%) | 259 (74.9%) |
| 6 or 7 Rooms | 112 (27.1%) | 30 (8.7%) |
| 8 or more Rooms | 105 (25.4%) | 0 (0.0%) |
| Total | 413 (100.0%) | 346 (100.0%) |
Housing Structure by Heating Type in Johnson City
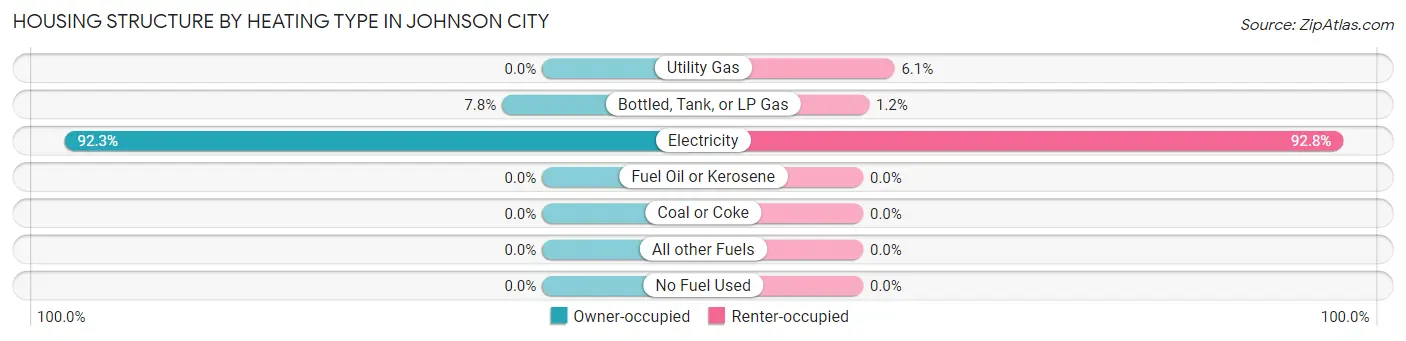
| Heating Type | Owner-occupied | Renter-occupied |
| Utility Gas | 0 (0.0%) | 21 (6.1%) |
| Bottled, Tank, or LP Gas | 32 (7.7%) | 4 (1.2%) |
| Electricity | 381 (92.2%) | 321 (92.8%) |
| Fuel Oil or Kerosene | 0 (0.0%) | 0 (0.0%) |
| Coal or Coke | 0 (0.0%) | 0 (0.0%) |
| All other Fuels | 0 (0.0%) | 0 (0.0%) |
| No Fuel Used | 0 (0.0%) | 0 (0.0%) |
| Total | 413 (100.0%) | 346 (100.0%) |
Household Vehicle Usage in Johnson City
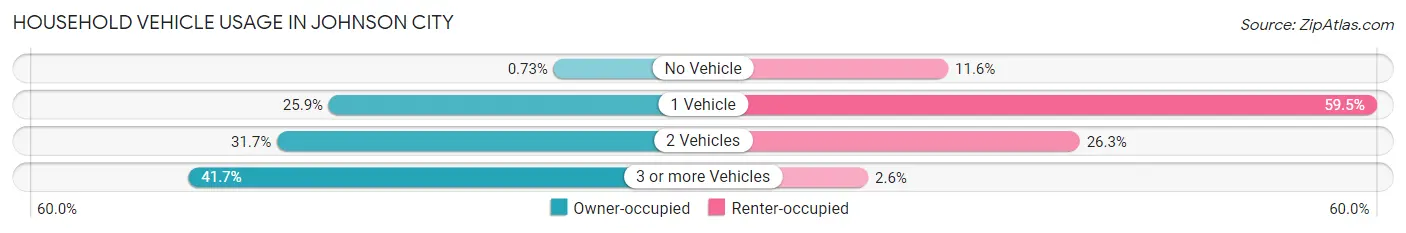
| Vehicles per Household | Owner-occupied | Renter-occupied |
| No Vehicle | 3 (0.7%) | 40 (11.6%) |
| 1 Vehicle | 107 (25.9%) | 206 (59.5%) |
| 2 Vehicles | 131 (31.7%) | 91 (26.3%) |
| 3 or more Vehicles | 172 (41.6%) | 9 (2.6%) |
| Total | 413 (100.0%) | 346 (100.0%) |
Real Estate & Mortgages in Johnson City
Real Estate and Mortgage Overview in Johnson City
| Characteristic | Without Mortgage | With Mortgage |
| Housing Units | 154 | 259 |
| Median Property Value | - | - |
| Median Household Income | $63,750 | $41 |
| Monthly Housing Costs | $505 | $21 |
| Real Estate Taxes | $1,221 | $7 |
Property Value by Mortgage Status in Johnson City
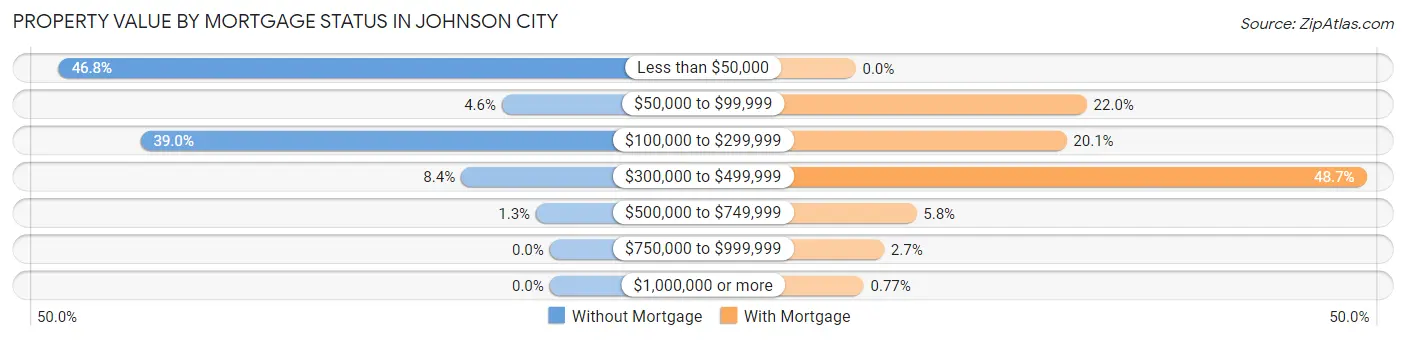
| Property Value | Without Mortgage | With Mortgage |
| Less than $50,000 | 72 (46.8%) | 0 (0.0%) |
| $50,000 to $99,999 | 7 (4.5%) | 57 (22.0%) |
| $100,000 to $299,999 | 60 (39.0%) | 52 (20.1%) |
| $300,000 to $499,999 | 13 (8.4%) | 126 (48.6%) |
| $500,000 to $749,999 | 2 (1.3%) | 15 (5.8%) |
| $750,000 to $999,999 | 0 (0.0%) | 7 (2.7%) |
| $1,000,000 or more | 0 (0.0%) | 2 (0.8%) |
| Total | 154 (100.0%) | 259 (100.0%) |
Household Income by Mortgage Status in Johnson City
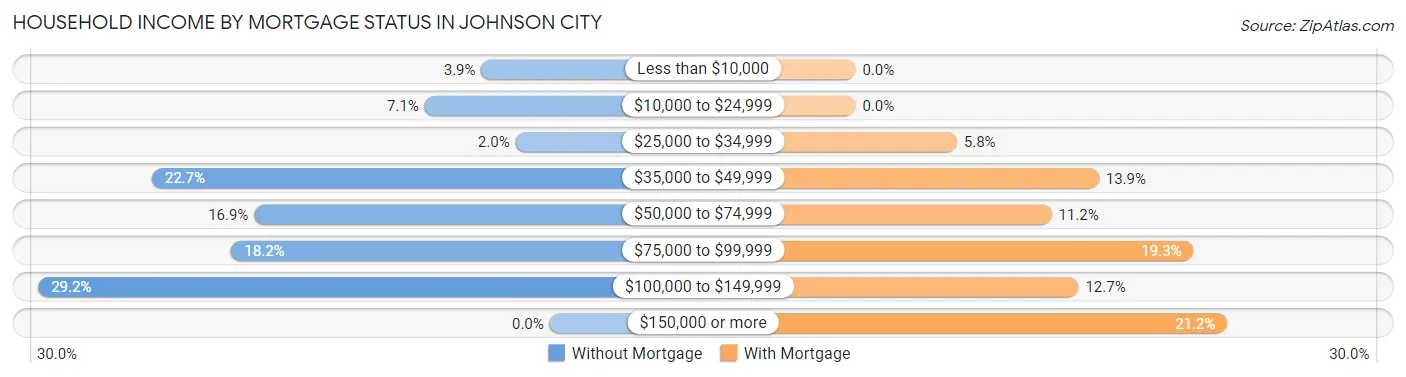
| Household Income | Without Mortgage | With Mortgage |
| Less than $10,000 | 6 (3.9%) | 0 (0.0%) |
| $10,000 to $24,999 | 11 (7.1%) | 0 (0.0%) |
| $25,000 to $34,999 | 3 (1.9%) | 15 (5.8%) |
| $35,000 to $49,999 | 35 (22.7%) | 36 (13.9%) |
| $50,000 to $74,999 | 26 (16.9%) | 29 (11.2%) |
| $75,000 to $99,999 | 28 (18.2%) | 50 (19.3%) |
| $100,000 to $149,999 | 45 (29.2%) | 33 (12.7%) |
| $150,000 or more | 0 (0.0%) | 55 (21.2%) |
| Total | 154 (100.0%) | 259 (100.0%) |
Property Value to Household Income Ratio in Johnson City
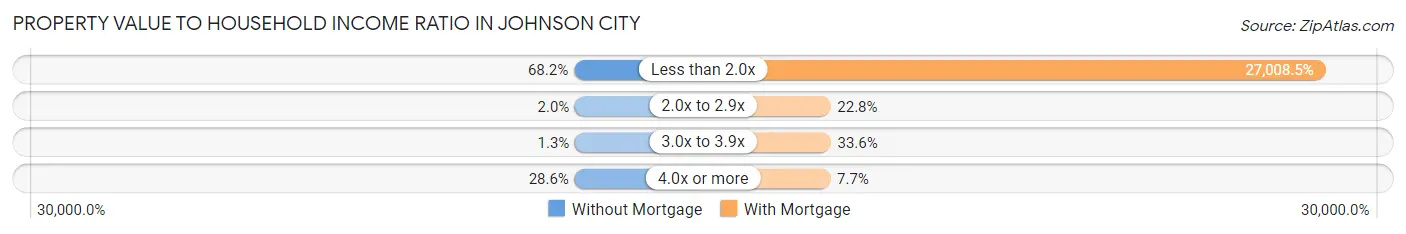
| Value-to-Income Ratio | Without Mortgage | With Mortgage |
| Less than 2.0x | 105 (68.2%) | 69,952 (27,008.5%) |
| 2.0x to 2.9x | 3 (1.9%) | 59 (22.8%) |
| 3.0x to 3.9x | 2 (1.3%) | 87 (33.6%) |
| 4.0x or more | 44 (28.6%) | 20 (7.7%) |
| Total | 154 (100.0%) | 259 (100.0%) |
Real Estate Taxes by Mortgage Status in Johnson City
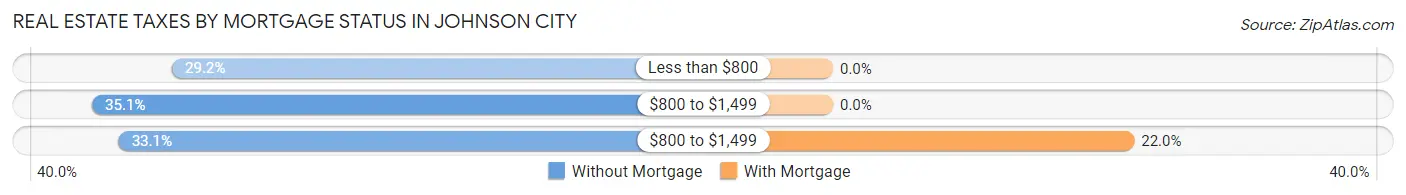
| Property Taxes | Without Mortgage | With Mortgage |
| Less than $800 | 45 (29.2%) | 0 (0.0%) |
| $800 to $1,499 | 54 (35.1%) | 0 (0.0%) |
| $800 to $1,499 | 51 (33.1%) | 57 (22.0%) |
| Total | 154 (100.0%) | 259 (100.0%) |
Health & Disability in Johnson City
Health Insurance Coverage by Age in Johnson City
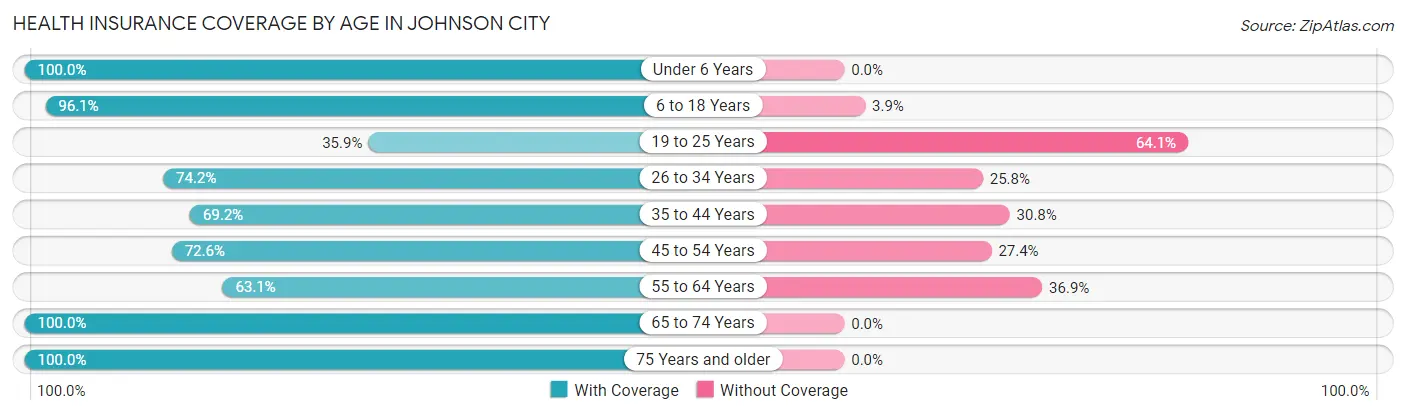
| Age Bracket | With Coverage | Without Coverage |
| Under 6 Years | 110 (100.0%) | 0 (0.0%) |
| 6 to 18 Years | 322 (96.1%) | 13 (3.9%) |
| 19 to 25 Years | 51 (35.9%) | 91 (64.1%) |
| 26 to 34 Years | 112 (74.2%) | 39 (25.8%) |
| 35 to 44 Years | 92 (69.2%) | 41 (30.8%) |
| 45 to 54 Years | 238 (72.6%) | 90 (27.4%) |
| 55 to 64 Years | 118 (63.1%) | 69 (36.9%) |
| 65 to 74 Years | 238 (100.0%) | 0 (0.0%) |
| 75 Years and older | 57 (100.0%) | 0 (0.0%) |
| Total | 1,338 (79.6%) | 343 (20.4%) |
Health Insurance Coverage by Citizenship Status in Johnson City
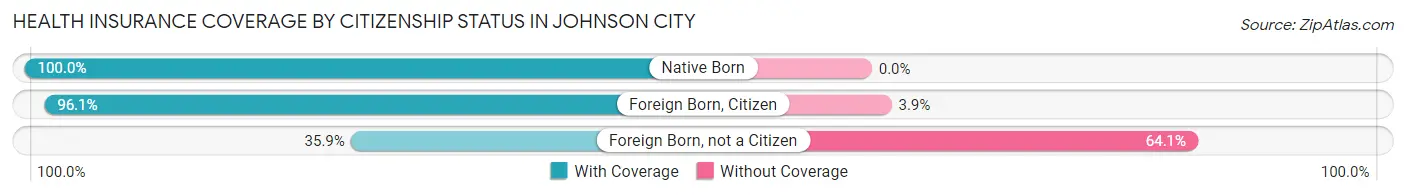
| Citizenship Status | With Coverage | Without Coverage |
| Native Born | 110 (100.0%) | 0 (0.0%) |
| Foreign Born, Citizen | 322 (96.1%) | 13 (3.9%) |
| Foreign Born, not a Citizen | 51 (35.9%) | 91 (64.1%) |
Health Insurance Coverage by Household Income in Johnson City
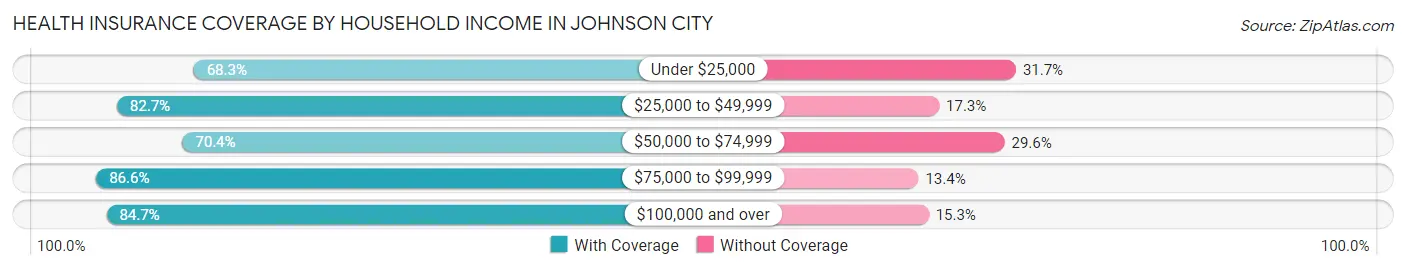
| Household Income | With Coverage | Without Coverage |
| Under $25,000 | 222 (68.3%) | 103 (31.7%) |
| $25,000 to $49,999 | 306 (82.7%) | 64 (17.3%) |
| $50,000 to $74,999 | 143 (70.4%) | 60 (29.6%) |
| $75,000 to $99,999 | 187 (86.6%) | 29 (13.4%) |
| $100,000 and over | 480 (84.7%) | 87 (15.3%) |
Public vs Private Health Insurance Coverage by Age in Johnson City
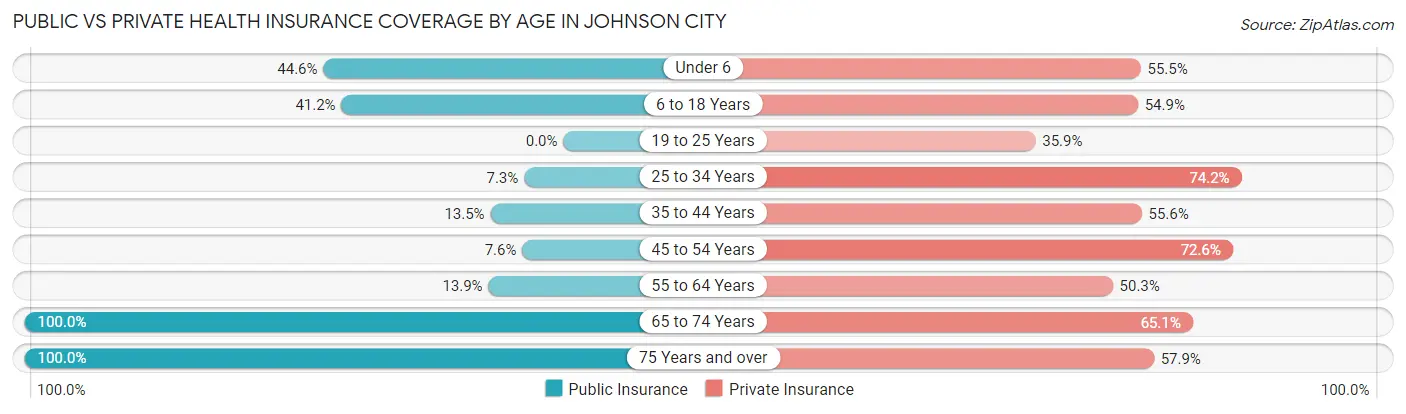
| Age Bracket | Public Insurance | Private Insurance |
| Under 6 | 49 (44.6%) | 61 (55.4%) |
| 6 to 18 Years | 138 (41.2%) | 184 (54.9%) |
| 19 to 25 Years | 0 (0.0%) | 51 (35.9%) |
| 25 to 34 Years | 11 (7.3%) | 112 (74.2%) |
| 35 to 44 Years | 18 (13.5%) | 74 (55.6%) |
| 45 to 54 Years | 25 (7.6%) | 238 (72.6%) |
| 55 to 64 Years | 26 (13.9%) | 94 (50.3%) |
| 65 to 74 Years | 238 (100.0%) | 155 (65.1%) |
| 75 Years and over | 57 (100.0%) | 33 (57.9%) |
| Total | 562 (33.4%) | 1,002 (59.6%) |
Disability Status by Sex by Age in Johnson City
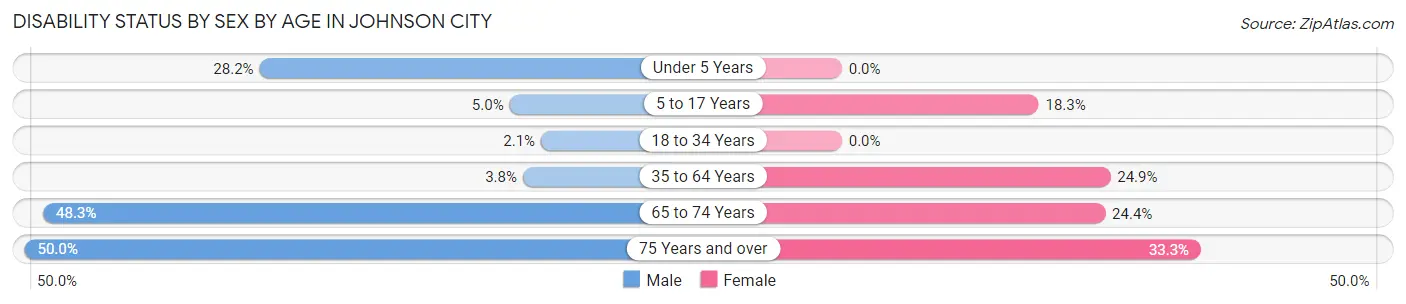
| Age Bracket | Male | Female |
| Under 5 Years | 11 (28.2%) | 0 (0.0%) |
| 5 to 17 Years | 4 (5.0%) | 40 (18.3%) |
| 18 to 34 Years | 4 (2.1%) | 0 (0.0%) |
| 35 to 64 Years | 12 (3.8%) | 82 (24.9%) |
| 65 to 74 Years | 28 (48.3%) | 44 (24.4%) |
| 75 Years and over | 3 (50.0%) | 17 (33.3%) |
Disability Class by Sex by Age in Johnson City
Disability Class: Hearing Difficulty
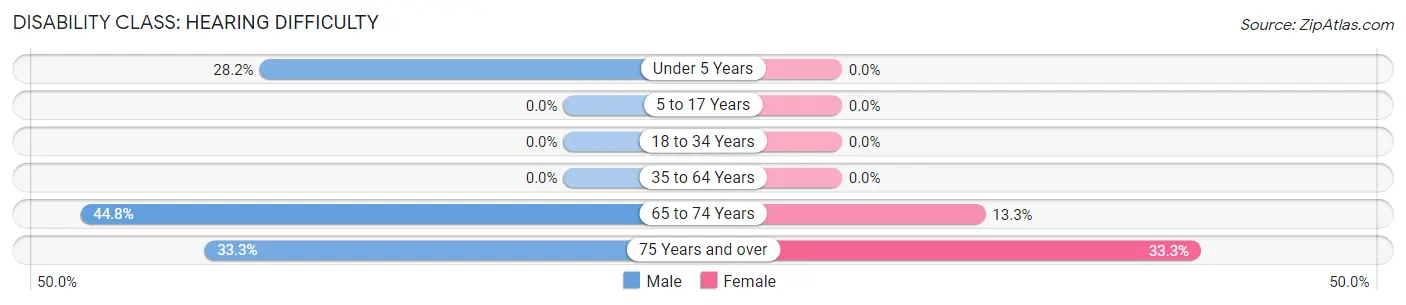
| Age Bracket | Male | Female |
| Under 5 Years | 11 (28.2%) | 0 (0.0%) |
| 5 to 17 Years | 0 (0.0%) | 0 (0.0%) |
| 18 to 34 Years | 0 (0.0%) | 0 (0.0%) |
| 35 to 64 Years | 0 (0.0%) | 0 (0.0%) |
| 65 to 74 Years | 26 (44.8%) | 24 (13.3%) |
| 75 Years and over | 2 (33.3%) | 17 (33.3%) |
Disability Class: Vision Difficulty
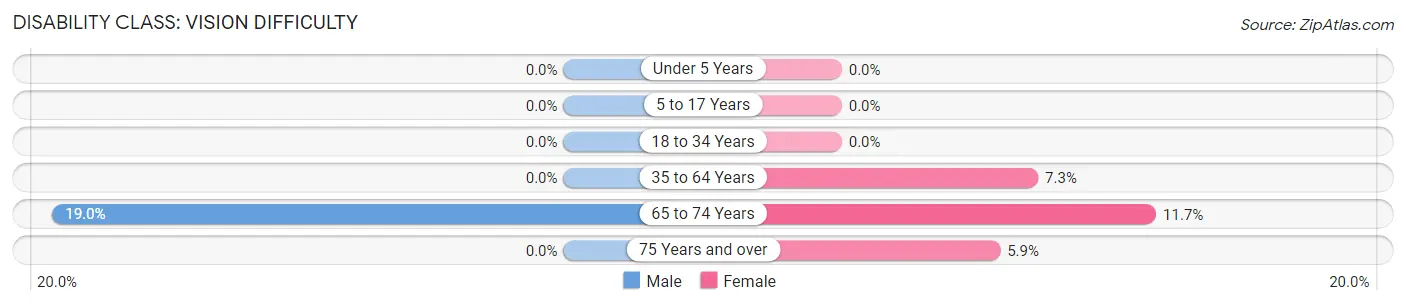
| Age Bracket | Male | Female |
| Under 5 Years | 0 (0.0%) | 0 (0.0%) |
| 5 to 17 Years | 0 (0.0%) | 0 (0.0%) |
| 18 to 34 Years | 0 (0.0%) | 0 (0.0%) |
| 35 to 64 Years | 0 (0.0%) | 24 (7.3%) |
| 65 to 74 Years | 11 (19.0%) | 21 (11.7%) |
| 75 Years and over | 0 (0.0%) | 3 (5.9%) |
Disability Class: Cognitive Difficulty
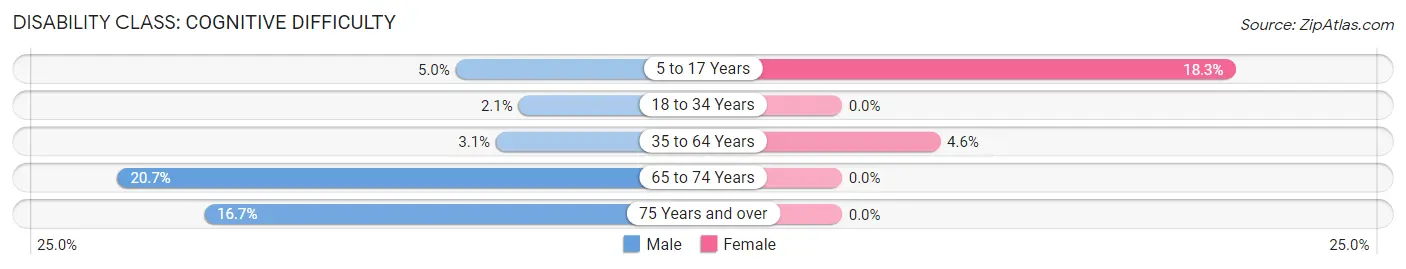
| Age Bracket | Male | Female |
| 5 to 17 Years | 4 (5.0%) | 40 (18.3%) |
| 18 to 34 Years | 4 (2.1%) | 0 (0.0%) |
| 35 to 64 Years | 10 (3.1%) | 15 (4.6%) |
| 65 to 74 Years | 12 (20.7%) | 0 (0.0%) |
| 75 Years and over | 1 (16.7%) | 0 (0.0%) |
Disability Class: Ambulatory Difficulty
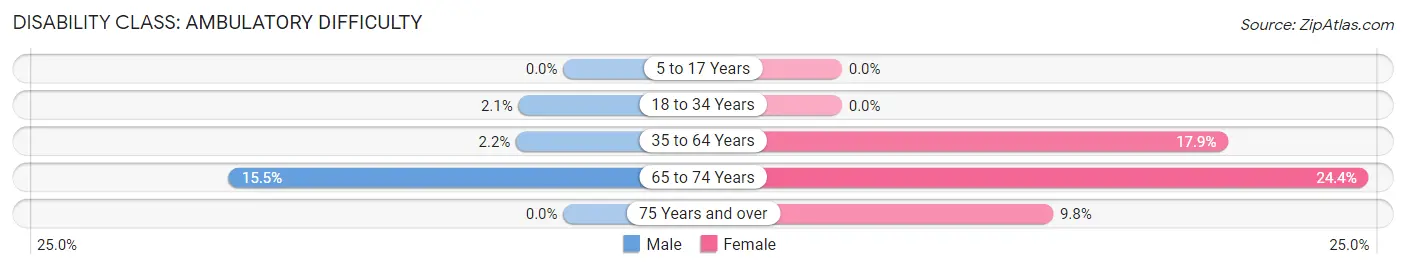
| Age Bracket | Male | Female |
| 5 to 17 Years | 0 (0.0%) | 0 (0.0%) |
| 18 to 34 Years | 4 (2.1%) | 0 (0.0%) |
| 35 to 64 Years | 7 (2.2%) | 59 (17.9%) |
| 65 to 74 Years | 9 (15.5%) | 44 (24.4%) |
| 75 Years and over | 0 (0.0%) | 5 (9.8%) |
Disability Class: Self-Care Difficulty
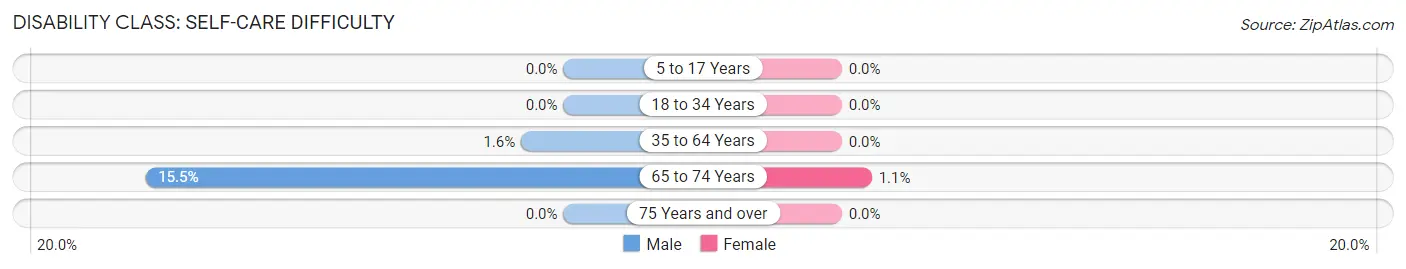
| Age Bracket | Male | Female |
| 5 to 17 Years | 0 (0.0%) | 0 (0.0%) |
| 18 to 34 Years | 0 (0.0%) | 0 (0.0%) |
| 35 to 64 Years | 5 (1.6%) | 0 (0.0%) |
| 65 to 74 Years | 9 (15.5%) | 2 (1.1%) |
| 75 Years and over | 0 (0.0%) | 0 (0.0%) |
Technology Access in Johnson City
Computing Device Access in Johnson City
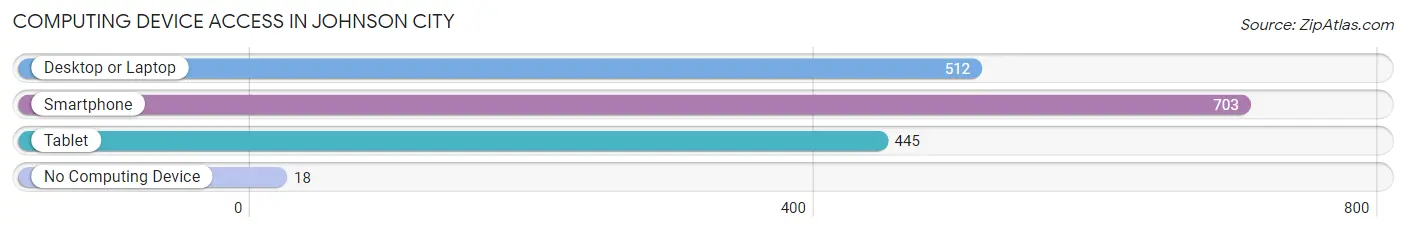
| Device Type | # Households | % Households |
| Desktop or Laptop | 512 | 67.5% |
| Smartphone | 703 | 92.6% |
| Tablet | 445 | 58.6% |
| No Computing Device | 18 | 2.4% |
| Total | 759 | 100.0% |
Internet Access in Johnson City
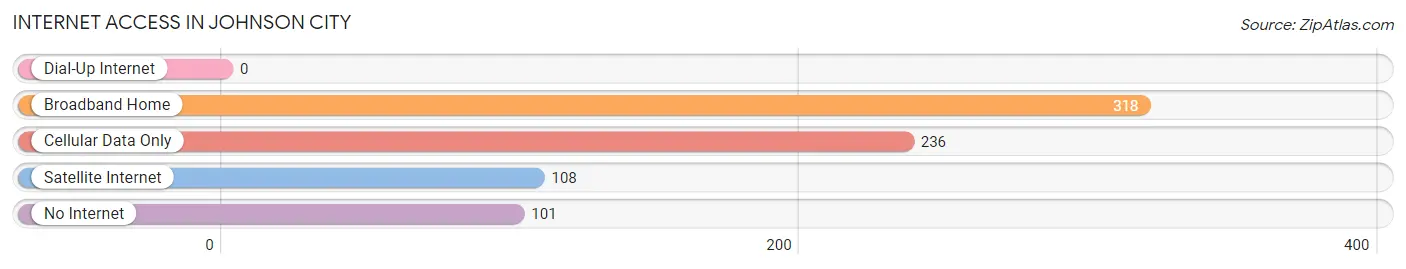
| Internet Type | # Households | % Households |
| Dial-Up Internet | 0 | 0.0% |
| Broadband Home | 318 | 41.9% |
| Cellular Data Only | 236 | 31.1% |
| Satellite Internet | 108 | 14.2% |
| No Internet | 101 | 13.3% |
| Total | 759 | 100.0% |
Johnson City Summary
Johnson City is a small town located in Blanco County, Texas, United States. It is situated in the Texas Hill Country, about 50 miles west of Austin. The population was 1,191 at the 2010 census.
History
The area around Johnson City was first settled in the late 1840s by German immigrants. The town was founded in 1879 by James Polk Johnson, a former Texas Ranger and Confederate soldier. Johnson named the town after himself and it was incorporated in 1882.
The town grew slowly but steadily, and by the early 1900s it had become a center for ranching and farming. The town was also home to several businesses, including a bank, a hotel, a blacksmith shop, and a general store.
In the 1920s, Johnson City began to experience a period of growth and prosperity. The town was connected to the outside world by the construction of a railroad line in 1925. This allowed for the shipment of goods and services to and from the town.
The Great Depression of the 1930s hit Johnson City hard, and the town's population declined. However, the town was able to survive and slowly began to recover.
In the 1950s, Johnson City experienced a period of growth and development. The town was connected to the outside world by the construction of a highway in 1954. This allowed for the shipment of goods and services to and from the town.
The town continued to grow and develop throughout the 1960s and 1970s. In the 1980s, Johnson City began to experience a period of decline. The town's population decreased and many businesses closed.
Geography
Johnson City is located in the Texas Hill Country, about 50 miles west of Austin. The town is situated in Blanco County, and is surrounded by the cities of Blanco, Dripping Springs, and Fredericksburg.
The town is located at the intersection of U.S. Highway 281 and State Highway 16. The town is situated on the banks of the Pedernales River.
The climate in Johnson City is generally mild, with hot summers and cool winters. The average annual temperature is 68 degrees Fahrenheit.
Economy
The economy of Johnson City is largely based on agriculture and tourism. The town is home to several wineries, and is a popular destination for wine tasting.
The town is also home to several businesses, including restaurants, retail stores, and a bank. The town is also home to a small airport, which serves as a hub for private and corporate aircraft.
Demographics
As of the 2010 census, the population of Johnson City was 1,191. The racial makeup of the town was 94.3% White, 0.3% African American, 0.2% Native American, 0.2% Asian, 0.1% Pacific Islander, 3.3% from other races, and 1.6% from two or more races. Hispanic or Latino of any race were 8.2% of the population.
The median household income in Johnson City was $41,250, and the median family income was $50,000. The per capita income was $20,945. About 11.2% of families and 14.2% of the population were below the poverty line.
Conclusion
Johnson City is a small town located in Blanco County, Texas. It is situated in the Texas Hill Country, about 50 miles west of Austin. The town was founded in 1879 by James Polk Johnson, and has a population of 1,191 as of the 2010 census. The economy of Johnson City is largely based on agriculture and tourism, and the town is home to several wineries and businesses. The racial makeup of the town is 94.3% White, 0.3% African American, 0.2% Native American, 0.2% Asian, 0.1% Pacific Islander, 3.3% from other races, and 1.6% from two or more races. The median household income in Johnson City was $41,250, and the median family income was $50,000.
Common Questions
What is Per Capita Income in Johnson City?
Per Capita income in Johnson City is $28,155.
What is the Median Family Income in Johnson City?
Median Family Income in Johnson City is $53,750.
What is the Median Household income in Johnson City?
Median Household Income in Johnson City is $45,160.
What is Income or Wage Gap in Johnson City?
Income or Wage Gap in Johnson City is 12.0%.
Women in Johnson City earn 88.0 cents for every dollar earned by a man.
What is Inequality or Gini Index in Johnson City?
Inequality or Gini Index in Johnson City is 0.48.
What is the Total Population of Johnson City?
Total Population of Johnson City is 1,755.
What is the Total Male Population of Johnson City?
Total Male Population of Johnson City is 743.
What is the Total Female Population of Johnson City?
Total Female Population of Johnson City is 1,012.
What is the Ratio of Males per 100 Females in Johnson City?
There are 73.42 Males per 100 Females in Johnson City.
What is the Ratio of Females per 100 Males in Johnson City?
There are 136.20 Females per 100 Males in Johnson City.
What is the Median Population Age in Johnson City?
Median Population Age in Johnson City is 43.5 Years.
What is the Average Family Size in Johnson City
Average Family Size in Johnson City is 3.0 People.
What is the Average Household Size in Johnson City
Average Household Size in Johnson City is 2.2 People.
How Large is the Labor Force in Johnson City?
There are 887 People in the Labor Forcein in Johnson City.
What is the Percentage of People in the Labor Force in Johnson City?
62.1% of People are in the Labor Force in Johnson City.
What is the Unemployment Rate in Johnson City?
Unemployment Rate in Johnson City is 4.5%.