Tehuacana, TX Map & Demographics
Tehuacana Map
Tehuacana Overview
$35,742
PER CAPITA INCOME
$79,375
AVG FAMILY INCOME
$63,750
AVG HOUSEHOLD INCOME
0.43
INEQUALITY / GINI INDEX
230
TOTAL POPULATION
139
MALE POPULATION
91
FEMALE POPULATION
152.75
MALES / 100 FEMALES
65.47
FEMALES / 100 MALES
53.3
MEDIAN AGE
2.9
AVG FAMILY SIZE
2.1
AVG HOUSEHOLD SIZE
113
LABOR FORCE [ PEOPLE ]
55.1%
PERCENT IN LABOR FORCE
Tehuacana Zip Codes
Tehuacana Area Codes
Income in Tehuacana
Income Overview in Tehuacana
Per Capita Income in Tehuacana is $35,742, while median incomes of families and households are $79,375 and $63,750 respectively.
| Characteristic | Number | Measure |
| Per Capita Income | 230 | $35,742 |
| Median Family Income | 53 | $79,375 |
| Mean Family Income | 53 | $81,372 |
| Median Household Income | 96 | $63,750 |
| Mean Household Income | 96 | $75,852 |
| Income Deficit | 53 | $0 |
| Wage / Income Gap (%) | 230 | 0.00% |
| Wage / Income Gap ($) | 230 | 100.00¢ per $1 |
| Gini / Inequality Index | 230 | 0.43 |
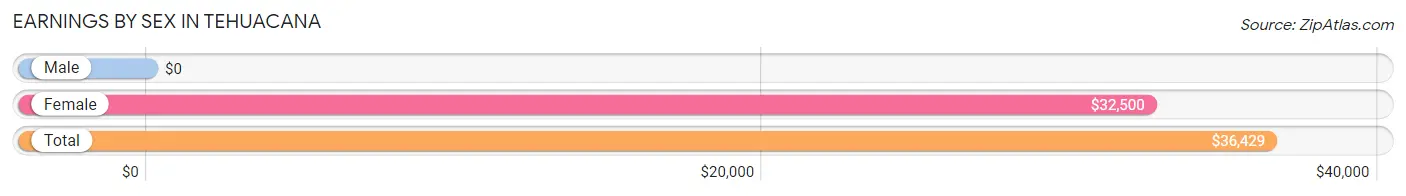
Earnings by Sex in Tehuacana
| Sex | Number | Average Earnings |
| Male | 74 (57.8%) | $0 |
| Female | 54 (42.2%) | $32,500 |
| Total | 128 (100.0%) | $36,429 |
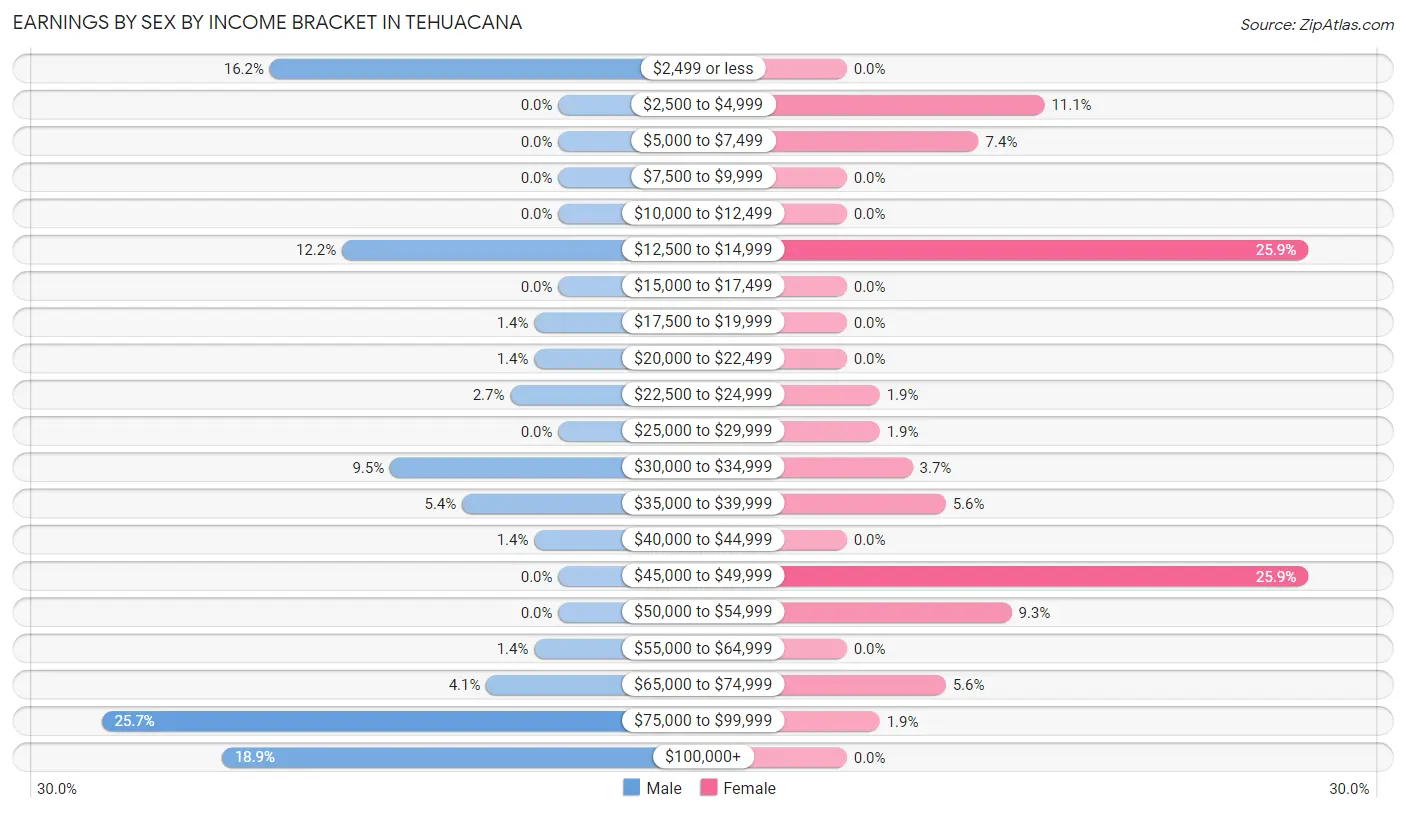
Earnings by Sex by Income Bracket in Tehuacana
The most common earnings brackets in Tehuacana are $75,000 to $99,999 for men (19 | 25.7%) and $12,500 to $14,999 for women (14 | 25.9%).
| Income | Male | Female |
| $2,499 or less | 12 (16.2%) | 0 (0.0%) |
| $2,500 to $4,999 | 0 (0.0%) | 6 (11.1%) |
| $5,000 to $7,499 | 0 (0.0%) | 4 (7.4%) |
| $7,500 to $9,999 | 0 (0.0%) | 0 (0.0%) |
| $10,000 to $12,499 | 0 (0.0%) | 0 (0.0%) |
| $12,500 to $14,999 | 9 (12.2%) | 14 (25.9%) |
| $15,000 to $17,499 | 0 (0.0%) | 0 (0.0%) |
| $17,500 to $19,999 | 1 (1.3%) | 0 (0.0%) |
| $20,000 to $22,499 | 1 (1.3%) | 0 (0.0%) |
| $22,500 to $24,999 | 2 (2.7%) | 1 (1.8%) |
| $25,000 to $29,999 | 0 (0.0%) | 1 (1.8%) |
| $30,000 to $34,999 | 7 (9.5%) | 2 (3.7%) |
| $35,000 to $39,999 | 4 (5.4%) | 3 (5.6%) |
| $40,000 to $44,999 | 1 (1.3%) | 0 (0.0%) |
| $45,000 to $49,999 | 0 (0.0%) | 14 (25.9%) |
| $50,000 to $54,999 | 0 (0.0%) | 5 (9.3%) |
| $55,000 to $64,999 | 1 (1.3%) | 0 (0.0%) |
| $65,000 to $74,999 | 3 (4.1%) | 3 (5.6%) |
| $75,000 to $99,999 | 19 (25.7%) | 1 (1.8%) |
| $100,000+ | 14 (18.9%) | 0 (0.0%) |
| Total | 74 (100.0%) | 54 (100.0%) |
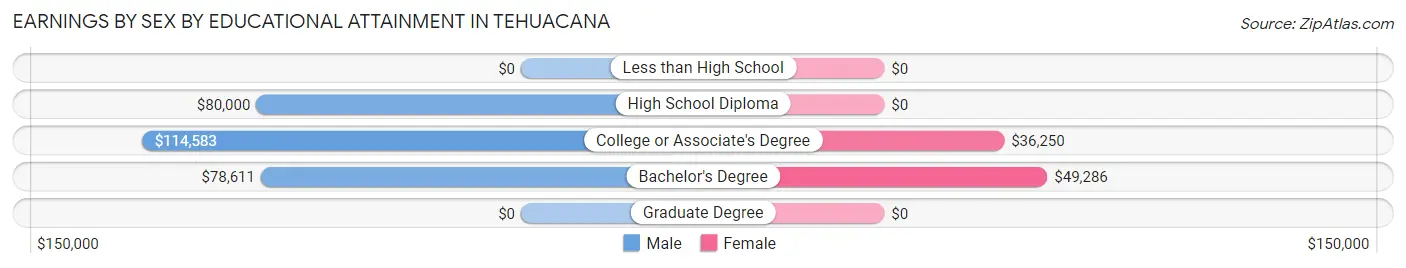
Earnings by Sex by Educational Attainment in Tehuacana
Average earnings in Tehuacana are $79,306 for men and $48,036 for women, a difference of 39.4%. Men with an educational attainment of college or associate's degree enjoy the highest average annual earnings of $114,583, while those with bachelor's degree education earn the least with $78,611. Women with an educational attainment of bachelor's degree earn the most with the average annual earnings of $49,286, while those with college or associate's degree education have the smallest earnings of $36,250.
| Educational Attainment | Male Income | Female Income |
| Less than High School | - | - |
| High School Diploma | $80,000 | $0 |
| College or Associate's Degree | $114,583 | $36,250 |
| Bachelor's Degree | $78,611 | $49,286 |
| Graduate Degree | - | - |
| Total | $79,306 | $48,036 |
Family Income in Tehuacana
Family Income Brackets in Tehuacana
According to the Tehuacana family income data, there are 10 families falling into the $50,000 to $74,999 income range, which is the most common income bracket and makes up 18.9% of all families.
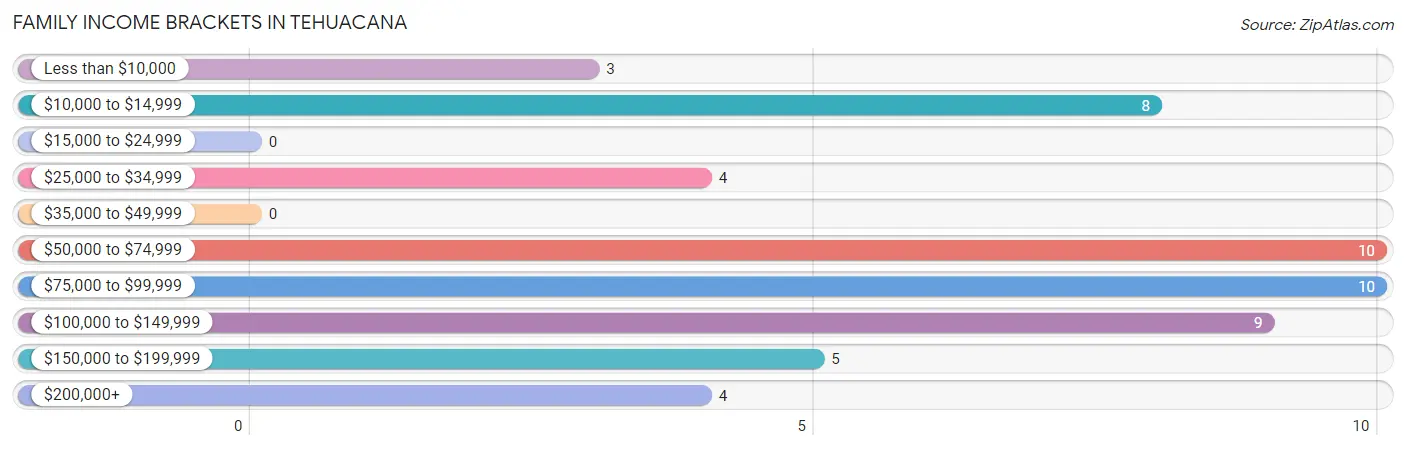
| Income Bracket | # Families | % Families |
| Less than $10,000 | 3 | 5.7% |
| $10,000 to $14,999 | 8 | 15.1% |
| $15,000 to $24,999 | 0 | 0.0% |
| $25,000 to $34,999 | 4 | 7.5% |
| $35,000 to $49,999 | 0 | 0.0% |
| $50,000 to $74,999 | 10 | 18.9% |
| $75,000 to $99,999 | 10 | 18.9% |
| $100,000 to $149,999 | 9 | 17.0% |
| $150,000 to $199,999 | 5 | 9.4% |
| $200,000+ | 4 | 7.5% |
Family Income by Famaliy Size in Tehuacana
3-person families (7 | 13.2%) account for the highest median family income in Tehuacana with $160,313 per family, while 3-person families (7 | 13.2%) have the highest median income of $53,438 per family member.
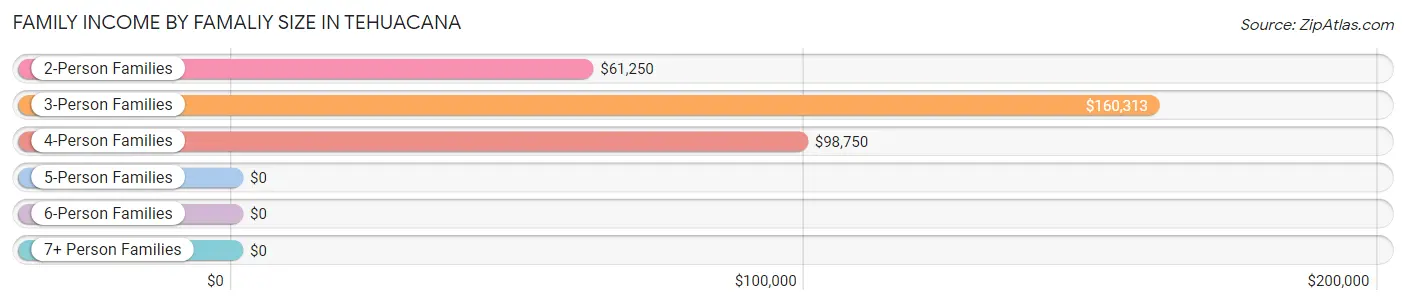
| Income Bracket | # Families | Median Income |
| 2-Person Families | 37 (69.8%) | $61,250 |
| 3-Person Families | 7 (13.2%) | $160,313 |
| 4-Person Families | 6 (11.3%) | $98,750 |
| 5-Person Families | 0 (0.0%) | $0 |
| 6-Person Families | 3 (5.7%) | $0 |
| 7+ Person Families | 0 (0.0%) | $0 |
| Total | 53 (100.0%) | $79,375 |
Family Income by Number of Earners in Tehuacana
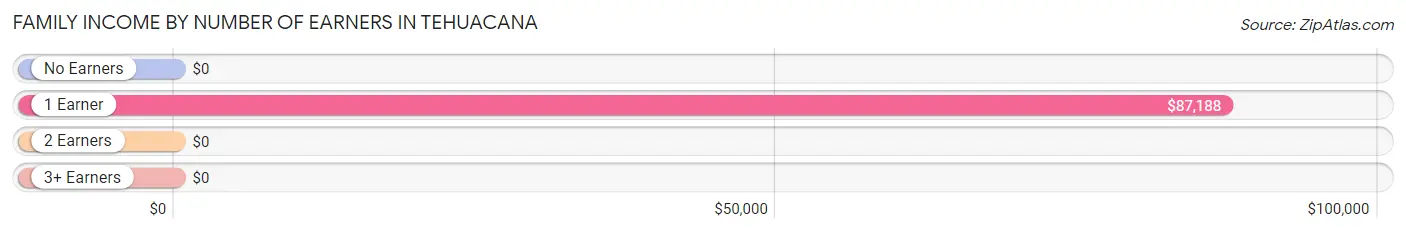
| Number of Earners | # Families | Median Income |
| No Earners | 14 (26.4%) | $0 |
| 1 Earner | 21 (39.6%) | $87,188 |
| 2 Earners | 14 (26.4%) | $0 |
| 3+ Earners | 4 (7.5%) | $0 |
| Total | 53 (100.0%) | $79,375 |
Household Income in Tehuacana
Household Income Brackets in Tehuacana
With 20 households falling in the category, the $75,000 to $99,999 income range is the most frequent in Tehuacana, accounting for 20.8% of all households. In contrast, only 5 households (5.2%) fall into the $15,000 to $24,999 income bracket, making it the least populous group.
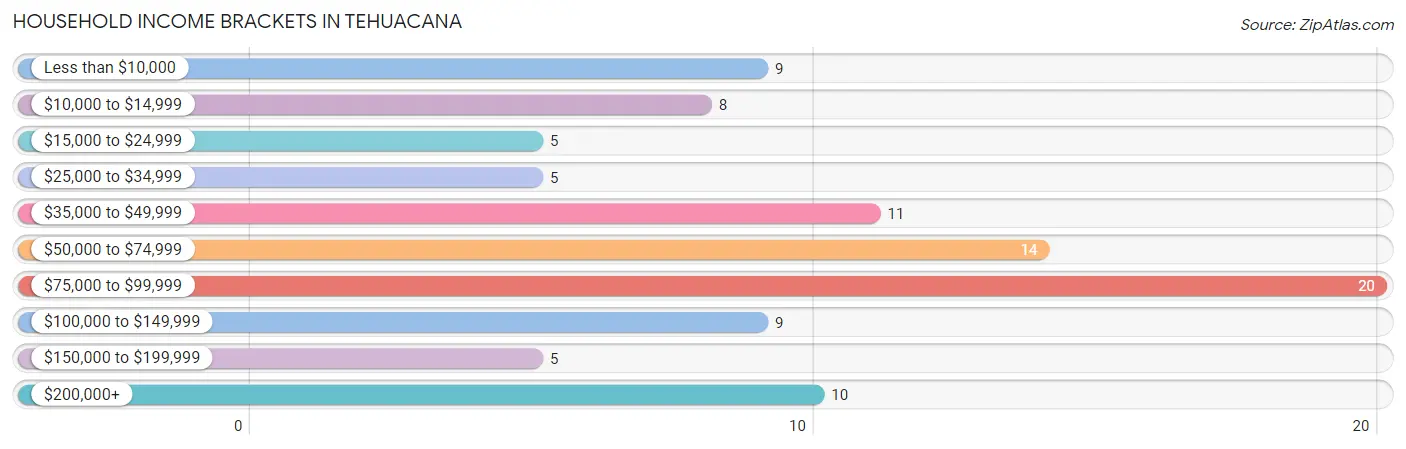
| Income Bracket | # Households | % Households |
| Less than $10,000 | 9 | 9.4% |
| $10,000 to $14,999 | 8 | 8.3% |
| $15,000 to $24,999 | 5 | 5.2% |
| $25,000 to $34,999 | 5 | 5.2% |
| $35,000 to $49,999 | 11 | 11.5% |
| $50,000 to $74,999 | 14 | 14.6% |
| $75,000 to $99,999 | 20 | 20.8% |
| $100,000 to $149,999 | 9 | 9.4% |
| $150,000 to $199,999 | 5 | 5.2% |
| $200,000+ | 10 | 10.4% |
Household Income by Householder Age in Tehuacana
The median household income in Tehuacana is $63,750, with the highest median household income of $71,250 found in the 45 to 64 years age bracket for the primary householder. A total of 41 households (42.7%) fall into this category.
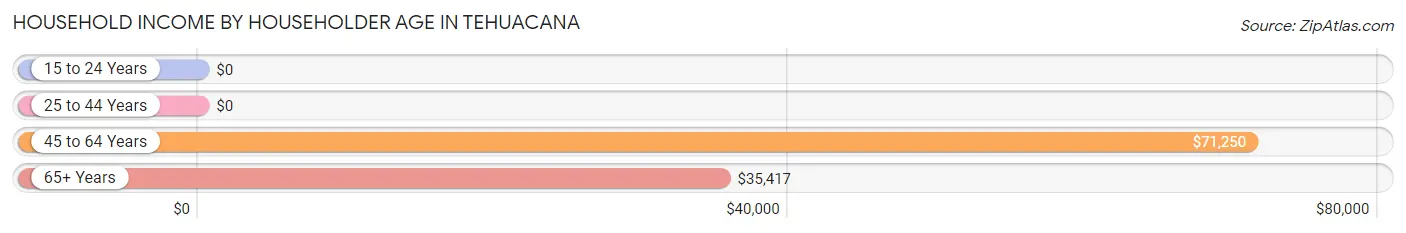
| Income Bracket | # Households | Median Income |
| 15 to 24 Years | 0 (0.0%) | $0 |
| 25 to 44 Years | 12 (12.5%) | $0 |
| 45 to 64 Years | 41 (42.7%) | $71,250 |
| 65+ Years | 43 (44.8%) | $35,417 |
| Total | 96 (100.0%) | $63,750 |
Poverty in Tehuacana
Income Below Poverty by Sex and Age in Tehuacana
With 30.6% poverty level for males and 18.5% for females among the residents of Tehuacana, 5 year old males and 25 to 34 year old females are the most vulnerable to poverty, with 4 males (100.0%) and 3 females (50.0%) in their respective age groups living below the poverty level.
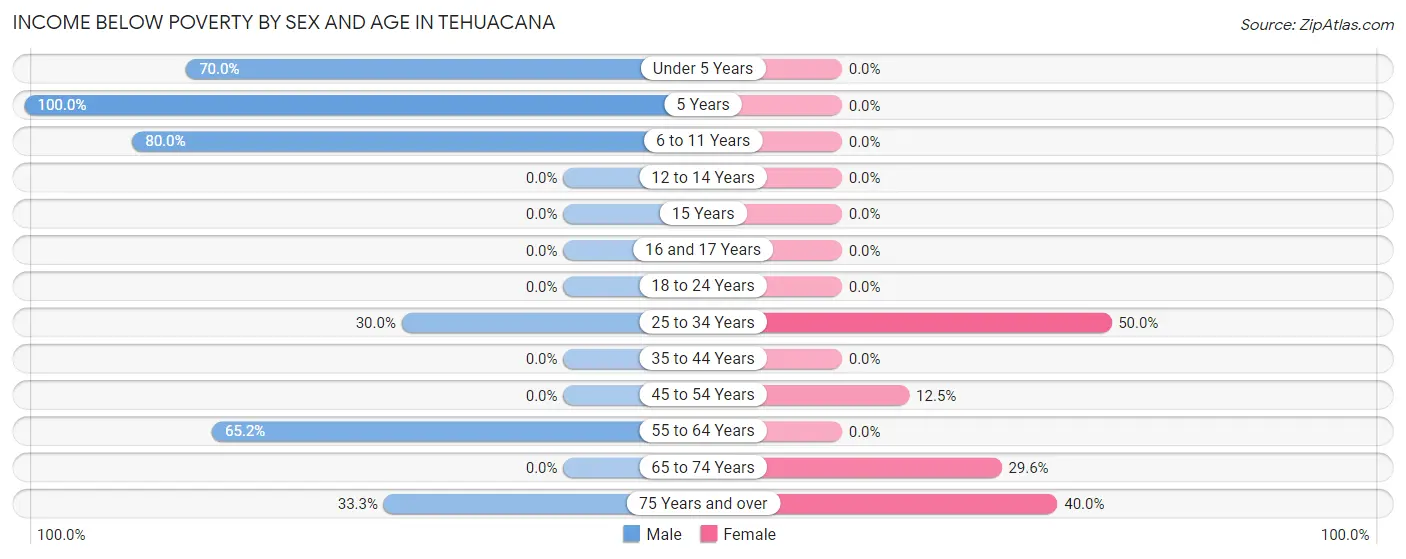
| Age Bracket | Male | Female |
| Under 5 Years | 7 (70.0%) | 0 (0.0%) |
| 5 Years | 4 (100.0%) | 0 (0.0%) |
| 6 to 11 Years | 4 (80.0%) | 0 (0.0%) |
| 12 to 14 Years | 0 (0.0%) | 0 (0.0%) |
| 15 Years | 0 (0.0%) | 0 (0.0%) |
| 16 and 17 Years | 0 (0.0%) | 0 (0.0%) |
| 18 to 24 Years | 0 (0.0%) | 0 (0.0%) |
| 25 to 34 Years | 3 (30.0%) | 3 (50.0%) |
| 35 to 44 Years | 0 (0.0%) | 0 (0.0%) |
| 45 to 54 Years | 0 (0.0%) | 2 (12.5%) |
| 55 to 64 Years | 15 (65.2%) | 0 (0.0%) |
| 65 to 74 Years | 0 (0.0%) | 8 (29.6%) |
| 75 Years and over | 4 (33.3%) | 2 (40.0%) |
| Total | 37 (30.6%) | 15 (18.5%) |
Income Above Poverty by Sex and Age in Tehuacana
According to the poverty statistics in Tehuacana, males aged 12 to 14 years and females aged 6 to 11 years are the age groups that are most secure financially, with 100.0% of males and 100.0% of females in these age groups living above the poverty line.
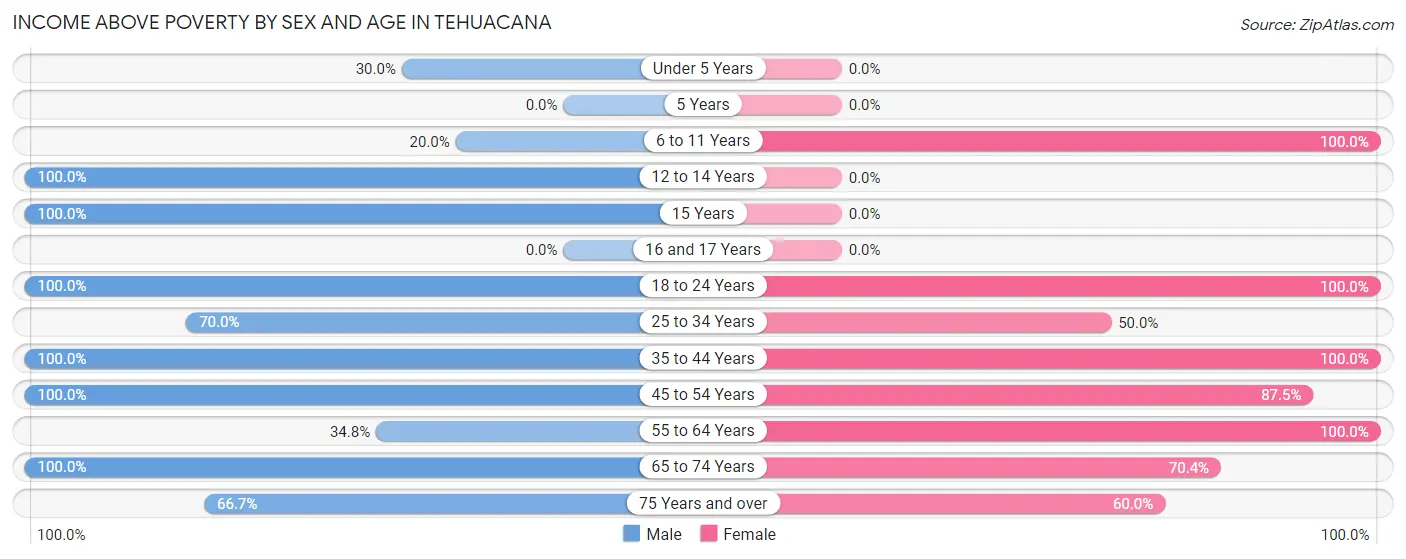
| Age Bracket | Male | Female |
| Under 5 Years | 3 (30.0%) | 0 (0.0%) |
| 5 Years | 0 (0.0%) | 0 (0.0%) |
| 6 to 11 Years | 1 (20.0%) | 3 (100.0%) |
| 12 to 14 Years | 2 (100.0%) | 0 (0.0%) |
| 15 Years | 1 (100.0%) | 0 (0.0%) |
| 16 and 17 Years | 0 (0.0%) | 0 (0.0%) |
| 18 to 24 Years | 7 (100.0%) | 4 (100.0%) |
| 25 to 34 Years | 7 (70.0%) | 3 (50.0%) |
| 35 to 44 Years | 7 (100.0%) | 1 (100.0%) |
| 45 to 54 Years | 25 (100.0%) | 14 (87.5%) |
| 55 to 64 Years | 8 (34.8%) | 19 (100.0%) |
| 65 to 74 Years | 15 (100.0%) | 19 (70.4%) |
| 75 Years and over | 8 (66.7%) | 3 (60.0%) |
| Total | 84 (69.4%) | 66 (81.5%) |
Income Below Poverty Among Married-Couple Families in Tehuacana
The poverty statistics for married-couple families in Tehuacana show that 24.4% or 11 of the total 45 families live below the poverty line. Families with 3 or 4 children have the highest poverty rate of 100.0%, comprising of 3 families. On the other hand, families with 1 or 2 children have the lowest poverty rate of 0.0%, which includes 0 families.
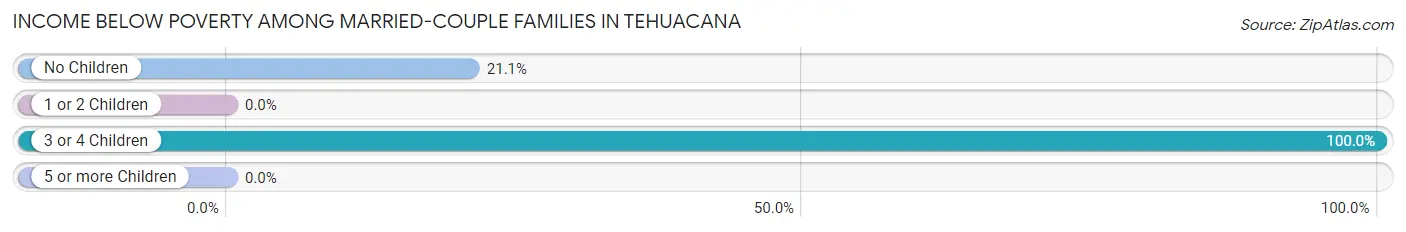
| Children | Above Poverty | Below Poverty |
| No Children | 30 (78.9%) | 8 (21.0%) |
| 1 or 2 Children | 4 (100.0%) | 0 (0.0%) |
| 3 or 4 Children | 0 (0.0%) | 3 (100.0%) |
| 5 or more Children | 0 (0.0%) | 0 (0.0%) |
| Total | 34 (75.6%) | 11 (24.4%) |
Income Below Poverty Among Single-Parent Households in Tehuacana
| Children | Single Father | Single Mother |
| No Children | 0 (0.0%) | 0 (0.0%) |
| 1 or 2 Children | 0 (0.0%) | 0 (0.0%) |
| 3 or 4 Children | 0 (0.0%) | 0 (0.0%) |
| 5 or more Children | 0 (0.0%) | 0 (0.0%) |
| Total | 0 (0.0%) | 0 (0.0%) |
Income Below Poverty Among Married-Couple vs Single-Parent Households in Tehuacana
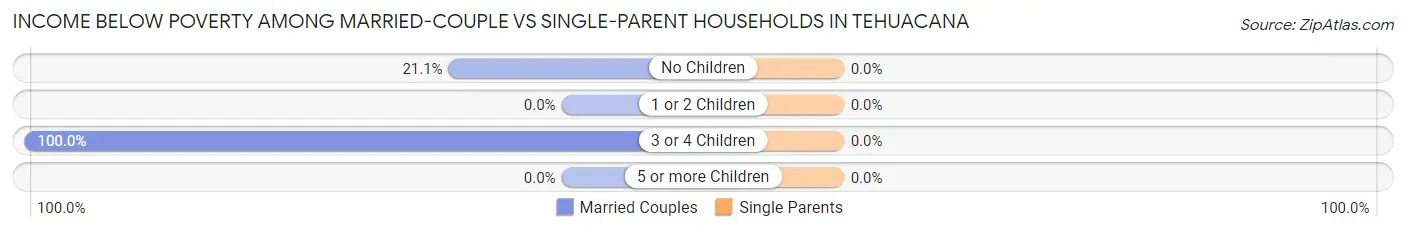
| Children | Married-Couple Families | Single-Parent Households |
| No Children | 8 (21.0%) | 0 (0.0%) |
| 1 or 2 Children | 0 (0.0%) | 0 (0.0%) |
| 3 or 4 Children | 3 (100.0%) | 0 (0.0%) |
| 5 or more Children | 0 (0.0%) | 0 (0.0%) |
| Total | 11 (24.4%) | 0 (0.0%) |
Race in Tehuacana
The most populous races in Tehuacana are White / Caucasian (176 | 76.5%), Two or more Races (31 | 13.5%), and Hispanic or Latino (28 | 12.2%).
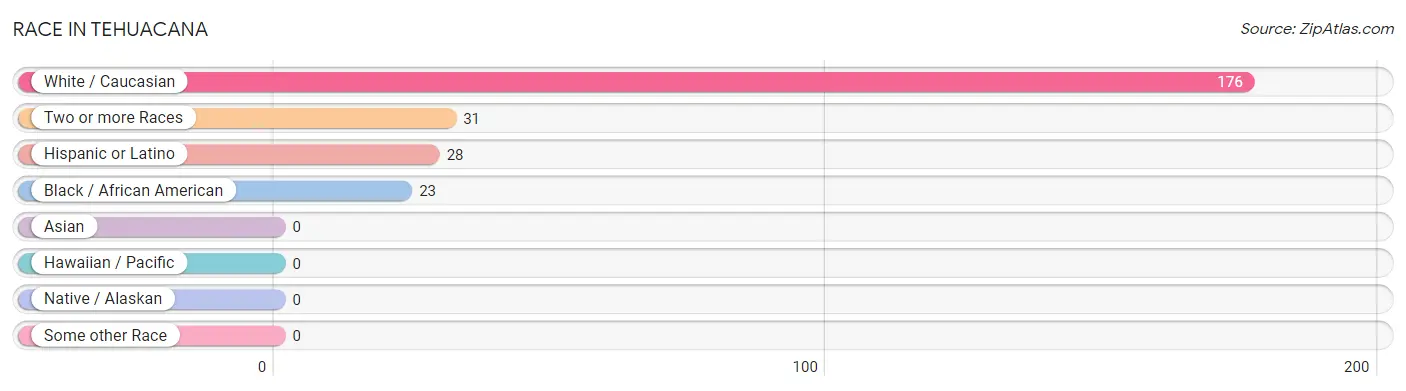
| Race | # Population | % Population |
| Asian | 0 | 0.0% |
| Black / African American | 23 | 10.0% |
| Hawaiian / Pacific | 0 | 0.0% |
| Hispanic or Latino | 28 | 12.2% |
| Native / Alaskan | 0 | 0.0% |
| White / Caucasian | 176 | 76.5% |
| Two or more Races | 31 | 13.5% |
| Some other Race | 0 | 0.0% |
| Total | 230 | 100.0% |
Ancestry in Tehuacana
The most populous ancestries reported in Tehuacana are English (35 | 15.2%), Irish (33 | 14.3%), Mexican (28 | 12.2%), German (13 | 5.7%), and Chickasaw (11 | 4.8%), together accounting for 52.2% of all Tehuacana residents.
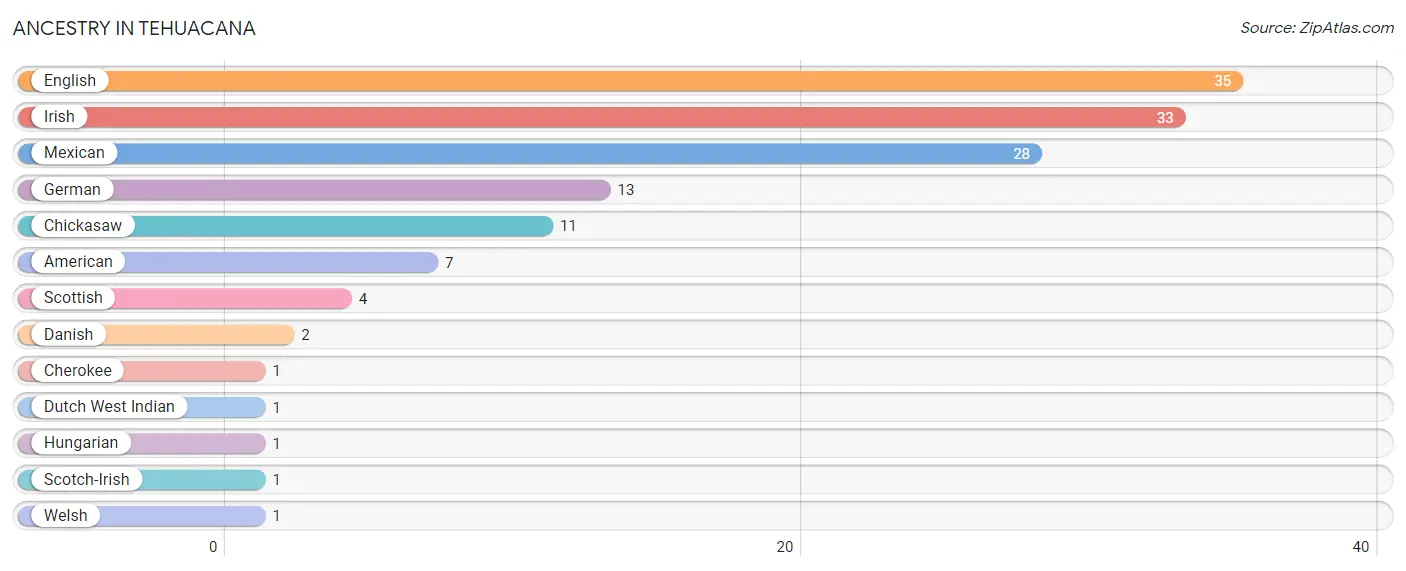
| Ancestry | # Population | % Population |
| American | 7 | 3.0% |
| Cherokee | 1 | 0.4% |
| Chickasaw | 11 | 4.8% |
| Danish | 2 | 0.9% |
| Dutch West Indian | 1 | 0.4% |
| English | 35 | 15.2% |
| German | 13 | 5.7% |
| Hungarian | 1 | 0.4% |
| Irish | 33 | 14.3% |
| Mexican | 28 | 12.2% |
| Scotch-Irish | 1 | 0.4% |
| Scottish | 4 | 1.7% |
| Welsh | 1 | 0.4% | View All 13 Rows |
Immigrants in Tehuacana

| Immigration Origin | # Population | % Population | View All 0 Rows |
Sex and Age in Tehuacana
Sex and Age in Tehuacana
The most populous age groups in Tehuacana are 55 to 59 Years (17 | 12.2%) for men and 65 to 69 Years (19 | 20.9%) for women.
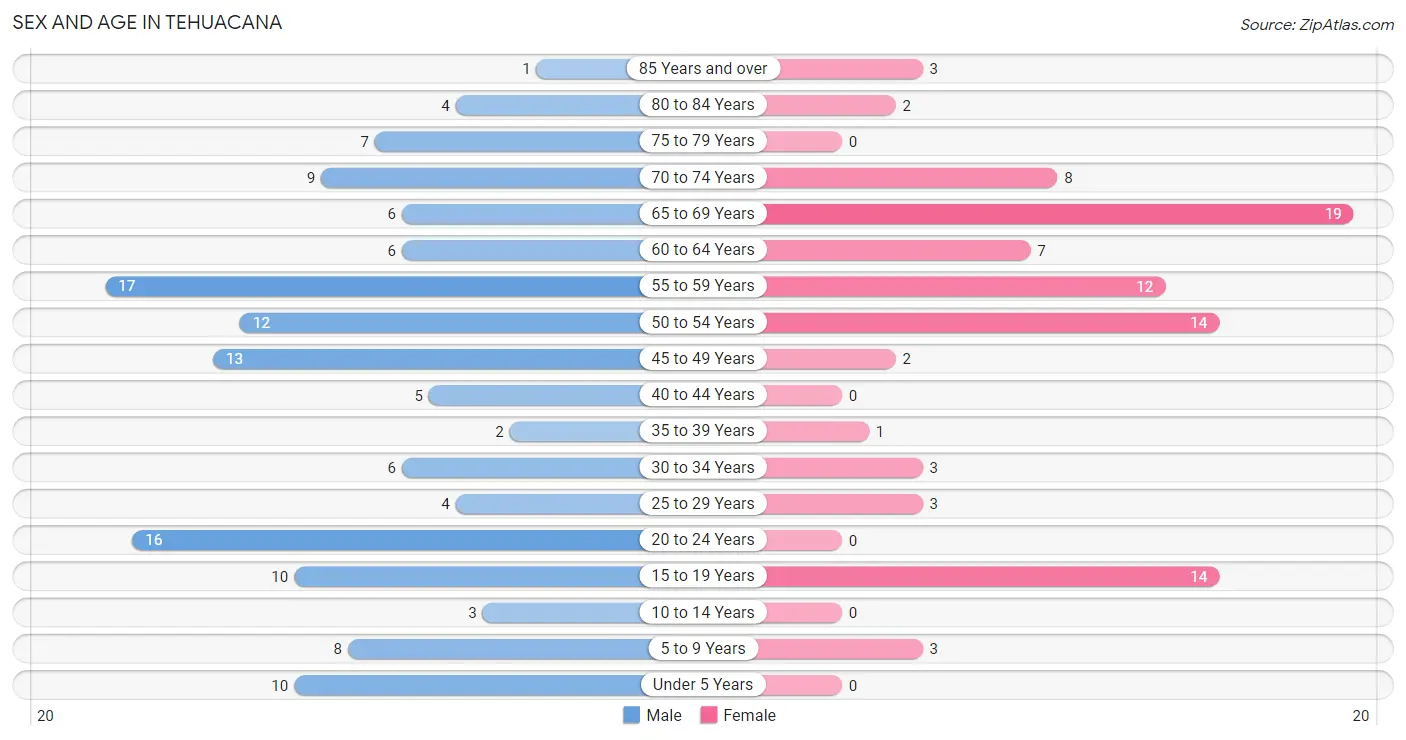
| Age Bracket | Male | Female |
| Under 5 Years | 10 (7.2%) | 0 (0.0%) |
| 5 to 9 Years | 8 (5.8%) | 3 (3.3%) |
| 10 to 14 Years | 3 (2.2%) | 0 (0.0%) |
| 15 to 19 Years | 10 (7.2%) | 14 (15.4%) |
| 20 to 24 Years | 16 (11.5%) | 0 (0.0%) |
| 25 to 29 Years | 4 (2.9%) | 3 (3.3%) |
| 30 to 34 Years | 6 (4.3%) | 3 (3.3%) |
| 35 to 39 Years | 2 (1.4%) | 1 (1.1%) |
| 40 to 44 Years | 5 (3.6%) | 0 (0.0%) |
| 45 to 49 Years | 13 (9.3%) | 2 (2.2%) |
| 50 to 54 Years | 12 (8.6%) | 14 (15.4%) |
| 55 to 59 Years | 17 (12.2%) | 12 (13.2%) |
| 60 to 64 Years | 6 (4.3%) | 7 (7.7%) |
| 65 to 69 Years | 6 (4.3%) | 19 (20.9%) |
| 70 to 74 Years | 9 (6.5%) | 8 (8.8%) |
| 75 to 79 Years | 7 (5.0%) | 0 (0.0%) |
| 80 to 84 Years | 4 (2.9%) | 2 (2.2%) |
| 85 Years and over | 1 (0.7%) | 3 (3.3%) |
| Total | 139 (100.0%) | 91 (100.0%) |
Families and Households in Tehuacana
Median Family Size in Tehuacana
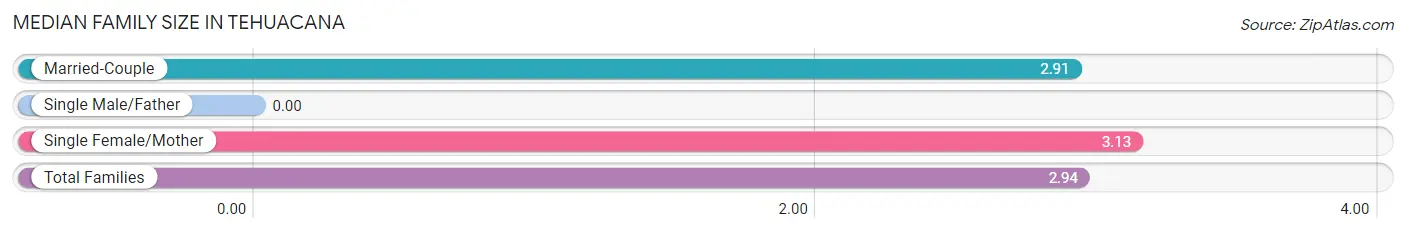
| Family Type | # Families | Family Size |
| Married-Couple | 45 (84.9%) | 2.91 |
| Single Male/Father | 0 (0.0%) | - |
| Single Female/Mother | 8 (15.1%) | 3.13 |
| Total Families | 53 (100.0%) | 2.94 |
Median Household Size in Tehuacana
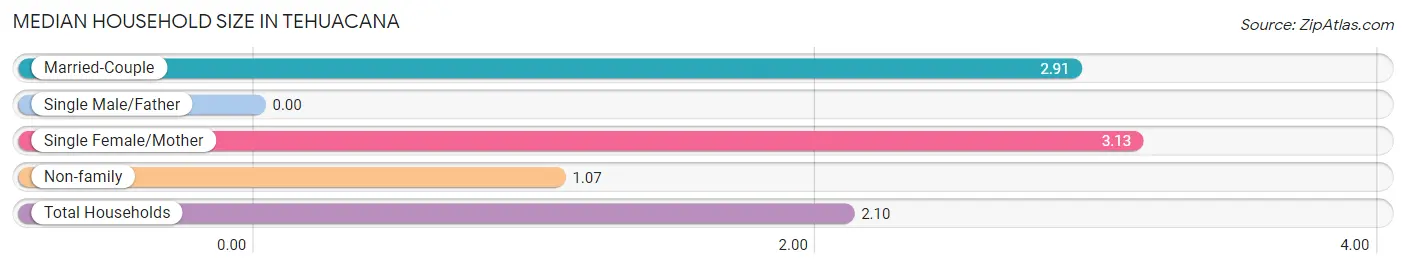
| Household Type | # Households | Household Size |
| Married-Couple | 45 (46.9%) | 2.91 |
| Single Male/Father | 0 (0.0%) | - |
| Single Female/Mother | 8 (8.3%) | 3.13 |
| Non-family | 43 (44.8%) | 1.07 |
| Total Households | 96 (100.0%) | 2.10 |
Household Size by Marriage Status in Tehuacana
Out of a total of 96 households in Tehuacana, 53 (55.2%) are family households, while 43 (44.8%) are nonfamily households. The most numerous type of family households are 2-person households, comprising 37, and the most common type of nonfamily households are 1-person households, comprising 41.
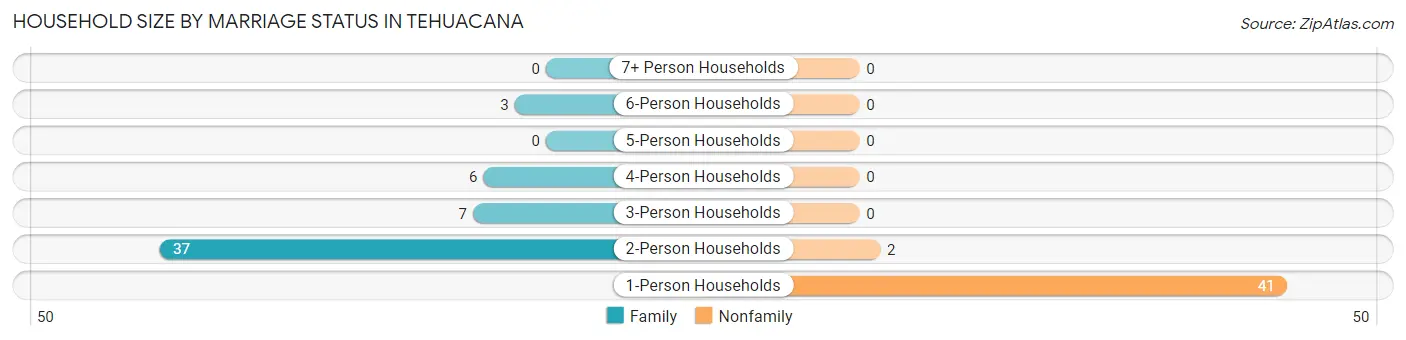
| Household Size | Family Households | Nonfamily Households |
| 1-Person Households | - | 41 (42.7%) |
| 2-Person Households | 37 (38.5%) | 2 (2.1%) |
| 3-Person Households | 7 (7.3%) | 0 (0.0%) |
| 4-Person Households | 6 (6.2%) | 0 (0.0%) |
| 5-Person Households | 0 (0.0%) | 0 (0.0%) |
| 6-Person Households | 3 (3.1%) | 0 (0.0%) |
| 7+ Person Households | 0 (0.0%) | 0 (0.0%) |
| Total | 53 (55.2%) | 43 (44.8%) |
Female Fertility in Tehuacana
Fertility by Age in Tehuacana
| Age Bracket | Women with Births | Births / 1,000 Women |
| 15 to 19 years | 0 (0.0%) | 0.0 |
| 20 to 34 years | 0 (0.0%) | 0.0 |
| 35 to 50 years | 0 (0.0%) | 0.0 |
| Total | 0 (0.0%) | 0.0 |
Fertility by Age by Marriage Status in Tehuacana
| Age Bracket | Married | Unmarried |
| 15 to 19 years | 0 (0.0%) | 0 (0.0%) |
| 20 to 34 years | 0 (0.0%) | 0 (0.0%) |
| 35 to 50 years | 0 (0.0%) | 0 (0.0%) |
| Total | 0 (0.0%) | 0 (0.0%) |
Fertility by Education in Tehuacana
| Educational Attainment | Women with Births | Births / 1,000 Women |
| Less than High School | 0 (0.0%) | 0.0 |
| High School Diploma | 0 (0.0%) | 0.0 |
| College or Associate's Degree | 0 (0.0%) | 0.0 |
| Bachelor's Degree | 0 (0.0%) | 0.0 |
| Graduate Degree | 0 (0.0%) | 0.0 |
| Total | 0 (0.0%) | 0.0 |
Fertility by Education by Marriage Status in Tehuacana
| Educational Attainment | Married | Unmarried |
| Less than High School | 0 (0.0%) | 0 (0.0%) |
| High School Diploma | 0 (0.0%) | 0 (0.0%) |
| College or Associate's Degree | 0 (0.0%) | 0 (0.0%) |
| Bachelor's Degree | 0 (0.0%) | 0 (0.0%) |
| Graduate Degree | 0 (0.0%) | 0 (0.0%) |
| Total | 0 (0.0%) | 0 (0.0%) |
Employment Characteristics in Tehuacana
Employment by Class of Employer in Tehuacana
Among the 106 employed individuals in Tehuacana, private company employees (62 | 58.5%), state government employees (15 | 14.1%), and not-for-profit organizations (13 | 12.3%) make up the most common classes of employment.
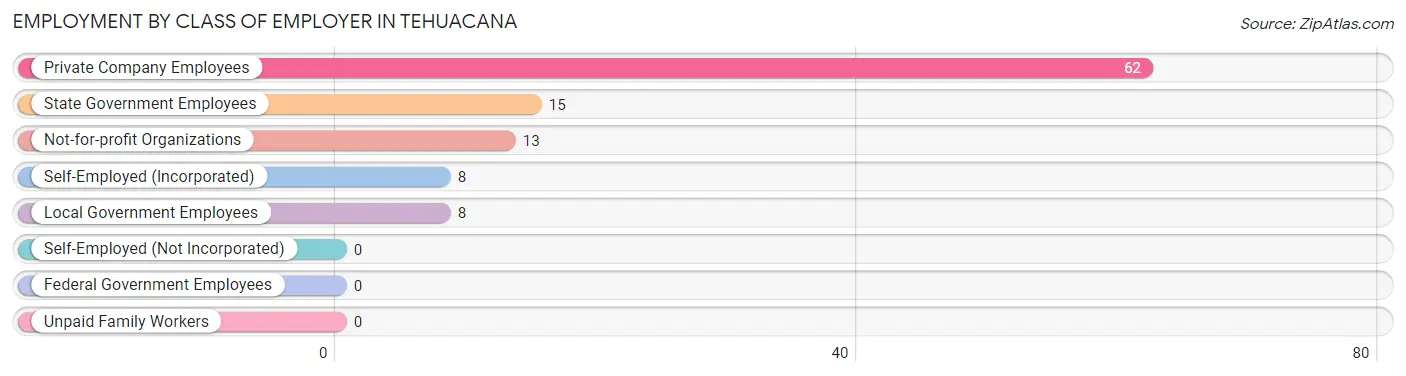
| Employer Class | # Employees | % Employees |
| Private Company Employees | 62 | 58.5% |
| Self-Employed (Incorporated) | 8 | 7.5% |
| Self-Employed (Not Incorporated) | 0 | 0.0% |
| Not-for-profit Organizations | 13 | 12.3% |
| Local Government Employees | 8 | 7.5% |
| State Government Employees | 15 | 14.1% |
| Federal Government Employees | 0 | 0.0% |
| Unpaid Family Workers | 0 | 0.0% |
| Total | 106 | 100.0% |
Employment Status by Age in Tehuacana
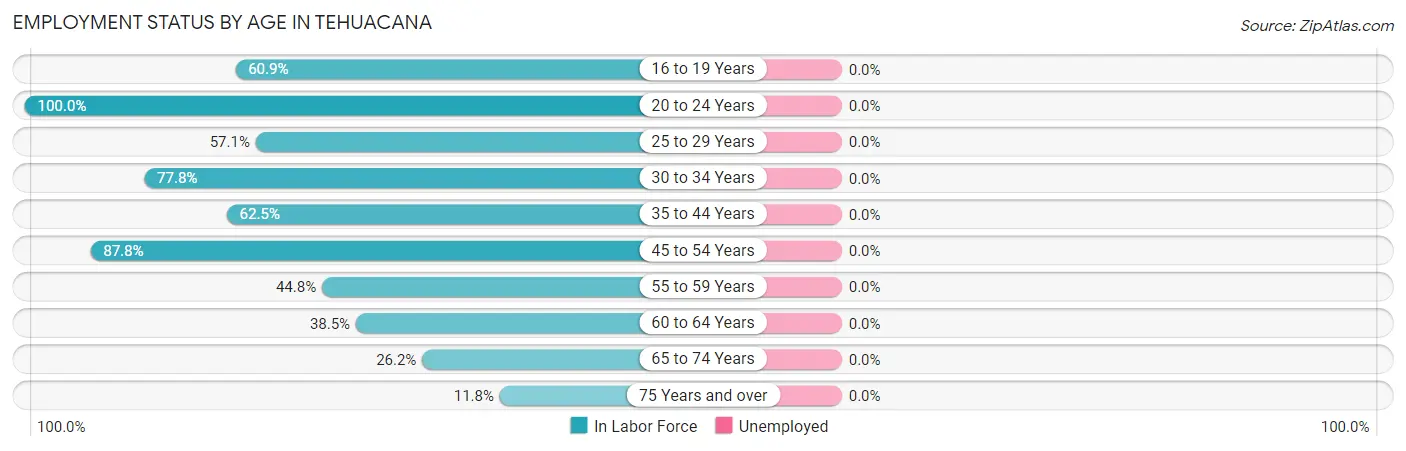
| Age Bracket | In Labor Force | Unemployed |
| 16 to 19 Years | 14 (60.9%) | 0 (0.0%) |
| 20 to 24 Years | 16 (100.0%) | 0 (0.0%) |
| 25 to 29 Years | 4 (57.1%) | 0 (0.0%) |
| 30 to 34 Years | 7 (77.8%) | 0 (0.0%) |
| 35 to 44 Years | 5 (62.5%) | 0 (0.0%) |
| 45 to 54 Years | 36 (87.8%) | 0 (0.0%) |
| 55 to 59 Years | 13 (44.8%) | 0 (0.0%) |
| 60 to 64 Years | 5 (38.5%) | 0 (0.0%) |
| 65 to 74 Years | 11 (26.2%) | 0 (0.0%) |
| 75 Years and over | 2 (11.8%) | 0 (0.0%) |
| Total | 113 (55.1%) | 0 (0.0%) |
Employment Status by Educational Attainment in Tehuacana
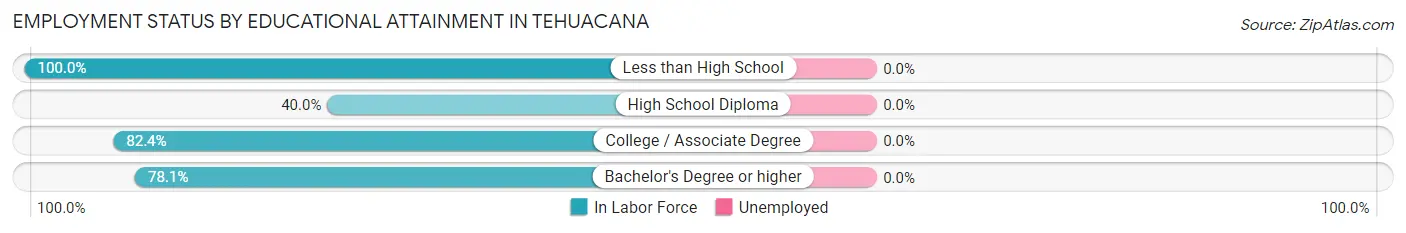
| Educational Attainment | In Labor Force | Unemployed |
| Less than High School | 1 (100.0%) | 0 (0.0%) |
| High School Diploma | 16 (40.0%) | 0 (0.0%) |
| College / Associate Degree | 28 (82.4%) | 0 (0.0%) |
| Bachelor's Degree or higher | 25 (78.1%) | 0 (0.0%) |
| Total | 70 (65.4%) | 0 (0.0%) |
Employment Occupations by Sex in Tehuacana
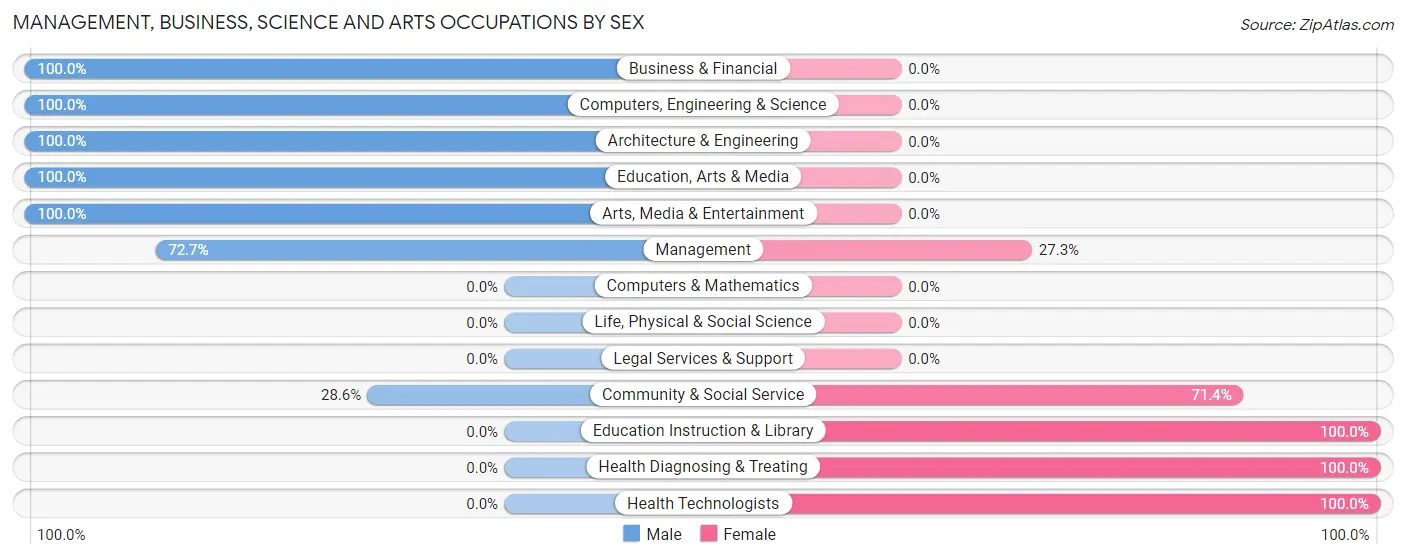
Management, Business, Science and Arts Occupations
The most common Management, Business, Science and Arts occupations in Tehuacana are Community & Social Service (14 | 12.4%), Management (11 | 9.7%), Health Diagnosing & Treating (11 | 9.7%), Education Instruction & Library (10 | 8.8%), and Health Technologists (9 | 8.0%).
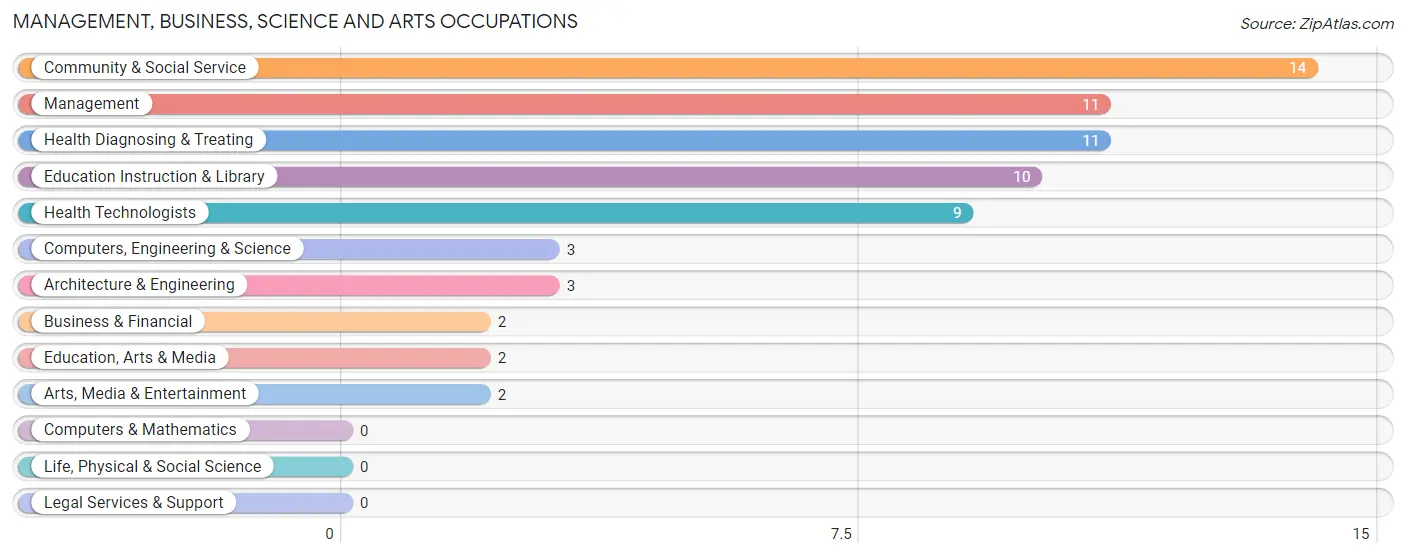
Management, Business, Science and Arts Occupations by Sex
Within the Management, Business, Science and Arts occupations in Tehuacana, the most male-oriented occupations are Business & Financial (100.0%), Computers, Engineering & Science (100.0%), and Architecture & Engineering (100.0%), while the most female-oriented occupations are Education Instruction & Library (100.0%), Health Diagnosing & Treating (100.0%), and Health Technologists (100.0%).
| Occupation | Male | Female |
| Management | 8 (72.7%) | 3 (27.3%) |
| Business & Financial | 2 (100.0%) | 0 (0.0%) |
| Computers, Engineering & Science | 3 (100.0%) | 0 (0.0%) |
| Computers & Mathematics | 0 (0.0%) | 0 (0.0%) |
| Architecture & Engineering | 3 (100.0%) | 0 (0.0%) |
| Life, Physical & Social Science | 0 (0.0%) | 0 (0.0%) |
| Community & Social Service | 4 (28.6%) | 10 (71.4%) |
| Education, Arts & Media | 2 (100.0%) | 0 (0.0%) |
| Legal Services & Support | 0 (0.0%) | 0 (0.0%) |
| Education Instruction & Library | 0 (0.0%) | 10 (100.0%) |
| Arts, Media & Entertainment | 2 (100.0%) | 0 (0.0%) |
| Health Diagnosing & Treating | 0 (0.0%) | 11 (100.0%) |
| Health Technologists | 0 (0.0%) | 9 (100.0%) |
| Total (Category) | 17 (41.5%) | 24 (58.5%) |
| Total (Overall) | 65 (57.5%) | 48 (42.5%) |
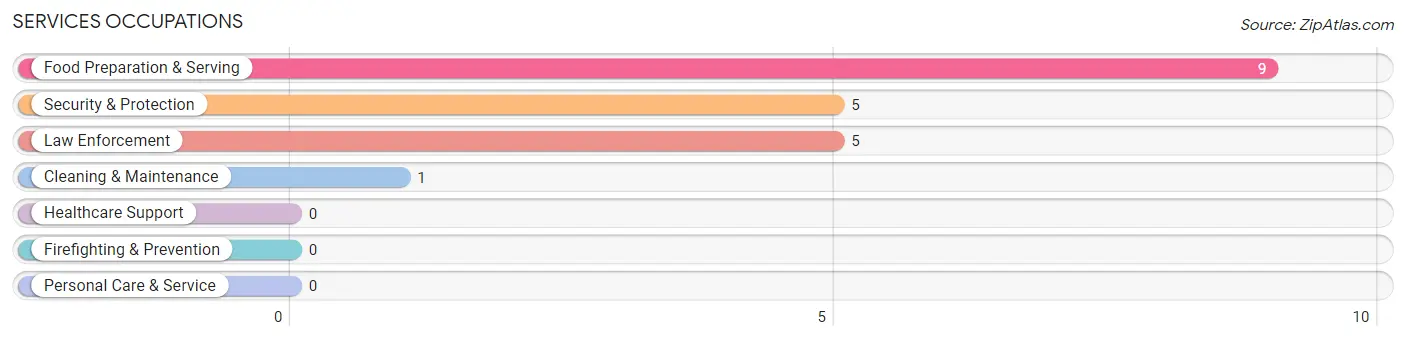
Services Occupations
The most common Services occupations in Tehuacana are Food Preparation & Serving (9 | 8.0%), Security & Protection (5 | 4.4%), Law Enforcement (5 | 4.4%), and Cleaning & Maintenance (1 | 0.9%).
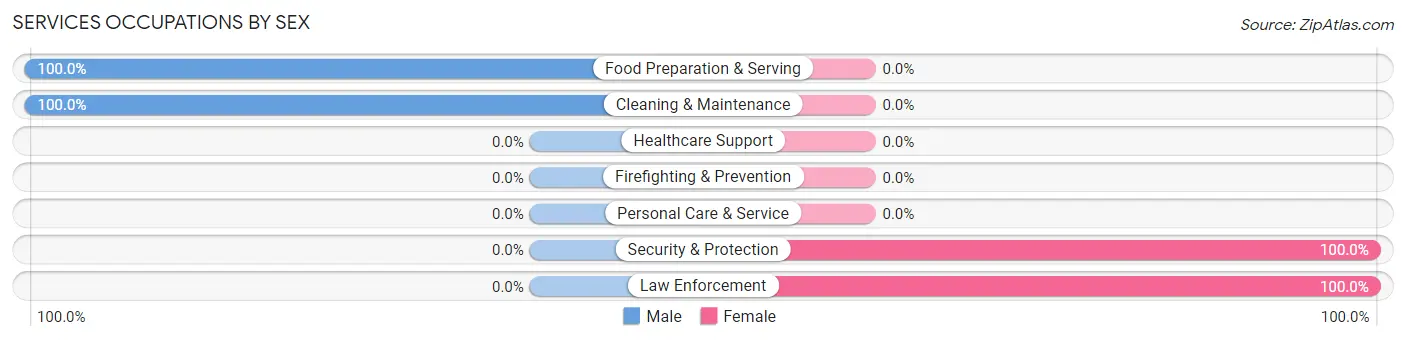
Services Occupations by Sex
Within the Services occupations in Tehuacana, the most male-oriented occupations are Food Preparation & Serving (100.0%), and Cleaning & Maintenance (100.0%), while the most female-oriented occupations are Security & Protection (100.0%), and Law Enforcement (100.0%).
| Occupation | Male | Female |
| Healthcare Support | 0 (0.0%) | 0 (0.0%) |
| Security & Protection | 0 (0.0%) | 5 (100.0%) |
| Firefighting & Prevention | 0 (0.0%) | 0 (0.0%) |
| Law Enforcement | 0 (0.0%) | 5 (100.0%) |
| Food Preparation & Serving | 9 (100.0%) | 0 (0.0%) |
| Cleaning & Maintenance | 1 (100.0%) | 0 (0.0%) |
| Personal Care & Service | 0 (0.0%) | 0 (0.0%) |
| Total (Category) | 10 (66.7%) | 5 (33.3%) |
| Total (Overall) | 65 (57.5%) | 48 (42.5%) |
Sales and Office Occupations
The most common Sales and Office occupations in Tehuacana are , and Office & Administration (15 | 13.3%).
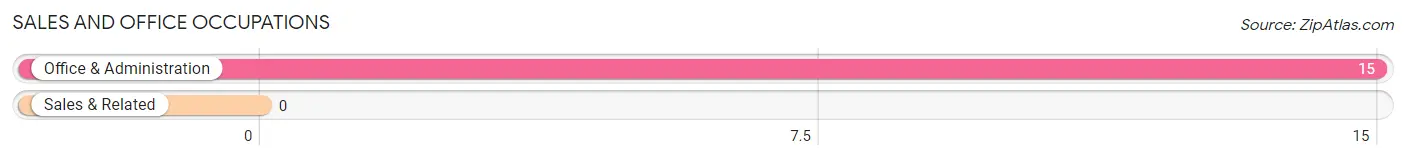
Sales and Office Occupations by Sex
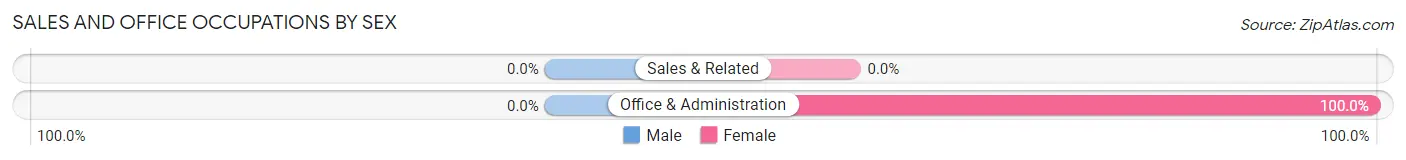
| Occupation | Male | Female |
| Sales & Related | 0 (0.0%) | 0 (0.0%) |
| Office & Administration | 0 (0.0%) | 15 (100.0%) |
| Total (Category) | 0 (0.0%) | 15 (100.0%) |
| Total (Overall) | 65 (57.5%) | 48 (42.5%) |
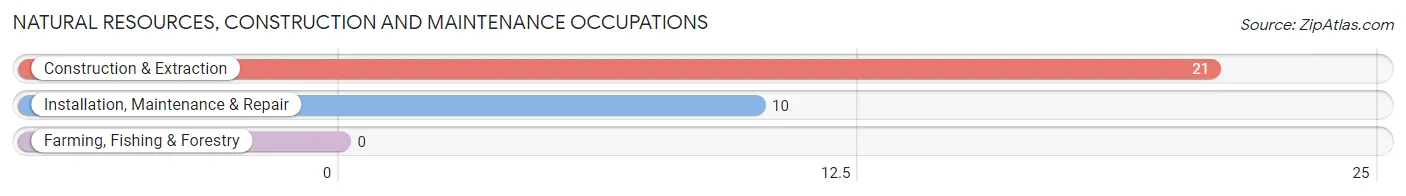
Natural Resources, Construction and Maintenance Occupations
The most common Natural Resources, Construction and Maintenance occupations in Tehuacana are Construction & Extraction (21 | 18.6%), and Installation, Maintenance & Repair (10 | 8.8%).
Natural Resources, Construction and Maintenance Occupations by Sex
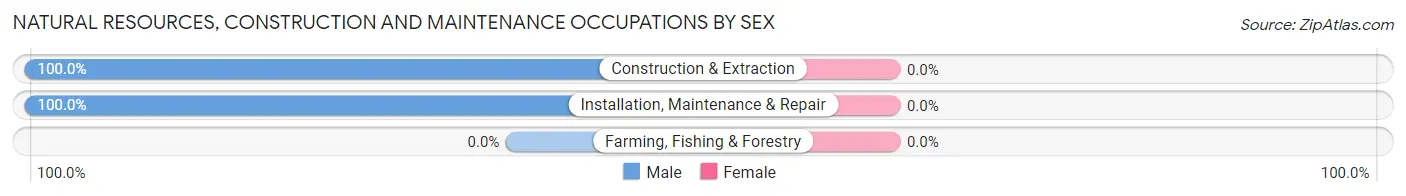
| Occupation | Male | Female |
| Farming, Fishing & Forestry | 0 (0.0%) | 0 (0.0%) |
| Construction & Extraction | 21 (100.0%) | 0 (0.0%) |
| Installation, Maintenance & Repair | 10 (100.0%) | 0 (0.0%) |
| Total (Category) | 31 (100.0%) | 0 (0.0%) |
| Total (Overall) | 65 (57.5%) | 48 (42.5%) |
Production, Transportation and Moving Occupations
The most common Production, Transportation and Moving occupations in Tehuacana are Transportation (4 | 3.5%), Material Moving (4 | 3.5%), and Production (3 | 2.6%).
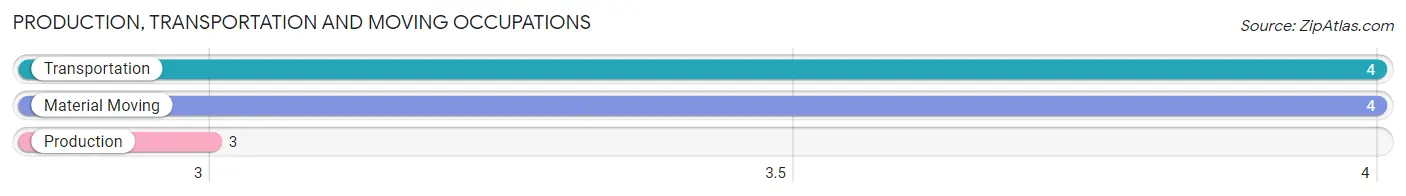
Production, Transportation and Moving Occupations by Sex
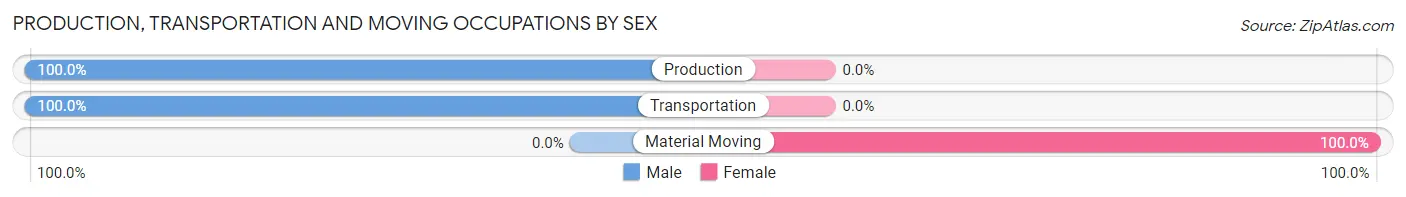
| Occupation | Male | Female |
| Production | 3 (100.0%) | 0 (0.0%) |
| Transportation | 4 (100.0%) | 0 (0.0%) |
| Material Moving | 0 (0.0%) | 4 (100.0%) |
| Total (Category) | 7 (63.6%) | 4 (36.4%) |
| Total (Overall) | 65 (57.5%) | 48 (42.5%) |
Employment Industries by Sex in Tehuacana
Employment Industries in Tehuacana
The major employment industries in Tehuacana include Construction (17 | 15.0%), Educational Services (16 | 14.2%), Health Care & Social Assistance (14 | 12.4%), Mining, Quarrying, & Extraction (13 | 11.5%), and Retail Trade (10 | 8.8%).

Employment Industries by Sex in Tehuacana
The Tehuacana industries that see more men than women are Agriculture, Fishing & Hunting (100.0%), Mining, Quarrying, & Extraction (100.0%), and Manufacturing (100.0%), whereas the industries that tend to have a higher number of women are Finance & Insurance (100.0%), Educational Services (100.0%), and Health Care & Social Assistance (100.0%).
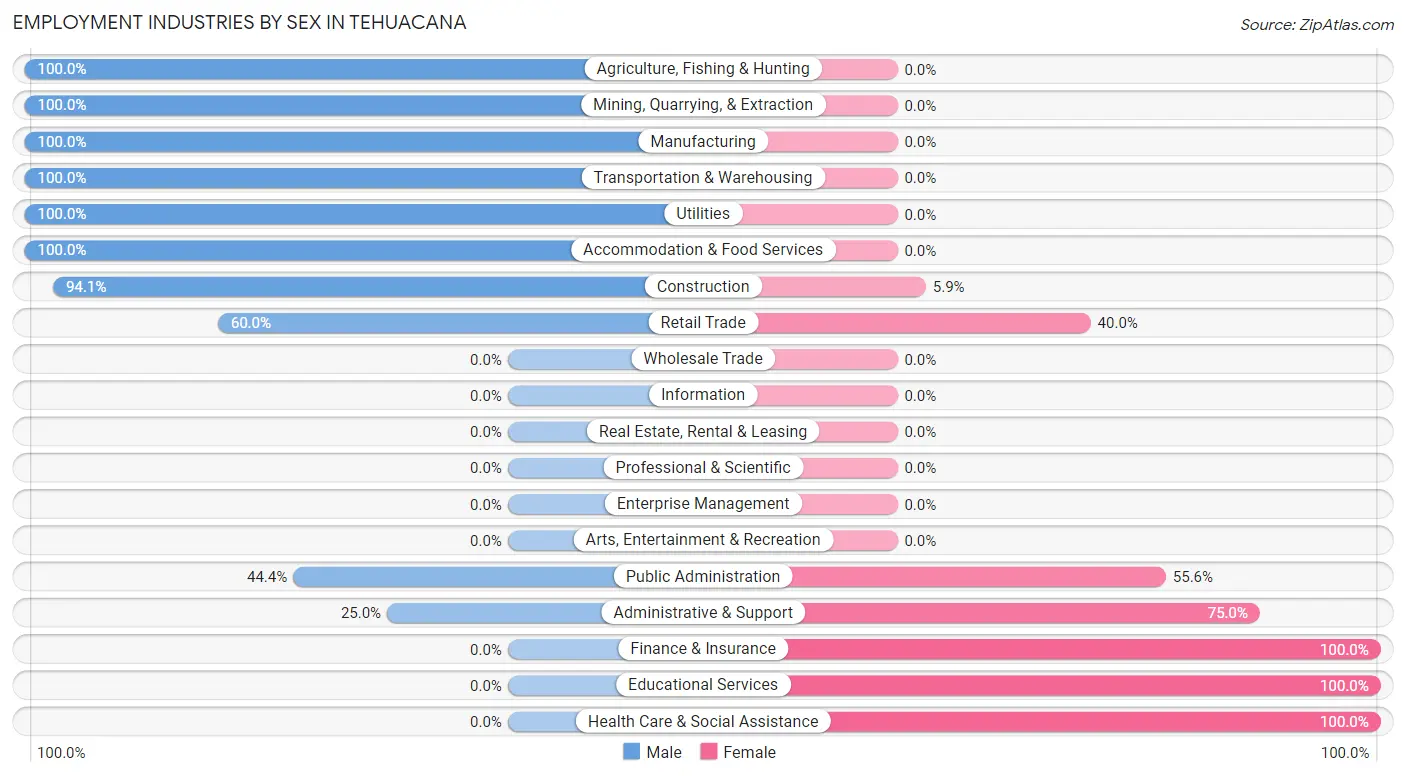
| Industry | Male | Female |
| Agriculture, Fishing & Hunting | 4 (100.0%) | 0 (0.0%) |
| Mining, Quarrying, & Extraction | 13 (100.0%) | 0 (0.0%) |
| Construction | 16 (94.1%) | 1 (5.9%) |
| Manufacturing | 2 (100.0%) | 0 (0.0%) |
| Wholesale Trade | 0 (0.0%) | 0 (0.0%) |
| Retail Trade | 6 (60.0%) | 4 (40.0%) |
| Transportation & Warehousing | 5 (100.0%) | 0 (0.0%) |
| Utilities | 2 (100.0%) | 0 (0.0%) |
| Information | 0 (0.0%) | 0 (0.0%) |
| Finance & Insurance | 0 (0.0%) | 1 (100.0%) |
| Real Estate, Rental & Leasing | 0 (0.0%) | 0 (0.0%) |
| Professional & Scientific | 0 (0.0%) | 0 (0.0%) |
| Enterprise Management | 0 (0.0%) | 0 (0.0%) |
| Administrative & Support | 1 (25.0%) | 3 (75.0%) |
| Educational Services | 0 (0.0%) | 16 (100.0%) |
| Health Care & Social Assistance | 0 (0.0%) | 14 (100.0%) |
| Arts, Entertainment & Recreation | 0 (0.0%) | 0 (0.0%) |
| Accommodation & Food Services | 10 (100.0%) | 0 (0.0%) |
| Public Administration | 4 (44.4%) | 5 (55.6%) |
| Total | 65 (57.5%) | 48 (42.5%) |
Education in Tehuacana
School Enrollment in Tehuacana
The most common levels of schooling among the 51 students in Tehuacana are college / undergraduate (28 | 54.9%), nursery / preschool (7 | 13.7%), and elementary school (7 | 13.7%).
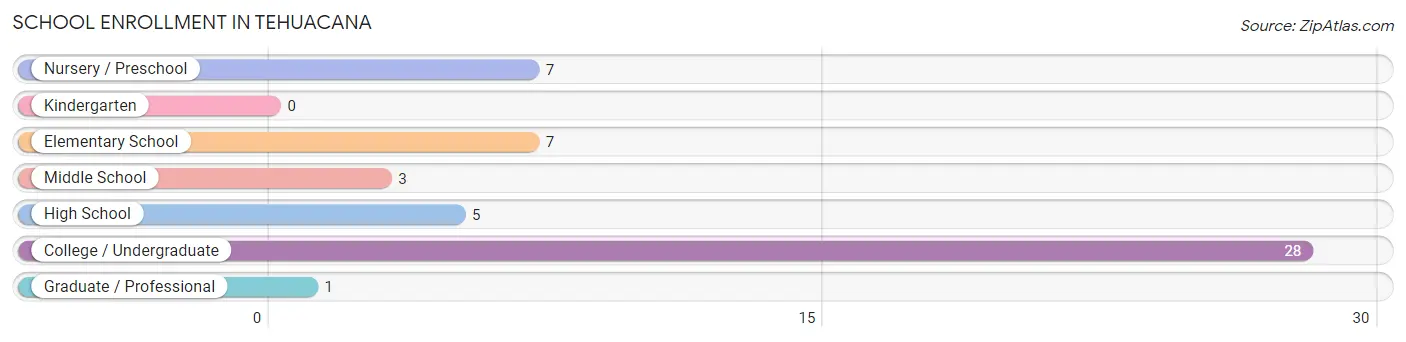
| School Level | # Students | % Students |
| Nursery / Preschool | 7 | 13.7% |
| Kindergarten | 0 | 0.0% |
| Elementary School | 7 | 13.7% |
| Middle School | 3 | 5.9% |
| High School | 5 | 9.8% |
| College / Undergraduate | 28 | 54.9% |
| Graduate / Professional | 1 | 2.0% |
| Total | 51 | 100.0% |
School Enrollment by Age by Funding Source in Tehuacana
Out of a total of 51 students who are enrolled in schools in Tehuacana, 22 (43.1%) attend a private institution, while the remaining 29 (56.9%) are enrolled in public schools. The age group of 3 to 4 year olds has the highest likelihood of being enrolled in private schools, with 3 (100.0% in the age bracket) enrolled. Conversely, the age group of 5 to 9 year old has the lowest likelihood of being enrolled in a private school, with 11 (100.0% in the age bracket) attending a public institution.
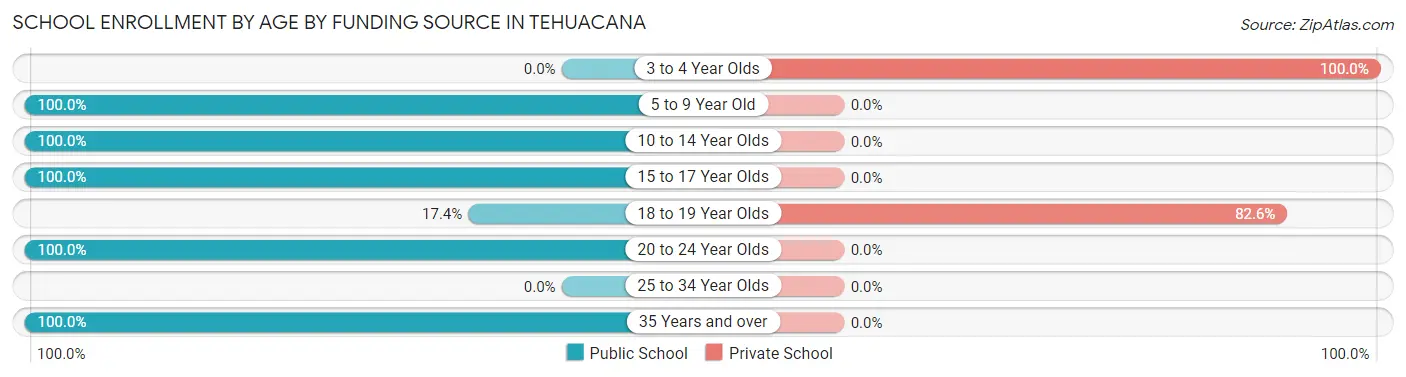
| Age Bracket | Public School | Private School |
| 3 to 4 Year Olds | 0 (0.0%) | 3 (100.0%) |
| 5 to 9 Year Old | 11 (100.0%) | 0 (0.0%) |
| 10 to 14 Year Olds | 3 (100.0%) | 0 (0.0%) |
| 15 to 17 Year Olds | 1 (100.0%) | 0 (0.0%) |
| 18 to 19 Year Olds | 4 (17.4%) | 19 (82.6%) |
| 20 to 24 Year Olds | 9 (100.0%) | 0 (0.0%) |
| 25 to 34 Year Olds | 0 (0.0%) | 0 (0.0%) |
| 35 Years and over | 1 (100.0%) | 0 (0.0%) |
| Total | 29 (56.9%) | 22 (43.1%) |
Educational Attainment by Field of Study in Tehuacana
Business (22 | 39.3%), education (12 | 21.4%), visual & performing arts (9 | 16.1%), science & technology (5 | 8.9%), and engineering (3 | 5.4%) are the most common fields of study among 56 individuals in Tehuacana who have obtained a bachelor's degree or higher.
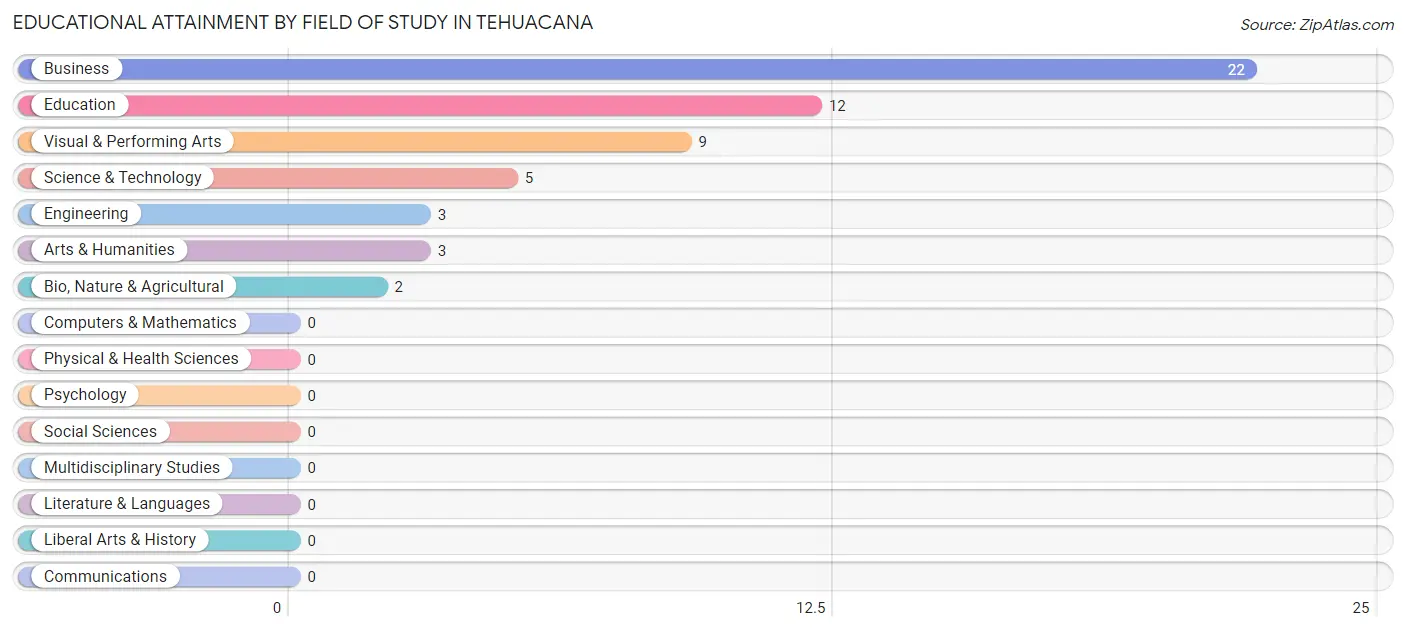
| Field of Study | # Graduates | % Graduates |
| Computers & Mathematics | 0 | 0.0% |
| Bio, Nature & Agricultural | 2 | 3.6% |
| Physical & Health Sciences | 0 | 0.0% |
| Psychology | 0 | 0.0% |
| Social Sciences | 0 | 0.0% |
| Engineering | 3 | 5.4% |
| Multidisciplinary Studies | 0 | 0.0% |
| Science & Technology | 5 | 8.9% |
| Business | 22 | 39.3% |
| Education | 12 | 21.4% |
| Literature & Languages | 0 | 0.0% |
| Liberal Arts & History | 0 | 0.0% |
| Visual & Performing Arts | 9 | 16.1% |
| Communications | 0 | 0.0% |
| Arts & Humanities | 3 | 5.4% |
| Total | 56 | 100.0% |
Transportation & Commute in Tehuacana
Vehicle Availability by Sex in Tehuacana
The most prevalent vehicle ownership categories in Tehuacana are males with 2 vehicles (16, accounting for 32.7%) and females with 2 vehicles (18, making up 42.1%).
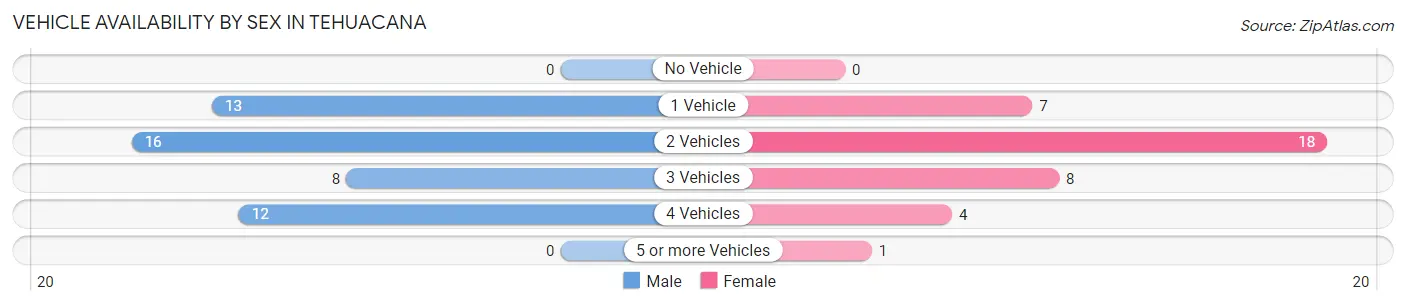
| Vehicles Available | Male | Female |
| No Vehicle | 0 (0.0%) | 0 (0.0%) |
| 1 Vehicle | 13 (26.5%) | 7 (18.4%) |
| 2 Vehicles | 16 (32.7%) | 18 (47.4%) |
| 3 Vehicles | 8 (16.3%) | 8 (21.0%) |
| 4 Vehicles | 12 (24.5%) | 4 (10.5%) |
| 5 or more Vehicles | 0 (0.0%) | 1 (2.6%) |
| Total | 49 (100.0%) | 38 (100.0%) |
Commute Time in Tehuacana
The most frequently occuring commute durations in Tehuacana are 5 to 9 minutes (37 commuters, 36.3%), 15 to 19 minutes (25 commuters, 24.5%), and 10 to 14 minutes (17 commuters, 16.7%).
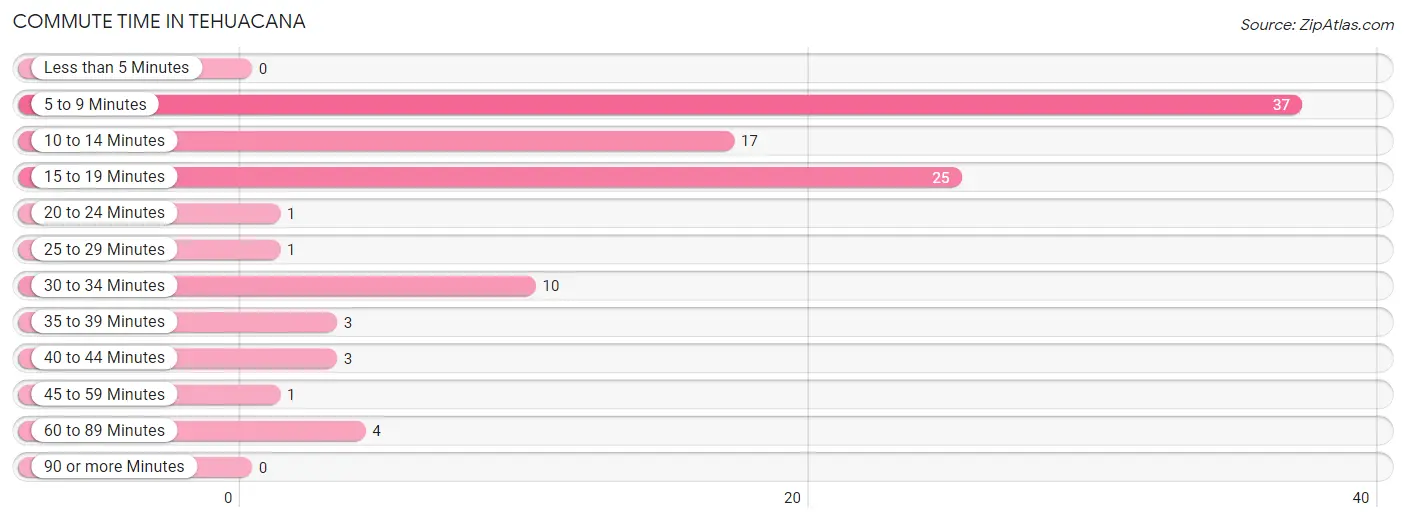
| Commute Time | # Commuters | % Commuters |
| Less than 5 Minutes | 0 | 0.0% |
| 5 to 9 Minutes | 37 | 36.3% |
| 10 to 14 Minutes | 17 | 16.7% |
| 15 to 19 Minutes | 25 | 24.5% |
| 20 to 24 Minutes | 1 | 1.0% |
| 25 to 29 Minutes | 1 | 1.0% |
| 30 to 34 Minutes | 10 | 9.8% |
| 35 to 39 Minutes | 3 | 2.9% |
| 40 to 44 Minutes | 3 | 2.9% |
| 45 to 59 Minutes | 1 | 1.0% |
| 60 to 89 Minutes | 4 | 3.9% |
| 90 or more Minutes | 0 | 0.0% |
Commute Time by Sex in Tehuacana
The most common commute times in Tehuacana are 15 to 19 minutes (18 commuters, 33.3%) for males and 5 to 9 minutes (24 commuters, 50.0%) for females.
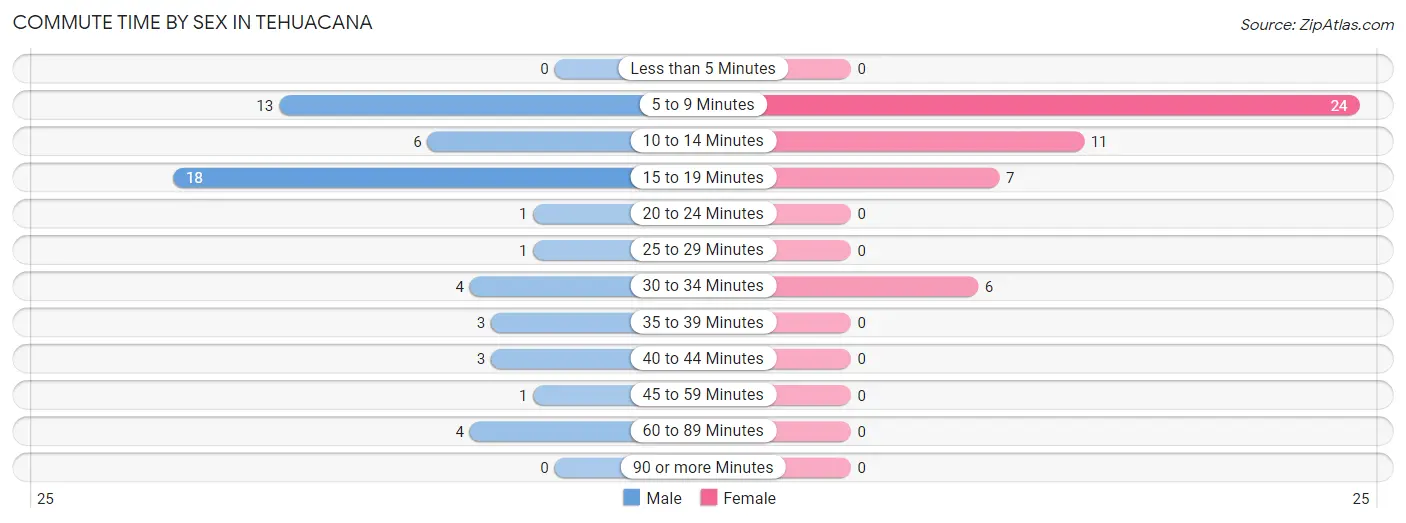
| Commute Time | Male | Female |
| Less than 5 Minutes | 0 (0.0%) | 0 (0.0%) |
| 5 to 9 Minutes | 13 (24.1%) | 24 (50.0%) |
| 10 to 14 Minutes | 6 (11.1%) | 11 (22.9%) |
| 15 to 19 Minutes | 18 (33.3%) | 7 (14.6%) |
| 20 to 24 Minutes | 1 (1.8%) | 0 (0.0%) |
| 25 to 29 Minutes | 1 (1.8%) | 0 (0.0%) |
| 30 to 34 Minutes | 4 (7.4%) | 6 (12.5%) |
| 35 to 39 Minutes | 3 (5.6%) | 0 (0.0%) |
| 40 to 44 Minutes | 3 (5.6%) | 0 (0.0%) |
| 45 to 59 Minutes | 1 (1.8%) | 0 (0.0%) |
| 60 to 89 Minutes | 4 (7.4%) | 0 (0.0%) |
| 90 or more Minutes | 0 (0.0%) | 0 (0.0%) |
Time of Departure to Work by Sex in Tehuacana
The most frequent times of departure to work in Tehuacana are 7:00 AM to 7:29 AM (20, 37.0%) for males and 7:30 AM to 7:59 AM (17, 35.4%) for females.
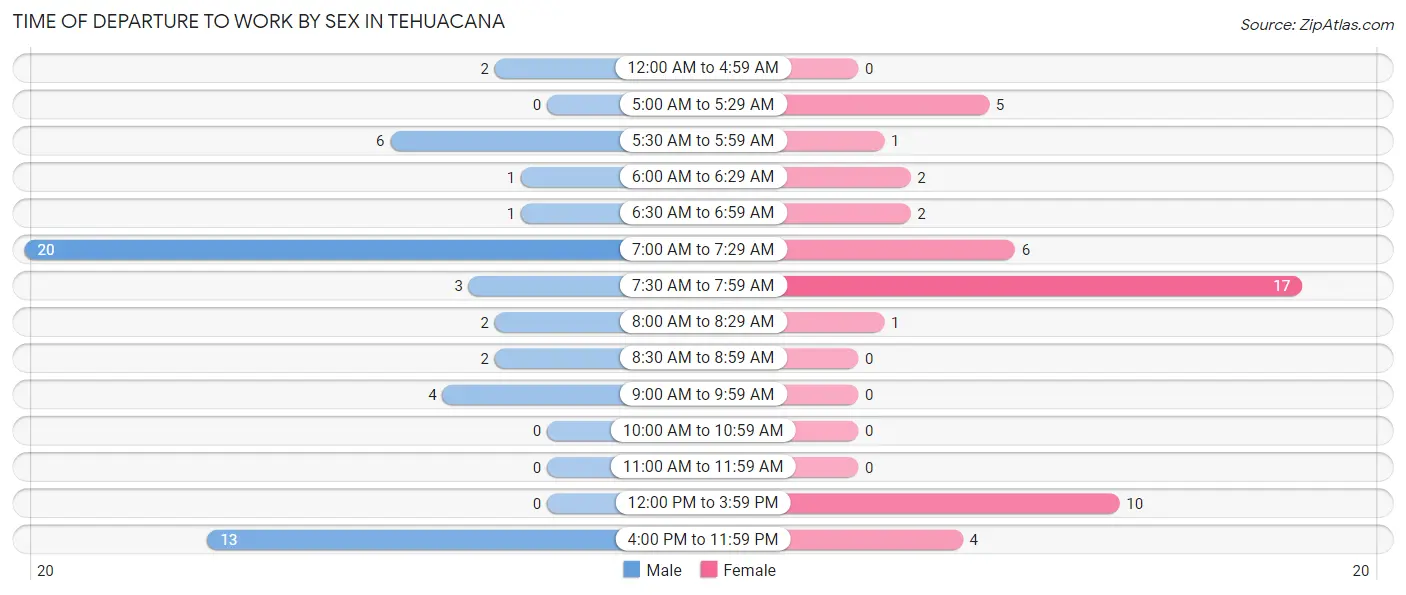
| Time of Departure | Male | Female |
| 12:00 AM to 4:59 AM | 2 (3.7%) | 0 (0.0%) |
| 5:00 AM to 5:29 AM | 0 (0.0%) | 5 (10.4%) |
| 5:30 AM to 5:59 AM | 6 (11.1%) | 1 (2.1%) |
| 6:00 AM to 6:29 AM | 1 (1.8%) | 2 (4.2%) |
| 6:30 AM to 6:59 AM | 1 (1.8%) | 2 (4.2%) |
| 7:00 AM to 7:29 AM | 20 (37.0%) | 6 (12.5%) |
| 7:30 AM to 7:59 AM | 3 (5.6%) | 17 (35.4%) |
| 8:00 AM to 8:29 AM | 2 (3.7%) | 1 (2.1%) |
| 8:30 AM to 8:59 AM | 2 (3.7%) | 0 (0.0%) |
| 9:00 AM to 9:59 AM | 4 (7.4%) | 0 (0.0%) |
| 10:00 AM to 10:59 AM | 0 (0.0%) | 0 (0.0%) |
| 11:00 AM to 11:59 AM | 0 (0.0%) | 0 (0.0%) |
| 12:00 PM to 3:59 PM | 0 (0.0%) | 10 (20.8%) |
| 4:00 PM to 11:59 PM | 13 (24.1%) | 4 (8.3%) |
| Total | 54 (100.0%) | 48 (100.0%) |
Housing Occupancy in Tehuacana
Occupancy by Ownership in Tehuacana
Of the total 96 dwellings in Tehuacana, owner-occupied units account for 70 (72.9%), while renter-occupied units make up 26 (27.1%).
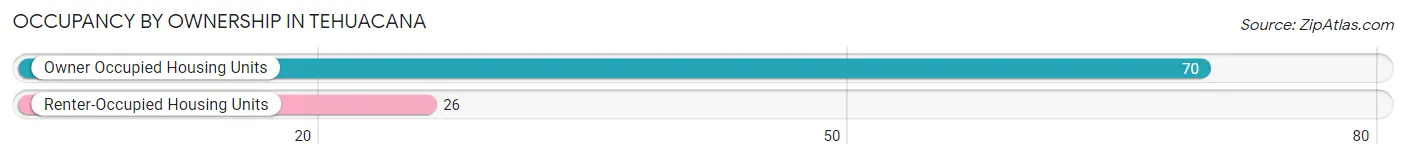
| Occupancy | # Housing Units | % Housing Units |
| Owner Occupied Housing Units | 70 | 72.9% |
| Renter-Occupied Housing Units | 26 | 27.1% |
| Total Occupied Housing Units | 96 | 100.0% |
Occupancy by Household Size in Tehuacana
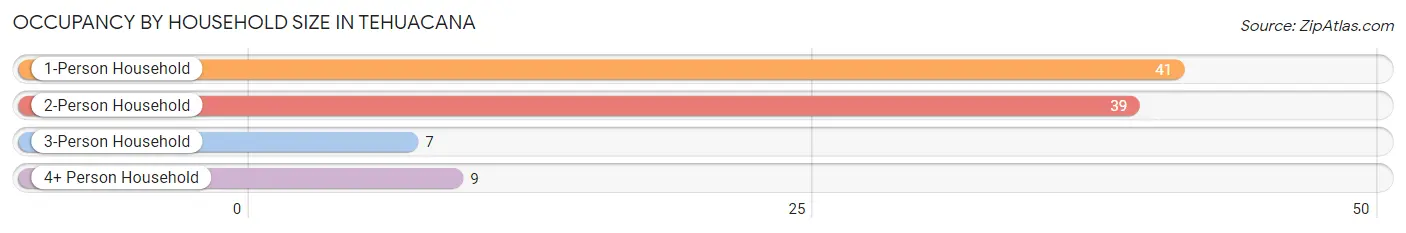
| Household Size | # Housing Units | % Housing Units |
| 1-Person Household | 41 | 42.7% |
| 2-Person Household | 39 | 40.6% |
| 3-Person Household | 7 | 7.3% |
| 4+ Person Household | 9 | 9.4% |
| Total Housing Units | 96 | 100.0% |
Occupancy by Ownership by Household Size in Tehuacana
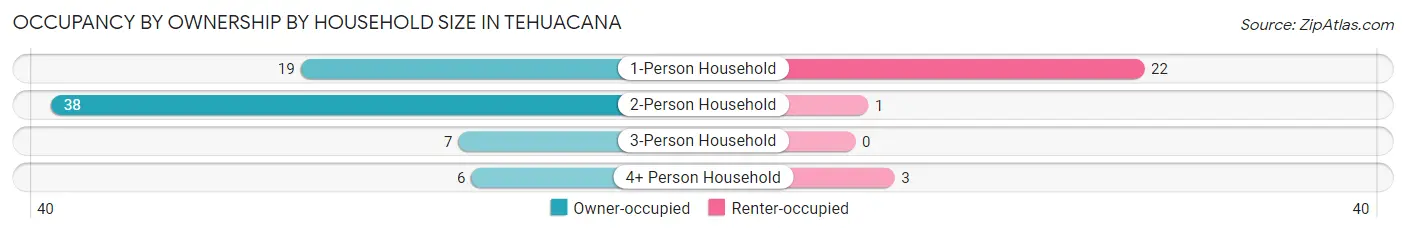
| Household Size | Owner-occupied | Renter-occupied |
| 1-Person Household | 19 (46.3%) | 22 (53.7%) |
| 2-Person Household | 38 (97.4%) | 1 (2.6%) |
| 3-Person Household | 7 (100.0%) | 0 (0.0%) |
| 4+ Person Household | 6 (66.7%) | 3 (33.3%) |
| Total Housing Units | 70 (72.9%) | 26 (27.1%) |
Occupancy by Educational Attainment in Tehuacana

| Household Size | Owner-occupied | Renter-occupied |
| Less than High School | 0 (0.0%) | 0 (0.0%) |
| High School Diploma | 17 (80.9%) | 4 (19.1%) |
| College/Associate Degree | 33 (82.5%) | 7 (17.5%) |
| Bachelor's Degree or higher | 20 (57.1%) | 15 (42.9%) |
Occupancy by Age of Householder in Tehuacana
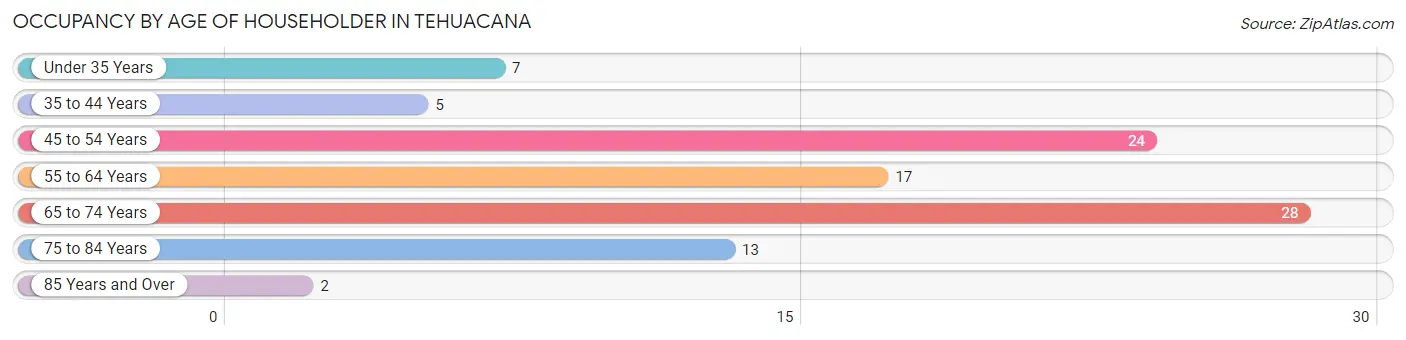
| Age Bracket | # Households | % Households |
| Under 35 Years | 7 | 7.3% |
| 35 to 44 Years | 5 | 5.2% |
| 45 to 54 Years | 24 | 25.0% |
| 55 to 64 Years | 17 | 17.7% |
| 65 to 74 Years | 28 | 29.2% |
| 75 to 84 Years | 13 | 13.5% |
| 85 Years and Over | 2 | 2.1% |
| Total | 96 | 100.0% |
Housing Finances in Tehuacana
Median Income by Occupancy in Tehuacana
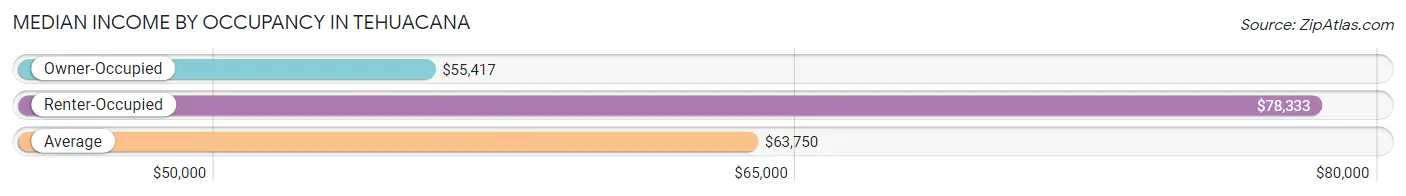
| Occupancy Type | # Households | Median Income |
| Owner-Occupied | 70 (72.9%) | $55,417 |
| Renter-Occupied | 26 (27.1%) | $78,333 |
| Average | 96 (100.0%) | $63,750 |
Occupancy by Householder Income Bracket in Tehuacana
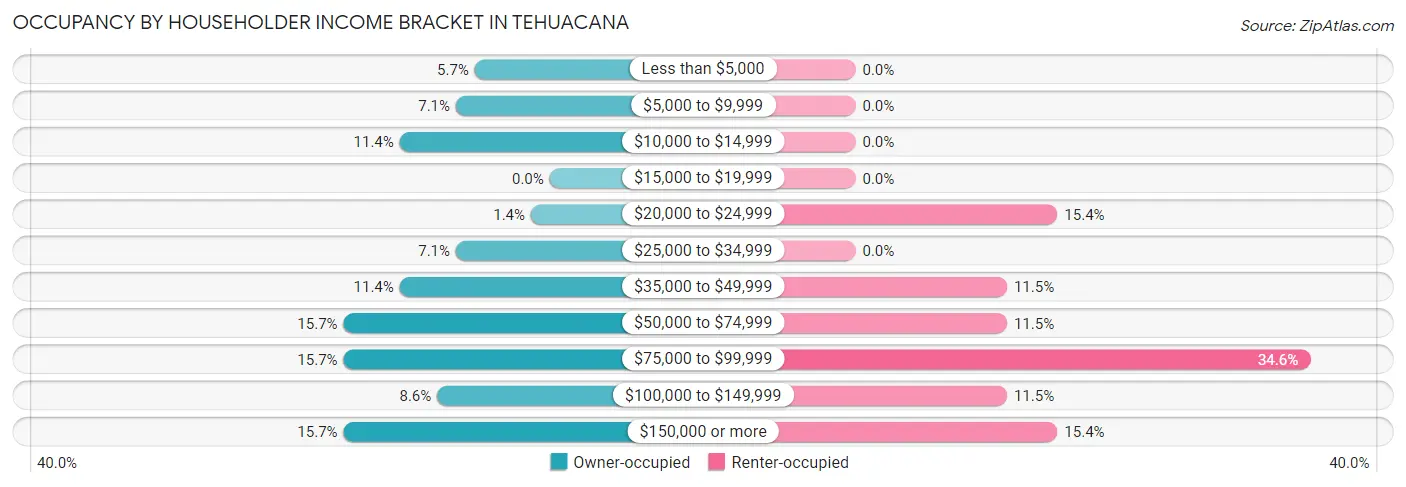
| Income Bracket | Owner-occupied | Renter-occupied |
| Less than $5,000 | 4 (5.7%) | 0 (0.0%) |
| $5,000 to $9,999 | 5 (7.1%) | 0 (0.0%) |
| $10,000 to $14,999 | 8 (11.4%) | 0 (0.0%) |
| $15,000 to $19,999 | 0 (0.0%) | 0 (0.0%) |
| $20,000 to $24,999 | 1 (1.4%) | 4 (15.4%) |
| $25,000 to $34,999 | 5 (7.1%) | 0 (0.0%) |
| $35,000 to $49,999 | 8 (11.4%) | 3 (11.5%) |
| $50,000 to $74,999 | 11 (15.7%) | 3 (11.5%) |
| $75,000 to $99,999 | 11 (15.7%) | 9 (34.6%) |
| $100,000 to $149,999 | 6 (8.6%) | 3 (11.5%) |
| $150,000 or more | 11 (15.7%) | 4 (15.4%) |
| Total | 70 (100.0%) | 26 (100.0%) |
Monthly Housing Cost Tiers in Tehuacana
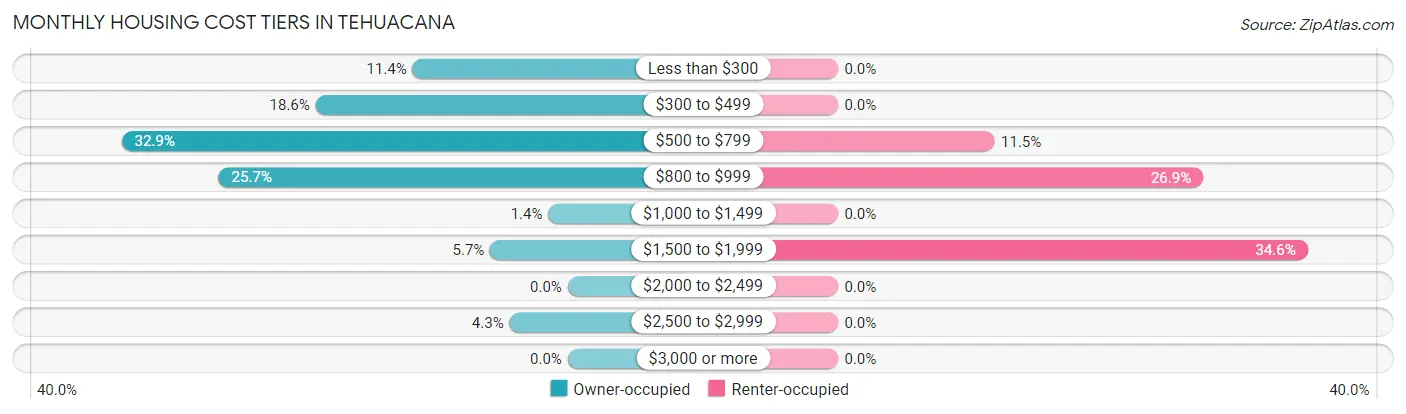
| Monthly Cost | Owner-occupied | Renter-occupied |
| Less than $300 | 8 (11.4%) | 0 (0.0%) |
| $300 to $499 | 13 (18.6%) | 0 (0.0%) |
| $500 to $799 | 23 (32.9%) | 3 (11.5%) |
| $800 to $999 | 18 (25.7%) | 7 (26.9%) |
| $1,000 to $1,499 | 1 (1.4%) | 0 (0.0%) |
| $1,500 to $1,999 | 4 (5.7%) | 9 (34.6%) |
| $2,000 to $2,499 | 0 (0.0%) | 0 (0.0%) |
| $2,500 to $2,999 | 3 (4.3%) | 0 (0.0%) |
| $3,000 or more | 0 (0.0%) | 0 (0.0%) |
| Total | 70 (100.0%) | 26 (100.0%) |
Physical Housing Characteristics in Tehuacana
Housing Structures in Tehuacana
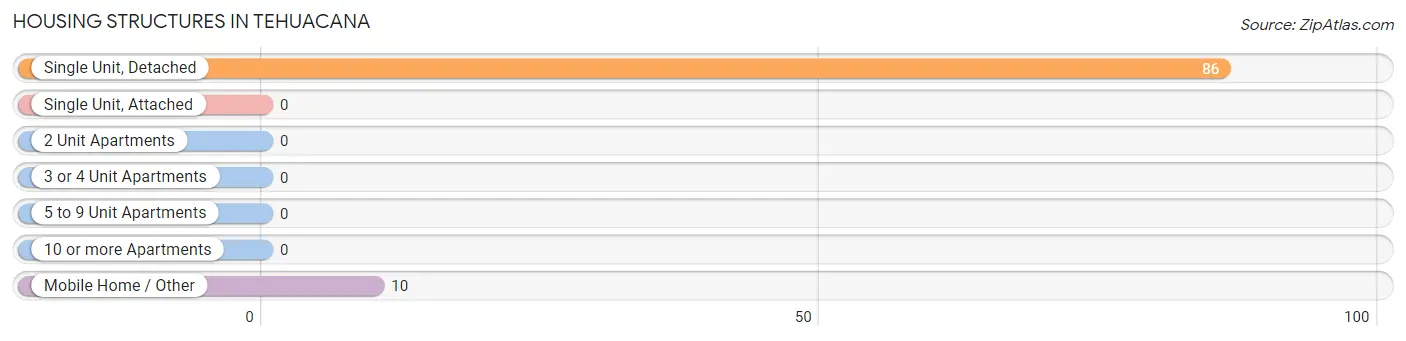
| Structure Type | # Housing Units | % Housing Units |
| Single Unit, Detached | 86 | 89.6% |
| Single Unit, Attached | 0 | 0.0% |
| 2 Unit Apartments | 0 | 0.0% |
| 3 or 4 Unit Apartments | 0 | 0.0% |
| 5 to 9 Unit Apartments | 0 | 0.0% |
| 10 or more Apartments | 0 | 0.0% |
| Mobile Home / Other | 10 | 10.4% |
| Total | 96 | 100.0% |
Housing Structures by Occupancy in Tehuacana
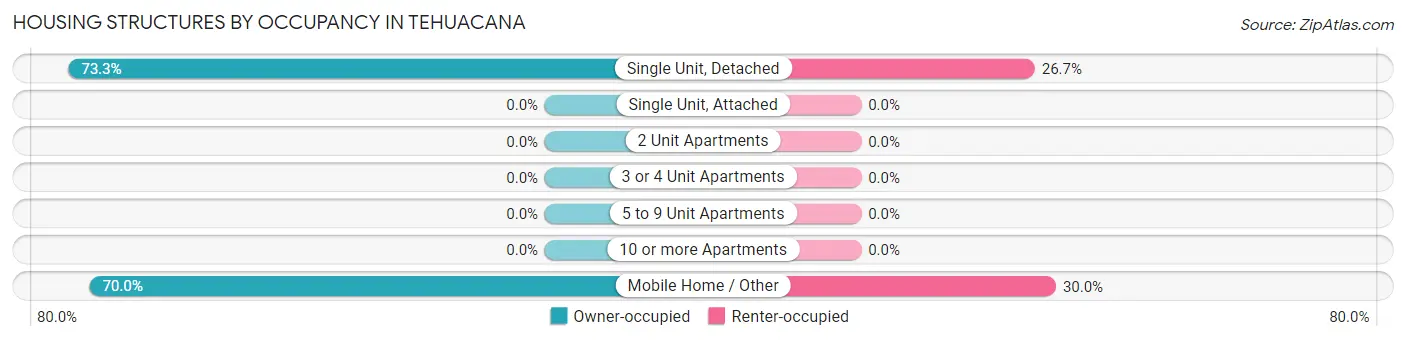
| Structure Type | Owner-occupied | Renter-occupied |
| Single Unit, Detached | 63 (73.3%) | 23 (26.7%) |
| Single Unit, Attached | 0 (0.0%) | 0 (0.0%) |
| 2 Unit Apartments | 0 (0.0%) | 0 (0.0%) |
| 3 or 4 Unit Apartments | 0 (0.0%) | 0 (0.0%) |
| 5 to 9 Unit Apartments | 0 (0.0%) | 0 (0.0%) |
| 10 or more Apartments | 0 (0.0%) | 0 (0.0%) |
| Mobile Home / Other | 7 (70.0%) | 3 (30.0%) |
| Total | 70 (72.9%) | 26 (27.1%) |
Housing Structures by Number of Rooms in Tehuacana
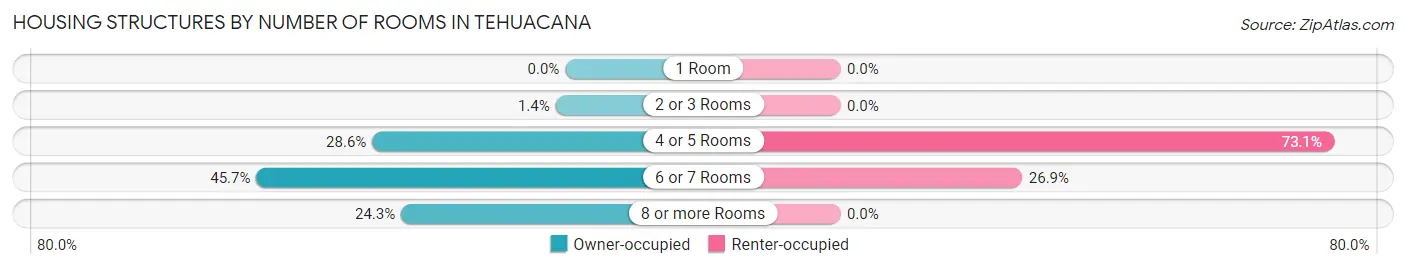
| Number of Rooms | Owner-occupied | Renter-occupied |
| 1 Room | 0 (0.0%) | 0 (0.0%) |
| 2 or 3 Rooms | 1 (1.4%) | 0 (0.0%) |
| 4 or 5 Rooms | 20 (28.6%) | 19 (73.1%) |
| 6 or 7 Rooms | 32 (45.7%) | 7 (26.9%) |
| 8 or more Rooms | 17 (24.3%) | 0 (0.0%) |
| Total | 70 (100.0%) | 26 (100.0%) |
Housing Structure by Heating Type in Tehuacana
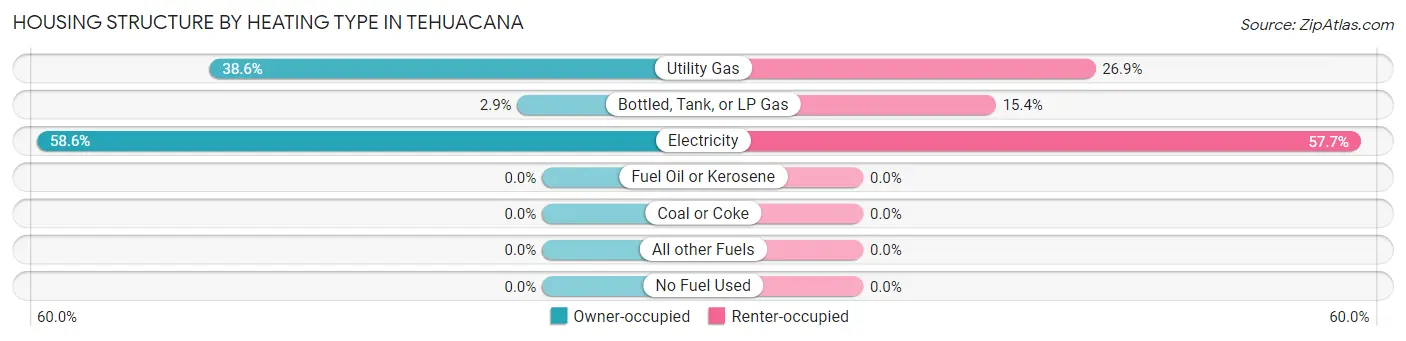
| Heating Type | Owner-occupied | Renter-occupied |
| Utility Gas | 27 (38.6%) | 7 (26.9%) |
| Bottled, Tank, or LP Gas | 2 (2.9%) | 4 (15.4%) |
| Electricity | 41 (58.6%) | 15 (57.7%) |
| Fuel Oil or Kerosene | 0 (0.0%) | 0 (0.0%) |
| Coal or Coke | 0 (0.0%) | 0 (0.0%) |
| All other Fuels | 0 (0.0%) | 0 (0.0%) |
| No Fuel Used | 0 (0.0%) | 0 (0.0%) |
| Total | 70 (100.0%) | 26 (100.0%) |
Household Vehicle Usage in Tehuacana
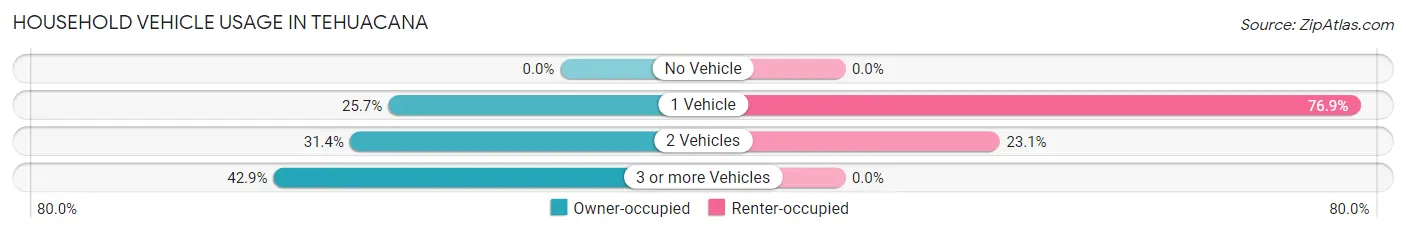
| Vehicles per Household | Owner-occupied | Renter-occupied |
| No Vehicle | 0 (0.0%) | 0 (0.0%) |
| 1 Vehicle | 18 (25.7%) | 20 (76.9%) |
| 2 Vehicles | 22 (31.4%) | 6 (23.1%) |
| 3 or more Vehicles | 30 (42.9%) | 0 (0.0%) |
| Total | 70 (100.0%) | 26 (100.0%) |
Real Estate & Mortgages in Tehuacana
Real Estate and Mortgage Overview in Tehuacana
| Characteristic | Without Mortgage | With Mortgage |
| Housing Units | 54 | 16 |
| Median Property Value | $111,100 | $0 |
| Median Household Income | $55,000 | $5 |
| Monthly Housing Costs | $575 | $0 |
| Real Estate Taxes | $1,375 | $0 |
Property Value by Mortgage Status in Tehuacana
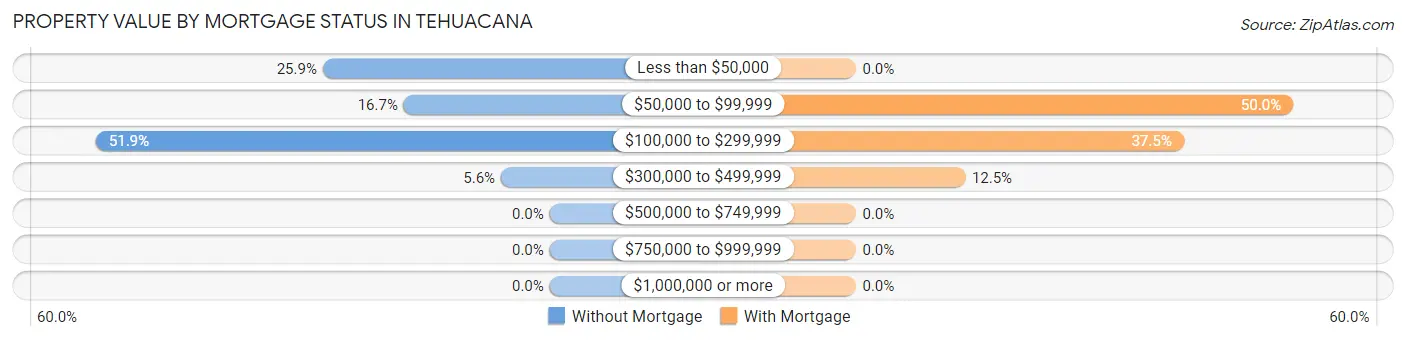
| Property Value | Without Mortgage | With Mortgage |
| Less than $50,000 | 14 (25.9%) | 0 (0.0%) |
| $50,000 to $99,999 | 9 (16.7%) | 8 (50.0%) |
| $100,000 to $299,999 | 28 (51.8%) | 6 (37.5%) |
| $300,000 to $499,999 | 3 (5.6%) | 2 (12.5%) |
| $500,000 to $749,999 | 0 (0.0%) | 0 (0.0%) |
| $750,000 to $999,999 | 0 (0.0%) | 0 (0.0%) |
| $1,000,000 or more | 0 (0.0%) | 0 (0.0%) |
| Total | 54 (100.0%) | 16 (100.0%) |
Household Income by Mortgage Status in Tehuacana
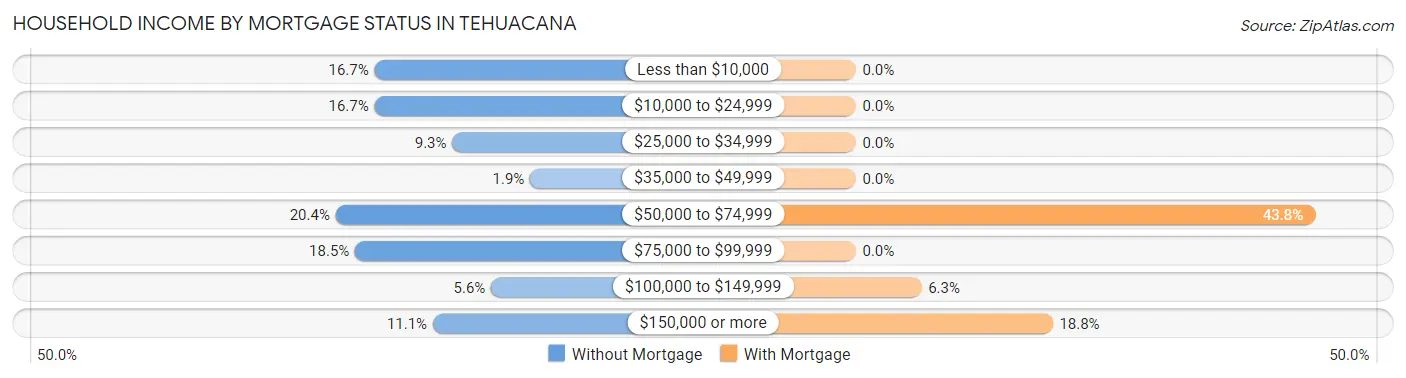
| Household Income | Without Mortgage | With Mortgage |
| Less than $10,000 | 9 (16.7%) | 0 (0.0%) |
| $10,000 to $24,999 | 9 (16.7%) | 0 (0.0%) |
| $25,000 to $34,999 | 5 (9.3%) | 0 (0.0%) |
| $35,000 to $49,999 | 1 (1.8%) | 0 (0.0%) |
| $50,000 to $74,999 | 11 (20.4%) | 7 (43.8%) |
| $75,000 to $99,999 | 10 (18.5%) | 0 (0.0%) |
| $100,000 to $149,999 | 3 (5.6%) | 1 (6.2%) |
| $150,000 or more | 6 (11.1%) | 3 (18.8%) |
| Total | 54 (100.0%) | 16 (100.0%) |
Property Value to Household Income Ratio in Tehuacana
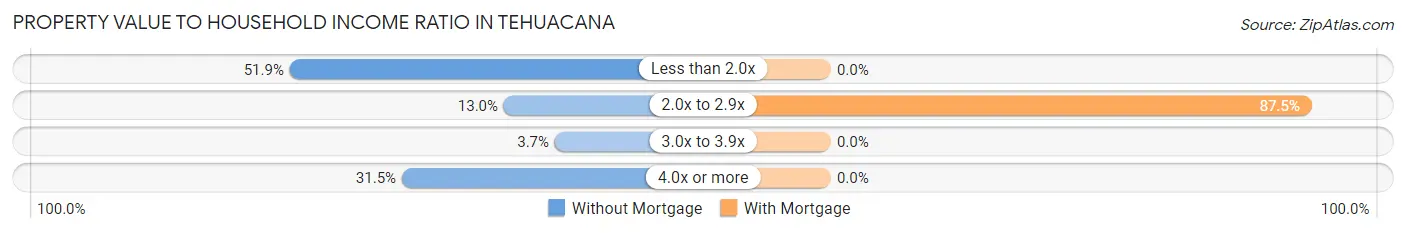
| Value-to-Income Ratio | Without Mortgage | With Mortgage |
| Less than 2.0x | 28 (51.8%) | 0 (0.0%) |
| 2.0x to 2.9x | 7 (13.0%) | 14 (87.5%) |
| 3.0x to 3.9x | 2 (3.7%) | 0 (0.0%) |
| 4.0x or more | 17 (31.5%) | 0 (0.0%) |
| Total | 54 (100.0%) | 16 (100.0%) |
Real Estate Taxes by Mortgage Status in Tehuacana
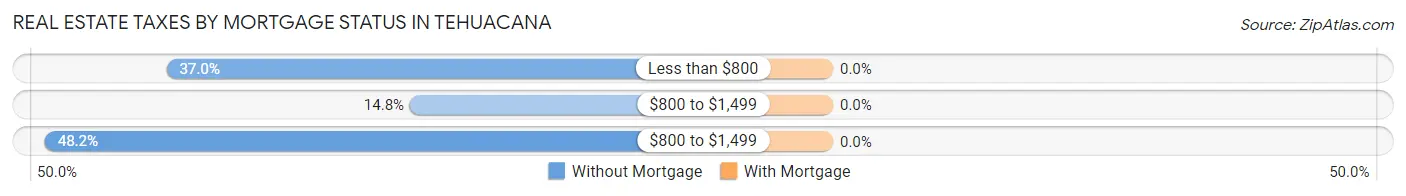
| Property Taxes | Without Mortgage | With Mortgage |
| Less than $800 | 20 (37.0%) | 0 (0.0%) |
| $800 to $1,499 | 8 (14.8%) | 0 (0.0%) |
| $800 to $1,499 | 26 (48.1%) | 0 (0.0%) |
| Total | 54 (100.0%) | 16 (100.0%) |
Health & Disability in Tehuacana
Health Insurance Coverage by Age in Tehuacana
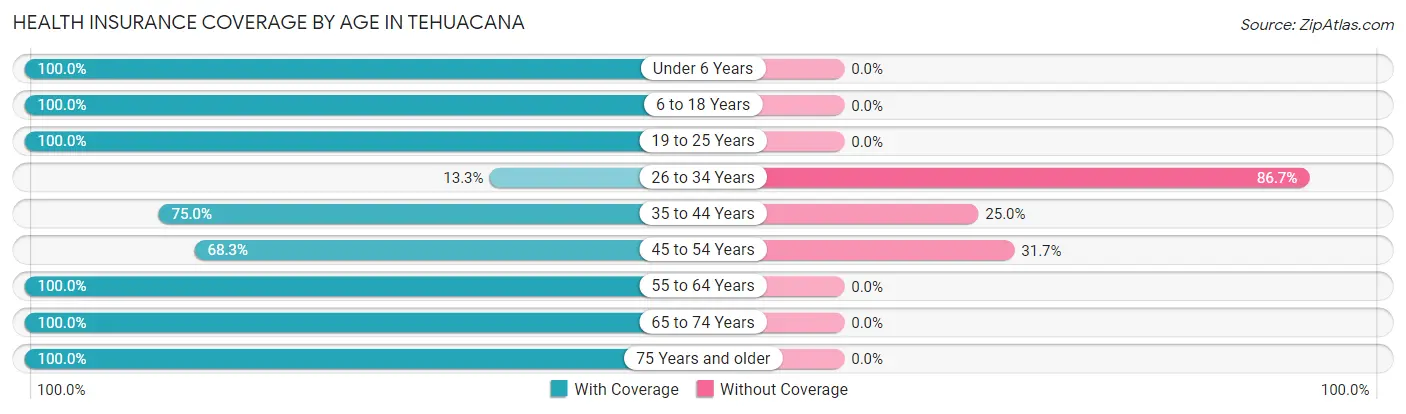
| Age Bracket | With Coverage | Without Coverage |
| Under 6 Years | 14 (100.0%) | 0 (0.0%) |
| 6 to 18 Years | 15 (100.0%) | 0 (0.0%) |
| 19 to 25 Years | 36 (100.0%) | 0 (0.0%) |
| 26 to 34 Years | 2 (13.3%) | 13 (86.7%) |
| 35 to 44 Years | 6 (75.0%) | 2 (25.0%) |
| 45 to 54 Years | 28 (68.3%) | 13 (31.7%) |
| 55 to 64 Years | 42 (100.0%) | 0 (0.0%) |
| 65 to 74 Years | 42 (100.0%) | 0 (0.0%) |
| 75 Years and older | 17 (100.0%) | 0 (0.0%) |
| Total | 202 (87.8%) | 28 (12.2%) |
Health Insurance Coverage by Citizenship Status in Tehuacana
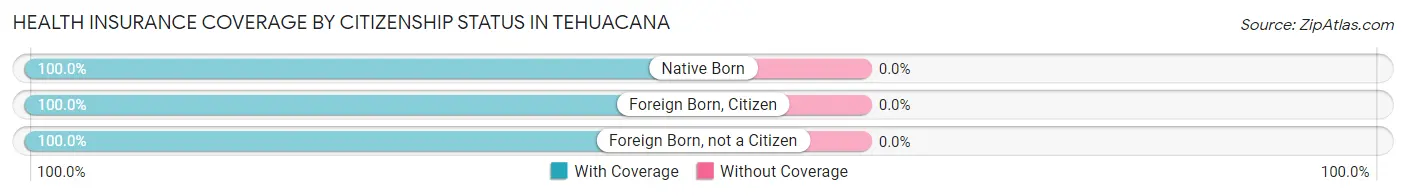
| Citizenship Status | With Coverage | Without Coverage |
| Native Born | 14 (100.0%) | 0 (0.0%) |
| Foreign Born, Citizen | 15 (100.0%) | 0 (0.0%) |
| Foreign Born, not a Citizen | 36 (100.0%) | 0 (0.0%) |
Health Insurance Coverage by Household Income in Tehuacana
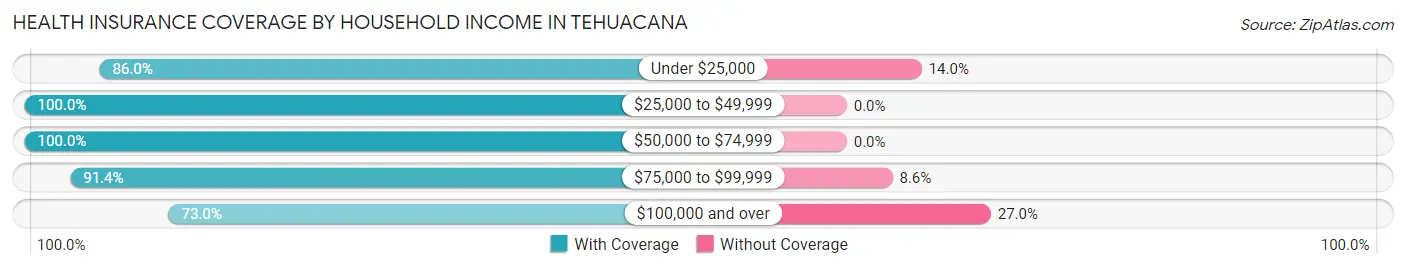
| Household Income | With Coverage | Without Coverage |
| Under $25,000 | 49 (86.0%) | 8 (14.0%) |
| $25,000 to $49,999 | 20 (100.0%) | 0 (0.0%) |
| $50,000 to $74,999 | 27 (100.0%) | 0 (0.0%) |
| $75,000 to $99,999 | 32 (91.4%) | 3 (8.6%) |
| $100,000 and over | 46 (73.0%) | 17 (27.0%) |
Public vs Private Health Insurance Coverage by Age in Tehuacana
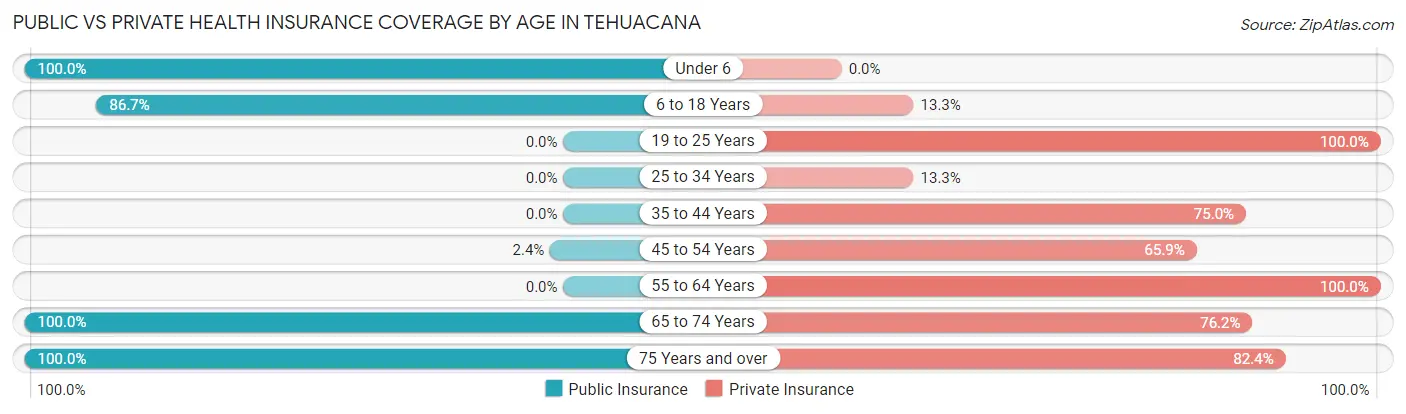
| Age Bracket | Public Insurance | Private Insurance |
| Under 6 | 14 (100.0%) | 0 (0.0%) |
| 6 to 18 Years | 13 (86.7%) | 2 (13.3%) |
| 19 to 25 Years | 0 (0.0%) | 36 (100.0%) |
| 25 to 34 Years | 0 (0.0%) | 2 (13.3%) |
| 35 to 44 Years | 0 (0.0%) | 6 (75.0%) |
| 45 to 54 Years | 1 (2.4%) | 27 (65.8%) |
| 55 to 64 Years | 0 (0.0%) | 42 (100.0%) |
| 65 to 74 Years | 42 (100.0%) | 32 (76.2%) |
| 75 Years and over | 17 (100.0%) | 14 (82.4%) |
| Total | 87 (37.8%) | 161 (70.0%) |
Disability Status by Sex by Age in Tehuacana
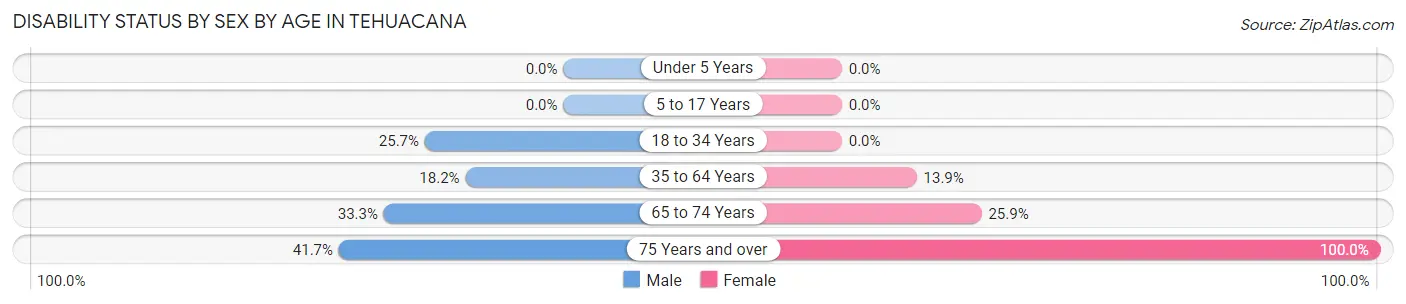
| Age Bracket | Male | Female |
| Under 5 Years | 0 (0.0%) | 0 (0.0%) |
| 5 to 17 Years | 0 (0.0%) | 0 (0.0%) |
| 18 to 34 Years | 9 (25.7%) | 0 (0.0%) |
| 35 to 64 Years | 10 (18.2%) | 5 (13.9%) |
| 65 to 74 Years | 5 (33.3%) | 7 (25.9%) |
| 75 Years and over | 5 (41.7%) | 5 (100.0%) |
Disability Class by Sex by Age in Tehuacana
Disability Class: Hearing Difficulty
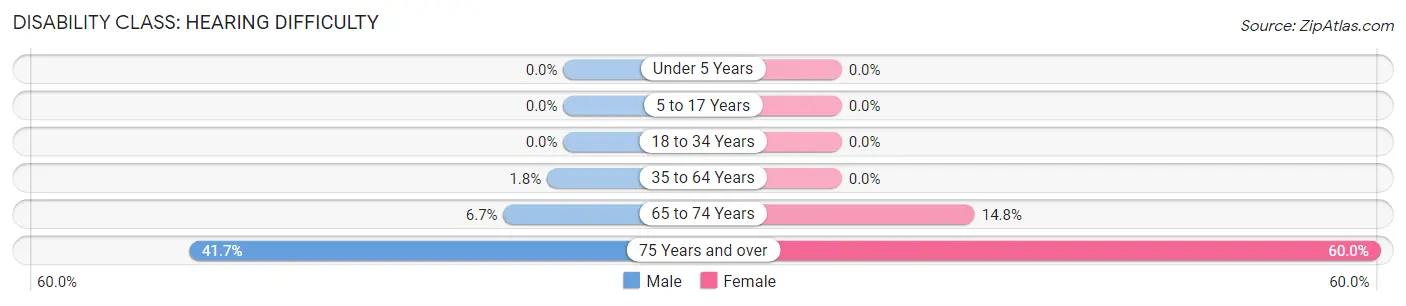
| Age Bracket | Male | Female |
| Under 5 Years | 0 (0.0%) | 0 (0.0%) |
| 5 to 17 Years | 0 (0.0%) | 0 (0.0%) |
| 18 to 34 Years | 0 (0.0%) | 0 (0.0%) |
| 35 to 64 Years | 1 (1.8%) | 0 (0.0%) |
| 65 to 74 Years | 1 (6.7%) | 4 (14.8%) |
| 75 Years and over | 5 (41.7%) | 3 (60.0%) |
Disability Class: Vision Difficulty
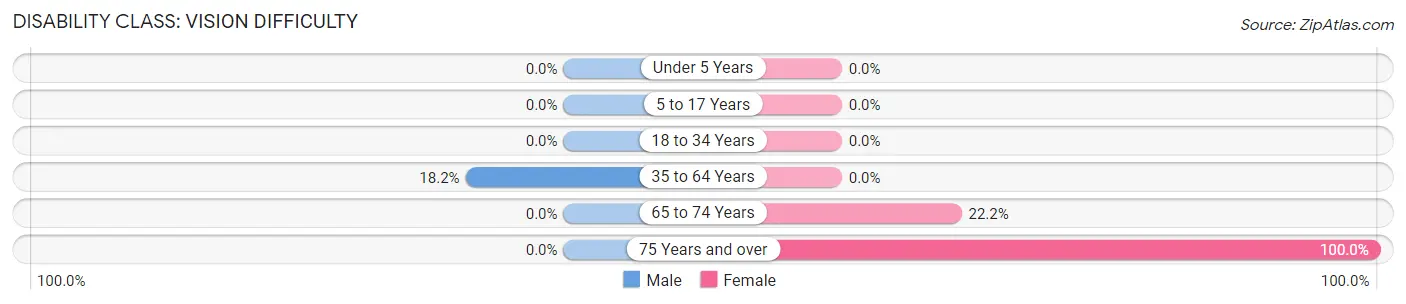
| Age Bracket | Male | Female |
| Under 5 Years | 0 (0.0%) | 0 (0.0%) |
| 5 to 17 Years | 0 (0.0%) | 0 (0.0%) |
| 18 to 34 Years | 0 (0.0%) | 0 (0.0%) |
| 35 to 64 Years | 10 (18.2%) | 0 (0.0%) |
| 65 to 74 Years | 0 (0.0%) | 6 (22.2%) |
| 75 Years and over | 0 (0.0%) | 5 (100.0%) |
Disability Class: Cognitive Difficulty
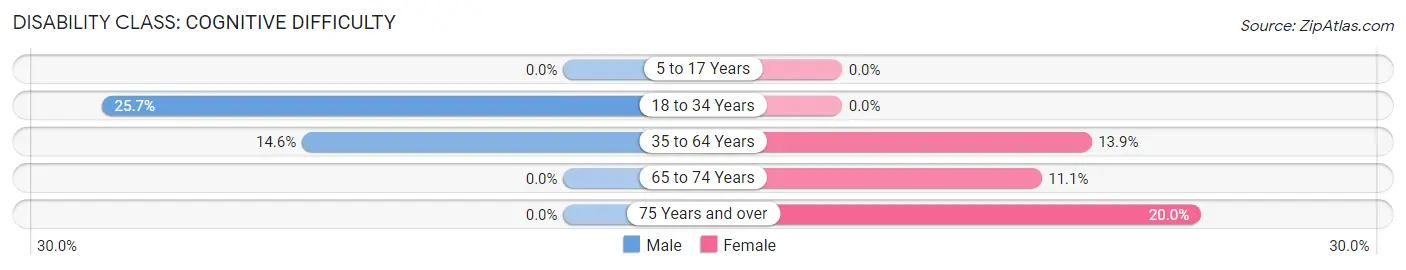
| Age Bracket | Male | Female |
| 5 to 17 Years | 0 (0.0%) | 0 (0.0%) |
| 18 to 34 Years | 9 (25.7%) | 0 (0.0%) |
| 35 to 64 Years | 8 (14.5%) | 5 (13.9%) |
| 65 to 74 Years | 0 (0.0%) | 3 (11.1%) |
| 75 Years and over | 0 (0.0%) | 1 (20.0%) |
Disability Class: Ambulatory Difficulty
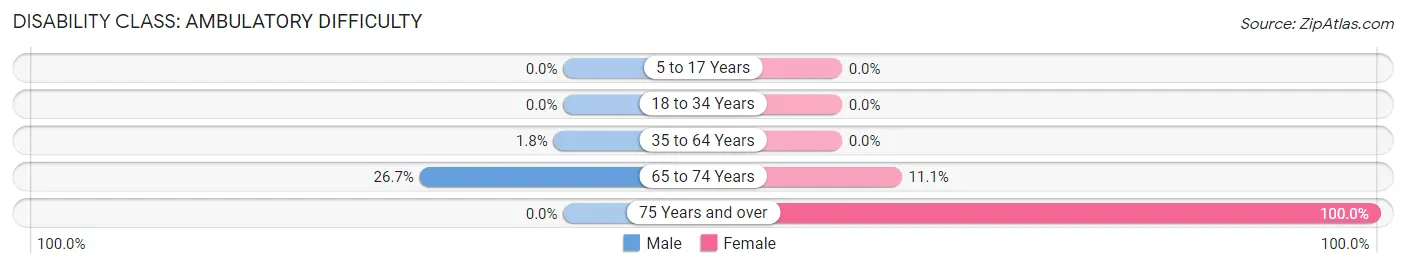
| Age Bracket | Male | Female |
| 5 to 17 Years | 0 (0.0%) | 0 (0.0%) |
| 18 to 34 Years | 0 (0.0%) | 0 (0.0%) |
| 35 to 64 Years | 1 (1.8%) | 0 (0.0%) |
| 65 to 74 Years | 4 (26.7%) | 3 (11.1%) |
| 75 Years and over | 0 (0.0%) | 5 (100.0%) |
Disability Class: Self-Care Difficulty
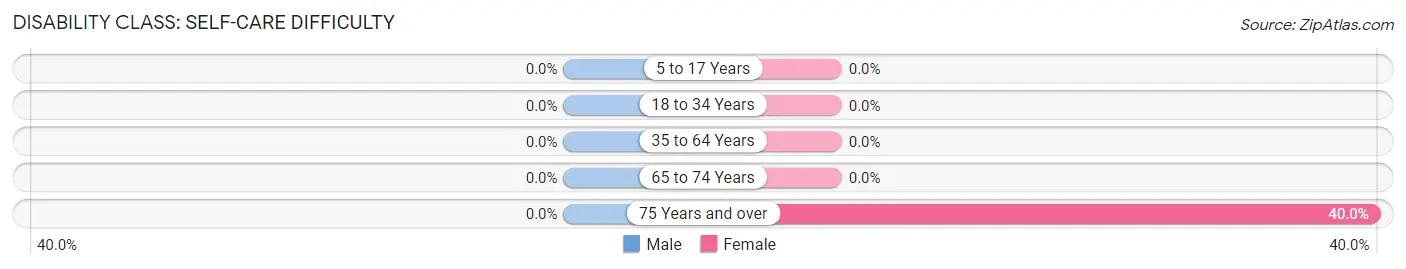
| Age Bracket | Male | Female |
| 5 to 17 Years | 0 (0.0%) | 0 (0.0%) |
| 18 to 34 Years | 0 (0.0%) | 0 (0.0%) |
| 35 to 64 Years | 0 (0.0%) | 0 (0.0%) |
| 65 to 74 Years | 0 (0.0%) | 0 (0.0%) |
| 75 Years and over | 0 (0.0%) | 2 (40.0%) |
Technology Access in Tehuacana
Computing Device Access in Tehuacana
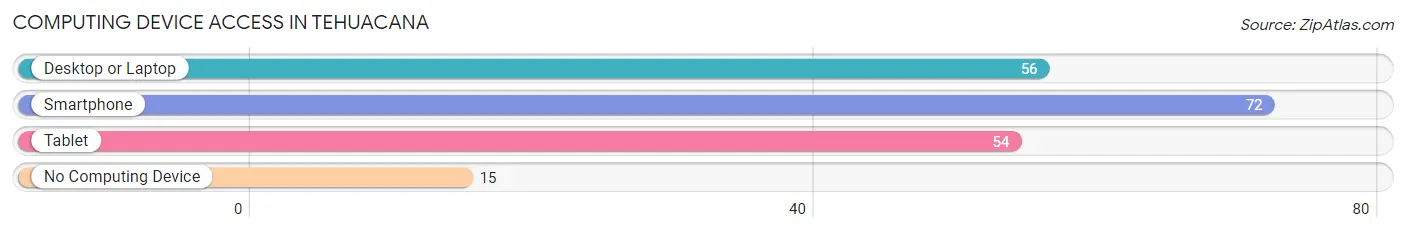
| Device Type | # Households | % Households |
| Desktop or Laptop | 56 | 58.3% |
| Smartphone | 72 | 75.0% |
| Tablet | 54 | 56.2% |
| No Computing Device | 15 | 15.6% |
| Total | 96 | 100.0% |
Internet Access in Tehuacana
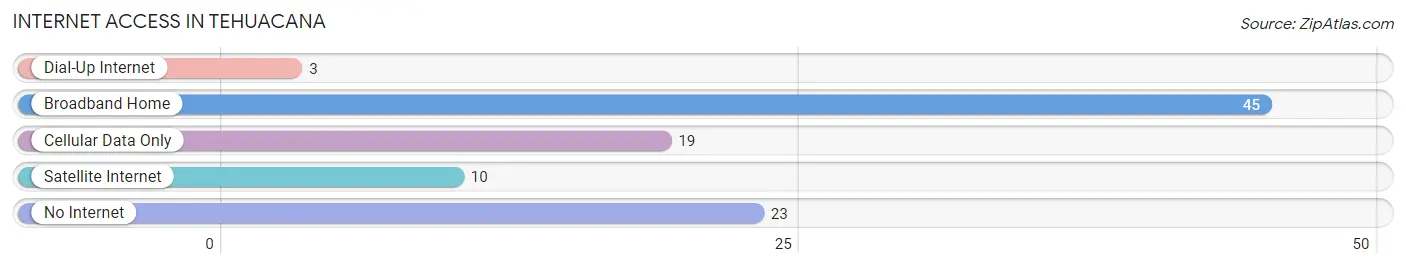
| Internet Type | # Households | % Households |
| Dial-Up Internet | 3 | 3.1% |
| Broadband Home | 45 | 46.9% |
| Cellular Data Only | 19 | 19.8% |
| Satellite Internet | 10 | 10.4% |
| No Internet | 23 | 24.0% |
| Total | 96 | 100.0% |
Tehuacana Summary
Tehuacana, Texas is a small unincorporated community located in Limestone County, Texas. It is situated about 10 miles south of Mexia and about 20 miles north of Waco. The population of Tehuacana was estimated to be around 200 people in 2020.
History
The area around Tehuacana was first settled in the early 1800s by settlers from the United States and Mexico. The town was originally known as “Tehuacana Springs” and was established in 1845. The name “Tehuacana” is derived from the Caddo Indian word for “meeting place”. The town was officially incorporated in 1876 and was a thriving community for many years.
In the late 1800s, Tehuacana was a major stop on the Houston and Texas Central Railway. The town was also home to a number of businesses, including a cotton gin, a grist mill, a blacksmith shop, and a general store.
In the early 1900s, Tehuacana experienced a period of decline due to the Great Depression and the Dust Bowl. The town’s population decreased from a peak of around 500 people in the 1920s to just over 200 people in 2020.
Geography
Tehuacana is located in Limestone County, Texas. It is situated about 10 miles south of Mexia and about 20 miles north of Waco. The town is located on the banks of the Navasota River. The terrain around Tehuacana is mostly flat with some rolling hills. The climate is generally hot and humid in the summer and mild in the winter.
Economy
The economy of Tehuacana is largely based on agriculture. The town is home to several farms that produce cotton, corn, and hay. There are also several small businesses in the area, including a gas station, a convenience store, and a restaurant.
Demographics
The population of Tehuacana was estimated to be around 200 people in 2020. The racial makeup of the town is predominantly white (90.5%), with African Americans (4.5%), Hispanics (3.5%), and Native Americans (1.5%) making up the remainder of the population. The median household income in Tehuacana is $35,000, and the median age is 37.
Conclusion
Tehuacana, Texas is a small unincorporated community located in Limestone County, Texas. It is situated about 10 miles south of Mexia and about 20 miles north of Waco. The population of Tehuacana was estimated to be around 200 people in 2020. The town’s economy is largely based on agriculture, and the racial makeup of the town is predominantly white. Tehuacana is a quiet, rural community with a rich history and a bright future.
Common Questions
What is Per Capita Income in Tehuacana?
Per Capita income in Tehuacana is $35,742.
What is the Median Family Income in Tehuacana?
Median Family Income in Tehuacana is $79,375.
What is the Median Household income in Tehuacana?
Median Household Income in Tehuacana is $63,750.
What is Inequality or Gini Index in Tehuacana?
Inequality or Gini Index in Tehuacana is 0.43.
What is the Total Population of Tehuacana?
Total Population of Tehuacana is 230.
What is the Total Male Population of Tehuacana?
Total Male Population of Tehuacana is 139.
What is the Total Female Population of Tehuacana?
Total Female Population of Tehuacana is 91.
What is the Ratio of Males per 100 Females in Tehuacana?
There are 152.75 Males per 100 Females in Tehuacana.
What is the Ratio of Females per 100 Males in Tehuacana?
There are 65.47 Females per 100 Males in Tehuacana.
What is the Median Population Age in Tehuacana?
Median Population Age in Tehuacana is 53.3 Years.
What is the Average Family Size in Tehuacana
Average Family Size in Tehuacana is 2.9 People.
What is the Average Household Size in Tehuacana
Average Household Size in Tehuacana is 2.1 People.
How Large is the Labor Force in Tehuacana?
There are 113 People in the Labor Forcein in Tehuacana.
What is the Percentage of People in the Labor Force in Tehuacana?
55.1% of People are in the Labor Force in Tehuacana.