Monte Alto, TX Map & Demographics
Monte Alto Map
Monte Alto Overview
$17,840
PER CAPITA INCOME
$46,020
AVG FAMILY INCOME
$41,115
AVG HOUSEHOLD INCOME
19.3%
WAGE / INCOME GAP [ % ]
80.7¢/ $1
WAGE / INCOME GAP [ $ ]
0.41
INEQUALITY / GINI INDEX
1,666
TOTAL POPULATION
787
MALE POPULATION
879
FEMALE POPULATION
89.53
MALES / 100 FEMALES
111.69
FEMALES / 100 MALES
39.2
MEDIAN AGE
3.7
AVG FAMILY SIZE
3.1
AVG HOUSEHOLD SIZE
756
LABOR FORCE [ PEOPLE ]
57.7%
PERCENT IN LABOR FORCE
7.3%
UNEMPLOYMENT RATE
Monte Alto Area Codes
Income in Monte Alto
Income Overview in Monte Alto
Per Capita Income in Monte Alto is $17,840, while median incomes of families and households are $46,020 and $41,115 respectively.
| Characteristic | Number | Measure |
| Per Capita Income | 1,666 | $17,840 |
| Median Family Income | 408 | $46,020 |
| Mean Family Income | 408 | $60,186 |
| Median Household Income | 544 | $41,115 |
| Mean Household Income | 544 | $52,951 |
| Income Deficit | 408 | $0 |
| Wage / Income Gap (%) | 1,666 | 19.33% |
| Wage / Income Gap ($) | 1,666 | 80.67¢ per $1 |
| Gini / Inequality Index | 1,666 | 0.41 |
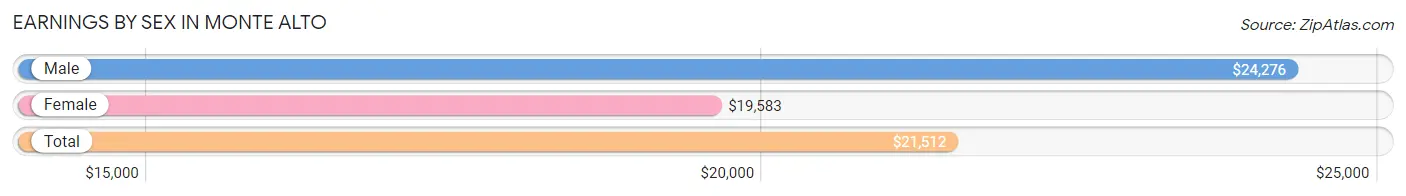
Earnings by Sex in Monte Alto
Average Earnings in Monte Alto are $21,512, $24,276 for men and $19,583 for women, a difference of 19.3%.
| Sex | Number | Average Earnings |
| Male | 361 (48.6%) | $24,276 |
| Female | 381 (51.3%) | $19,583 |
| Total | 742 (100.0%) | $21,512 |
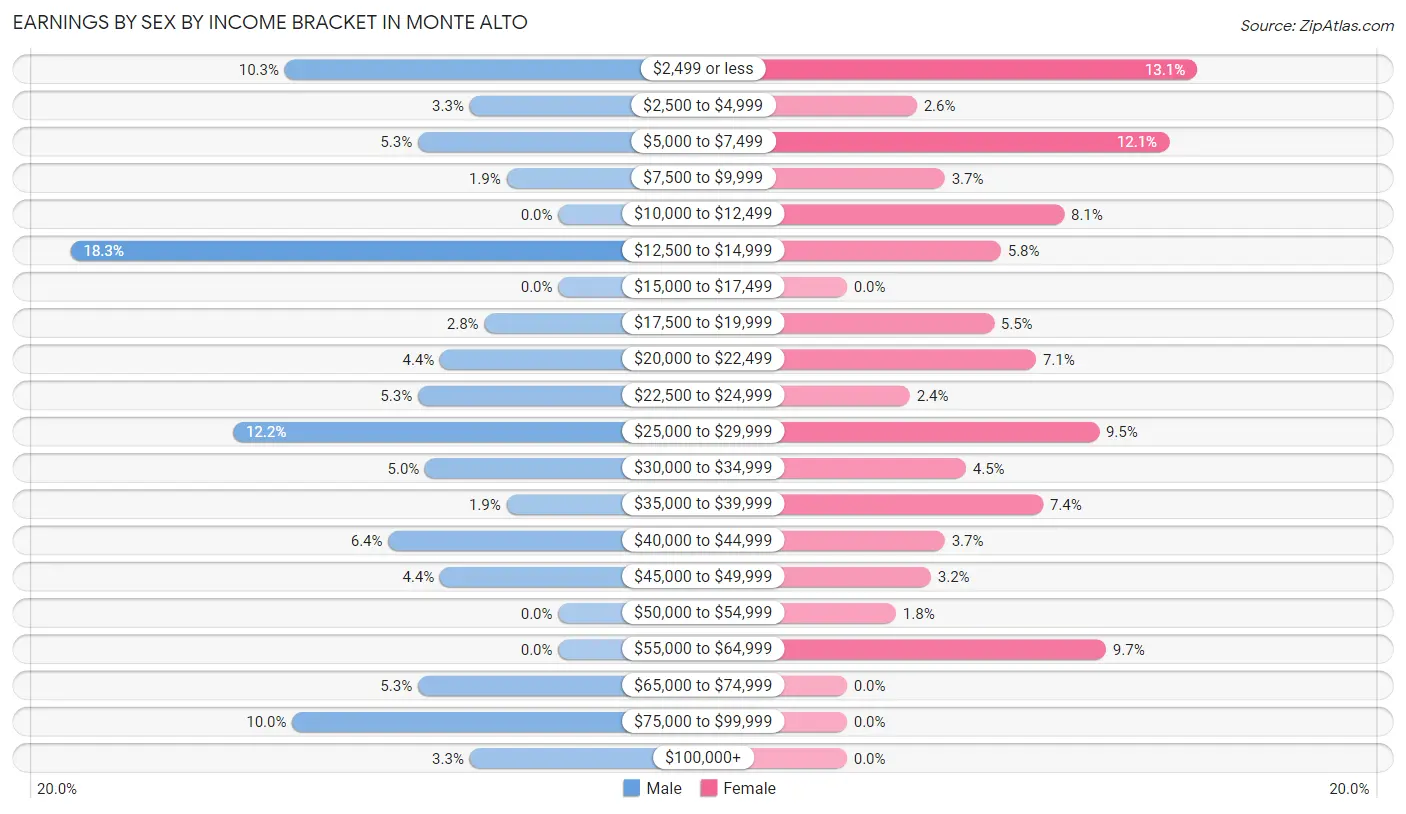
Earnings by Sex by Income Bracket in Monte Alto
The most common earnings brackets in Monte Alto are $12,500 to $14,999 for men (66 | 18.3%) and $2,499 or less for women (50 | 13.1%).
| Income | Male | Female |
| $2,499 or less | 37 (10.2%) | 50 (13.1%) |
| $2,500 to $4,999 | 12 (3.3%) | 10 (2.6%) |
| $5,000 to $7,499 | 19 (5.3%) | 46 (12.1%) |
| $7,500 to $9,999 | 7 (1.9%) | 14 (3.7%) |
| $10,000 to $12,499 | 0 (0.0%) | 31 (8.1%) |
| $12,500 to $14,999 | 66 (18.3%) | 22 (5.8%) |
| $15,000 to $17,499 | 0 (0.0%) | 0 (0.0%) |
| $17,500 to $19,999 | 10 (2.8%) | 21 (5.5%) |
| $20,000 to $22,499 | 16 (4.4%) | 27 (7.1%) |
| $22,500 to $24,999 | 19 (5.3%) | 9 (2.4%) |
| $25,000 to $29,999 | 44 (12.2%) | 36 (9.5%) |
| $30,000 to $34,999 | 18 (5.0%) | 17 (4.5%) |
| $35,000 to $39,999 | 7 (1.9%) | 28 (7.3%) |
| $40,000 to $44,999 | 23 (6.4%) | 14 (3.7%) |
| $45,000 to $49,999 | 16 (4.4%) | 12 (3.2%) |
| $50,000 to $54,999 | 0 (0.0%) | 7 (1.8%) |
| $55,000 to $64,999 | 0 (0.0%) | 37 (9.7%) |
| $65,000 to $74,999 | 19 (5.3%) | 0 (0.0%) |
| $75,000 to $99,999 | 36 (10.0%) | 0 (0.0%) |
| $100,000+ | 12 (3.3%) | 0 (0.0%) |
| Total | 361 (100.0%) | 381 (100.0%) |
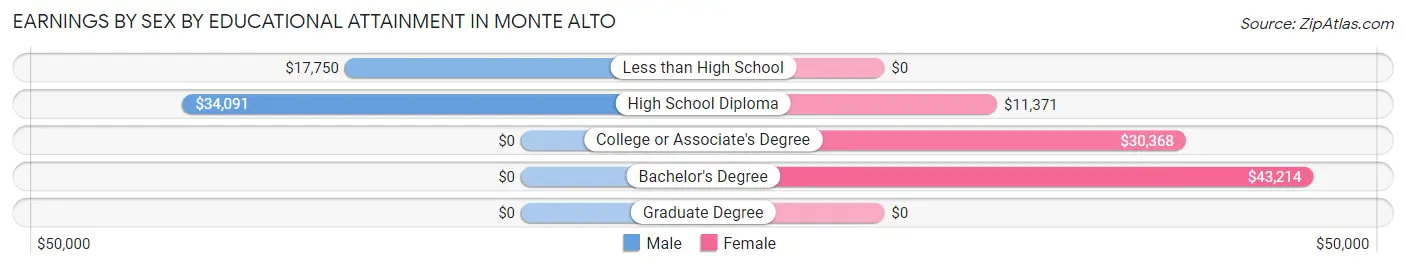
Earnings by Sex by Educational Attainment in Monte Alto
Average earnings in Monte Alto are $26,042 for men and $22,176 for women, a difference of 14.8%. Men with an educational attainment of high school diploma enjoy the highest average annual earnings of $34,091, while those with less than high school education earn the least with $17,750. Women with an educational attainment of bachelor's degree earn the most with the average annual earnings of $43,214, while those with high school diploma education have the smallest earnings of $11,371.
| Educational Attainment | Male Income | Female Income |
| Less than High School | $17,750 | $0 |
| High School Diploma | $34,091 | $11,371 |
| College or Associate's Degree | - | - |
| Bachelor's Degree | - | - |
| Graduate Degree | - | - |
| Total | $26,042 | $22,176 |
Family Income in Monte Alto
Family Income Brackets in Monte Alto
According to the Monte Alto family income data, there are 110 families falling into the $35,000 to $49,999 income range, which is the most common income bracket and makes up 27.0% of all families.
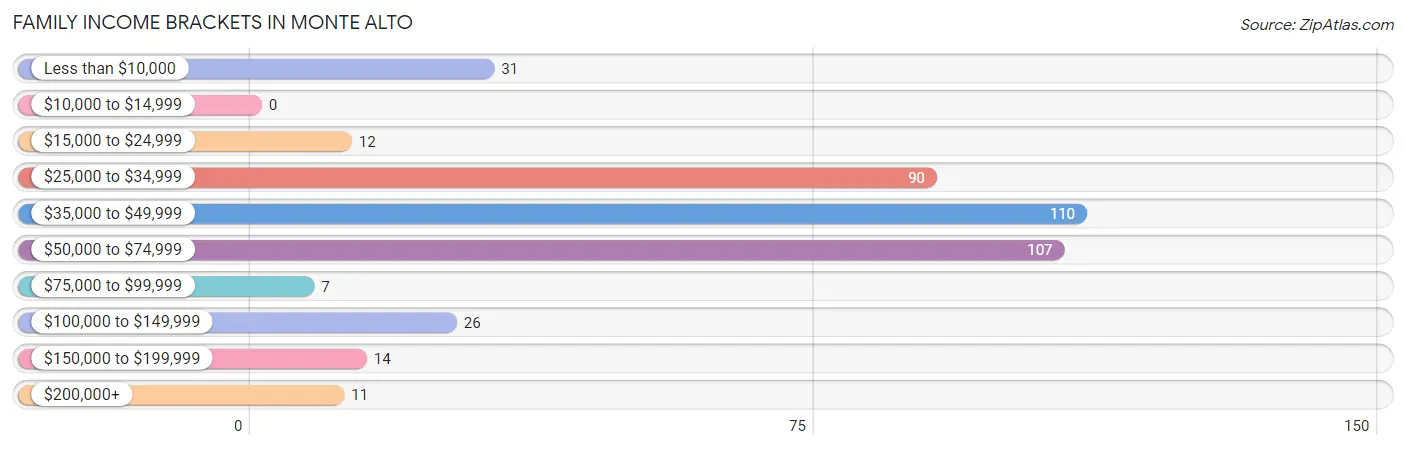
| Income Bracket | # Families | % Families |
| Less than $10,000 | 31 | 7.6% |
| $10,000 to $14,999 | 0 | 0.0% |
| $15,000 to $24,999 | 12 | 2.9% |
| $25,000 to $34,999 | 90 | 22.1% |
| $35,000 to $49,999 | 110 | 27.0% |
| $50,000 to $74,999 | 107 | 26.2% |
| $75,000 to $99,999 | 7 | 1.7% |
| $100,000 to $149,999 | 26 | 6.4% |
| $150,000 to $199,999 | 14 | 3.4% |
| $200,000+ | 11 | 2.7% |
Family Income by Famaliy Size in Monte Alto
2-person families (123 | 30.1%) account for the highest median family income in Monte Alto with $70,067 per family, while 2-person families (123 | 30.1%) have the highest median income of $35,034 per family member.
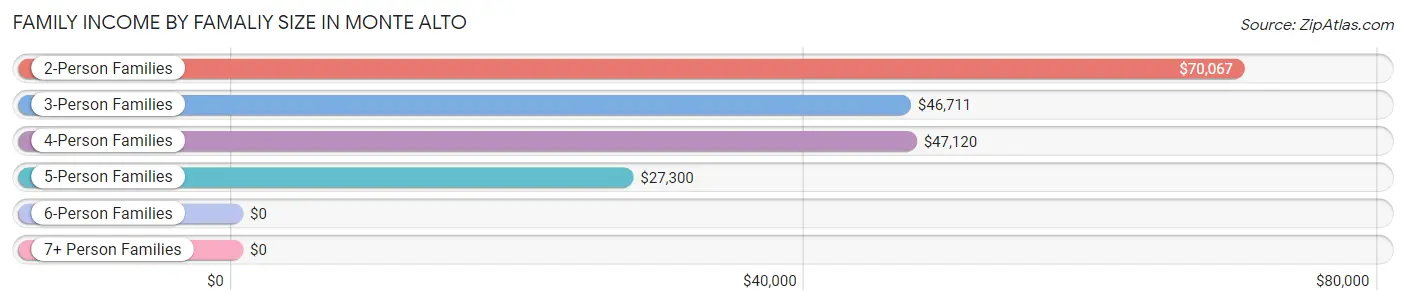
| Income Bracket | # Families | Median Income |
| 2-Person Families | 123 (30.1%) | $70,067 |
| 3-Person Families | 94 (23.0%) | $46,711 |
| 4-Person Families | 109 (26.7%) | $47,120 |
| 5-Person Families | 80 (19.6%) | $27,300 |
| 6-Person Families | 0 (0.0%) | $0 |
| 7+ Person Families | 2 (0.5%) | $0 |
| Total | 408 (100.0%) | $46,020 |
Family Income by Number of Earners in Monte Alto
The median family income in Monte Alto is $46,020, with families comprising no earners (77) having the highest median family income of $70,781, while families with 1 earner (135) have the lowest median family income of $34,063, accounting for 18.9% and 33.1% of families, respectively.
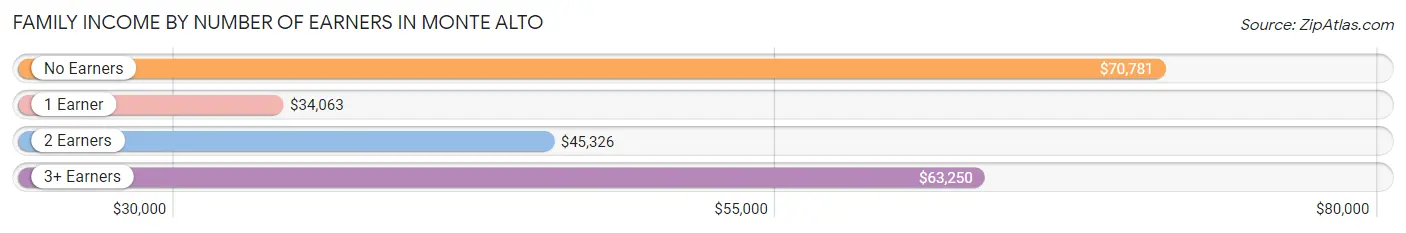
| Number of Earners | # Families | Median Income |
| No Earners | 77 (18.9%) | $70,781 |
| 1 Earner | 135 (33.1%) | $34,063 |
| 2 Earners | 152 (37.2%) | $45,326 |
| 3+ Earners | 44 (10.8%) | $63,250 |
| Total | 408 (100.0%) | $46,020 |
Household Income in Monte Alto
Household Income Brackets in Monte Alto
With 142 households falling in the category, the $35,000 to $49,999 income range is the most frequent in Monte Alto, accounting for 26.1% of all households. In contrast, only 11 households (2.0%) fall into the $200,000+ income bracket, making it the least populous group.
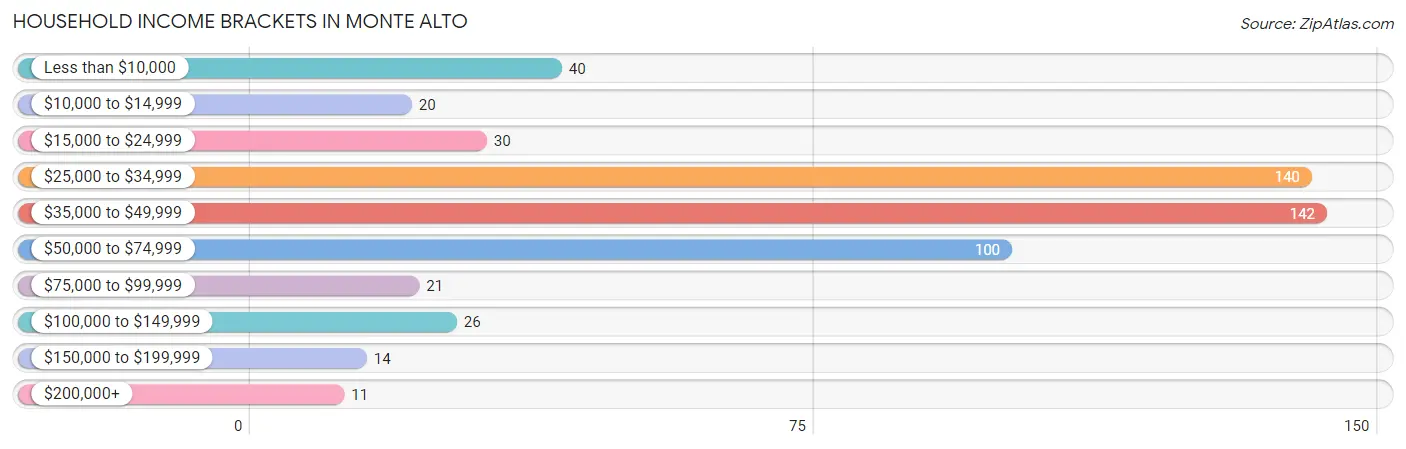
| Income Bracket | # Households | % Households |
| Less than $10,000 | 40 | 7.4% |
| $10,000 to $14,999 | 20 | 3.7% |
| $15,000 to $24,999 | 30 | 5.5% |
| $25,000 to $34,999 | 140 | 25.7% |
| $35,000 to $49,999 | 142 | 26.1% |
| $50,000 to $74,999 | 100 | 18.4% |
| $75,000 to $99,999 | 21 | 3.9% |
| $100,000 to $149,999 | 26 | 4.8% |
| $150,000 to $199,999 | 14 | 2.6% |
| $200,000+ | 11 | 2.0% |
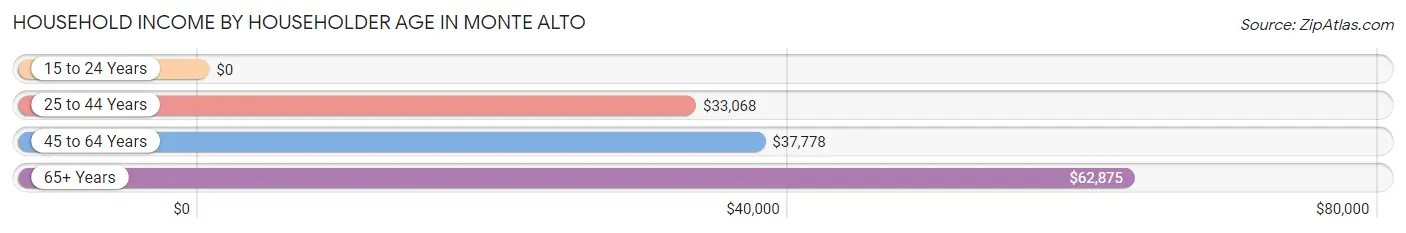
Household Income by Householder Age in Monte Alto
The median household income in Monte Alto is $41,115, with the highest median household income of $62,875 found in the 65+ years age bracket for the primary householder. A total of 177 households (32.5%) fall into this category. Meanwhile, the 15 to 24 years age bracket for the primary householder has the lowest median household income of $0, with 24 households (4.4%) in this group.
| Income Bracket | # Households | Median Income |
| 15 to 24 Years | 24 (4.4%) | $0 |
| 25 to 44 Years | 133 (24.4%) | $33,068 |
| 45 to 64 Years | 210 (38.6%) | $37,778 |
| 65+ Years | 177 (32.5%) | $62,875 |
| Total | 544 (100.0%) | $41,115 |
Poverty in Monte Alto
Income Below Poverty by Sex and Age in Monte Alto
With 36.0% poverty level for males and 44.7% for females among the residents of Monte Alto, 5 year old males and under 5 year old females are the most vulnerable to poverty, with 7 males (100.0%) and 64 females (100.0%) in their respective age groups living below the poverty level.
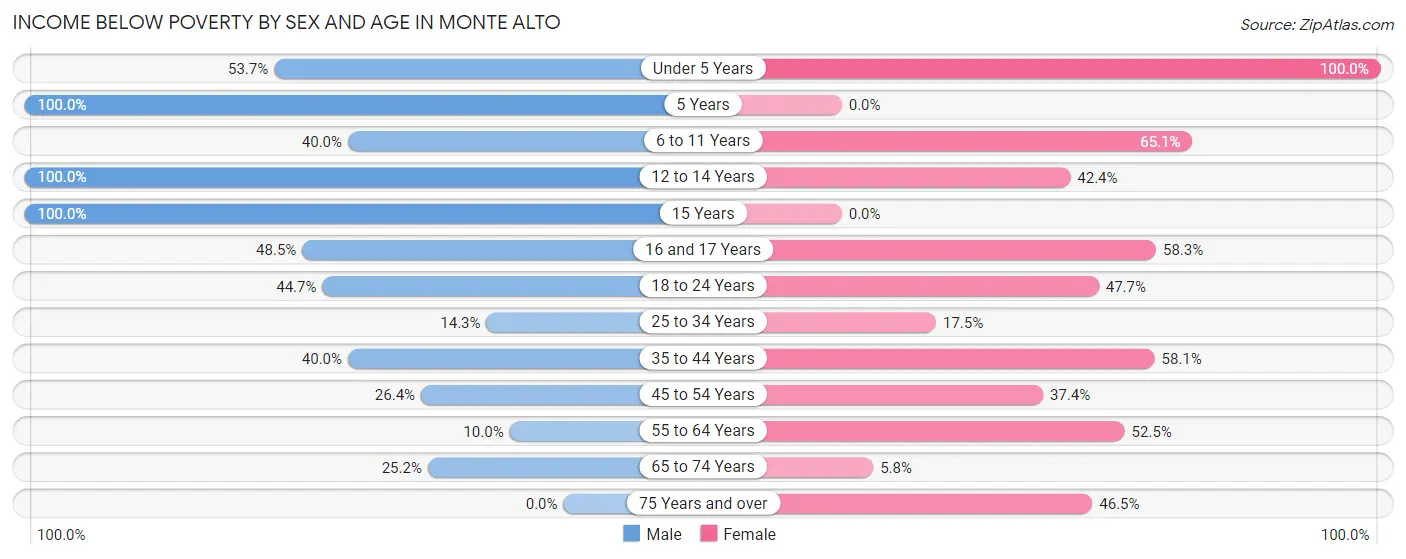
| Age Bracket | Male | Female |
| Under 5 Years | 29 (53.7%) | 64 (100.0%) |
| 5 Years | 7 (100.0%) | 0 (0.0%) |
| 6 to 11 Years | 14 (40.0%) | 54 (65.1%) |
| 12 to 14 Years | 13 (100.0%) | 14 (42.4%) |
| 15 Years | 56 (100.0%) | 0 (0.0%) |
| 16 and 17 Years | 48 (48.5%) | 7 (58.3%) |
| 18 to 24 Years | 17 (44.7%) | 83 (47.7%) |
| 25 to 34 Years | 9 (14.3%) | 7 (17.5%) |
| 35 to 44 Years | 18 (40.0%) | 54 (58.1%) |
| 45 to 54 Years | 23 (26.4%) | 62 (37.3%) |
| 55 to 64 Years | 12 (10.0%) | 21 (52.5%) |
| 65 to 74 Years | 37 (25.2%) | 7 (5.8%) |
| 75 Years and over | 0 (0.0%) | 20 (46.5%) |
| Total | 283 (36.0%) | 393 (44.7%) |
Income Above Poverty by Sex and Age in Monte Alto
According to the poverty statistics in Monte Alto, males aged 75 years and over and females aged 5 years are the age groups that are most secure financially, with 100.0% of males and 100.0% of females in these age groups living above the poverty line.
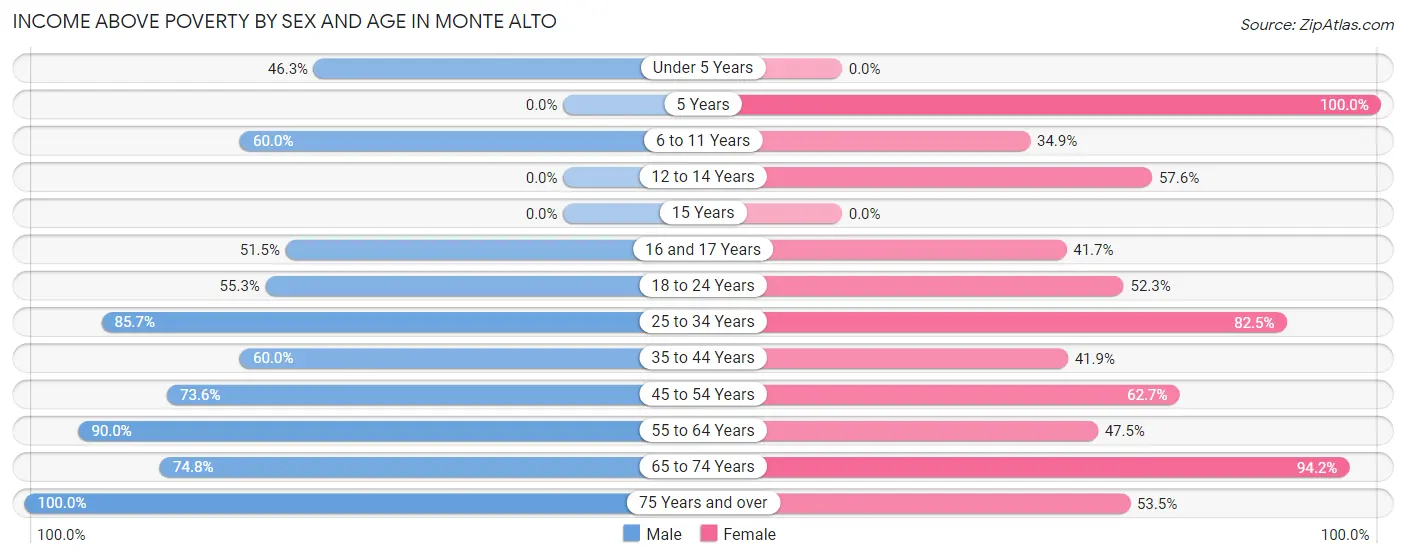
| Age Bracket | Male | Female |
| Under 5 Years | 25 (46.3%) | 0 (0.0%) |
| 5 Years | 0 (0.0%) | 11 (100.0%) |
| 6 to 11 Years | 21 (60.0%) | 29 (34.9%) |
| 12 to 14 Years | 0 (0.0%) | 19 (57.6%) |
| 15 Years | 0 (0.0%) | 0 (0.0%) |
| 16 and 17 Years | 51 (51.5%) | 5 (41.7%) |
| 18 to 24 Years | 21 (55.3%) | 91 (52.3%) |
| 25 to 34 Years | 54 (85.7%) | 33 (82.5%) |
| 35 to 44 Years | 27 (60.0%) | 39 (41.9%) |
| 45 to 54 Years | 64 (73.6%) | 104 (62.6%) |
| 55 to 64 Years | 108 (90.0%) | 19 (47.5%) |
| 65 to 74 Years | 110 (74.8%) | 113 (94.2%) |
| 75 Years and over | 23 (100.0%) | 23 (53.5%) |
| Total | 504 (64.0%) | 486 (55.3%) |
Income Below Poverty Among Married-Couple Families in Monte Alto
The poverty statistics for married-couple families in Monte Alto show that 9.6% or 21 of the total 219 families live below the poverty line. Families with 3 or 4 children have the highest poverty rate of 100.0%, comprising of 2 families. On the other hand, families with no children have the lowest poverty rate of 0.0%, which includes 0 families.
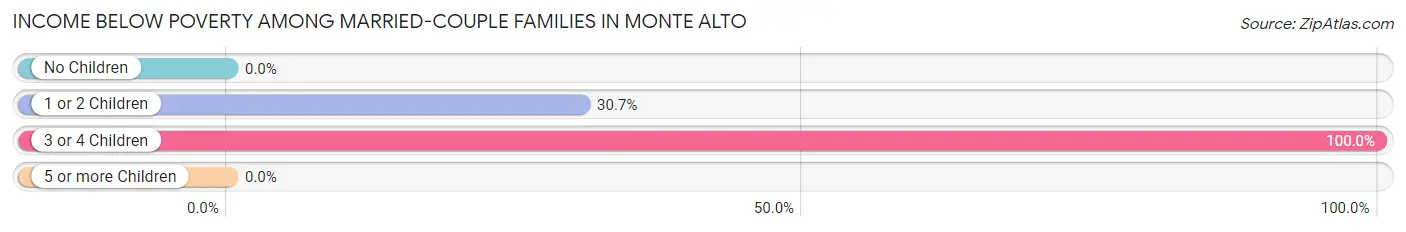
| Children | Above Poverty | Below Poverty |
| No Children | 155 (100.0%) | 0 (0.0%) |
| 1 or 2 Children | 43 (69.4%) | 19 (30.6%) |
| 3 or 4 Children | 0 (0.0%) | 2 (100.0%) |
| 5 or more Children | 0 (0.0%) | 0 (0.0%) |
| Total | 198 (90.4%) | 21 (9.6%) |
Income Below Poverty Among Single-Parent Households in Monte Alto
According to the poverty data in Monte Alto, 100.0% or 10 single-father households and 45.8% or 82 single-mother households are living below the poverty line. Among single-father households, those with 3 or 4 children have the highest poverty rate, with 10 households (100.0%) experiencing poverty. Likewise, among single-mother households, those with 3 or 4 children have the highest poverty rate, with 43 households (100.0%) falling below the poverty line.
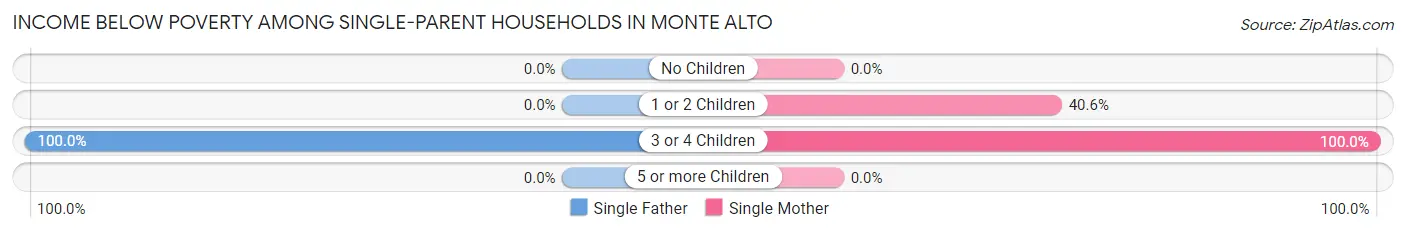
| Children | Single Father | Single Mother |
| No Children | 0 (0.0%) | 0 (0.0%) |
| 1 or 2 Children | 0 (0.0%) | 39 (40.6%) |
| 3 or 4 Children | 10 (100.0%) | 43 (100.0%) |
| 5 or more Children | 0 (0.0%) | 0 (0.0%) |
| Total | 10 (100.0%) | 82 (45.8%) |
Income Below Poverty Among Married-Couple vs Single-Parent Households in Monte Alto
The poverty data for Monte Alto shows that 21 of the married-couple family households (9.6%) and 92 of the single-parent households (48.7%) are living below the poverty level. Within the married-couple family households, those with 3 or 4 children have the highest poverty rate, with 2 households (100.0%) falling below the poverty line. Among the single-parent households, those with 3 or 4 children have the highest poverty rate, with 53 household (100.0%) living below poverty.
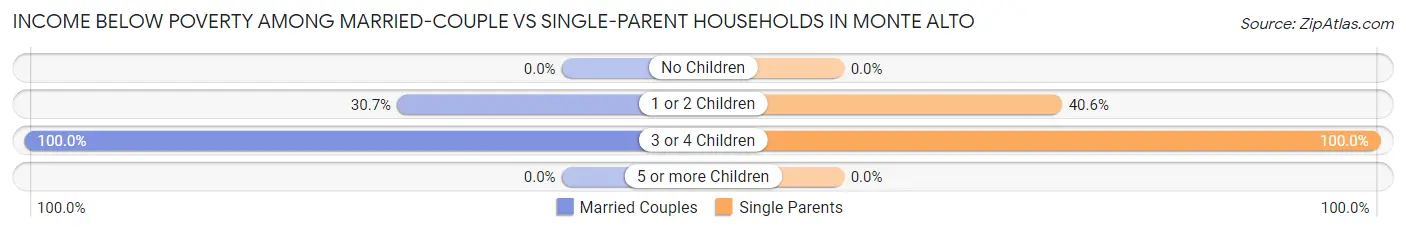
| Children | Married-Couple Families | Single-Parent Households |
| No Children | 0 (0.0%) | 0 (0.0%) |
| 1 or 2 Children | 19 (30.6%) | 39 (40.6%) |
| 3 or 4 Children | 2 (100.0%) | 53 (100.0%) |
| 5 or more Children | 0 (0.0%) | 0 (0.0%) |
| Total | 21 (9.6%) | 92 (48.7%) |
Race in Monte Alto
The most populous races in Monte Alto are Hispanic or Latino (1,666 | 100.0%), White / Caucasian (928 | 55.7%), and Two or more Races (559 | 33.6%).
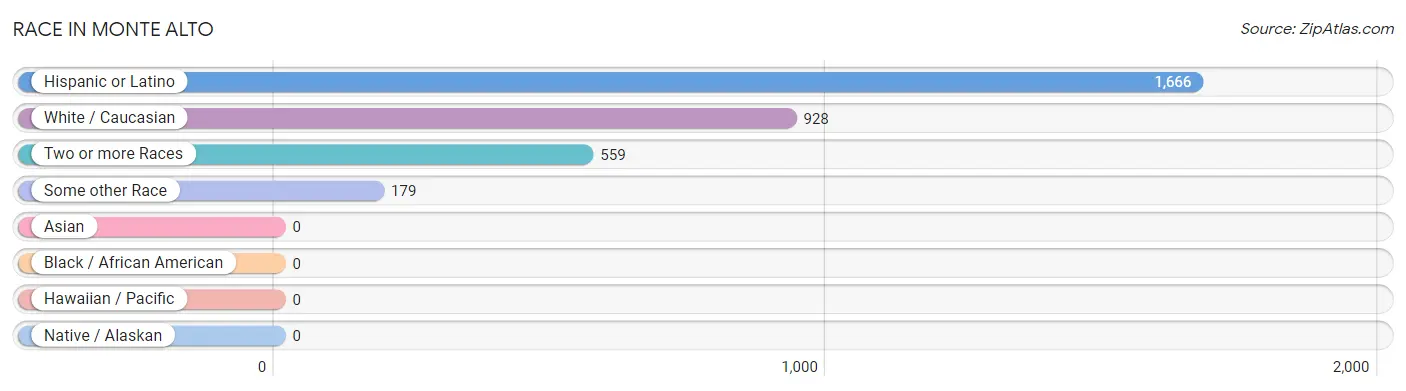
| Race | # Population | % Population |
| Asian | 0 | 0.0% |
| Black / African American | 0 | 0.0% |
| Hawaiian / Pacific | 0 | 0.0% |
| Hispanic or Latino | 1,666 | 100.0% |
| Native / Alaskan | 0 | 0.0% |
| White / Caucasian | 928 | 55.7% |
| Two or more Races | 559 | 33.6% |
| Some other Race | 179 | 10.7% |
| Total | 1,666 | 100.0% |
Ancestry in Monte Alto
The most populous ancestries reported in Monte Alto are Mexican (1,629 | 97.8%), and Italian (7 | 0.4%), together accounting for 98.2% of all Monte Alto residents.
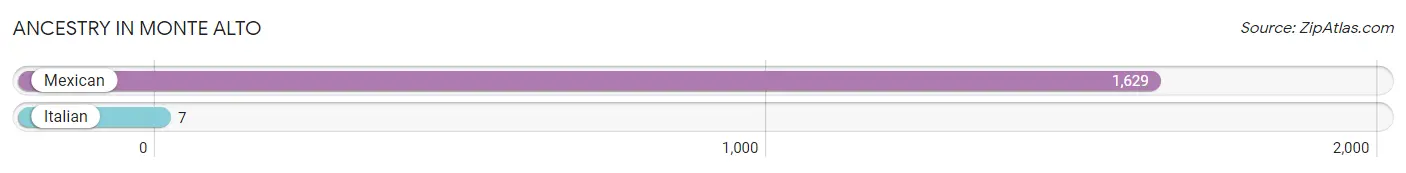
| Ancestry | # Population | % Population |
| Italian | 7 | 0.4% |
| Mexican | 1,629 | 97.8% | View All 2 Rows |
Immigrants in Monte Alto
The most numerous immigrant groups reported in Monte Alto came from Central America (294 | 17.6%), Latin America (294 | 17.6%), and Mexico (294 | 17.6%), together accounting for 52.9% of all Monte Alto residents.
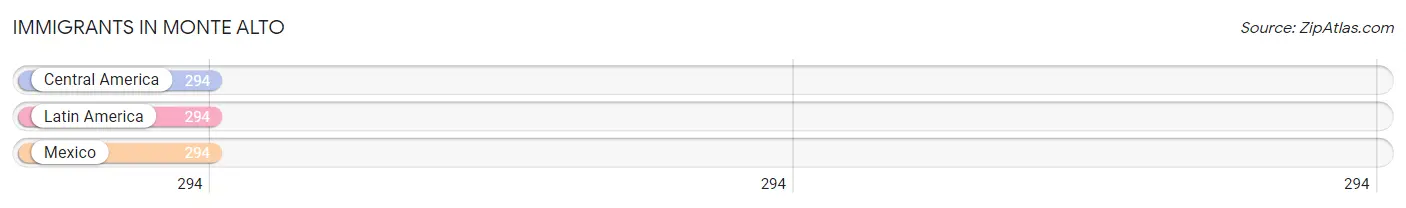
| Immigration Origin | # Population | % Population |
| Central America | 294 | 17.6% |
| Latin America | 294 | 17.6% |
| Mexico | 294 | 17.6% | View All 3 Rows |
Sex and Age in Monte Alto
Sex and Age in Monte Alto
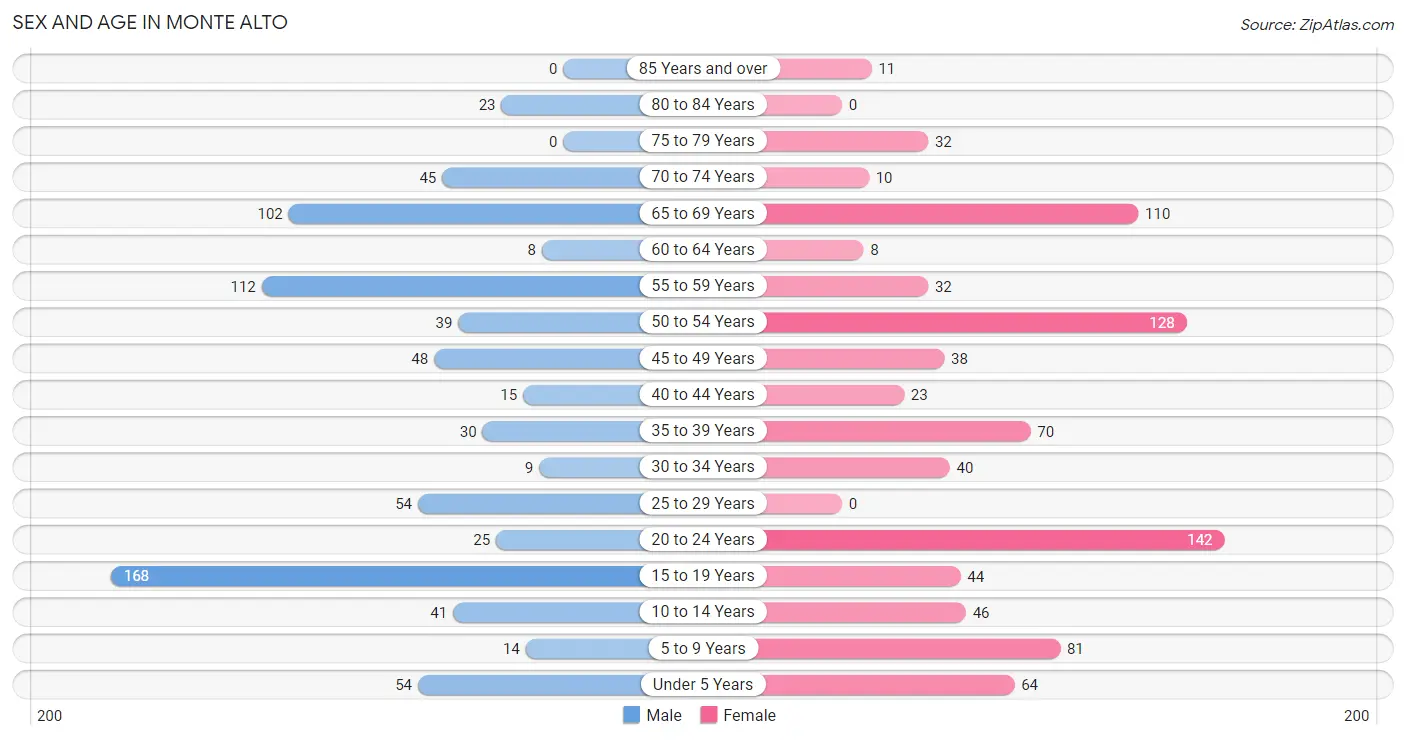
The most populous age groups in Monte Alto are 15 to 19 Years (168 | 21.3%) for men and 20 to 24 Years (142 | 16.2%) for women.
| Age Bracket | Male | Female |
| Under 5 Years | 54 (6.9%) | 64 (7.3%) |
| 5 to 9 Years | 14 (1.8%) | 81 (9.2%) |
| 10 to 14 Years | 41 (5.2%) | 46 (5.2%) |
| 15 to 19 Years | 168 (21.3%) | 44 (5.0%) |
| 20 to 24 Years | 25 (3.2%) | 142 (16.2%) |
| 25 to 29 Years | 54 (6.9%) | 0 (0.0%) |
| 30 to 34 Years | 9 (1.1%) | 40 (4.5%) |
| 35 to 39 Years | 30 (3.8%) | 70 (8.0%) |
| 40 to 44 Years | 15 (1.9%) | 23 (2.6%) |
| 45 to 49 Years | 48 (6.1%) | 38 (4.3%) |
| 50 to 54 Years | 39 (5.0%) | 128 (14.6%) |
| 55 to 59 Years | 112 (14.2%) | 32 (3.6%) |
| 60 to 64 Years | 8 (1.0%) | 8 (0.9%) |
| 65 to 69 Years | 102 (13.0%) | 110 (12.5%) |
| 70 to 74 Years | 45 (5.7%) | 10 (1.1%) |
| 75 to 79 Years | 0 (0.0%) | 32 (3.6%) |
| 80 to 84 Years | 23 (2.9%) | 0 (0.0%) |
| 85 Years and over | 0 (0.0%) | 11 (1.3%) |
| Total | 787 (100.0%) | 879 (100.0%) |
Families and Households in Monte Alto
Median Family Size in Monte Alto
The median family size in Monte Alto is 3.67 persons per family, with single male/father families (10 | 2.5%) accounting for the largest median family size of 4.9 persons per family. On the other hand, married-couple families (219 | 53.7%) represent the smallest median family size with 3.14 persons per family.
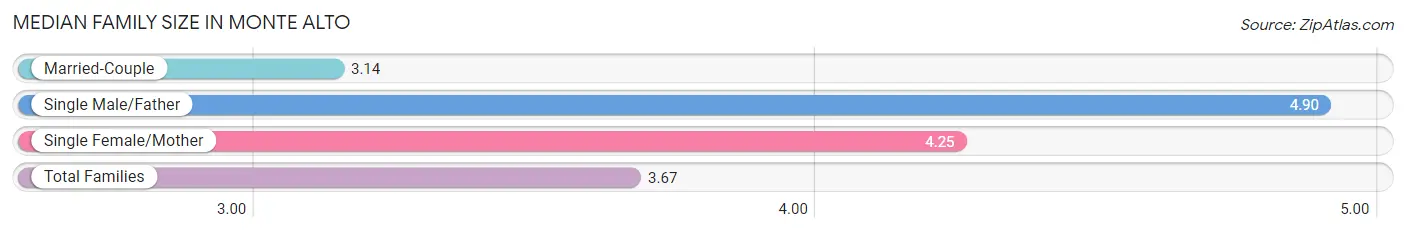
| Family Type | # Families | Family Size |
| Married-Couple | 219 (53.7%) | 3.14 |
| Single Male/Father | 10 (2.5%) | 4.90 |
| Single Female/Mother | 179 (43.9%) | 4.25 |
| Total Families | 408 (100.0%) | 3.67 |
Median Household Size in Monte Alto
The median household size in Monte Alto is 3.06 persons per household, with single male/father households (10 | 1.8%) accounting for the largest median household size of 4.9 persons per household. non-family households (136 | 25.0%) represent the smallest median household size with 1.15 persons per household.
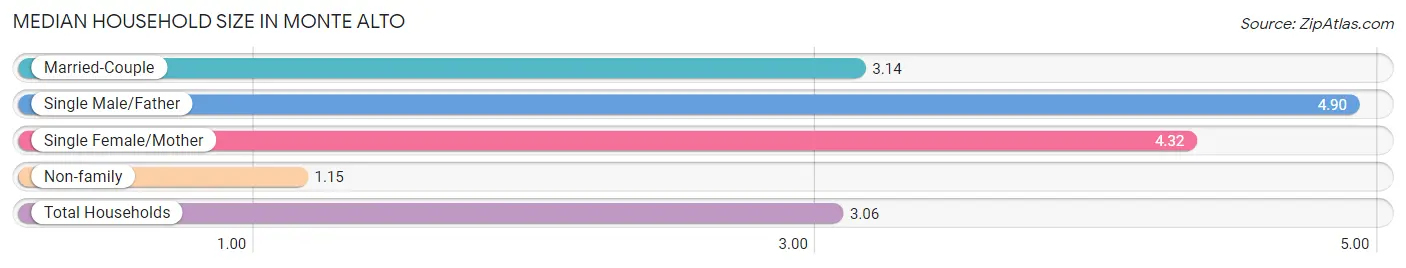
| Household Type | # Households | Household Size |
| Married-Couple | 219 (40.3%) | 3.14 |
| Single Male/Father | 10 (1.8%) | 4.90 |
| Single Female/Mother | 179 (32.9%) | 4.32 |
| Non-family | 136 (25.0%) | 1.15 |
| Total Households | 544 (100.0%) | 3.06 |
Household Size by Marriage Status in Monte Alto
Out of a total of 544 households in Monte Alto, 408 (75.0%) are family households, while 136 (25.0%) are nonfamily households. The most numerous type of family households are 2-person households, comprising 123, and the most common type of nonfamily households are 1-person households, comprising 116.
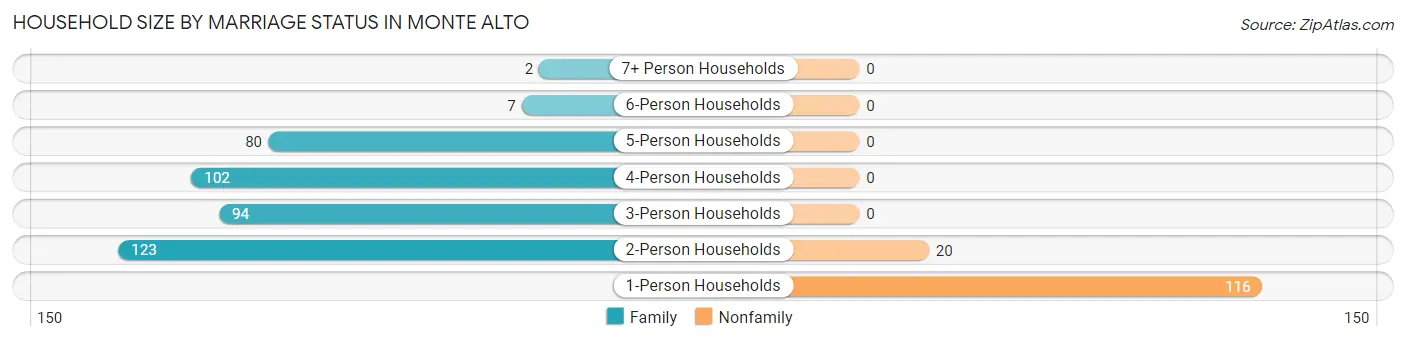
| Household Size | Family Households | Nonfamily Households |
| 1-Person Households | - | 116 (21.3%) |
| 2-Person Households | 123 (22.6%) | 20 (3.7%) |
| 3-Person Households | 94 (17.3%) | 0 (0.0%) |
| 4-Person Households | 102 (18.8%) | 0 (0.0%) |
| 5-Person Households | 80 (14.7%) | 0 (0.0%) |
| 6-Person Households | 7 (1.3%) | 0 (0.0%) |
| 7+ Person Households | 2 (0.4%) | 0 (0.0%) |
| Total | 408 (75.0%) | 136 (25.0%) |
Female Fertility in Monte Alto
Fertility by Age in Monte Alto
Average fertility rate in Monte Alto is 190.0 births per 1,000 women. Women in the age bracket of 20 to 34 years have the highest fertility rate with 357.0 births per 1,000 women. Women in the age bracket of 20 to 34 years acount for 85.5% of all women with births.
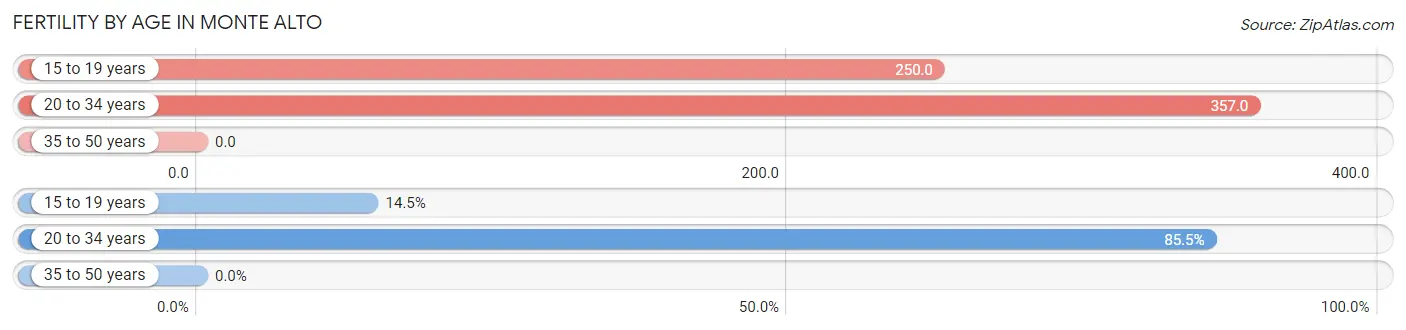
| Age Bracket | Women with Births | Births / 1,000 Women |
| 15 to 19 years | 11 (14.5%) | 250.0 |
| 20 to 34 years | 65 (85.5%) | 357.0 |
| 35 to 50 years | 0 (0.0%) | 0.0 |
| Total | 76 (100.0%) | 190.0 |
Fertility by Age by Marriage Status in Monte Alto
38.2% of women with births (76) in Monte Alto are married. The highest percentage of unmarried women with births falls into 15 to 19 years age bracket with 100.0% of them unmarried at the time of birth, while the lowest percentage of unmarried women with births belong to 20 to 34 years age bracket with 55.4% of them unmarried.
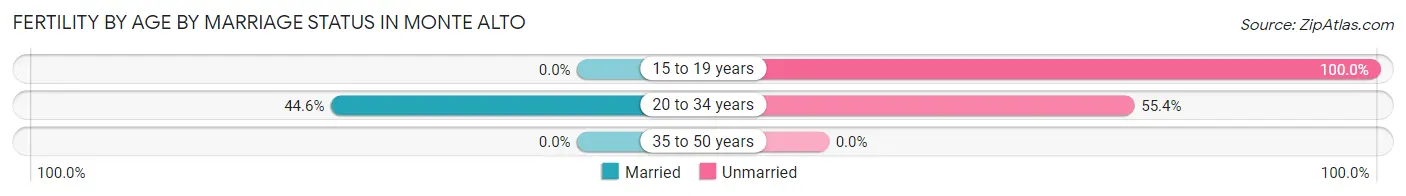
| Age Bracket | Married | Unmarried |
| 15 to 19 years | 0 (0.0%) | 11 (100.0%) |
| 20 to 34 years | 29 (44.6%) | 36 (55.4%) |
| 35 to 50 years | 0 (0.0%) | 0 (0.0%) |
| Total | 29 (38.2%) | 47 (61.8%) |
Fertility by Education in Monte Alto
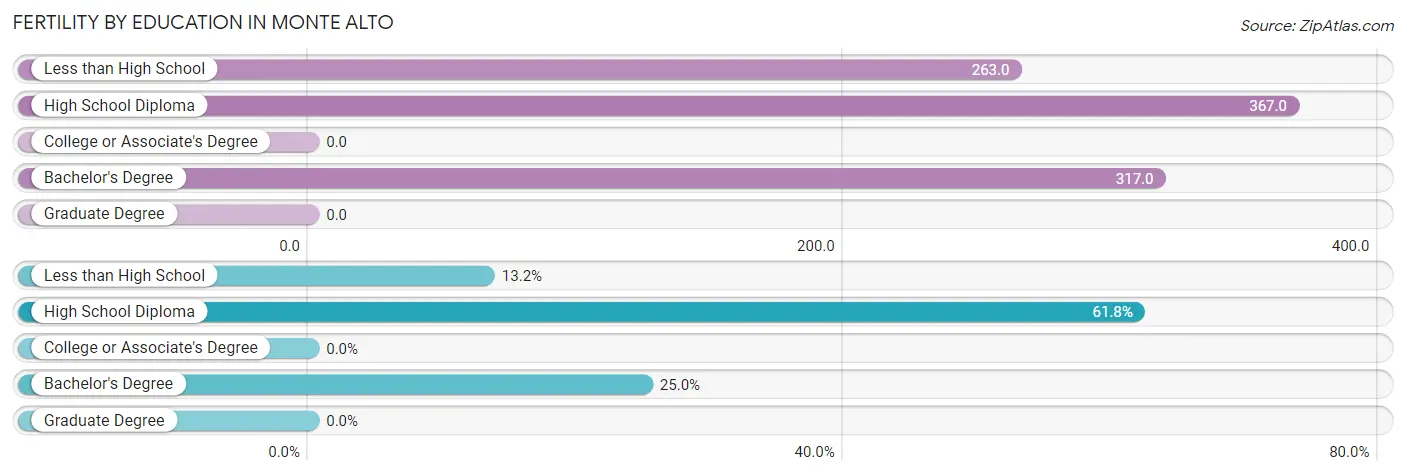
| Educational Attainment | Women with Births | Births / 1,000 Women |
| Less than High School | 10 (13.2%) | 263.0 |
| High School Diploma | 47 (61.8%) | 367.0 |
| College or Associate's Degree | 0 (0.0%) | 0.0 |
| Bachelor's Degree | 19 (25.0%) | 317.0 |
| Graduate Degree | 0 (0.0%) | 0.0 |
| Total | 76 (100.0%) | 190.0 |
Fertility by Education by Marriage Status in Monte Alto
61.8% of women with births in Monte Alto are unmarried. Women with the educational attainment of less than high school are most likely to be married with 100.0% of them married at childbirth, while women with the educational attainment of high school diploma are least likely to be married with 100.0% of them unmarried at childbirth.
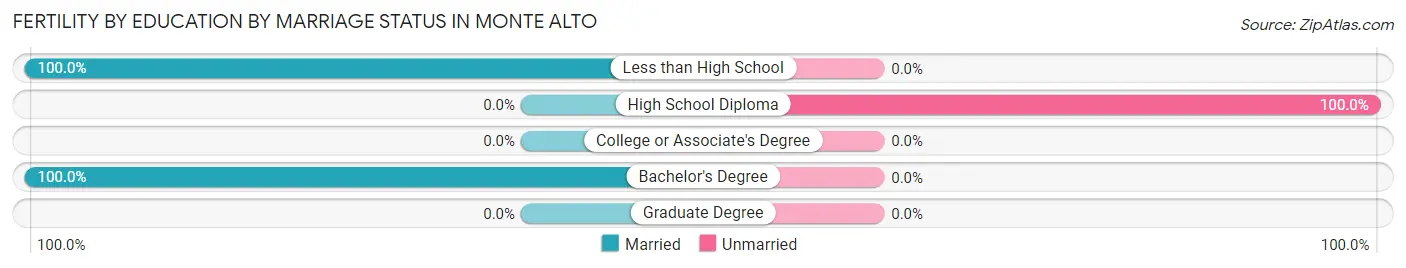
| Educational Attainment | Married | Unmarried |
| Less than High School | 10 (100.0%) | 0 (0.0%) |
| High School Diploma | 0 (0.0%) | 47 (100.0%) |
| College or Associate's Degree | 0 (0.0%) | 0 (0.0%) |
| Bachelor's Degree | 19 (100.0%) | 0 (0.0%) |
| Graduate Degree | 0 (0.0%) | 0 (0.0%) |
| Total | 29 (38.2%) | 47 (61.8%) |
Employment Characteristics in Monte Alto
Employment by Class of Employer in Monte Alto
Among the 682 employed individuals in Monte Alto, private company employees (365 | 53.5%), local government employees (102 | 15.0%), and state government employees (99 | 14.5%) make up the most common classes of employment.
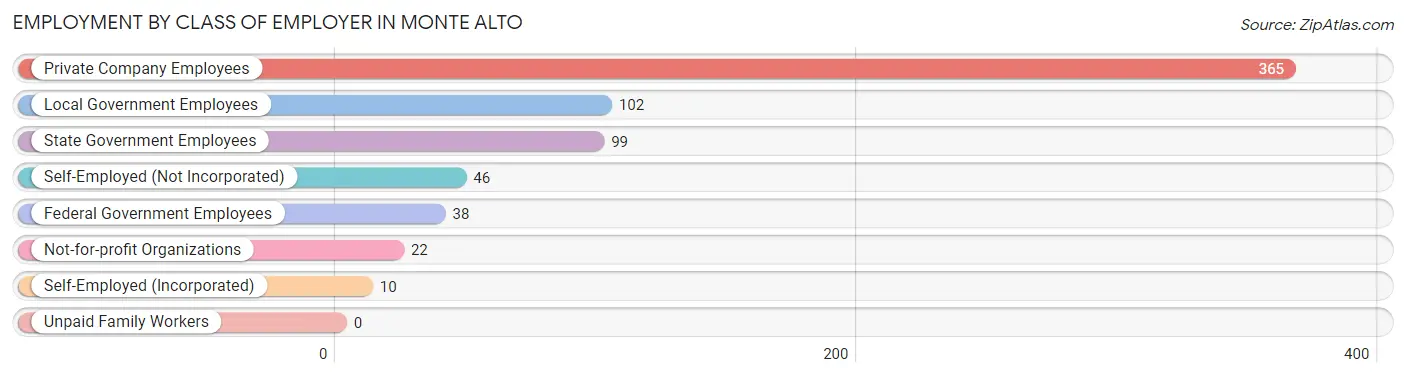
| Employer Class | # Employees | % Employees |
| Private Company Employees | 365 | 53.5% |
| Self-Employed (Incorporated) | 10 | 1.5% |
| Self-Employed (Not Incorporated) | 46 | 6.7% |
| Not-for-profit Organizations | 22 | 3.2% |
| Local Government Employees | 102 | 15.0% |
| State Government Employees | 99 | 14.5% |
| Federal Government Employees | 38 | 5.6% |
| Unpaid Family Workers | 0 | 0.0% |
| Total | 682 | 100.0% |
Employment Status by Age in Monte Alto
According to the labor force statistics for Monte Alto, out of the total population over 16 years of age (1,310), 57.7% or 756 individuals are in the labor force, with 7.3% or 55 of them unemployed. The age group with the highest labor force participation rate is 25 to 29 years, with 100.0% or 54 individuals in the labor force. Within the labor force, the 20 to 24 years age range has the highest percentage of unemployed individuals, with 22.4% or 15 of them being unemployed.
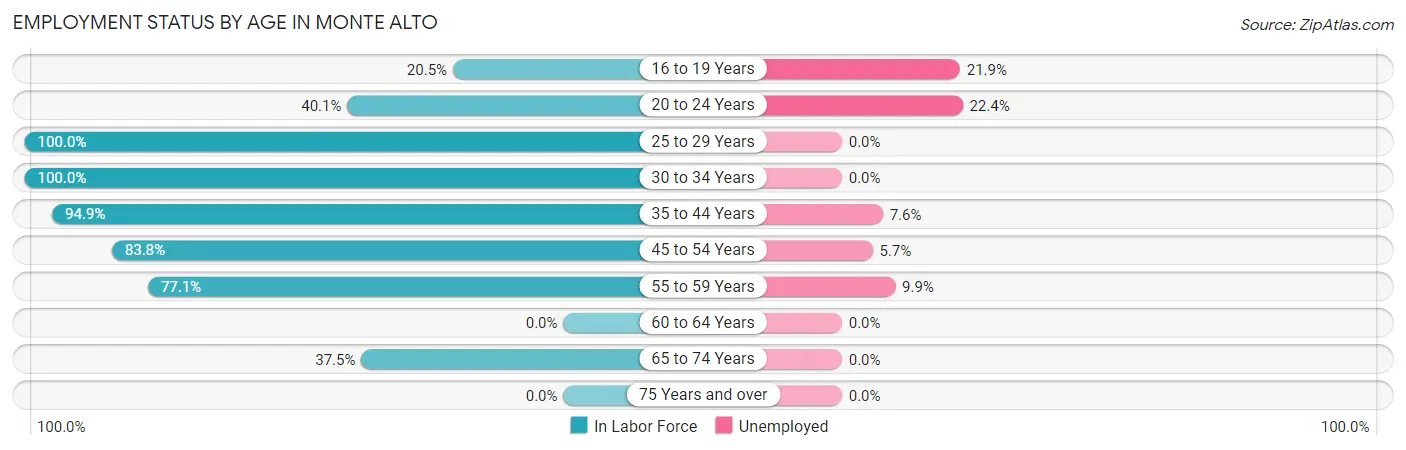
| Age Bracket | In Labor Force | Unemployed |
| 16 to 19 Years | 32 (20.5%) | 7 (21.9%) |
| 20 to 24 Years | 67 (40.1%) | 15 (22.4%) |
| 25 to 29 Years | 54 (100.0%) | 0 (0.0%) |
| 30 to 34 Years | 49 (100.0%) | 0 (0.0%) |
| 35 to 44 Years | 131 (94.9%) | 10 (7.6%) |
| 45 to 54 Years | 212 (83.8%) | 12 (5.7%) |
| 55 to 59 Years | 111 (77.1%) | 11 (9.9%) |
| 60 to 64 Years | 0 (0.0%) | 0 (0.0%) |
| 65 to 74 Years | 100 (37.5%) | 0 (0.0%) |
| 75 Years and over | 0 (0.0%) | 0 (0.0%) |
| Total | 756 (57.7%) | 55 (7.3%) |
Employment Status by Educational Attainment in Monte Alto
According to labor force statistics for Monte Alto, 85.2% of individuals (557) out of the total population between 25 and 64 years of age (654) are in the labor force, with 5.9% or 33 of them being unemployed. The group with the highest labor force participation rate are those with the educational attainment of bachelor's degree or higher, with 100.0% or 94 individuals in the labor force. Within the labor force, individuals with high school diploma education have the highest percentage of unemployment, with 21.4% or 31 of them being unemployed.
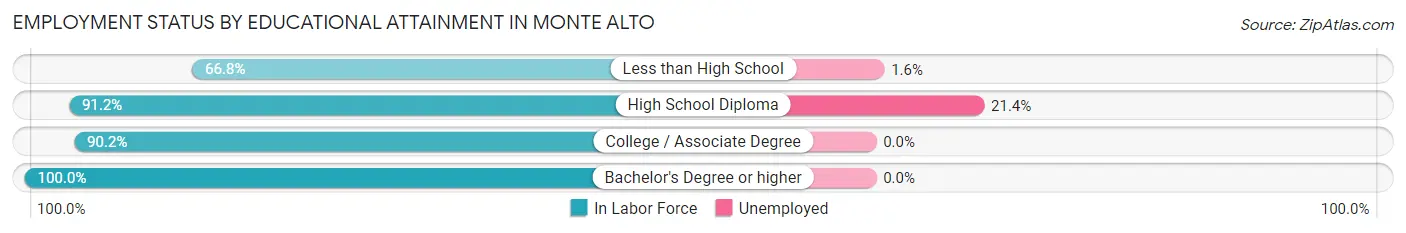
| Educational Attainment | In Labor Force | Unemployed |
| Less than High School | 125 (66.8%) | 3 (1.6%) |
| High School Diploma | 145 (91.2%) | 34 (21.4%) |
| College / Associate Degree | 193 (90.2%) | 0 (0.0%) |
| Bachelor's Degree or higher | 94 (100.0%) | 0 (0.0%) |
| Total | 557 (85.2%) | 39 (5.9%) |
Employment Occupations by Sex in Monte Alto
Management, Business, Science and Arts Occupations
The most common Management, Business, Science and Arts occupations in Monte Alto are Community & Social Service (78 | 11.1%), Education Instruction & Library (51 | 7.3%), Health Diagnosing & Treating (37 | 5.3%), Health Technologists (28 | 4.0%), and Management (24 | 3.4%).
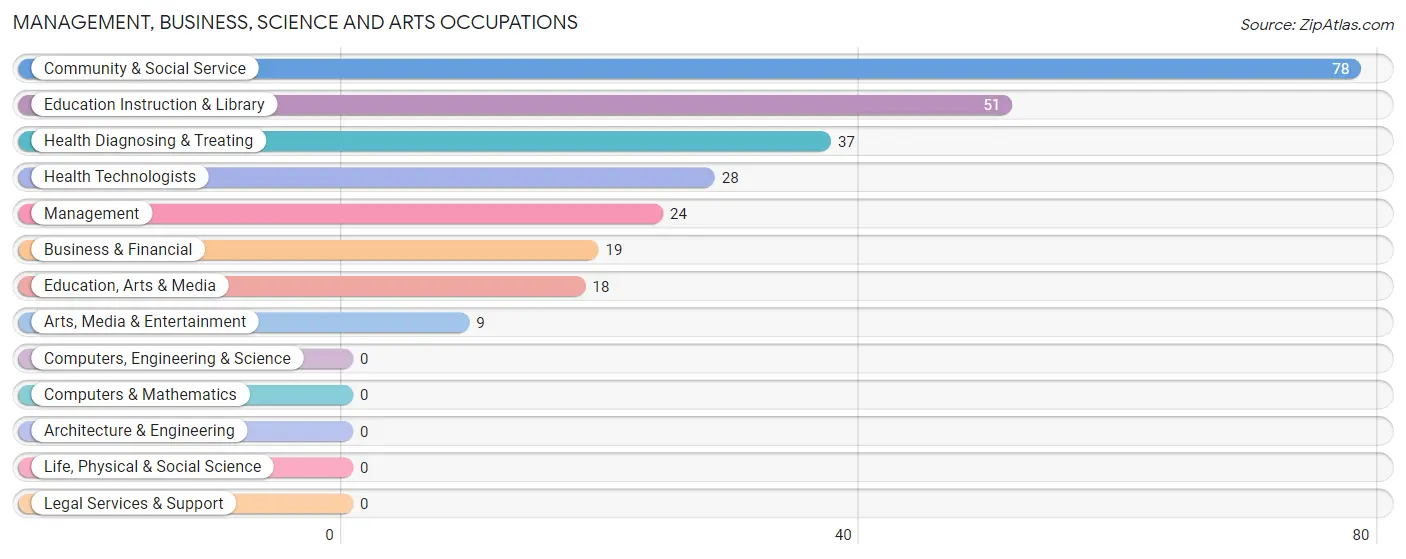
Management, Business, Science and Arts Occupations by Sex
Within the Management, Business, Science and Arts occupations in Monte Alto, the most male-oriented occupations are Arts, Media & Entertainment (100.0%), Health Diagnosing & Treating (48.6%), and Health Technologists (32.1%), while the most female-oriented occupations are Business & Financial (100.0%), Education, Arts & Media (100.0%), and Management (70.8%).

| Occupation | Male | Female |
| Management | 7 (29.2%) | 17 (70.8%) |
| Business & Financial | 0 (0.0%) | 19 (100.0%) |
| Computers, Engineering & Science | 0 (0.0%) | 0 (0.0%) |
| Computers & Mathematics | 0 (0.0%) | 0 (0.0%) |
| Architecture & Engineering | 0 (0.0%) | 0 (0.0%) |
| Life, Physical & Social Science | 0 (0.0%) | 0 (0.0%) |
| Community & Social Service | 25 (32.1%) | 53 (67.9%) |
| Education, Arts & Media | 0 (0.0%) | 18 (100.0%) |
| Legal Services & Support | 0 (0.0%) | 0 (0.0%) |
| Education Instruction & Library | 16 (31.4%) | 35 (68.6%) |
| Arts, Media & Entertainment | 9 (100.0%) | 0 (0.0%) |
| Health Diagnosing & Treating | 18 (48.6%) | 19 (51.3%) |
| Health Technologists | 9 (32.1%) | 19 (67.9%) |
| Total (Category) | 50 (31.7%) | 108 (68.3%) |
| Total (Overall) | 341 (48.6%) | 360 (51.4%) |
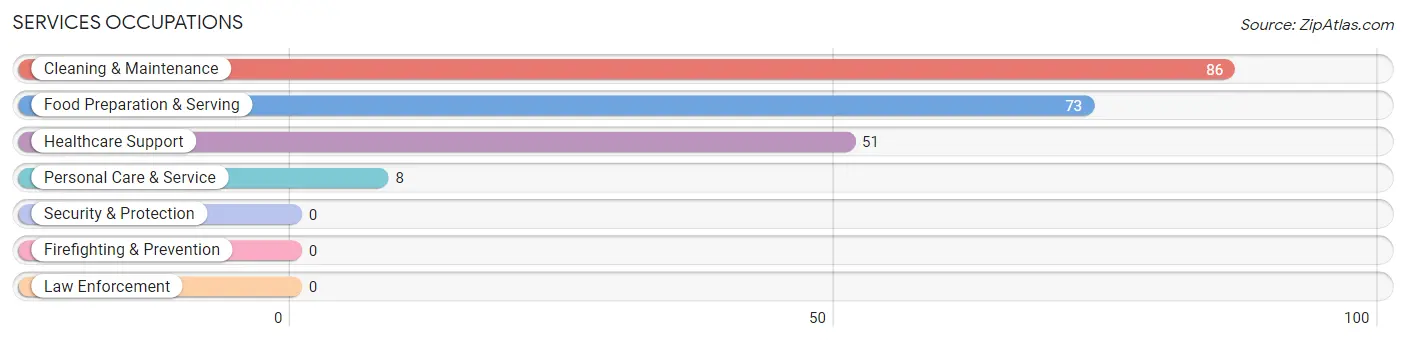
Services Occupations
The most common Services occupations in Monte Alto are Cleaning & Maintenance (86 | 12.3%), Food Preparation & Serving (73 | 10.4%), Healthcare Support (51 | 7.3%), and Personal Care & Service (8 | 1.1%).
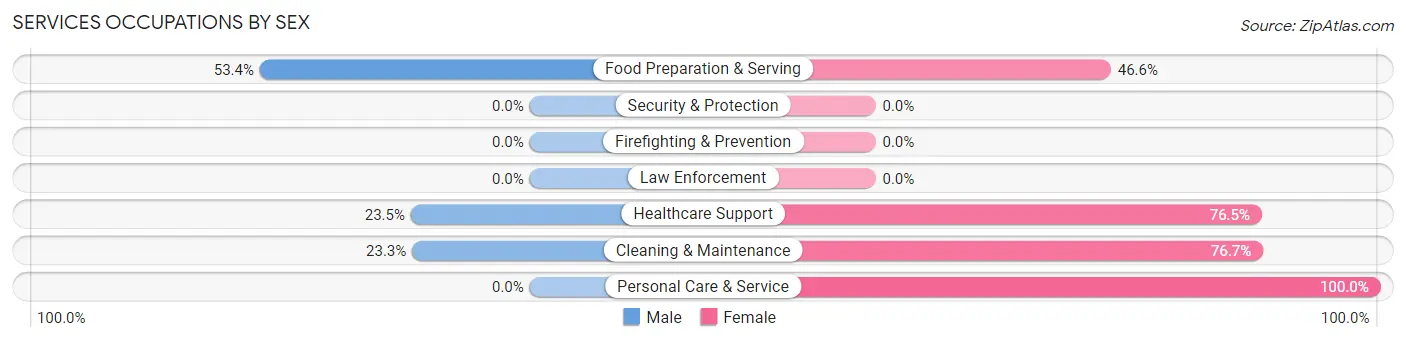
Services Occupations by Sex
Within the Services occupations in Monte Alto, the most male-oriented occupations are Food Preparation & Serving (53.4%), Healthcare Support (23.5%), and Cleaning & Maintenance (23.3%), while the most female-oriented occupations are Personal Care & Service (100.0%), Cleaning & Maintenance (76.7%), and Healthcare Support (76.5%).
| Occupation | Male | Female |
| Healthcare Support | 12 (23.5%) | 39 (76.5%) |
| Security & Protection | 0 (0.0%) | 0 (0.0%) |
| Firefighting & Prevention | 0 (0.0%) | 0 (0.0%) |
| Law Enforcement | 0 (0.0%) | 0 (0.0%) |
| Food Preparation & Serving | 39 (53.4%) | 34 (46.6%) |
| Cleaning & Maintenance | 20 (23.3%) | 66 (76.7%) |
| Personal Care & Service | 0 (0.0%) | 8 (100.0%) |
| Total (Category) | 71 (32.6%) | 147 (67.4%) |
| Total (Overall) | 341 (48.6%) | 360 (51.4%) |
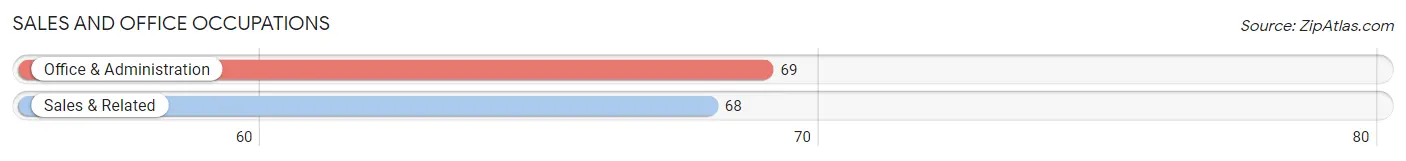
Sales and Office Occupations
The most common Sales and Office occupations in Monte Alto are Office & Administration (69 | 9.8%), and Sales & Related (68 | 9.7%).
Sales and Office Occupations by Sex
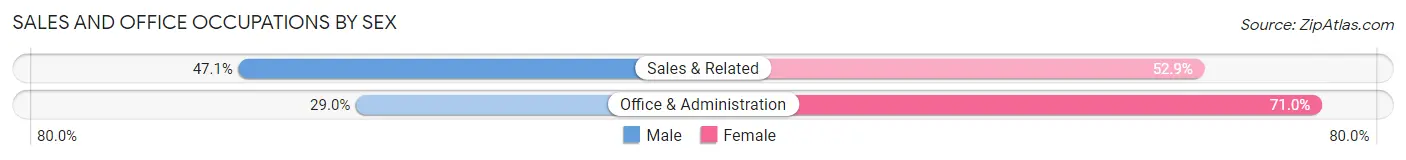
| Occupation | Male | Female |
| Sales & Related | 32 (47.1%) | 36 (52.9%) |
| Office & Administration | 20 (29.0%) | 49 (71.0%) |
| Total (Category) | 52 (38.0%) | 85 (62.0%) |
| Total (Overall) | 341 (48.6%) | 360 (51.4%) |
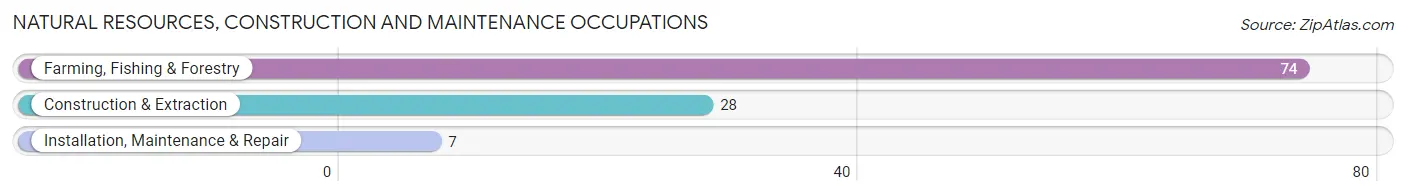
Natural Resources, Construction and Maintenance Occupations
The most common Natural Resources, Construction and Maintenance occupations in Monte Alto are Farming, Fishing & Forestry (74 | 10.6%), Construction & Extraction (28 | 4.0%), and Installation, Maintenance & Repair (7 | 1.0%).
Natural Resources, Construction and Maintenance Occupations by Sex
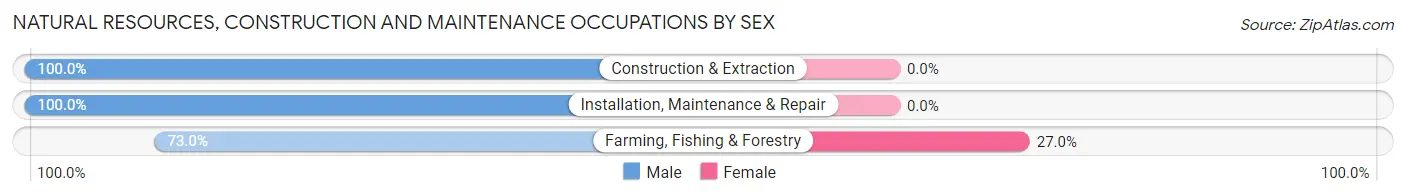
| Occupation | Male | Female |
| Farming, Fishing & Forestry | 54 (73.0%) | 20 (27.0%) |
| Construction & Extraction | 28 (100.0%) | 0 (0.0%) |
| Installation, Maintenance & Repair | 7 (100.0%) | 0 (0.0%) |
| Total (Category) | 89 (81.7%) | 20 (18.3%) |
| Total (Overall) | 341 (48.6%) | 360 (51.4%) |
Production, Transportation and Moving Occupations
The most common Production, Transportation and Moving occupations in Monte Alto are Material Moving (53 | 7.6%), and Transportation (26 | 3.7%).
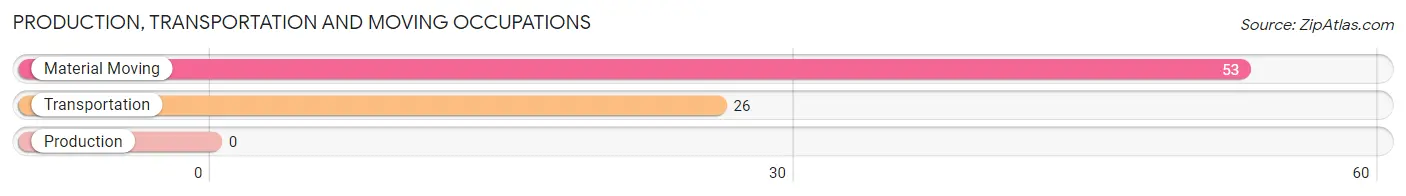
Production, Transportation and Moving Occupations by Sex
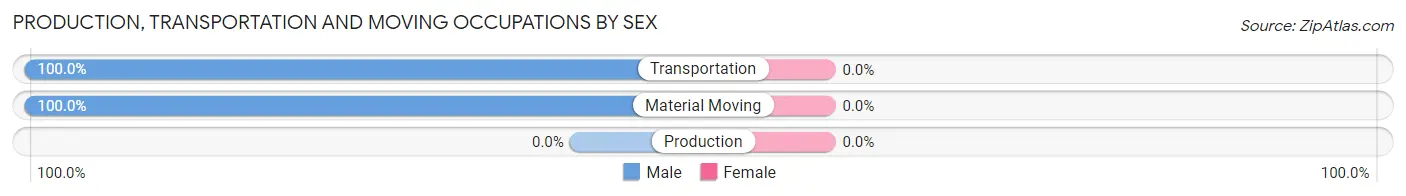
| Occupation | Male | Female |
| Production | 0 (0.0%) | 0 (0.0%) |
| Transportation | 26 (100.0%) | 0 (0.0%) |
| Material Moving | 53 (100.0%) | 0 (0.0%) |
| Total (Category) | 79 (100.0%) | 0 (0.0%) |
| Total (Overall) | 341 (48.6%) | 360 (51.4%) |
Employment Industries by Sex in Monte Alto
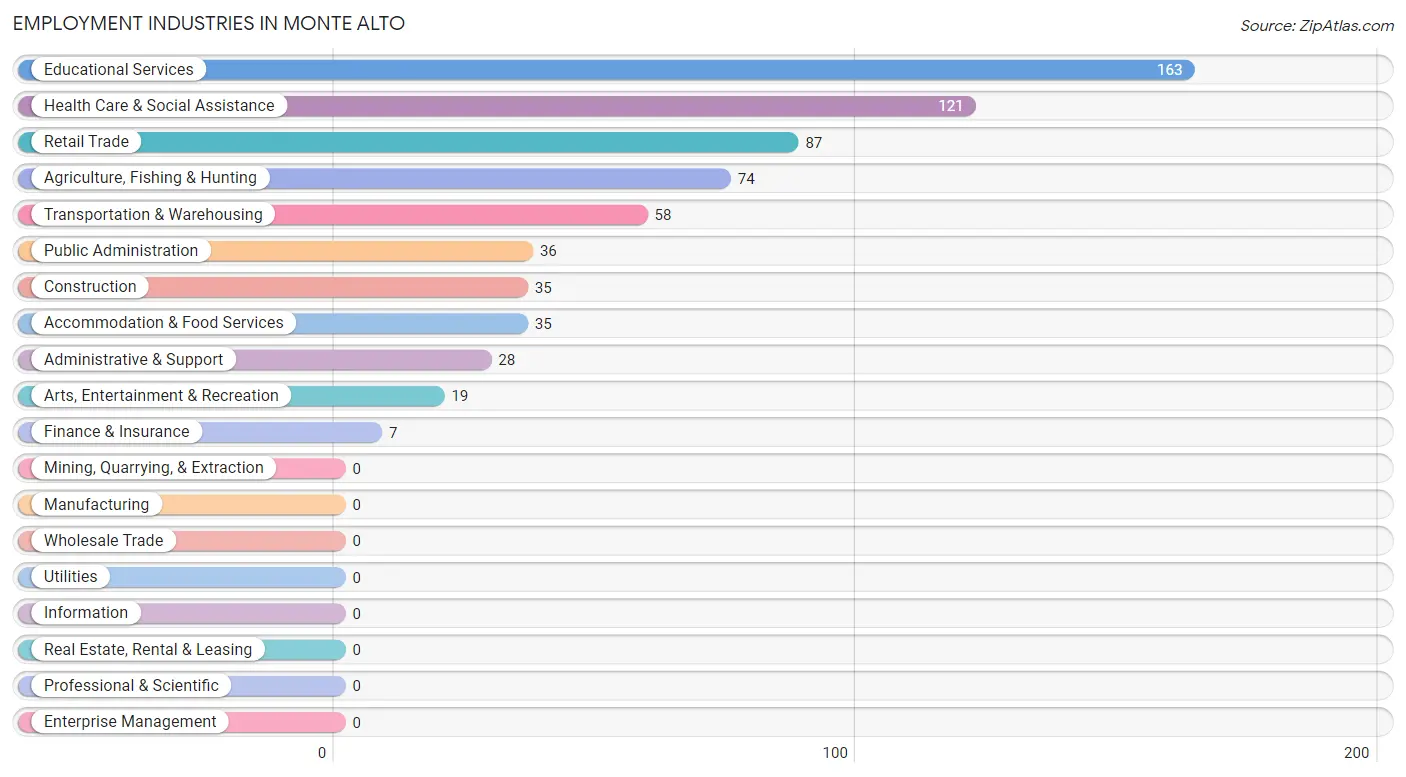
Employment Industries in Monte Alto
The major employment industries in Monte Alto include Educational Services (163 | 23.3%), Health Care & Social Assistance (121 | 17.3%), Retail Trade (87 | 12.4%), Agriculture, Fishing & Hunting (74 | 10.6%), and Transportation & Warehousing (58 | 8.3%).
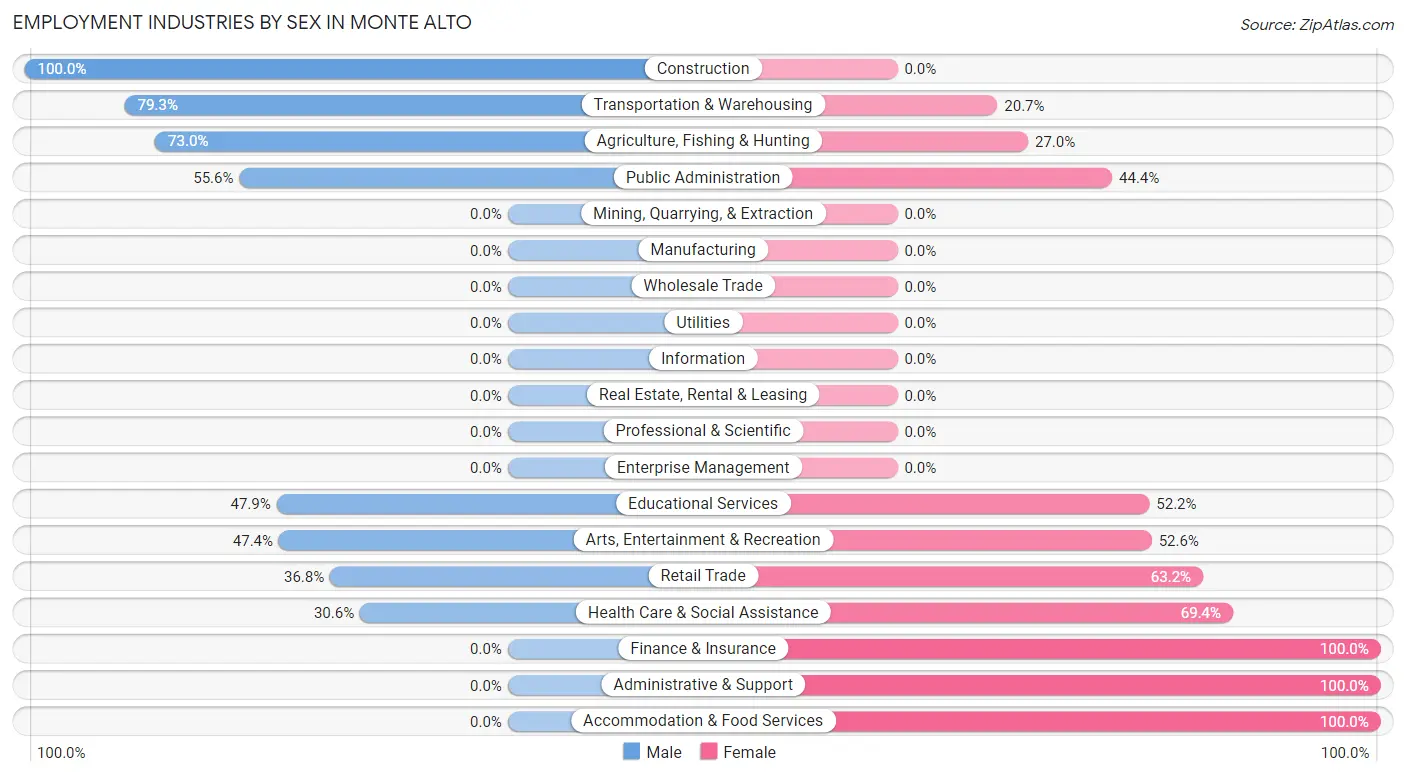
Employment Industries by Sex in Monte Alto
The Monte Alto industries that see more men than women are Construction (100.0%), Transportation & Warehousing (79.3%), and Agriculture, Fishing & Hunting (73.0%), whereas the industries that tend to have a higher number of women are Finance & Insurance (100.0%), Administrative & Support (100.0%), and Accommodation & Food Services (100.0%).
| Industry | Male | Female |
| Agriculture, Fishing & Hunting | 54 (73.0%) | 20 (27.0%) |
| Mining, Quarrying, & Extraction | 0 (0.0%) | 0 (0.0%) |
| Construction | 35 (100.0%) | 0 (0.0%) |
| Manufacturing | 0 (0.0%) | 0 (0.0%) |
| Wholesale Trade | 0 (0.0%) | 0 (0.0%) |
| Retail Trade | 32 (36.8%) | 55 (63.2%) |
| Transportation & Warehousing | 46 (79.3%) | 12 (20.7%) |
| Utilities | 0 (0.0%) | 0 (0.0%) |
| Information | 0 (0.0%) | 0 (0.0%) |
| Finance & Insurance | 0 (0.0%) | 7 (100.0%) |
| Real Estate, Rental & Leasing | 0 (0.0%) | 0 (0.0%) |
| Professional & Scientific | 0 (0.0%) | 0 (0.0%) |
| Enterprise Management | 0 (0.0%) | 0 (0.0%) |
| Administrative & Support | 0 (0.0%) | 28 (100.0%) |
| Educational Services | 78 (47.8%) | 85 (52.1%) |
| Health Care & Social Assistance | 37 (30.6%) | 84 (69.4%) |
| Arts, Entertainment & Recreation | 9 (47.4%) | 10 (52.6%) |
| Accommodation & Food Services | 0 (0.0%) | 35 (100.0%) |
| Public Administration | 20 (55.6%) | 16 (44.4%) |
| Total | 341 (48.6%) | 360 (51.4%) |
Education in Monte Alto
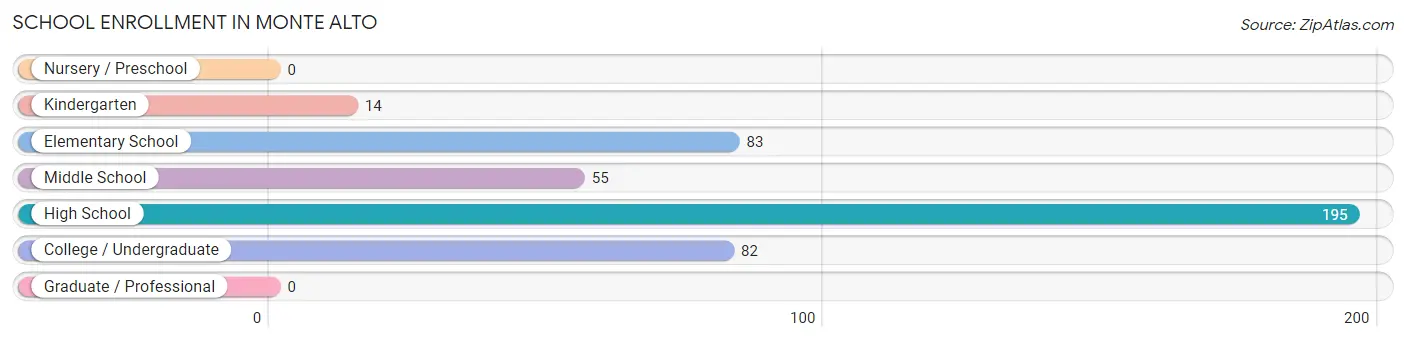
School Enrollment in Monte Alto
The most common levels of schooling among the 429 students in Monte Alto are high school (195 | 45.5%), elementary school (83 | 19.4%), and college / undergraduate (82 | 19.1%).
| School Level | # Students | % Students |
| Nursery / Preschool | 0 | 0.0% |
| Kindergarten | 14 | 3.3% |
| Elementary School | 83 | 19.4% |
| Middle School | 55 | 12.8% |
| High School | 195 | 45.5% |
| College / Undergraduate | 82 | 19.1% |
| Graduate / Professional | 0 | 0.0% |
| Total | 429 | 100.0% |
School Enrollment by Age by Funding Source in Monte Alto
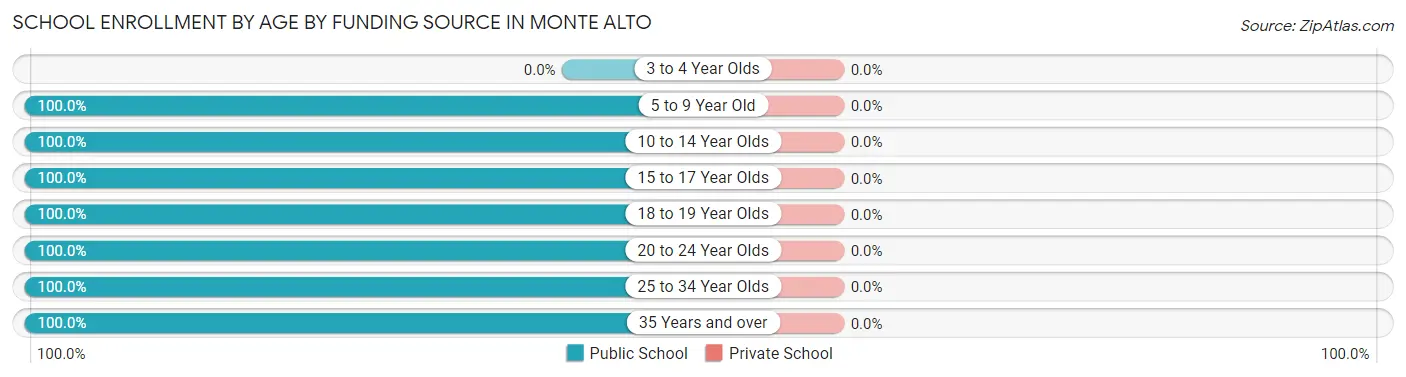
| Age Bracket | Public School | Private School |
| 3 to 4 Year Olds | 0 (0.0%) | 0 (0.0%) |
| 5 to 9 Year Old | 84 (100.0%) | 0 (0.0%) |
| 10 to 14 Year Olds | 87 (100.0%) | 0 (0.0%) |
| 15 to 17 Year Olds | 167 (100.0%) | 0 (0.0%) |
| 18 to 19 Year Olds | 9 (100.0%) | 0 (0.0%) |
| 20 to 24 Year Olds | 51 (100.0%) | 0 (0.0%) |
| 25 to 34 Year Olds | 29 (100.0%) | 0 (0.0%) |
| 35 Years and over | 2 (100.0%) | 0 (0.0%) |
| Total | 429 (100.0%) | 0 (0.0%) |
Educational Attainment by Field of Study in Monte Alto
Science & technology (76 | 37.1%), business (75 | 36.6%), arts & humanities (32 | 15.6%), visual & performing arts (13 | 6.3%), and social sciences (9 | 4.4%) are the most common fields of study among 205 individuals in Monte Alto who have obtained a bachelor's degree or higher.
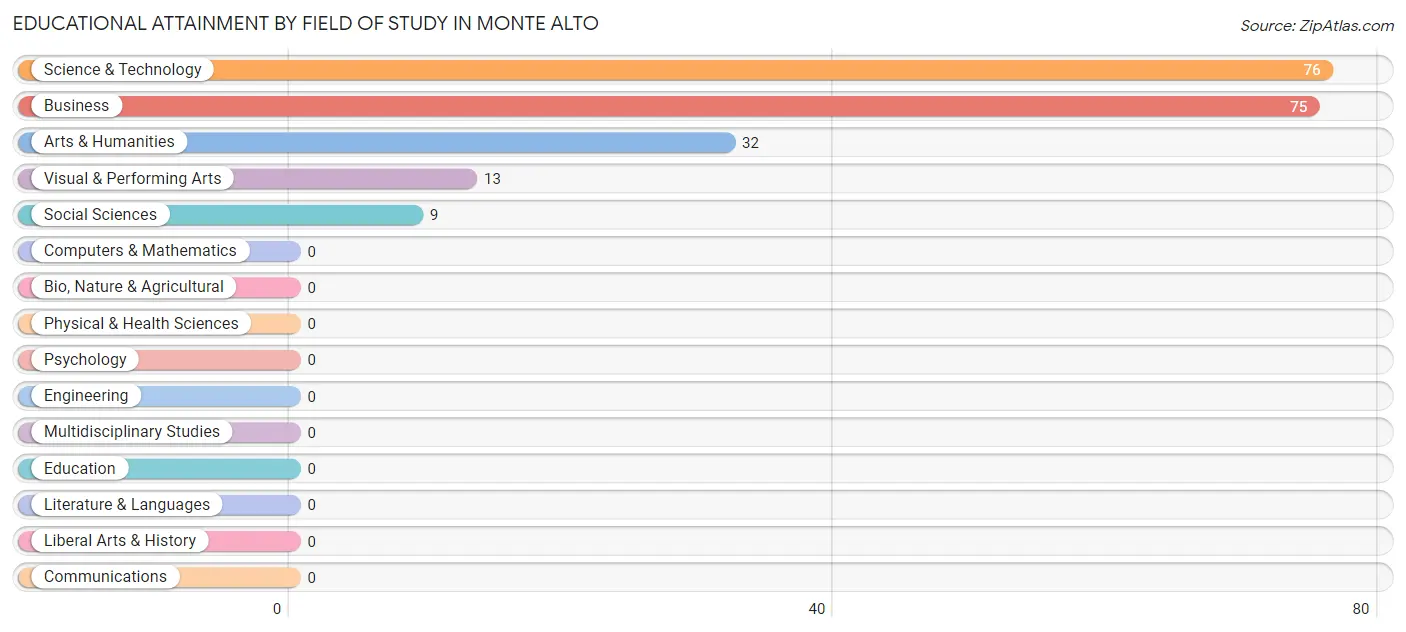
| Field of Study | # Graduates | % Graduates |
| Computers & Mathematics | 0 | 0.0% |
| Bio, Nature & Agricultural | 0 | 0.0% |
| Physical & Health Sciences | 0 | 0.0% |
| Psychology | 0 | 0.0% |
| Social Sciences | 9 | 4.4% |
| Engineering | 0 | 0.0% |
| Multidisciplinary Studies | 0 | 0.0% |
| Science & Technology | 76 | 37.1% |
| Business | 75 | 36.6% |
| Education | 0 | 0.0% |
| Literature & Languages | 0 | 0.0% |
| Liberal Arts & History | 0 | 0.0% |
| Visual & Performing Arts | 13 | 6.3% |
| Communications | 0 | 0.0% |
| Arts & Humanities | 32 | 15.6% |
| Total | 205 | 100.0% |
Transportation & Commute in Monte Alto
Vehicle Availability by Sex in Monte Alto
The most prevalent vehicle ownership categories in Monte Alto are males with 2 vehicles (110, accounting for 32.3%) and females with 2 vehicles (115, making up 32.3%).
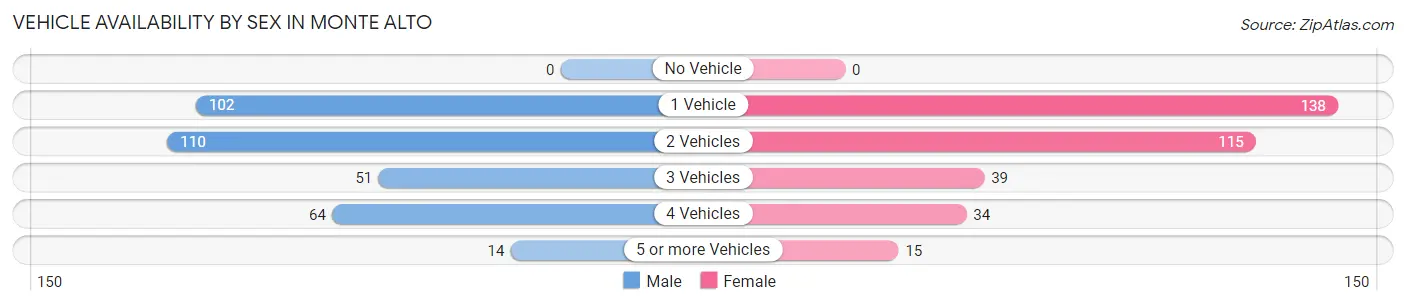
| Vehicles Available | Male | Female |
| No Vehicle | 0 (0.0%) | 0 (0.0%) |
| 1 Vehicle | 102 (29.9%) | 138 (40.5%) |
| 2 Vehicles | 110 (32.3%) | 115 (33.7%) |
| 3 Vehicles | 51 (15.0%) | 39 (11.4%) |
| 4 Vehicles | 64 (18.8%) | 34 (10.0%) |
| 5 or more Vehicles | 14 (4.1%) | 15 (4.4%) |
| Total | 341 (100.0%) | 341 (100.0%) |
Commute Time in Monte Alto
The most frequently occuring commute durations in Monte Alto are less than 5 minutes (107 commuters, 15.7%), 25 to 29 minutes (99 commuters, 14.5%), and 5 to 9 minutes (92 commuters, 13.5%).
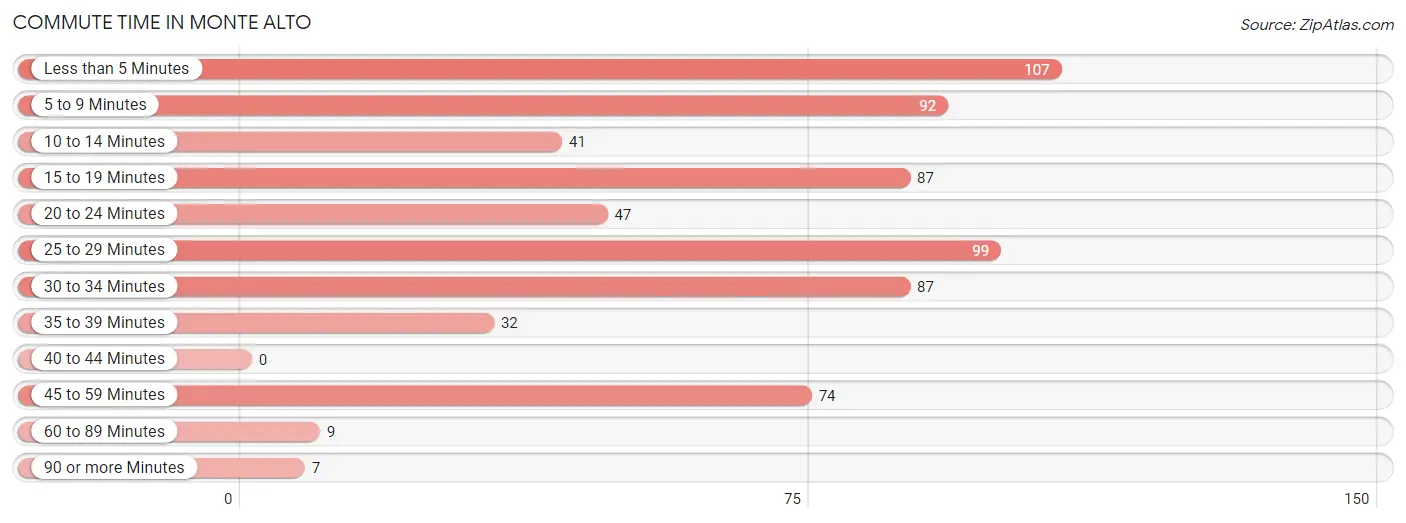
| Commute Time | # Commuters | % Commuters |
| Less than 5 Minutes | 107 | 15.7% |
| 5 to 9 Minutes | 92 | 13.5% |
| 10 to 14 Minutes | 41 | 6.0% |
| 15 to 19 Minutes | 87 | 12.8% |
| 20 to 24 Minutes | 47 | 6.9% |
| 25 to 29 Minutes | 99 | 14.5% |
| 30 to 34 Minutes | 87 | 12.8% |
| 35 to 39 Minutes | 32 | 4.7% |
| 40 to 44 Minutes | 0 | 0.0% |
| 45 to 59 Minutes | 74 | 10.8% |
| 60 to 89 Minutes | 9 | 1.3% |
| 90 or more Minutes | 7 | 1.0% |
Commute Time by Sex in Monte Alto
The most common commute times in Monte Alto are 25 to 29 minutes (67 commuters, 19.7%) for males and less than 5 minutes (84 commuters, 24.6%) for females.
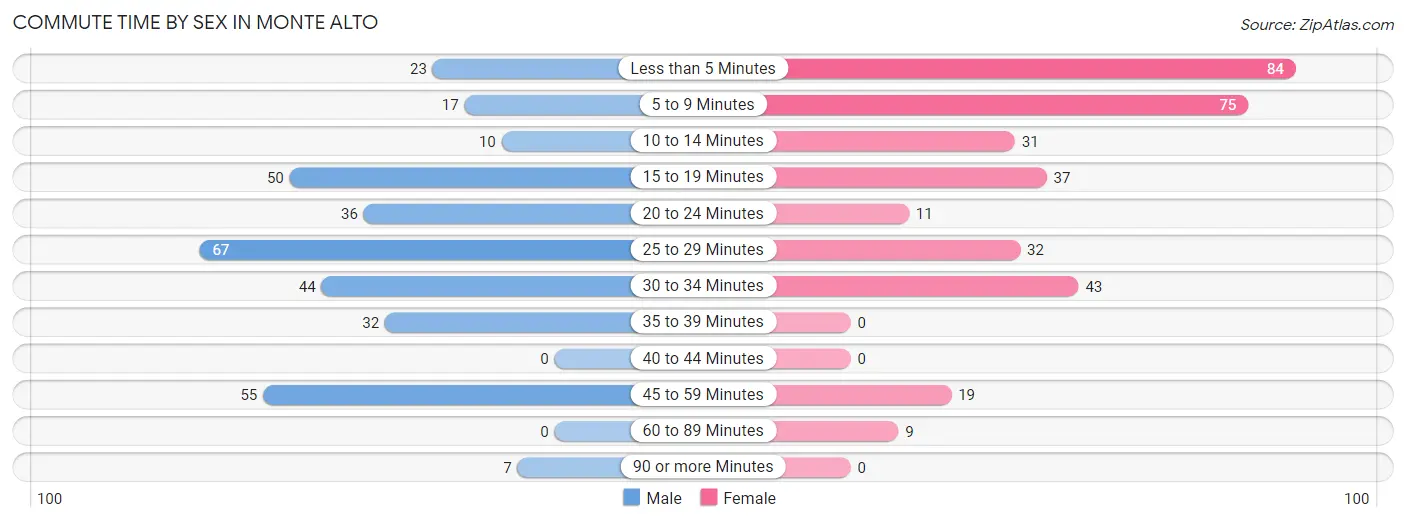
| Commute Time | Male | Female |
| Less than 5 Minutes | 23 (6.7%) | 84 (24.6%) |
| 5 to 9 Minutes | 17 (5.0%) | 75 (22.0%) |
| 10 to 14 Minutes | 10 (2.9%) | 31 (9.1%) |
| 15 to 19 Minutes | 50 (14.7%) | 37 (10.8%) |
| 20 to 24 Minutes | 36 (10.6%) | 11 (3.2%) |
| 25 to 29 Minutes | 67 (19.7%) | 32 (9.4%) |
| 30 to 34 Minutes | 44 (12.9%) | 43 (12.6%) |
| 35 to 39 Minutes | 32 (9.4%) | 0 (0.0%) |
| 40 to 44 Minutes | 0 (0.0%) | 0 (0.0%) |
| 45 to 59 Minutes | 55 (16.1%) | 19 (5.6%) |
| 60 to 89 Minutes | 0 (0.0%) | 9 (2.6%) |
| 90 or more Minutes | 7 (2.1%) | 0 (0.0%) |
Time of Departure to Work by Sex in Monte Alto
The most frequent times of departure to work in Monte Alto are 6:00 AM to 6:29 AM (88, 25.8%) for males and 7:00 AM to 7:29 AM (83, 24.3%) for females.
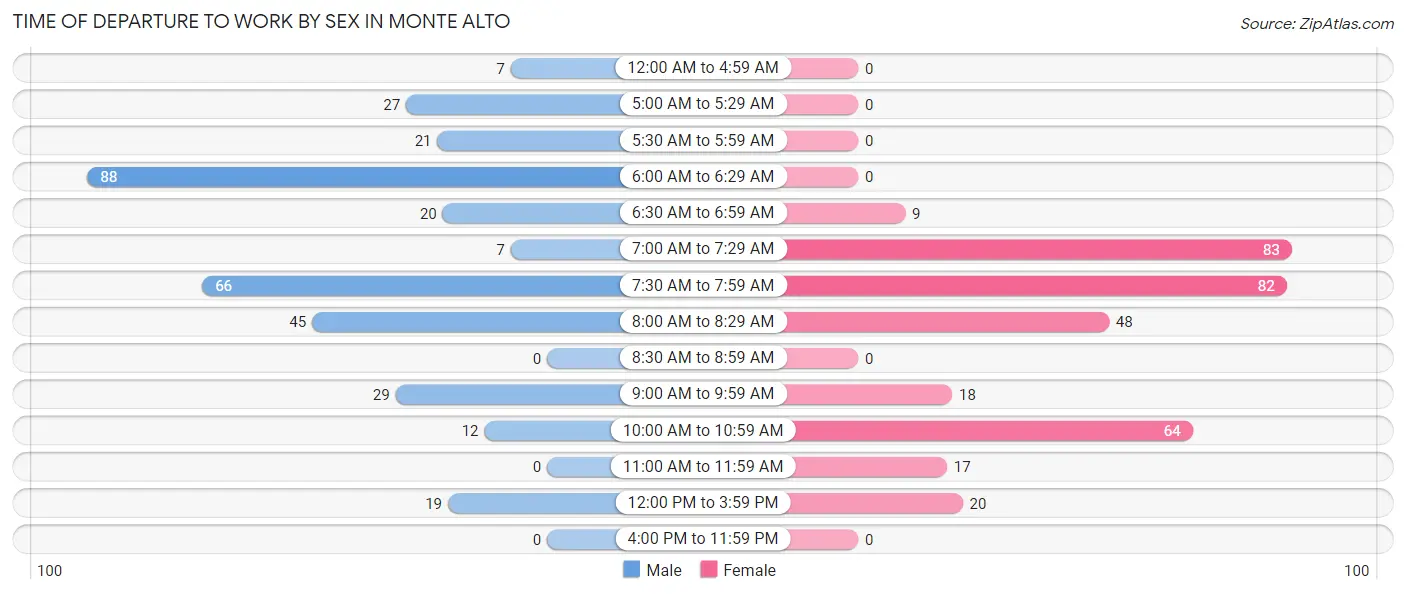
| Time of Departure | Male | Female |
| 12:00 AM to 4:59 AM | 7 (2.1%) | 0 (0.0%) |
| 5:00 AM to 5:29 AM | 27 (7.9%) | 0 (0.0%) |
| 5:30 AM to 5:59 AM | 21 (6.2%) | 0 (0.0%) |
| 6:00 AM to 6:29 AM | 88 (25.8%) | 0 (0.0%) |
| 6:30 AM to 6:59 AM | 20 (5.9%) | 9 (2.6%) |
| 7:00 AM to 7:29 AM | 7 (2.1%) | 83 (24.3%) |
| 7:30 AM to 7:59 AM | 66 (19.4%) | 82 (24.0%) |
| 8:00 AM to 8:29 AM | 45 (13.2%) | 48 (14.1%) |
| 8:30 AM to 8:59 AM | 0 (0.0%) | 0 (0.0%) |
| 9:00 AM to 9:59 AM | 29 (8.5%) | 18 (5.3%) |
| 10:00 AM to 10:59 AM | 12 (3.5%) | 64 (18.8%) |
| 11:00 AM to 11:59 AM | 0 (0.0%) | 17 (5.0%) |
| 12:00 PM to 3:59 PM | 19 (5.6%) | 20 (5.9%) |
| 4:00 PM to 11:59 PM | 0 (0.0%) | 0 (0.0%) |
| Total | 341 (100.0%) | 341 (100.0%) |
Housing Occupancy in Monte Alto
Occupancy by Ownership in Monte Alto
Of the total 544 dwellings in Monte Alto, owner-occupied units account for 490 (90.1%), while renter-occupied units make up 54 (9.9%).
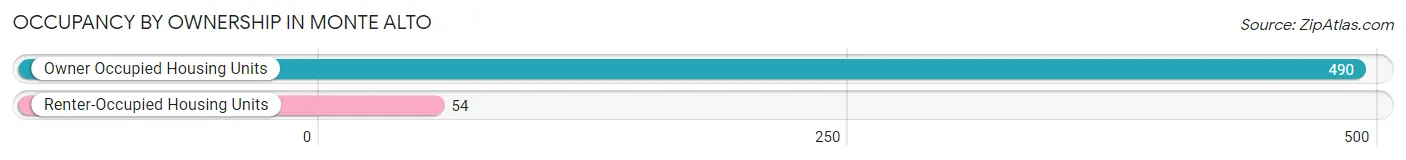
| Occupancy | # Housing Units | % Housing Units |
| Owner Occupied Housing Units | 490 | 90.1% |
| Renter-Occupied Housing Units | 54 | 9.9% |
| Total Occupied Housing Units | 544 | 100.0% |
Occupancy by Household Size in Monte Alto
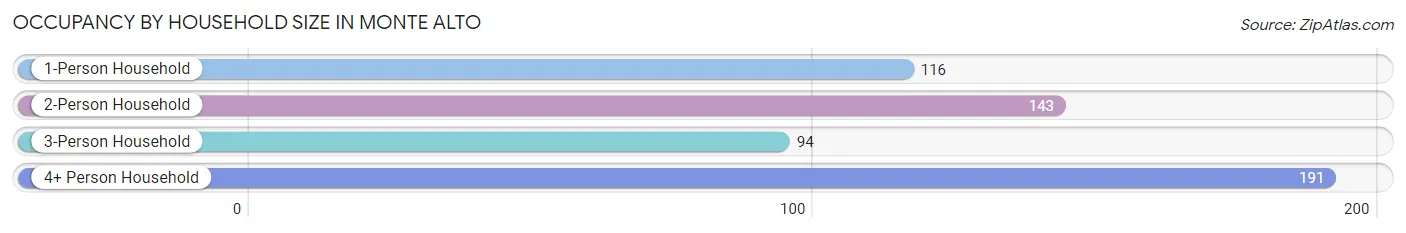
| Household Size | # Housing Units | % Housing Units |
| 1-Person Household | 116 | 21.3% |
| 2-Person Household | 143 | 26.3% |
| 3-Person Household | 94 | 17.3% |
| 4+ Person Household | 191 | 35.1% |
| Total Housing Units | 544 | 100.0% |
Occupancy by Ownership by Household Size in Monte Alto
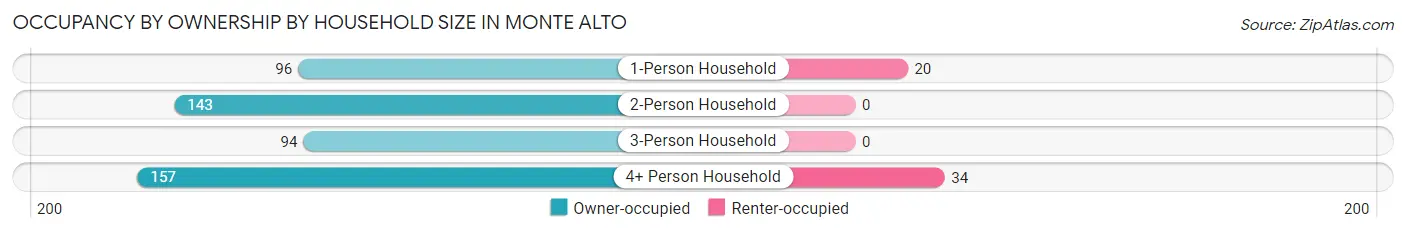
| Household Size | Owner-occupied | Renter-occupied |
| 1-Person Household | 96 (82.8%) | 20 (17.2%) |
| 2-Person Household | 143 (100.0%) | 0 (0.0%) |
| 3-Person Household | 94 (100.0%) | 0 (0.0%) |
| 4+ Person Household | 157 (82.2%) | 34 (17.8%) |
| Total Housing Units | 490 (90.1%) | 54 (9.9%) |
Occupancy by Educational Attainment in Monte Alto
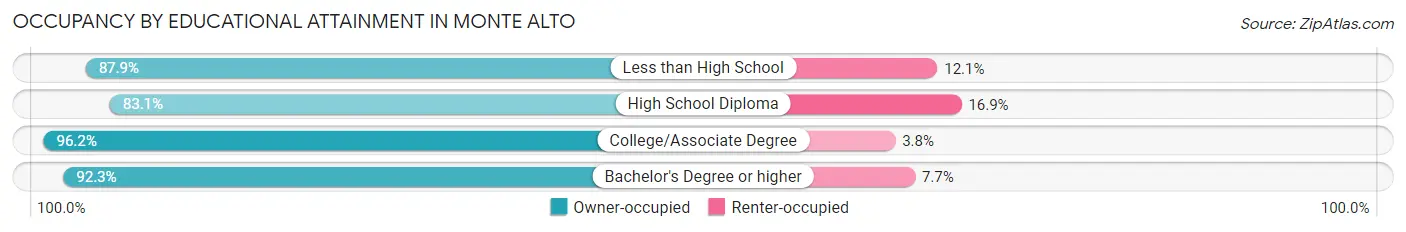
| Household Size | Owner-occupied | Renter-occupied |
| Less than High School | 116 (87.9%) | 16 (12.1%) |
| High School Diploma | 113 (83.1%) | 23 (16.9%) |
| College/Associate Degree | 153 (96.2%) | 6 (3.8%) |
| Bachelor's Degree or higher | 108 (92.3%) | 9 (7.7%) |
Occupancy by Age of Householder in Monte Alto
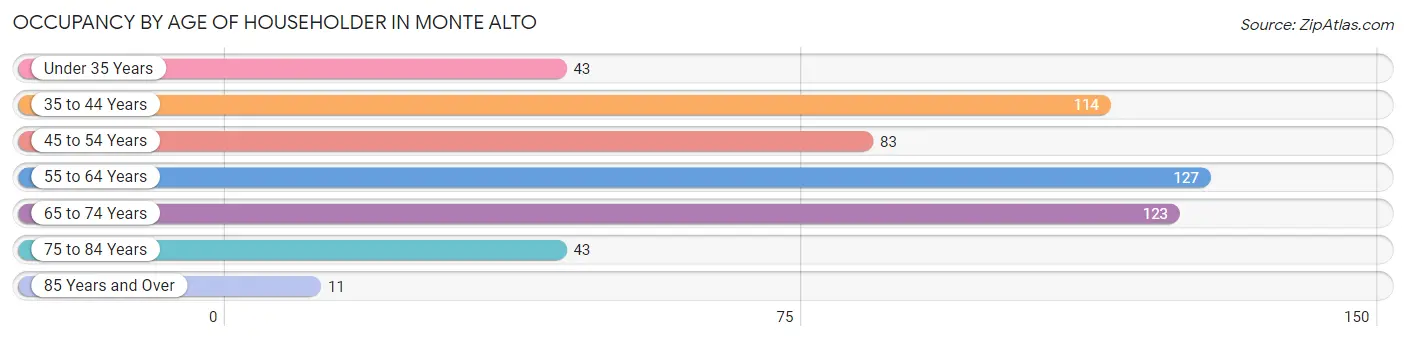
| Age Bracket | # Households | % Households |
| Under 35 Years | 43 | 7.9% |
| 35 to 44 Years | 114 | 21.0% |
| 45 to 54 Years | 83 | 15.3% |
| 55 to 64 Years | 127 | 23.4% |
| 65 to 74 Years | 123 | 22.6% |
| 75 to 84 Years | 43 | 7.9% |
| 85 Years and Over | 11 | 2.0% |
| Total | 544 | 100.0% |
Housing Finances in Monte Alto
Median Income by Occupancy in Monte Alto
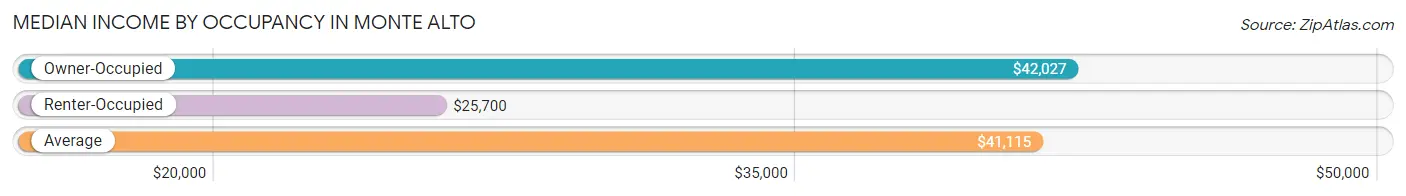
| Occupancy Type | # Households | Median Income |
| Owner-Occupied | 490 (90.1%) | $42,027 |
| Renter-Occupied | 54 (9.9%) | $25,700 |
| Average | 544 (100.0%) | $41,115 |
Occupancy by Householder Income Bracket in Monte Alto
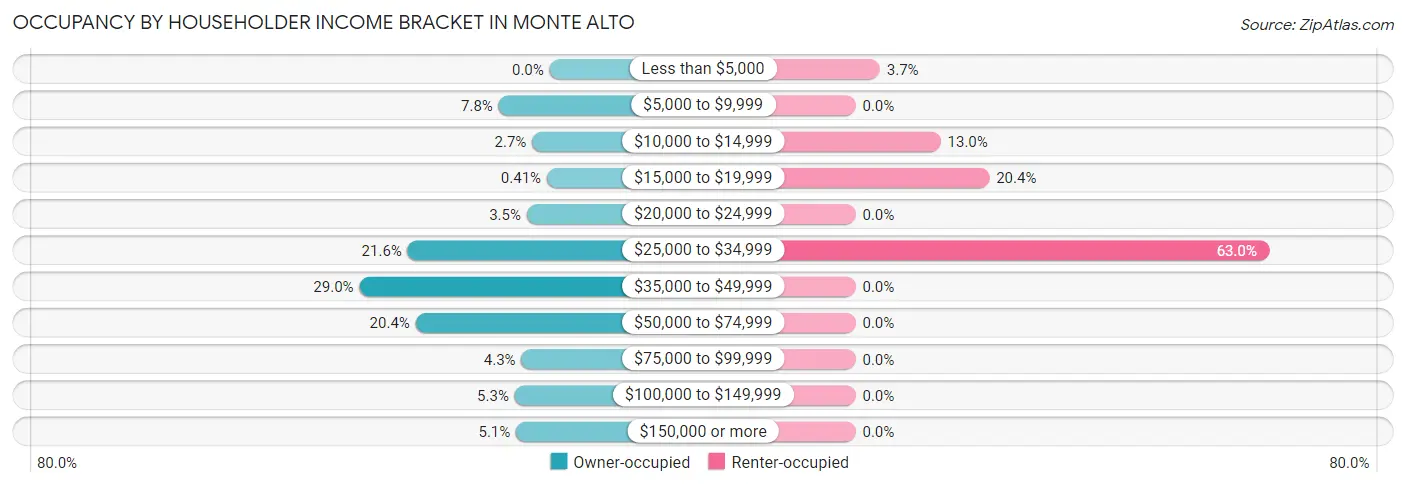
| Income Bracket | Owner-occupied | Renter-occupied |
| Less than $5,000 | 0 (0.0%) | 2 (3.7%) |
| $5,000 to $9,999 | 38 (7.8%) | 0 (0.0%) |
| $10,000 to $14,999 | 13 (2.6%) | 7 (13.0%) |
| $15,000 to $19,999 | 2 (0.4%) | 11 (20.4%) |
| $20,000 to $24,999 | 17 (3.5%) | 0 (0.0%) |
| $25,000 to $34,999 | 106 (21.6%) | 34 (63.0%) |
| $35,000 to $49,999 | 142 (29.0%) | 0 (0.0%) |
| $50,000 to $74,999 | 100 (20.4%) | 0 (0.0%) |
| $75,000 to $99,999 | 21 (4.3%) | 0 (0.0%) |
| $100,000 to $149,999 | 26 (5.3%) | 0 (0.0%) |
| $150,000 or more | 25 (5.1%) | 0 (0.0%) |
| Total | 490 (100.0%) | 54 (100.0%) |
Monthly Housing Cost Tiers in Monte Alto
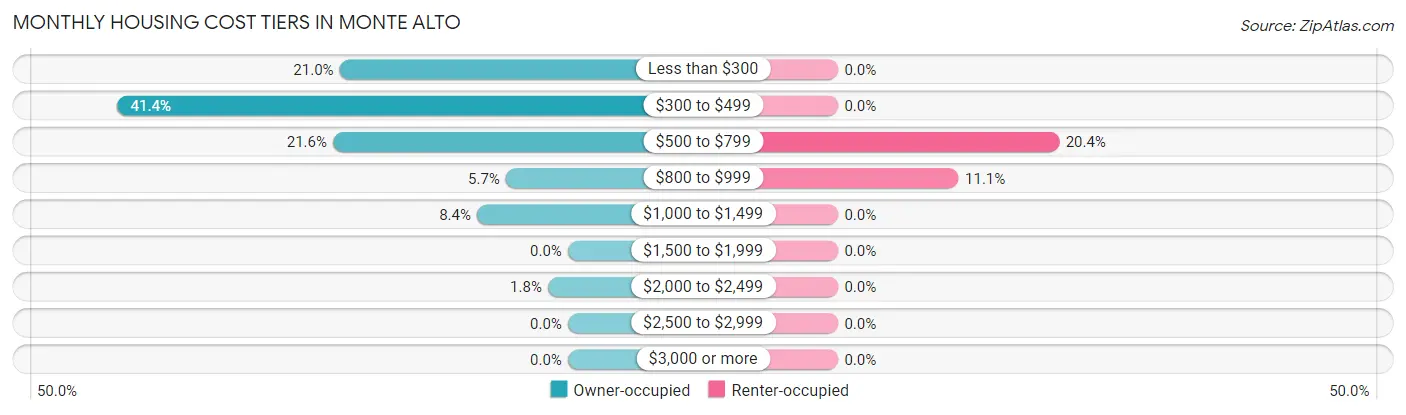
| Monthly Cost | Owner-occupied | Renter-occupied |
| Less than $300 | 103 (21.0%) | 0 (0.0%) |
| $300 to $499 | 203 (41.4%) | 0 (0.0%) |
| $500 to $799 | 106 (21.6%) | 11 (20.4%) |
| $800 to $999 | 28 (5.7%) | 6 (11.1%) |
| $1,000 to $1,499 | 41 (8.4%) | 0 (0.0%) |
| $1,500 to $1,999 | 0 (0.0%) | 0 (0.0%) |
| $2,000 to $2,499 | 9 (1.8%) | 0 (0.0%) |
| $2,500 to $2,999 | 0 (0.0%) | 0 (0.0%) |
| $3,000 or more | 0 (0.0%) | 0 (0.0%) |
| Total | 490 (100.0%) | 54 (100.0%) |
Physical Housing Characteristics in Monte Alto
Housing Structures in Monte Alto
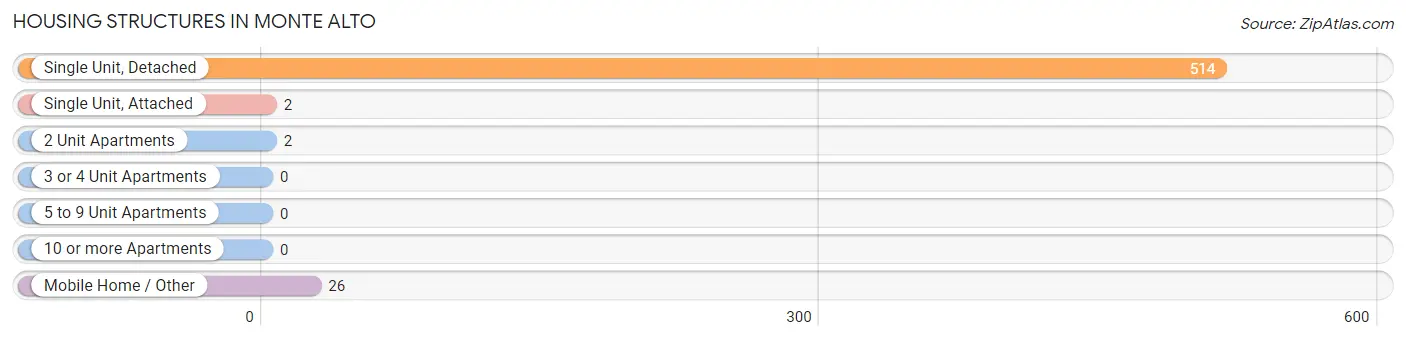
| Structure Type | # Housing Units | % Housing Units |
| Single Unit, Detached | 514 | 94.5% |
| Single Unit, Attached | 2 | 0.4% |
| 2 Unit Apartments | 2 | 0.4% |
| 3 or 4 Unit Apartments | 0 | 0.0% |
| 5 to 9 Unit Apartments | 0 | 0.0% |
| 10 or more Apartments | 0 | 0.0% |
| Mobile Home / Other | 26 | 4.8% |
| Total | 544 | 100.0% |
Housing Structures by Occupancy in Monte Alto
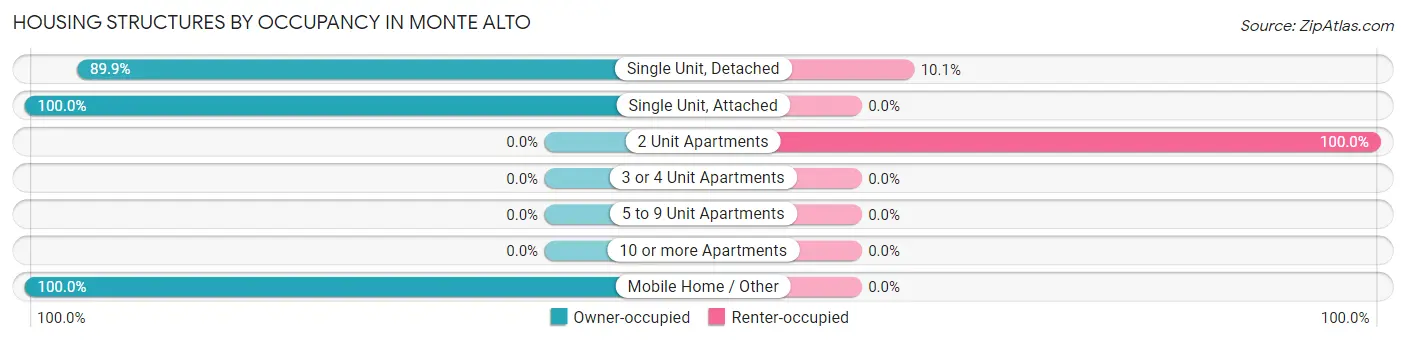
| Structure Type | Owner-occupied | Renter-occupied |
| Single Unit, Detached | 462 (89.9%) | 52 (10.1%) |
| Single Unit, Attached | 2 (100.0%) | 0 (0.0%) |
| 2 Unit Apartments | 0 (0.0%) | 2 (100.0%) |
| 3 or 4 Unit Apartments | 0 (0.0%) | 0 (0.0%) |
| 5 to 9 Unit Apartments | 0 (0.0%) | 0 (0.0%) |
| 10 or more Apartments | 0 (0.0%) | 0 (0.0%) |
| Mobile Home / Other | 26 (100.0%) | 0 (0.0%) |
| Total | 490 (90.1%) | 54 (9.9%) |
Housing Structures by Number of Rooms in Monte Alto
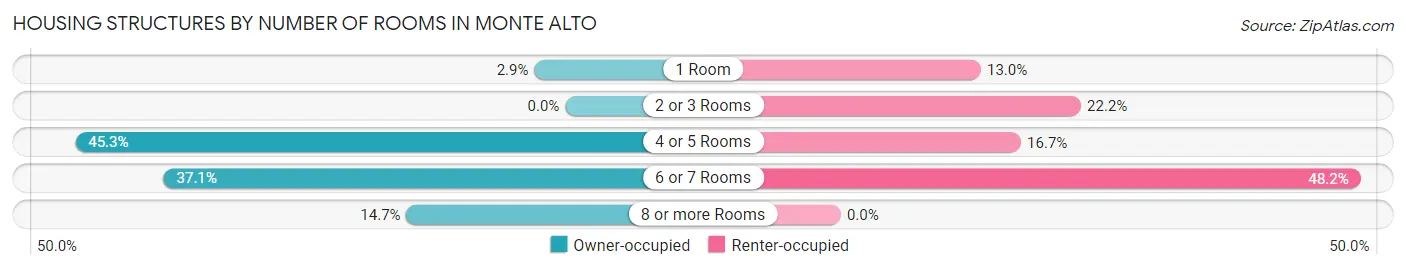
| Number of Rooms | Owner-occupied | Renter-occupied |
| 1 Room | 14 (2.9%) | 7 (13.0%) |
| 2 or 3 Rooms | 0 (0.0%) | 12 (22.2%) |
| 4 or 5 Rooms | 222 (45.3%) | 9 (16.7%) |
| 6 or 7 Rooms | 182 (37.1%) | 26 (48.1%) |
| 8 or more Rooms | 72 (14.7%) | 0 (0.0%) |
| Total | 490 (100.0%) | 54 (100.0%) |
Housing Structure by Heating Type in Monte Alto
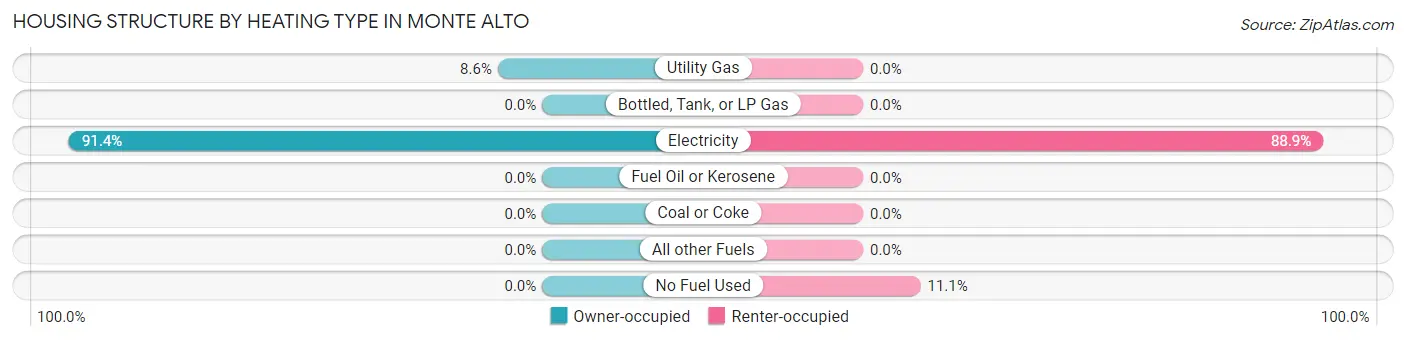
| Heating Type | Owner-occupied | Renter-occupied |
| Utility Gas | 42 (8.6%) | 0 (0.0%) |
| Bottled, Tank, or LP Gas | 0 (0.0%) | 0 (0.0%) |
| Electricity | 448 (91.4%) | 48 (88.9%) |
| Fuel Oil or Kerosene | 0 (0.0%) | 0 (0.0%) |
| Coal or Coke | 0 (0.0%) | 0 (0.0%) |
| All other Fuels | 0 (0.0%) | 0 (0.0%) |
| No Fuel Used | 0 (0.0%) | 6 (11.1%) |
| Total | 490 (100.0%) | 54 (100.0%) |
Household Vehicle Usage in Monte Alto
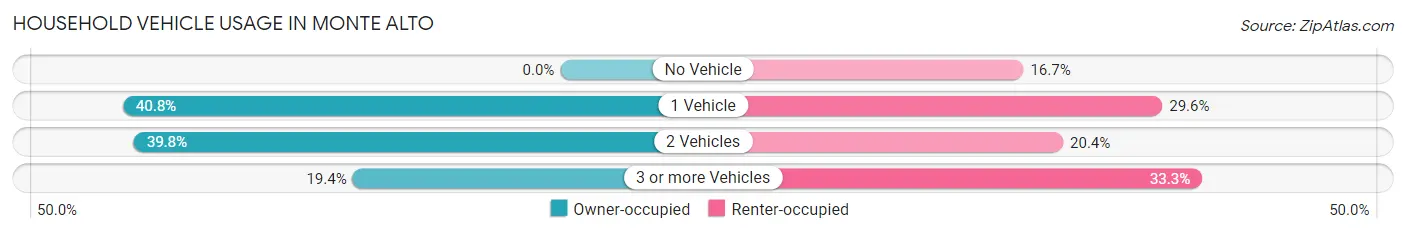
| Vehicles per Household | Owner-occupied | Renter-occupied |
| No Vehicle | 0 (0.0%) | 9 (16.7%) |
| 1 Vehicle | 200 (40.8%) | 16 (29.6%) |
| 2 Vehicles | 195 (39.8%) | 11 (20.4%) |
| 3 or more Vehicles | 95 (19.4%) | 18 (33.3%) |
| Total | 490 (100.0%) | 54 (100.0%) |
Real Estate & Mortgages in Monte Alto
Real Estate and Mortgage Overview in Monte Alto
| Characteristic | Without Mortgage | With Mortgage |
| Housing Units | 371 | 119 |
| Median Property Value | $63,800 | $93,100 |
| Median Household Income | $42,416 | $0 |
| Monthly Housing Costs | $353 | $0 |
| Real Estate Taxes | $808 | $0 |
Property Value by Mortgage Status in Monte Alto
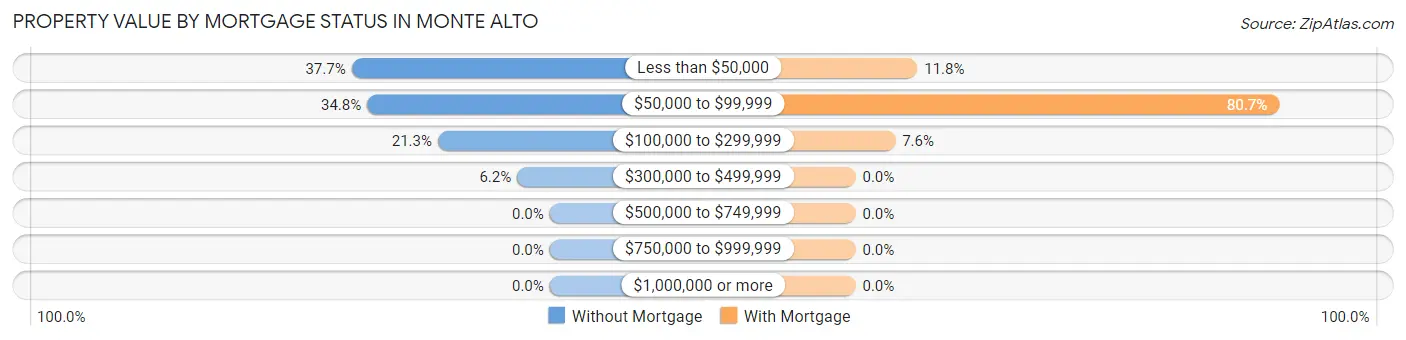
| Property Value | Without Mortgage | With Mortgage |
| Less than $50,000 | 140 (37.7%) | 14 (11.8%) |
| $50,000 to $99,999 | 129 (34.8%) | 96 (80.7%) |
| $100,000 to $299,999 | 79 (21.3%) | 9 (7.6%) |
| $300,000 to $499,999 | 23 (6.2%) | 0 (0.0%) |
| $500,000 to $749,999 | 0 (0.0%) | 0 (0.0%) |
| $750,000 to $999,999 | 0 (0.0%) | 0 (0.0%) |
| $1,000,000 or more | 0 (0.0%) | 0 (0.0%) |
| Total | 371 (100.0%) | 119 (100.0%) |
Household Income by Mortgage Status in Monte Alto
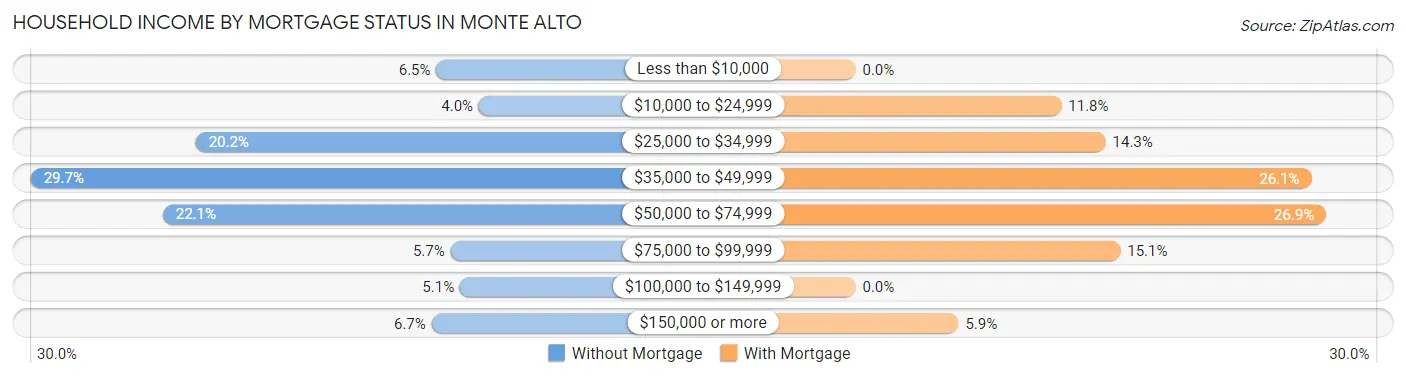
| Household Income | Without Mortgage | With Mortgage |
| Less than $10,000 | 24 (6.5%) | 0 (0.0%) |
| $10,000 to $24,999 | 15 (4.0%) | 14 (11.8%) |
| $25,000 to $34,999 | 75 (20.2%) | 17 (14.3%) |
| $35,000 to $49,999 | 110 (29.6%) | 31 (26.1%) |
| $50,000 to $74,999 | 82 (22.1%) | 32 (26.9%) |
| $75,000 to $99,999 | 21 (5.7%) | 18 (15.1%) |
| $100,000 to $149,999 | 19 (5.1%) | 0 (0.0%) |
| $150,000 or more | 25 (6.7%) | 7 (5.9%) |
| Total | 371 (100.0%) | 119 (100.0%) |
Property Value to Household Income Ratio in Monte Alto
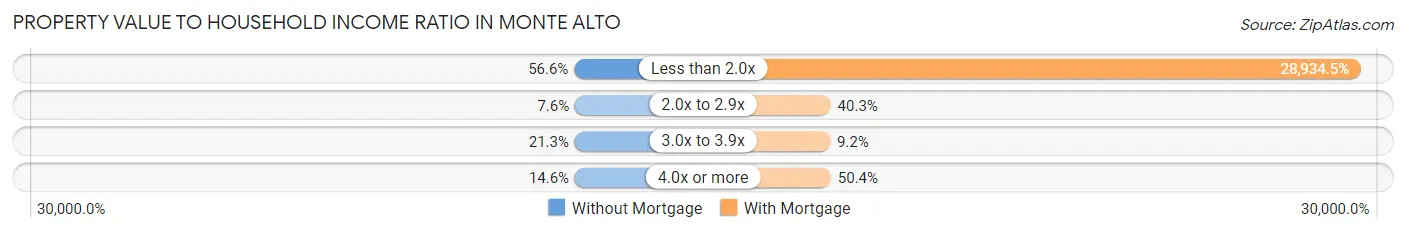
| Value-to-Income Ratio | Without Mortgage | With Mortgage |
| Less than 2.0x | 210 (56.6%) | 34,432 (28,934.4%) |
| 2.0x to 2.9x | 28 (7.5%) | 48 (40.3%) |
| 3.0x to 3.9x | 79 (21.3%) | 11 (9.2%) |
| 4.0x or more | 54 (14.6%) | 60 (50.4%) |
| Total | 371 (100.0%) | 119 (100.0%) |
Real Estate Taxes by Mortgage Status in Monte Alto
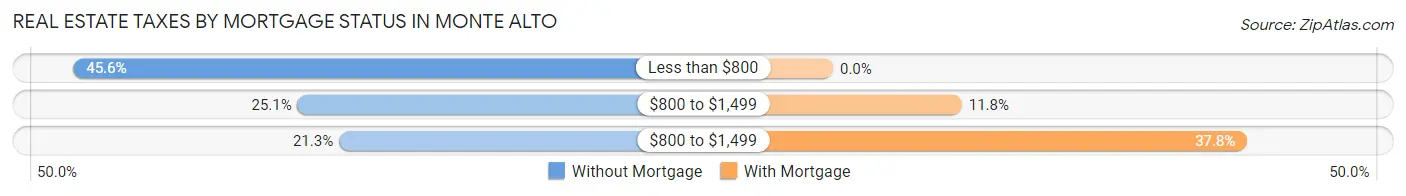
| Property Taxes | Without Mortgage | With Mortgage |
| Less than $800 | 169 (45.6%) | 0 (0.0%) |
| $800 to $1,499 | 93 (25.1%) | 14 (11.8%) |
| $800 to $1,499 | 79 (21.3%) | 45 (37.8%) |
| Total | 371 (100.0%) | 119 (100.0%) |
Health & Disability in Monte Alto
Health Insurance Coverage by Age in Monte Alto
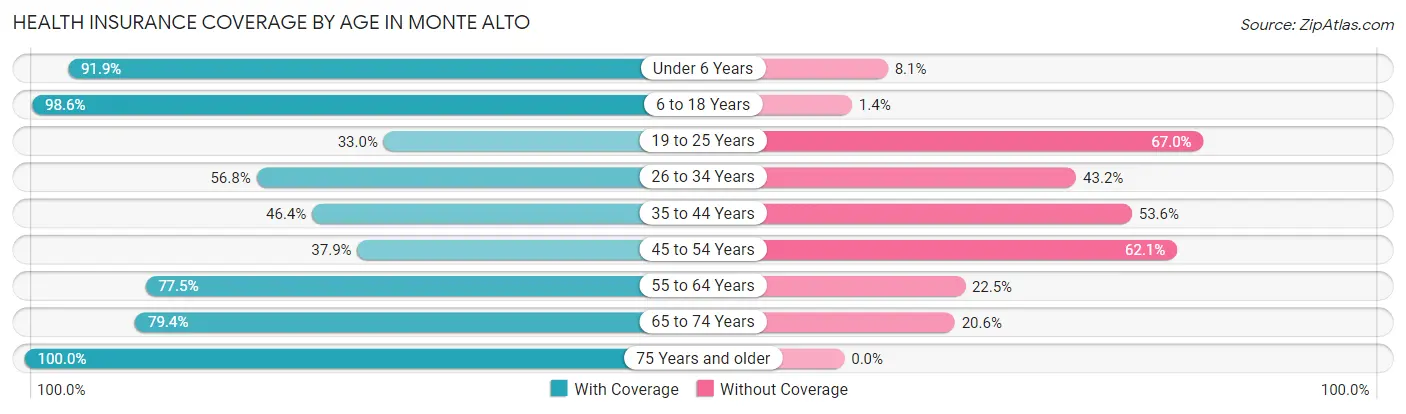
| Age Bracket | With Coverage | Without Coverage |
| Under 6 Years | 125 (91.9%) | 11 (8.1%) |
| 6 to 18 Years | 346 (98.6%) | 5 (1.4%) |
| 19 to 25 Years | 73 (33.0%) | 148 (67.0%) |
| 26 to 34 Years | 42 (56.8%) | 32 (43.2%) |
| 35 to 44 Years | 64 (46.4%) | 74 (53.6%) |
| 45 to 54 Years | 96 (37.9%) | 157 (62.1%) |
| 55 to 64 Years | 124 (77.5%) | 36 (22.5%) |
| 65 to 74 Years | 212 (79.4%) | 55 (20.6%) |
| 75 Years and older | 66 (100.0%) | 0 (0.0%) |
| Total | 1,148 (68.9%) | 518 (31.1%) |
Health Insurance Coverage by Citizenship Status in Monte Alto
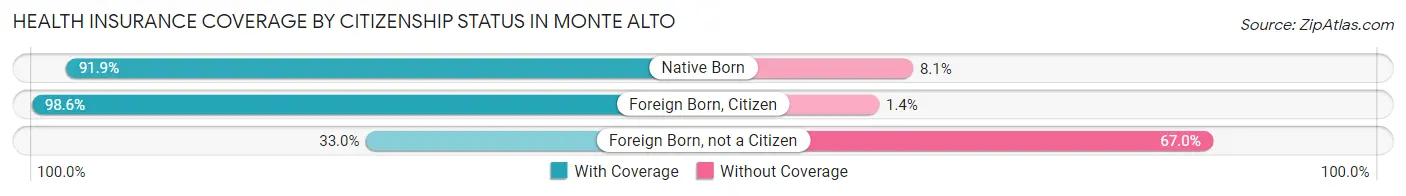
| Citizenship Status | With Coverage | Without Coverage |
| Native Born | 125 (91.9%) | 11 (8.1%) |
| Foreign Born, Citizen | 346 (98.6%) | 5 (1.4%) |
| Foreign Born, not a Citizen | 73 (33.0%) | 148 (67.0%) |
Health Insurance Coverage by Household Income in Monte Alto
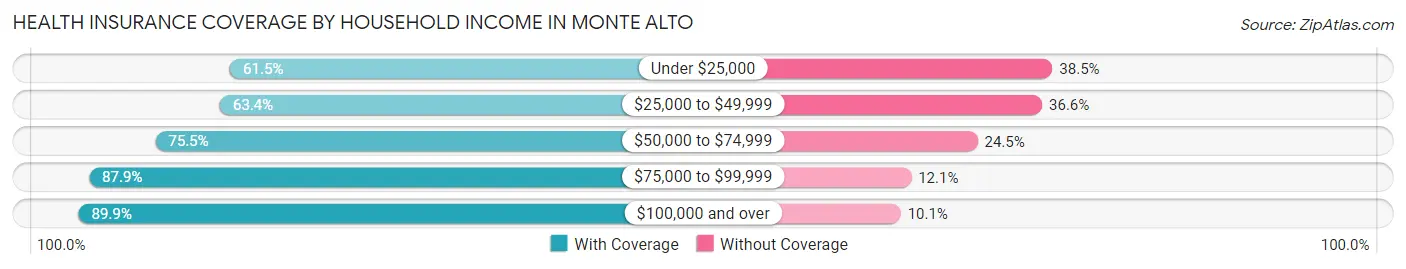
| Household Income | With Coverage | Without Coverage |
| Under $25,000 | 166 (61.5%) | 104 (38.5%) |
| $25,000 to $49,999 | 565 (63.4%) | 326 (36.6%) |
| $50,000 to $74,999 | 188 (75.5%) | 61 (24.5%) |
| $75,000 to $99,999 | 51 (87.9%) | 7 (12.1%) |
| $100,000 and over | 178 (89.9%) | 20 (10.1%) |
Public vs Private Health Insurance Coverage by Age in Monte Alto
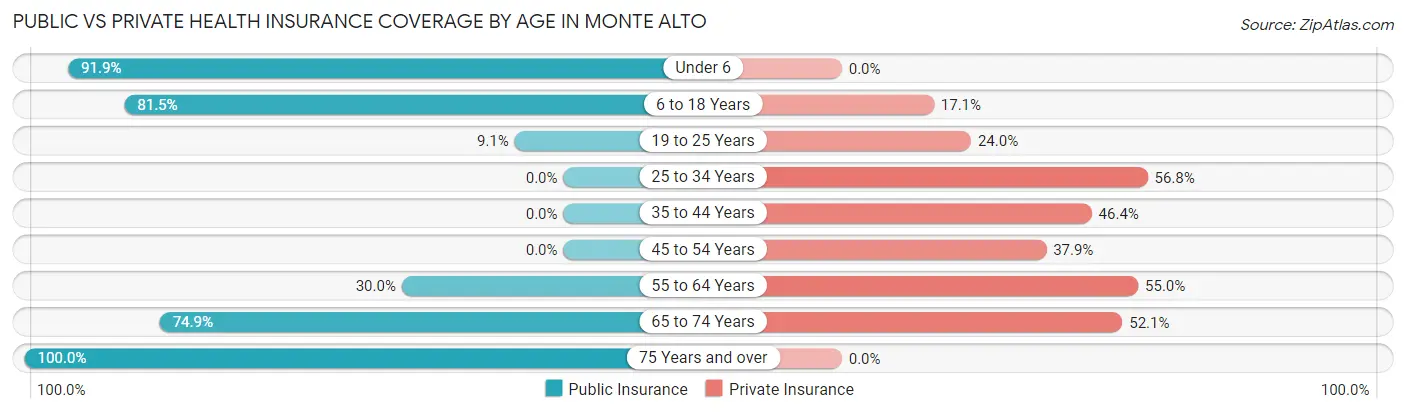
| Age Bracket | Public Insurance | Private Insurance |
| Under 6 | 125 (91.9%) | 0 (0.0%) |
| 6 to 18 Years | 286 (81.5%) | 60 (17.1%) |
| 19 to 25 Years | 20 (9.0%) | 53 (24.0%) |
| 25 to 34 Years | 0 (0.0%) | 42 (56.8%) |
| 35 to 44 Years | 0 (0.0%) | 64 (46.4%) |
| 45 to 54 Years | 0 (0.0%) | 96 (37.9%) |
| 55 to 64 Years | 48 (30.0%) | 88 (55.0%) |
| 65 to 74 Years | 200 (74.9%) | 139 (52.1%) |
| 75 Years and over | 66 (100.0%) | 0 (0.0%) |
| Total | 745 (44.7%) | 542 (32.5%) |
Disability Status by Sex by Age in Monte Alto
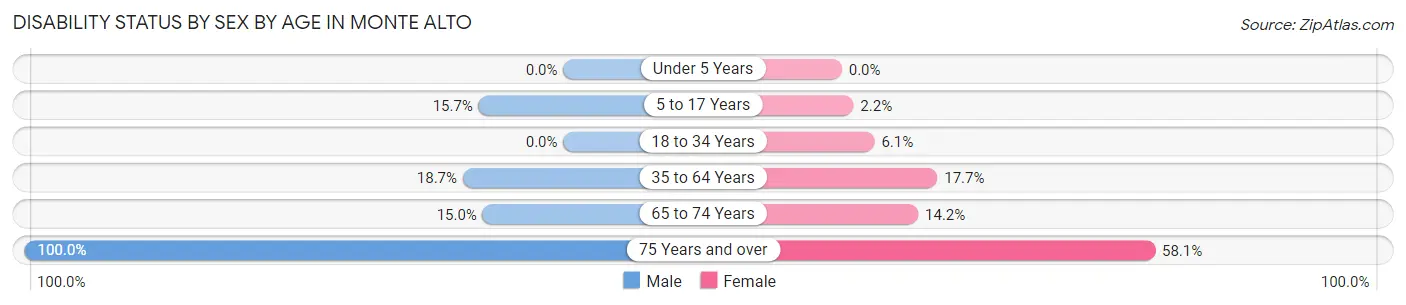
| Age Bracket | Male | Female |
| Under 5 Years | 0 (0.0%) | 0 (0.0%) |
| 5 to 17 Years | 33 (15.7%) | 3 (2.2%) |
| 18 to 34 Years | 0 (0.0%) | 13 (6.1%) |
| 35 to 64 Years | 47 (18.6%) | 53 (17.7%) |
| 65 to 74 Years | 22 (15.0%) | 17 (14.2%) |
| 75 Years and over | 23 (100.0%) | 25 (58.1%) |
Disability Class by Sex by Age in Monte Alto
Disability Class: Hearing Difficulty
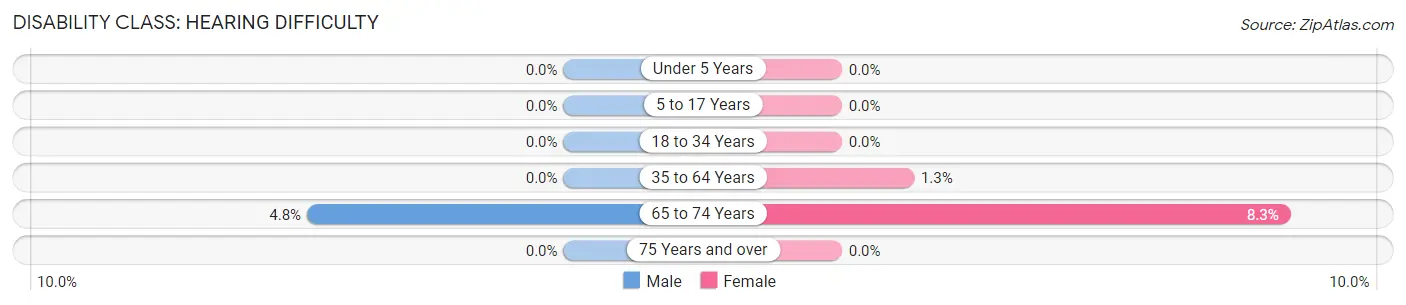
| Age Bracket | Male | Female |
| Under 5 Years | 0 (0.0%) | 0 (0.0%) |
| 5 to 17 Years | 0 (0.0%) | 0 (0.0%) |
| 18 to 34 Years | 0 (0.0%) | 0 (0.0%) |
| 35 to 64 Years | 0 (0.0%) | 4 (1.3%) |
| 65 to 74 Years | 7 (4.8%) | 10 (8.3%) |
| 75 Years and over | 0 (0.0%) | 0 (0.0%) |
Disability Class: Vision Difficulty
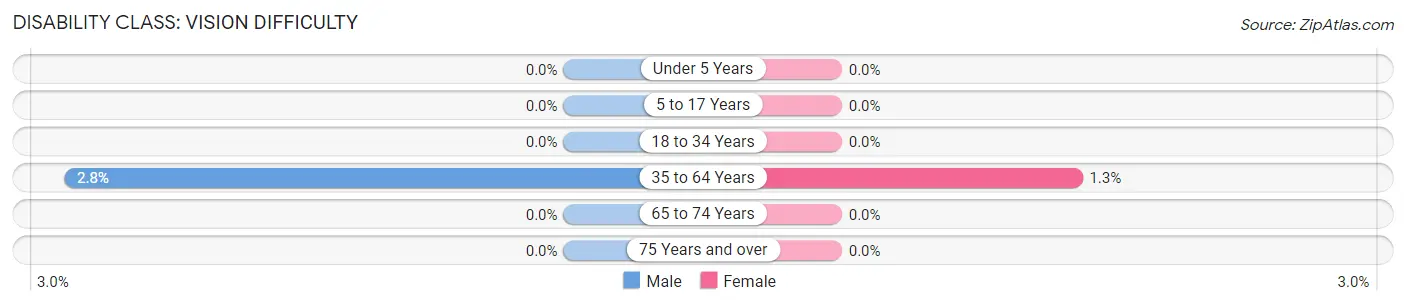
| Age Bracket | Male | Female |
| Under 5 Years | 0 (0.0%) | 0 (0.0%) |
| 5 to 17 Years | 0 (0.0%) | 0 (0.0%) |
| 18 to 34 Years | 0 (0.0%) | 0 (0.0%) |
| 35 to 64 Years | 7 (2.8%) | 4 (1.3%) |
| 65 to 74 Years | 0 (0.0%) | 0 (0.0%) |
| 75 Years and over | 0 (0.0%) | 0 (0.0%) |
Disability Class: Cognitive Difficulty
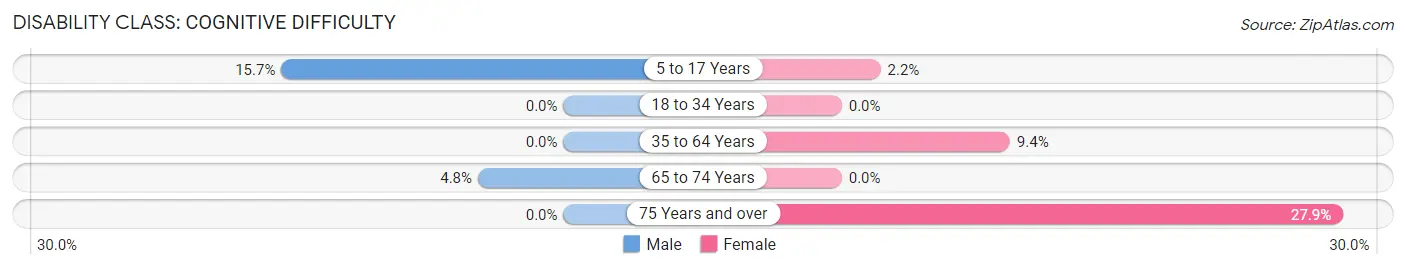
| Age Bracket | Male | Female |
| 5 to 17 Years | 33 (15.7%) | 3 (2.2%) |
| 18 to 34 Years | 0 (0.0%) | 0 (0.0%) |
| 35 to 64 Years | 0 (0.0%) | 28 (9.4%) |
| 65 to 74 Years | 7 (4.8%) | 0 (0.0%) |
| 75 Years and over | 0 (0.0%) | 12 (27.9%) |
Disability Class: Ambulatory Difficulty
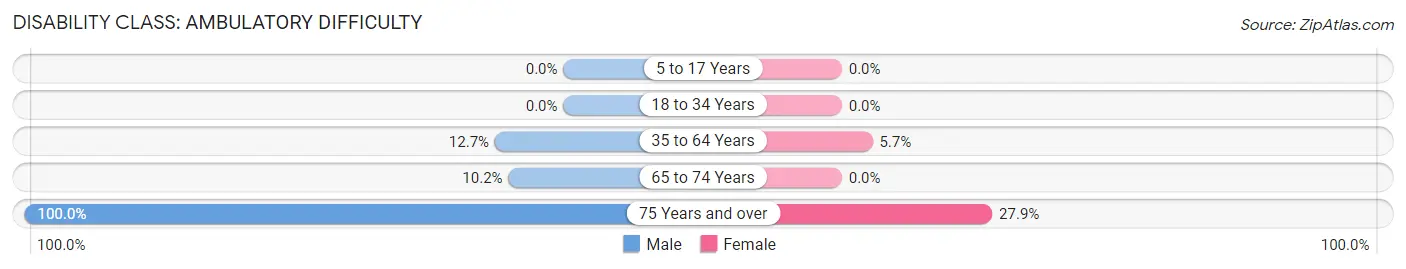
| Age Bracket | Male | Female |
| 5 to 17 Years | 0 (0.0%) | 0 (0.0%) |
| 18 to 34 Years | 0 (0.0%) | 0 (0.0%) |
| 35 to 64 Years | 32 (12.7%) | 17 (5.7%) |
| 65 to 74 Years | 15 (10.2%) | 0 (0.0%) |
| 75 Years and over | 23 (100.0%) | 12 (27.9%) |
Disability Class: Self-Care Difficulty
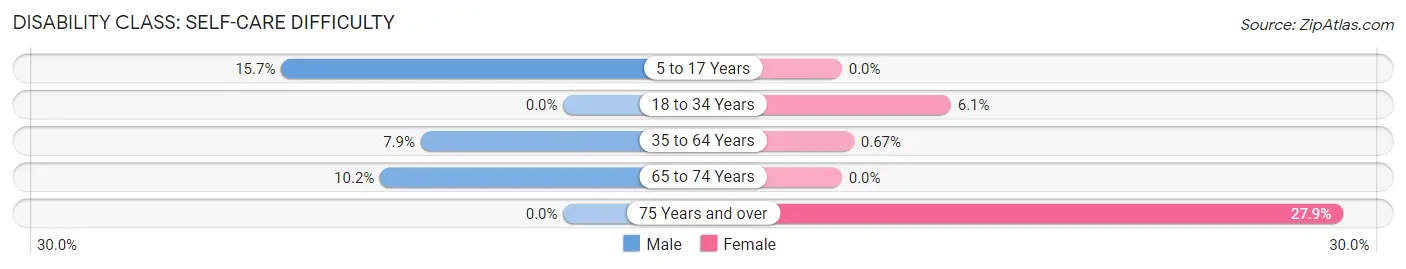
| Age Bracket | Male | Female |
| 5 to 17 Years | 33 (15.7%) | 0 (0.0%) |
| 18 to 34 Years | 0 (0.0%) | 13 (6.1%) |
| 35 to 64 Years | 20 (7.9%) | 2 (0.7%) |
| 65 to 74 Years | 15 (10.2%) | 0 (0.0%) |
| 75 Years and over | 0 (0.0%) | 12 (27.9%) |
Technology Access in Monte Alto
Computing Device Access in Monte Alto
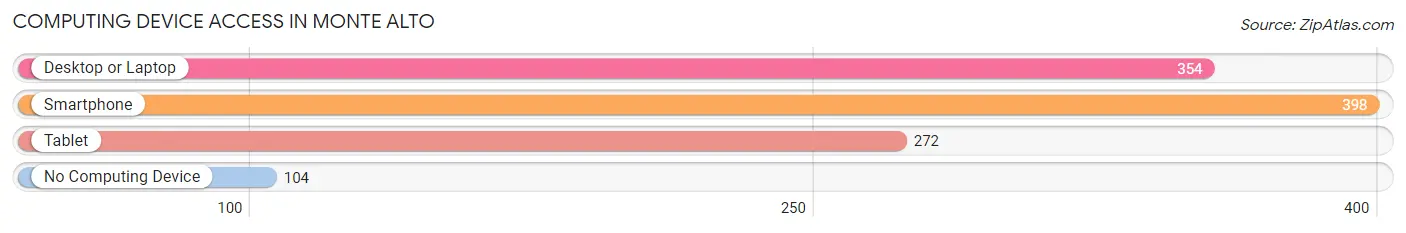
| Device Type | # Households | % Households |
| Desktop or Laptop | 354 | 65.1% |
| Smartphone | 398 | 73.2% |
| Tablet | 272 | 50.0% |
| No Computing Device | 104 | 19.1% |
| Total | 544 | 100.0% |
Internet Access in Monte Alto
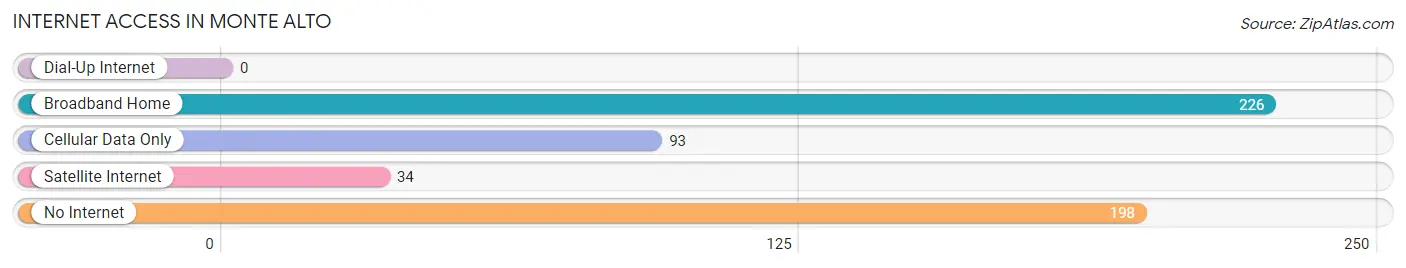
| Internet Type | # Households | % Households |
| Dial-Up Internet | 0 | 0.0% |
| Broadband Home | 226 | 41.5% |
| Cellular Data Only | 93 | 17.1% |
| Satellite Internet | 34 | 6.2% |
| No Internet | 198 | 36.4% |
| Total | 544 | 100.0% |
Monte Alto Summary
Monte Alto is a small town located in Hidalgo County, Texas, United States. It is situated about 20 miles south of McAllen and about 10 miles north of Edinburg. The population of Monte Alto was 1,845 at the 2010 census.
History
Monte Alto was founded in 1891 by a group of Mexican settlers who were looking for a place to settle and start a new life. The town was named after the nearby mountain, Monte Alto, which is Spanish for “high mountain”. The settlers were attracted to the area because of its fertile soil and abundant water supply.
The town grew quickly and by the early 1900s, it had become a thriving agricultural center. The town was home to several cotton gins, a flour mill, and a cottonseed oil mill. The town also had a post office, a school, and several churches.
In the 1920s, the town began to decline as the cotton industry moved away from the area. The population decreased and the town became a small, quiet community.
Geography
Monte Alto is located at 26°14'25" North, 98°14'25" West (26.240278, -98.240278). The town is situated in the Rio Grande Valley, which is a flat, fertile plain that is surrounded by mountains. The town is located about 20 miles south of McAllen and about 10 miles north of Edinburg.
The climate in Monte Alto is subtropical, with hot summers and mild winters. The average temperature in the summer is around 90°F and the average temperature in the winter is around 60°F.
Economy
The economy of Monte Alto is largely based on agriculture. The town is home to several farms that produce cotton, corn, sorghum, and other crops. The town also has several businesses that provide services to the local community, such as auto repair shops, restaurants, and grocery stores.
Demographics
As of the 2010 census, the population of Monte Alto was 1,845. The racial makeup of the town was 79.3% Hispanic or Latino, 19.2% White, 0.2% African American, 0.2% Native American, 0.2% Asian, and 0.9% from other races.
The median household income in Monte Alto was $25,938 in 2010. The per capita income was $11,845. About 24.3% of the population was below the poverty line.
Monte Alto is a small, quiet town that is home to a diverse population. The town has a rich history and a strong agricultural economy. The town is a great place to live and work, and it is a great place to raise a family.
Common Questions
What is Per Capita Income in Monte Alto?
Per Capita income in Monte Alto is $17,840.
What is the Median Family Income in Monte Alto?
Median Family Income in Monte Alto is $46,020.
What is the Median Household income in Monte Alto?
Median Household Income in Monte Alto is $41,115.
What is Income or Wage Gap in Monte Alto?
Income or Wage Gap in Monte Alto is 19.3%.
Women in Monte Alto earn 80.7 cents for every dollar earned by a man.
What is Inequality or Gini Index in Monte Alto?
Inequality or Gini Index in Monte Alto is 0.41.
What is the Total Population of Monte Alto?
Total Population of Monte Alto is 1,666.
What is the Total Male Population of Monte Alto?
Total Male Population of Monte Alto is 787.
What is the Total Female Population of Monte Alto?
Total Female Population of Monte Alto is 879.
What is the Ratio of Males per 100 Females in Monte Alto?
There are 89.53 Males per 100 Females in Monte Alto.
What is the Ratio of Females per 100 Males in Monte Alto?
There are 111.69 Females per 100 Males in Monte Alto.
What is the Median Population Age in Monte Alto?
Median Population Age in Monte Alto is 39.2 Years.
What is the Average Family Size in Monte Alto
Average Family Size in Monte Alto is 3.7 People.
What is the Average Household Size in Monte Alto
Average Household Size in Monte Alto is 3.1 People.
How Large is the Labor Force in Monte Alto?
There are 756 People in the Labor Forcein in Monte Alto.
What is the Percentage of People in the Labor Force in Monte Alto?
57.7% of People are in the Labor Force in Monte Alto.
What is the Unemployment Rate in Monte Alto?
Unemployment Rate in Monte Alto is 7.3%.