Horseshoe Bend, TX Map & Demographics
Horseshoe Bend Map
Horseshoe Bend Overview
$34,248
PER CAPITA INCOME
$102,807
AVG FAMILY INCOME
0.36
INEQUALITY / GINI INDEX
754
TOTAL POPULATION
345
MALE POPULATION
409
FEMALE POPULATION
84.35
MALES / 100 FEMALES
118.55
FEMALES / 100 MALES
60.4
MEDIAN AGE
2.2
AVG FAMILY SIZE
2.1
AVG HOUSEHOLD SIZE
279
LABOR FORCE [ PEOPLE ]
39.2%
PERCENT IN LABOR FORCE
5.7%
UNEMPLOYMENT RATE
Income in Horseshoe Bend
Income Overview in Horseshoe Bend
| Characteristic | Number | Measure |
| Per Capita Income | 754 | $34,248 |
| Median Family Income | 258 | $102,807 |
| Mean Family Income | 258 | $76,478 |
| Median Household Income | 353 | $0 |
| Mean Household Income | 353 | $70,683 |
| Income Deficit | 258 | $0 |
| Wage / Income Gap (%) | 754 | 0.00% |
| Wage / Income Gap ($) | 754 | 100.00¢ per $1 |
| Gini / Inequality Index | 754 | 0.36 |
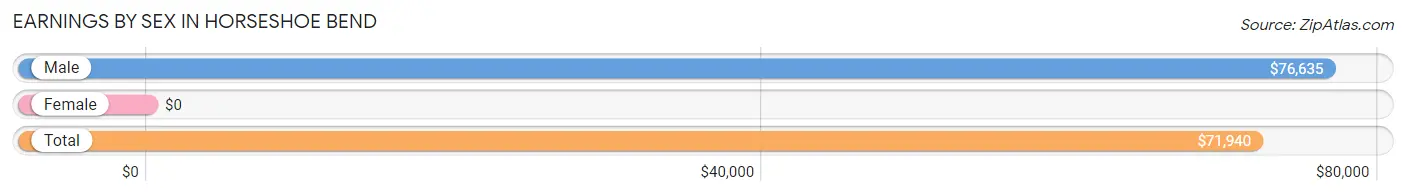
Earnings by Sex in Horseshoe Bend
| Sex | Number | Average Earnings |
| Male | 270 (73.2%) | $76,635 |
| Female | 99 (26.8%) | $0 |
| Total | 369 (100.0%) | $71,940 |
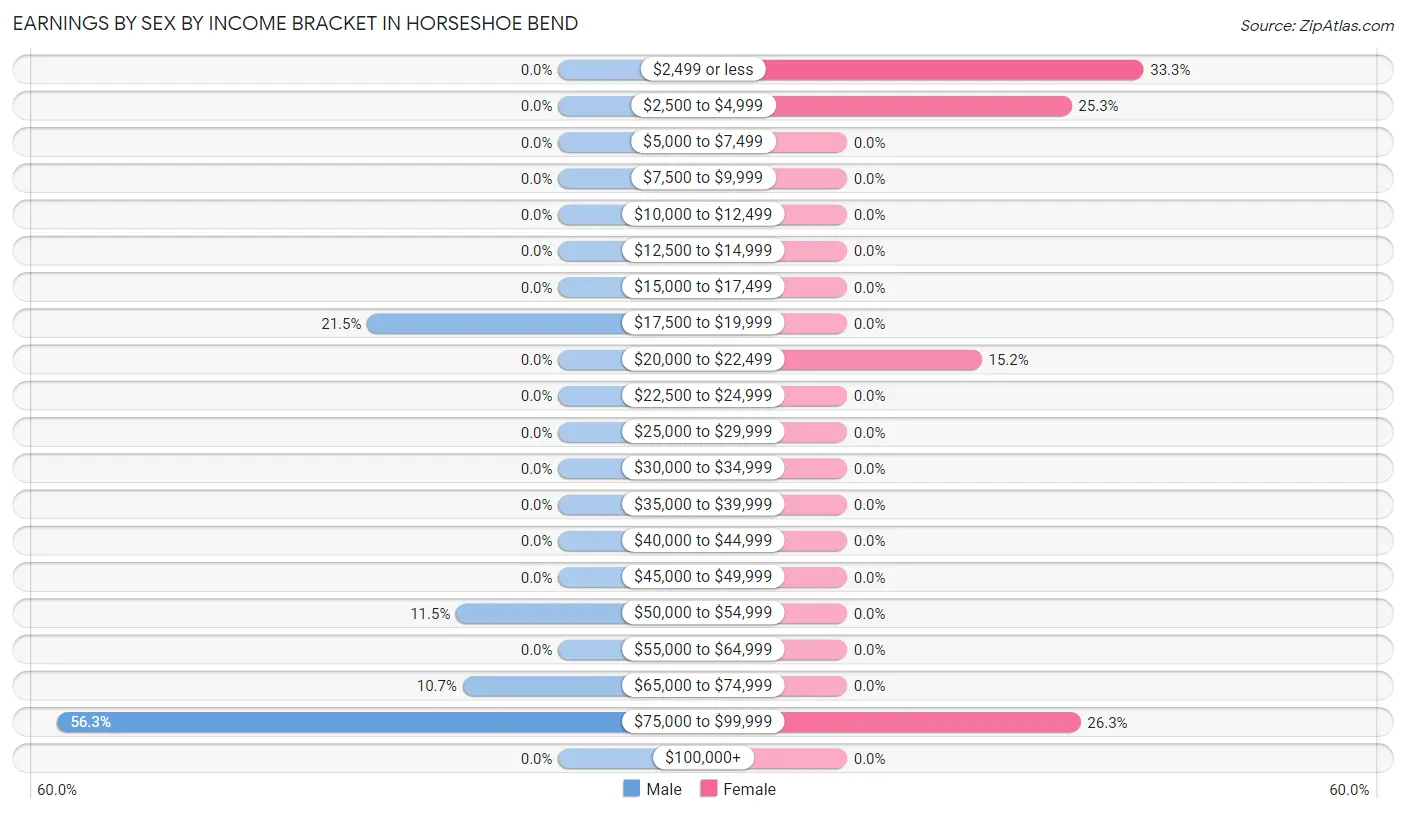
Earnings by Sex by Income Bracket in Horseshoe Bend
The most common earnings brackets in Horseshoe Bend are $75,000 to $99,999 for men (152 | 56.3%) and $2,499 or less for women (33 | 33.3%).
| Income | Male | Female |
| $2,499 or less | 0 (0.0%) | 33 (33.3%) |
| $2,500 to $4,999 | 0 (0.0%) | 25 (25.3%) |
| $5,000 to $7,499 | 0 (0.0%) | 0 (0.0%) |
| $7,500 to $9,999 | 0 (0.0%) | 0 (0.0%) |
| $10,000 to $12,499 | 0 (0.0%) | 0 (0.0%) |
| $12,500 to $14,999 | 0 (0.0%) | 0 (0.0%) |
| $15,000 to $17,499 | 0 (0.0%) | 0 (0.0%) |
| $17,500 to $19,999 | 58 (21.5%) | 0 (0.0%) |
| $20,000 to $22,499 | 0 (0.0%) | 15 (15.1%) |
| $22,500 to $24,999 | 0 (0.0%) | 0 (0.0%) |
| $25,000 to $29,999 | 0 (0.0%) | 0 (0.0%) |
| $30,000 to $34,999 | 0 (0.0%) | 0 (0.0%) |
| $35,000 to $39,999 | 0 (0.0%) | 0 (0.0%) |
| $40,000 to $44,999 | 0 (0.0%) | 0 (0.0%) |
| $45,000 to $49,999 | 0 (0.0%) | 0 (0.0%) |
| $50,000 to $54,999 | 31 (11.5%) | 0 (0.0%) |
| $55,000 to $64,999 | 0 (0.0%) | 0 (0.0%) |
| $65,000 to $74,999 | 29 (10.7%) | 0 (0.0%) |
| $75,000 to $99,999 | 152 (56.3%) | 26 (26.3%) |
| $100,000+ | 0 (0.0%) | 0 (0.0%) |
| Total | 270 (100.0%) | 99 (100.0%) |
Earnings by Sex by Educational Attainment in Horseshoe Bend
| Educational Attainment | Male Income | Female Income |
| Less than High School | - | - |
| High School Diploma | - | - |
| College or Associate's Degree | - | - |
| Bachelor's Degree | - | - |
| Graduate Degree | - | - |
| Total | $76,635 | $0 |
Family Income in Horseshoe Bend
Family Income Brackets in Horseshoe Bend
According to the Horseshoe Bend family income data, there are 116 families falling into the $100,000 to $149,999 income range, which is the most common income bracket and makes up 45.0% of all families.
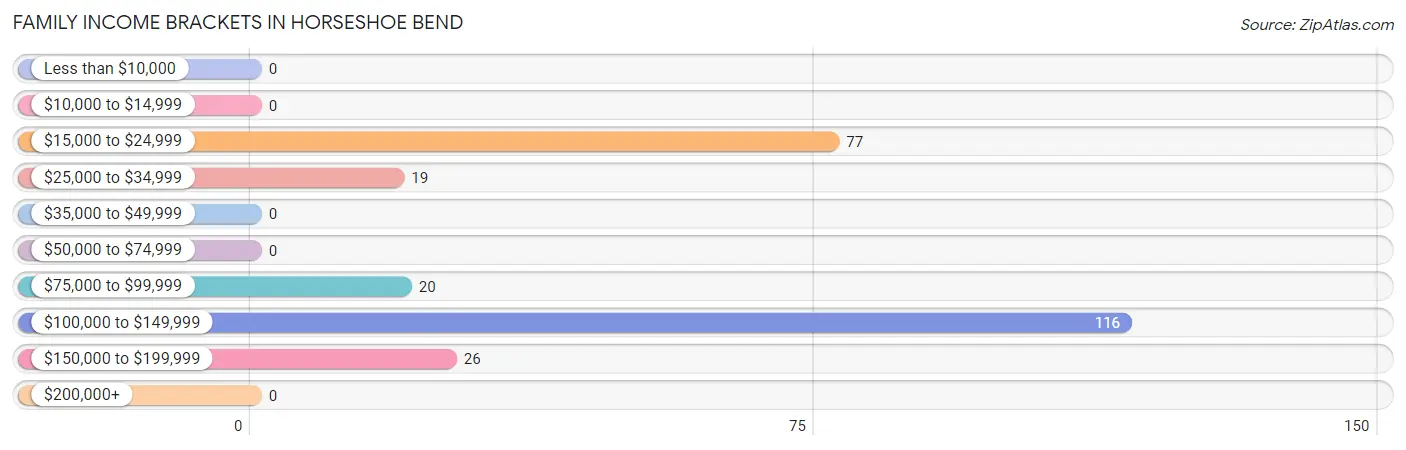
| Income Bracket | # Families | % Families |
| Less than $10,000 | 0 | 0.0% |
| $10,000 to $14,999 | 0 | 0.0% |
| $15,000 to $24,999 | 77 | 29.8% |
| $25,000 to $34,999 | 19 | 7.4% |
| $35,000 to $49,999 | 0 | 0.0% |
| $50,000 to $74,999 | 0 | 0.0% |
| $75,000 to $99,999 | 20 | 7.8% |
| $100,000 to $149,999 | 116 | 45.0% |
| $150,000 to $199,999 | 26 | 10.1% |
| $200,000+ | 0 | 0.0% |
Family Income by Famaliy Size in Horseshoe Bend
| Income Bracket | # Families | Median Income |
| 2-Person Families | 228 (88.4%) | $0 |
| 3-Person Families | 20 (7.7%) | $0 |
| 4-Person Families | 0 (0.0%) | $0 |
| 5-Person Families | 10 (3.9%) | $0 |
| 6-Person Families | 0 (0.0%) | $0 |
| 7+ Person Families | 0 (0.0%) | $0 |
| Total | 258 (100.0%) | $102,807 |
Family Income by Number of Earners in Horseshoe Bend
| Number of Earners | # Families | Median Income |
| No Earners | 38 (14.7%) | $0 |
| 1 Earner | 164 (63.6%) | $0 |
| 2 Earners | 56 (21.7%) | $0 |
| 3+ Earners | 0 (0.0%) | $0 |
| Total | 258 (100.0%) | $102,807 |
Household Income in Horseshoe Bend
Household Income Brackets in Horseshoe Bend
With 106 households falling in the category, the $100,000 to $149,999 income range is the most frequent in Horseshoe Bend, accounting for 30.0% of all households.
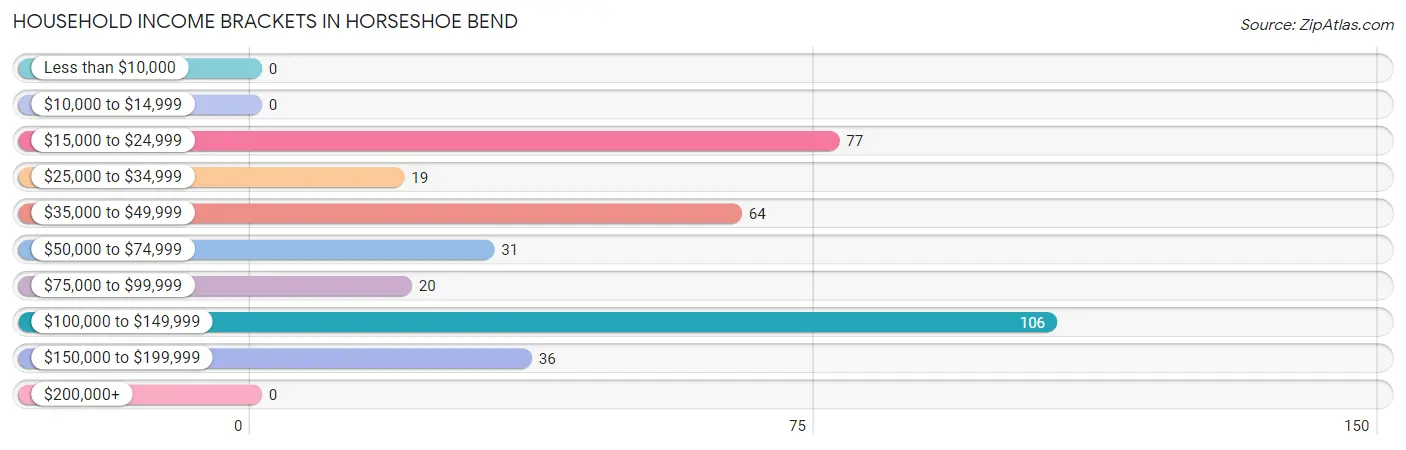
| Income Bracket | # Households | % Households |
| Less than $10,000 | 0 | 0.0% |
| $10,000 to $14,999 | 0 | 0.0% |
| $15,000 to $24,999 | 77 | 21.8% |
| $25,000 to $34,999 | 19 | 5.4% |
| $35,000 to $49,999 | 64 | 18.1% |
| $50,000 to $74,999 | 31 | 8.8% |
| $75,000 to $99,999 | 20 | 5.7% |
| $100,000 to $149,999 | 106 | 30.0% |
| $150,000 to $199,999 | 36 | 10.2% |
| $200,000+ | 0 | 0.0% |
Household Income by Householder Age in Horseshoe Bend
The median household income in Horseshoe Bend is $0, with the highest median household income of $102,995 found in the 45 to 64 years age bracket for the primary householder. A total of 222 households (62.9%) fall into this category.
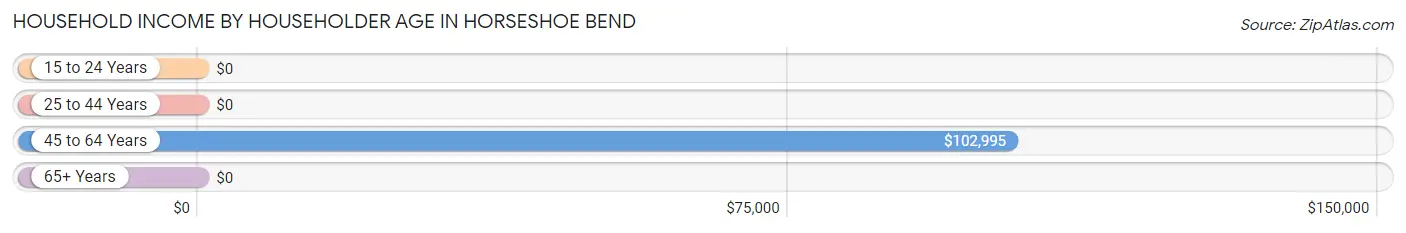
| Income Bracket | # Households | Median Income |
| 15 to 24 Years | 0 (0.0%) | $0 |
| 25 to 44 Years | 68 (19.3%) | $0 |
| 45 to 64 Years | 222 (62.9%) | $102,995 |
| 65+ Years | 63 (17.8%) | $0 |
| Total | 353 (100.0%) | $0 |
Poverty in Horseshoe Bend
Income Below Poverty by Sex and Age in Horseshoe Bend
With 24.3% poverty level for males and 31.5% for females among the residents of Horseshoe Bend, 25 to 34 year old males and under 5 year old females are the most vulnerable to poverty, with 58 males (100.0%) and 42 females (100.0%) in their respective age groups living below the poverty level.
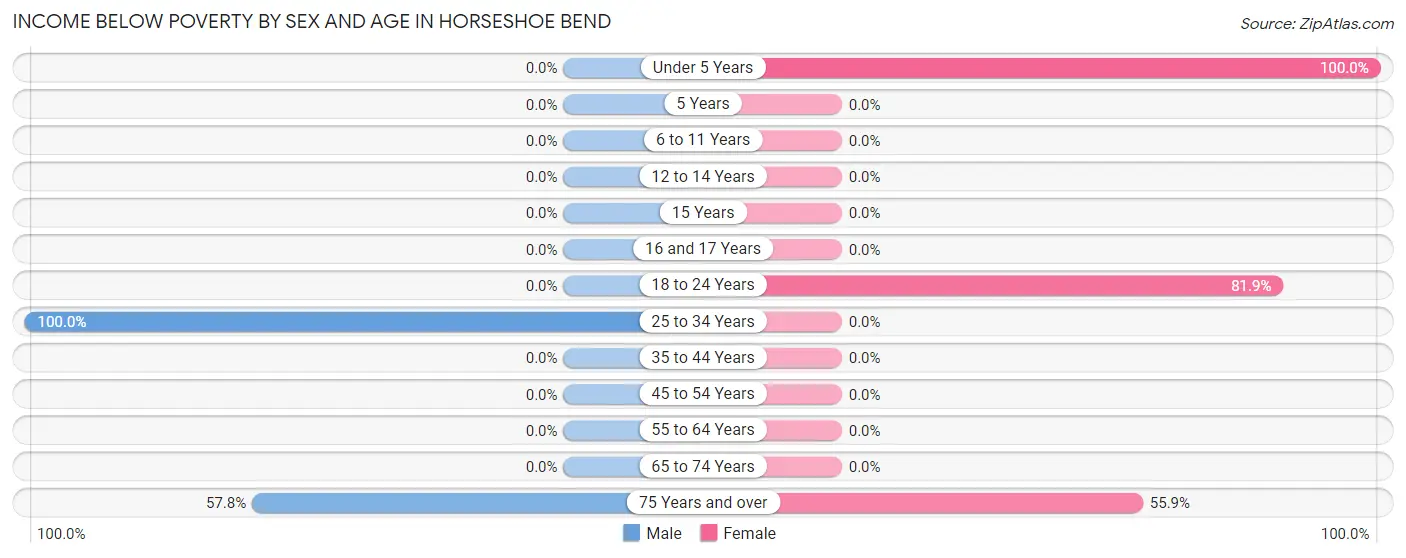
| Age Bracket | Male | Female |
| Under 5 Years | 0 (0.0%) | 42 (100.0%) |
| 5 Years | 0 (0.0%) | 0 (0.0%) |
| 6 to 11 Years | 0 (0.0%) | 0 (0.0%) |
| 12 to 14 Years | 0 (0.0%) | 0 (0.0%) |
| 15 Years | 0 (0.0%) | 0 (0.0%) |
| 16 and 17 Years | 0 (0.0%) | 0 (0.0%) |
| 18 to 24 Years | 0 (0.0%) | 68 (81.9%) |
| 25 to 34 Years | 58 (100.0%) | 0 (0.0%) |
| 35 to 44 Years | 0 (0.0%) | 0 (0.0%) |
| 45 to 54 Years | 0 (0.0%) | 0 (0.0%) |
| 55 to 64 Years | 0 (0.0%) | 0 (0.0%) |
| 65 to 74 Years | 0 (0.0%) | 0 (0.0%) |
| 75 Years and over | 26 (57.8%) | 19 (55.9%) |
| Total | 84 (24.3%) | 129 (31.5%) |
Income Above Poverty by Sex and Age in Horseshoe Bend
According to the poverty statistics in Horseshoe Bend, males aged 18 to 24 years and females aged 25 to 34 years are the age groups that are most secure financially, with 100.0% of males and 100.0% of females in these age groups living above the poverty line.
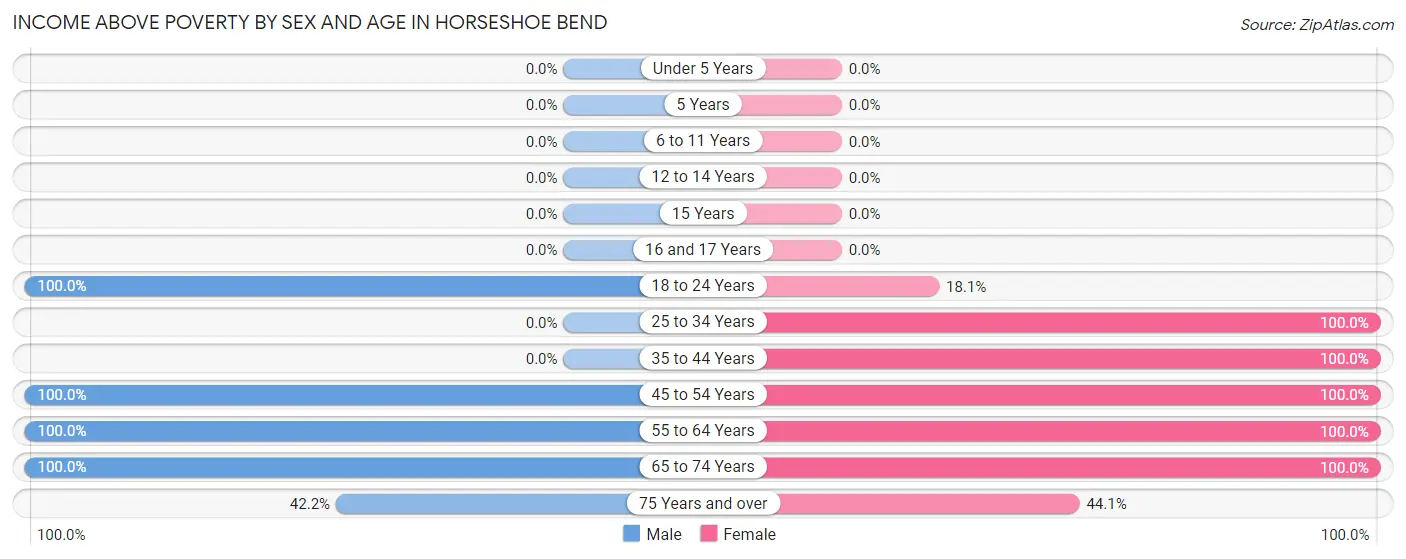
| Age Bracket | Male | Female |
| Under 5 Years | 0 (0.0%) | 0 (0.0%) |
| 5 Years | 0 (0.0%) | 0 (0.0%) |
| 6 to 11 Years | 0 (0.0%) | 0 (0.0%) |
| 12 to 14 Years | 0 (0.0%) | 0 (0.0%) |
| 15 Years | 0 (0.0%) | 0 (0.0%) |
| 16 and 17 Years | 0 (0.0%) | 0 (0.0%) |
| 18 to 24 Years | 16 (100.0%) | 15 (18.1%) |
| 25 to 34 Years | 0 (0.0%) | 33 (100.0%) |
| 35 to 44 Years | 0 (0.0%) | 10 (100.0%) |
| 45 to 54 Years | 57 (100.0%) | 17 (100.0%) |
| 55 to 64 Years | 155 (100.0%) | 165 (100.0%) |
| 65 to 74 Years | 14 (100.0%) | 25 (100.0%) |
| 75 Years and over | 19 (42.2%) | 15 (44.1%) |
| Total | 261 (75.6%) | 280 (68.5%) |
Income Below Poverty Among Married-Couple Families in Horseshoe Bend
The poverty statistics for married-couple families in Horseshoe Bend show that 9.5% or 19 of the total 200 families live below the poverty line. Families with no children have the highest poverty rate of 9.5%, comprising of 19 families. On the other hand, families with no children have the lowest poverty rate of 9.5%, which includes 19 families.
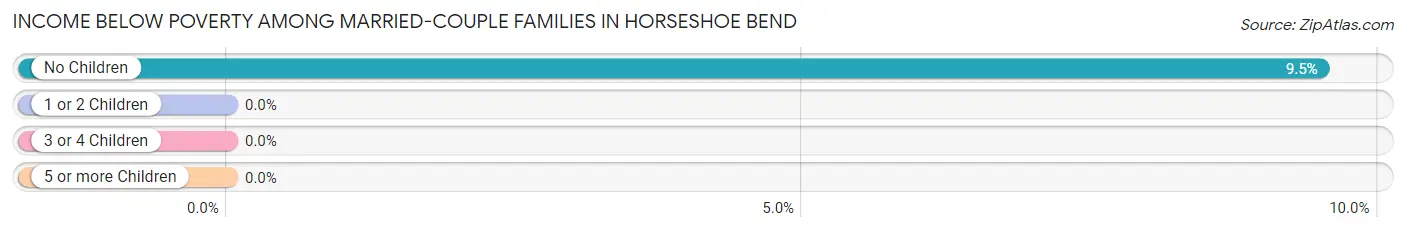
| Children | Above Poverty | Below Poverty |
| No Children | 181 (90.5%) | 19 (9.5%) |
| 1 or 2 Children | 0 (0.0%) | 0 (0.0%) |
| 3 or 4 Children | 0 (0.0%) | 0 (0.0%) |
| 5 or more Children | 0 (0.0%) | 0 (0.0%) |
| Total | 181 (90.5%) | 19 (9.5%) |
Income Below Poverty Among Single-Parent Households in Horseshoe Bend
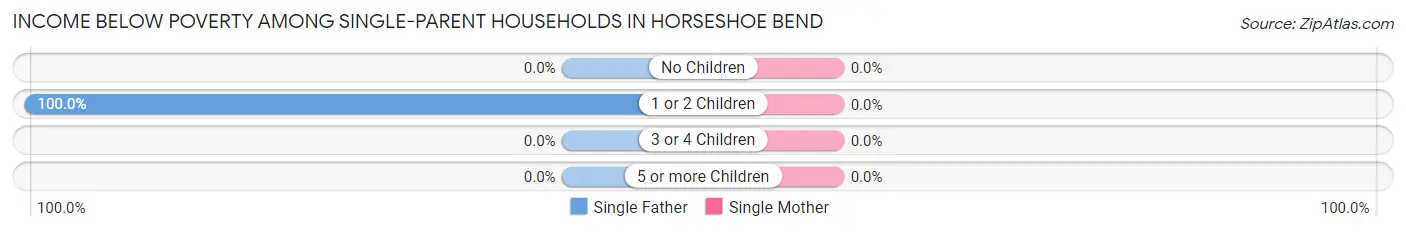
| Children | Single Father | Single Mother |
| No Children | 0 (0.0%) | 0 (0.0%) |
| 1 or 2 Children | 58 (100.0%) | 0 (0.0%) |
| 3 or 4 Children | 0 (0.0%) | 0 (0.0%) |
| 5 or more Children | 0 (0.0%) | 0 (0.0%) |
| Total | 58 (100.0%) | 0 (0.0%) |
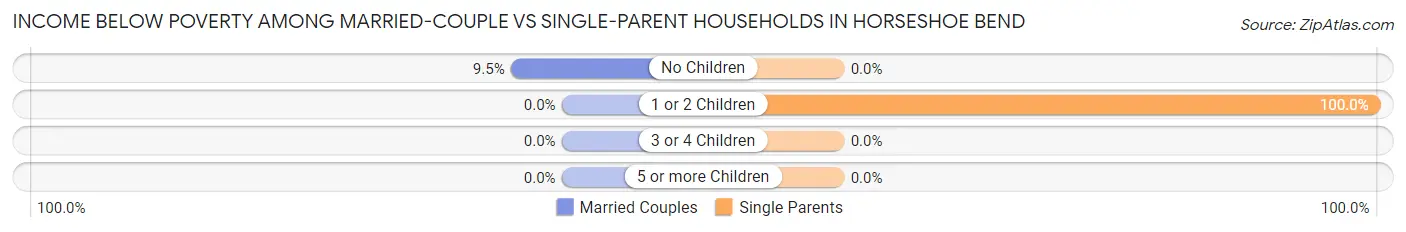
Income Below Poverty Among Married-Couple vs Single-Parent Households in Horseshoe Bend
The poverty data for Horseshoe Bend shows that 19 of the married-couple family households (9.5%) and 58 of the single-parent households (100.0%) are living below the poverty level. Within the married-couple family households, those with no children have the highest poverty rate, with 19 households (9.5%) falling below the poverty line. Among the single-parent households, those with 1 or 2 children have the highest poverty rate, with 58 household (100.0%) living below poverty.
| Children | Married-Couple Families | Single-Parent Households |
| No Children | 19 (9.5%) | 0 (0.0%) |
| 1 or 2 Children | 0 (0.0%) | 58 (100.0%) |
| 3 or 4 Children | 0 (0.0%) | 0 (0.0%) |
| 5 or more Children | 0 (0.0%) | 0 (0.0%) |
| Total | 19 (9.5%) | 58 (100.0%) |
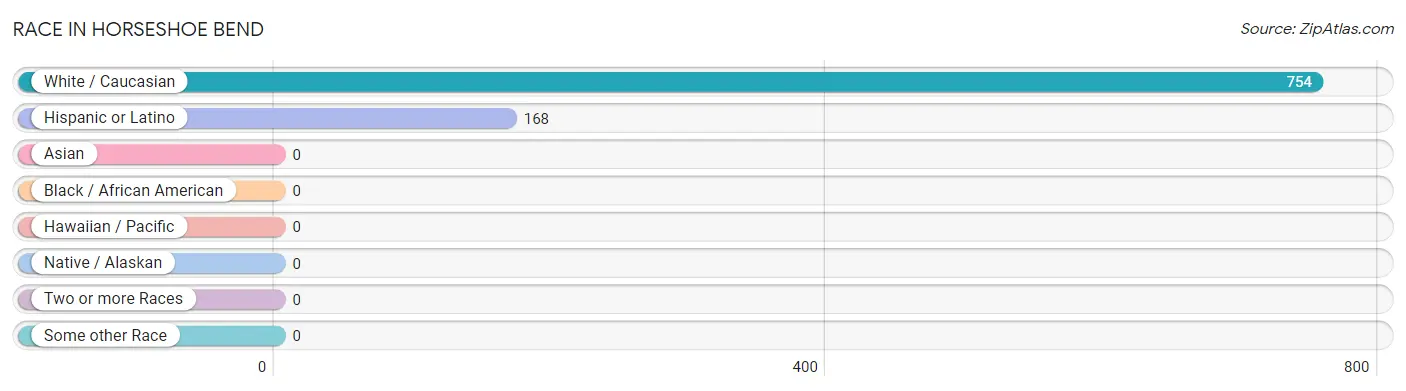
Race in Horseshoe Bend
The most populous races in Horseshoe Bend are White / Caucasian (754 | 100.0%), and Hispanic or Latino (168 | 22.3%).
| Race | # Population | % Population |
| Asian | 0 | 0.0% |
| Black / African American | 0 | 0.0% |
| Hawaiian / Pacific | 0 | 0.0% |
| Hispanic or Latino | 168 | 22.3% |
| Native / Alaskan | 0 | 0.0% |
| White / Caucasian | 754 | 100.0% |
| Two or more Races | 0 | 0.0% |
| Some other Race | 0 | 0.0% |
| Total | 754 | 100.0% |
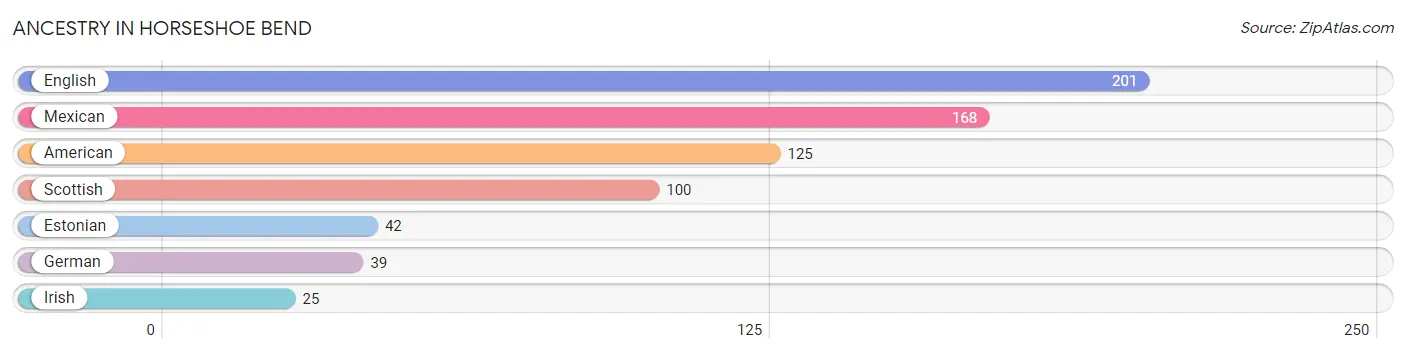
Ancestry in Horseshoe Bend
The most populous ancestries reported in Horseshoe Bend are English (201 | 26.7%), Mexican (168 | 22.3%), American (125 | 16.6%), Scottish (100 | 13.3%), and Estonian (42 | 5.6%), together accounting for 84.4% of all Horseshoe Bend residents.
| Ancestry | # Population | % Population |
| American | 125 | 16.6% |
| English | 201 | 26.7% |
| Estonian | 42 | 5.6% |
| German | 39 | 5.2% |
| Irish | 25 | 3.3% |
| Mexican | 168 | 22.3% |
| Scottish | 100 | 13.3% | View All 7 Rows |
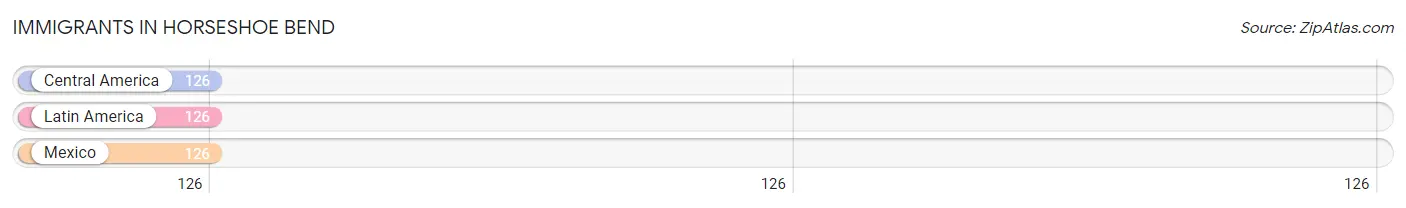
Immigrants in Horseshoe Bend
The most numerous immigrant groups reported in Horseshoe Bend came from Central America (126 | 16.7%), Latin America (126 | 16.7%), and Mexico (126 | 16.7%), together accounting for 50.1% of all Horseshoe Bend residents.
| Immigration Origin | # Population | % Population |
| Central America | 126 | 16.7% |
| Latin America | 126 | 16.7% |
| Mexico | 126 | 16.7% | View All 3 Rows |
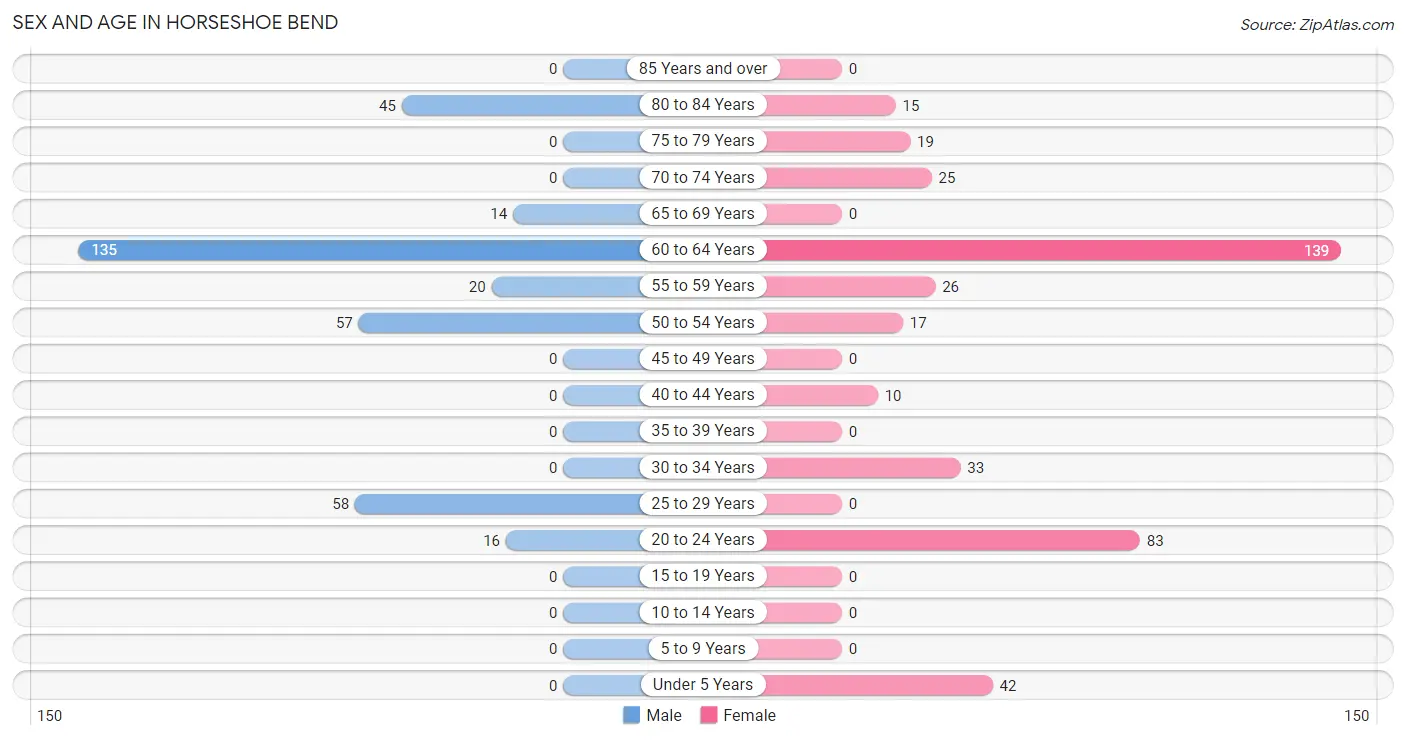
Sex and Age in Horseshoe Bend
Sex and Age in Horseshoe Bend
The most populous age groups in Horseshoe Bend are 60 to 64 Years (135 | 39.1%) for men and 60 to 64 Years (139 | 34.0%) for women.
| Age Bracket | Male | Female |
| Under 5 Years | 0 (0.0%) | 42 (10.3%) |
| 5 to 9 Years | 0 (0.0%) | 0 (0.0%) |
| 10 to 14 Years | 0 (0.0%) | 0 (0.0%) |
| 15 to 19 Years | 0 (0.0%) | 0 (0.0%) |
| 20 to 24 Years | 16 (4.6%) | 83 (20.3%) |
| 25 to 29 Years | 58 (16.8%) | 0 (0.0%) |
| 30 to 34 Years | 0 (0.0%) | 33 (8.1%) |
| 35 to 39 Years | 0 (0.0%) | 0 (0.0%) |
| 40 to 44 Years | 0 (0.0%) | 10 (2.4%) |
| 45 to 49 Years | 0 (0.0%) | 0 (0.0%) |
| 50 to 54 Years | 57 (16.5%) | 17 (4.2%) |
| 55 to 59 Years | 20 (5.8%) | 26 (6.4%) |
| 60 to 64 Years | 135 (39.1%) | 139 (34.0%) |
| 65 to 69 Years | 14 (4.1%) | 0 (0.0%) |
| 70 to 74 Years | 0 (0.0%) | 25 (6.1%) |
| 75 to 79 Years | 0 (0.0%) | 19 (4.6%) |
| 80 to 84 Years | 45 (13.0%) | 15 (3.7%) |
| 85 Years and over | 0 (0.0%) | 0 (0.0%) |
| Total | 345 (100.0%) | 409 (100.0%) |
Families and Households in Horseshoe Bend
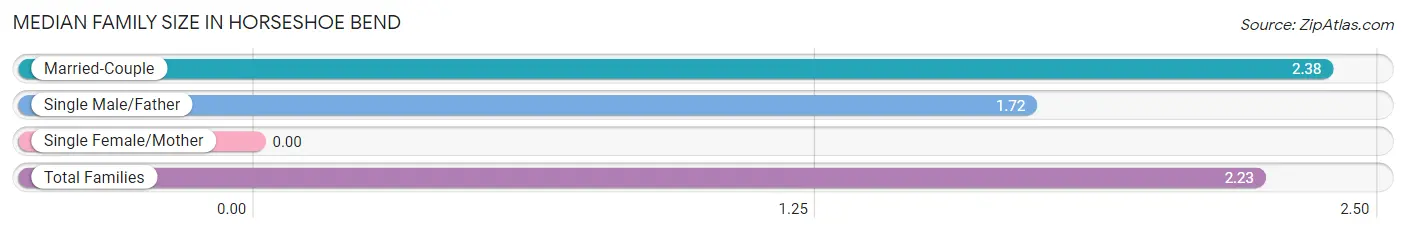
Median Family Size in Horseshoe Bend
| Family Type | # Families | Family Size |
| Married-Couple | 200 (77.5%) | 2.38 |
| Single Male/Father | 58 (22.5%) | 1.72 |
| Single Female/Mother | 0 (0.0%) | - |
| Total Families | 258 (100.0%) | 2.23 |
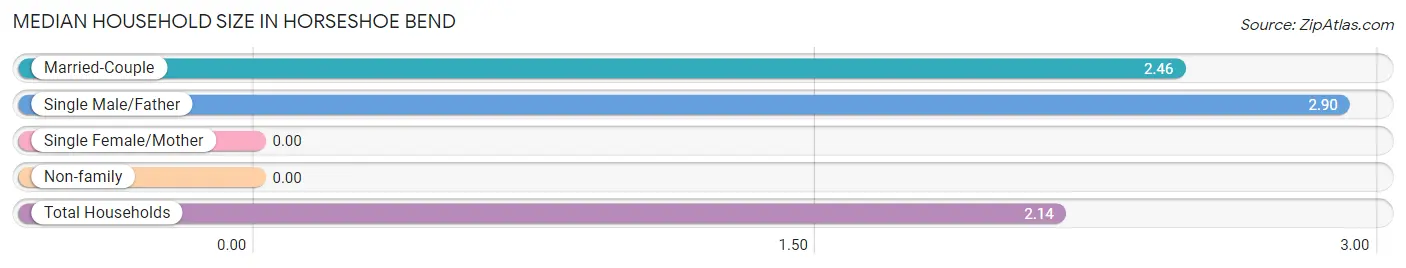
Median Household Size in Horseshoe Bend
| Household Type | # Households | Household Size |
| Married-Couple | 200 (56.7%) | 2.46 |
| Single Male/Father | 58 (16.4%) | 2.90 |
| Single Female/Mother | 0 (0.0%) | - |
| Non-family | 95 (26.9%) | - |
| Total Households | 353 (100.0%) | 2.14 |
Household Size by Marriage Status in Horseshoe Bend
Out of a total of 353 households in Horseshoe Bend, 258 (73.1%) are family households, while 95 (26.9%) are nonfamily households. The most numerous type of family households are 2-person households, comprising 170, and the most common type of nonfamily households are 1-person households, comprising 95.
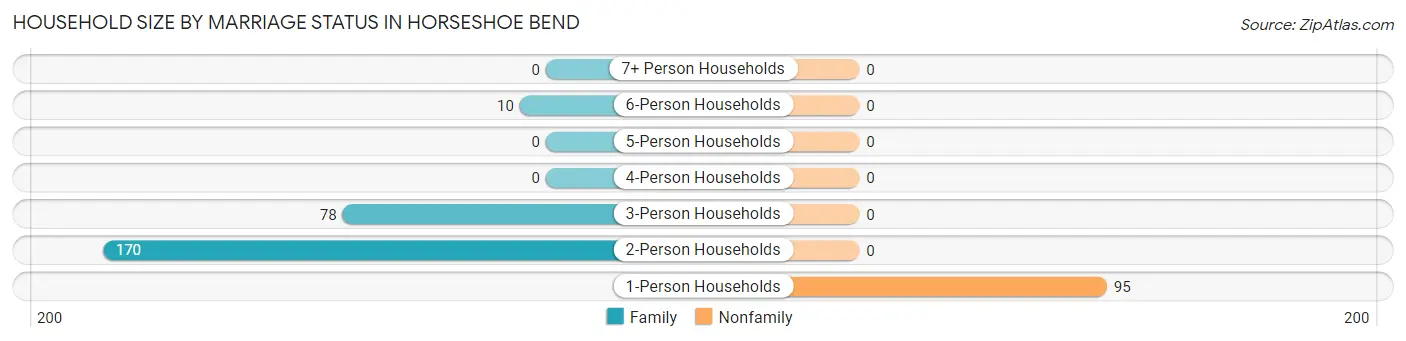
| Household Size | Family Households | Nonfamily Households |
| 1-Person Households | - | 95 (26.9%) |
| 2-Person Households | 170 (48.2%) | 0 (0.0%) |
| 3-Person Households | 78 (22.1%) | 0 (0.0%) |
| 4-Person Households | 0 (0.0%) | 0 (0.0%) |
| 5-Person Households | 0 (0.0%) | 0 (0.0%) |
| 6-Person Households | 10 (2.8%) | 0 (0.0%) |
| 7+ Person Households | 0 (0.0%) | 0 (0.0%) |
| Total | 258 (73.1%) | 95 (26.9%) |
Female Fertility in Horseshoe Bend
Fertility by Age in Horseshoe Bend
Average fertility rate in Horseshoe Bend is 119.0 births per 1,000 women. Women in the age bracket of 35 to 50 years have the highest fertility rate with 630.0 births per 1,000 women. Women in the age bracket of 35 to 50 years acount for 100.0% of all women with births.
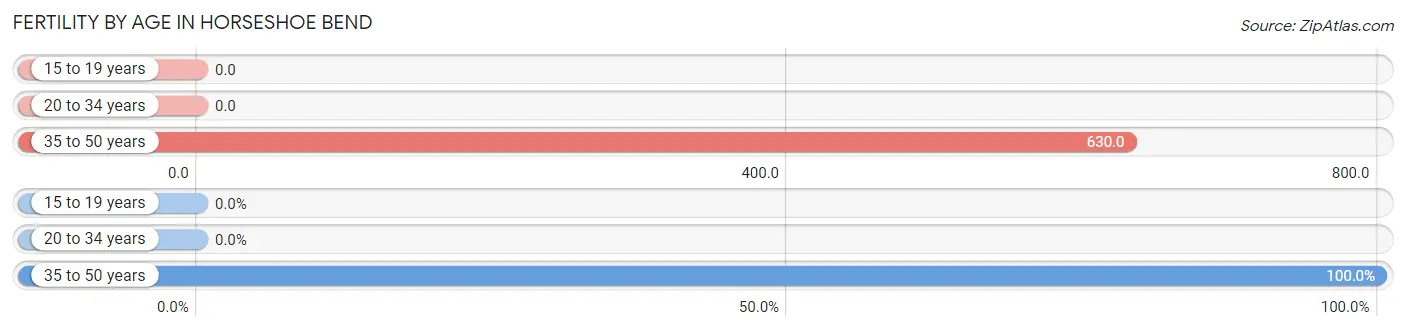
| Age Bracket | Women with Births | Births / 1,000 Women |
| 15 to 19 years | 0 (0.0%) | 0.0 |
| 20 to 34 years | 0 (0.0%) | 0.0 |
| 35 to 50 years | 17 (100.0%) | 630.0 |
| Total | 17 (100.0%) | 119.0 |
Fertility by Age by Marriage Status in Horseshoe Bend
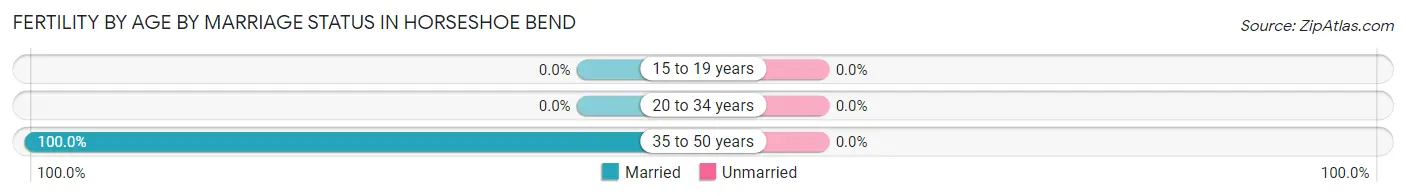
| Age Bracket | Married | Unmarried |
| 15 to 19 years | 0 (0.0%) | 0 (0.0%) |
| 20 to 34 years | 0 (0.0%) | 0 (0.0%) |
| 35 to 50 years | 17 (100.0%) | 0 (0.0%) |
| Total | 17 (100.0%) | 0 (0.0%) |
Fertility by Education in Horseshoe Bend
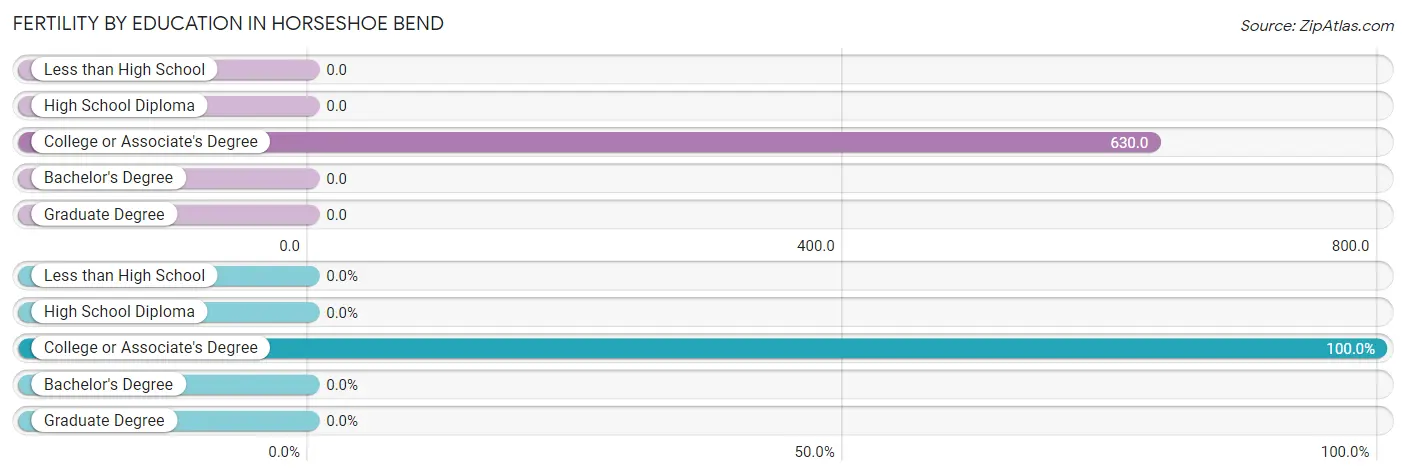
| Educational Attainment | Women with Births | Births / 1,000 Women |
| Less than High School | 0 (0.0%) | 0.0 |
| High School Diploma | 0 (0.0%) | 0.0 |
| College or Associate's Degree | 17 (100.0%) | 630.0 |
| Bachelor's Degree | 0 (0.0%) | 0.0 |
| Graduate Degree | 0 (0.0%) | 0.0 |
| Total | 17 (100.0%) | 119.0 |
Fertility by Education by Marriage Status in Horseshoe Bend
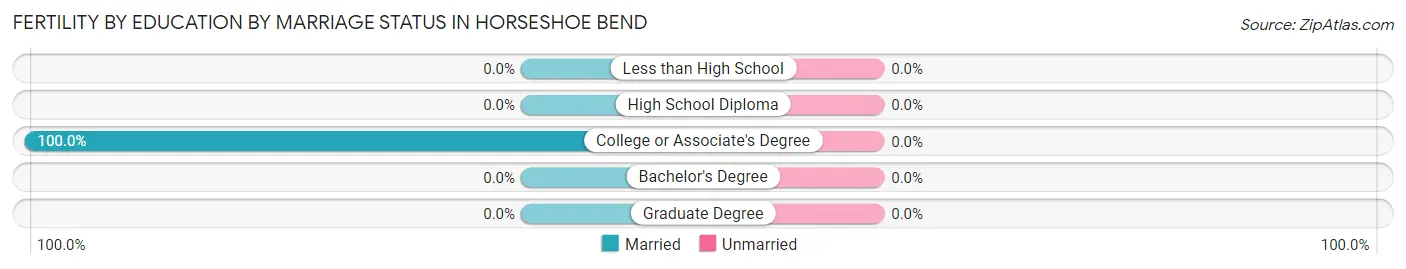
| Educational Attainment | Married | Unmarried |
| Less than High School | 0 (0.0%) | 0 (0.0%) |
| High School Diploma | 0 (0.0%) | 0 (0.0%) |
| College or Associate's Degree | 17 (100.0%) | 0 (0.0%) |
| Bachelor's Degree | 0 (0.0%) | 0 (0.0%) |
| Graduate Degree | 0 (0.0%) | 0 (0.0%) |
| Total | 17 (100.0%) | 0 (0.0%) |
Employment Characteristics in Horseshoe Bend
Employment by Class of Employer in Horseshoe Bend
Among the 263 employed individuals in Horseshoe Bend, private company employees (208 | 79.1%), and not-for-profit organizations (55 | 20.9%) make up the most common classes of employment.
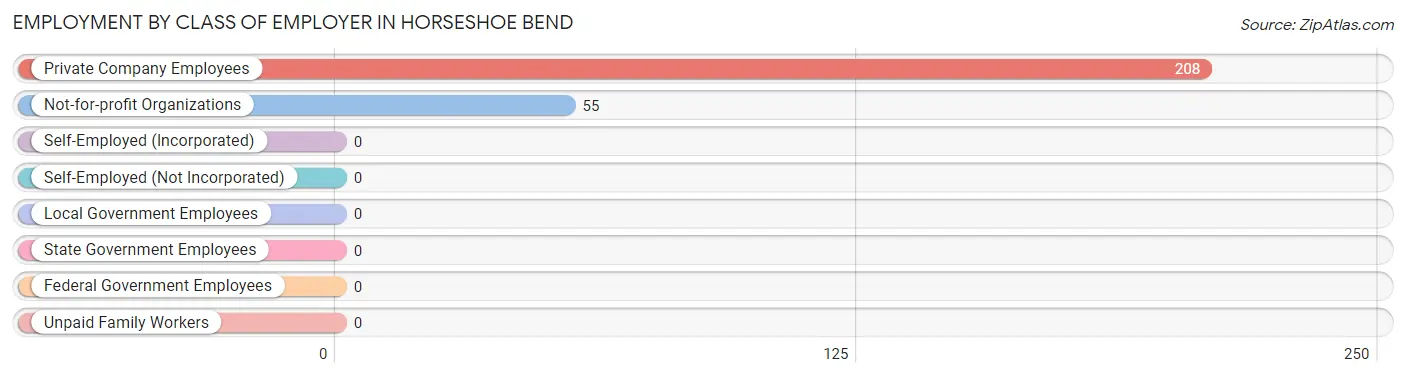
| Employer Class | # Employees | % Employees |
| Private Company Employees | 208 | 79.1% |
| Self-Employed (Incorporated) | 0 | 0.0% |
| Self-Employed (Not Incorporated) | 0 | 0.0% |
| Not-for-profit Organizations | 55 | 20.9% |
| Local Government Employees | 0 | 0.0% |
| State Government Employees | 0 | 0.0% |
| Federal Government Employees | 0 | 0.0% |
| Unpaid Family Workers | 0 | 0.0% |
| Total | 263 | 100.0% |
Employment Status by Age in Horseshoe Bend
According to the labor force statistics for Horseshoe Bend, out of the total population over 16 years of age (712), 39.2% or 279 individuals are in the labor force, with 5.7% or 16 of them unemployed. The age group with the highest labor force participation rate is 25 to 29 years, with 100.0% or 58 individuals in the labor force. Within the labor force, the 20 to 24 years age range has the highest percentage of unemployed individuals, with 51.6% or 16 of them being unemployed.
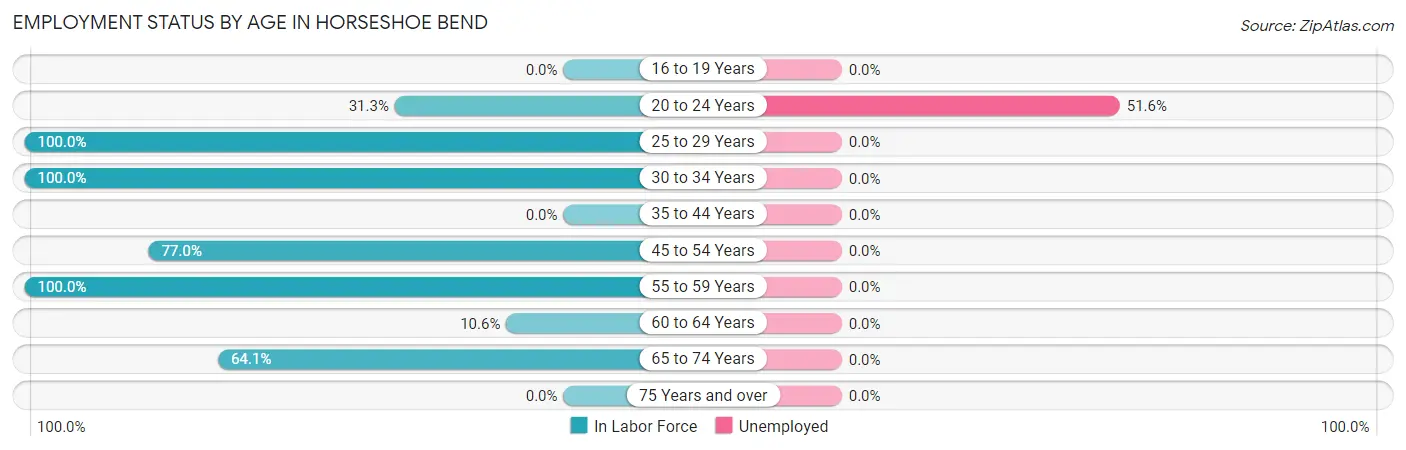
| Age Bracket | In Labor Force | Unemployed |
| 16 to 19 Years | 0 (0.0%) | 0 (0.0%) |
| 20 to 24 Years | 31 (31.3%) | 16 (51.6%) |
| 25 to 29 Years | 58 (100.0%) | 0 (0.0%) |
| 30 to 34 Years | 33 (100.0%) | 0 (0.0%) |
| 35 to 44 Years | 0 (0.0%) | 0 (0.0%) |
| 45 to 54 Years | 57 (77.0%) | 0 (0.0%) |
| 55 to 59 Years | 46 (100.0%) | 0 (0.0%) |
| 60 to 64 Years | 29 (10.6%) | 0 (0.0%) |
| 65 to 74 Years | 25 (64.1%) | 0 (0.0%) |
| 75 Years and over | 0 (0.0%) | 0 (0.0%) |
| Total | 279 (39.2%) | 16 (5.7%) |
Employment Status by Educational Attainment in Horseshoe Bend
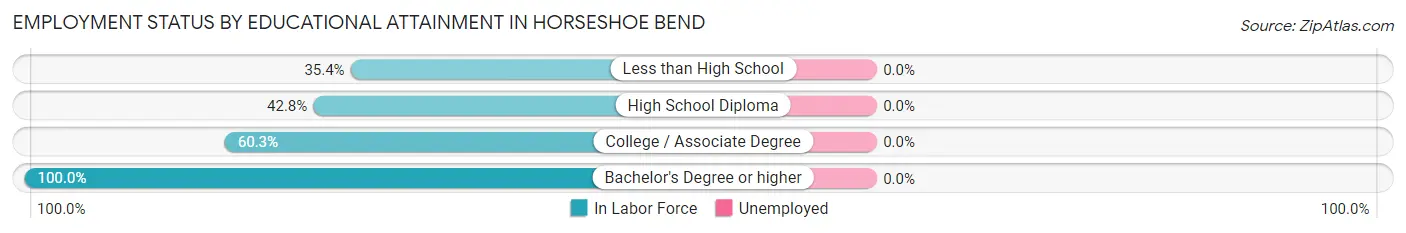
| Educational Attainment | In Labor Force | Unemployed |
| Less than High School | 58 (35.4%) | 0 (0.0%) |
| High School Diploma | 104 (42.8%) | 0 (0.0%) |
| College / Associate Degree | 41 (60.3%) | 0 (0.0%) |
| Bachelor's Degree or higher | 20 (100.0%) | 0 (0.0%) |
| Total | 223 (45.1%) | 0 (0.0%) |
Employment Occupations by Sex in Horseshoe Bend
Management, Business, Science and Arts Occupations
The most common Management, Business, Science and Arts occupations in Horseshoe Bend are Business & Financial (26 | 9.9%), and Management (20 | 7.6%).
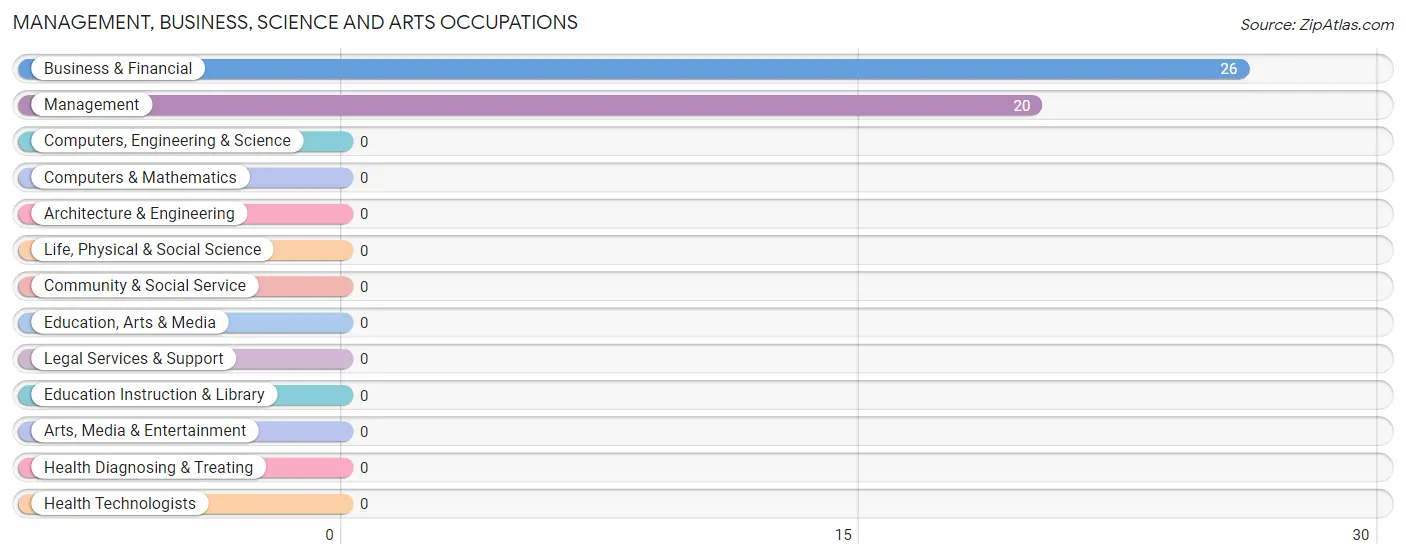
Management, Business, Science and Arts Occupations by Sex
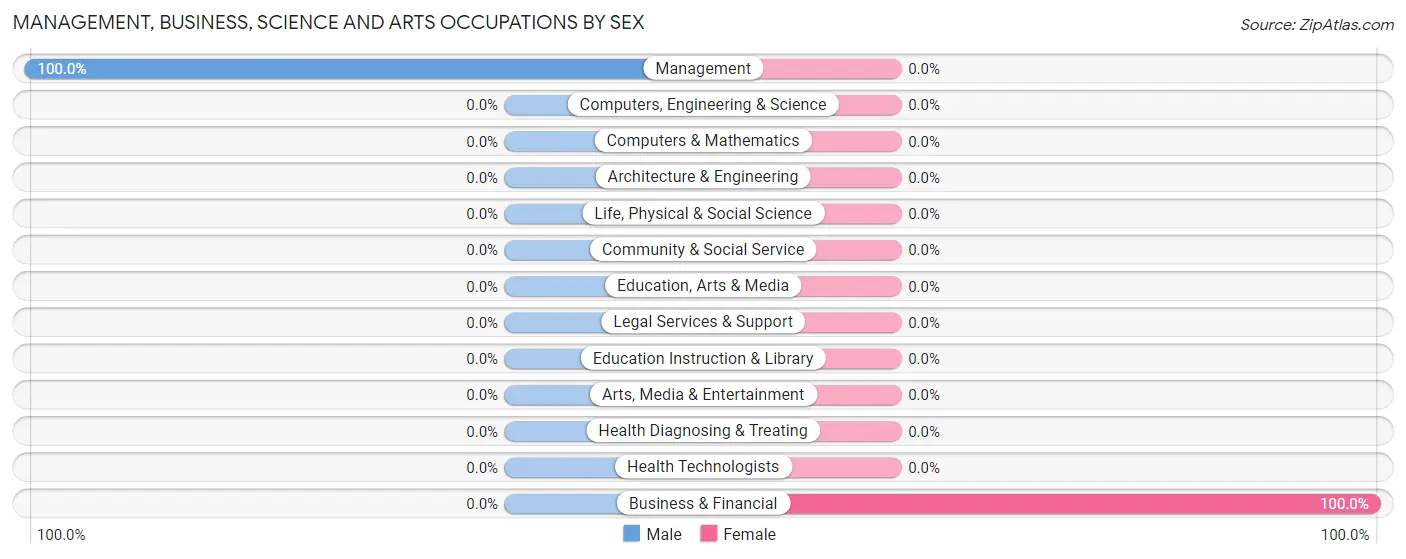
| Occupation | Male | Female |
| Management | 20 (100.0%) | 0 (0.0%) |
| Business & Financial | 0 (0.0%) | 26 (100.0%) |
| Computers, Engineering & Science | 0 (0.0%) | 0 (0.0%) |
| Computers & Mathematics | 0 (0.0%) | 0 (0.0%) |
| Architecture & Engineering | 0 (0.0%) | 0 (0.0%) |
| Life, Physical & Social Science | 0 (0.0%) | 0 (0.0%) |
| Community & Social Service | 0 (0.0%) | 0 (0.0%) |
| Education, Arts & Media | 0 (0.0%) | 0 (0.0%) |
| Legal Services & Support | 0 (0.0%) | 0 (0.0%) |
| Education Instruction & Library | 0 (0.0%) | 0 (0.0%) |
| Arts, Media & Entertainment | 0 (0.0%) | 0 (0.0%) |
| Health Diagnosing & Treating | 0 (0.0%) | 0 (0.0%) |
| Health Technologists | 0 (0.0%) | 0 (0.0%) |
| Total (Category) | 20 (43.5%) | 26 (56.5%) |
| Total (Overall) | 164 (62.4%) | 99 (37.6%) |
Services Occupations
The most common Services occupations in Horseshoe Bend are , and Healthcare Support (25 | 9.5%).
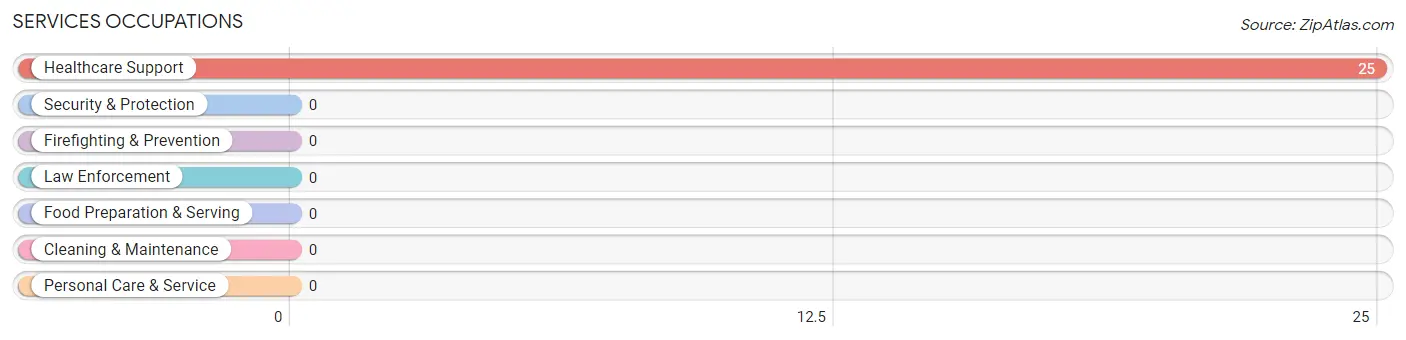
Services Occupations by Sex
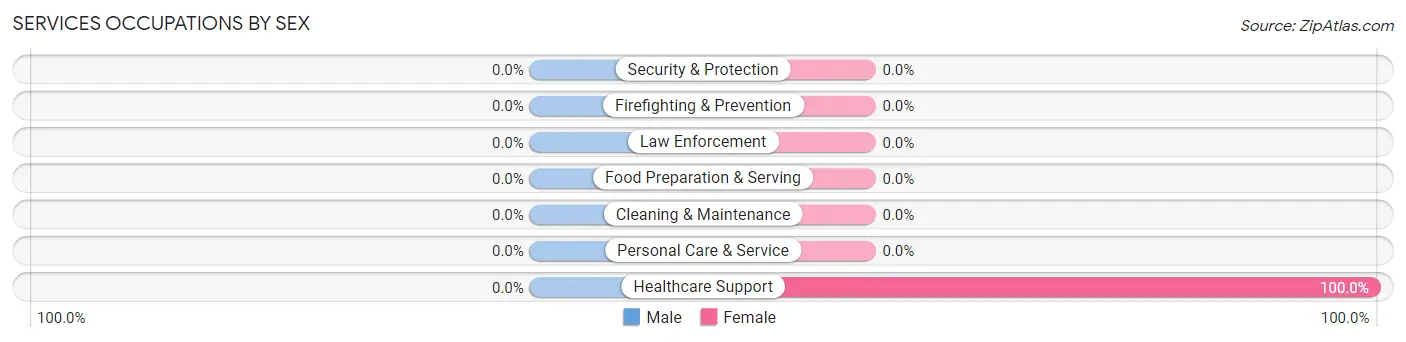
| Occupation | Male | Female |
| Healthcare Support | 0 (0.0%) | 25 (100.0%) |
| Security & Protection | 0 (0.0%) | 0 (0.0%) |
| Firefighting & Prevention | 0 (0.0%) | 0 (0.0%) |
| Law Enforcement | 0 (0.0%) | 0 (0.0%) |
| Food Preparation & Serving | 0 (0.0%) | 0 (0.0%) |
| Cleaning & Maintenance | 0 (0.0%) | 0 (0.0%) |
| Personal Care & Service | 0 (0.0%) | 0 (0.0%) |
| Total (Category) | 0 (0.0%) | 25 (100.0%) |
| Total (Overall) | 164 (62.4%) | 99 (37.6%) |
Sales and Office Occupations
The most common Sales and Office occupations in Horseshoe Bend are , and Sales & Related (44 | 16.7%).
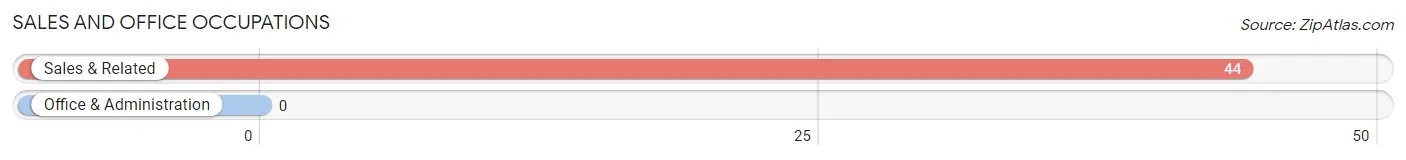
Sales and Office Occupations by Sex
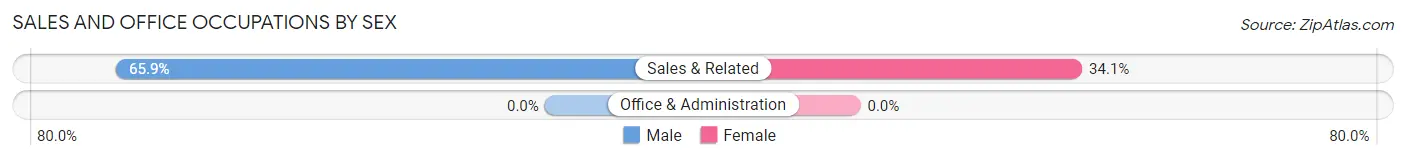
| Occupation | Male | Female |
| Sales & Related | 29 (65.9%) | 15 (34.1%) |
| Office & Administration | 0 (0.0%) | 0 (0.0%) |
| Total (Category) | 29 (65.9%) | 15 (34.1%) |
| Total (Overall) | 164 (62.4%) | 99 (37.6%) |
Natural Resources, Construction and Maintenance Occupations
The most common Natural Resources, Construction and Maintenance occupations in Horseshoe Bend are , and Construction & Extraction (58 | 22.1%).
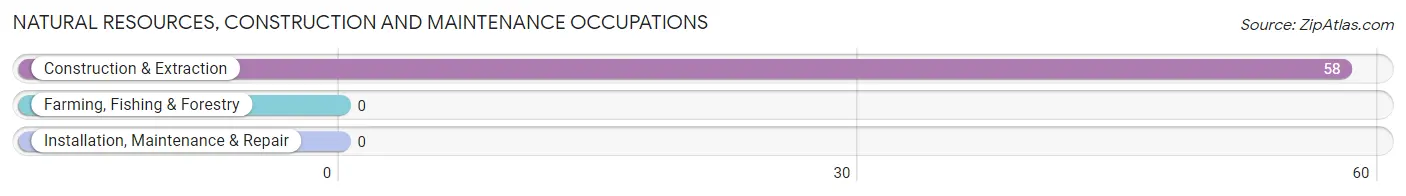
Natural Resources, Construction and Maintenance Occupations by Sex
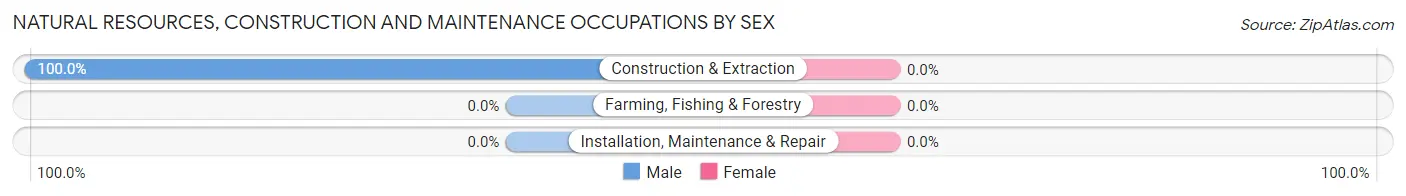
| Occupation | Male | Female |
| Farming, Fishing & Forestry | 0 (0.0%) | 0 (0.0%) |
| Construction & Extraction | 58 (100.0%) | 0 (0.0%) |
| Installation, Maintenance & Repair | 0 (0.0%) | 0 (0.0%) |
| Total (Category) | 58 (100.0%) | 0 (0.0%) |
| Total (Overall) | 164 (62.4%) | 99 (37.6%) |
Production, Transportation and Moving Occupations
The most common Production, Transportation and Moving occupations in Horseshoe Bend are Transportation (57 | 21.7%), and Production (33 | 12.6%).
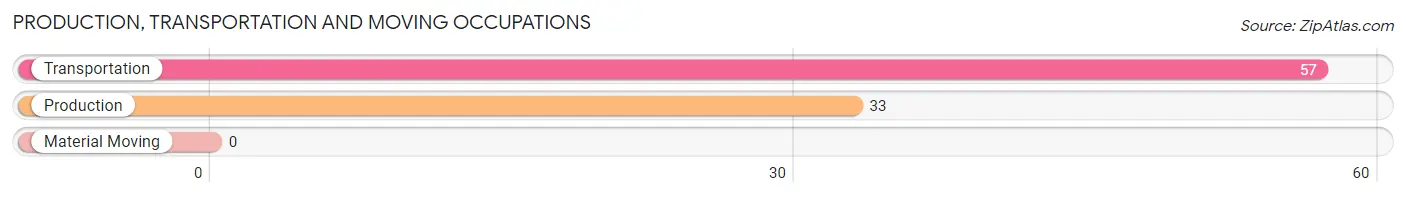
Production, Transportation and Moving Occupations by Sex
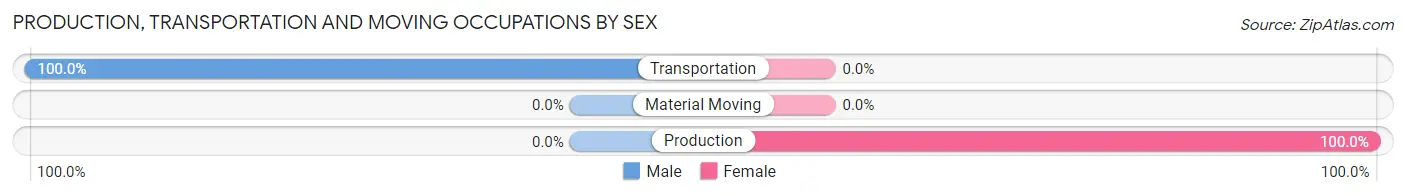
| Occupation | Male | Female |
| Production | 0 (0.0%) | 33 (100.0%) |
| Transportation | 57 (100.0%) | 0 (0.0%) |
| Material Moving | 0 (0.0%) | 0 (0.0%) |
| Total (Category) | 57 (63.3%) | 33 (36.7%) |
| Total (Overall) | 164 (62.4%) | 99 (37.6%) |
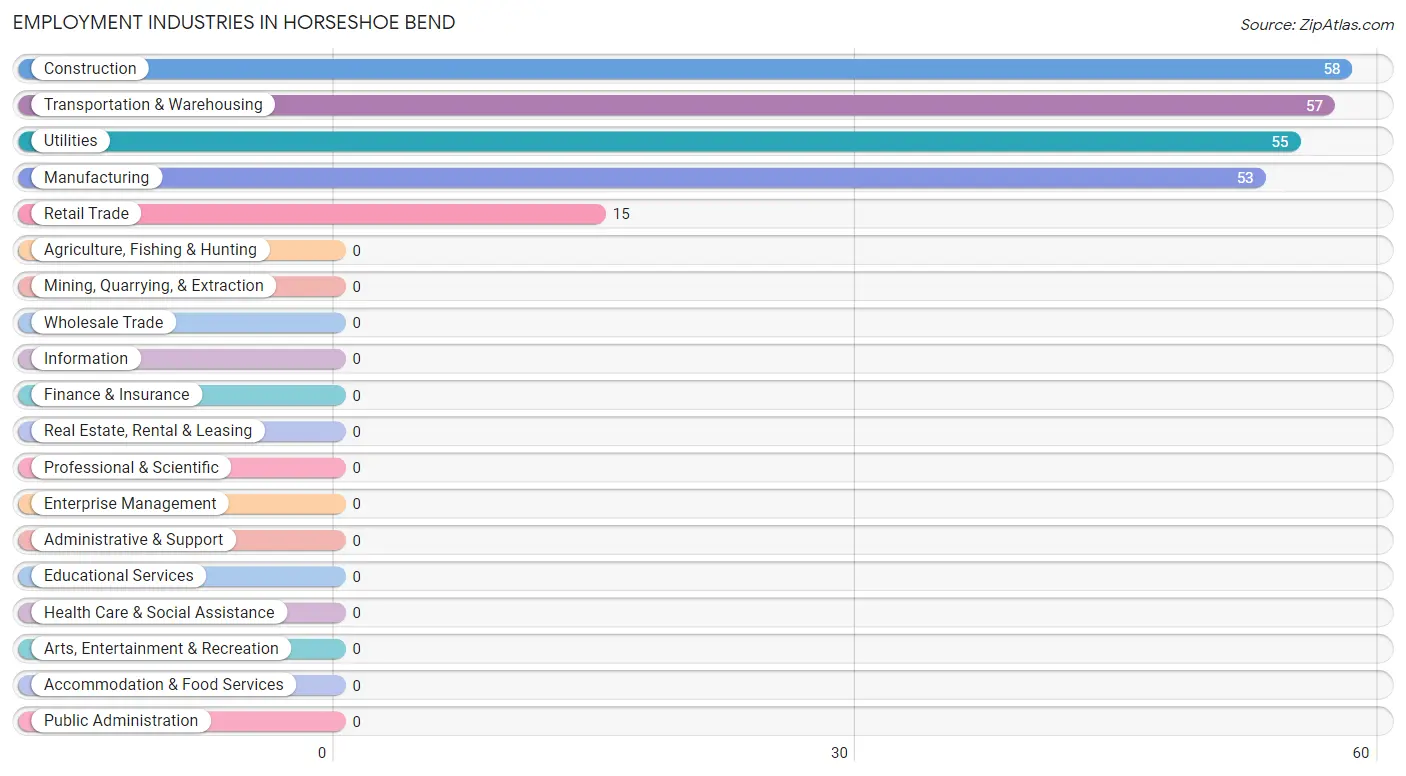
Employment Industries by Sex in Horseshoe Bend
Employment Industries in Horseshoe Bend
The major employment industries in Horseshoe Bend include Construction (58 | 22.1%), Transportation & Warehousing (57 | 21.7%), Utilities (55 | 20.9%), Manufacturing (53 | 20.2%), and Retail Trade (15 | 5.7%).
Employment Industries by Sex in Horseshoe Bend
The Horseshoe Bend industries that see more men than women are Construction (100.0%), Transportation & Warehousing (100.0%), and Utilities (52.7%), whereas the industries that tend to have a higher number of women are Retail Trade (100.0%), Manufacturing (62.3%), and Utilities (47.3%).
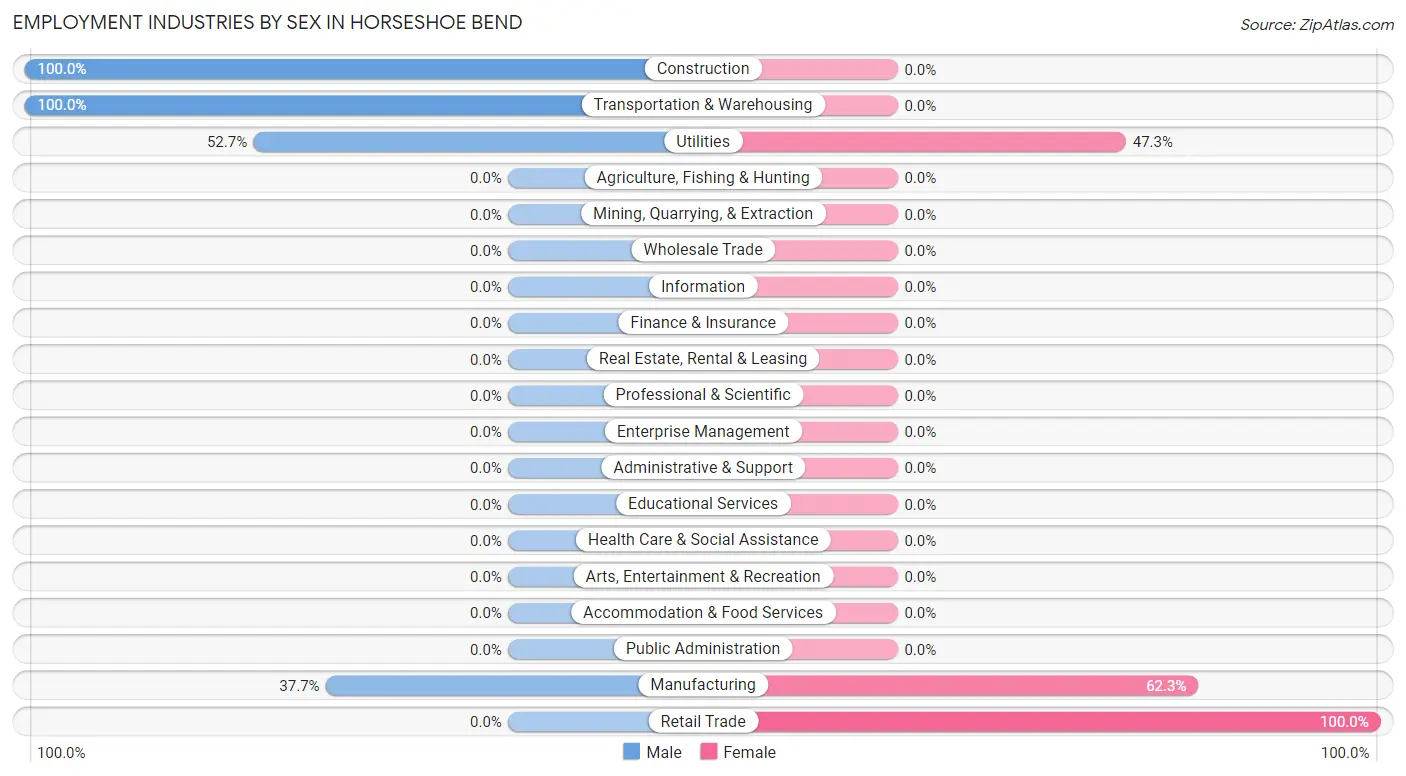
| Industry | Male | Female |
| Agriculture, Fishing & Hunting | 0 (0.0%) | 0 (0.0%) |
| Mining, Quarrying, & Extraction | 0 (0.0%) | 0 (0.0%) |
| Construction | 58 (100.0%) | 0 (0.0%) |
| Manufacturing | 20 (37.7%) | 33 (62.3%) |
| Wholesale Trade | 0 (0.0%) | 0 (0.0%) |
| Retail Trade | 0 (0.0%) | 15 (100.0%) |
| Transportation & Warehousing | 57 (100.0%) | 0 (0.0%) |
| Utilities | 29 (52.7%) | 26 (47.3%) |
| Information | 0 (0.0%) | 0 (0.0%) |
| Finance & Insurance | 0 (0.0%) | 0 (0.0%) |
| Real Estate, Rental & Leasing | 0 (0.0%) | 0 (0.0%) |
| Professional & Scientific | 0 (0.0%) | 0 (0.0%) |
| Enterprise Management | 0 (0.0%) | 0 (0.0%) |
| Administrative & Support | 0 (0.0%) | 0 (0.0%) |
| Educational Services | 0 (0.0%) | 0 (0.0%) |
| Health Care & Social Assistance | 0 (0.0%) | 0 (0.0%) |
| Arts, Entertainment & Recreation | 0 (0.0%) | 0 (0.0%) |
| Accommodation & Food Services | 0 (0.0%) | 0 (0.0%) |
| Public Administration | 0 (0.0%) | 0 (0.0%) |
| Total | 164 (62.4%) | 99 (37.6%) |
Education in Horseshoe Bend
School Enrollment in Horseshoe Bend
| School Level | # Students | % Students |
| Nursery / Preschool | 0 | 0.0% |
| Kindergarten | 0 | 0.0% |
| Elementary School | 0 | 0.0% |
| Middle School | 0 | 0.0% |
| High School | 0 | 0.0% |
| College / Undergraduate | 0 | 0.0% |
| Graduate / Professional | 0 | 0.0% |
| Total | 0 | 0.0% |
School Enrollment by Age by Funding Source in Horseshoe Bend
| Age Bracket | Public School | Private School |
| 3 to 4 Year Olds | 0 (0.0%) | 0 (0.0%) |
| 5 to 9 Year Old | 0 (0.0%) | 0 (0.0%) |
| 10 to 14 Year Olds | 0 (0.0%) | 0 (0.0%) |
| 15 to 17 Year Olds | 0 (0.0%) | 0 (0.0%) |
| 18 to 19 Year Olds | 0 (0.0%) | 0 (0.0%) |
| 20 to 24 Year Olds | 0 (0.0%) | 0 (0.0%) |
| 25 to 34 Year Olds | 0 (0.0%) | 0 (0.0%) |
| 35 Years and over | 0 (0.0%) | 0 (0.0%) |
| Total | 0 (0.0%) | 0 (0.0%) |
Educational Attainment by Field of Study in Horseshoe Bend
Business (46 | 51.1%), and education (44 | 48.9%) are the most common fields of study among 90 individuals in Horseshoe Bend who have obtained a bachelor's degree or higher.
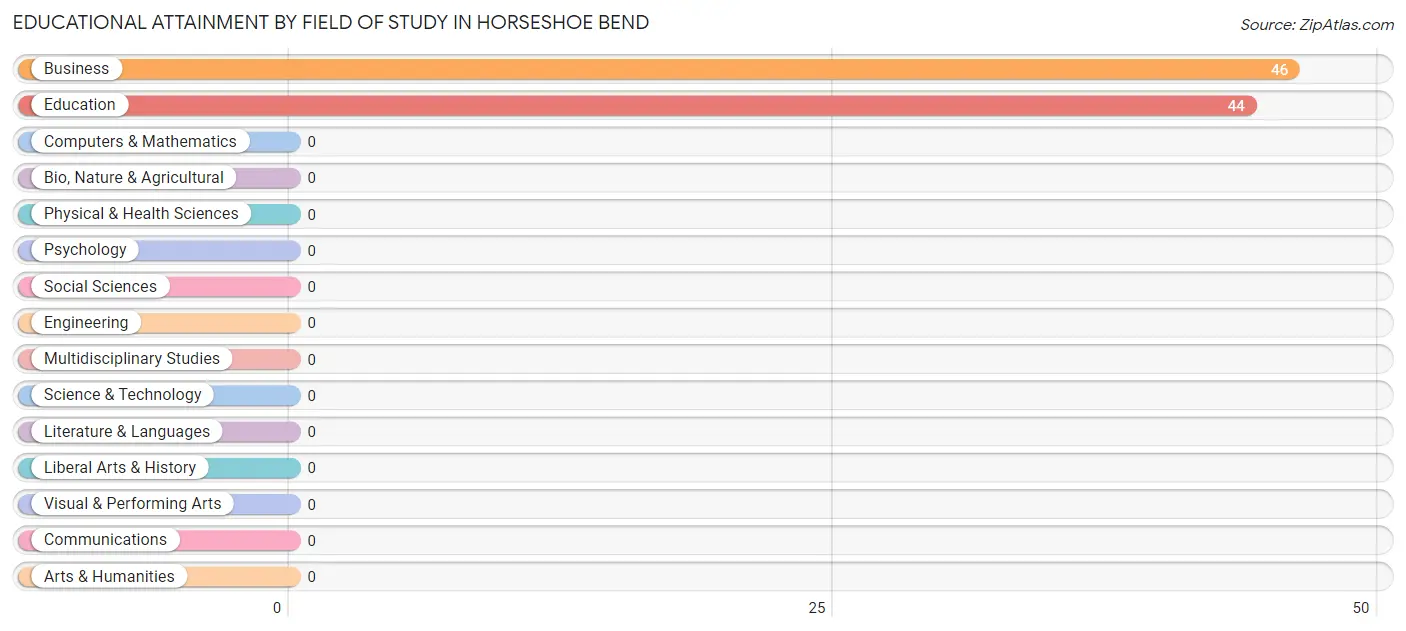
| Field of Study | # Graduates | % Graduates |
| Computers & Mathematics | 0 | 0.0% |
| Bio, Nature & Agricultural | 0 | 0.0% |
| Physical & Health Sciences | 0 | 0.0% |
| Psychology | 0 | 0.0% |
| Social Sciences | 0 | 0.0% |
| Engineering | 0 | 0.0% |
| Multidisciplinary Studies | 0 | 0.0% |
| Science & Technology | 0 | 0.0% |
| Business | 46 | 51.1% |
| Education | 44 | 48.9% |
| Literature & Languages | 0 | 0.0% |
| Liberal Arts & History | 0 | 0.0% |
| Visual & Performing Arts | 0 | 0.0% |
| Communications | 0 | 0.0% |
| Arts & Humanities | 0 | 0.0% |
| Total | 90 | 100.0% |
Transportation & Commute in Horseshoe Bend
Vehicle Availability by Sex in Horseshoe Bend
The most prevalent vehicle ownership categories in Horseshoe Bend are males with 3 vehicles (164, accounting for 100.0%) and females with 3 vehicles (74, making up 165.7%).
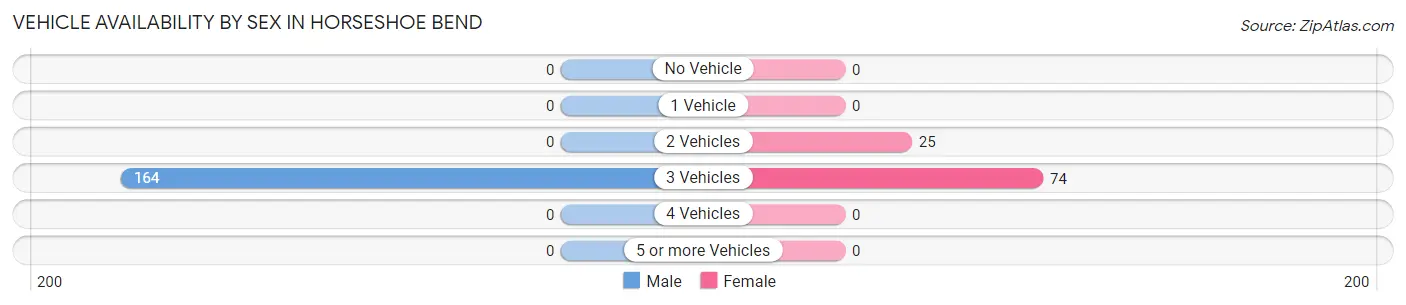
| Vehicles Available | Male | Female |
| No Vehicle | 0 (0.0%) | 0 (0.0%) |
| 1 Vehicle | 0 (0.0%) | 0 (0.0%) |
| 2 Vehicles | 0 (0.0%) | 25 (25.3%) |
| 3 Vehicles | 164 (100.0%) | 74 (74.8%) |
| 4 Vehicles | 0 (0.0%) | 0 (0.0%) |
| 5 or more Vehicles | 0 (0.0%) | 0 (0.0%) |
| Total | 164 (100.0%) | 99 (100.0%) |
Commute Time in Horseshoe Bend
The most frequently occuring commute durations in Horseshoe Bend are 60 to 89 minutes (91 commuters, 39.6%), 40 to 44 minutes (58 commuters, 25.2%), and 30 to 34 minutes (31 commuters, 13.5%).
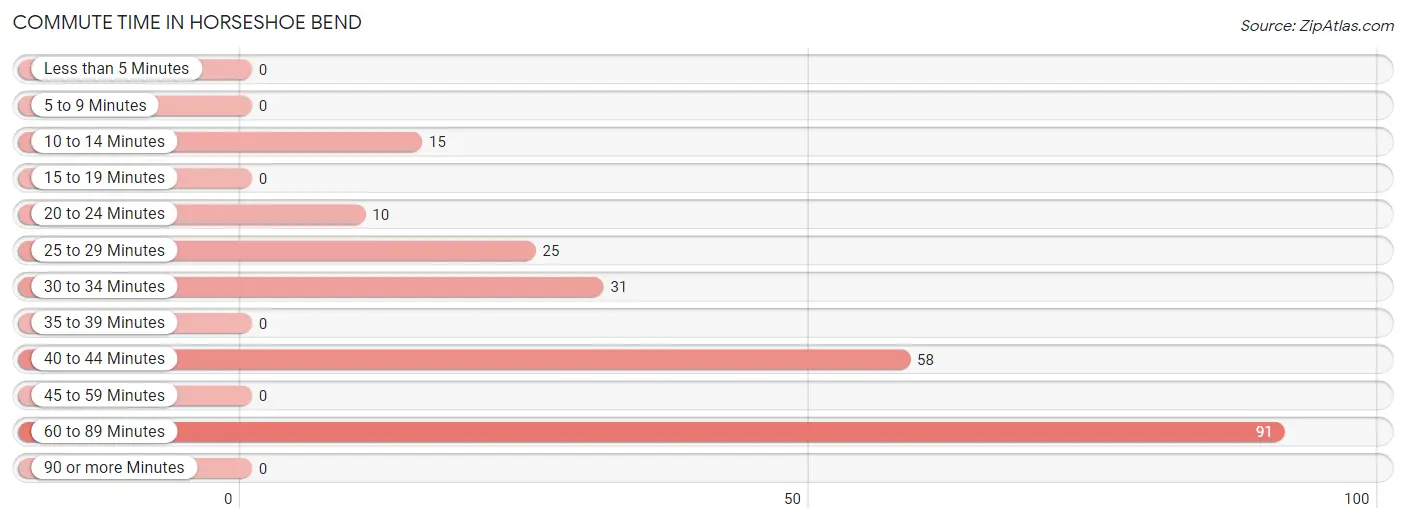
| Commute Time | # Commuters | % Commuters |
| Less than 5 Minutes | 0 | 0.0% |
| 5 to 9 Minutes | 0 | 0.0% |
| 10 to 14 Minutes | 15 | 6.5% |
| 15 to 19 Minutes | 0 | 0.0% |
| 20 to 24 Minutes | 10 | 4.3% |
| 25 to 29 Minutes | 25 | 10.9% |
| 30 to 34 Minutes | 31 | 13.5% |
| 35 to 39 Minutes | 0 | 0.0% |
| 40 to 44 Minutes | 58 | 25.2% |
| 45 to 59 Minutes | 0 | 0.0% |
| 60 to 89 Minutes | 91 | 39.6% |
| 90 or more Minutes | 0 | 0.0% |
Commute Time by Sex in Horseshoe Bend
The most common commute times in Horseshoe Bend are 60 to 89 minutes (65 commuters, 39.6%) for males and 60 to 89 minutes (26 commuters, 39.4%) for females.
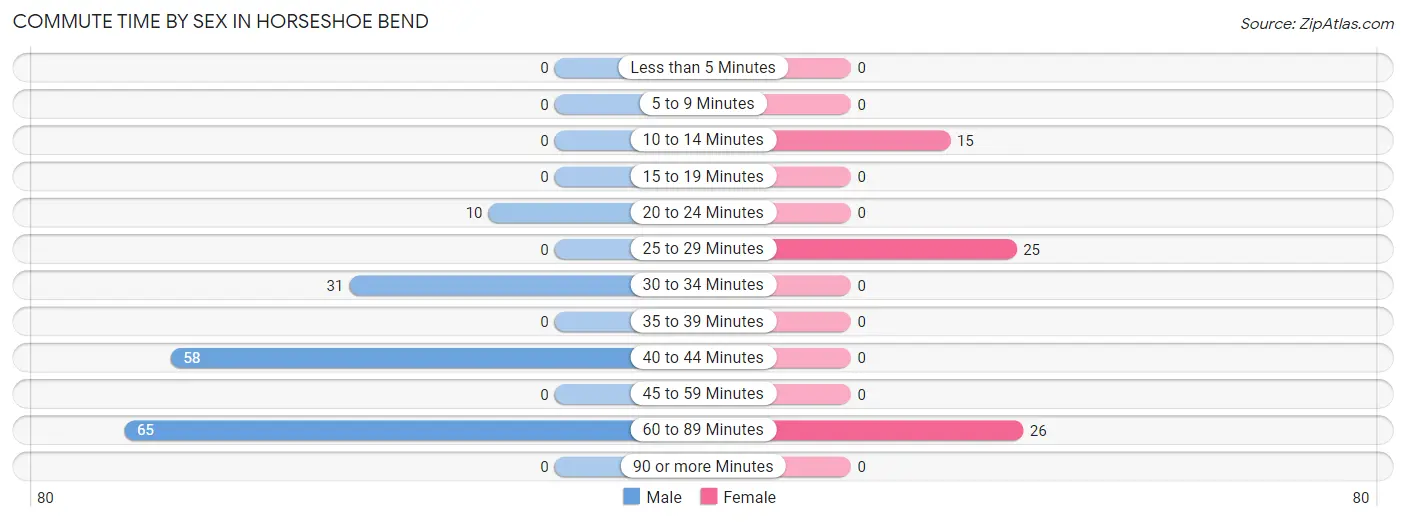
| Commute Time | Male | Female |
| Less than 5 Minutes | 0 (0.0%) | 0 (0.0%) |
| 5 to 9 Minutes | 0 (0.0%) | 0 (0.0%) |
| 10 to 14 Minutes | 0 (0.0%) | 15 (22.7%) |
| 15 to 19 Minutes | 0 (0.0%) | 0 (0.0%) |
| 20 to 24 Minutes | 10 (6.1%) | 0 (0.0%) |
| 25 to 29 Minutes | 0 (0.0%) | 25 (37.9%) |
| 30 to 34 Minutes | 31 (18.9%) | 0 (0.0%) |
| 35 to 39 Minutes | 0 (0.0%) | 0 (0.0%) |
| 40 to 44 Minutes | 58 (35.4%) | 0 (0.0%) |
| 45 to 59 Minutes | 0 (0.0%) | 0 (0.0%) |
| 60 to 89 Minutes | 65 (39.6%) | 26 (39.4%) |
| 90 or more Minutes | 0 (0.0%) | 0 (0.0%) |
Time of Departure to Work by Sex in Horseshoe Bend
The most frequent times of departure to work in Horseshoe Bend are 8:00 AM to 8:29 AM (58, 35.4%) for males and 6:00 AM to 6:29 AM (26, 39.4%) for females.
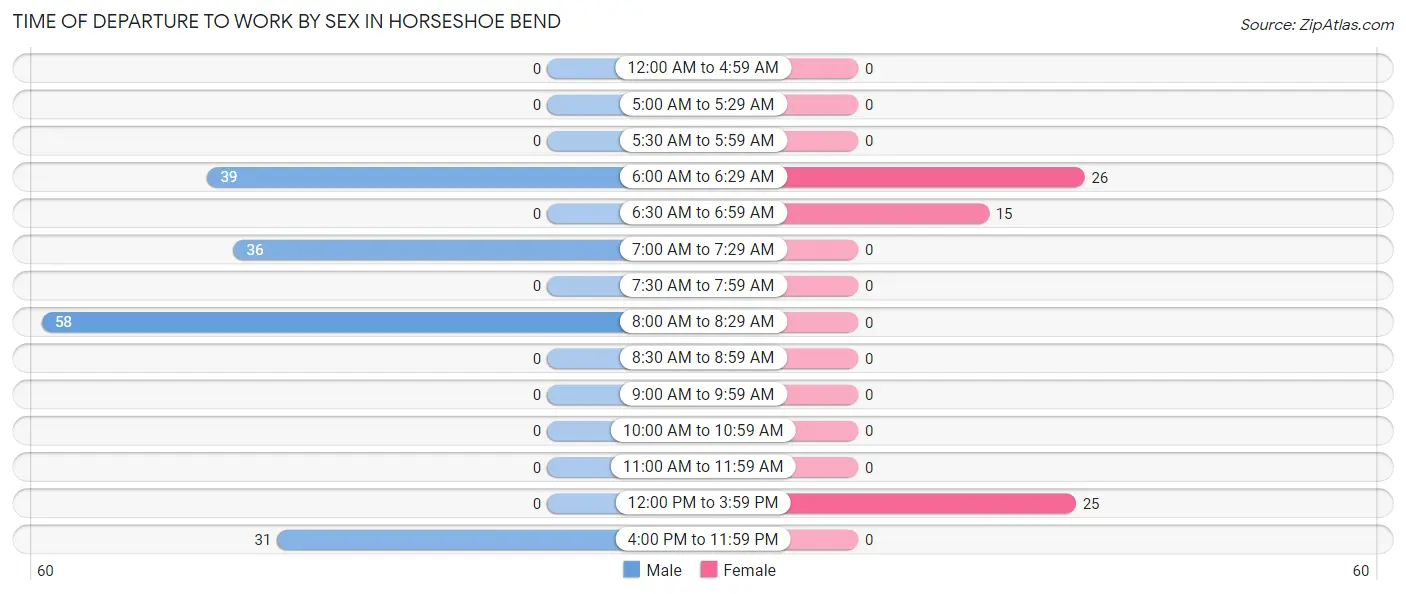
| Time of Departure | Male | Female |
| 12:00 AM to 4:59 AM | 0 (0.0%) | 0 (0.0%) |
| 5:00 AM to 5:29 AM | 0 (0.0%) | 0 (0.0%) |
| 5:30 AM to 5:59 AM | 0 (0.0%) | 0 (0.0%) |
| 6:00 AM to 6:29 AM | 39 (23.8%) | 26 (39.4%) |
| 6:30 AM to 6:59 AM | 0 (0.0%) | 15 (22.7%) |
| 7:00 AM to 7:29 AM | 36 (22.0%) | 0 (0.0%) |
| 7:30 AM to 7:59 AM | 0 (0.0%) | 0 (0.0%) |
| 8:00 AM to 8:29 AM | 58 (35.4%) | 0 (0.0%) |
| 8:30 AM to 8:59 AM | 0 (0.0%) | 0 (0.0%) |
| 9:00 AM to 9:59 AM | 0 (0.0%) | 0 (0.0%) |
| 10:00 AM to 10:59 AM | 0 (0.0%) | 0 (0.0%) |
| 11:00 AM to 11:59 AM | 0 (0.0%) | 0 (0.0%) |
| 12:00 PM to 3:59 PM | 0 (0.0%) | 25 (37.9%) |
| 4:00 PM to 11:59 PM | 31 (18.9%) | 0 (0.0%) |
| Total | 164 (100.0%) | 66 (100.0%) |
Housing Occupancy in Horseshoe Bend
Occupancy by Ownership in Horseshoe Bend
Of the total 353 dwellings in Horseshoe Bend, owner-occupied units account for 295 (83.6%), while renter-occupied units make up 58 (16.4%).
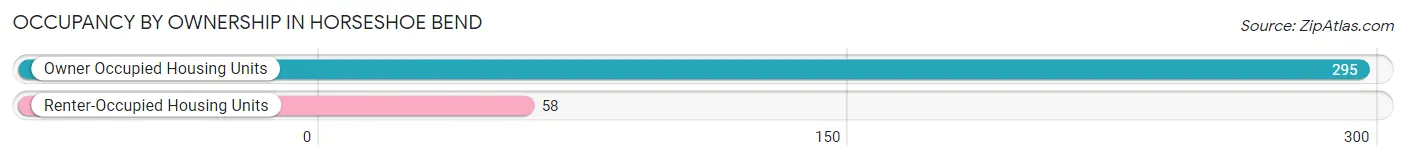
| Occupancy | # Housing Units | % Housing Units |
| Owner Occupied Housing Units | 295 | 83.6% |
| Renter-Occupied Housing Units | 58 | 16.4% |
| Total Occupied Housing Units | 353 | 100.0% |
Occupancy by Household Size in Horseshoe Bend
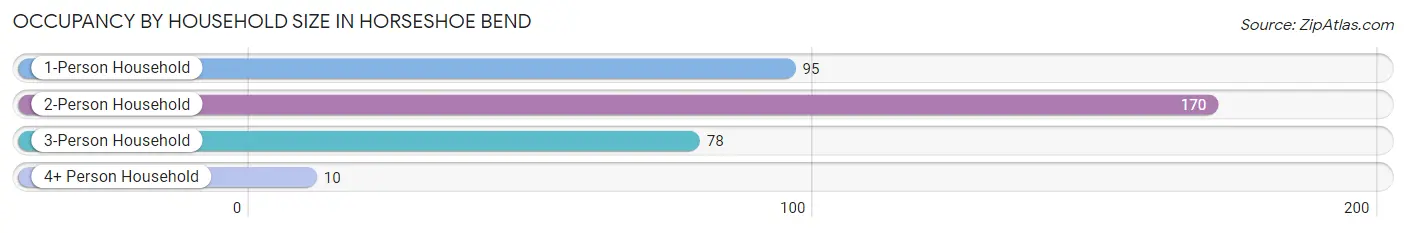
| Household Size | # Housing Units | % Housing Units |
| 1-Person Household | 95 | 26.9% |
| 2-Person Household | 170 | 48.2% |
| 3-Person Household | 78 | 22.1% |
| 4+ Person Household | 10 | 2.8% |
| Total Housing Units | 353 | 100.0% |
Occupancy by Ownership by Household Size in Horseshoe Bend
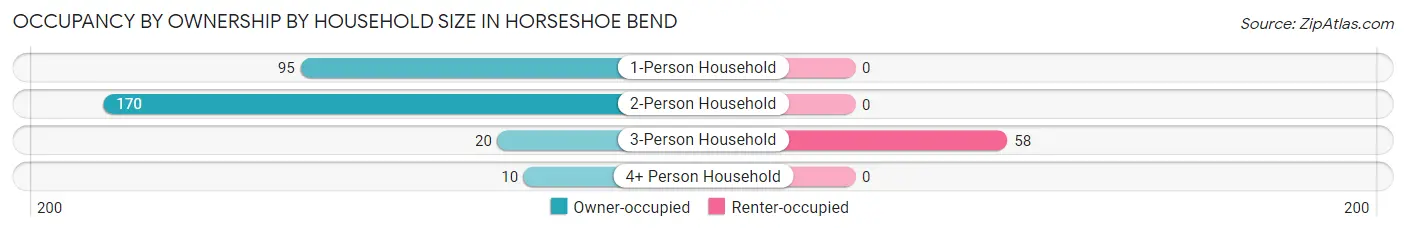
| Household Size | Owner-occupied | Renter-occupied |
| 1-Person Household | 95 (100.0%) | 0 (0.0%) |
| 2-Person Household | 170 (100.0%) | 0 (0.0%) |
| 3-Person Household | 20 (25.6%) | 58 (74.4%) |
| 4+ Person Household | 10 (100.0%) | 0 (0.0%) |
| Total Housing Units | 295 (83.6%) | 58 (16.4%) |
Occupancy by Educational Attainment in Horseshoe Bend
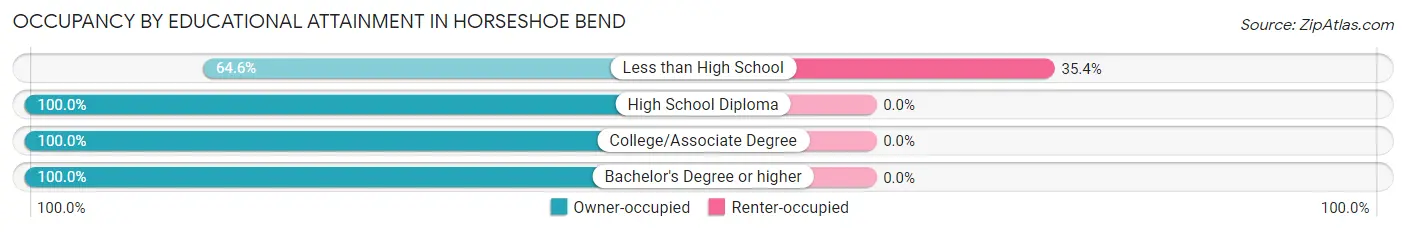
| Household Size | Owner-occupied | Renter-occupied |
| Less than High School | 106 (64.6%) | 58 (35.4%) |
| High School Diploma | 65 (100.0%) | 0 (0.0%) |
| College/Associate Degree | 60 (100.0%) | 0 (0.0%) |
| Bachelor's Degree or higher | 64 (100.0%) | 0 (0.0%) |
Occupancy by Age of Householder in Horseshoe Bend
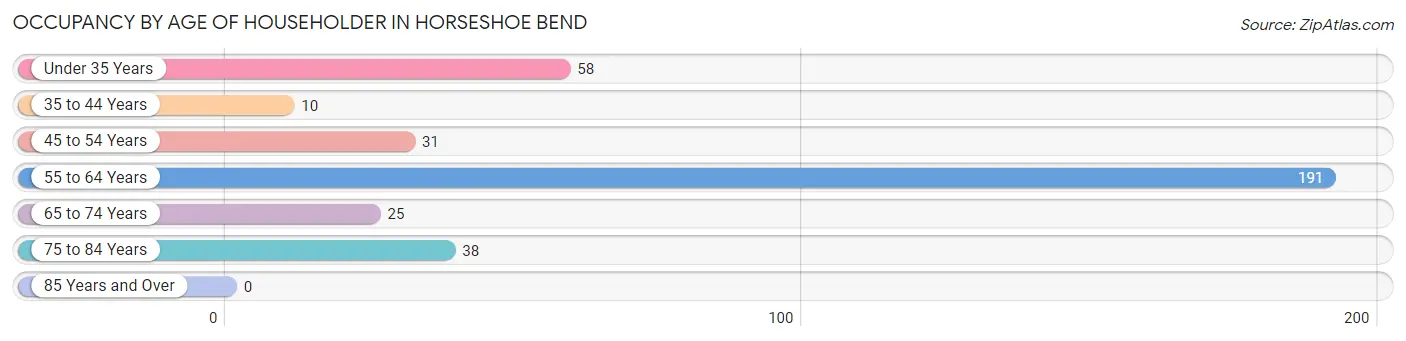
| Age Bracket | # Households | % Households |
| Under 35 Years | 58 | 16.4% |
| 35 to 44 Years | 10 | 2.8% |
| 45 to 54 Years | 31 | 8.8% |
| 55 to 64 Years | 191 | 54.1% |
| 65 to 74 Years | 25 | 7.1% |
| 75 to 84 Years | 38 | 10.8% |
| 85 Years and Over | 0 | 0.0% |
| Total | 353 | 100.0% |
Housing Finances in Horseshoe Bend
Median Income by Occupancy in Horseshoe Bend
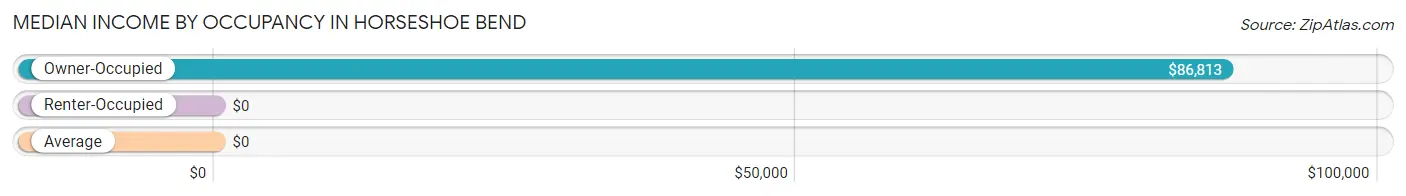
| Occupancy Type | # Households | Median Income |
| Owner-Occupied | 295 (83.6%) | $86,813 |
| Renter-Occupied | 58 (16.4%) | $0 |
| Average | 353 (100.0%) | $0 |
Occupancy by Householder Income Bracket in Horseshoe Bend
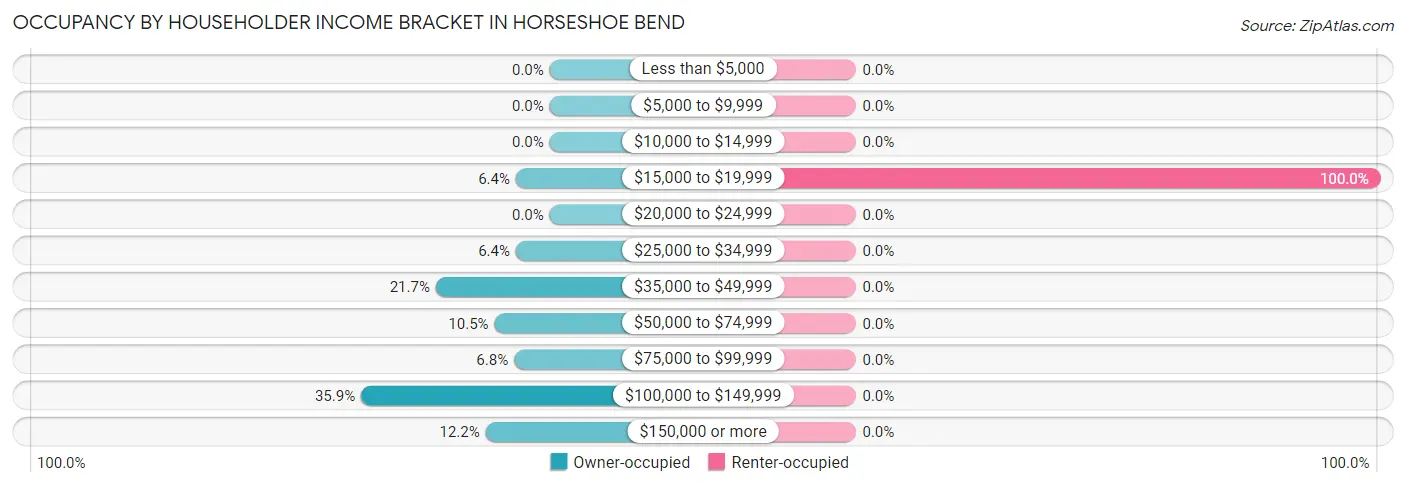
| Income Bracket | Owner-occupied | Renter-occupied |
| Less than $5,000 | 0 (0.0%) | 0 (0.0%) |
| $5,000 to $9,999 | 0 (0.0%) | 0 (0.0%) |
| $10,000 to $14,999 | 0 (0.0%) | 0 (0.0%) |
| $15,000 to $19,999 | 19 (6.4%) | 58 (100.0%) |
| $20,000 to $24,999 | 0 (0.0%) | 0 (0.0%) |
| $25,000 to $34,999 | 19 (6.4%) | 0 (0.0%) |
| $35,000 to $49,999 | 64 (21.7%) | 0 (0.0%) |
| $50,000 to $74,999 | 31 (10.5%) | 0 (0.0%) |
| $75,000 to $99,999 | 20 (6.8%) | 0 (0.0%) |
| $100,000 to $149,999 | 106 (35.9%) | 0 (0.0%) |
| $150,000 or more | 36 (12.2%) | 0 (0.0%) |
| Total | 295 (100.0%) | 58 (100.0%) |
Monthly Housing Cost Tiers in Horseshoe Bend
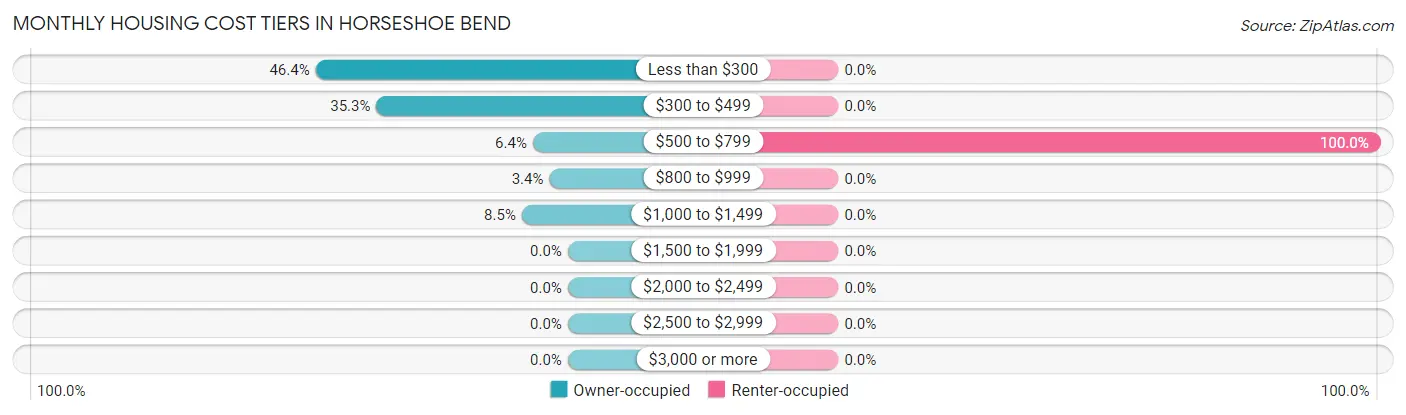
| Monthly Cost | Owner-occupied | Renter-occupied |
| Less than $300 | 137 (46.4%) | 0 (0.0%) |
| $300 to $499 | 104 (35.2%) | 0 (0.0%) |
| $500 to $799 | 19 (6.4%) | 58 (100.0%) |
| $800 to $999 | 10 (3.4%) | 0 (0.0%) |
| $1,000 to $1,499 | 25 (8.5%) | 0 (0.0%) |
| $1,500 to $1,999 | 0 (0.0%) | 0 (0.0%) |
| $2,000 to $2,499 | 0 (0.0%) | 0 (0.0%) |
| $2,500 to $2,999 | 0 (0.0%) | 0 (0.0%) |
| $3,000 or more | 0 (0.0%) | 0 (0.0%) |
| Total | 295 (100.0%) | 58 (100.0%) |
Physical Housing Characteristics in Horseshoe Bend
Housing Structures in Horseshoe Bend
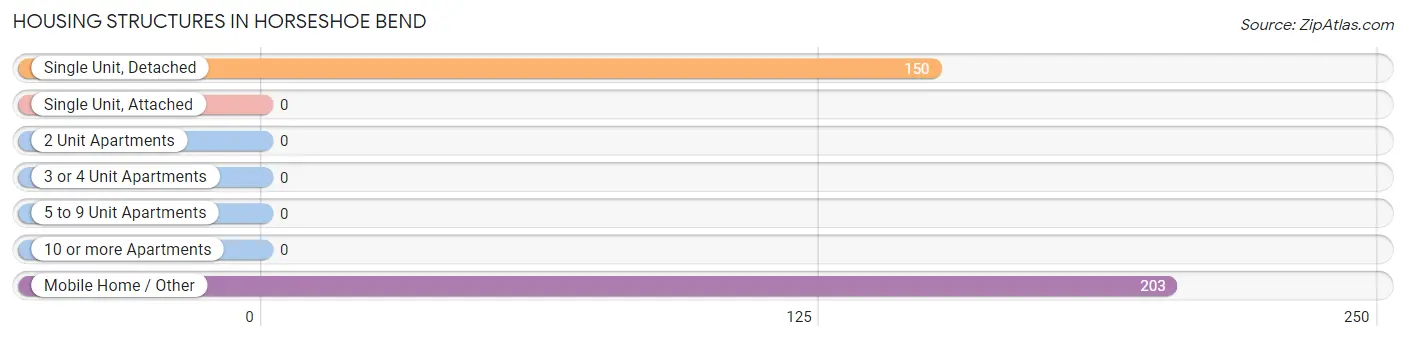
| Structure Type | # Housing Units | % Housing Units |
| Single Unit, Detached | 150 | 42.5% |
| Single Unit, Attached | 0 | 0.0% |
| 2 Unit Apartments | 0 | 0.0% |
| 3 or 4 Unit Apartments | 0 | 0.0% |
| 5 to 9 Unit Apartments | 0 | 0.0% |
| 10 or more Apartments | 0 | 0.0% |
| Mobile Home / Other | 203 | 57.5% |
| Total | 353 | 100.0% |
Housing Structures by Occupancy in Horseshoe Bend
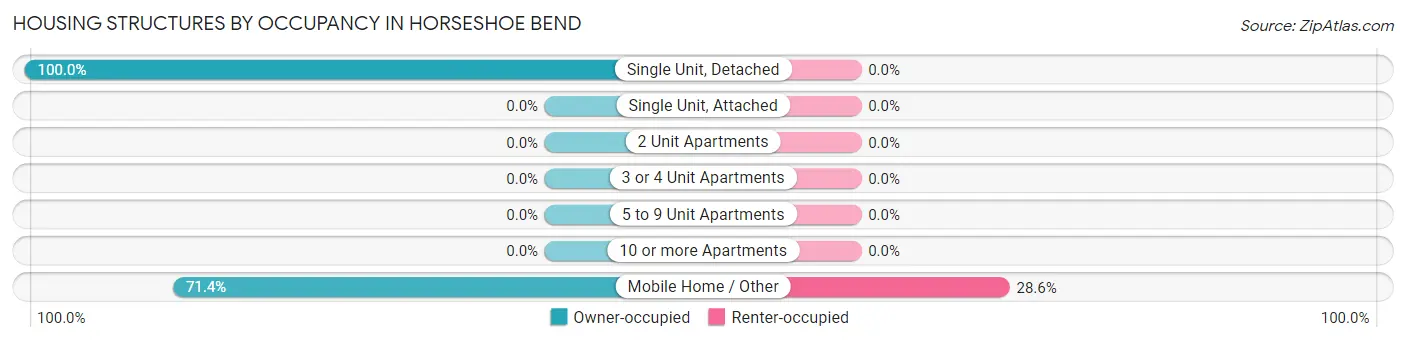
| Structure Type | Owner-occupied | Renter-occupied |
| Single Unit, Detached | 150 (100.0%) | 0 (0.0%) |
| Single Unit, Attached | 0 (0.0%) | 0 (0.0%) |
| 2 Unit Apartments | 0 (0.0%) | 0 (0.0%) |
| 3 or 4 Unit Apartments | 0 (0.0%) | 0 (0.0%) |
| 5 to 9 Unit Apartments | 0 (0.0%) | 0 (0.0%) |
| 10 or more Apartments | 0 (0.0%) | 0 (0.0%) |
| Mobile Home / Other | 145 (71.4%) | 58 (28.6%) |
| Total | 295 (83.6%) | 58 (16.4%) |
Housing Structures by Number of Rooms in Horseshoe Bend
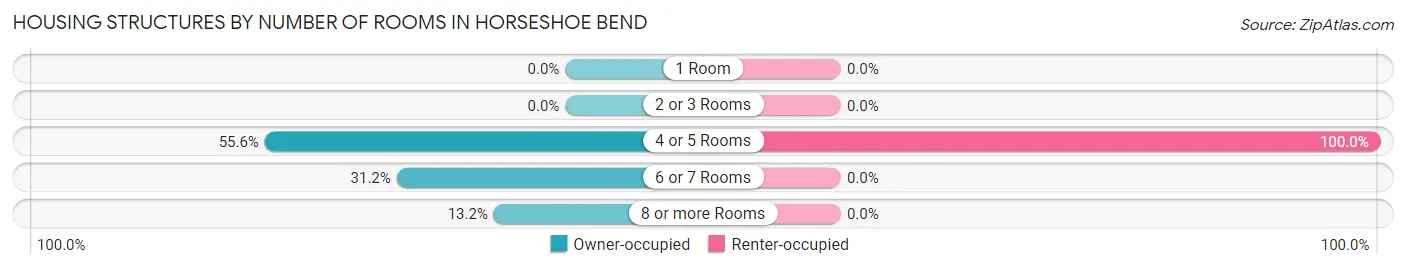
| Number of Rooms | Owner-occupied | Renter-occupied |
| 1 Room | 0 (0.0%) | 0 (0.0%) |
| 2 or 3 Rooms | 0 (0.0%) | 0 (0.0%) |
| 4 or 5 Rooms | 164 (55.6%) | 58 (100.0%) |
| 6 or 7 Rooms | 92 (31.2%) | 0 (0.0%) |
| 8 or more Rooms | 39 (13.2%) | 0 (0.0%) |
| Total | 295 (100.0%) | 58 (100.0%) |
Housing Structure by Heating Type in Horseshoe Bend
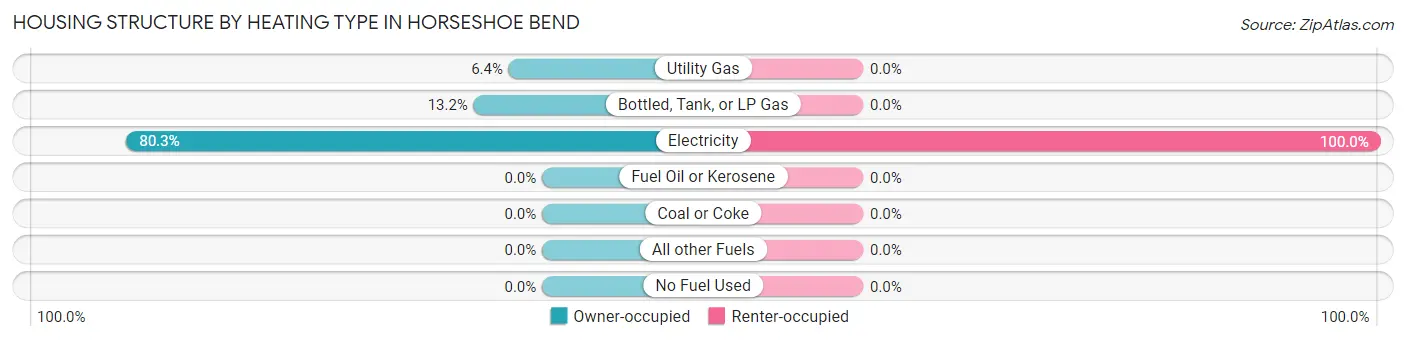
| Heating Type | Owner-occupied | Renter-occupied |
| Utility Gas | 19 (6.4%) | 0 (0.0%) |
| Bottled, Tank, or LP Gas | 39 (13.2%) | 0 (0.0%) |
| Electricity | 237 (80.3%) | 58 (100.0%) |
| Fuel Oil or Kerosene | 0 (0.0%) | 0 (0.0%) |
| Coal or Coke | 0 (0.0%) | 0 (0.0%) |
| All other Fuels | 0 (0.0%) | 0 (0.0%) |
| No Fuel Used | 0 (0.0%) | 0 (0.0%) |
| Total | 295 (100.0%) | 58 (100.0%) |
Household Vehicle Usage in Horseshoe Bend
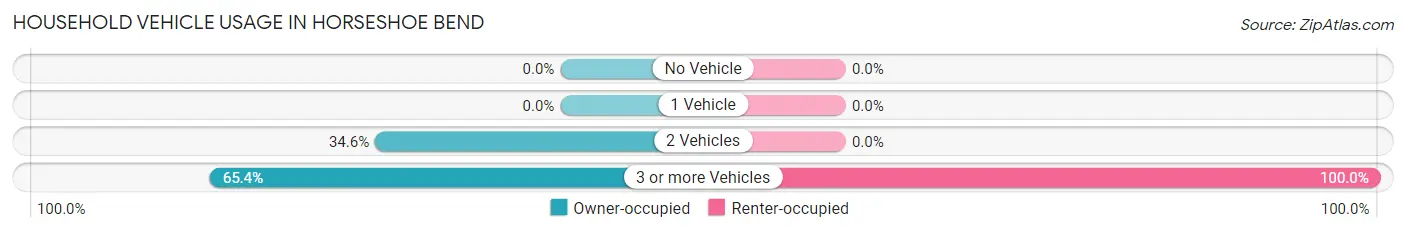
| Vehicles per Household | Owner-occupied | Renter-occupied |
| No Vehicle | 0 (0.0%) | 0 (0.0%) |
| 1 Vehicle | 0 (0.0%) | 0 (0.0%) |
| 2 Vehicles | 102 (34.6%) | 0 (0.0%) |
| 3 or more Vehicles | 193 (65.4%) | 58 (100.0%) |
| Total | 295 (100.0%) | 58 (100.0%) |
Real Estate & Mortgages in Horseshoe Bend
Real Estate and Mortgage Overview in Horseshoe Bend
| Characteristic | Without Mortgage | With Mortgage |
| Housing Units | 260 | 35 |
| Median Property Value | $93,200 | $0 |
| Median Household Income | $102,547 | $10 |
| Monthly Housing Costs | $289 | $0 |
| Real Estate Taxes | - | - |
Property Value by Mortgage Status in Horseshoe Bend
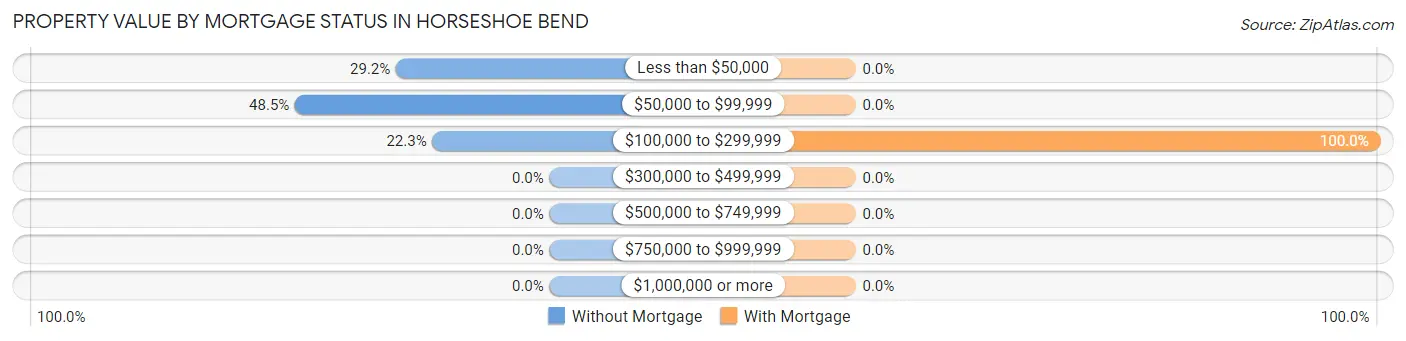
| Property Value | Without Mortgage | With Mortgage |
| Less than $50,000 | 76 (29.2%) | 0 (0.0%) |
| $50,000 to $99,999 | 126 (48.5%) | 0 (0.0%) |
| $100,000 to $299,999 | 58 (22.3%) | 35 (100.0%) |
| $300,000 to $499,999 | 0 (0.0%) | 0 (0.0%) |
| $500,000 to $749,999 | 0 (0.0%) | 0 (0.0%) |
| $750,000 to $999,999 | 0 (0.0%) | 0 (0.0%) |
| $1,000,000 or more | 0 (0.0%) | 0 (0.0%) |
| Total | 260 (100.0%) | 35 (100.0%) |
Household Income by Mortgage Status in Horseshoe Bend
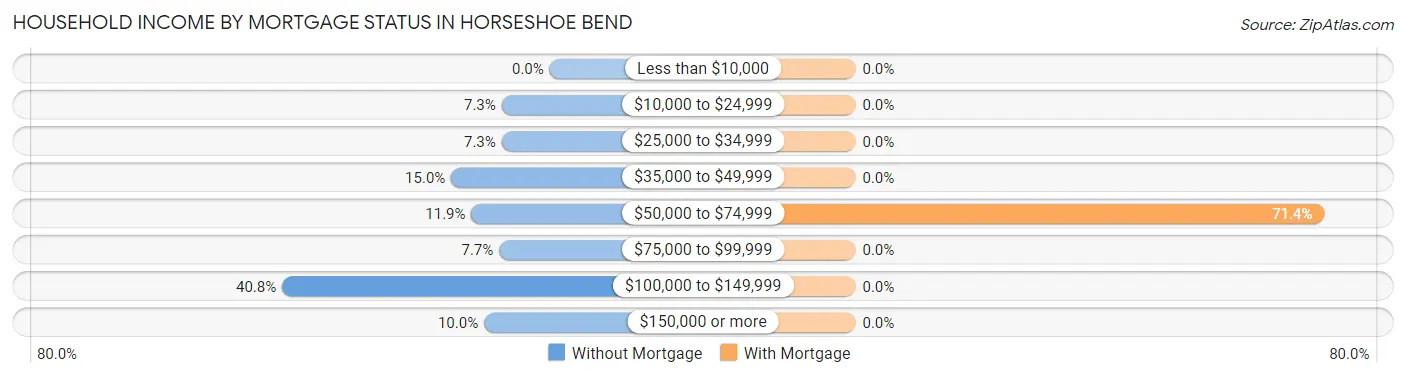
| Household Income | Without Mortgage | With Mortgage |
| Less than $10,000 | 0 (0.0%) | 0 (0.0%) |
| $10,000 to $24,999 | 19 (7.3%) | 0 (0.0%) |
| $25,000 to $34,999 | 19 (7.3%) | 0 (0.0%) |
| $35,000 to $49,999 | 39 (15.0%) | 0 (0.0%) |
| $50,000 to $74,999 | 31 (11.9%) | 25 (71.4%) |
| $75,000 to $99,999 | 20 (7.7%) | 0 (0.0%) |
| $100,000 to $149,999 | 106 (40.8%) | 0 (0.0%) |
| $150,000 or more | 26 (10.0%) | 0 (0.0%) |
| Total | 260 (100.0%) | 35 (100.0%) |
Property Value to Household Income Ratio in Horseshoe Bend
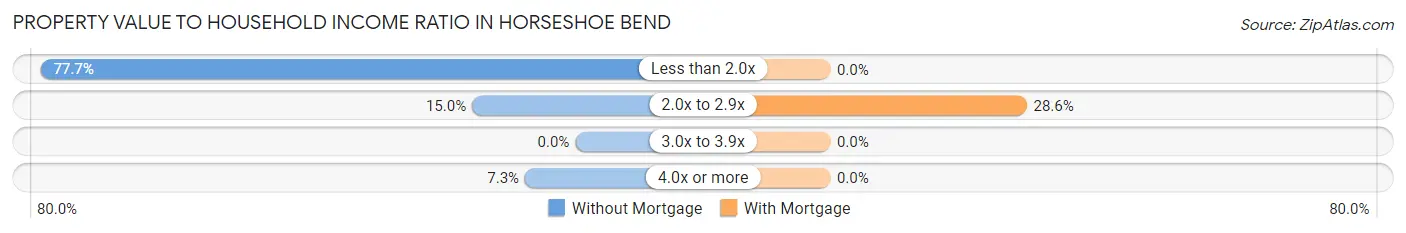
| Value-to-Income Ratio | Without Mortgage | With Mortgage |
| Less than 2.0x | 202 (77.7%) | 0 (0.0%) |
| 2.0x to 2.9x | 39 (15.0%) | 10 (28.6%) |
| 3.0x to 3.9x | 0 (0.0%) | 0 (0.0%) |
| 4.0x or more | 19 (7.3%) | 0 (0.0%) |
| Total | 260 (100.0%) | 35 (100.0%) |
Real Estate Taxes by Mortgage Status in Horseshoe Bend
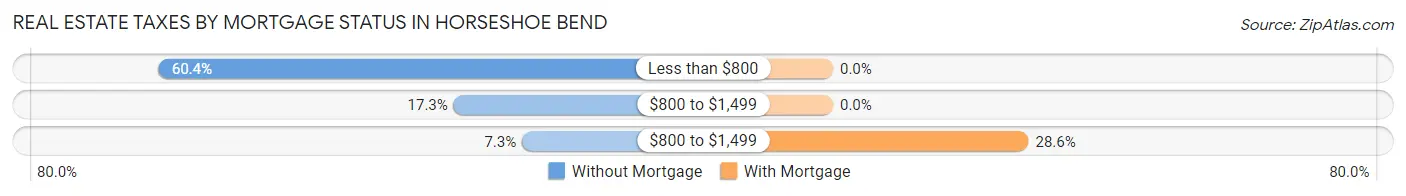
| Property Taxes | Without Mortgage | With Mortgage |
| Less than $800 | 157 (60.4%) | 0 (0.0%) |
| $800 to $1,499 | 45 (17.3%) | 0 (0.0%) |
| $800 to $1,499 | 19 (7.3%) | 10 (28.6%) |
| Total | 260 (100.0%) | 35 (100.0%) |
Health & Disability in Horseshoe Bend
Health Insurance Coverage by Age in Horseshoe Bend
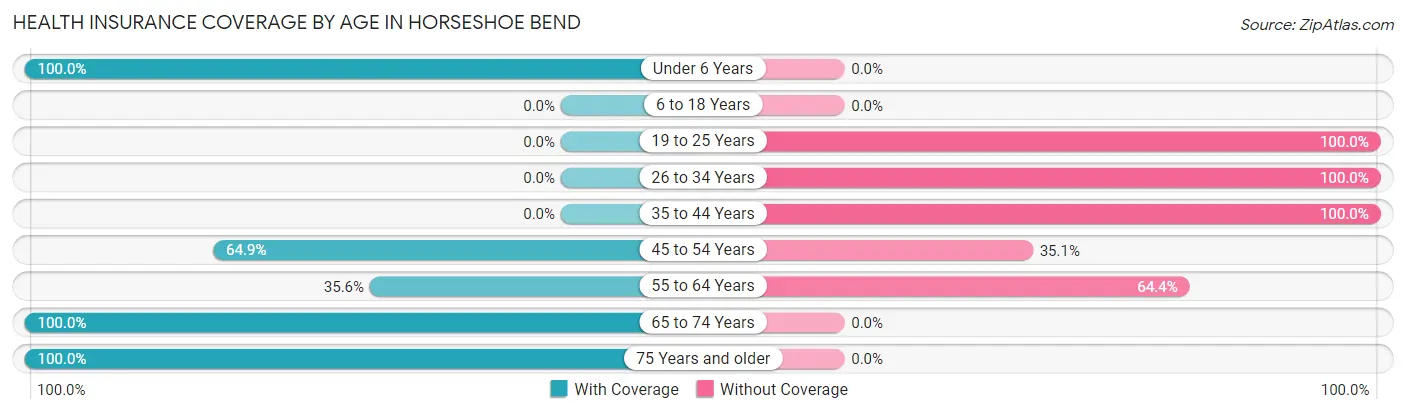
| Age Bracket | With Coverage | Without Coverage |
| Under 6 Years | 42 (100.0%) | 0 (0.0%) |
| 6 to 18 Years | 0 (0.0%) | 0 (0.0%) |
| 19 to 25 Years | 0 (0.0%) | 99 (100.0%) |
| 26 to 34 Years | 0 (0.0%) | 91 (100.0%) |
| 35 to 44 Years | 0 (0.0%) | 10 (100.0%) |
| 45 to 54 Years | 48 (64.9%) | 26 (35.1%) |
| 55 to 64 Years | 114 (35.6%) | 206 (64.4%) |
| 65 to 74 Years | 39 (100.0%) | 0 (0.0%) |
| 75 Years and older | 79 (100.0%) | 0 (0.0%) |
| Total | 322 (42.7%) | 432 (57.3%) |
Health Insurance Coverage by Citizenship Status in Horseshoe Bend
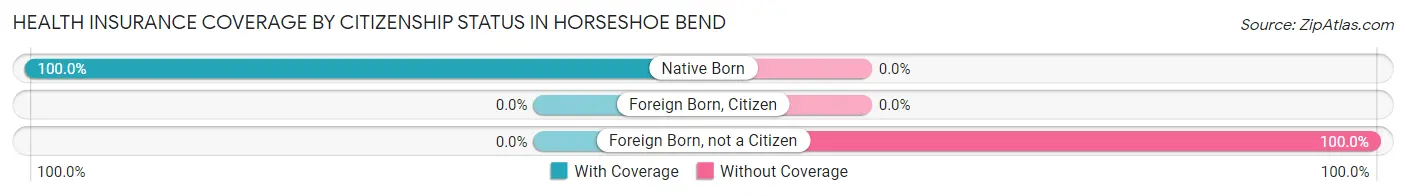
| Citizenship Status | With Coverage | Without Coverage |
| Native Born | 42 (100.0%) | 0 (0.0%) |
| Foreign Born, Citizen | 0 (0.0%) | 0 (0.0%) |
| Foreign Born, not a Citizen | 0 (0.0%) | 99 (100.0%) |
Health Insurance Coverage by Household Income in Horseshoe Bend
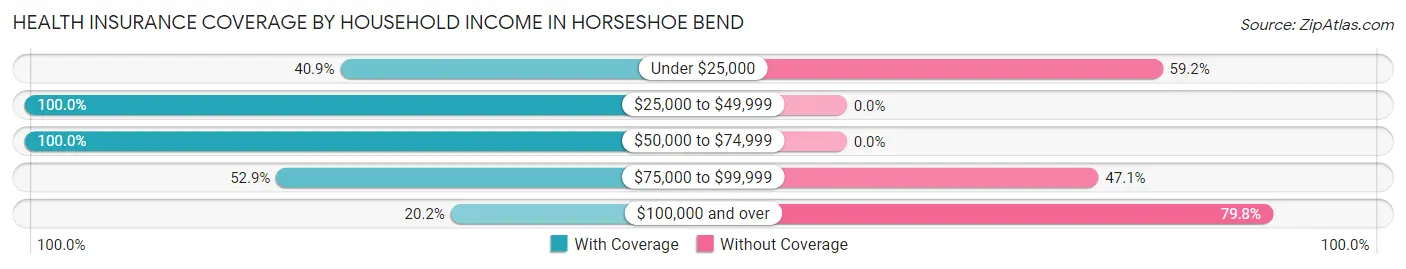
| Household Income | With Coverage | Without Coverage |
| Under $25,000 | 87 (40.8%) | 126 (59.2%) |
| $25,000 to $49,999 | 98 (100.0%) | 0 (0.0%) |
| $50,000 to $74,999 | 31 (100.0%) | 0 (0.0%) |
| $75,000 to $99,999 | 37 (52.9%) | 33 (47.1%) |
| $100,000 and over | 69 (20.2%) | 273 (79.8%) |
Public vs Private Health Insurance Coverage by Age in Horseshoe Bend
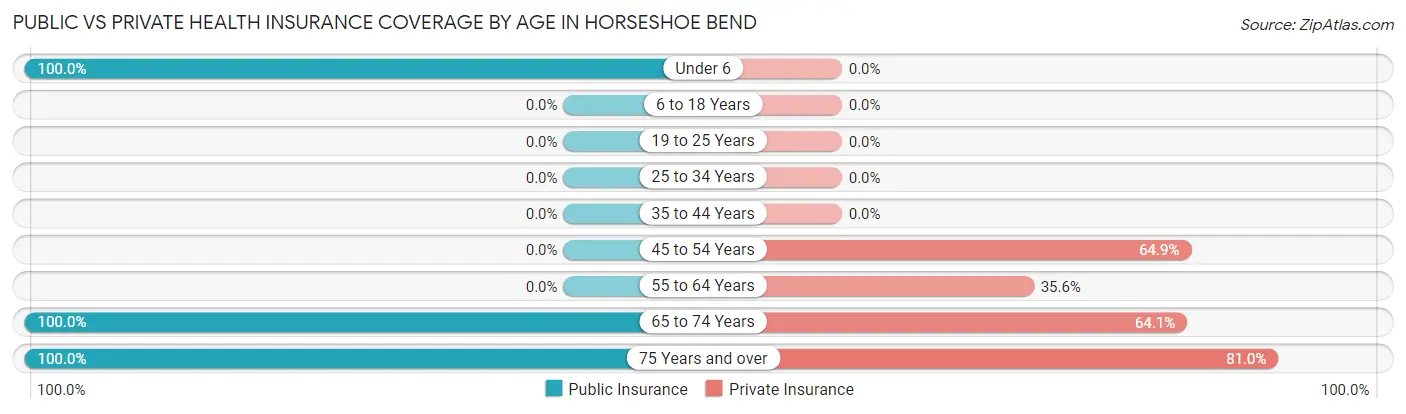
| Age Bracket | Public Insurance | Private Insurance |
| Under 6 | 42 (100.0%) | 0 (0.0%) |
| 6 to 18 Years | 0 (0.0%) | 0 (0.0%) |
| 19 to 25 Years | 0 (0.0%) | 0 (0.0%) |
| 25 to 34 Years | 0 (0.0%) | 0 (0.0%) |
| 35 to 44 Years | 0 (0.0%) | 0 (0.0%) |
| 45 to 54 Years | 0 (0.0%) | 48 (64.9%) |
| 55 to 64 Years | 0 (0.0%) | 114 (35.6%) |
| 65 to 74 Years | 39 (100.0%) | 25 (64.1%) |
| 75 Years and over | 79 (100.0%) | 64 (81.0%) |
| Total | 160 (21.2%) | 251 (33.3%) |
Disability Status by Sex by Age in Horseshoe Bend
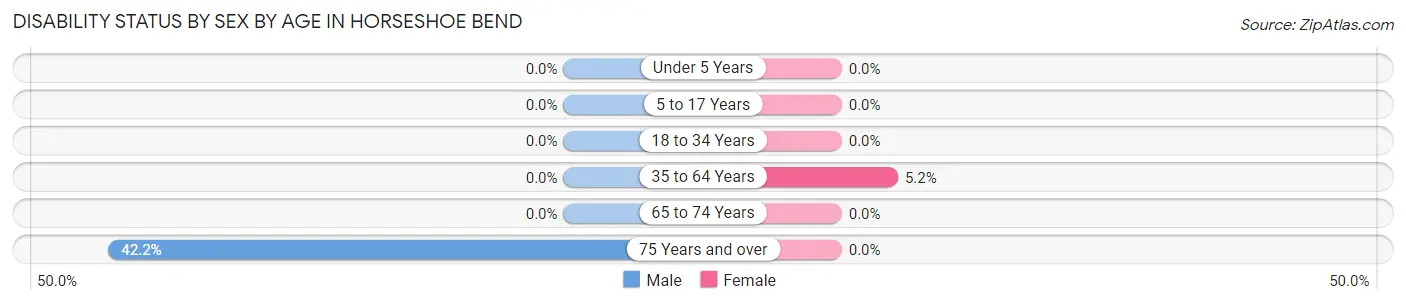
| Age Bracket | Male | Female |
| Under 5 Years | 0 (0.0%) | 0 (0.0%) |
| 5 to 17 Years | 0 (0.0%) | 0 (0.0%) |
| 18 to 34 Years | 0 (0.0%) | 0 (0.0%) |
| 35 to 64 Years | 0 (0.0%) | 10 (5.2%) |
| 65 to 74 Years | 0 (0.0%) | 0 (0.0%) |
| 75 Years and over | 19 (42.2%) | 0 (0.0%) |
Disability Class by Sex by Age in Horseshoe Bend
Disability Class: Hearing Difficulty
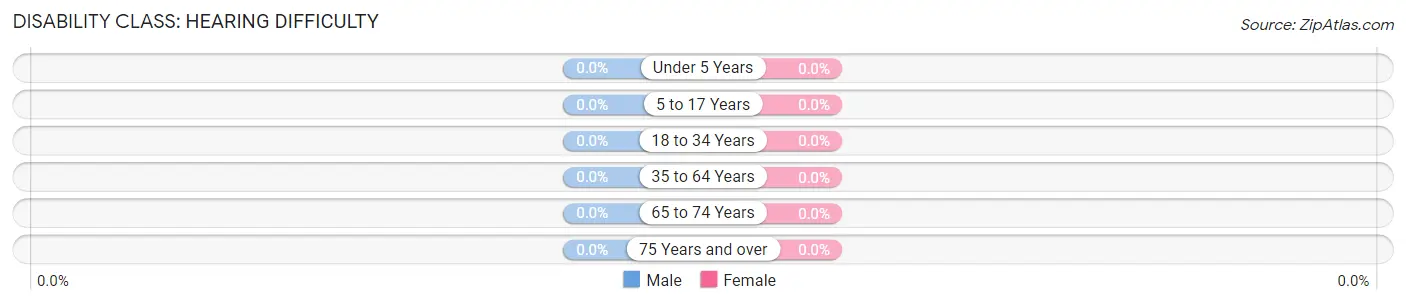
| Age Bracket | Male | Female |
| Under 5 Years | 0 (0.0%) | 0 (0.0%) |
| 5 to 17 Years | 0 (0.0%) | 0 (0.0%) |
| 18 to 34 Years | 0 (0.0%) | 0 (0.0%) |
| 35 to 64 Years | 0 (0.0%) | 0 (0.0%) |
| 65 to 74 Years | 0 (0.0%) | 0 (0.0%) |
| 75 Years and over | 0 (0.0%) | 0 (0.0%) |
Disability Class: Vision Difficulty
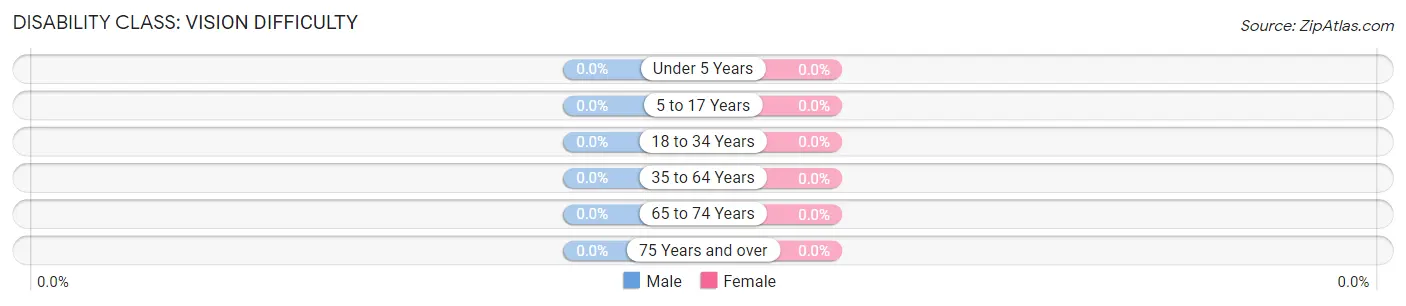
| Age Bracket | Male | Female |
| Under 5 Years | 0 (0.0%) | 0 (0.0%) |
| 5 to 17 Years | 0 (0.0%) | 0 (0.0%) |
| 18 to 34 Years | 0 (0.0%) | 0 (0.0%) |
| 35 to 64 Years | 0 (0.0%) | 0 (0.0%) |
| 65 to 74 Years | 0 (0.0%) | 0 (0.0%) |
| 75 Years and over | 0 (0.0%) | 0 (0.0%) |
Disability Class: Cognitive Difficulty
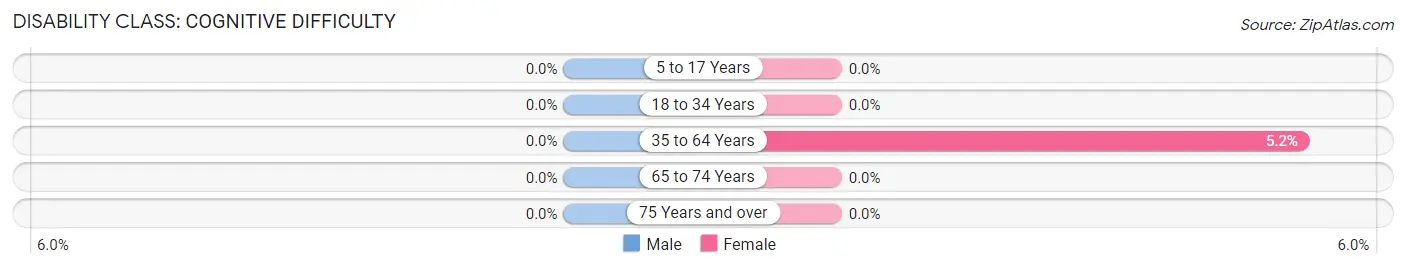
| Age Bracket | Male | Female |
| 5 to 17 Years | 0 (0.0%) | 0 (0.0%) |
| 18 to 34 Years | 0 (0.0%) | 0 (0.0%) |
| 35 to 64 Years | 0 (0.0%) | 10 (5.2%) |
| 65 to 74 Years | 0 (0.0%) | 0 (0.0%) |
| 75 Years and over | 0 (0.0%) | 0 (0.0%) |
Disability Class: Ambulatory Difficulty
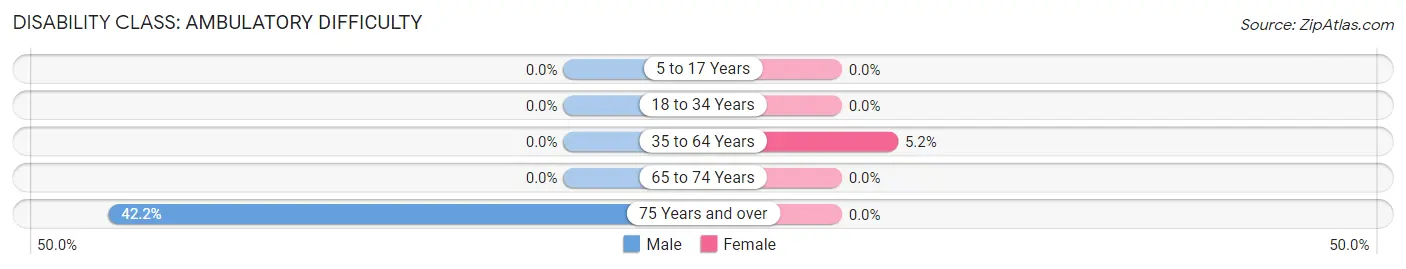
| Age Bracket | Male | Female |
| 5 to 17 Years | 0 (0.0%) | 0 (0.0%) |
| 18 to 34 Years | 0 (0.0%) | 0 (0.0%) |
| 35 to 64 Years | 0 (0.0%) | 10 (5.2%) |
| 65 to 74 Years | 0 (0.0%) | 0 (0.0%) |
| 75 Years and over | 19 (42.2%) | 0 (0.0%) |
Disability Class: Self-Care Difficulty
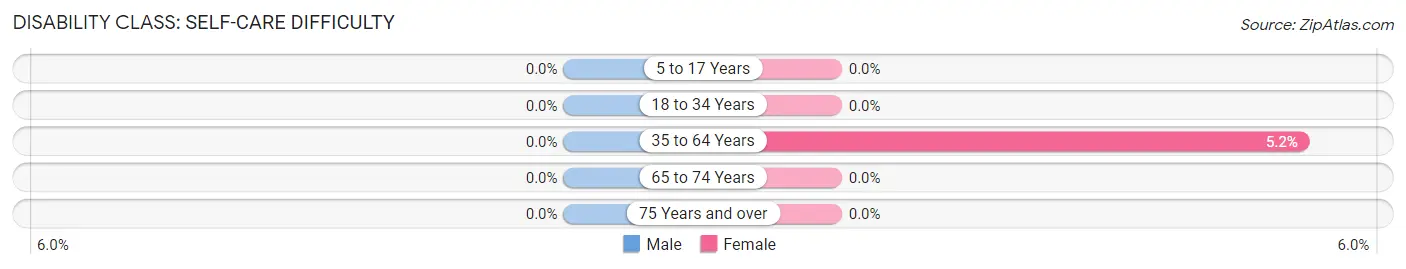
| Age Bracket | Male | Female |
| 5 to 17 Years | 0 (0.0%) | 0 (0.0%) |
| 18 to 34 Years | 0 (0.0%) | 0 (0.0%) |
| 35 to 64 Years | 0 (0.0%) | 10 (5.2%) |
| 65 to 74 Years | 0 (0.0%) | 0 (0.0%) |
| 75 Years and over | 0 (0.0%) | 0 (0.0%) |
Technology Access in Horseshoe Bend
Computing Device Access in Horseshoe Bend
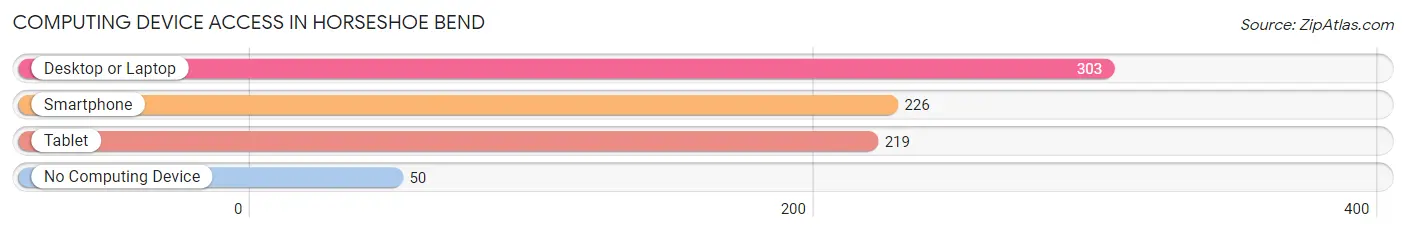
| Device Type | # Households | % Households |
| Desktop or Laptop | 303 | 85.8% |
| Smartphone | 226 | 64.0% |
| Tablet | 219 | 62.0% |
| No Computing Device | 50 | 14.2% |
| Total | 353 | 100.0% |
Internet Access in Horseshoe Bend
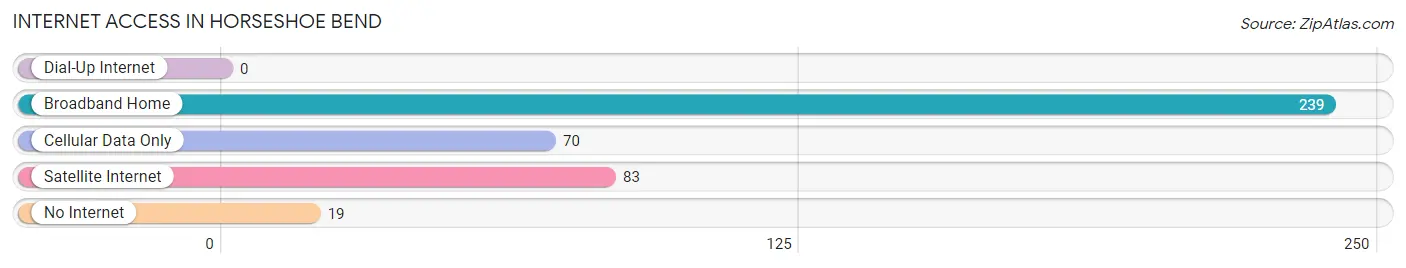
| Internet Type | # Households | % Households |
| Dial-Up Internet | 0 | 0.0% |
| Broadband Home | 239 | 67.7% |
| Cellular Data Only | 70 | 19.8% |
| Satellite Internet | 83 | 23.5% |
| No Internet | 19 | 5.4% |
| Total | 353 | 100.0% |
Horseshoe Bend Summary
Horseshoe Bend, Texas is a small unincorporated community located in the far western corner of the state, near the border with New Mexico. It is situated in the high plains of the Llano Estacado, an area of flat, arid land that is home to a variety of wildlife and vegetation. The town is named for the nearby horseshoe-shaped bend in the Pecos River, which is the only river in Texas that flows from west to east.
History
Horseshoe Bend was first settled in the late 19th century by ranchers and farmers who were attracted to the area by its abundant natural resources. The town was officially established in 1891, when the first post office was opened. The town grew slowly over the next few decades, and by the mid-20th century, it had become a small but thriving community.
In the 1950s, the town was chosen as the site of a new air force base, which brought a large influx of military personnel and their families to the area. The base was closed in the 1970s, but the population of Horseshoe Bend continued to grow, and by the turn of the 21st century, it had become a popular destination for tourists and outdoor enthusiasts.
Geography
Horseshoe Bend is located in the far western corner of Texas, near the border with New Mexico. It is situated in the high plains of the Llano Estacado, an area of flat, arid land that is home to a variety of wildlife and vegetation. The town is named for the nearby horseshoe-shaped bend in the Pecos River, which is the only river in Texas that flows from west to east.
The town is located at an elevation of 3,400 feet, and the surrounding area is characterized by rolling hills and wide open spaces. The climate is semi-arid, with hot summers and mild winters. The average annual precipitation is just over 16 inches, and the average annual temperature is around 68 degrees Fahrenheit.
Economy
The economy of Horseshoe Bend is largely based on agriculture and tourism. The town is home to several large ranches, which raise cattle, sheep, and other livestock. The area is also known for its production of cotton, wheat, and other crops.
Tourism is an important part of the local economy, as the town is a popular destination for outdoor enthusiasts. The nearby Pecos River is a popular spot for fishing, boating, and other recreational activities. The town is also home to several historic sites, including the old air force base, which is now a museum.
Demographics
As of the 2010 census, the population of Horseshoe Bend was 1,093. The racial makeup of the town was 94.3% White, 0.7% African American, 0.3% Native American, 0.2% Asian, and 4.5% from other races. The median household income was $37,500, and the median age was 41.
Horseshoe Bend is a small, rural community with a strong sense of community and a close-knit population. The town is home to several churches, a library, and a volunteer fire department. The town is served by a single school district, which includes an elementary school, a middle school, and a high school.
Conclusion
Horseshoe Bend, Texas is a small unincorporated community located in the far western corner of the state, near the border with New Mexico. It is situated in the high plains of the Llano Estacado, an area of flat, arid land that is home to a variety of wildlife and vegetation. The town is named for the nearby horseshoe-shaped bend in the Pecos River, which is the only river in Texas that flows from west to east. The economy of Horseshoe Bend is largely based on agriculture and tourism, and the town is home to a close-knit population of just over 1,000 people. The town is a popular destination for outdoor enthusiasts, and it is served by a single school district.
Common Questions
What is Per Capita Income in Horseshoe Bend?
Per Capita income in Horseshoe Bend is $34,248.
What is the Median Family Income in Horseshoe Bend?
Median Family Income in Horseshoe Bend is $102,807.
What is Inequality or Gini Index in Horseshoe Bend?
Inequality or Gini Index in Horseshoe Bend is 0.36.
What is the Total Population of Horseshoe Bend?
Total Population of Horseshoe Bend is 754.
What is the Total Male Population of Horseshoe Bend?
Total Male Population of Horseshoe Bend is 345.
What is the Total Female Population of Horseshoe Bend?
Total Female Population of Horseshoe Bend is 409.
What is the Ratio of Males per 100 Females in Horseshoe Bend?
There are 84.35 Males per 100 Females in Horseshoe Bend.
What is the Ratio of Females per 100 Males in Horseshoe Bend?
There are 118.55 Females per 100 Males in Horseshoe Bend.
What is the Median Population Age in Horseshoe Bend?
Median Population Age in Horseshoe Bend is 60.4 Years.
What is the Average Family Size in Horseshoe Bend
Average Family Size in Horseshoe Bend is 2.2 People.
What is the Average Household Size in Horseshoe Bend
Average Household Size in Horseshoe Bend is 2.1 People.
How Large is the Labor Force in Horseshoe Bend?
There are 279 People in the Labor Forcein in Horseshoe Bend.
What is the Percentage of People in the Labor Force in Horseshoe Bend?
39.2% of People are in the Labor Force in Horseshoe Bend.
What is the Unemployment Rate in Horseshoe Bend?
Unemployment Rate in Horseshoe Bend is 5.7%.