Hebbronville, TX Map & Demographics
Hebbronville Map
Hebbronville Overview
$17,591
PER CAPITA INCOME
$44,913
AVG FAMILY INCOME
$40,994
AVG HOUSEHOLD INCOME
57.0%
WAGE / INCOME GAP [ % ]
43.0¢/ $1
WAGE / INCOME GAP [ $ ]
$12,202
FAMILY INCOME DEFICIT
0.43
INEQUALITY / GINI INDEX
4,355
TOTAL POPULATION
2,308
MALE POPULATION
2,047
FEMALE POPULATION
112.75
MALES / 100 FEMALES
88.69
FEMALES / 100 MALES
24.5
MEDIAN AGE
4.4
AVG FAMILY SIZE
3.6
AVG HOUSEHOLD SIZE
1,901
LABOR FORCE [ PEOPLE ]
62.3%
PERCENT IN LABOR FORCE
5.1%
UNEMPLOYMENT RATE
Hebbronville Zip Codes
Hebbronville Area Codes
Income in Hebbronville
Income Overview in Hebbronville
Per Capita Income in Hebbronville is $17,591, while median incomes of families and households are $44,913 and $40,994 respectively.
| Characteristic | Number | Measure |
| Per Capita Income | 4,355 | $17,591 |
| Median Family Income | 838 | $44,913 |
| Mean Family Income | 838 | $61,706 |
| Median Household Income | 1,183 | $40,994 |
| Mean Household Income | 1,183 | $57,542 |
| Income Deficit | 838 | $12,202 |
| Wage / Income Gap (%) | 4,355 | 56.98% |
| Wage / Income Gap ($) | 4,355 | 43.02¢ per $1 |
| Gini / Inequality Index | 4,355 | 0.43 |
Earnings by Sex in Hebbronville
Average Earnings in Hebbronville are $24,602, $35,317 for men and $15,194 for women, a difference of 57.0%.
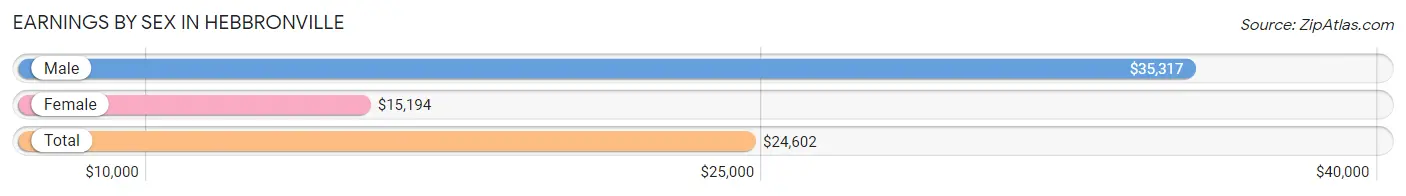
| Sex | Number | Average Earnings |
| Male | 1,208 (59.7%) | $35,317 |
| Female | 815 (40.3%) | $15,194 |
| Total | 2,023 (100.0%) | $24,602 |
Earnings by Sex by Income Bracket in Hebbronville
The most common earnings brackets in Hebbronville are $35,000 to $39,999 for men (339 | 28.1%) and $5,000 to $7,499 for women (146 | 17.9%).
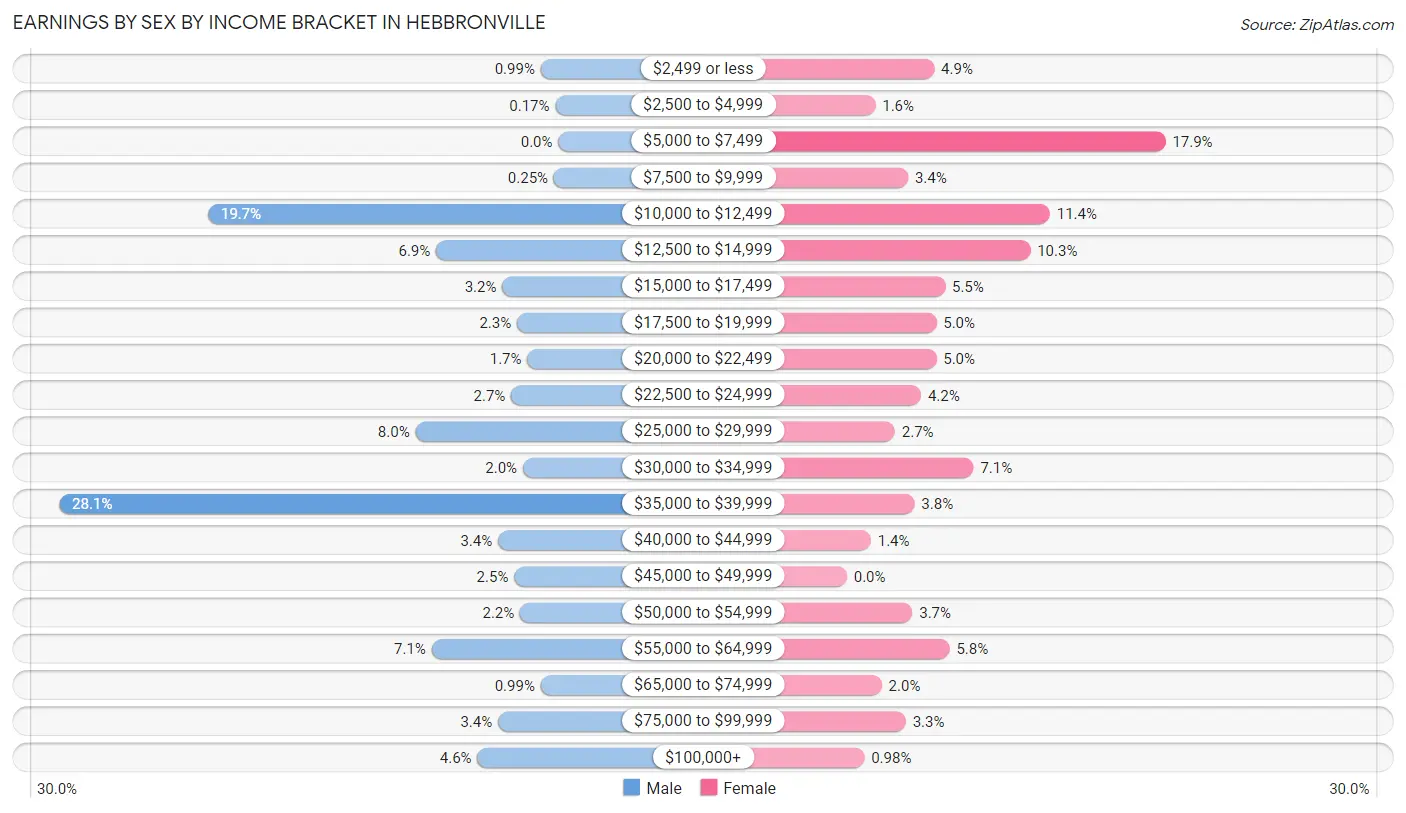
| Income | Male | Female |
| $2,499 or less | 12 (1.0%) | 40 (4.9%) |
| $2,500 to $4,999 | 2 (0.2%) | 13 (1.6%) |
| $5,000 to $7,499 | 0 (0.0%) | 146 (17.9%) |
| $7,500 to $9,999 | 3 (0.3%) | 28 (3.4%) |
| $10,000 to $12,499 | 238 (19.7%) | 93 (11.4%) |
| $12,500 to $14,999 | 83 (6.9%) | 84 (10.3%) |
| $15,000 to $17,499 | 38 (3.2%) | 45 (5.5%) |
| $17,500 to $19,999 | 28 (2.3%) | 41 (5.0%) |
| $20,000 to $22,499 | 21 (1.7%) | 41 (5.0%) |
| $22,500 to $24,999 | 32 (2.6%) | 34 (4.2%) |
| $25,000 to $29,999 | 97 (8.0%) | 22 (2.7%) |
| $30,000 to $34,999 | 24 (2.0%) | 58 (7.1%) |
| $35,000 to $39,999 | 339 (28.1%) | 31 (3.8%) |
| $40,000 to $44,999 | 41 (3.4%) | 11 (1.3%) |
| $45,000 to $49,999 | 30 (2.5%) | 0 (0.0%) |
| $50,000 to $54,999 | 26 (2.1%) | 30 (3.7%) |
| $55,000 to $64,999 | 86 (7.1%) | 47 (5.8%) |
| $65,000 to $74,999 | 12 (1.0%) | 16 (2.0%) |
| $75,000 to $99,999 | 41 (3.4%) | 27 (3.3%) |
| $100,000+ | 55 (4.5%) | 8 (1.0%) |
| Total | 1,208 (100.0%) | 815 (100.0%) |
Earnings by Sex by Educational Attainment in Hebbronville
Average earnings in Hebbronville are $27,909 for men and $21,067 for women, a difference of 24.5%. Men with an educational attainment of college or associate's degree enjoy the highest average annual earnings of $53,438, while those with less than high school education earn the least with $20,833. Women with an educational attainment of graduate degree earn the most with the average annual earnings of $64,125, while those with high school diploma education have the smallest earnings of $12,432.
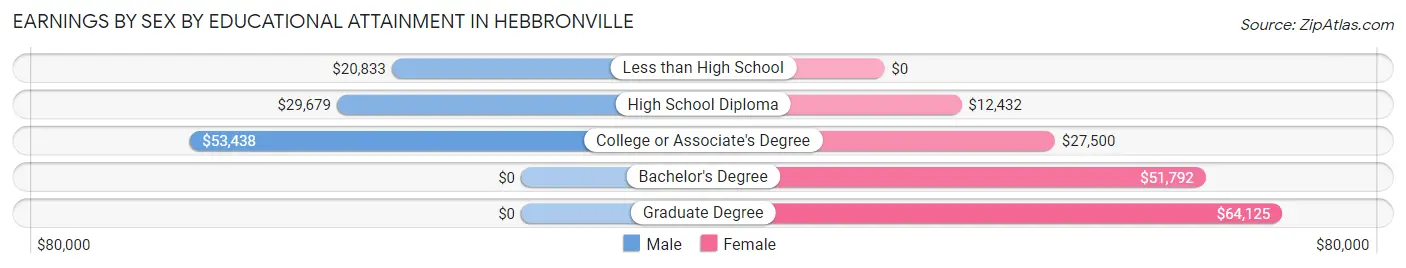
| Educational Attainment | Male Income | Female Income |
| Less than High School | $20,833 | $0 |
| High School Diploma | $29,679 | $12,432 |
| College or Associate's Degree | $53,438 | $27,500 |
| Bachelor's Degree | - | - |
| Graduate Degree | - | - |
| Total | $27,909 | $21,067 |
Family Income in Hebbronville
Family Income Brackets in Hebbronville
According to the Hebbronville family income data, there are 170 families falling into the $50,000 to $74,999 income range, which is the most common income bracket and makes up 20.3% of all families. Conversely, the $75,000 to $99,999 income bracket is the least frequent group with only 20 families (2.4%) belonging to this category.
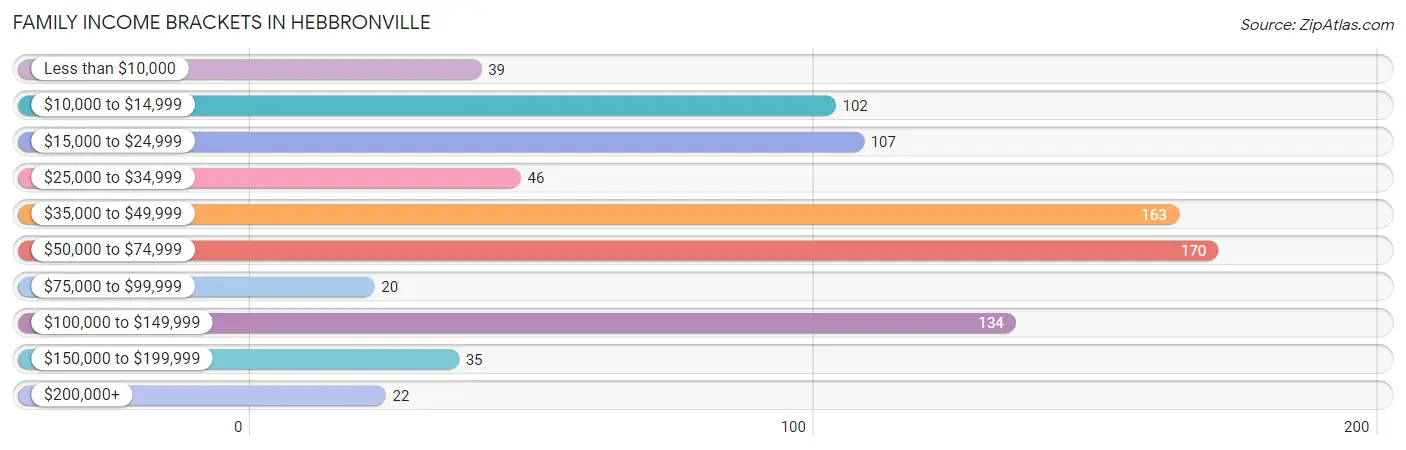
| Income Bracket | # Families | % Families |
| Less than $10,000 | 39 | 4.7% |
| $10,000 to $14,999 | 102 | 12.2% |
| $15,000 to $24,999 | 107 | 12.8% |
| $25,000 to $34,999 | 46 | 5.5% |
| $35,000 to $49,999 | 163 | 19.5% |
| $50,000 to $74,999 | 170 | 20.3% |
| $75,000 to $99,999 | 20 | 2.4% |
| $100,000 to $149,999 | 134 | 16.0% |
| $150,000 to $199,999 | 35 | 4.2% |
| $200,000+ | 22 | 2.6% |
Family Income by Famaliy Size in Hebbronville
2-person families (324 | 38.7%) account for the highest median family income in Hebbronville with $50,000 per family, while 2-person families (324 | 38.7%) have the highest median income of $25,000 per family member.
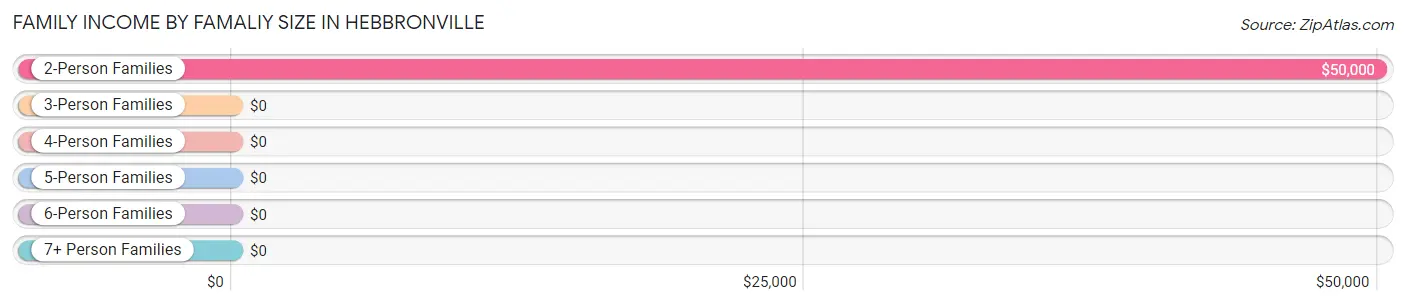
| Income Bracket | # Families | Median Income |
| 2-Person Families | 324 (38.7%) | $50,000 |
| 3-Person Families | 157 (18.7%) | $0 |
| 4-Person Families | 170 (20.3%) | $0 |
| 5-Person Families | 99 (11.8%) | $0 |
| 6-Person Families | 54 (6.4%) | $0 |
| 7+ Person Families | 34 (4.1%) | $0 |
| Total | 838 (100.0%) | $44,913 |
Family Income by Number of Earners in Hebbronville
The median family income in Hebbronville is $44,913, with families comprising 3+ earners (114) having the highest median family income of $110,238, while families with no earners (80) have the lowest median family income of $24,211, accounting for 13.6% and 9.6% of families, respectively.
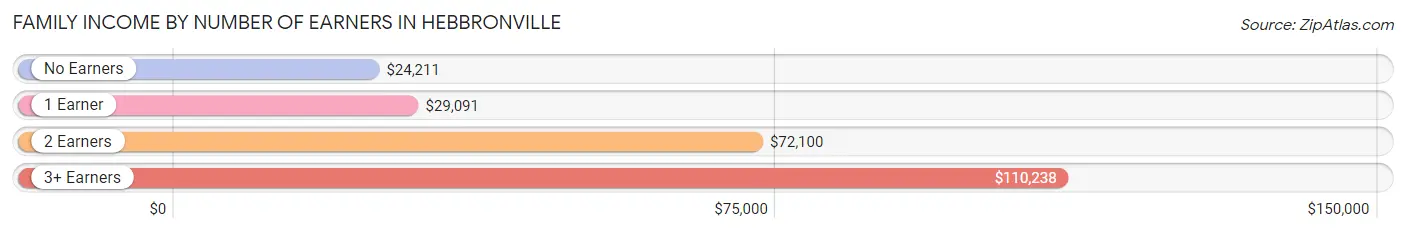
| Number of Earners | # Families | Median Income |
| No Earners | 80 (9.6%) | $24,211 |
| 1 Earner | 432 (51.5%) | $29,091 |
| 2 Earners | 212 (25.3%) | $72,100 |
| 3+ Earners | 114 (13.6%) | $110,238 |
| Total | 838 (100.0%) | $44,913 |
Household Income in Hebbronville
Household Income Brackets in Hebbronville
With 311 households falling in the category, the $35,000 to $49,999 income range is the most frequent in Hebbronville, accounting for 26.3% of all households. In contrast, only 22 households (1.9%) fall into the $200,000+ income bracket, making it the least populous group.
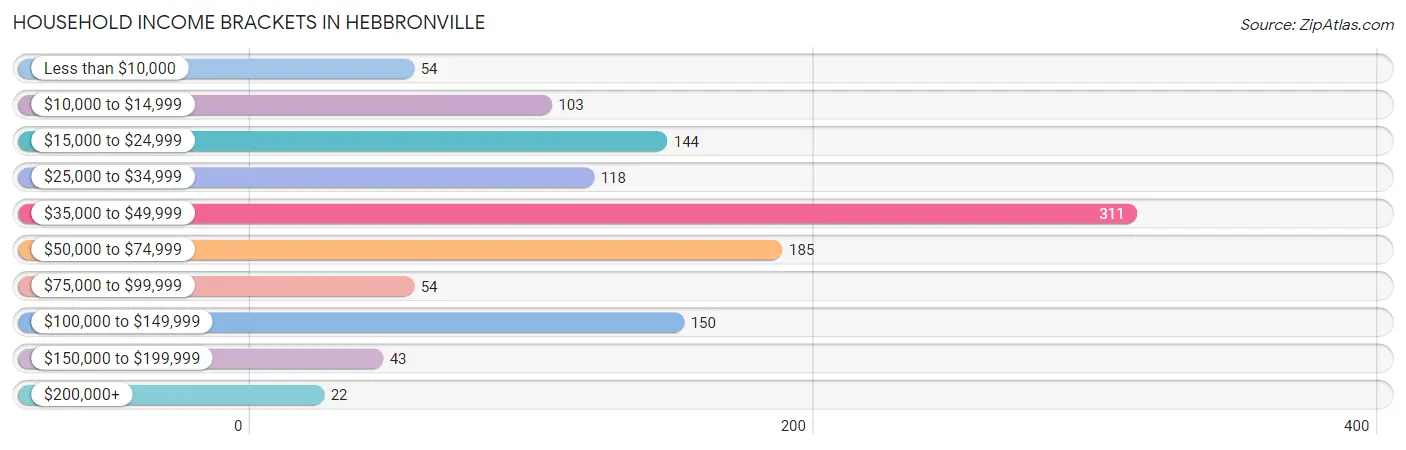
| Income Bracket | # Households | % Households |
| Less than $10,000 | 54 | 4.6% |
| $10,000 to $14,999 | 103 | 8.7% |
| $15,000 to $24,999 | 144 | 12.2% |
| $25,000 to $34,999 | 118 | 10.0% |
| $35,000 to $49,999 | 311 | 26.3% |
| $50,000 to $74,999 | 185 | 15.6% |
| $75,000 to $99,999 | 54 | 4.6% |
| $100,000 to $149,999 | 150 | 12.7% |
| $150,000 to $199,999 | 43 | 3.6% |
| $200,000+ | 22 | 1.9% |
Household Income by Householder Age in Hebbronville
The median household income in Hebbronville is $40,994, with the highest median household income of $52,000 found in the 45 to 64 years age bracket for the primary householder. A total of 408 households (34.5%) fall into this category. Meanwhile, the 25 to 44 years age bracket for the primary householder has the lowest median household income of $0, with 356 households (30.1%) in this group.
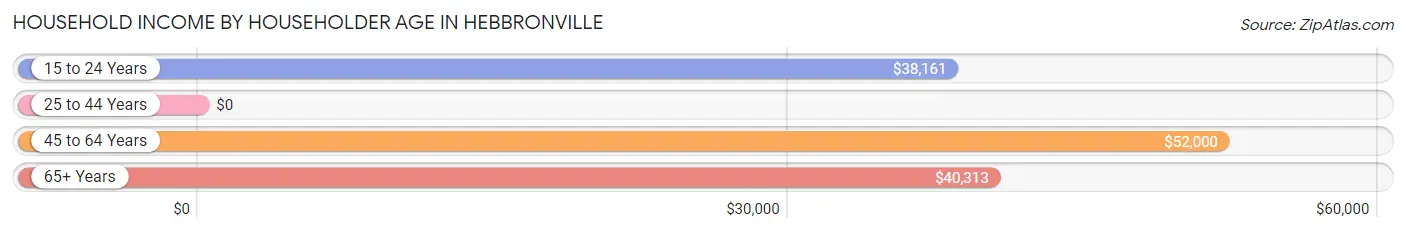
| Income Bracket | # Households | Median Income |
| 15 to 24 Years | 181 (15.3%) | $38,161 |
| 25 to 44 Years | 356 (30.1%) | $0 |
| 45 to 64 Years | 408 (34.5%) | $52,000 |
| 65+ Years | 238 (20.1%) | $40,313 |
| Total | 1,183 (100.0%) | $40,994 |
Poverty in Hebbronville
Income Below Poverty by Sex and Age in Hebbronville
With 28.6% poverty level for males and 33.4% for females among the residents of Hebbronville, under 5 year old males and under 5 year old females are the most vulnerable to poverty, with 304 males (72.9%) and 140 females (66.7%) in their respective age groups living below the poverty level.
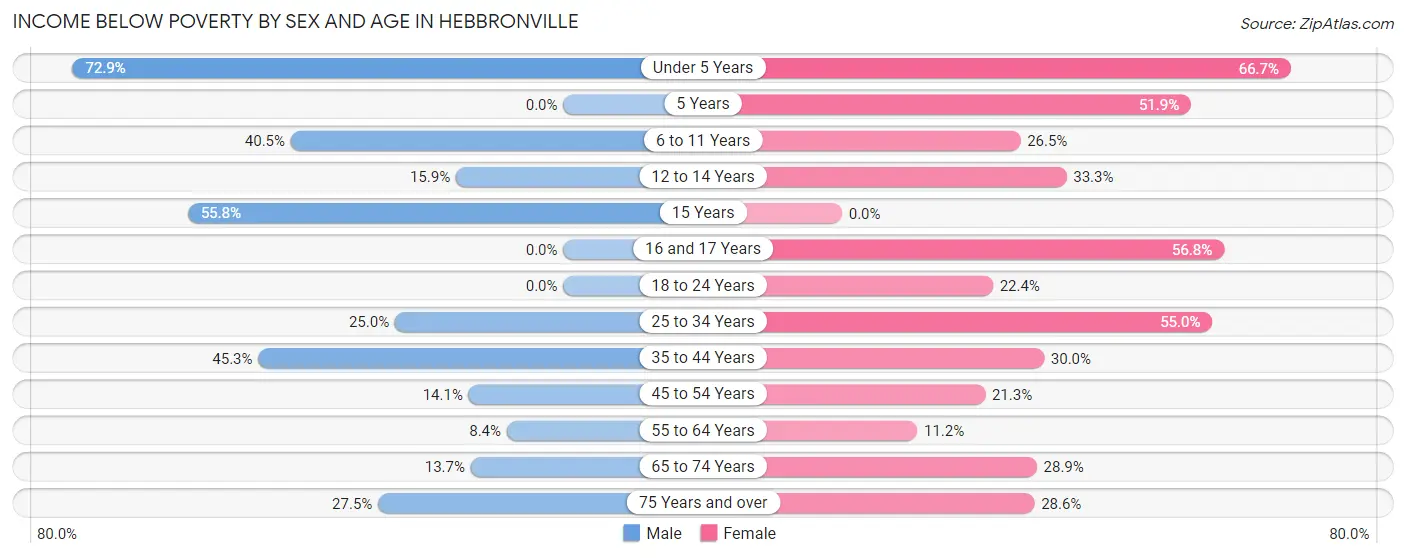
| Age Bracket | Male | Female |
| Under 5 Years | 304 (72.9%) | 140 (66.7%) |
| 5 Years | 0 (0.0%) | 14 (51.8%) |
| 6 to 11 Years | 70 (40.5%) | 49 (26.5%) |
| 12 to 14 Years | 11 (15.9%) | 18 (33.3%) |
| 15 Years | 29 (55.8%) | 0 (0.0%) |
| 16 and 17 Years | 0 (0.0%) | 21 (56.8%) |
| 18 to 24 Years | 0 (0.0%) | 91 (22.4%) |
| 25 to 34 Years | 85 (25.0%) | 143 (55.0%) |
| 35 to 44 Years | 77 (45.3%) | 51 (30.0%) |
| 45 to 54 Years | 34 (14.1%) | 44 (21.3%) |
| 55 to 64 Years | 13 (8.4%) | 21 (11.2%) |
| 65 to 74 Years | 18 (13.7%) | 35 (28.9%) |
| 75 Years and over | 11 (27.5%) | 24 (28.6%) |
| Total | 652 (28.6%) | 651 (33.4%) |
Income Above Poverty by Sex and Age in Hebbronville
According to the poverty statistics in Hebbronville, males aged 5 years and females aged 55 to 64 years are the age groups that are most secure financially, with 100.0% of males and 88.8% of females in these age groups living above the poverty line.
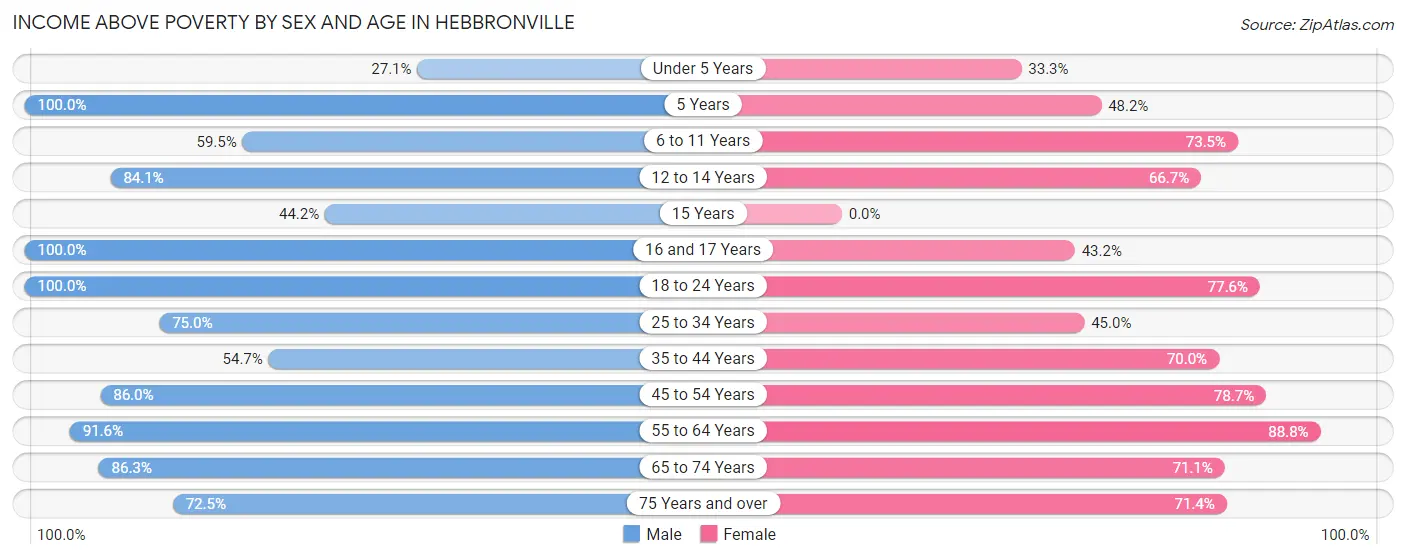
| Age Bracket | Male | Female |
| Under 5 Years | 113 (27.1%) | 70 (33.3%) |
| 5 Years | 34 (100.0%) | 13 (48.1%) |
| 6 to 11 Years | 103 (59.5%) | 136 (73.5%) |
| 12 to 14 Years | 58 (84.1%) | 36 (66.7%) |
| 15 Years | 23 (44.2%) | 0 (0.0%) |
| 16 and 17 Years | 38 (100.0%) | 16 (43.2%) |
| 18 to 24 Years | 418 (100.0%) | 315 (77.6%) |
| 25 to 34 Years | 255 (75.0%) | 117 (45.0%) |
| 35 to 44 Years | 93 (54.7%) | 119 (70.0%) |
| 45 to 54 Years | 208 (86.0%) | 163 (78.7%) |
| 55 to 64 Years | 142 (91.6%) | 167 (88.8%) |
| 65 to 74 Years | 113 (86.3%) | 86 (71.1%) |
| 75 Years and over | 29 (72.5%) | 60 (71.4%) |
| Total | 1,627 (71.4%) | 1,298 (66.6%) |
Income Below Poverty Among Married-Couple Families in Hebbronville
The poverty statistics for married-couple families in Hebbronville show that 11.8% or 63 of the total 535 families live below the poverty line. Families with 5 or more children have the highest poverty rate of 100.0%, comprising of 18 families. On the other hand, families with 3 or 4 children have the lowest poverty rate of 0.0%, which includes 0 families.
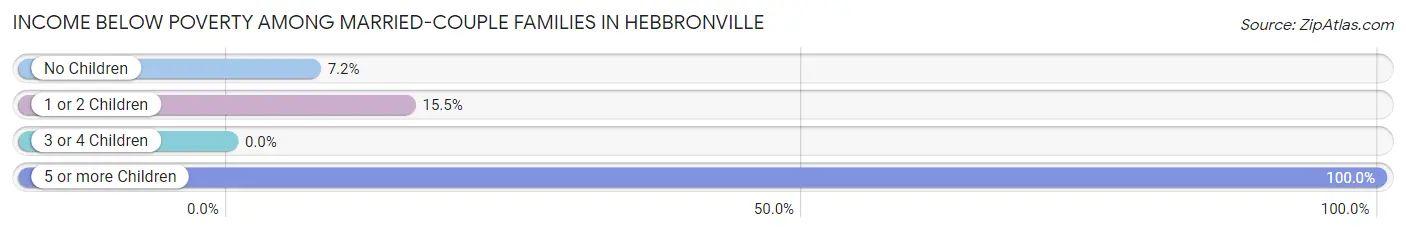
| Children | Above Poverty | Below Poverty |
| No Children | 335 (92.8%) | 26 (7.2%) |
| 1 or 2 Children | 104 (84.6%) | 19 (15.4%) |
| 3 or 4 Children | 33 (100.0%) | 0 (0.0%) |
| 5 or more Children | 0 (0.0%) | 18 (100.0%) |
| Total | 472 (88.2%) | 63 (11.8%) |
Income Below Poverty Among Single-Parent Households in Hebbronville
According to the poverty data in Hebbronville, 93.8% or 91 single-father households and 47.6% or 98 single-mother households are living below the poverty line. Among single-father households, those with 3 or 4 children have the highest poverty rate, with 64 households (100.0%) experiencing poverty. Likewise, among single-mother households, those with 3 or 4 children have the highest poverty rate, with 46 households (59.0%) falling below the poverty line.
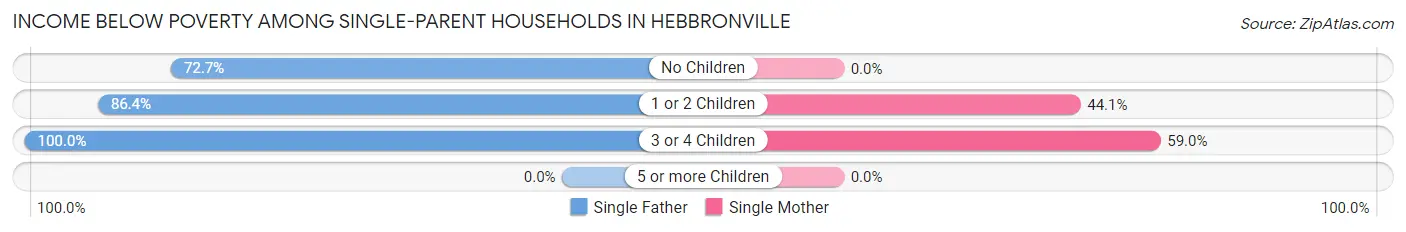
| Children | Single Father | Single Mother |
| No Children | 8 (72.7%) | 0 (0.0%) |
| 1 or 2 Children | 19 (86.4%) | 52 (44.1%) |
| 3 or 4 Children | 64 (100.0%) | 46 (59.0%) |
| 5 or more Children | 0 (0.0%) | 0 (0.0%) |
| Total | 91 (93.8%) | 98 (47.6%) |
Income Below Poverty Among Married-Couple vs Single-Parent Households in Hebbronville
The poverty data for Hebbronville shows that 63 of the married-couple family households (11.8%) and 189 of the single-parent households (62.4%) are living below the poverty level. Within the married-couple family households, those with 5 or more children have the highest poverty rate, with 18 households (100.0%) falling below the poverty line. Among the single-parent households, those with 3 or 4 children have the highest poverty rate, with 110 household (77.5%) living below poverty.
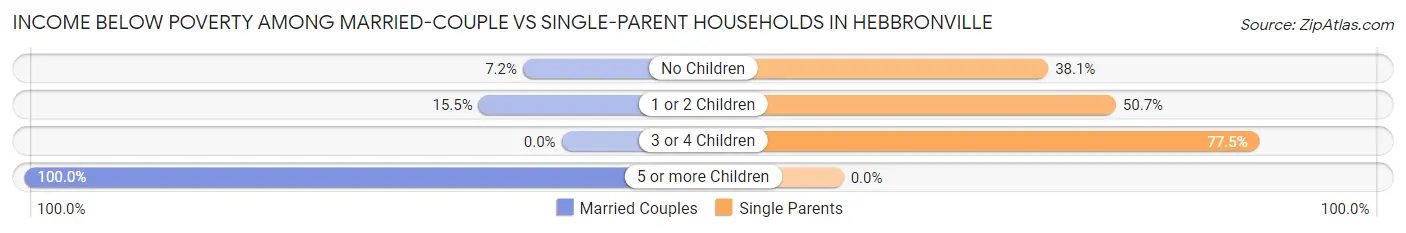
| Children | Married-Couple Families | Single-Parent Households |
| No Children | 26 (7.2%) | 8 (38.1%) |
| 1 or 2 Children | 19 (15.4%) | 71 (50.7%) |
| 3 or 4 Children | 0 (0.0%) | 110 (77.5%) |
| 5 or more Children | 18 (100.0%) | 0 (0.0%) |
| Total | 63 (11.8%) | 189 (62.4%) |
Race in Hebbronville
The most populous races in Hebbronville are Hispanic or Latino (4,014 | 92.2%), White / Caucasian (2,669 | 61.3%), and Two or more Races (1,450 | 33.3%).
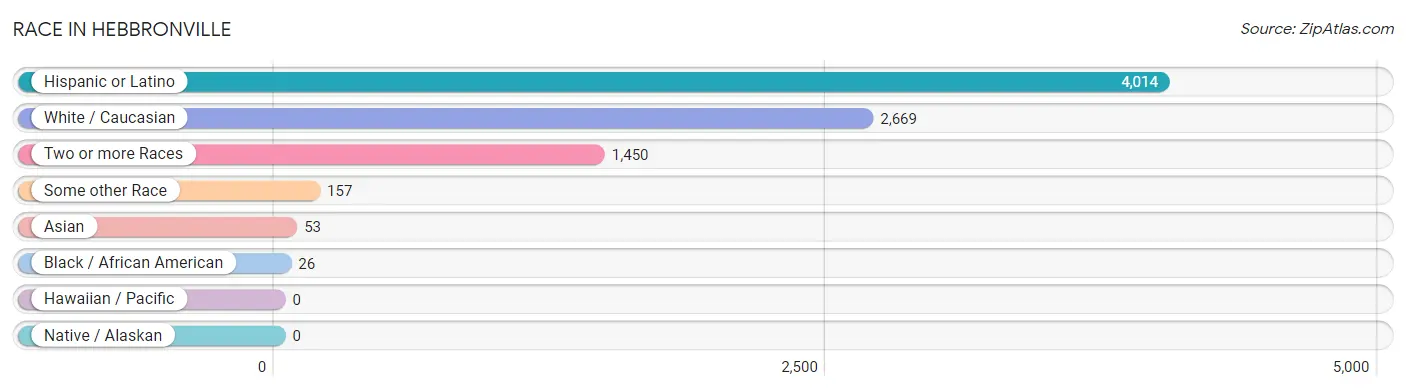
| Race | # Population | % Population |
| Asian | 53 | 1.2% |
| Black / African American | 26 | 0.6% |
| Hawaiian / Pacific | 0 | 0.0% |
| Hispanic or Latino | 4,014 | 92.2% |
| Native / Alaskan | 0 | 0.0% |
| White / Caucasian | 2,669 | 61.3% |
| Two or more Races | 1,450 | 33.3% |
| Some other Race | 157 | 3.6% |
| Total | 4,355 | 100.0% |
Ancestry in Hebbronville
The most populous ancestries reported in Hebbronville are Mexican (3,882 | 89.1%), Korean (247 | 5.7%), American (198 | 4.5%), German (95 | 2.2%), and Italian (50 | 1.1%), together accounting for 102.7% of all Hebbronville residents.
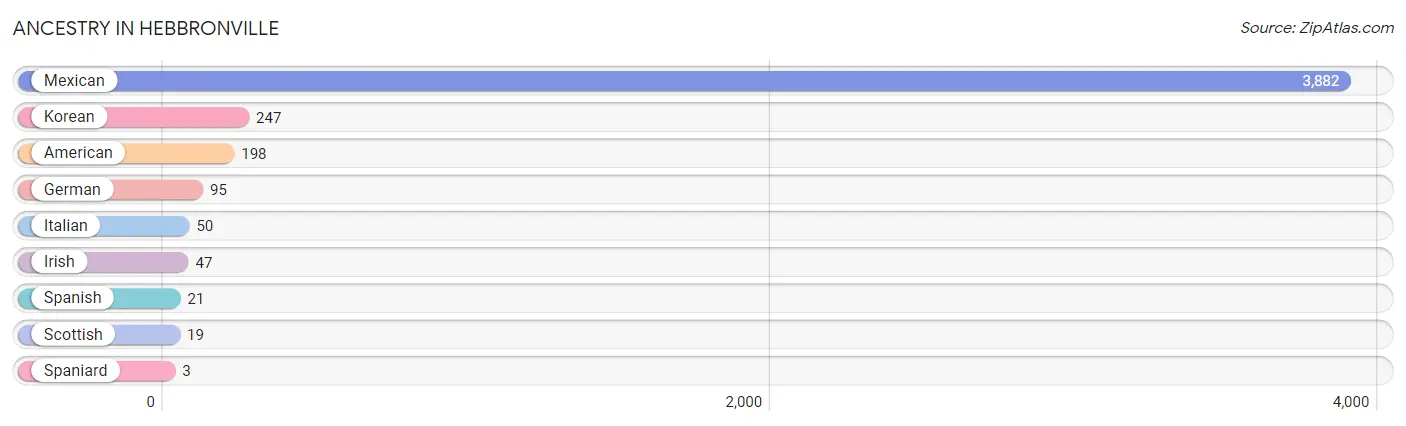
| Ancestry | # Population | % Population |
| American | 198 | 4.5% |
| German | 95 | 2.2% |
| Irish | 47 | 1.1% |
| Italian | 50 | 1.1% |
| Korean | 247 | 5.7% |
| Mexican | 3,882 | 89.1% |
| Scottish | 19 | 0.4% |
| Spaniard | 3 | 0.1% |
| Spanish | 21 | 0.5% | View All 9 Rows |
Immigrants in Hebbronville
The most numerous immigrant groups reported in Hebbronville came from Central America (70 | 1.6%), Latin America (70 | 1.6%), Mexico (70 | 1.6%), Asia (10 | 0.2%), and Philippines (10 | 0.2%), together accounting for 5.3% of all Hebbronville residents.
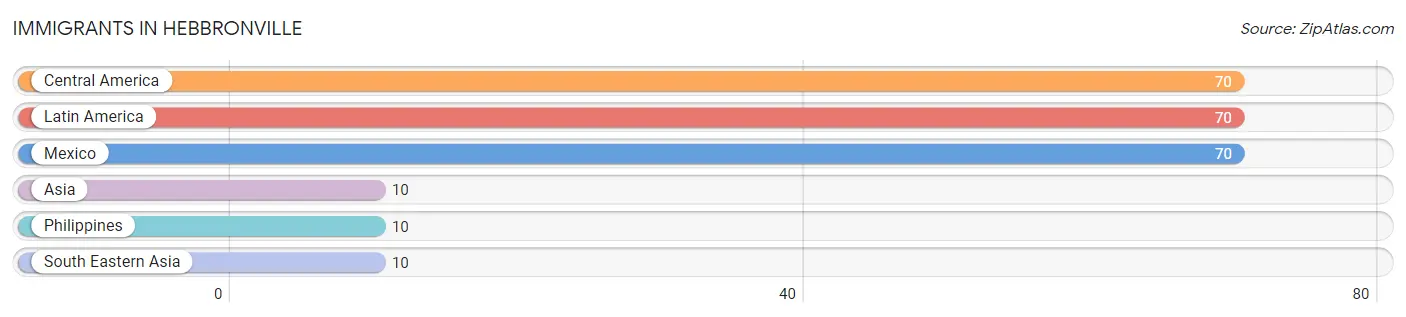
| Immigration Origin | # Population | % Population |
| Asia | 10 | 0.2% |
| Central America | 70 | 1.6% |
| Latin America | 70 | 1.6% |
| Mexico | 70 | 1.6% |
| Philippines | 10 | 0.2% |
| South Eastern Asia | 10 | 0.2% | View All 6 Rows |
Sex and Age in Hebbronville
Sex and Age in Hebbronville
The most populous age groups in Hebbronville are 20 to 24 Years (422 | 18.3%) for men and Under 5 Years (293 | 14.3%) for women.
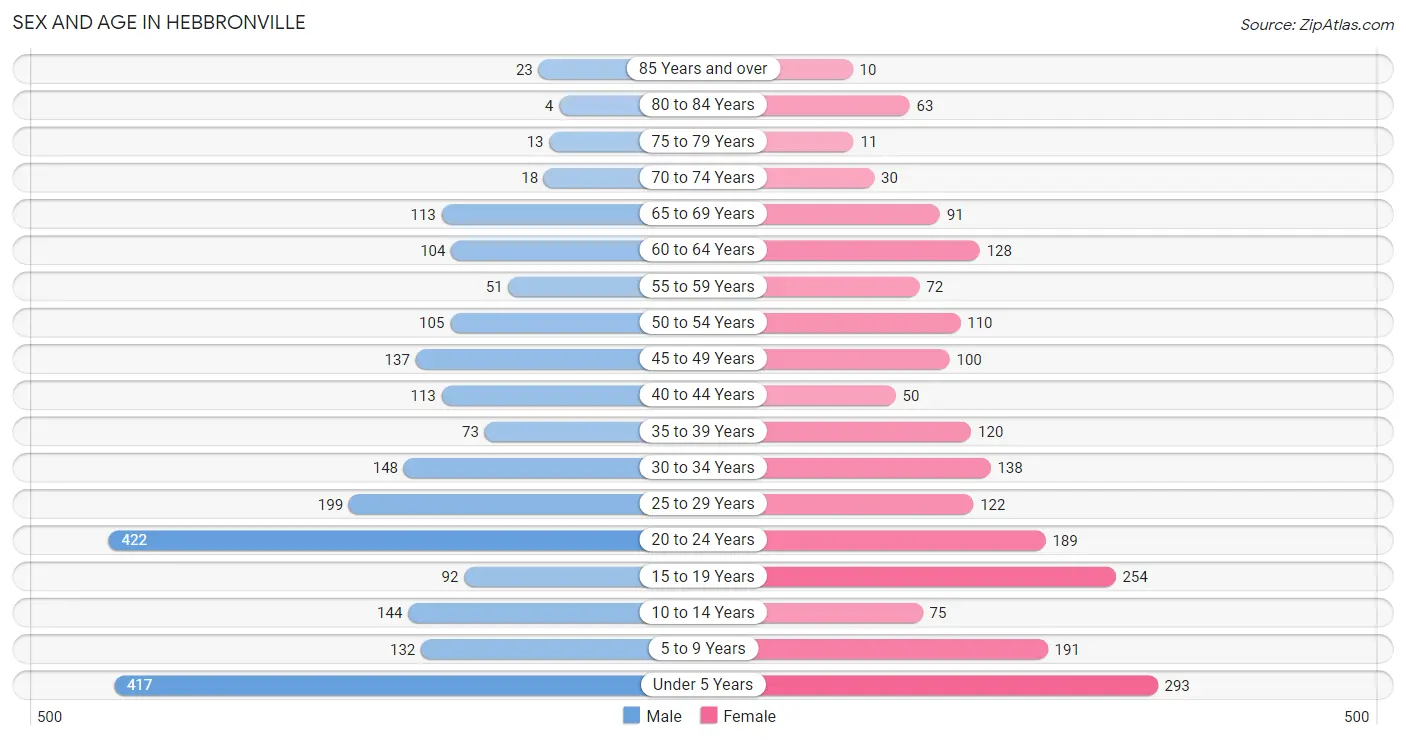
| Age Bracket | Male | Female |
| Under 5 Years | 417 (18.1%) | 293 (14.3%) |
| 5 to 9 Years | 132 (5.7%) | 191 (9.3%) |
| 10 to 14 Years | 144 (6.2%) | 75 (3.7%) |
| 15 to 19 Years | 92 (4.0%) | 254 (12.4%) |
| 20 to 24 Years | 422 (18.3%) | 189 (9.2%) |
| 25 to 29 Years | 199 (8.6%) | 122 (6.0%) |
| 30 to 34 Years | 148 (6.4%) | 138 (6.7%) |
| 35 to 39 Years | 73 (3.2%) | 120 (5.9%) |
| 40 to 44 Years | 113 (4.9%) | 50 (2.4%) |
| 45 to 49 Years | 137 (5.9%) | 100 (4.9%) |
| 50 to 54 Years | 105 (4.5%) | 110 (5.4%) |
| 55 to 59 Years | 51 (2.2%) | 72 (3.5%) |
| 60 to 64 Years | 104 (4.5%) | 128 (6.2%) |
| 65 to 69 Years | 113 (4.9%) | 91 (4.4%) |
| 70 to 74 Years | 18 (0.8%) | 30 (1.5%) |
| 75 to 79 Years | 13 (0.6%) | 11 (0.5%) |
| 80 to 84 Years | 4 (0.2%) | 63 (3.1%) |
| 85 Years and over | 23 (1.0%) | 10 (0.5%) |
| Total | 2,308 (100.0%) | 2,047 (100.0%) |
Families and Households in Hebbronville
Median Family Size in Hebbronville
The median family size in Hebbronville is 4.37 persons per family, with single female/mother families (206 | 24.6%) accounting for the largest median family size of 6.92 persons per family. On the other hand, married-couple families (535 | 63.8%) represent the smallest median family size with 3.29 persons per family.
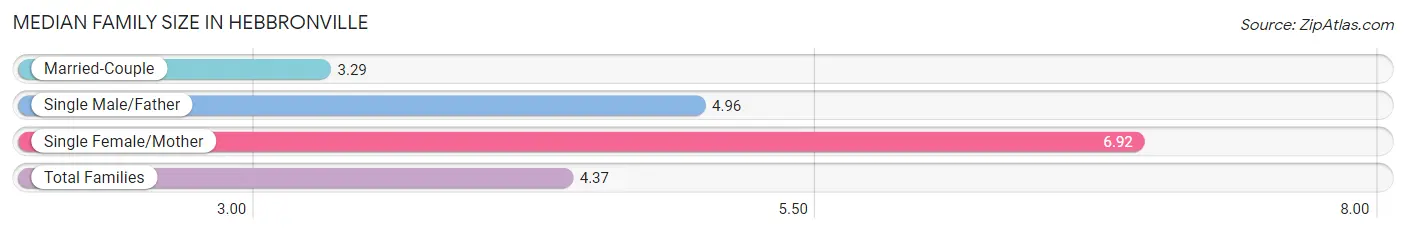
| Family Type | # Families | Family Size |
| Married-Couple | 535 (63.8%) | 3.29 |
| Single Male/Father | 97 (11.6%) | 4.96 |
| Single Female/Mother | 206 (24.6%) | 6.92 |
| Total Families | 838 (100.0%) | 4.37 |
Median Household Size in Hebbronville
The median household size in Hebbronville is 3.64 persons per household, with single female/mother households (206 | 17.4%) accounting for the largest median household size of 7.49 persons per household. non-family households (345 | 29.2%) represent the smallest median household size with 1.12 persons per household.
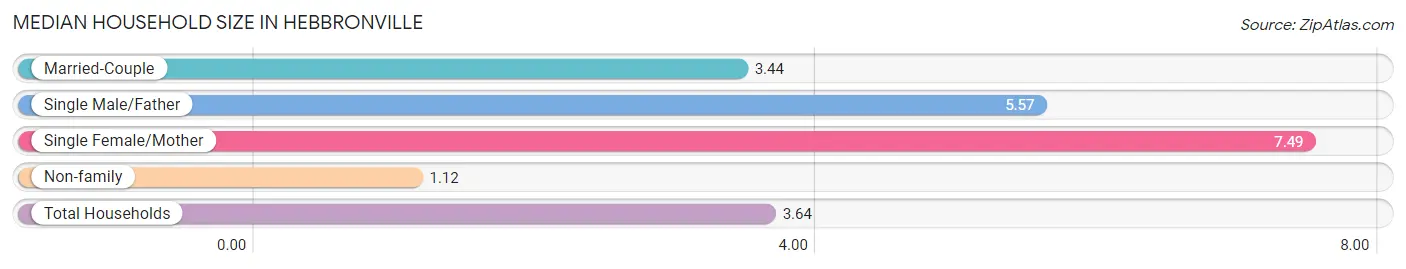
| Household Type | # Households | Household Size |
| Married-Couple | 535 (45.2%) | 3.44 |
| Single Male/Father | 97 (8.2%) | 5.57 |
| Single Female/Mother | 206 (17.4%) | 7.49 |
| Non-family | 345 (29.2%) | 1.12 |
| Total Households | 1,183 (100.0%) | 3.64 |
Household Size by Marriage Status in Hebbronville
Out of a total of 1,183 households in Hebbronville, 838 (70.8%) are family households, while 345 (29.2%) are nonfamily households. The most numerous type of family households are 2-person households, comprising 287, and the most common type of nonfamily households are 1-person households, comprising 312.
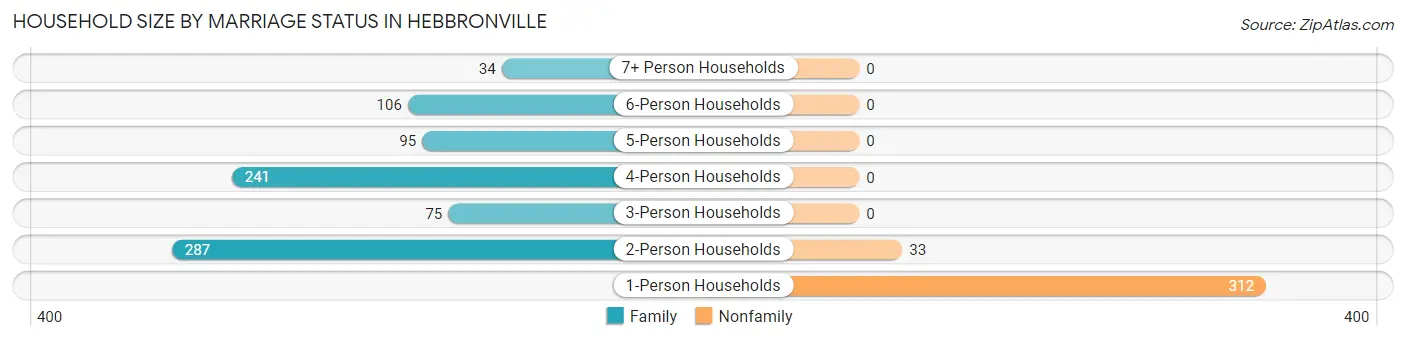
| Household Size | Family Households | Nonfamily Households |
| 1-Person Households | - | 312 (26.4%) |
| 2-Person Households | 287 (24.3%) | 33 (2.8%) |
| 3-Person Households | 75 (6.3%) | 0 (0.0%) |
| 4-Person Households | 241 (20.4%) | 0 (0.0%) |
| 5-Person Households | 95 (8.0%) | 0 (0.0%) |
| 6-Person Households | 106 (9.0%) | 0 (0.0%) |
| 7+ Person Households | 34 (2.9%) | 0 (0.0%) |
| Total | 838 (70.8%) | 345 (29.2%) |
Female Fertility in Hebbronville
Fertility by Age in Hebbronville
Average fertility rate in Hebbronville is 110.0 births per 1,000 women. Women in the age bracket of 15 to 19 years have the highest fertility rate with 264.0 births per 1,000 women. Women in the age bracket of 15 to 19 years acount for 62.6% of all women with births.
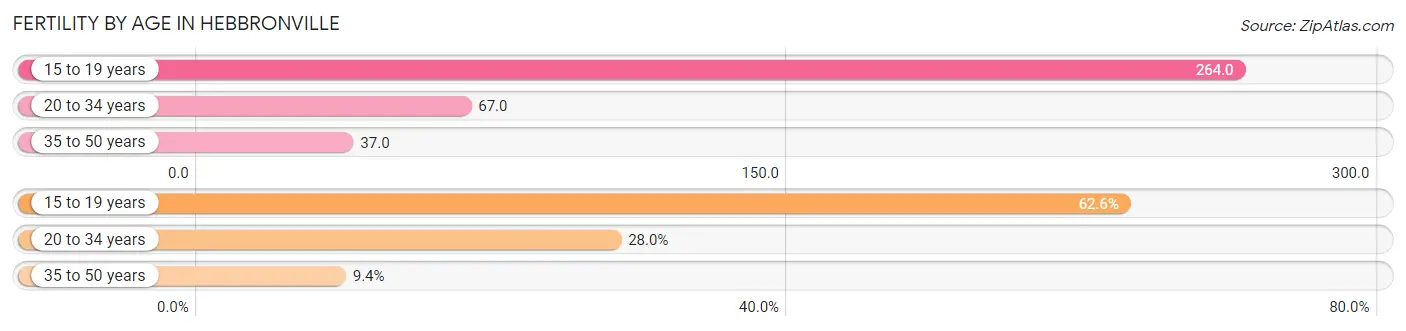
| Age Bracket | Women with Births | Births / 1,000 Women |
| 15 to 19 years | 67 (62.6%) | 264.0 |
| 20 to 34 years | 30 (28.0%) | 67.0 |
| 35 to 50 years | 10 (9.3%) | 37.0 |
| Total | 107 (100.0%) | 110.0 |
Fertility by Age by Marriage Status in Hebbronville
67.3% of women with births (107) in Hebbronville are married. The highest percentage of unmarried women with births falls into 35 to 50 years age bracket with 100.0% of them unmarried at the time of birth, while the lowest percentage of unmarried women with births belong to 15 to 19 years age bracket with 0.0% of them unmarried.
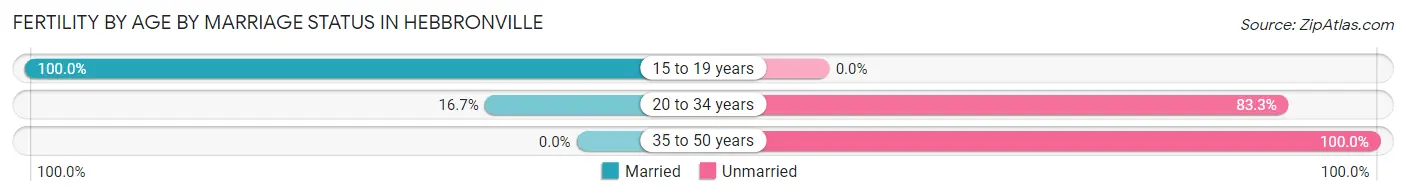
| Age Bracket | Married | Unmarried |
| 15 to 19 years | 67 (100.0%) | 0 (0.0%) |
| 20 to 34 years | 5 (16.7%) | 25 (83.3%) |
| 35 to 50 years | 0 (0.0%) | 10 (100.0%) |
| Total | 72 (67.3%) | 35 (32.7%) |
Fertility by Education in Hebbronville
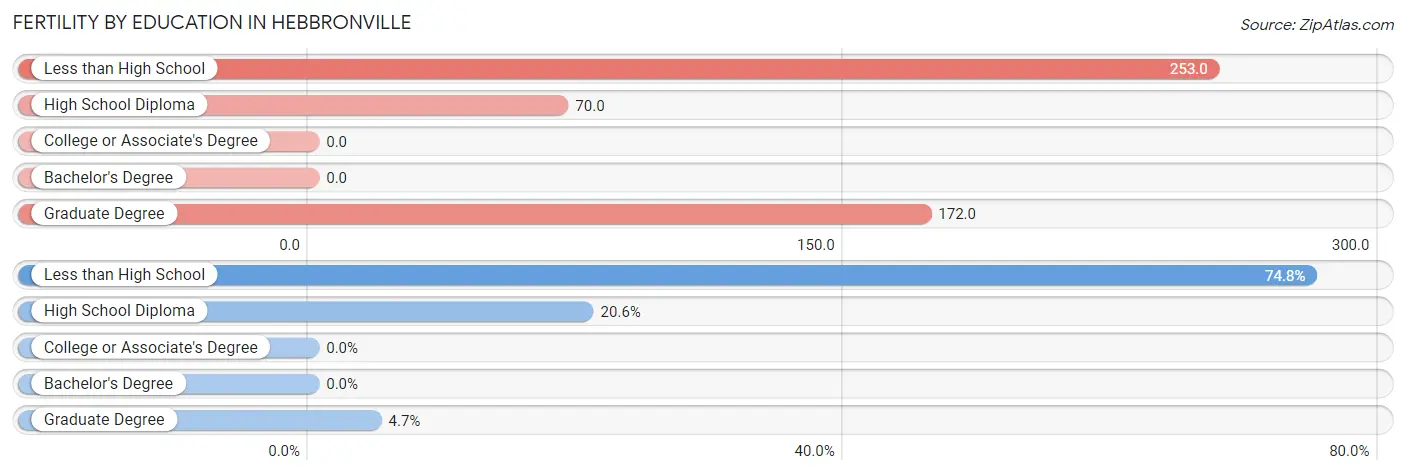
| Educational Attainment | Women with Births | Births / 1,000 Women |
| Less than High School | 80 (74.8%) | 253.0 |
| High School Diploma | 22 (20.6%) | 70.0 |
| College or Associate's Degree | 0 (0.0%) | 0.0 |
| Bachelor's Degree | 0 (0.0%) | 0.0 |
| Graduate Degree | 5 (4.7%) | 172.0 |
| Total | 107 (100.0%) | 110.0 |
Fertility by Education by Marriage Status in Hebbronville
32.7% of women with births in Hebbronville are unmarried. Women with the educational attainment of graduate degree are most likely to be married with 100.0% of them married at childbirth, while women with the educational attainment of high school diploma are least likely to be married with 100.0% of them unmarried at childbirth.
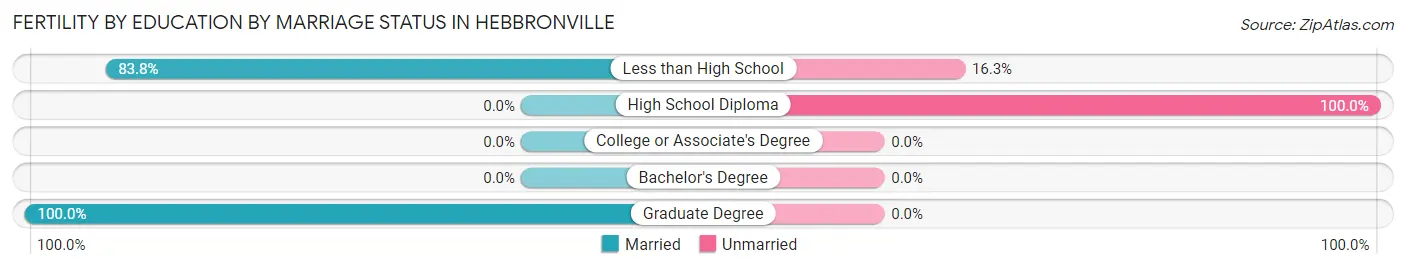
| Educational Attainment | Married | Unmarried |
| Less than High School | 67 (83.8%) | 13 (16.3%) |
| High School Diploma | 0 (0.0%) | 22 (100.0%) |
| College or Associate's Degree | 0 (0.0%) | 0 (0.0%) |
| Bachelor's Degree | 0 (0.0%) | 0 (0.0%) |
| Graduate Degree | 5 (100.0%) | 0 (0.0%) |
| Total | 72 (67.3%) | 35 (32.7%) |
Employment Characteristics in Hebbronville
Employment by Class of Employer in Hebbronville
Among the 1,755 employed individuals in Hebbronville, private company employees (1,345 | 76.6%), local government employees (146 | 8.3%), and state government employees (80 | 4.6%) make up the most common classes of employment.
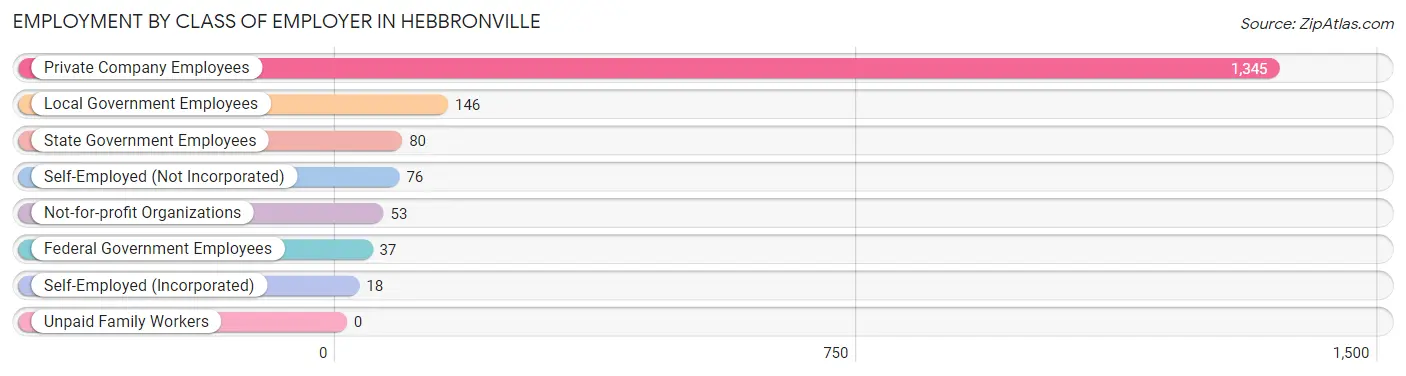
| Employer Class | # Employees | % Employees |
| Private Company Employees | 1,345 | 76.6% |
| Self-Employed (Incorporated) | 18 | 1.0% |
| Self-Employed (Not Incorporated) | 76 | 4.3% |
| Not-for-profit Organizations | 53 | 3.0% |
| Local Government Employees | 146 | 8.3% |
| State Government Employees | 80 | 4.6% |
| Federal Government Employees | 37 | 2.1% |
| Unpaid Family Workers | 0 | 0.0% |
| Total | 1,755 | 100.0% |
Employment Status by Age in Hebbronville
According to the labor force statistics for Hebbronville, out of the total population over 16 years of age (3,051), 62.3% or 1,901 individuals are in the labor force, with 5.1% or 97 of them unemployed. The age group with the highest labor force participation rate is 20 to 24 years, with 94.6% or 578 individuals in the labor force. Within the labor force, the 25 to 29 years age range has the highest percentage of unemployed individuals, with 34.4% or 45 of them being unemployed.
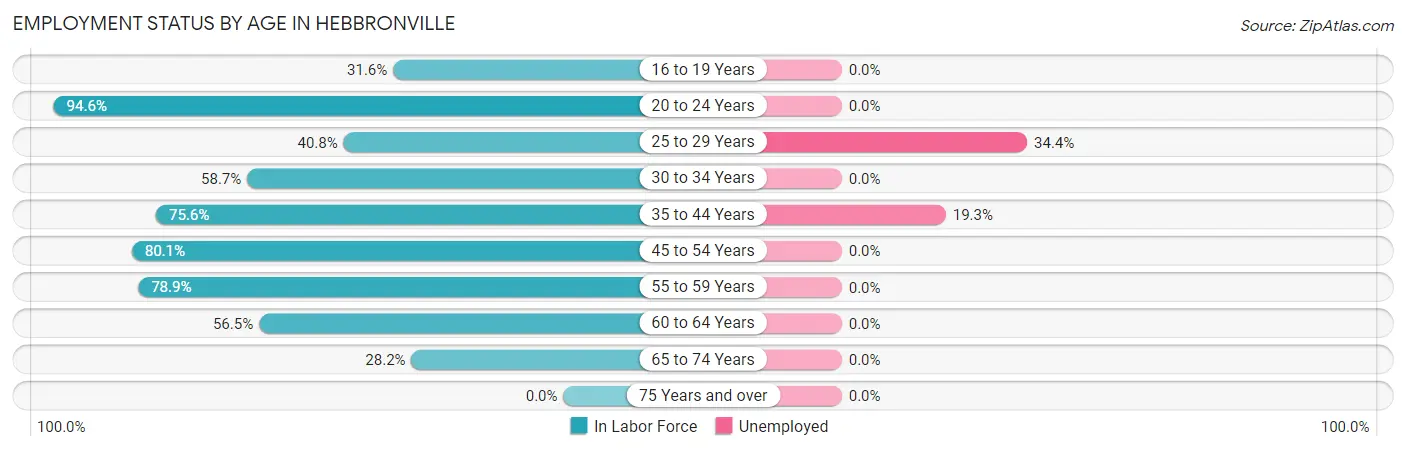
| Age Bracket | In Labor Force | Unemployed |
| 16 to 19 Years | 93 (31.6%) | 0 (0.0%) |
| 20 to 24 Years | 578 (94.6%) | 0 (0.0%) |
| 25 to 29 Years | 131 (40.8%) | 45 (34.4%) |
| 30 to 34 Years | 168 (58.7%) | 0 (0.0%) |
| 35 to 44 Years | 269 (75.6%) | 52 (19.3%) |
| 45 to 54 Years | 362 (80.1%) | 0 (0.0%) |
| 55 to 59 Years | 97 (78.9%) | 0 (0.0%) |
| 60 to 64 Years | 131 (56.5%) | 0 (0.0%) |
| 65 to 74 Years | 71 (28.2%) | 0 (0.0%) |
| 75 Years and over | 0 (0.0%) | 0 (0.0%) |
| Total | 1,901 (62.3%) | 97 (5.1%) |
Employment Status by Educational Attainment in Hebbronville
According to labor force statistics for Hebbronville, 65.4% of individuals (1,158) out of the total population between 25 and 64 years of age (1,770) are in the labor force, with 8.4% or 97 of them being unemployed. The group with the highest labor force participation rate are those with the educational attainment of bachelor's degree or higher, with 91.0% or 152 individuals in the labor force. Within the labor force, individuals with less than high school education have the highest percentage of unemployment, with 14.0% or 45 of them being unemployed.
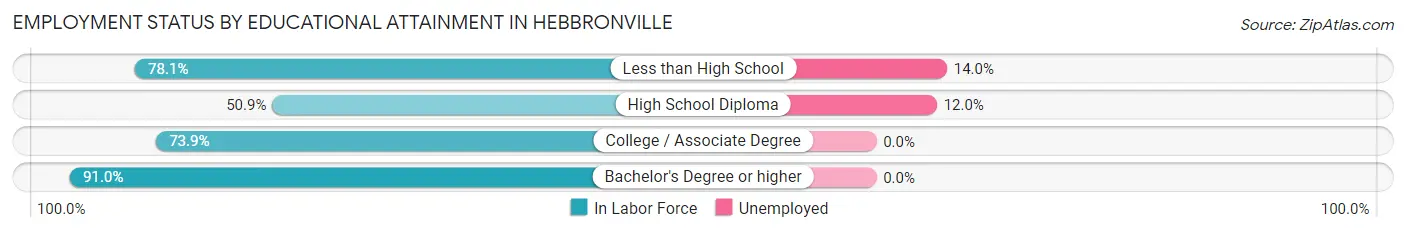
| Educational Attainment | In Labor Force | Unemployed |
| Less than High School | 321 (78.1%) | 58 (14.0%) |
| High School Diploma | 433 (50.9%) | 102 (12.0%) |
| College / Associate Degree | 252 (73.9%) | 0 (0.0%) |
| Bachelor's Degree or higher | 152 (91.0%) | 0 (0.0%) |
| Total | 1,158 (65.4%) | 149 (8.4%) |
Employment Occupations by Sex in Hebbronville
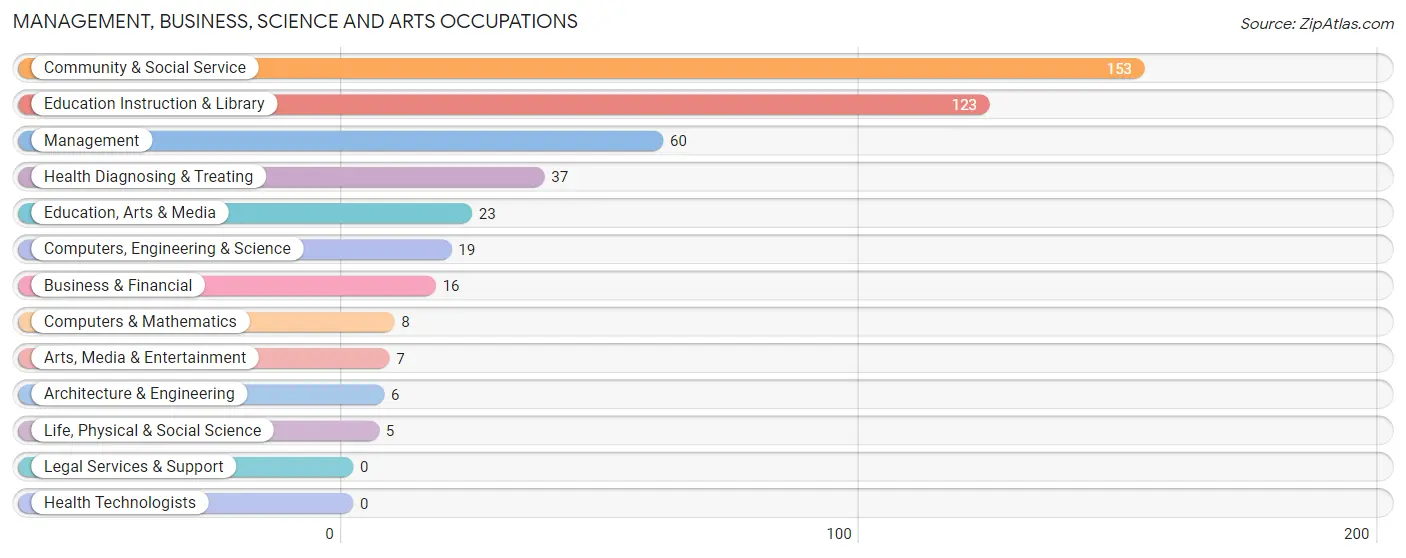
Management, Business, Science and Arts Occupations
The most common Management, Business, Science and Arts occupations in Hebbronville are Community & Social Service (153 | 8.5%), Education Instruction & Library (123 | 6.8%), Management (60 | 3.3%), Health Diagnosing & Treating (37 | 2.1%), and Education, Arts & Media (23 | 1.3%).
Management, Business, Science and Arts Occupations by Sex
Within the Management, Business, Science and Arts occupations in Hebbronville, the most male-oriented occupations are Computers, Engineering & Science (100.0%), Computers & Mathematics (100.0%), and Architecture & Engineering (100.0%), while the most female-oriented occupations are Education, Arts & Media (100.0%), Health Diagnosing & Treating (100.0%), and Education Instruction & Library (78.9%).
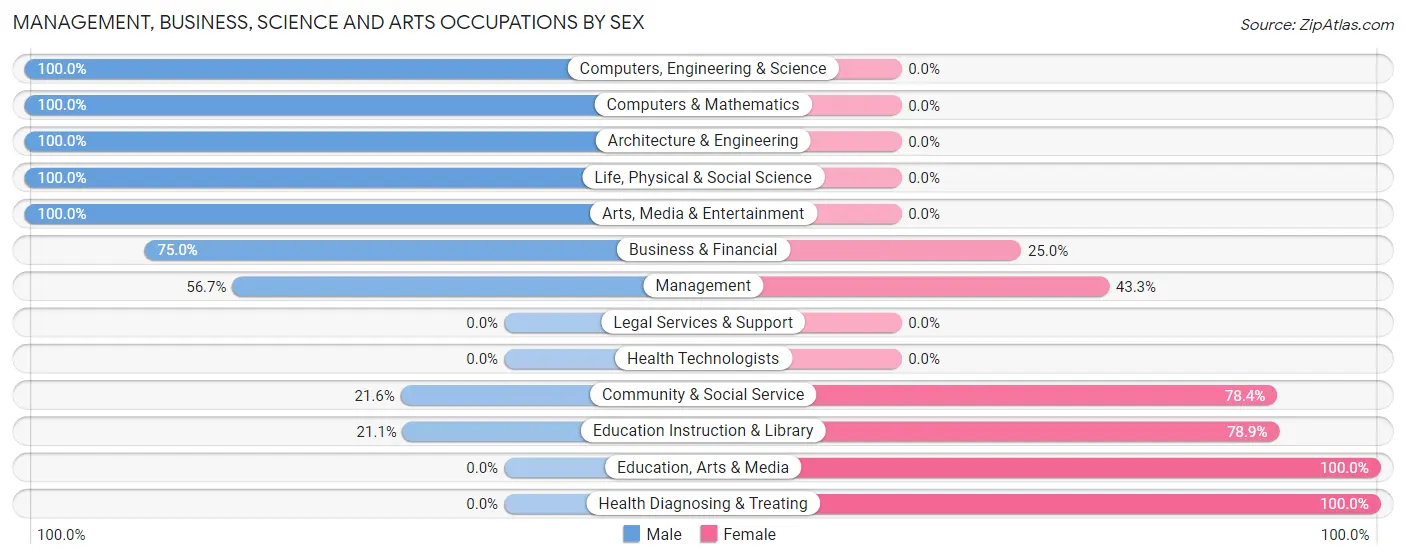
| Occupation | Male | Female |
| Management | 34 (56.7%) | 26 (43.3%) |
| Business & Financial | 12 (75.0%) | 4 (25.0%) |
| Computers, Engineering & Science | 19 (100.0%) | 0 (0.0%) |
| Computers & Mathematics | 8 (100.0%) | 0 (0.0%) |
| Architecture & Engineering | 6 (100.0%) | 0 (0.0%) |
| Life, Physical & Social Science | 5 (100.0%) | 0 (0.0%) |
| Community & Social Service | 33 (21.6%) | 120 (78.4%) |
| Education, Arts & Media | 0 (0.0%) | 23 (100.0%) |
| Legal Services & Support | 0 (0.0%) | 0 (0.0%) |
| Education Instruction & Library | 26 (21.1%) | 97 (78.9%) |
| Arts, Media & Entertainment | 7 (100.0%) | 0 (0.0%) |
| Health Diagnosing & Treating | 0 (0.0%) | 37 (100.0%) |
| Health Technologists | 0 (0.0%) | 0 (0.0%) |
| Total (Category) | 98 (34.4%) | 187 (65.6%) |
| Total (Overall) | 1,066 (59.1%) | 737 (40.9%) |
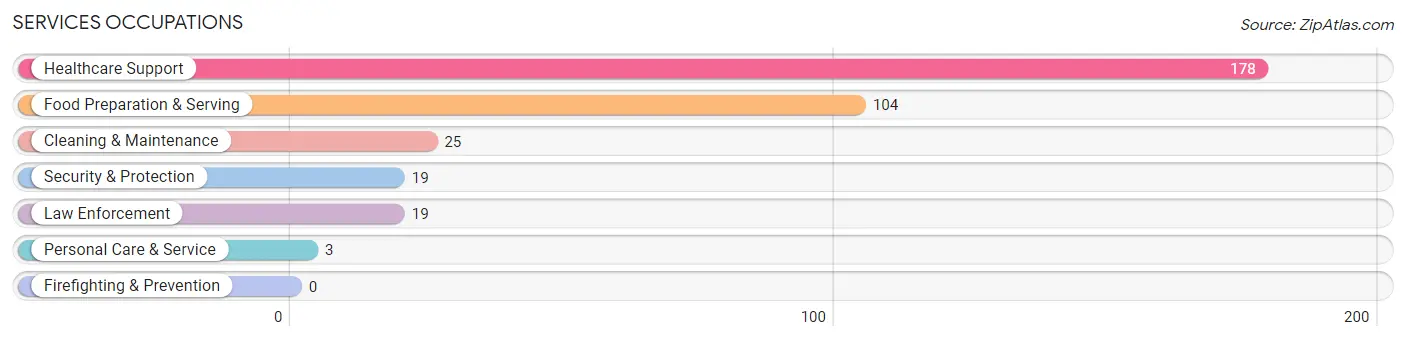
Services Occupations
The most common Services occupations in Hebbronville are Healthcare Support (178 | 9.9%), Food Preparation & Serving (104 | 5.8%), Cleaning & Maintenance (25 | 1.4%), Security & Protection (19 | 1.1%), and Law Enforcement (19 | 1.1%).
Services Occupations by Sex
Within the Services occupations in Hebbronville, the most male-oriented occupations are Cleaning & Maintenance (100.0%), and Food Preparation & Serving (46.2%), while the most female-oriented occupations are Healthcare Support (100.0%), Security & Protection (100.0%), and Law Enforcement (100.0%).
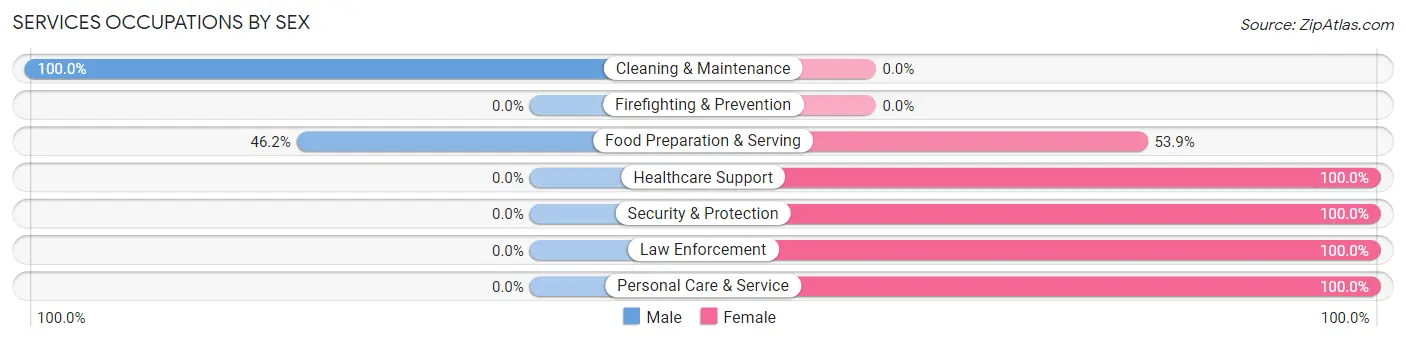
| Occupation | Male | Female |
| Healthcare Support | 0 (0.0%) | 178 (100.0%) |
| Security & Protection | 0 (0.0%) | 19 (100.0%) |
| Firefighting & Prevention | 0 (0.0%) | 0 (0.0%) |
| Law Enforcement | 0 (0.0%) | 19 (100.0%) |
| Food Preparation & Serving | 48 (46.2%) | 56 (53.8%) |
| Cleaning & Maintenance | 25 (100.0%) | 0 (0.0%) |
| Personal Care & Service | 0 (0.0%) | 3 (100.0%) |
| Total (Category) | 73 (22.2%) | 256 (77.8%) |
| Total (Overall) | 1,066 (59.1%) | 737 (40.9%) |
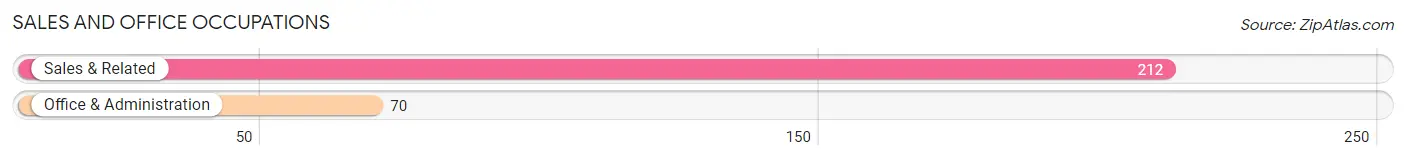
Sales and Office Occupations
The most common Sales and Office occupations in Hebbronville are Sales & Related (212 | 11.8%), and Office & Administration (70 | 3.9%).
Sales and Office Occupations by Sex
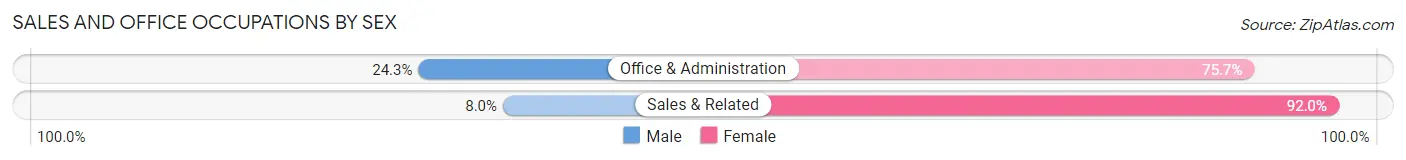
| Occupation | Male | Female |
| Sales & Related | 17 (8.0%) | 195 (92.0%) |
| Office & Administration | 17 (24.3%) | 53 (75.7%) |
| Total (Category) | 34 (12.1%) | 248 (87.9%) |
| Total (Overall) | 1,066 (59.1%) | 737 (40.9%) |
Natural Resources, Construction and Maintenance Occupations
The most common Natural Resources, Construction and Maintenance occupations in Hebbronville are Construction & Extraction (346 | 19.2%), Installation, Maintenance & Repair (60 | 3.3%), and Farming, Fishing & Forestry (16 | 0.9%).
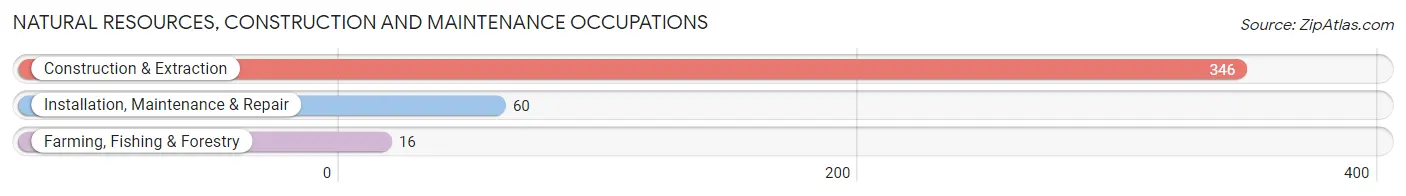
Natural Resources, Construction and Maintenance Occupations by Sex
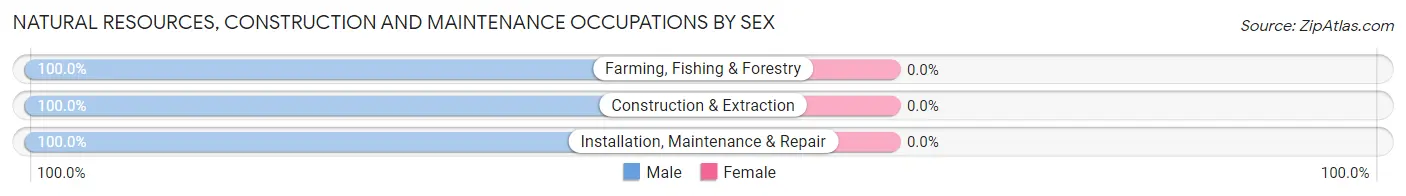
| Occupation | Male | Female |
| Farming, Fishing & Forestry | 16 (100.0%) | 0 (0.0%) |
| Construction & Extraction | 346 (100.0%) | 0 (0.0%) |
| Installation, Maintenance & Repair | 60 (100.0%) | 0 (0.0%) |
| Total (Category) | 422 (100.0%) | 0 (0.0%) |
| Total (Overall) | 1,066 (59.1%) | 737 (40.9%) |
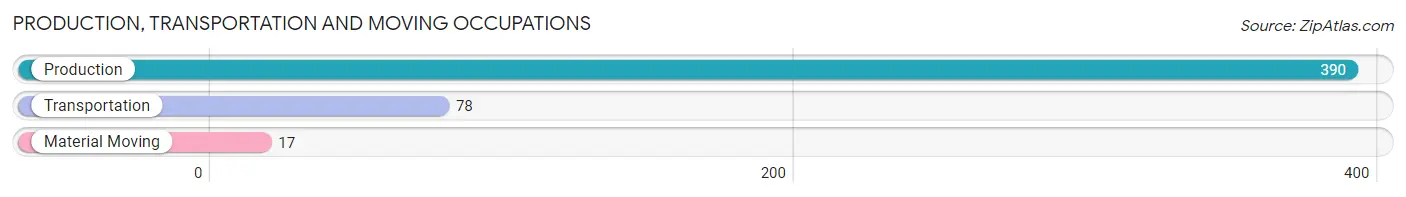
Production, Transportation and Moving Occupations
The most common Production, Transportation and Moving occupations in Hebbronville are Production (390 | 21.6%), Transportation (78 | 4.3%), and Material Moving (17 | 0.9%).
Production, Transportation and Moving Occupations by Sex
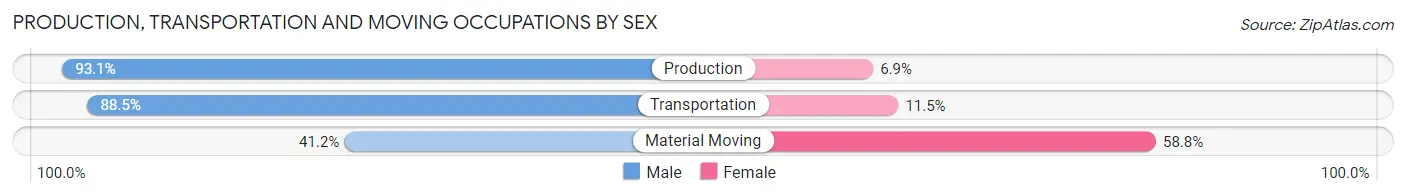
| Occupation | Male | Female |
| Production | 363 (93.1%) | 27 (6.9%) |
| Transportation | 69 (88.5%) | 9 (11.5%) |
| Material Moving | 7 (41.2%) | 10 (58.8%) |
| Total (Category) | 439 (90.5%) | 46 (9.5%) |
| Total (Overall) | 1,066 (59.1%) | 737 (40.9%) |
Employment Industries by Sex in Hebbronville
Employment Industries in Hebbronville
The major employment industries in Hebbronville include Mining, Quarrying, & Extraction (494 | 27.4%), Retail Trade (268 | 14.9%), Health Care & Social Assistance (262 | 14.5%), Educational Services (172 | 9.5%), and Construction (100 | 5.6%).

Employment Industries by Sex in Hebbronville
The Hebbronville industries that see more men than women are Wholesale Trade (100.0%), Transportation & Warehousing (100.0%), and Utilities (100.0%), whereas the industries that tend to have a higher number of women are Health Care & Social Assistance (97.7%), Retail Trade (83.2%), and Finance & Insurance (76.7%).
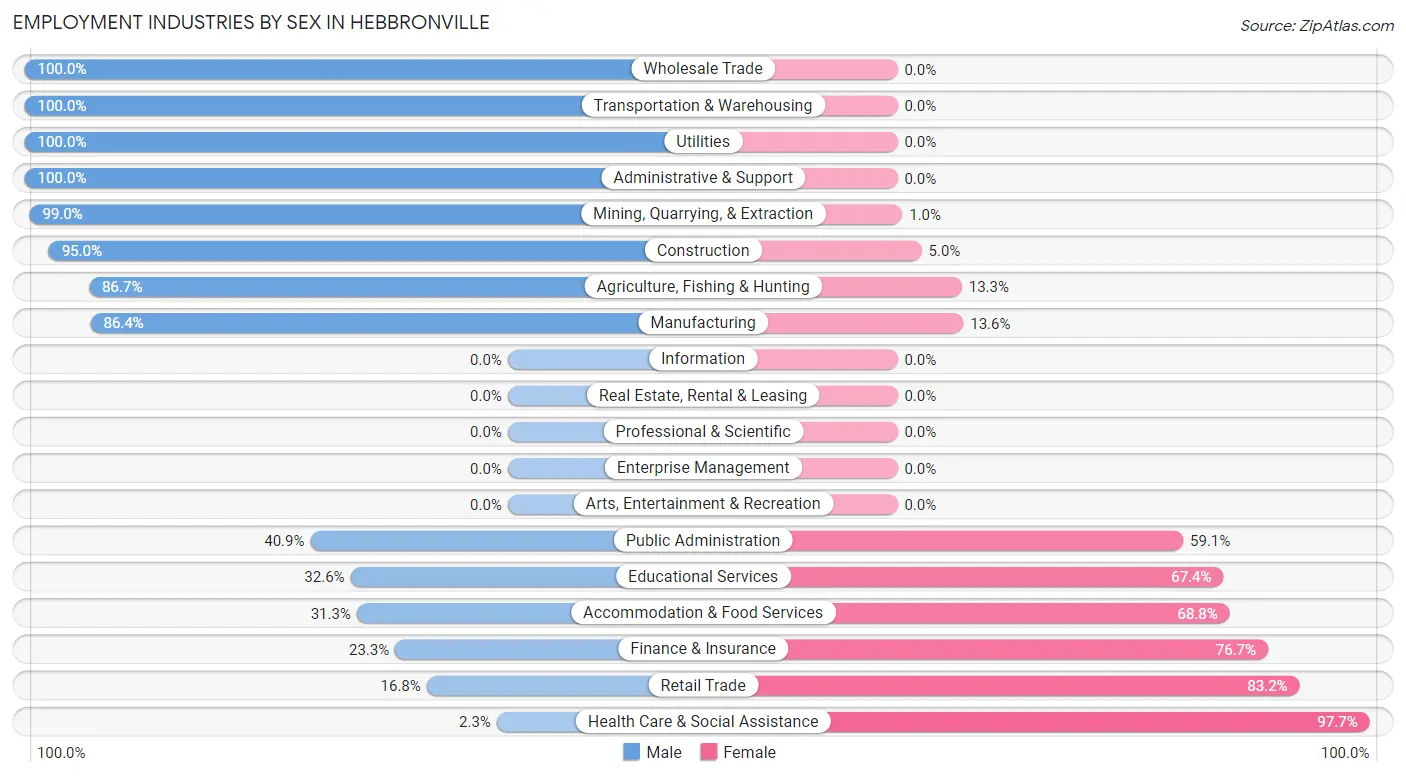
| Industry | Male | Female |
| Agriculture, Fishing & Hunting | 26 (86.7%) | 4 (13.3%) |
| Mining, Quarrying, & Extraction | 489 (99.0%) | 5 (1.0%) |
| Construction | 95 (95.0%) | 5 (5.0%) |
| Manufacturing | 19 (86.4%) | 3 (13.6%) |
| Wholesale Trade | 23 (100.0%) | 0 (0.0%) |
| Retail Trade | 45 (16.8%) | 223 (83.2%) |
| Transportation & Warehousing | 51 (100.0%) | 0 (0.0%) |
| Utilities | 50 (100.0%) | 0 (0.0%) |
| Information | 0 (0.0%) | 0 (0.0%) |
| Finance & Insurance | 7 (23.3%) | 23 (76.7%) |
| Real Estate, Rental & Leasing | 0 (0.0%) | 0 (0.0%) |
| Professional & Scientific | 0 (0.0%) | 0 (0.0%) |
| Enterprise Management | 0 (0.0%) | 0 (0.0%) |
| Administrative & Support | 20 (100.0%) | 0 (0.0%) |
| Educational Services | 56 (32.6%) | 116 (67.4%) |
| Health Care & Social Assistance | 6 (2.3%) | 256 (97.7%) |
| Arts, Entertainment & Recreation | 0 (0.0%) | 0 (0.0%) |
| Accommodation & Food Services | 20 (31.2%) | 44 (68.8%) |
| Public Administration | 38 (40.9%) | 55 (59.1%) |
| Total | 1,066 (59.1%) | 737 (40.9%) |
Education in Hebbronville
School Enrollment in Hebbronville
The most common levels of schooling among the 1,027 students in Hebbronville are elementary school (277 | 27.0%), nursery / preschool (248 | 24.1%), and college / undergraduate (159 | 15.5%).
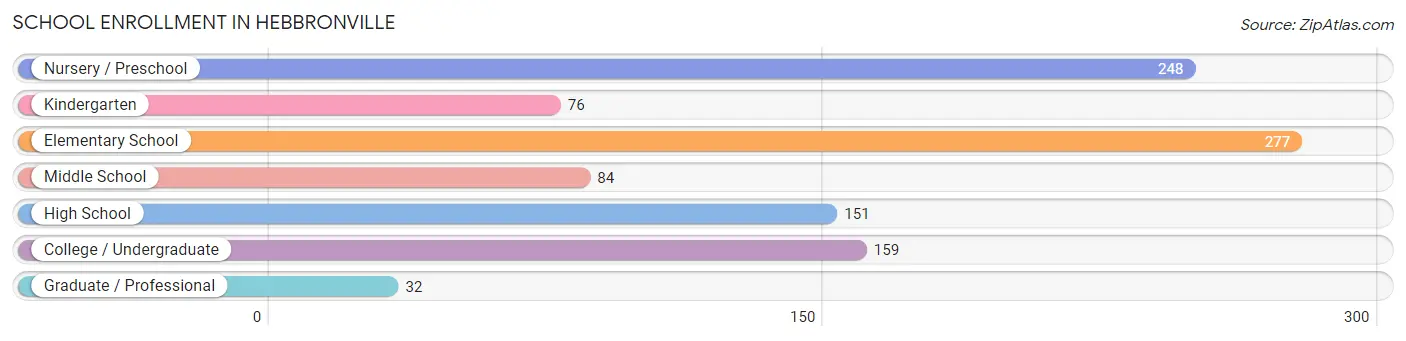
| School Level | # Students | % Students |
| Nursery / Preschool | 248 | 24.1% |
| Kindergarten | 76 | 7.4% |
| Elementary School | 277 | 27.0% |
| Middle School | 84 | 8.2% |
| High School | 151 | 14.7% |
| College / Undergraduate | 159 | 15.5% |
| Graduate / Professional | 32 | 3.1% |
| Total | 1,027 | 100.0% |
School Enrollment by Age by Funding Source in Hebbronville
Out of a total of 1,027 students who are enrolled in schools in Hebbronville, 14 (1.4%) attend a private institution, while the remaining 1,013 (98.6%) are enrolled in public schools. The age group of 25 to 34 year olds has the highest likelihood of being enrolled in private schools, with 8 (61.5% in the age bracket) enrolled. Conversely, the age group of 3 to 4 year olds has the lowest likelihood of being enrolled in a private school, with 235 (100.0% in the age bracket) attending a public institution.
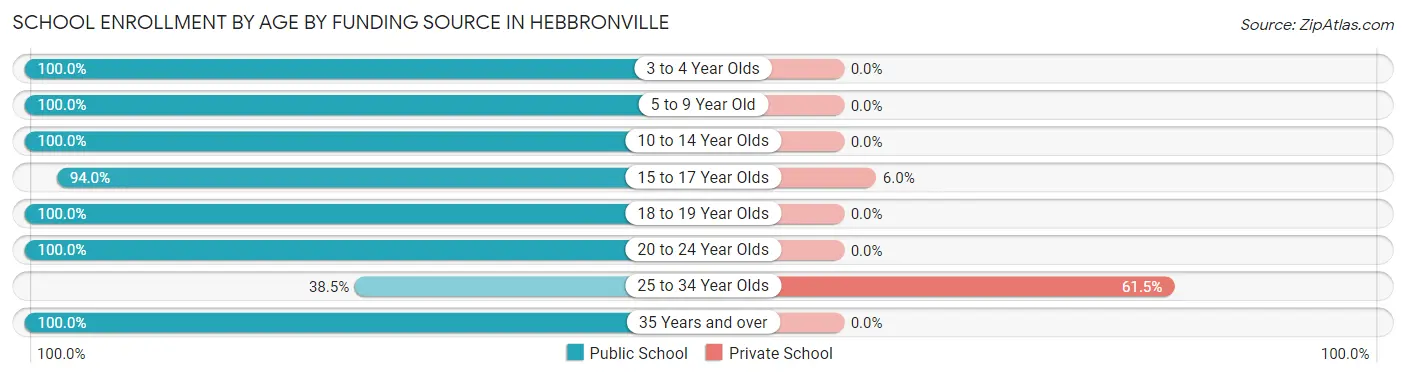
| Age Bracket | Public School | Private School |
| 3 to 4 Year Olds | 235 (100.0%) | 0 (0.0%) |
| 5 to 9 Year Old | 284 (100.0%) | 0 (0.0%) |
| 10 to 14 Year Olds | 184 (100.0%) | 0 (0.0%) |
| 15 to 17 Year Olds | 94 (94.0%) | 6 (6.0%) |
| 18 to 19 Year Olds | 86 (100.0%) | 0 (0.0%) |
| 20 to 24 Year Olds | 76 (100.0%) | 0 (0.0%) |
| 25 to 34 Year Olds | 5 (38.5%) | 8 (61.5%) |
| 35 Years and over | 49 (100.0%) | 0 (0.0%) |
| Total | 1,013 (98.6%) | 14 (1.4%) |
Educational Attainment by Field of Study in Hebbronville
Education (76 | 33.0%), business (37 | 16.1%), computers & mathematics (30 | 13.0%), psychology (23 | 10.0%), and bio, nature & agricultural (18 | 7.8%) are the most common fields of study among 230 individuals in Hebbronville who have obtained a bachelor's degree or higher.
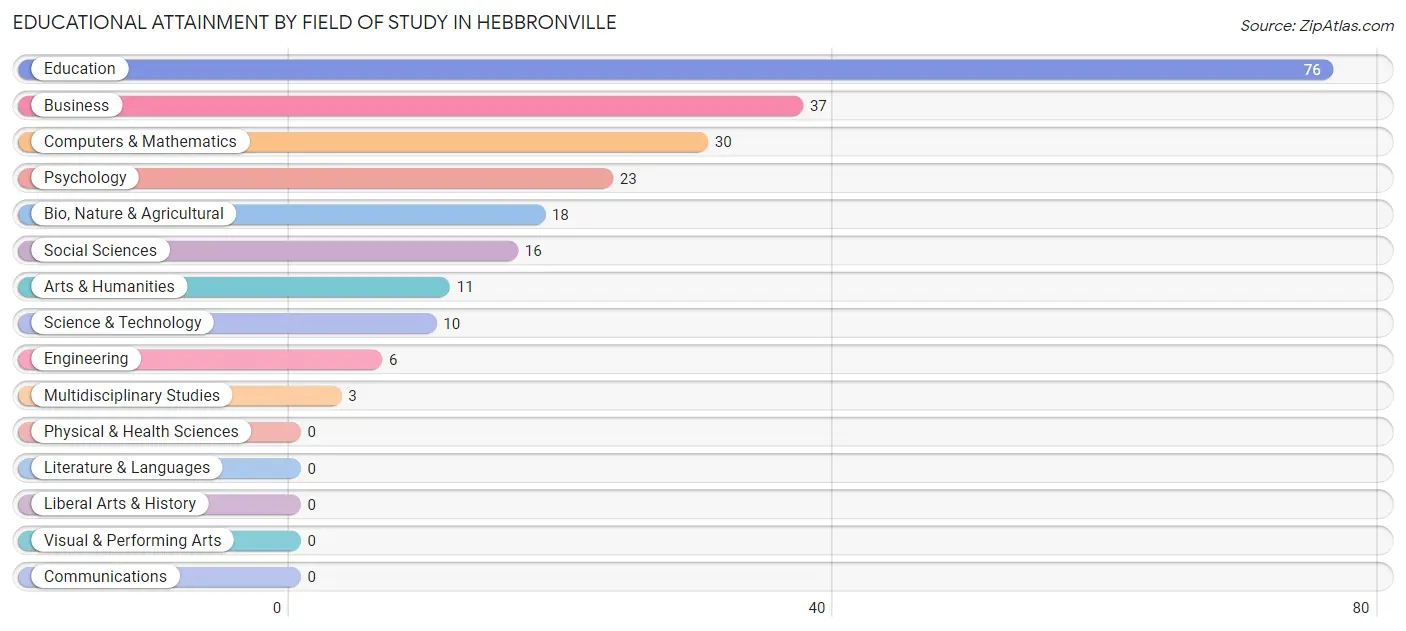
| Field of Study | # Graduates | % Graduates |
| Computers & Mathematics | 30 | 13.0% |
| Bio, Nature & Agricultural | 18 | 7.8% |
| Physical & Health Sciences | 0 | 0.0% |
| Psychology | 23 | 10.0% |
| Social Sciences | 16 | 7.0% |
| Engineering | 6 | 2.6% |
| Multidisciplinary Studies | 3 | 1.3% |
| Science & Technology | 10 | 4.3% |
| Business | 37 | 16.1% |
| Education | 76 | 33.0% |
| Literature & Languages | 0 | 0.0% |
| Liberal Arts & History | 0 | 0.0% |
| Visual & Performing Arts | 0 | 0.0% |
| Communications | 0 | 0.0% |
| Arts & Humanities | 11 | 4.8% |
| Total | 230 | 100.0% |
Transportation & Commute in Hebbronville
Vehicle Availability by Sex in Hebbronville
The most prevalent vehicle ownership categories in Hebbronville are males with 1 vehicle (462, accounting for 43.6%) and females with 1 vehicle (162, making up 66.4%).
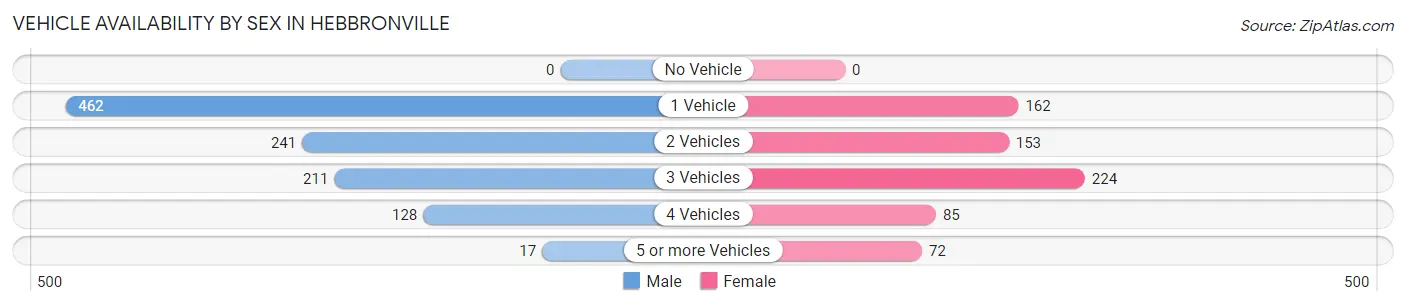
| Vehicles Available | Male | Female |
| No Vehicle | 0 (0.0%) | 0 (0.0%) |
| 1 Vehicle | 462 (43.6%) | 162 (23.3%) |
| 2 Vehicles | 241 (22.8%) | 153 (22.0%) |
| 3 Vehicles | 211 (19.9%) | 224 (32.2%) |
| 4 Vehicles | 128 (12.1%) | 85 (12.2%) |
| 5 or more Vehicles | 17 (1.6%) | 72 (10.3%) |
| Total | 1,059 (100.0%) | 696 (100.0%) |
Commute Time in Hebbronville
The most frequently occuring commute durations in Hebbronville are 5 to 9 minutes (481 commuters, 27.8%), 60 to 89 minutes (295 commuters, 17.0%), and 10 to 14 minutes (264 commuters, 15.2%).
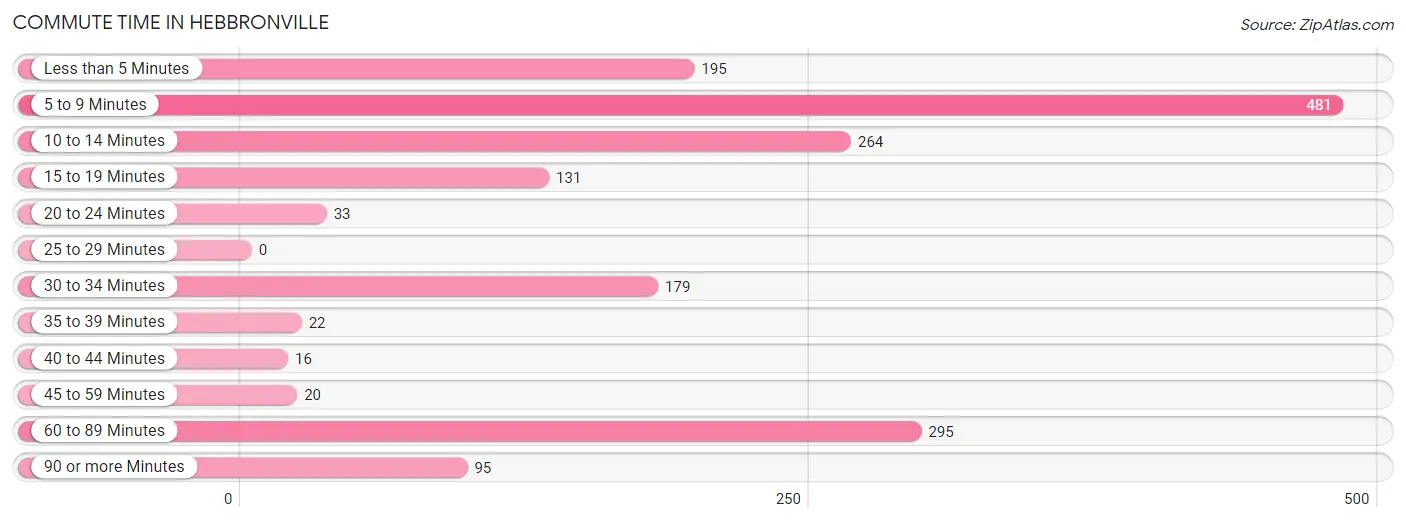
| Commute Time | # Commuters | % Commuters |
| Less than 5 Minutes | 195 | 11.3% |
| 5 to 9 Minutes | 481 | 27.8% |
| 10 to 14 Minutes | 264 | 15.2% |
| 15 to 19 Minutes | 131 | 7.6% |
| 20 to 24 Minutes | 33 | 1.9% |
| 25 to 29 Minutes | 0 | 0.0% |
| 30 to 34 Minutes | 179 | 10.3% |
| 35 to 39 Minutes | 22 | 1.3% |
| 40 to 44 Minutes | 16 | 0.9% |
| 45 to 59 Minutes | 20 | 1.2% |
| 60 to 89 Minutes | 295 | 17.0% |
| 90 or more Minutes | 95 | 5.5% |
Commute Time by Sex in Hebbronville
The most common commute times in Hebbronville are 60 to 89 minutes (258 commuters, 24.9%) for males and 5 to 9 minutes (265 commuters, 38.1%) for females.
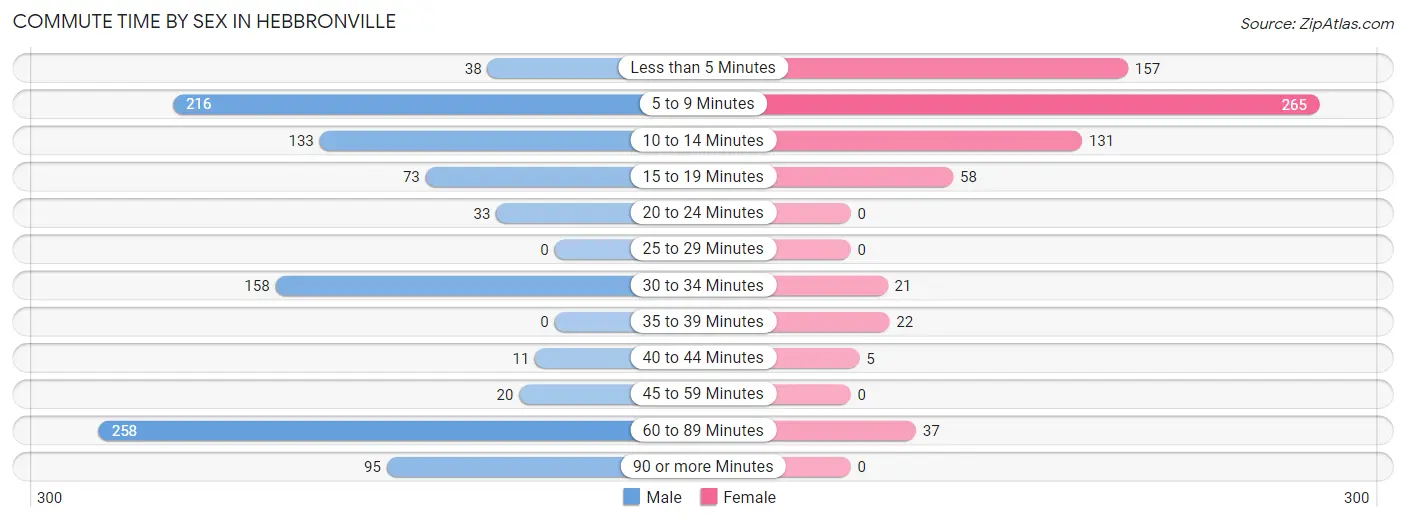
| Commute Time | Male | Female |
| Less than 5 Minutes | 38 (3.7%) | 157 (22.6%) |
| 5 to 9 Minutes | 216 (20.9%) | 265 (38.1%) |
| 10 to 14 Minutes | 133 (12.9%) | 131 (18.8%) |
| 15 to 19 Minutes | 73 (7.0%) | 58 (8.3%) |
| 20 to 24 Minutes | 33 (3.2%) | 0 (0.0%) |
| 25 to 29 Minutes | 0 (0.0%) | 0 (0.0%) |
| 30 to 34 Minutes | 158 (15.3%) | 21 (3.0%) |
| 35 to 39 Minutes | 0 (0.0%) | 22 (3.2%) |
| 40 to 44 Minutes | 11 (1.1%) | 5 (0.7%) |
| 45 to 59 Minutes | 20 (1.9%) | 0 (0.0%) |
| 60 to 89 Minutes | 258 (24.9%) | 37 (5.3%) |
| 90 or more Minutes | 95 (9.2%) | 0 (0.0%) |
Time of Departure to Work by Sex in Hebbronville
The most frequent times of departure to work in Hebbronville are 12:00 AM to 4:59 AM (243, 23.5%) for males and 8:00 AM to 8:29 AM (178, 25.6%) for females.
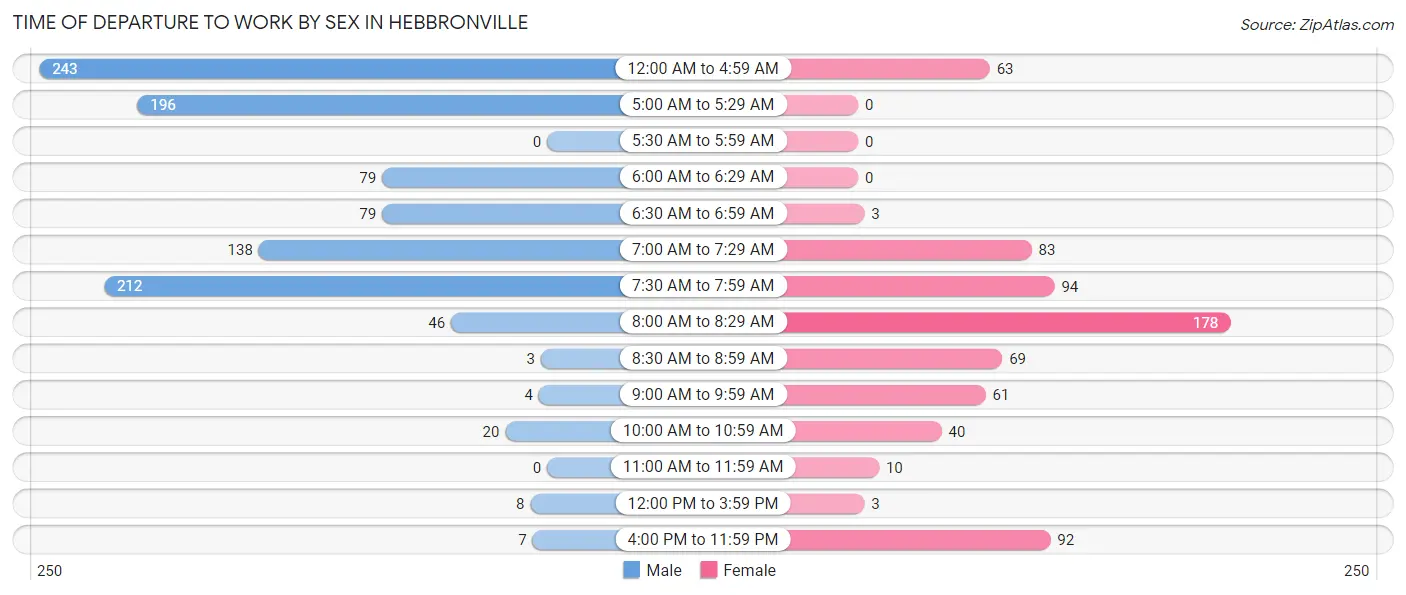
| Time of Departure | Male | Female |
| 12:00 AM to 4:59 AM | 243 (23.5%) | 63 (9.0%) |
| 5:00 AM to 5:29 AM | 196 (18.9%) | 0 (0.0%) |
| 5:30 AM to 5:59 AM | 0 (0.0%) | 0 (0.0%) |
| 6:00 AM to 6:29 AM | 79 (7.6%) | 0 (0.0%) |
| 6:30 AM to 6:59 AM | 79 (7.6%) | 3 (0.4%) |
| 7:00 AM to 7:29 AM | 138 (13.3%) | 83 (11.9%) |
| 7:30 AM to 7:59 AM | 212 (20.5%) | 94 (13.5%) |
| 8:00 AM to 8:29 AM | 46 (4.4%) | 178 (25.6%) |
| 8:30 AM to 8:59 AM | 3 (0.3%) | 69 (9.9%) |
| 9:00 AM to 9:59 AM | 4 (0.4%) | 61 (8.8%) |
| 10:00 AM to 10:59 AM | 20 (1.9%) | 40 (5.8%) |
| 11:00 AM to 11:59 AM | 0 (0.0%) | 10 (1.4%) |
| 12:00 PM to 3:59 PM | 8 (0.8%) | 3 (0.4%) |
| 4:00 PM to 11:59 PM | 7 (0.7%) | 92 (13.2%) |
| Total | 1,035 (100.0%) | 696 (100.0%) |
Housing Occupancy in Hebbronville
Occupancy by Ownership in Hebbronville
Of the total 1,183 dwellings in Hebbronville, owner-occupied units account for 733 (62.0%), while renter-occupied units make up 450 (38.0%).
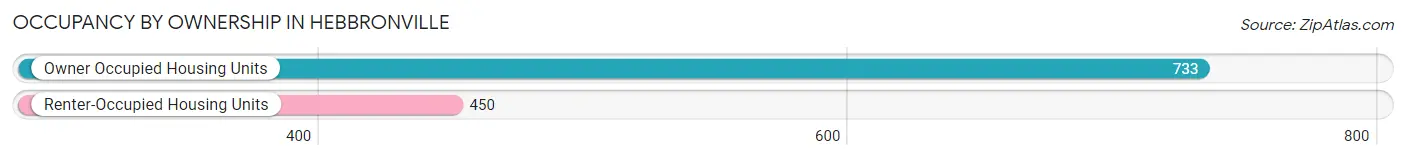
| Occupancy | # Housing Units | % Housing Units |
| Owner Occupied Housing Units | 733 | 62.0% |
| Renter-Occupied Housing Units | 450 | 38.0% |
| Total Occupied Housing Units | 1,183 | 100.0% |
Occupancy by Household Size in Hebbronville
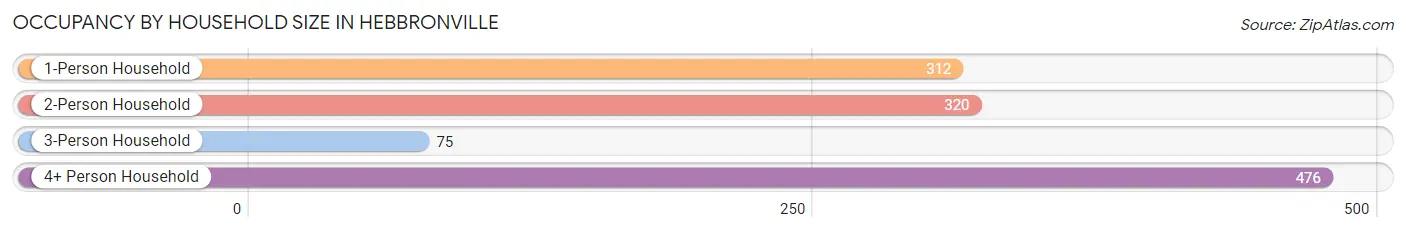
| Household Size | # Housing Units | % Housing Units |
| 1-Person Household | 312 | 26.4% |
| 2-Person Household | 320 | 27.1% |
| 3-Person Household | 75 | 6.3% |
| 4+ Person Household | 476 | 40.2% |
| Total Housing Units | 1,183 | 100.0% |
Occupancy by Ownership by Household Size in Hebbronville
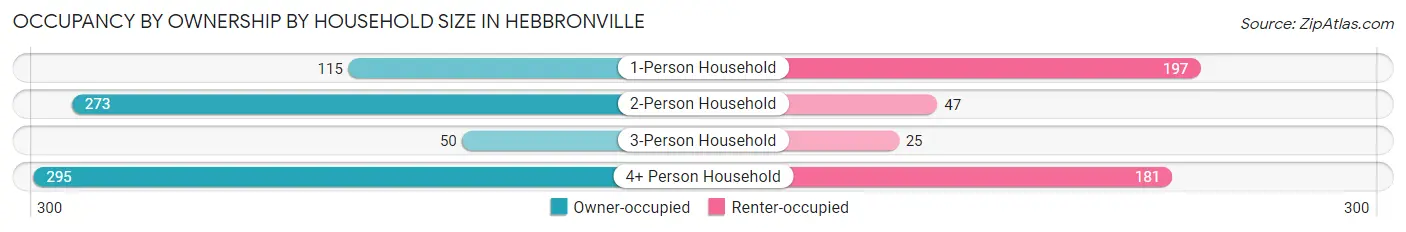
| Household Size | Owner-occupied | Renter-occupied |
| 1-Person Household | 115 (36.9%) | 197 (63.1%) |
| 2-Person Household | 273 (85.3%) | 47 (14.7%) |
| 3-Person Household | 50 (66.7%) | 25 (33.3%) |
| 4+ Person Household | 295 (62.0%) | 181 (38.0%) |
| Total Housing Units | 733 (62.0%) | 450 (38.0%) |
Occupancy by Educational Attainment in Hebbronville
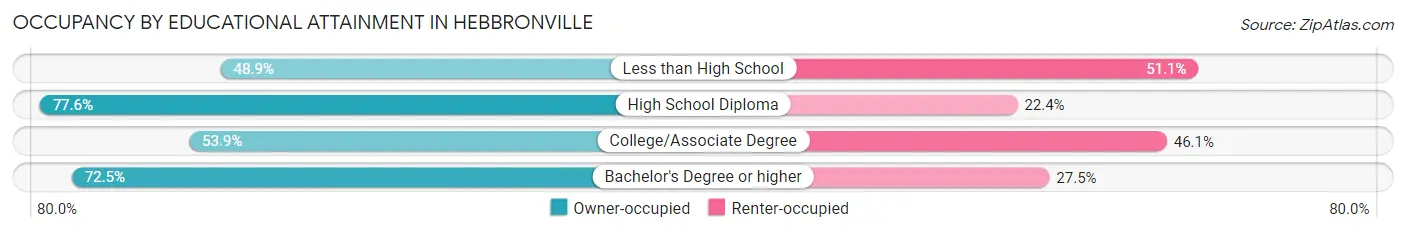
| Household Size | Owner-occupied | Renter-occupied |
| Less than High School | 133 (48.9%) | 139 (51.1%) |
| High School Diploma | 277 (77.6%) | 80 (22.4%) |
| College/Associate Degree | 228 (53.9%) | 195 (46.1%) |
| Bachelor's Degree or higher | 95 (72.5%) | 36 (27.5%) |
Occupancy by Age of Householder in Hebbronville
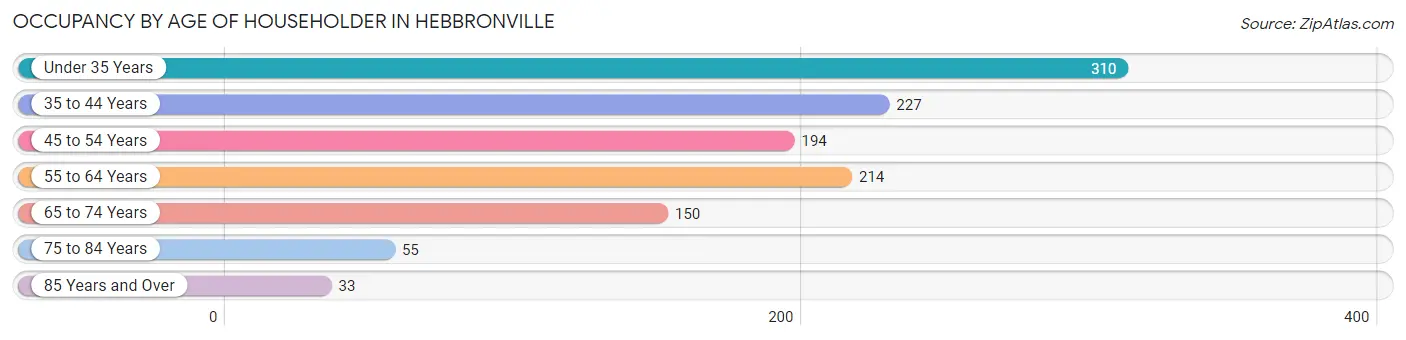
| Age Bracket | # Households | % Households |
| Under 35 Years | 310 | 26.2% |
| 35 to 44 Years | 227 | 19.2% |
| 45 to 54 Years | 194 | 16.4% |
| 55 to 64 Years | 214 | 18.1% |
| 65 to 74 Years | 150 | 12.7% |
| 75 to 84 Years | 55 | 4.6% |
| 85 Years and Over | 33 | 2.8% |
| Total | 1,183 | 100.0% |
Housing Finances in Hebbronville
Median Income by Occupancy in Hebbronville
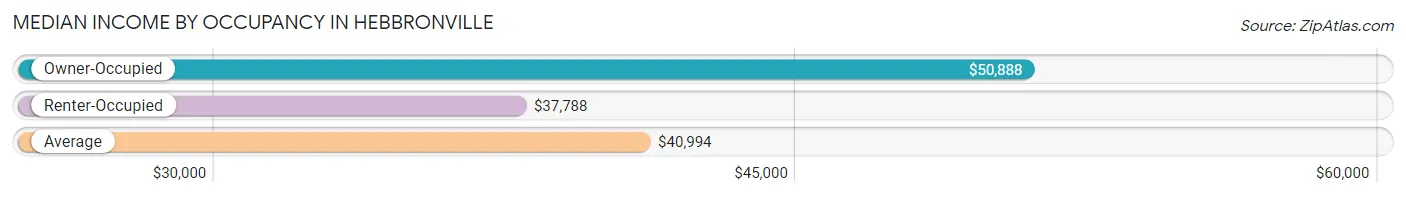
| Occupancy Type | # Households | Median Income |
| Owner-Occupied | 733 (62.0%) | $50,888 |
| Renter-Occupied | 450 (38.0%) | $37,788 |
| Average | 1,183 (100.0%) | $40,994 |
Occupancy by Householder Income Bracket in Hebbronville
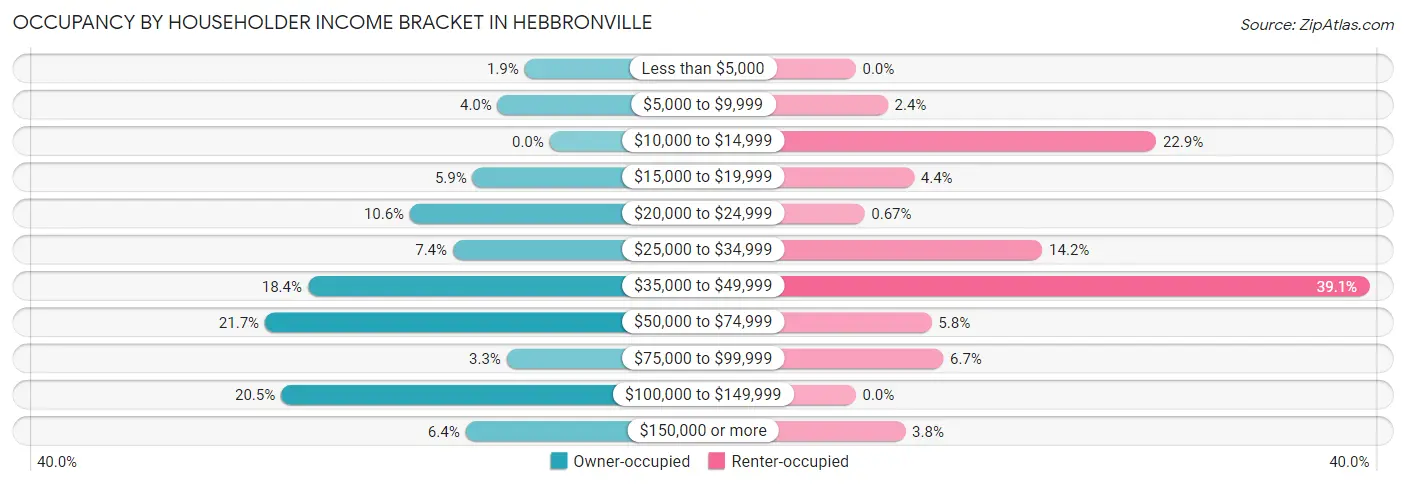
| Income Bracket | Owner-occupied | Renter-occupied |
| Less than $5,000 | 14 (1.9%) | 0 (0.0%) |
| $5,000 to $9,999 | 29 (4.0%) | 11 (2.4%) |
| $10,000 to $14,999 | 0 (0.0%) | 103 (22.9%) |
| $15,000 to $19,999 | 43 (5.9%) | 20 (4.4%) |
| $20,000 to $24,999 | 78 (10.6%) | 3 (0.7%) |
| $25,000 to $34,999 | 54 (7.4%) | 64 (14.2%) |
| $35,000 to $49,999 | 135 (18.4%) | 176 (39.1%) |
| $50,000 to $74,999 | 159 (21.7%) | 26 (5.8%) |
| $75,000 to $99,999 | 24 (3.3%) | 30 (6.7%) |
| $100,000 to $149,999 | 150 (20.5%) | 0 (0.0%) |
| $150,000 or more | 47 (6.4%) | 17 (3.8%) |
| Total | 733 (100.0%) | 450 (100.0%) |
Monthly Housing Cost Tiers in Hebbronville
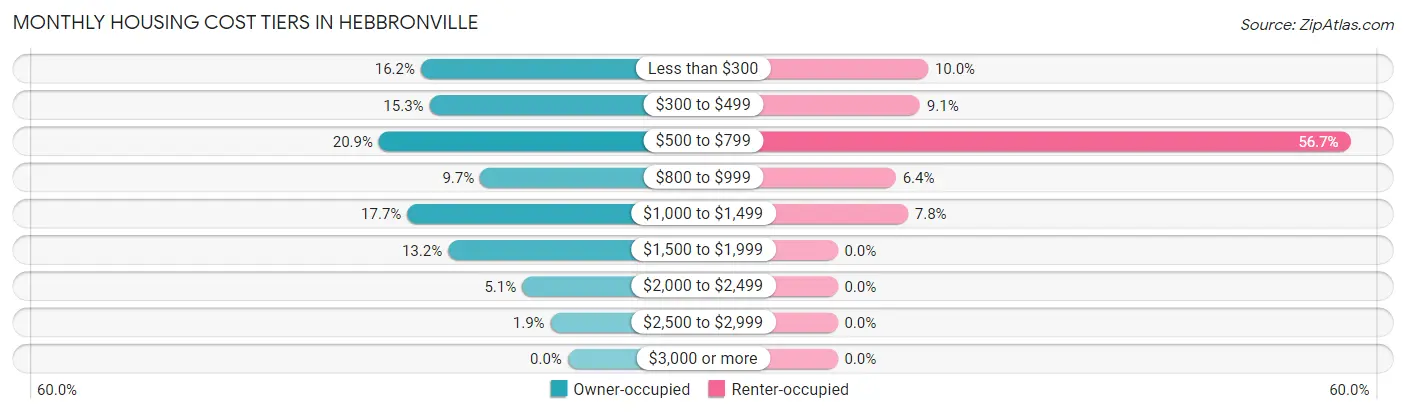
| Monthly Cost | Owner-occupied | Renter-occupied |
| Less than $300 | 119 (16.2%) | 45 (10.0%) |
| $300 to $499 | 112 (15.3%) | 41 (9.1%) |
| $500 to $799 | 153 (20.9%) | 255 (56.7%) |
| $800 to $999 | 71 (9.7%) | 29 (6.4%) |
| $1,000 to $1,499 | 130 (17.7%) | 35 (7.8%) |
| $1,500 to $1,999 | 97 (13.2%) | 0 (0.0%) |
| $2,000 to $2,499 | 37 (5.1%) | 0 (0.0%) |
| $2,500 to $2,999 | 14 (1.9%) | 0 (0.0%) |
| $3,000 or more | 0 (0.0%) | 0 (0.0%) |
| Total | 733 (100.0%) | 450 (100.0%) |
Physical Housing Characteristics in Hebbronville
Housing Structures in Hebbronville
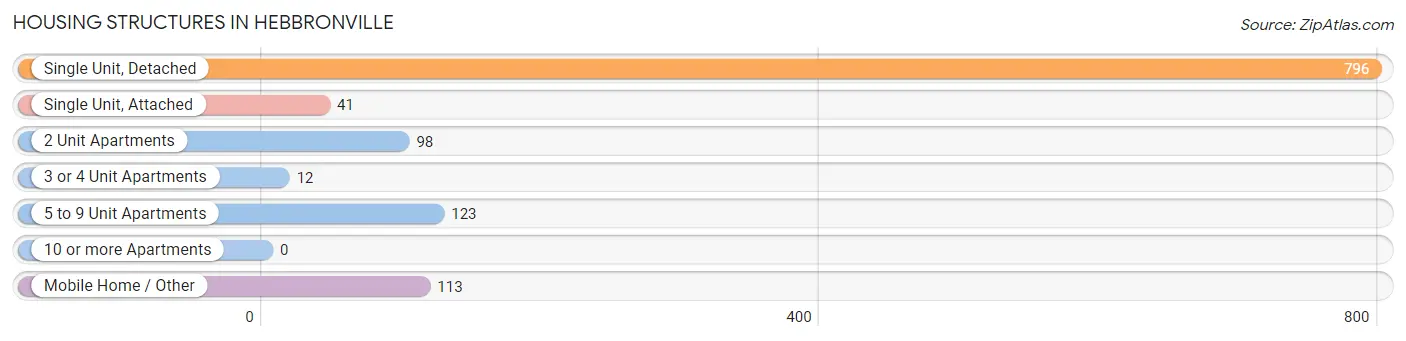
| Structure Type | # Housing Units | % Housing Units |
| Single Unit, Detached | 796 | 67.3% |
| Single Unit, Attached | 41 | 3.5% |
| 2 Unit Apartments | 98 | 8.3% |
| 3 or 4 Unit Apartments | 12 | 1.0% |
| 5 to 9 Unit Apartments | 123 | 10.4% |
| 10 or more Apartments | 0 | 0.0% |
| Mobile Home / Other | 113 | 9.6% |
| Total | 1,183 | 100.0% |
Housing Structures by Occupancy in Hebbronville
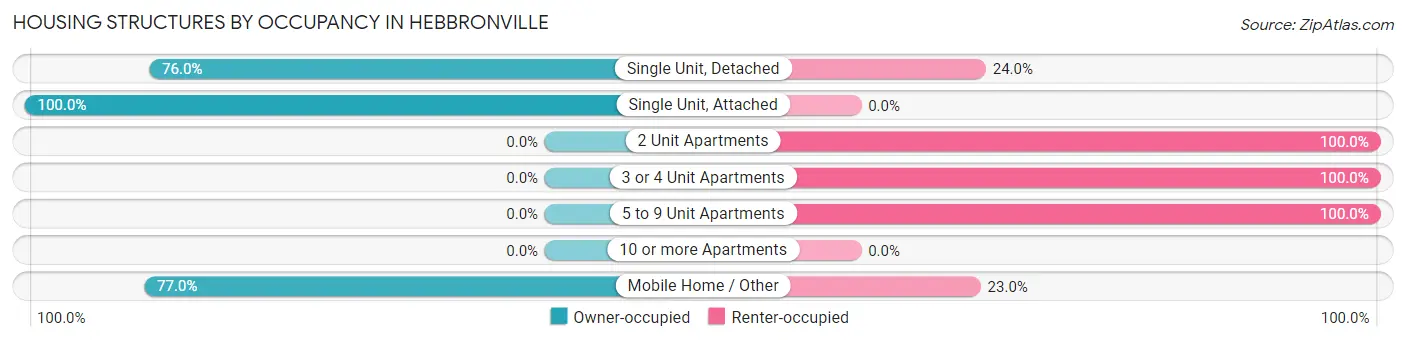
| Structure Type | Owner-occupied | Renter-occupied |
| Single Unit, Detached | 605 (76.0%) | 191 (24.0%) |
| Single Unit, Attached | 41 (100.0%) | 0 (0.0%) |
| 2 Unit Apartments | 0 (0.0%) | 98 (100.0%) |
| 3 or 4 Unit Apartments | 0 (0.0%) | 12 (100.0%) |
| 5 to 9 Unit Apartments | 0 (0.0%) | 123 (100.0%) |
| 10 or more Apartments | 0 (0.0%) | 0 (0.0%) |
| Mobile Home / Other | 87 (77.0%) | 26 (23.0%) |
| Total | 733 (62.0%) | 450 (38.0%) |
Housing Structures by Number of Rooms in Hebbronville
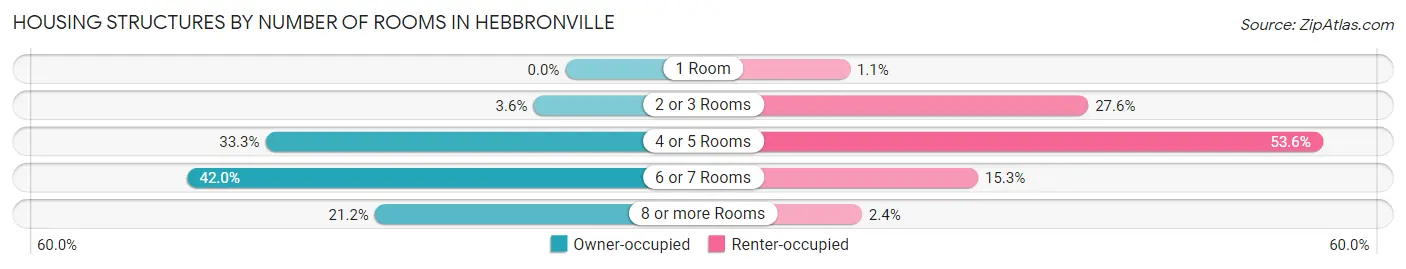
| Number of Rooms | Owner-occupied | Renter-occupied |
| 1 Room | 0 (0.0%) | 5 (1.1%) |
| 2 or 3 Rooms | 26 (3.5%) | 124 (27.6%) |
| 4 or 5 Rooms | 244 (33.3%) | 241 (53.6%) |
| 6 or 7 Rooms | 308 (42.0%) | 69 (15.3%) |
| 8 or more Rooms | 155 (21.1%) | 11 (2.4%) |
| Total | 733 (100.0%) | 450 (100.0%) |
Housing Structure by Heating Type in Hebbronville
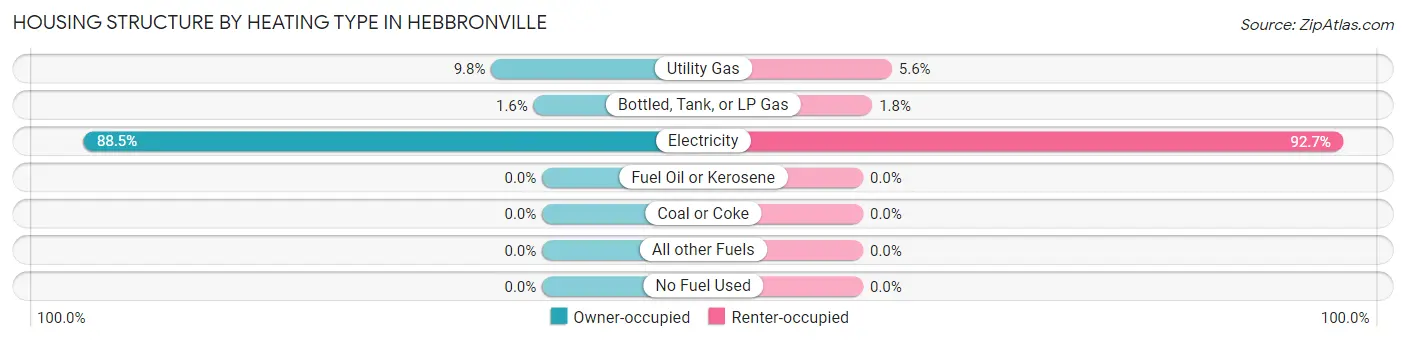
| Heating Type | Owner-occupied | Renter-occupied |
| Utility Gas | 72 (9.8%) | 25 (5.6%) |
| Bottled, Tank, or LP Gas | 12 (1.6%) | 8 (1.8%) |
| Electricity | 649 (88.5%) | 417 (92.7%) |
| Fuel Oil or Kerosene | 0 (0.0%) | 0 (0.0%) |
| Coal or Coke | 0 (0.0%) | 0 (0.0%) |
| All other Fuels | 0 (0.0%) | 0 (0.0%) |
| No Fuel Used | 0 (0.0%) | 0 (0.0%) |
| Total | 733 (100.0%) | 450 (100.0%) |
Household Vehicle Usage in Hebbronville
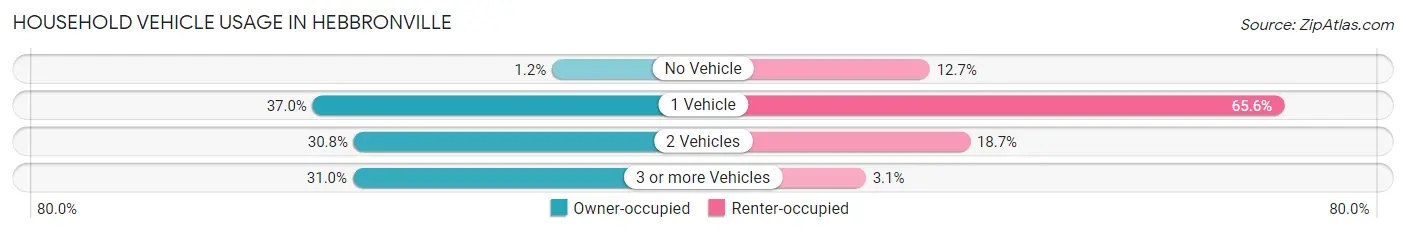
| Vehicles per Household | Owner-occupied | Renter-occupied |
| No Vehicle | 9 (1.2%) | 57 (12.7%) |
| 1 Vehicle | 271 (37.0%) | 295 (65.6%) |
| 2 Vehicles | 226 (30.8%) | 84 (18.7%) |
| 3 or more Vehicles | 227 (31.0%) | 14 (3.1%) |
| Total | 733 (100.0%) | 450 (100.0%) |
Real Estate & Mortgages in Hebbronville
Real Estate and Mortgage Overview in Hebbronville
| Characteristic | Without Mortgage | With Mortgage |
| Housing Units | 370 | 363 |
| Median Property Value | $73,300 | $143,200 |
| Median Household Income | $37,143 | $42 |
| Monthly Housing Costs | $413 | $0 |
| Real Estate Taxes | $1,066 | $41 |
Property Value by Mortgage Status in Hebbronville
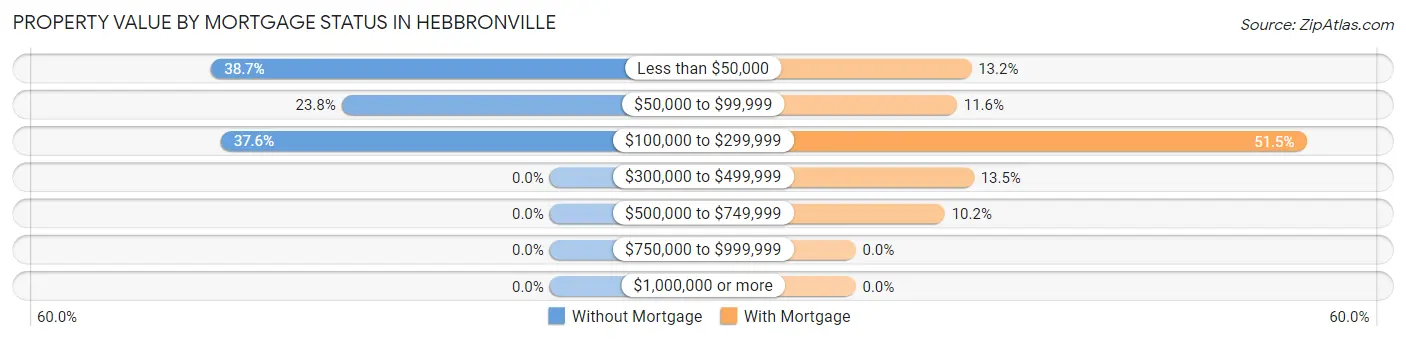
| Property Value | Without Mortgage | With Mortgage |
| Less than $50,000 | 143 (38.7%) | 48 (13.2%) |
| $50,000 to $99,999 | 88 (23.8%) | 42 (11.6%) |
| $100,000 to $299,999 | 139 (37.6%) | 187 (51.5%) |
| $300,000 to $499,999 | 0 (0.0%) | 49 (13.5%) |
| $500,000 to $749,999 | 0 (0.0%) | 37 (10.2%) |
| $750,000 to $999,999 | 0 (0.0%) | 0 (0.0%) |
| $1,000,000 or more | 0 (0.0%) | 0 (0.0%) |
| Total | 370 (100.0%) | 363 (100.0%) |
Household Income by Mortgage Status in Hebbronville
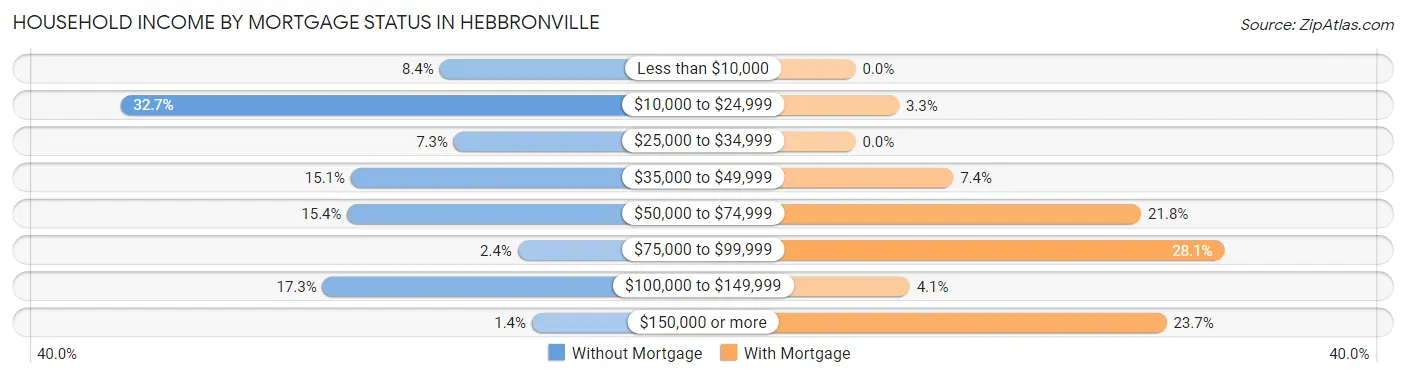
| Household Income | Without Mortgage | With Mortgage |
| Less than $10,000 | 31 (8.4%) | 0 (0.0%) |
| $10,000 to $24,999 | 121 (32.7%) | 12 (3.3%) |
| $25,000 to $34,999 | 27 (7.3%) | 0 (0.0%) |
| $35,000 to $49,999 | 56 (15.1%) | 27 (7.4%) |
| $50,000 to $74,999 | 57 (15.4%) | 79 (21.8%) |
| $75,000 to $99,999 | 9 (2.4%) | 102 (28.1%) |
| $100,000 to $149,999 | 64 (17.3%) | 15 (4.1%) |
| $150,000 or more | 5 (1.3%) | 86 (23.7%) |
| Total | 370 (100.0%) | 363 (100.0%) |
Property Value to Household Income Ratio in Hebbronville
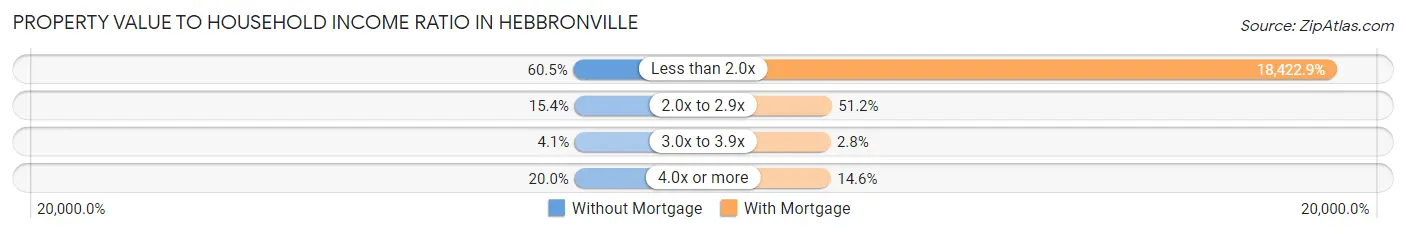
| Value-to-Income Ratio | Without Mortgage | With Mortgage |
| Less than 2.0x | 224 (60.5%) | 66,875 (18,422.9%) |
| 2.0x to 2.9x | 57 (15.4%) | 186 (51.2%) |
| 3.0x to 3.9x | 15 (4.1%) | 10 (2.8%) |
| 4.0x or more | 74 (20.0%) | 53 (14.6%) |
| Total | 370 (100.0%) | 363 (100.0%) |
Real Estate Taxes by Mortgage Status in Hebbronville
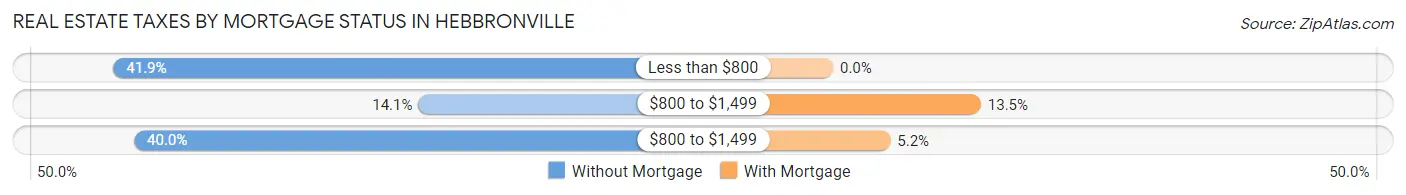
| Property Taxes | Without Mortgage | With Mortgage |
| Less than $800 | 155 (41.9%) | 0 (0.0%) |
| $800 to $1,499 | 52 (14.1%) | 49 (13.5%) |
| $800 to $1,499 | 148 (40.0%) | 19 (5.2%) |
| Total | 370 (100.0%) | 363 (100.0%) |
Health & Disability in Hebbronville
Health Insurance Coverage by Age in Hebbronville
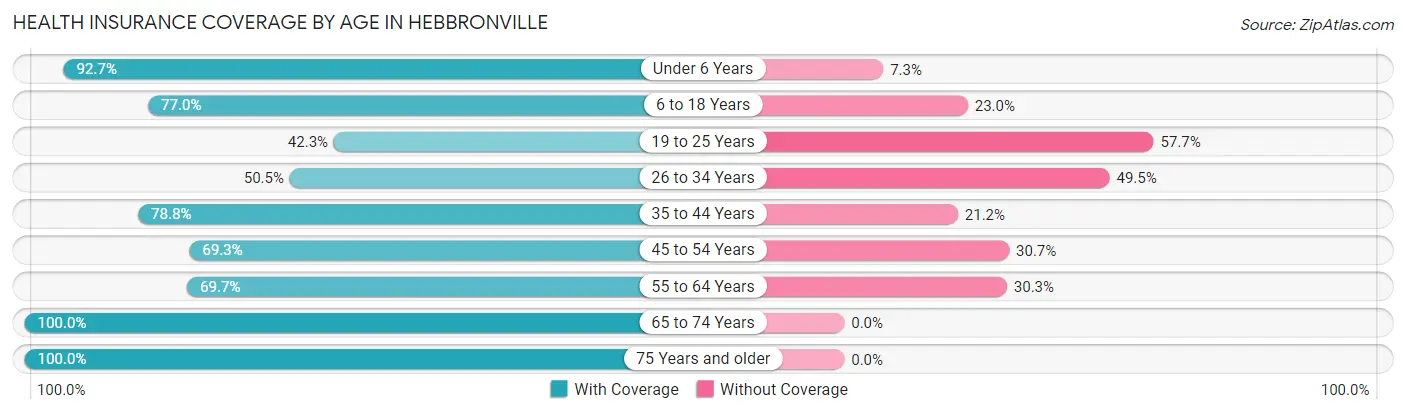
| Age Bracket | With Coverage | Without Coverage |
| Under 6 Years | 715 (92.7%) | 56 (7.3%) |
| 6 to 18 Years | 575 (77.0%) | 172 (23.0%) |
| 19 to 25 Years | 347 (42.3%) | 473 (57.7%) |
| 26 to 34 Years | 235 (50.5%) | 230 (49.5%) |
| 35 to 44 Years | 268 (78.8%) | 72 (21.2%) |
| 45 to 54 Years | 311 (69.3%) | 138 (30.7%) |
| 55 to 64 Years | 239 (69.7%) | 104 (30.3%) |
| 65 to 74 Years | 252 (100.0%) | 0 (0.0%) |
| 75 Years and older | 124 (100.0%) | 0 (0.0%) |
| Total | 3,066 (71.1%) | 1,245 (28.9%) |
Health Insurance Coverage by Citizenship Status in Hebbronville
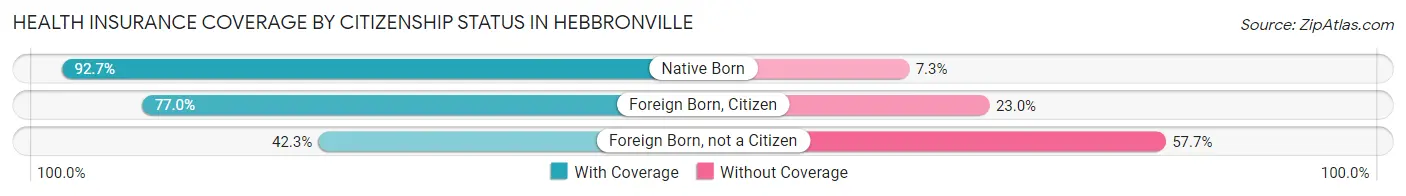
| Citizenship Status | With Coverage | Without Coverage |
| Native Born | 715 (92.7%) | 56 (7.3%) |
| Foreign Born, Citizen | 575 (77.0%) | 172 (23.0%) |
| Foreign Born, not a Citizen | 347 (42.3%) | 473 (57.7%) |
Health Insurance Coverage by Household Income in Hebbronville
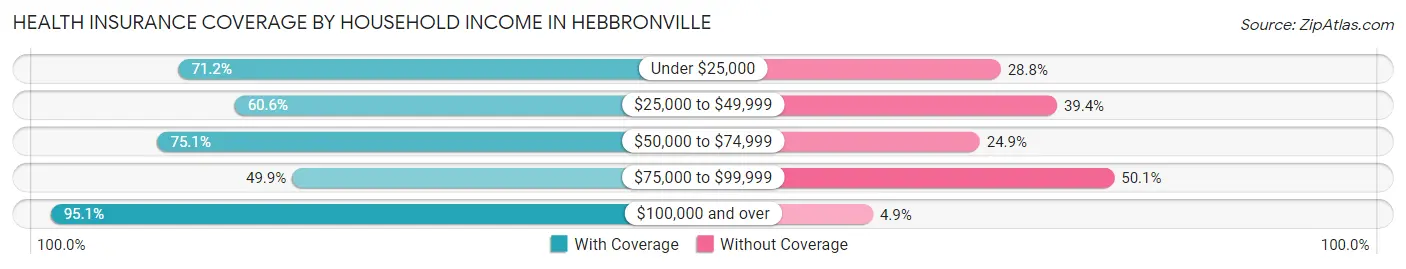
| Household Income | With Coverage | Without Coverage |
| Under $25,000 | 708 (71.2%) | 287 (28.8%) |
| $25,000 to $49,999 | 804 (60.6%) | 522 (39.4%) |
| $50,000 to $74,999 | 491 (75.1%) | 163 (24.9%) |
| $75,000 to $99,999 | 229 (49.9%) | 230 (50.1%) |
| $100,000 and over | 834 (95.1%) | 43 (4.9%) |
Public vs Private Health Insurance Coverage by Age in Hebbronville
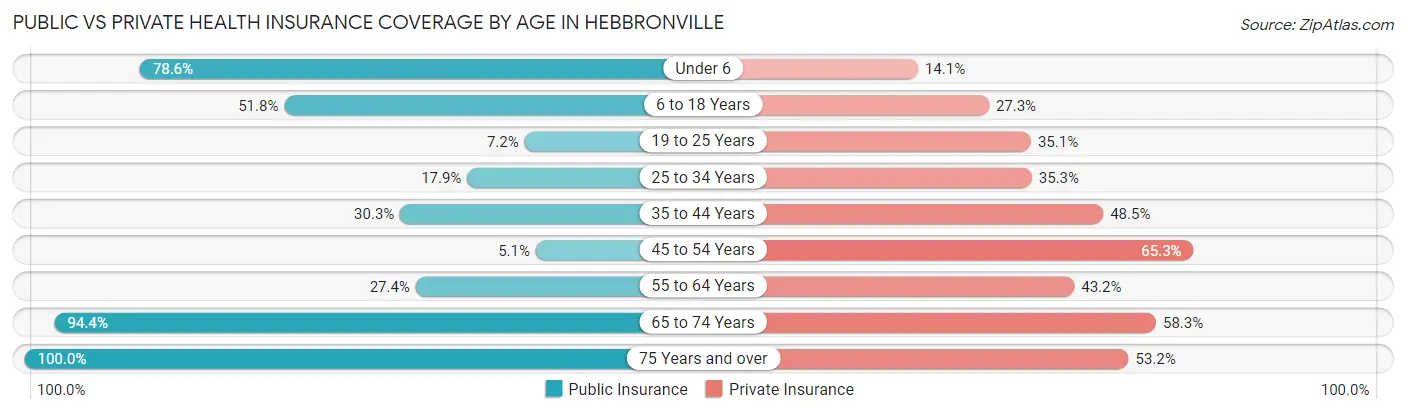
| Age Bracket | Public Insurance | Private Insurance |
| Under 6 | 606 (78.6%) | 109 (14.1%) |
| 6 to 18 Years | 387 (51.8%) | 204 (27.3%) |
| 19 to 25 Years | 59 (7.2%) | 288 (35.1%) |
| 25 to 34 Years | 83 (17.8%) | 164 (35.3%) |
| 35 to 44 Years | 103 (30.3%) | 165 (48.5%) |
| 45 to 54 Years | 23 (5.1%) | 293 (65.3%) |
| 55 to 64 Years | 94 (27.4%) | 148 (43.1%) |
| 65 to 74 Years | 238 (94.4%) | 147 (58.3%) |
| 75 Years and over | 124 (100.0%) | 66 (53.2%) |
| Total | 1,717 (39.8%) | 1,584 (36.7%) |
Disability Status by Sex by Age in Hebbronville
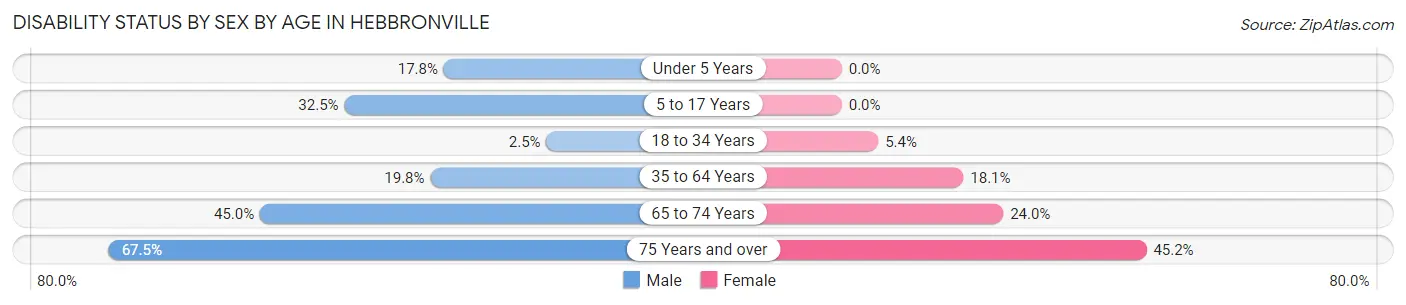
| Age Bracket | Male | Female |
| Under 5 Years | 74 (17.7%) | 0 (0.0%) |
| 5 to 17 Years | 119 (32.5%) | 0 (0.0%) |
| 18 to 34 Years | 19 (2.5%) | 36 (5.4%) |
| 35 to 64 Years | 112 (19.8%) | 102 (18.0%) |
| 65 to 74 Years | 59 (45.0%) | 29 (24.0%) |
| 75 Years and over | 27 (67.5%) | 38 (45.2%) |
Disability Class by Sex by Age in Hebbronville
Disability Class: Hearing Difficulty
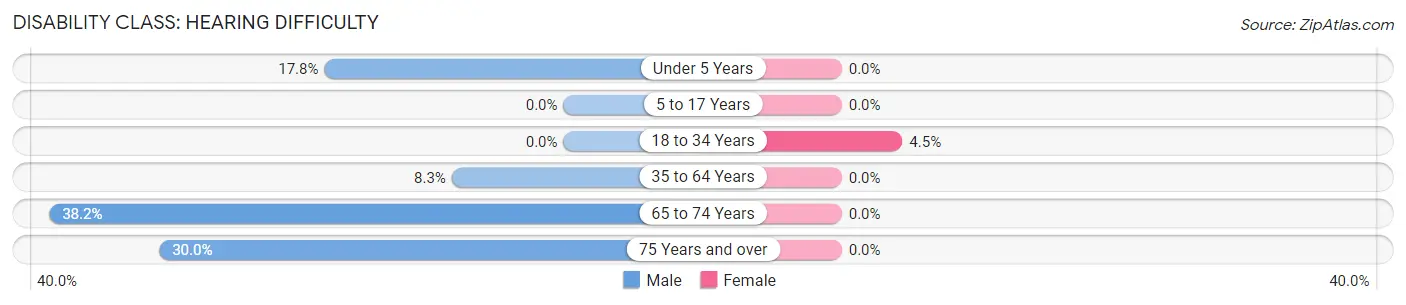
| Age Bracket | Male | Female |
| Under 5 Years | 74 (17.7%) | 0 (0.0%) |
| 5 to 17 Years | 0 (0.0%) | 0 (0.0%) |
| 18 to 34 Years | 0 (0.0%) | 30 (4.5%) |
| 35 to 64 Years | 47 (8.3%) | 0 (0.0%) |
| 65 to 74 Years | 50 (38.2%) | 0 (0.0%) |
| 75 Years and over | 12 (30.0%) | 0 (0.0%) |
Disability Class: Vision Difficulty
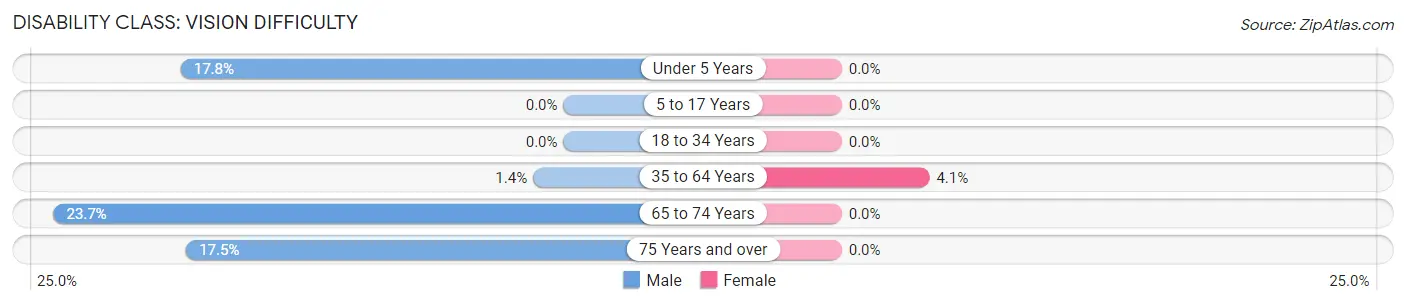
| Age Bracket | Male | Female |
| Under 5 Years | 74 (17.7%) | 0 (0.0%) |
| 5 to 17 Years | 0 (0.0%) | 0 (0.0%) |
| 18 to 34 Years | 0 (0.0%) | 0 (0.0%) |
| 35 to 64 Years | 8 (1.4%) | 23 (4.1%) |
| 65 to 74 Years | 31 (23.7%) | 0 (0.0%) |
| 75 Years and over | 7 (17.5%) | 0 (0.0%) |
Disability Class: Cognitive Difficulty
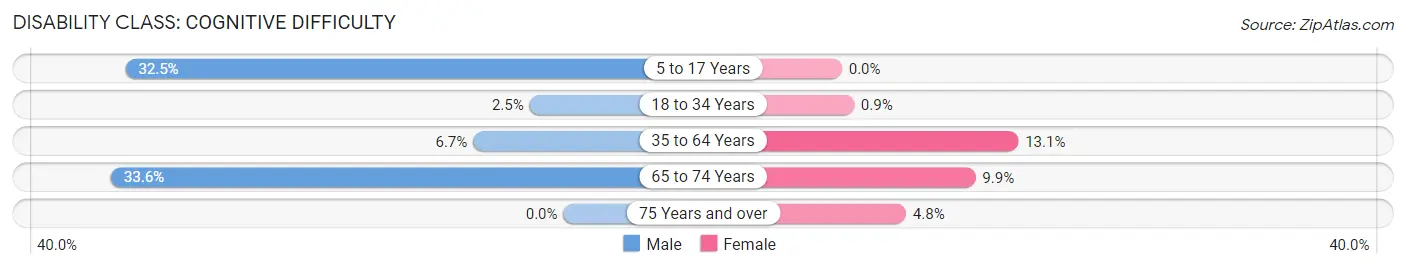
| Age Bracket | Male | Female |
| 5 to 17 Years | 119 (32.5%) | 0 (0.0%) |
| 18 to 34 Years | 19 (2.5%) | 6 (0.9%) |
| 35 to 64 Years | 38 (6.7%) | 74 (13.1%) |
| 65 to 74 Years | 44 (33.6%) | 12 (9.9%) |
| 75 Years and over | 0 (0.0%) | 4 (4.8%) |
Disability Class: Ambulatory Difficulty
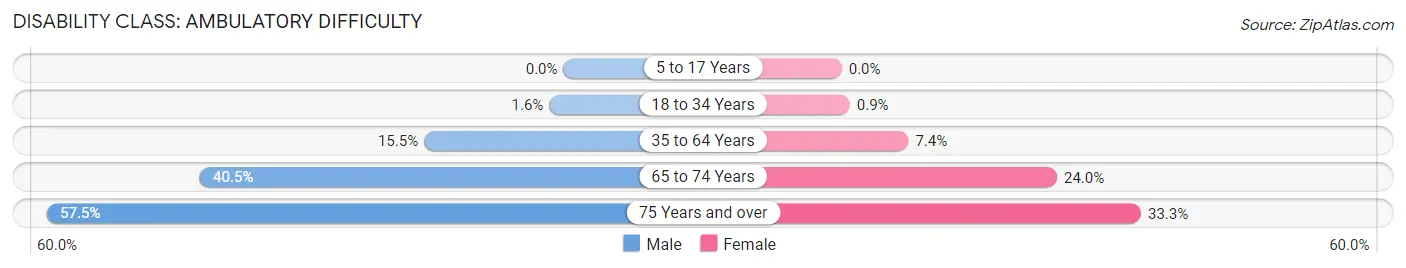
| Age Bracket | Male | Female |
| 5 to 17 Years | 0 (0.0%) | 0 (0.0%) |
| 18 to 34 Years | 12 (1.6%) | 6 (0.9%) |
| 35 to 64 Years | 88 (15.5%) | 42 (7.4%) |
| 65 to 74 Years | 53 (40.5%) | 29 (24.0%) |
| 75 Years and over | 23 (57.5%) | 28 (33.3%) |
Disability Class: Self-Care Difficulty
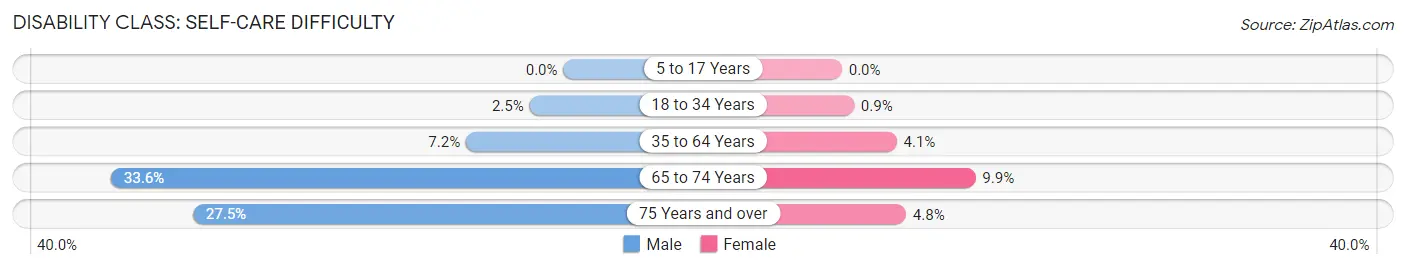
| Age Bracket | Male | Female |
| 5 to 17 Years | 0 (0.0%) | 0 (0.0%) |
| 18 to 34 Years | 19 (2.5%) | 6 (0.9%) |
| 35 to 64 Years | 41 (7.2%) | 23 (4.1%) |
| 65 to 74 Years | 44 (33.6%) | 12 (9.9%) |
| 75 Years and over | 11 (27.5%) | 4 (4.8%) |
Technology Access in Hebbronville
Computing Device Access in Hebbronville
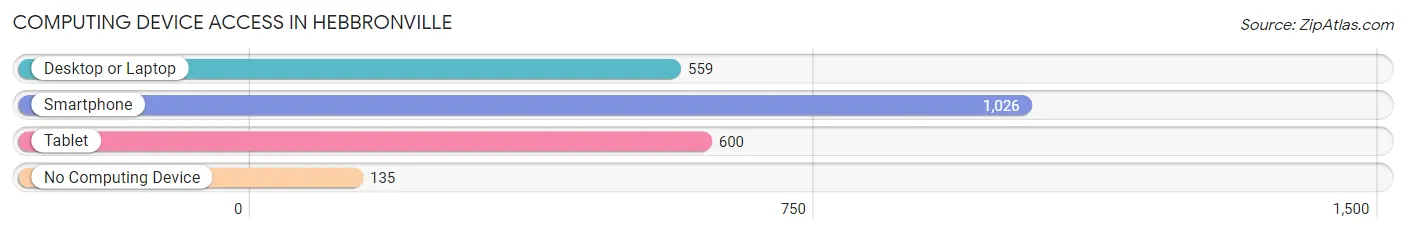
| Device Type | # Households | % Households |
| Desktop or Laptop | 559 | 47.2% |
| Smartphone | 1,026 | 86.7% |
| Tablet | 600 | 50.7% |
| No Computing Device | 135 | 11.4% |
| Total | 1,183 | 100.0% |
Internet Access in Hebbronville
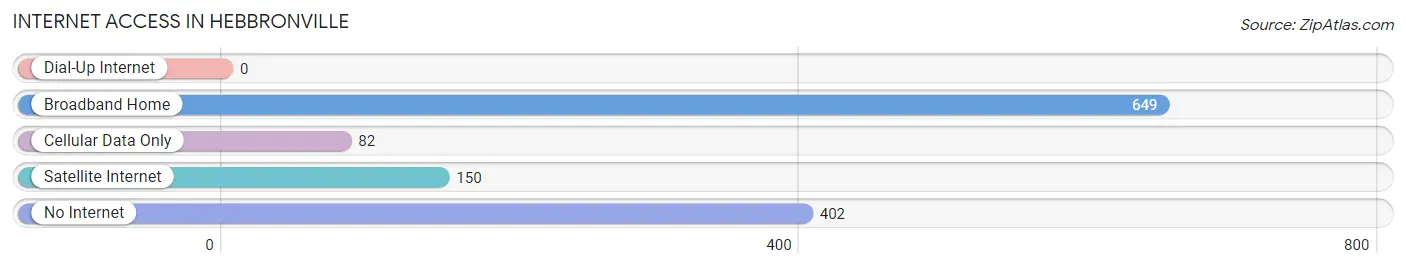
| Internet Type | # Households | % Households |
| Dial-Up Internet | 0 | 0.0% |
| Broadband Home | 649 | 54.9% |
| Cellular Data Only | 82 | 6.9% |
| Satellite Internet | 150 | 12.7% |
| No Internet | 402 | 34.0% |
| Total | 1,183 | 100.0% |
Hebbronville Summary
Hebbronville, Texas is a small town located in Jim Hogg County in the state of Texas. It is situated in the Rio Grande Valley, approximately 80 miles southwest of Corpus Christi. The town was founded in 1883 and named after John G. Hebbron, a prominent rancher in the area. Hebbronville is known for its rich history, diverse geography, and vibrant economy.
History
Hebbronville was founded in 1883 by John G. Hebbron, a prominent rancher in the area. Hebbron had purchased the land from the King Ranch and established a ranching operation. Hebbronville quickly grew into a thriving community, with a post office, a school, and a general store. The town was incorporated in 1909 and by 1910, the population had grown to 1,000.
Hebbronville was a major center for the cattle industry in the early 20th century. The town was home to several large ranches, including the King Ranch, the Hebbron Ranch, and the Santa Gertrudis Ranch. The town was also home to several large packing plants, which processed and shipped beef to markets across the country.
Hebbronville was also a major center for the oil industry in the early 20th century. The town was home to several large oil companies, including the Texas Oil Company and the Hebbron Oil Company. The town was also home to several large refineries, which processed and shipped oil to markets across the country.
Geography
Hebbronville is located in Jim Hogg County in the state of Texas. It is situated in the Rio Grande Valley, approximately 80 miles southwest of Corpus Christi. The town is located on the banks of the Rio Grande River, which forms the border between the United States and Mexico.
The town is surrounded by a variety of terrain, including flat plains, rolling hills, and rugged mountains. The climate is semi-arid, with hot summers and mild winters. The average annual temperature is 73 degrees Fahrenheit.
Economy
Hebbronville’s economy is largely based on agriculture and oil production. The town is home to several large ranches, which produce beef, cotton, and other crops. The town is also home to several large oil companies, which produce and ship oil to markets across the country.
The town is also home to several manufacturing companies, which produce a variety of products, including furniture, clothing, and electronics. The town is also home to several retail stores, which sell a variety of goods, including clothing, groceries, and home goods.
Demographics
As of the 2010 census, the population of Hebbronville was 4,558. The population is largely Hispanic, with approximately 90% of the population identifying as Hispanic or Latino. The median household income is $30,000, and the median home value is $80,000. The town is served by the Hebbronville Independent School District.
Common Questions
What is Per Capita Income in Hebbronville?
Per Capita income in Hebbronville is $17,591.
What is the Median Family Income in Hebbronville?
Median Family Income in Hebbronville is $44,913.
What is the Median Household income in Hebbronville?
Median Household Income in Hebbronville is $40,994.
What is Income or Wage Gap in Hebbronville?
Income or Wage Gap in Hebbronville is 57.0%.
Women in Hebbronville earn 43.0 cents for every dollar earned by a man.
What is Family Income Deficit in Hebbronville?
Family Income Deficit in Hebbronville is $12,202.
Families that are below poverty line in Hebbronville earn $12,202 less on average than the poverty threshold level.
What is Inequality or Gini Index in Hebbronville?
Inequality or Gini Index in Hebbronville is 0.43.
What is the Total Population of Hebbronville?
Total Population of Hebbronville is 4,355.
What is the Total Male Population of Hebbronville?
Total Male Population of Hebbronville is 2,308.
What is the Total Female Population of Hebbronville?
Total Female Population of Hebbronville is 2,047.
What is the Ratio of Males per 100 Females in Hebbronville?
There are 112.75 Males per 100 Females in Hebbronville.
What is the Ratio of Females per 100 Males in Hebbronville?
There are 88.69 Females per 100 Males in Hebbronville.
What is the Median Population Age in Hebbronville?
Median Population Age in Hebbronville is 24.5 Years.
What is the Average Family Size in Hebbronville
Average Family Size in Hebbronville is 4.4 People.
What is the Average Household Size in Hebbronville
Average Household Size in Hebbronville is 3.6 People.
How Large is the Labor Force in Hebbronville?
There are 1,901 People in the Labor Forcein in Hebbronville.
What is the Percentage of People in the Labor Force in Hebbronville?
62.3% of People are in the Labor Force in Hebbronville.
What is the Unemployment Rate in Hebbronville?
Unemployment Rate in Hebbronville is 5.1%.