Alto Bonito Heights, TX Map & Demographics
Alto Bonito Heights Map
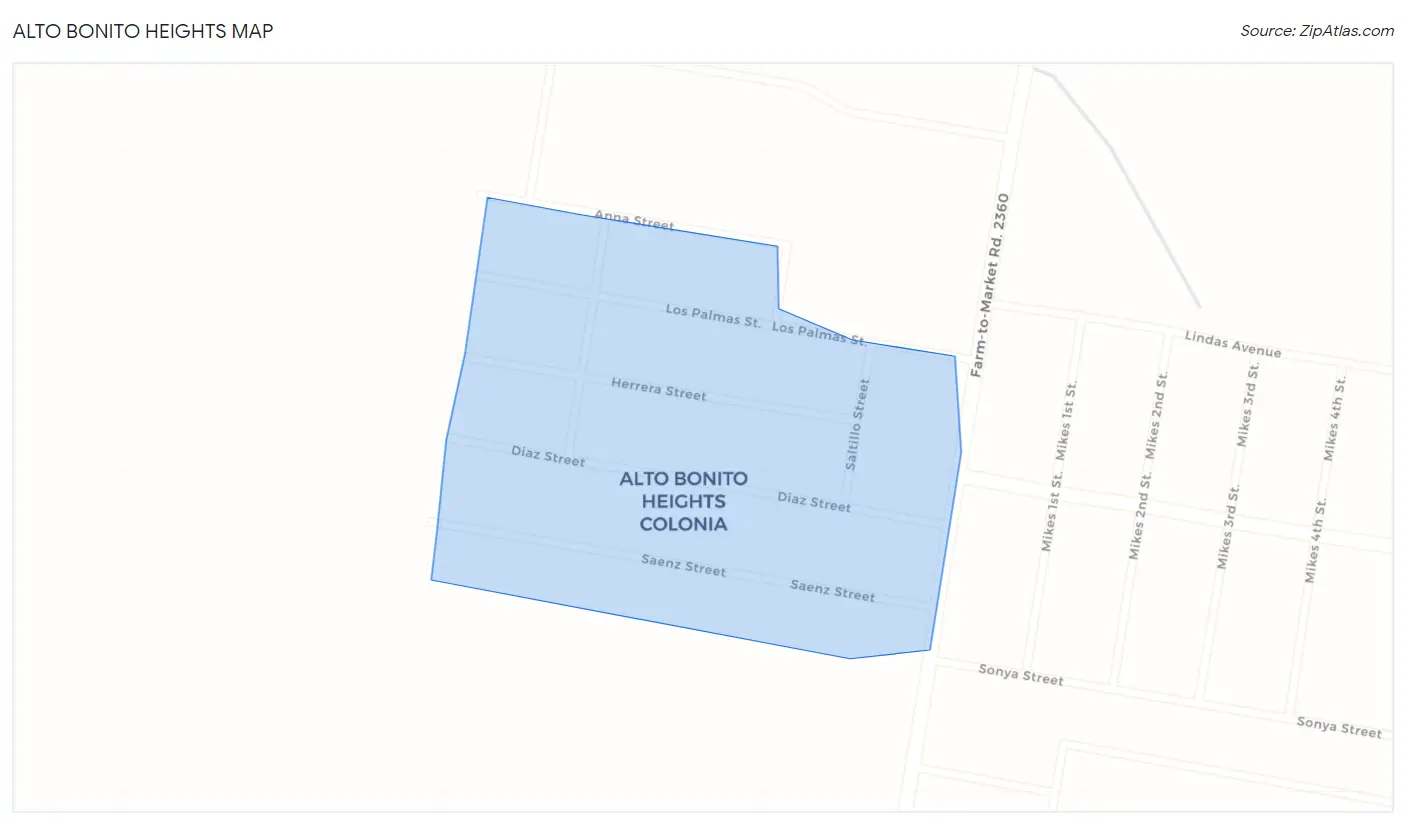
Alto Bonito Heights Overview
$9,116
PER CAPITA INCOME
0.42
INEQUALITY / GINI INDEX
726
TOTAL POPULATION
337
MALE POPULATION
389
FEMALE POPULATION
86.63
MALES / 100 FEMALES
115.43
FEMALES / 100 MALES
28.2
MEDIAN AGE
5.9
AVG FAMILY SIZE
4.9
AVG HOUSEHOLD SIZE
215
LABOR FORCE [ PEOPLE ]
44.1%
PERCENT IN LABOR FORCE
Income in Alto Bonito Heights
Income Overview in Alto Bonito Heights
| Characteristic | Number | Measure |
| Per Capita Income | 726 | $9,116 |
| Median Family Income | 99 | $0 |
| Mean Family Income | 99 | $45,225 |
| Median Household Income | 148 | $0 |
| Mean Household Income | 148 | $33,322 |
| Income Deficit | 99 | $0 |
| Wage / Income Gap (%) | 726 | 0.00% |
| Wage / Income Gap ($) | 726 | 100.00¢ per $1 |
| Gini / Inequality Index | 726 | 0.42 |
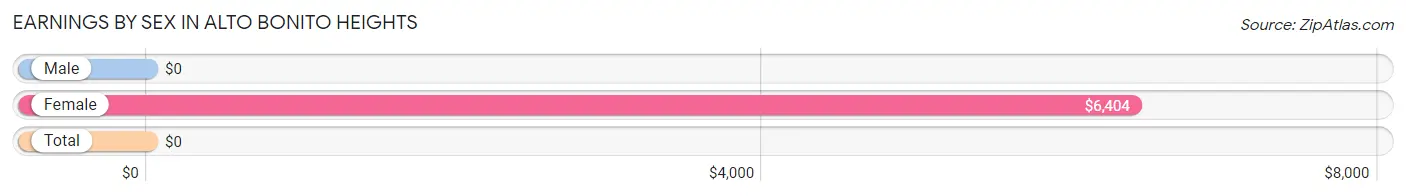
Earnings by Sex in Alto Bonito Heights
| Sex | Number | Average Earnings |
| Male | 115 (53.5%) | $0 |
| Female | 100 (46.5%) | $6,404 |
| Total | 215 (100.0%) | $0 |
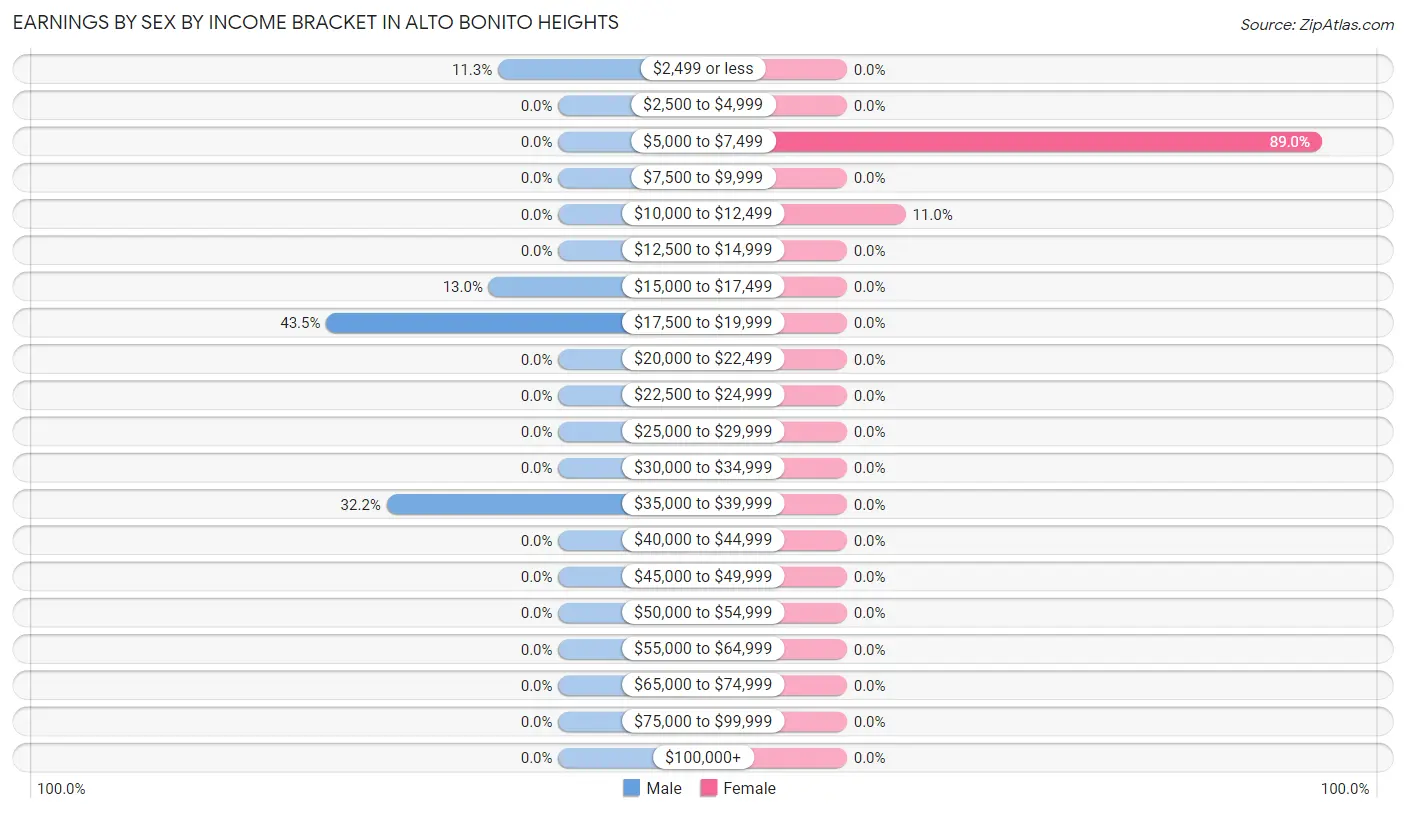
Earnings by Sex by Income Bracket in Alto Bonito Heights
The most common earnings brackets in Alto Bonito Heights are $17,500 to $19,999 for men (50 | 43.5%) and $5,000 to $7,499 for women (89 | 89.0%).
| Income | Male | Female |
| $2,499 or less | 13 (11.3%) | 0 (0.0%) |
| $2,500 to $4,999 | 0 (0.0%) | 0 (0.0%) |
| $5,000 to $7,499 | 0 (0.0%) | 89 (89.0%) |
| $7,500 to $9,999 | 0 (0.0%) | 0 (0.0%) |
| $10,000 to $12,499 | 0 (0.0%) | 11 (11.0%) |
| $12,500 to $14,999 | 0 (0.0%) | 0 (0.0%) |
| $15,000 to $17,499 | 15 (13.0%) | 0 (0.0%) |
| $17,500 to $19,999 | 50 (43.5%) | 0 (0.0%) |
| $20,000 to $22,499 | 0 (0.0%) | 0 (0.0%) |
| $22,500 to $24,999 | 0 (0.0%) | 0 (0.0%) |
| $25,000 to $29,999 | 0 (0.0%) | 0 (0.0%) |
| $30,000 to $34,999 | 0 (0.0%) | 0 (0.0%) |
| $35,000 to $39,999 | 37 (32.2%) | 0 (0.0%) |
| $40,000 to $44,999 | 0 (0.0%) | 0 (0.0%) |
| $45,000 to $49,999 | 0 (0.0%) | 0 (0.0%) |
| $50,000 to $54,999 | 0 (0.0%) | 0 (0.0%) |
| $55,000 to $64,999 | 0 (0.0%) | 0 (0.0%) |
| $65,000 to $74,999 | 0 (0.0%) | 0 (0.0%) |
| $75,000 to $99,999 | 0 (0.0%) | 0 (0.0%) |
| $100,000+ | 0 (0.0%) | 0 (0.0%) |
| Total | 115 (100.0%) | 100 (100.0%) |
Earnings by Sex by Educational Attainment in Alto Bonito Heights
| Educational Attainment | Male Income | Female Income |
| Less than High School | - | - |
| High School Diploma | - | - |
| College or Associate's Degree | - | - |
| Bachelor's Degree | - | - |
| Graduate Degree | - | - |
| Total | - | - |
Family Income in Alto Bonito Heights
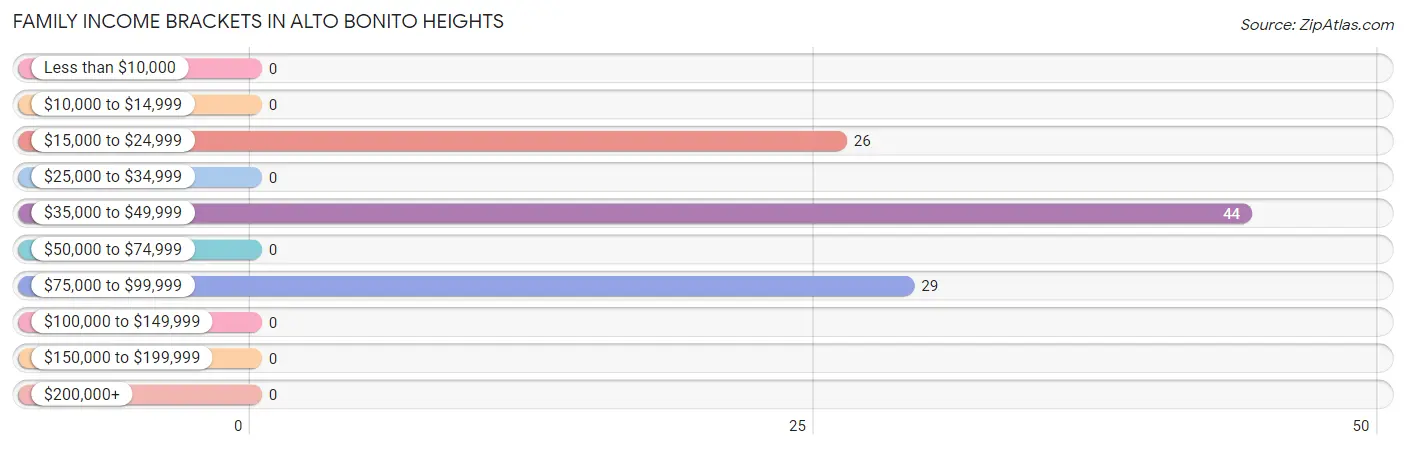
Family Income Brackets in Alto Bonito Heights
According to the Alto Bonito Heights family income data, there are 44 families falling into the $35,000 to $49,999 income range, which is the most common income bracket and makes up 44.4% of all families.
| Income Bracket | # Families | % Families |
| Less than $10,000 | 0 | 0.0% |
| $10,000 to $14,999 | 0 | 0.0% |
| $15,000 to $24,999 | 26 | 26.3% |
| $25,000 to $34,999 | 0 | 0.0% |
| $35,000 to $49,999 | 44 | 44.4% |
| $50,000 to $74,999 | 0 | 0.0% |
| $75,000 to $99,999 | 29 | 29.3% |
| $100,000 to $149,999 | 0 | 0.0% |
| $150,000 to $199,999 | 0 | 0.0% |
| $200,000+ | 0 | 0.0% |
Family Income by Famaliy Size in Alto Bonito Heights
| Income Bracket | # Families | Median Income |
| 2-Person Families | 26 (26.3%) | $0 |
| 3-Person Families | 29 (29.3%) | $0 |
| 4-Person Families | 0 (0.0%) | $0 |
| 5-Person Families | 15 (15.1%) | $0 |
| 6-Person Families | 0 (0.0%) | $0 |
| 7+ Person Families | 29 (29.3%) | $0 |
| Total | 99 (100.0%) | $0 |
Family Income by Number of Earners in Alto Bonito Heights
| Number of Earners | # Families | Median Income |
| No Earners | 26 (26.3%) | $0 |
| 1 Earner | 29 (29.3%) | $0 |
| 2 Earners | 29 (29.3%) | $0 |
| 3+ Earners | 15 (15.1%) | $0 |
| Total | 99 (100.0%) | $0 |
Household Income in Alto Bonito Heights
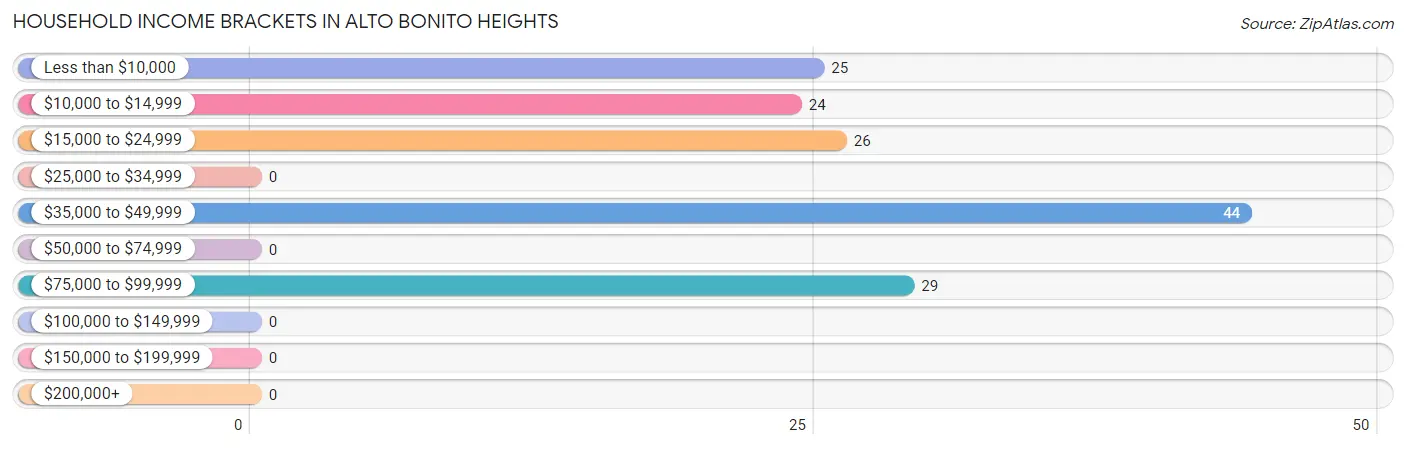
Household Income Brackets in Alto Bonito Heights
With 44 households falling in the category, the $35,000 to $49,999 income range is the most frequent in Alto Bonito Heights, accounting for 29.7% of all households.
| Income Bracket | # Households | % Households |
| Less than $10,000 | 25 | 16.9% |
| $10,000 to $14,999 | 24 | 16.2% |
| $15,000 to $24,999 | 26 | 17.6% |
| $25,000 to $34,999 | 0 | 0.0% |
| $35,000 to $49,999 | 44 | 29.7% |
| $50,000 to $74,999 | 0 | 0.0% |
| $75,000 to $99,999 | 29 | 19.6% |
| $100,000 to $149,999 | 0 | 0.0% |
| $150,000 to $199,999 | 0 | 0.0% |
| $200,000+ | 0 | 0.0% |
Household Income by Householder Age in Alto Bonito Heights
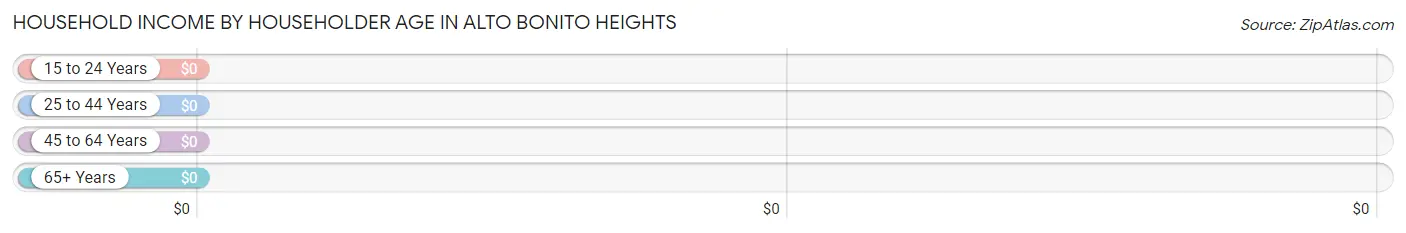
| Income Bracket | # Households | Median Income |
| 15 to 24 Years | 0 (0.0%) | $0 |
| 25 to 44 Years | 15 (10.1%) | $0 |
| 45 to 64 Years | 78 (52.7%) | $0 |
| 65+ Years | 55 (37.2%) | $0 |
| Total | 148 (100.0%) | $0 |
Poverty in Alto Bonito Heights
Income Below Poverty by Sex and Age in Alto Bonito Heights
With 55.5% poverty level for males and 86.4% for females among the residents of Alto Bonito Heights, 25 to 34 year old males and under 5 year old females are the most vulnerable to poverty, with 50 males (100.0%) and 110 females (100.0%) in their respective age groups living below the poverty level.
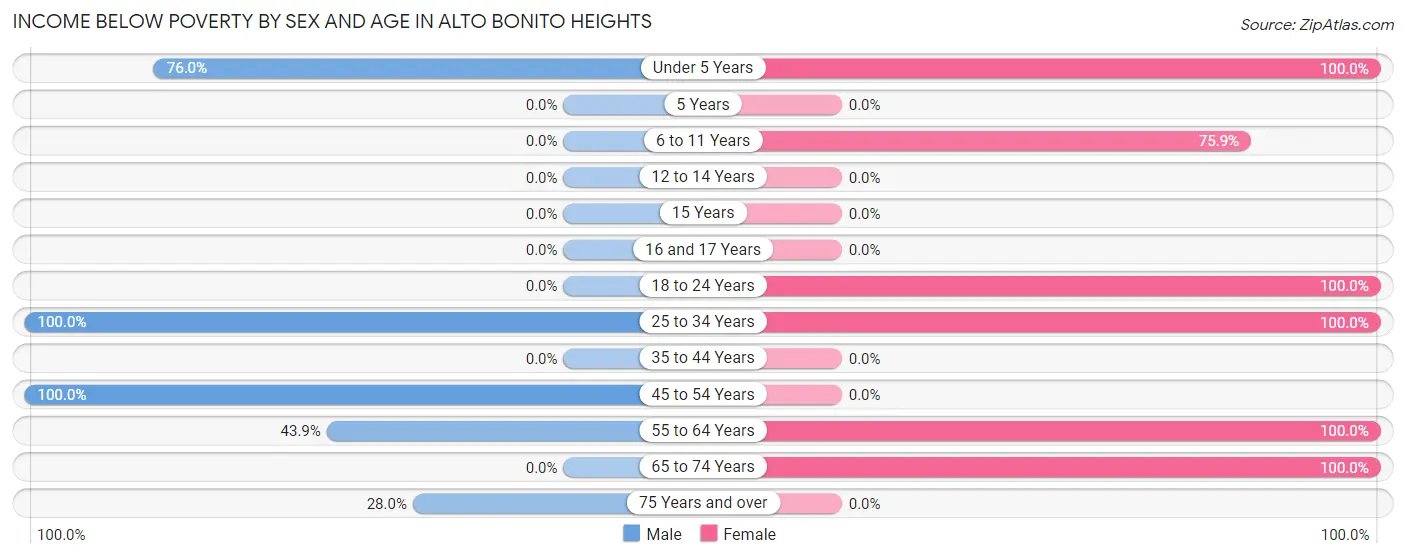
| Age Bracket | Male | Female |
| Under 5 Years | 57 (76.0%) | 110 (100.0%) |
| 5 Years | 0 (0.0%) | 0 (0.0%) |
| 6 to 11 Years | 0 (0.0%) | 41 (75.9%) |
| 12 to 14 Years | 0 (0.0%) | 0 (0.0%) |
| 15 Years | 0 (0.0%) | 0 (0.0%) |
| 16 and 17 Years | 0 (0.0%) | 0 (0.0%) |
| 18 to 24 Years | 0 (0.0%) | 100 (100.0%) |
| 25 to 34 Years | 50 (100.0%) | 39 (100.0%) |
| 35 to 44 Years | 0 (0.0%) | 0 (0.0%) |
| 45 to 54 Years | 25 (100.0%) | 0 (0.0%) |
| 55 to 64 Years | 29 (43.9%) | 24 (100.0%) |
| 65 to 74 Years | 0 (0.0%) | 22 (100.0%) |
| 75 Years and over | 26 (28.0%) | 0 (0.0%) |
| Total | 187 (55.5%) | 336 (86.4%) |
Income Above Poverty by Sex and Age in Alto Bonito Heights
According to the poverty statistics in Alto Bonito Heights, males aged 18 to 24 years and females aged 35 to 44 years are the age groups that are most secure financially, with 100.0% of males and 100.0% of females in these age groups living above the poverty line.
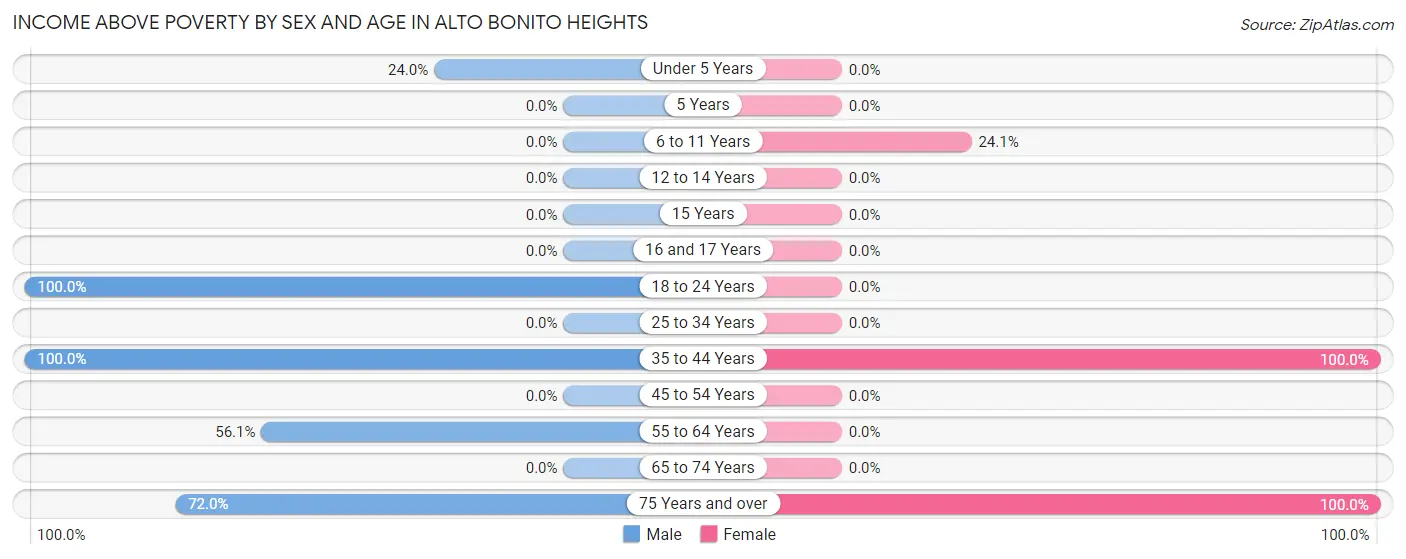
| Age Bracket | Male | Female |
| Under 5 Years | 18 (24.0%) | 0 (0.0%) |
| 5 Years | 0 (0.0%) | 0 (0.0%) |
| 6 to 11 Years | 0 (0.0%) | 13 (24.1%) |
| 12 to 14 Years | 0 (0.0%) | 0 (0.0%) |
| 15 Years | 0 (0.0%) | 0 (0.0%) |
| 16 and 17 Years | 0 (0.0%) | 0 (0.0%) |
| 18 to 24 Years | 13 (100.0%) | 0 (0.0%) |
| 25 to 34 Years | 0 (0.0%) | 0 (0.0%) |
| 35 to 44 Years | 15 (100.0%) | 11 (100.0%) |
| 45 to 54 Years | 0 (0.0%) | 0 (0.0%) |
| 55 to 64 Years | 37 (56.1%) | 0 (0.0%) |
| 65 to 74 Years | 0 (0.0%) | 0 (0.0%) |
| 75 Years and over | 67 (72.0%) | 29 (100.0%) |
| Total | 150 (44.5%) | 53 (13.6%) |
Income Below Poverty Among Married-Couple Families in Alto Bonito Heights
The poverty statistics for married-couple families in Alto Bonito Heights show that 37.1% or 26 of the total 70 families live below the poverty line. Families with no children have the highest poverty rate of 47.3%, comprising of 26 families. On the other hand, families with 1 or 2 children have the lowest poverty rate of 0.0%, which includes 0 families.
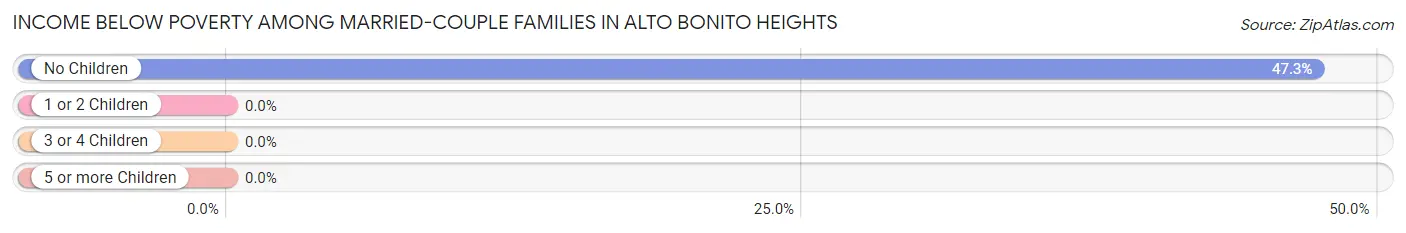
| Children | Above Poverty | Below Poverty |
| No Children | 29 (52.7%) | 26 (47.3%) |
| 1 or 2 Children | 15 (100.0%) | 0 (0.0%) |
| 3 or 4 Children | 0 (0.0%) | 0 (0.0%) |
| 5 or more Children | 0 (0.0%) | 0 (0.0%) |
| Total | 44 (62.9%) | 26 (37.1%) |
Income Below Poverty Among Single-Parent Households in Alto Bonito Heights
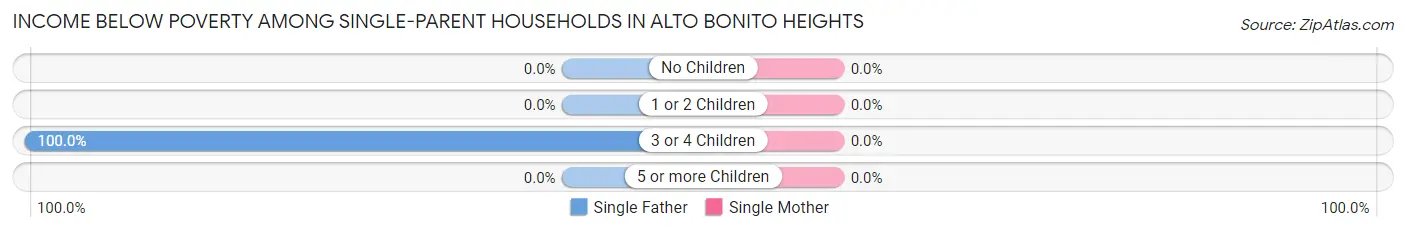
| Children | Single Father | Single Mother |
| No Children | 0 (0.0%) | 0 (0.0%) |
| 1 or 2 Children | 0 (0.0%) | 0 (0.0%) |
| 3 or 4 Children | 29 (100.0%) | 0 (0.0%) |
| 5 or more Children | 0 (0.0%) | 0 (0.0%) |
| Total | 29 (100.0%) | 0 (0.0%) |
Income Below Poverty Among Married-Couple vs Single-Parent Households in Alto Bonito Heights
The poverty data for Alto Bonito Heights shows that 26 of the married-couple family households (37.1%) and 29 of the single-parent households (100.0%) are living below the poverty level. Within the married-couple family households, those with no children have the highest poverty rate, with 26 households (47.3%) falling below the poverty line. Among the single-parent households, those with 3 or 4 children have the highest poverty rate, with 29 household (100.0%) living below poverty.
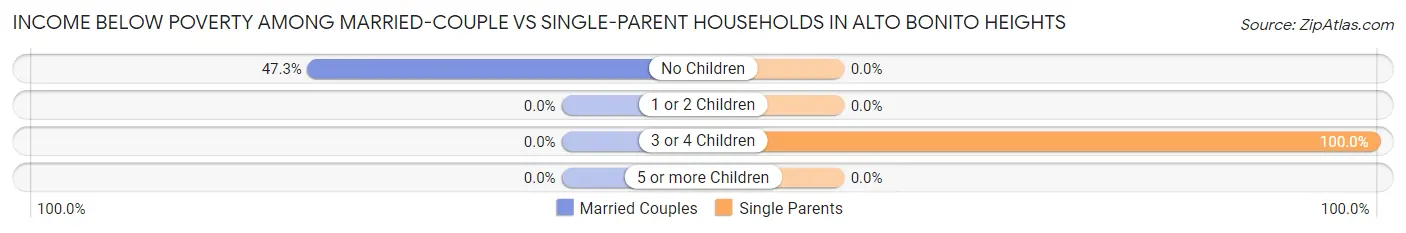
| Children | Married-Couple Families | Single-Parent Households |
| No Children | 26 (47.3%) | 0 (0.0%) |
| 1 or 2 Children | 0 (0.0%) | 0 (0.0%) |
| 3 or 4 Children | 0 (0.0%) | 29 (100.0%) |
| 5 or more Children | 0 (0.0%) | 0 (0.0%) |
| Total | 26 (37.1%) | 29 (100.0%) |
Race in Alto Bonito Heights
The most populous races in Alto Bonito Heights are Hispanic or Latino (726 | 100.0%), Two or more Races (656 | 90.4%), and White / Caucasian (70 | 9.6%).
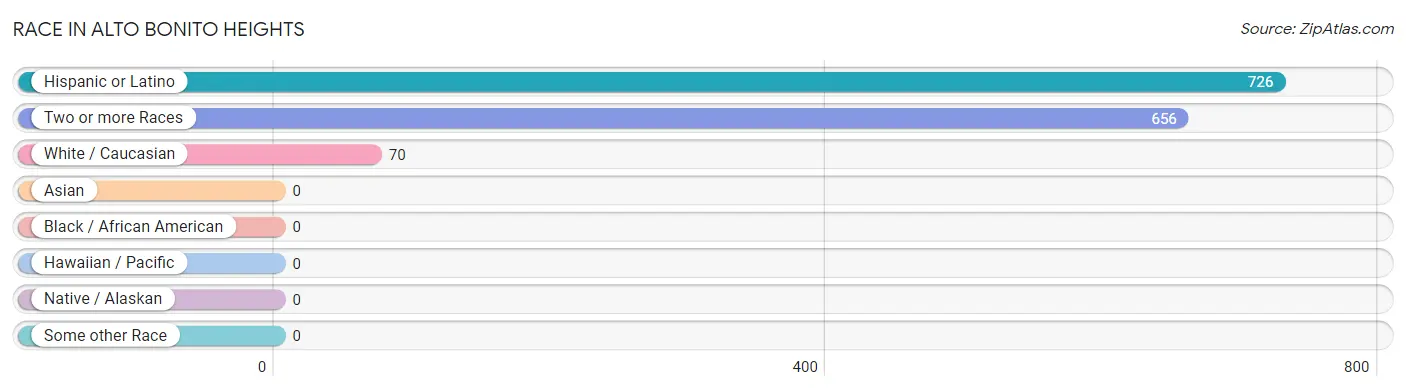
| Race | # Population | % Population |
| Asian | 0 | 0.0% |
| Black / African American | 0 | 0.0% |
| Hawaiian / Pacific | 0 | 0.0% |
| Hispanic or Latino | 726 | 100.0% |
| Native / Alaskan | 0 | 0.0% |
| White / Caucasian | 70 | 9.6% |
| Two or more Races | 656 | 90.4% |
| Some other Race | 0 | 0.0% |
| Total | 726 | 100.0% |
Ancestry in Alto Bonito Heights
The most populous ancestries reported in Alto Bonito Heights are , and Mexican (726 | 100.0%), together accounting for 100.0% of all Alto Bonito Heights residents.

| Ancestry | # Population | % Population |
| Mexican | 726 | 100.0% | View All 1 Rows |
Immigrants in Alto Bonito Heights
The most numerous immigrant groups reported in Alto Bonito Heights came from Central America (321 | 44.2%), Latin America (321 | 44.2%), and Mexico (321 | 44.2%), together accounting for 132.6% of all Alto Bonito Heights residents.
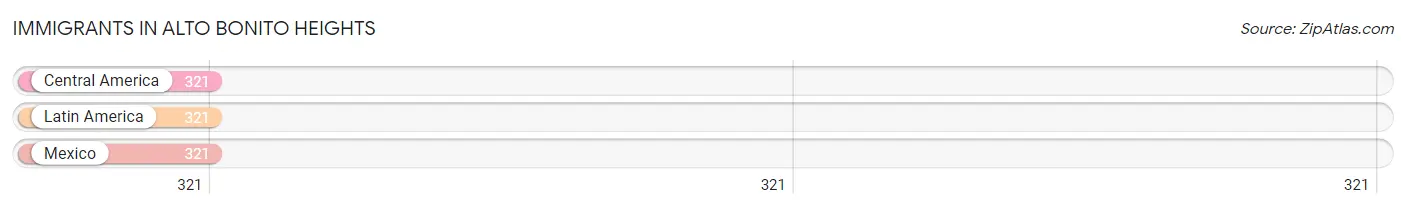
| Immigration Origin | # Population | % Population |
| Central America | 321 | 44.2% |
| Latin America | 321 | 44.2% |
| Mexico | 321 | 44.2% | View All 3 Rows |
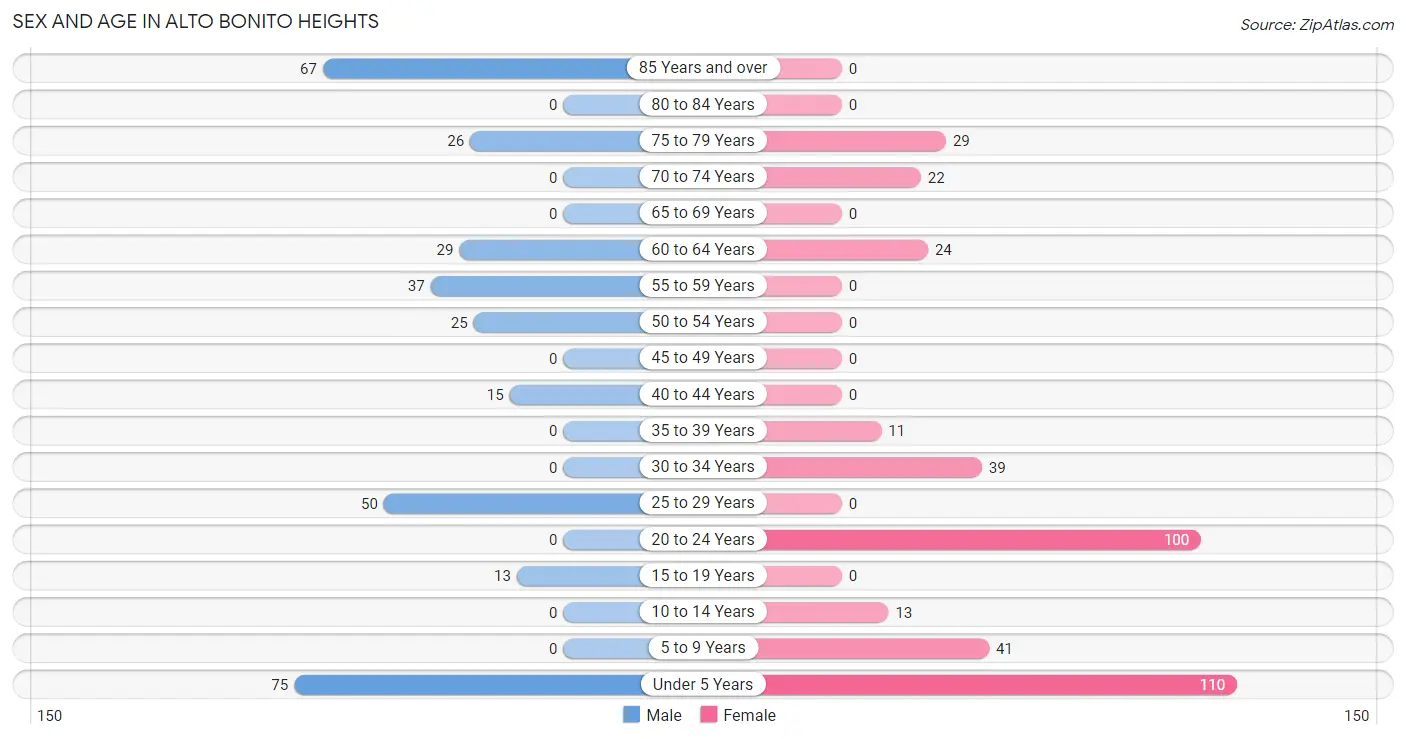
Sex and Age in Alto Bonito Heights
Sex and Age in Alto Bonito Heights
The most populous age groups in Alto Bonito Heights are Under 5 Years (75 | 22.3%) for men and Under 5 Years (110 | 28.3%) for women.
| Age Bracket | Male | Female |
| Under 5 Years | 75 (22.3%) | 110 (28.3%) |
| 5 to 9 Years | 0 (0.0%) | 41 (10.5%) |
| 10 to 14 Years | 0 (0.0%) | 13 (3.3%) |
| 15 to 19 Years | 13 (3.9%) | 0 (0.0%) |
| 20 to 24 Years | 0 (0.0%) | 100 (25.7%) |
| 25 to 29 Years | 50 (14.8%) | 0 (0.0%) |
| 30 to 34 Years | 0 (0.0%) | 39 (10.0%) |
| 35 to 39 Years | 0 (0.0%) | 11 (2.8%) |
| 40 to 44 Years | 15 (4.4%) | 0 (0.0%) |
| 45 to 49 Years | 0 (0.0%) | 0 (0.0%) |
| 50 to 54 Years | 25 (7.4%) | 0 (0.0%) |
| 55 to 59 Years | 37 (11.0%) | 0 (0.0%) |
| 60 to 64 Years | 29 (8.6%) | 24 (6.2%) |
| 65 to 69 Years | 0 (0.0%) | 0 (0.0%) |
| 70 to 74 Years | 0 (0.0%) | 22 (5.7%) |
| 75 to 79 Years | 26 (7.7%) | 29 (7.5%) |
| 80 to 84 Years | 0 (0.0%) | 0 (0.0%) |
| 85 Years and over | 67 (19.9%) | 0 (0.0%) |
| Total | 337 (100.0%) | 389 (100.0%) |
Families and Households in Alto Bonito Heights
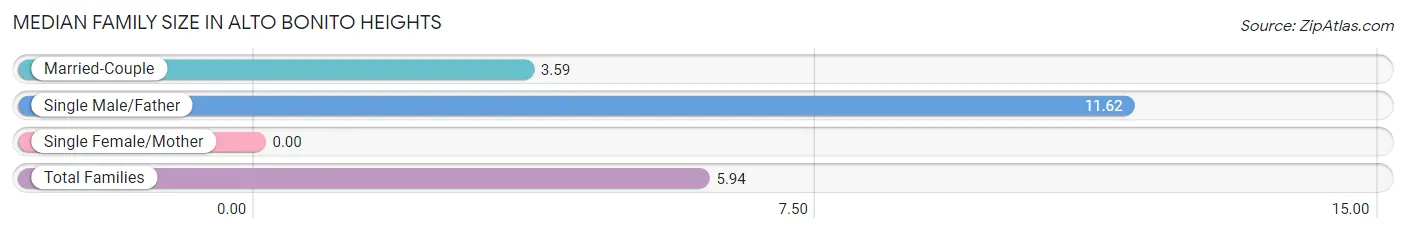
Median Family Size in Alto Bonito Heights
| Family Type | # Families | Family Size |
| Married-Couple | 70 (70.7%) | 3.59 |
| Single Male/Father | 29 (29.3%) | 11.62 |
| Single Female/Mother | 0 (0.0%) | - |
| Total Families | 99 (100.0%) | 5.94 |
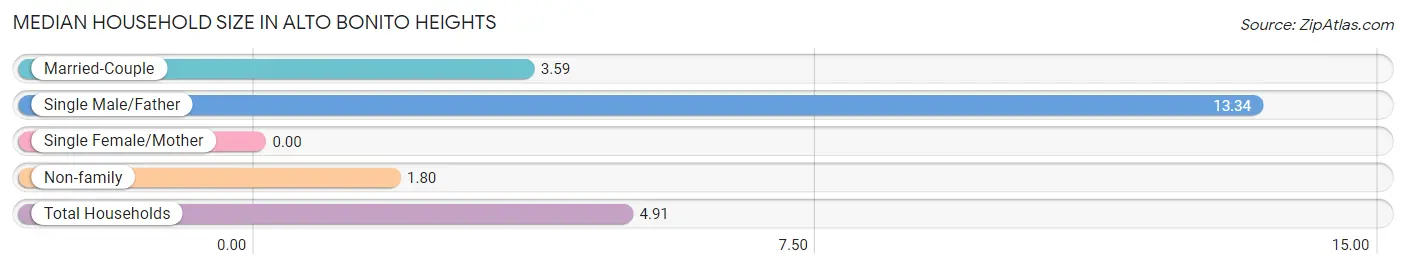
Median Household Size in Alto Bonito Heights
| Household Type | # Households | Household Size |
| Married-Couple | 70 (47.3%) | 3.59 |
| Single Male/Father | 29 (19.6%) | 13.34 |
| Single Female/Mother | 0 (0.0%) | - |
| Non-family | 49 (33.1%) | 1.80 |
| Total Households | 148 (100.0%) | 4.91 |
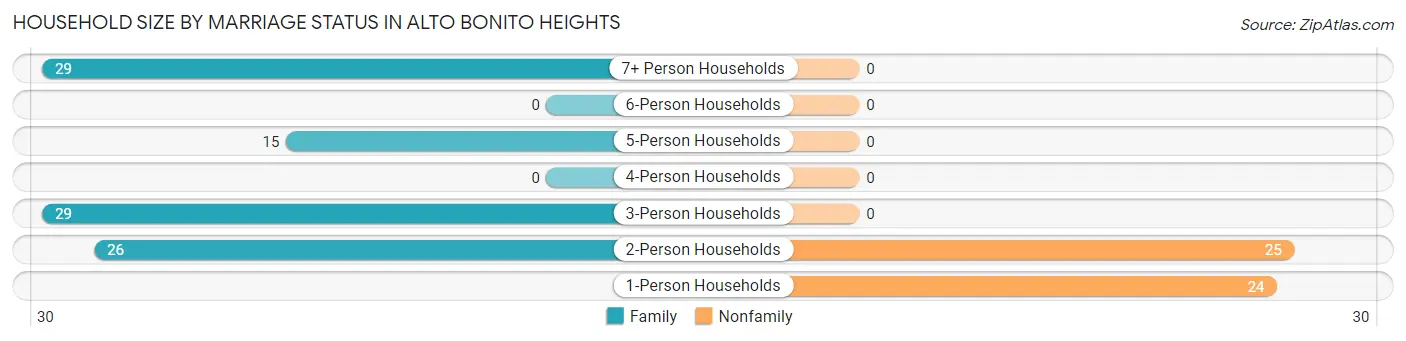
Household Size by Marriage Status in Alto Bonito Heights
Out of a total of 148 households in Alto Bonito Heights, 99 (66.9%) are family households, while 49 (33.1%) are nonfamily households. The most numerous type of family households are 3-person households, comprising 29, and the most common type of nonfamily households are 2-person households, comprising 25.
| Household Size | Family Households | Nonfamily Households |
| 1-Person Households | - | 24 (16.2%) |
| 2-Person Households | 26 (17.6%) | 25 (16.9%) |
| 3-Person Households | 29 (19.6%) | 0 (0.0%) |
| 4-Person Households | 0 (0.0%) | 0 (0.0%) |
| 5-Person Households | 15 (10.1%) | 0 (0.0%) |
| 6-Person Households | 0 (0.0%) | 0 (0.0%) |
| 7+ Person Households | 29 (19.6%) | 0 (0.0%) |
| Total | 99 (66.9%) | 49 (33.1%) |
Female Fertility in Alto Bonito Heights
Fertility by Age in Alto Bonito Heights
Average fertility rate in Alto Bonito Heights is 333.0 births per 1,000 women. Women in the age bracket of 20 to 34 years have the highest fertility rate with 360.0 births per 1,000 women. Women in the age bracket of 20 to 34 years acount for 100.0% of all women with births.
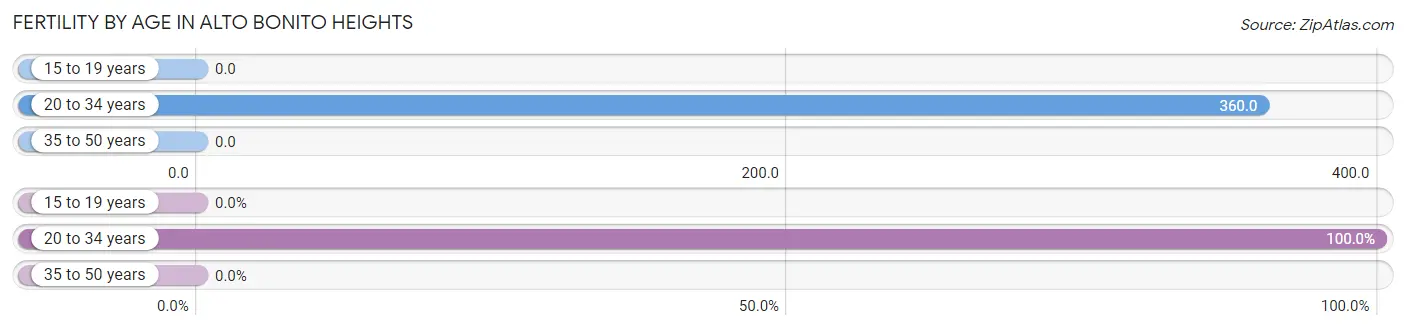
| Age Bracket | Women with Births | Births / 1,000 Women |
| 15 to 19 years | 0 (0.0%) | 0.0 |
| 20 to 34 years | 50 (100.0%) | 360.0 |
| 35 to 50 years | 0 (0.0%) | 0.0 |
| Total | 50 (100.0%) | 333.0 |
Fertility by Age by Marriage Status in Alto Bonito Heights
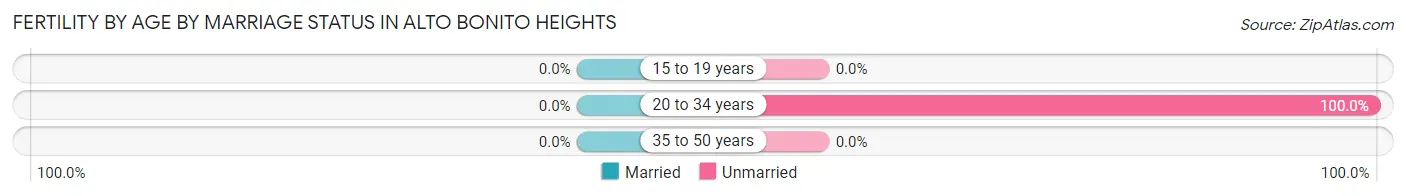
| Age Bracket | Married | Unmarried |
| 15 to 19 years | 0 (0.0%) | 0 (0.0%) |
| 20 to 34 years | 0 (0.0%) | 50 (100.0%) |
| 35 to 50 years | 0 (0.0%) | 0 (0.0%) |
| Total | 0 (0.0%) | 50 (100.0%) |
Fertility by Education in Alto Bonito Heights
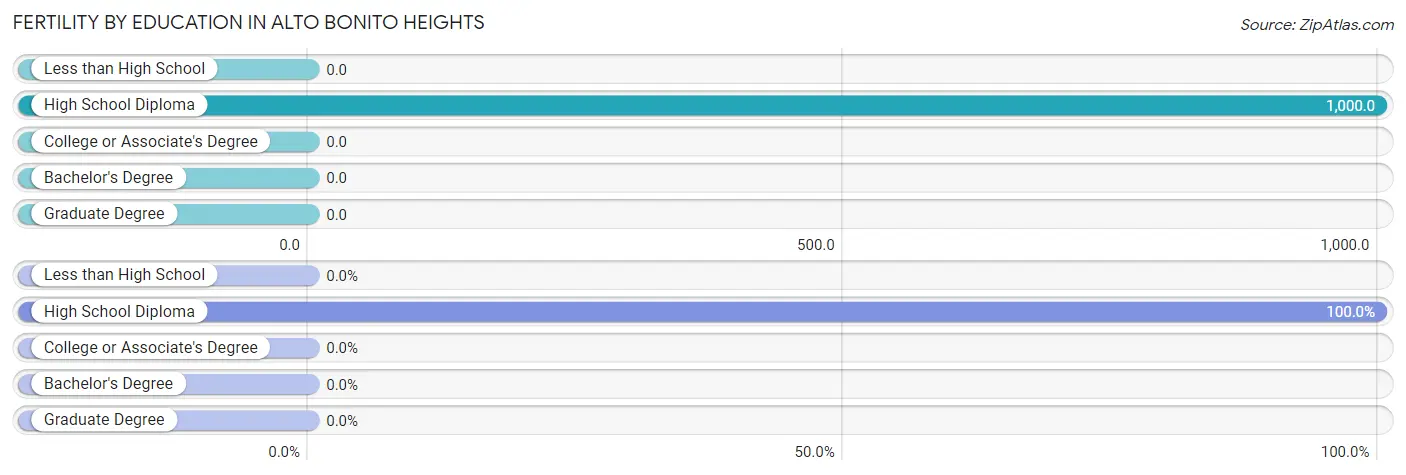
| Educational Attainment | Women with Births | Births / 1,000 Women |
| Less than High School | 0 (0.0%) | 0.0 |
| High School Diploma | 50 (100.0%) | 1,000.0 |
| College or Associate's Degree | 0 (0.0%) | 0.0 |
| Bachelor's Degree | 0 (0.0%) | 0.0 |
| Graduate Degree | 0 (0.0%) | 0.0 |
| Total | 50 (100.0%) | 333.0 |
Fertility by Education by Marriage Status in Alto Bonito Heights
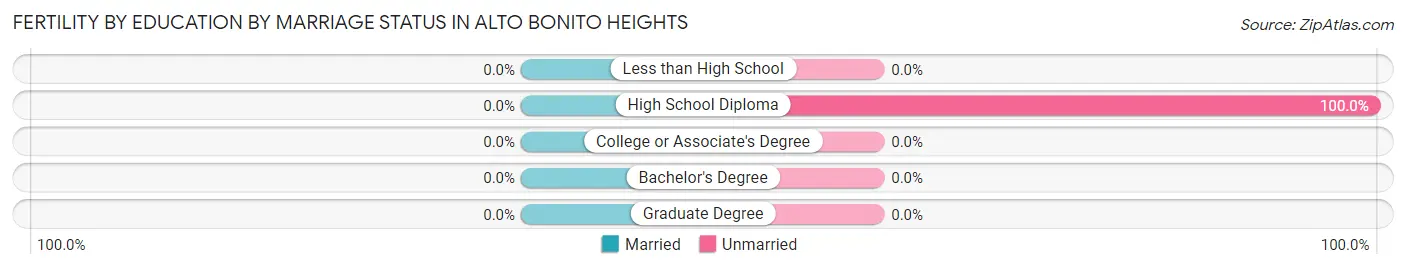
| Educational Attainment | Married | Unmarried |
| Less than High School | 0 (0.0%) | 0 (0.0%) |
| High School Diploma | 0 (0.0%) | 50 (100.0%) |
| College or Associate's Degree | 0 (0.0%) | 0 (0.0%) |
| Bachelor's Degree | 0 (0.0%) | 0 (0.0%) |
| Graduate Degree | 0 (0.0%) | 0 (0.0%) |
| Total | 0 (0.0%) | 50 (100.0%) |
Employment Characteristics in Alto Bonito Heights
Employment by Class of Employer in Alto Bonito Heights
Among the 215 employed individuals in Alto Bonito Heights, private company employees (200 | 93.0%), and self-employed (not incorporated) (15 | 7.0%) make up the most common classes of employment.
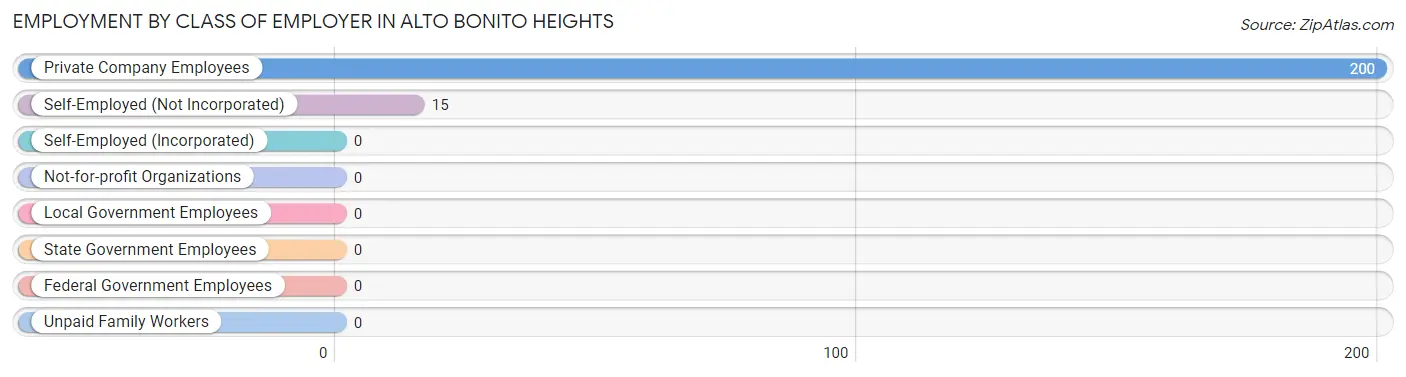
| Employer Class | # Employees | % Employees |
| Private Company Employees | 200 | 93.0% |
| Self-Employed (Incorporated) | 0 | 0.0% |
| Self-Employed (Not Incorporated) | 15 | 7.0% |
| Not-for-profit Organizations | 0 | 0.0% |
| Local Government Employees | 0 | 0.0% |
| State Government Employees | 0 | 0.0% |
| Federal Government Employees | 0 | 0.0% |
| Unpaid Family Workers | 0 | 0.0% |
| Total | 215 | 100.0% |
Employment Status by Age in Alto Bonito Heights
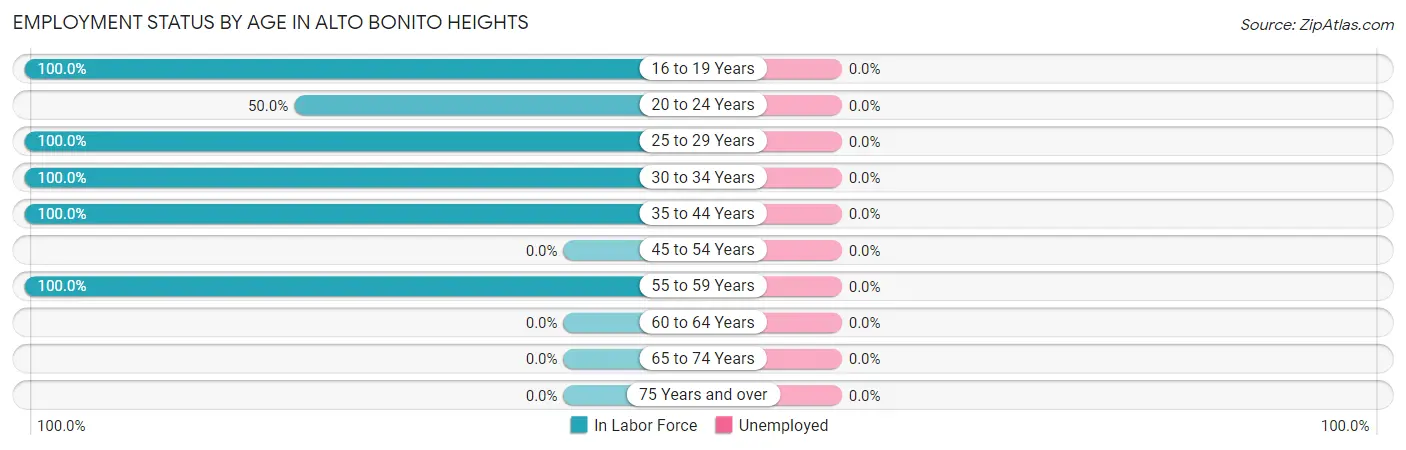
| Age Bracket | In Labor Force | Unemployed |
| 16 to 19 Years | 13 (100.0%) | 0 (0.0%) |
| 20 to 24 Years | 50 (50.0%) | 0 (0.0%) |
| 25 to 29 Years | 50 (100.0%) | 0 (0.0%) |
| 30 to 34 Years | 39 (100.0%) | 0 (0.0%) |
| 35 to 44 Years | 26 (100.0%) | 0 (0.0%) |
| 45 to 54 Years | 0 (0.0%) | 0 (0.0%) |
| 55 to 59 Years | 37 (100.0%) | 0 (0.0%) |
| 60 to 64 Years | 0 (0.0%) | 0 (0.0%) |
| 65 to 74 Years | 0 (0.0%) | 0 (0.0%) |
| 75 Years and over | 0 (0.0%) | 0 (0.0%) |
| Total | 215 (44.1%) | 0 (0.0%) |
Employment Status by Educational Attainment in Alto Bonito Heights
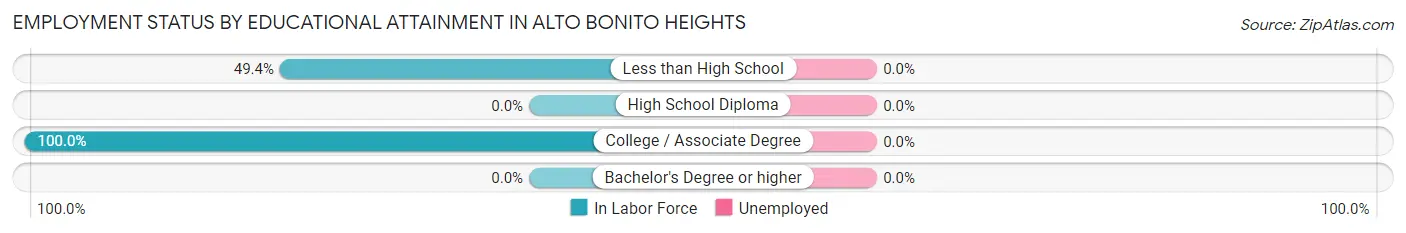
| Educational Attainment | In Labor Force | Unemployed |
| Less than High School | 76 (49.4%) | 0 (0.0%) |
| High School Diploma | 0 (0.0%) | 0 (0.0%) |
| College / Associate Degree | 76 (100.0%) | 0 (0.0%) |
| Bachelor's Degree or higher | 0 (0.0%) | 0 (0.0%) |
| Total | 152 (66.1%) | 0 (0.0%) |
Employment Occupations by Sex in Alto Bonito Heights
Management, Business, Science and Arts Occupations
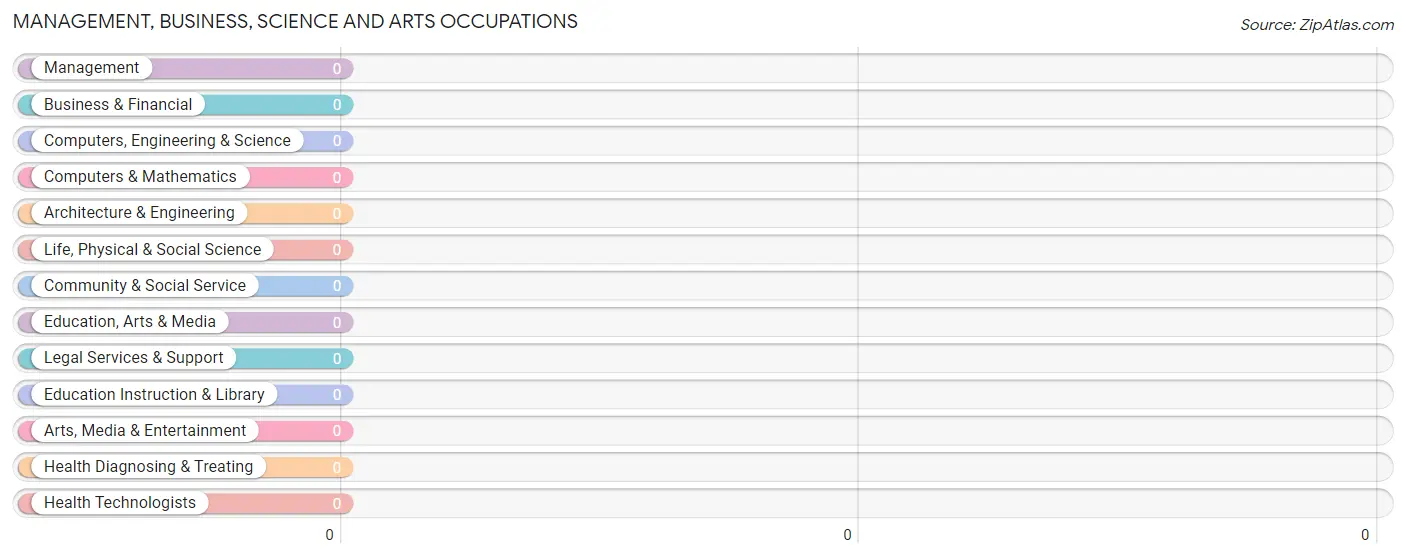
Management, Business, Science and Arts Occupations by Sex
| Occupation | Male | Female |
| Management | 0 (0.0%) | 0 (0.0%) |
| Business & Financial | 0 (0.0%) | 0 (0.0%) |
| Computers, Engineering & Science | 0 (0.0%) | 0 (0.0%) |
| Computers & Mathematics | 0 (0.0%) | 0 (0.0%) |
| Architecture & Engineering | 0 (0.0%) | 0 (0.0%) |
| Life, Physical & Social Science | 0 (0.0%) | 0 (0.0%) |
| Community & Social Service | 0 (0.0%) | 0 (0.0%) |
| Education, Arts & Media | 0 (0.0%) | 0 (0.0%) |
| Legal Services & Support | 0 (0.0%) | 0 (0.0%) |
| Education Instruction & Library | 0 (0.0%) | 0 (0.0%) |
| Arts, Media & Entertainment | 0 (0.0%) | 0 (0.0%) |
| Health Diagnosing & Treating | 0 (0.0%) | 0 (0.0%) |
| Health Technologists | 0 (0.0%) | 0 (0.0%) |
| Total (Category) | 0 (0.0%) | 0 (0.0%) |
| Total (Overall) | 115 (53.5%) | 100 (46.5%) |
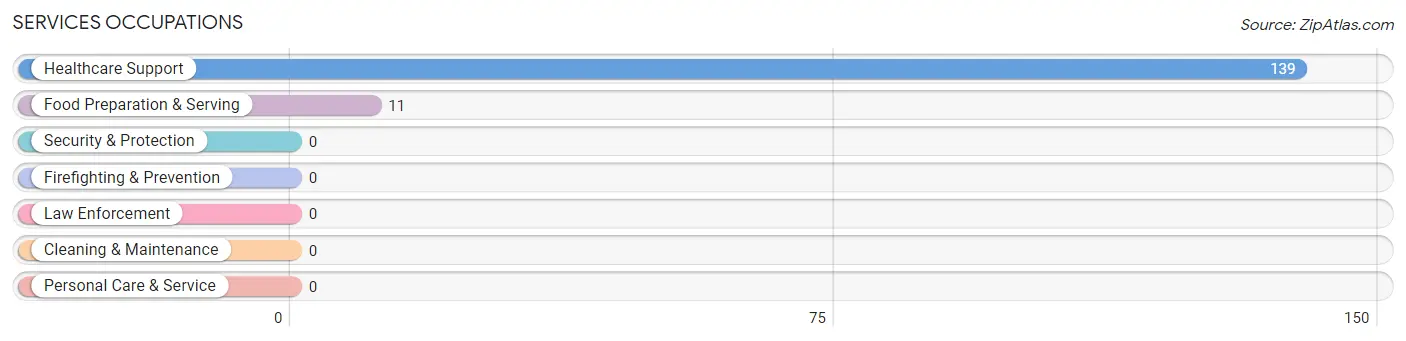
Services Occupations
The most common Services occupations in Alto Bonito Heights are Healthcare Support (139 | 64.6%), and Food Preparation & Serving (11 | 5.1%).
Services Occupations by Sex
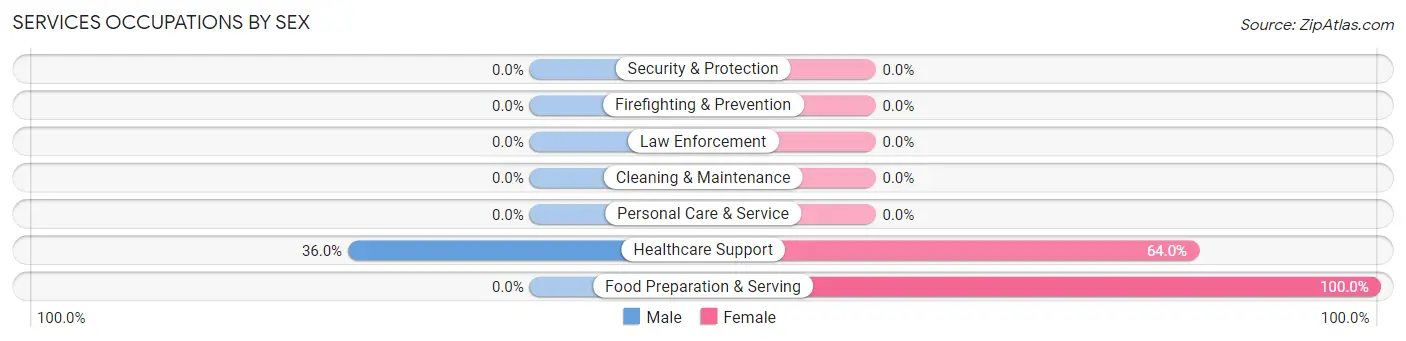
| Occupation | Male | Female |
| Healthcare Support | 50 (36.0%) | 89 (64.0%) |
| Security & Protection | 0 (0.0%) | 0 (0.0%) |
| Firefighting & Prevention | 0 (0.0%) | 0 (0.0%) |
| Law Enforcement | 0 (0.0%) | 0 (0.0%) |
| Food Preparation & Serving | 0 (0.0%) | 11 (100.0%) |
| Cleaning & Maintenance | 0 (0.0%) | 0 (0.0%) |
| Personal Care & Service | 0 (0.0%) | 0 (0.0%) |
| Total (Category) | 50 (33.3%) | 100 (66.7%) |
| Total (Overall) | 115 (53.5%) | 100 (46.5%) |
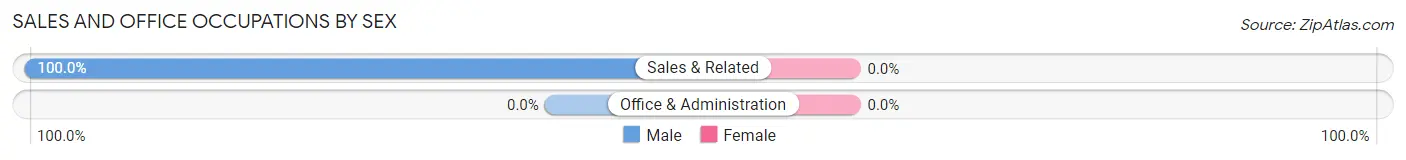
Sales and Office Occupations
The most common Sales and Office occupations in Alto Bonito Heights are , and Sales & Related (13 | 6.0%).
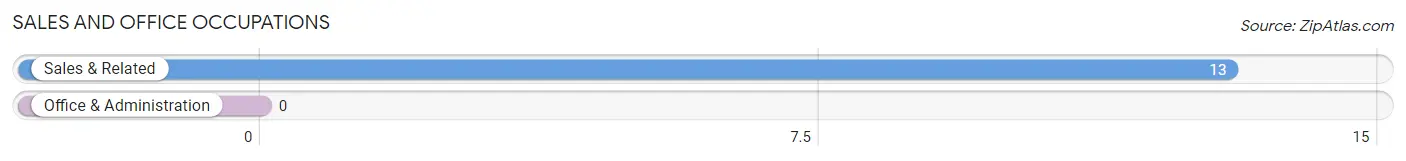
Sales and Office Occupations by Sex
| Occupation | Male | Female |
| Sales & Related | 13 (100.0%) | 0 (0.0%) |
| Office & Administration | 0 (0.0%) | 0 (0.0%) |
| Total (Category) | 13 (100.0%) | 0 (0.0%) |
| Total (Overall) | 115 (53.5%) | 100 (46.5%) |
Natural Resources, Construction and Maintenance Occupations
The most common Natural Resources, Construction and Maintenance occupations in Alto Bonito Heights are , and Construction & Extraction (15 | 7.0%).
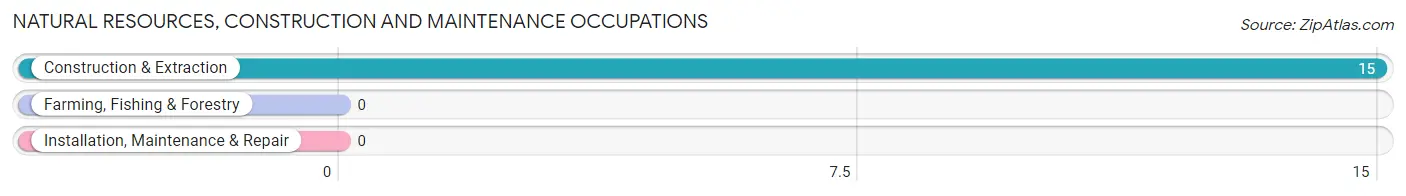
Natural Resources, Construction and Maintenance Occupations by Sex
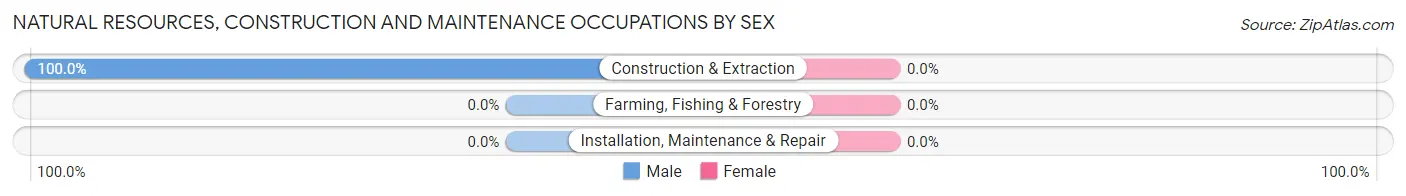
| Occupation | Male | Female |
| Farming, Fishing & Forestry | 0 (0.0%) | 0 (0.0%) |
| Construction & Extraction | 15 (100.0%) | 0 (0.0%) |
| Installation, Maintenance & Repair | 0 (0.0%) | 0 (0.0%) |
| Total (Category) | 15 (100.0%) | 0 (0.0%) |
| Total (Overall) | 115 (53.5%) | 100 (46.5%) |
Production, Transportation and Moving Occupations
The most common Production, Transportation and Moving occupations in Alto Bonito Heights are , and Production (37 | 17.2%).
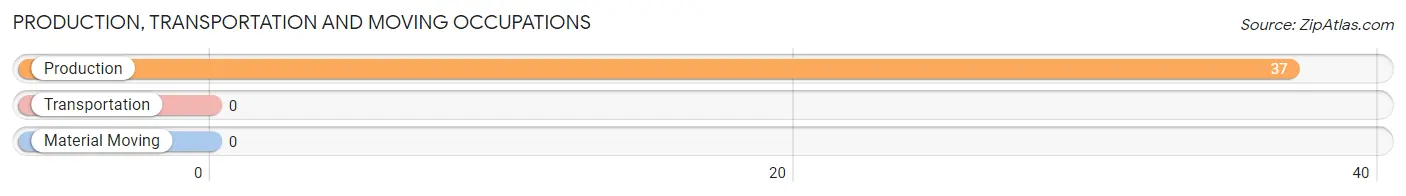
Production, Transportation and Moving Occupations by Sex
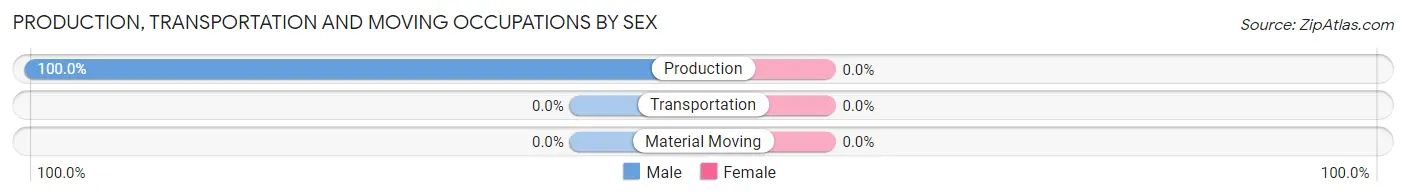
| Occupation | Male | Female |
| Production | 37 (100.0%) | 0 (0.0%) |
| Transportation | 0 (0.0%) | 0 (0.0%) |
| Material Moving | 0 (0.0%) | 0 (0.0%) |
| Total (Category) | 37 (100.0%) | 0 (0.0%) |
| Total (Overall) | 115 (53.5%) | 100 (46.5%) |
Employment Industries by Sex in Alto Bonito Heights
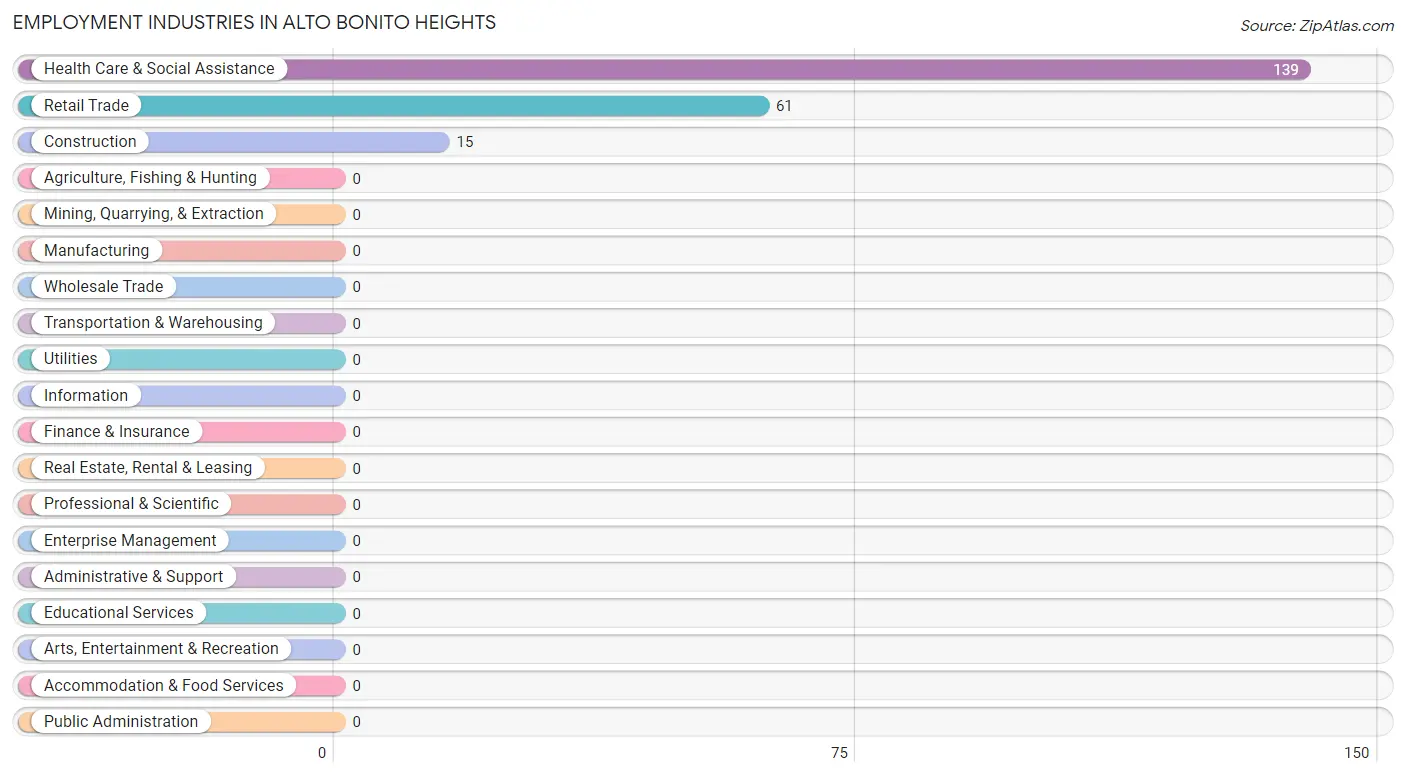
Employment Industries in Alto Bonito Heights
The major employment industries in Alto Bonito Heights include Health Care & Social Assistance (139 | 64.6%), Retail Trade (61 | 28.4%), and Construction (15 | 7.0%).
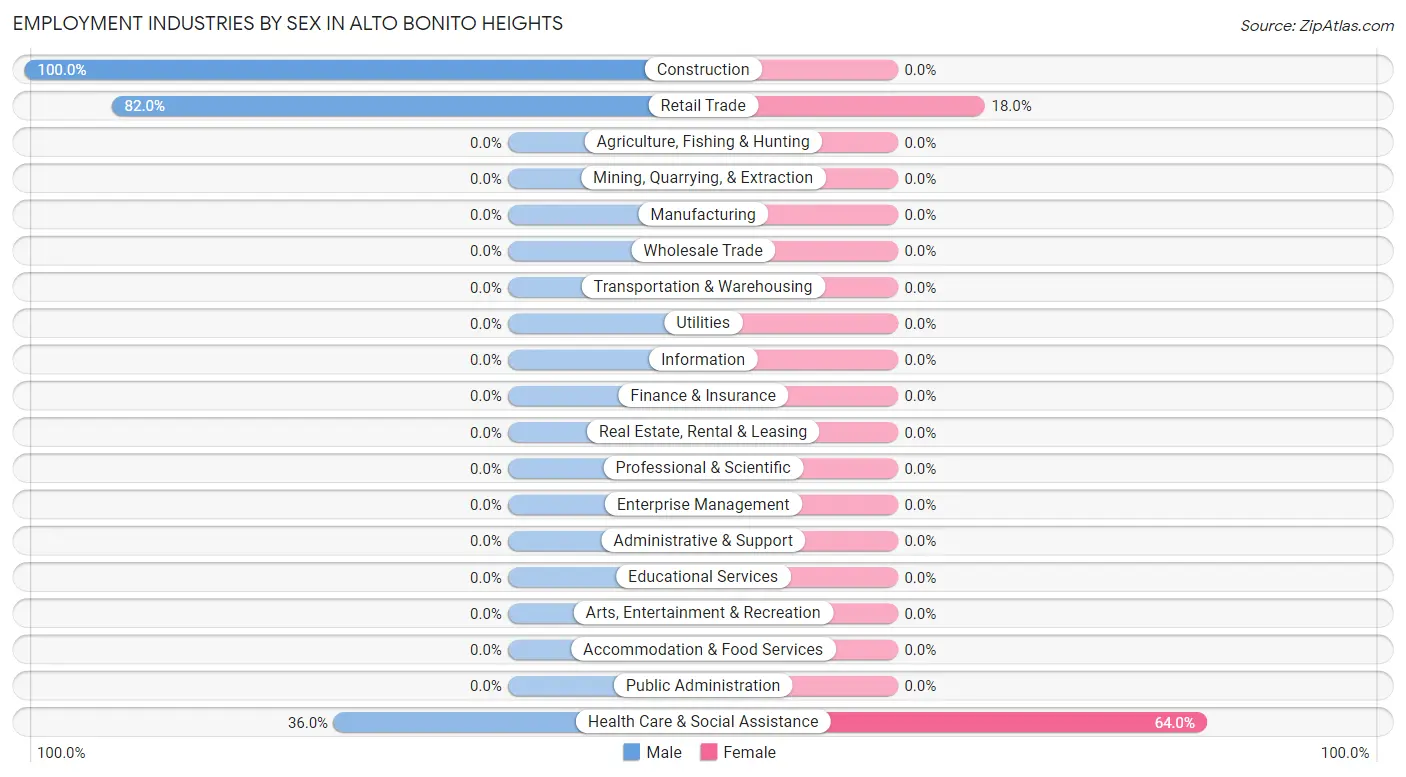
Employment Industries by Sex in Alto Bonito Heights
The Alto Bonito Heights industries that see more men than women are Construction (100.0%), Retail Trade (82.0%), and Health Care & Social Assistance (36.0%), whereas the industries that tend to have a higher number of women are Health Care & Social Assistance (64.0%), and Retail Trade (18.0%).
| Industry | Male | Female |
| Agriculture, Fishing & Hunting | 0 (0.0%) | 0 (0.0%) |
| Mining, Quarrying, & Extraction | 0 (0.0%) | 0 (0.0%) |
| Construction | 15 (100.0%) | 0 (0.0%) |
| Manufacturing | 0 (0.0%) | 0 (0.0%) |
| Wholesale Trade | 0 (0.0%) | 0 (0.0%) |
| Retail Trade | 50 (82.0%) | 11 (18.0%) |
| Transportation & Warehousing | 0 (0.0%) | 0 (0.0%) |
| Utilities | 0 (0.0%) | 0 (0.0%) |
| Information | 0 (0.0%) | 0 (0.0%) |
| Finance & Insurance | 0 (0.0%) | 0 (0.0%) |
| Real Estate, Rental & Leasing | 0 (0.0%) | 0 (0.0%) |
| Professional & Scientific | 0 (0.0%) | 0 (0.0%) |
| Enterprise Management | 0 (0.0%) | 0 (0.0%) |
| Administrative & Support | 0 (0.0%) | 0 (0.0%) |
| Educational Services | 0 (0.0%) | 0 (0.0%) |
| Health Care & Social Assistance | 50 (36.0%) | 89 (64.0%) |
| Arts, Entertainment & Recreation | 0 (0.0%) | 0 (0.0%) |
| Accommodation & Food Services | 0 (0.0%) | 0 (0.0%) |
| Public Administration | 0 (0.0%) | 0 (0.0%) |
| Total | 115 (53.5%) | 100 (46.5%) |
Education in Alto Bonito Heights
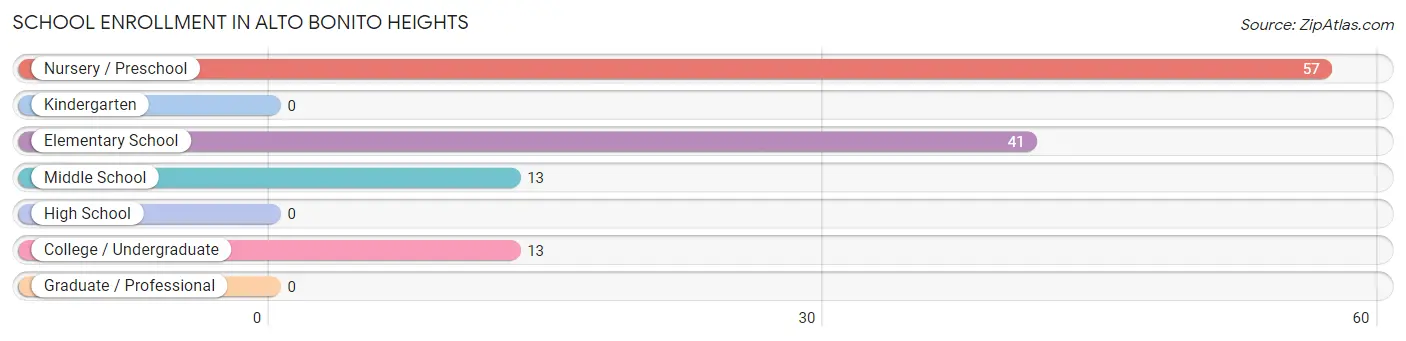
School Enrollment in Alto Bonito Heights
The most common levels of schooling among the 124 students in Alto Bonito Heights are nursery / preschool (57 | 46.0%), elementary school (41 | 33.1%), and middle school (13 | 10.5%).
| School Level | # Students | % Students |
| Nursery / Preschool | 57 | 46.0% |
| Kindergarten | 0 | 0.0% |
| Elementary School | 41 | 33.1% |
| Middle School | 13 | 10.5% |
| High School | 0 | 0.0% |
| College / Undergraduate | 13 | 10.5% |
| Graduate / Professional | 0 | 0.0% |
| Total | 124 | 100.0% |
School Enrollment by Age by Funding Source in Alto Bonito Heights
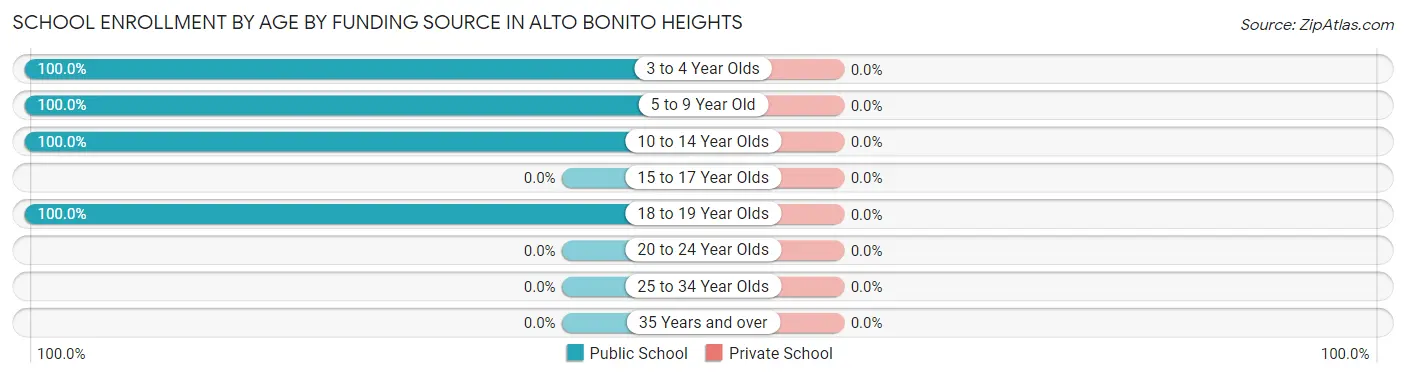
| Age Bracket | Public School | Private School |
| 3 to 4 Year Olds | 57 (100.0%) | 0 (0.0%) |
| 5 to 9 Year Old | 41 (100.0%) | 0 (0.0%) |
| 10 to 14 Year Olds | 13 (100.0%) | 0 (0.0%) |
| 15 to 17 Year Olds | 0 (0.0%) | 0 (0.0%) |
| 18 to 19 Year Olds | 13 (100.0%) | 0 (0.0%) |
| 20 to 24 Year Olds | 0 (0.0%) | 0 (0.0%) |
| 25 to 34 Year Olds | 0 (0.0%) | 0 (0.0%) |
| 35 Years and over | 0 (0.0%) | 0 (0.0%) |
| Total | 124 (100.0%) | 0 (0.0%) |
Educational Attainment by Field of Study in Alto Bonito Heights
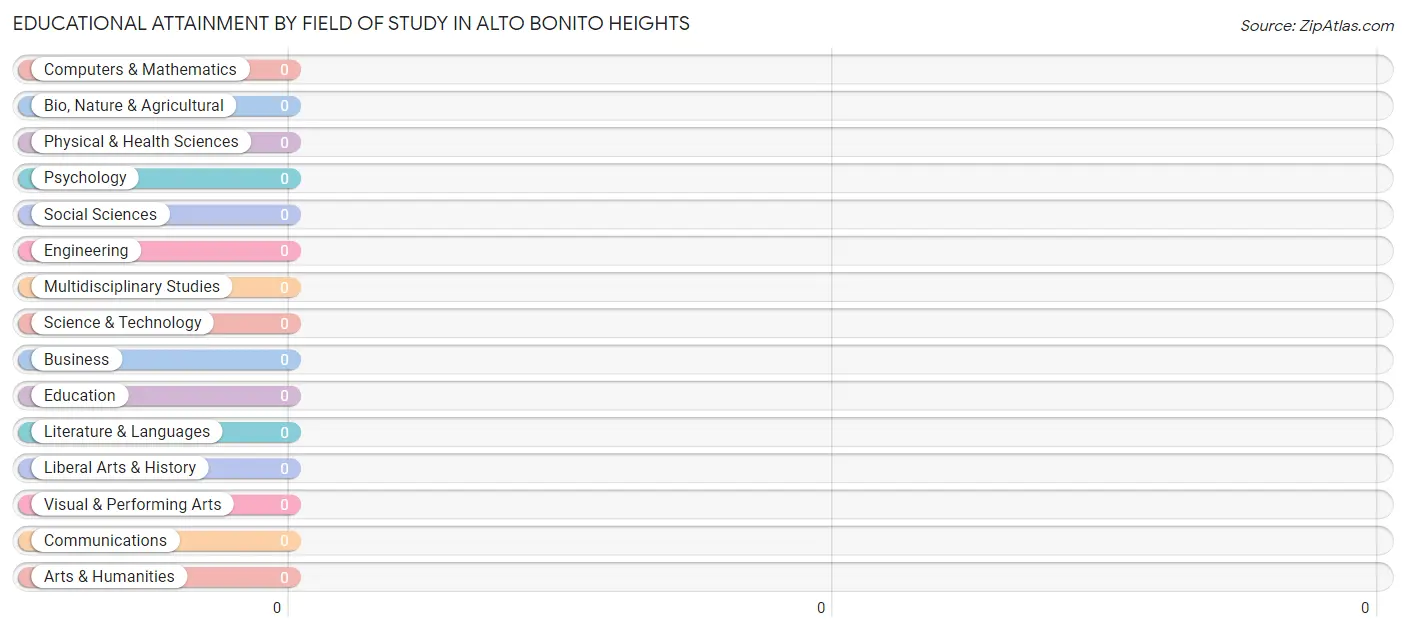
| Field of Study | # Graduates | % Graduates |
| Computers & Mathematics | 0 | 0.0% |
| Bio, Nature & Agricultural | 0 | 0.0% |
| Physical & Health Sciences | 0 | 0.0% |
| Psychology | 0 | 0.0% |
| Social Sciences | 0 | 0.0% |
| Engineering | 0 | 0.0% |
| Multidisciplinary Studies | 0 | 0.0% |
| Science & Technology | 0 | 0.0% |
| Business | 0 | 0.0% |
| Education | 0 | 0.0% |
| Literature & Languages | 0 | 0.0% |
| Liberal Arts & History | 0 | 0.0% |
| Visual & Performing Arts | 0 | 0.0% |
| Communications | 0 | 0.0% |
| Arts & Humanities | 0 | 0.0% |
| Total | 0 | 0.0% |
Transportation & Commute in Alto Bonito Heights
Vehicle Availability by Sex in Alto Bonito Heights
The most prevalent vehicle ownership categories in Alto Bonito Heights are males with 2 vehicles (50, accounting for 43.5%) and females with 2 vehicles (50, making up 50.0%).
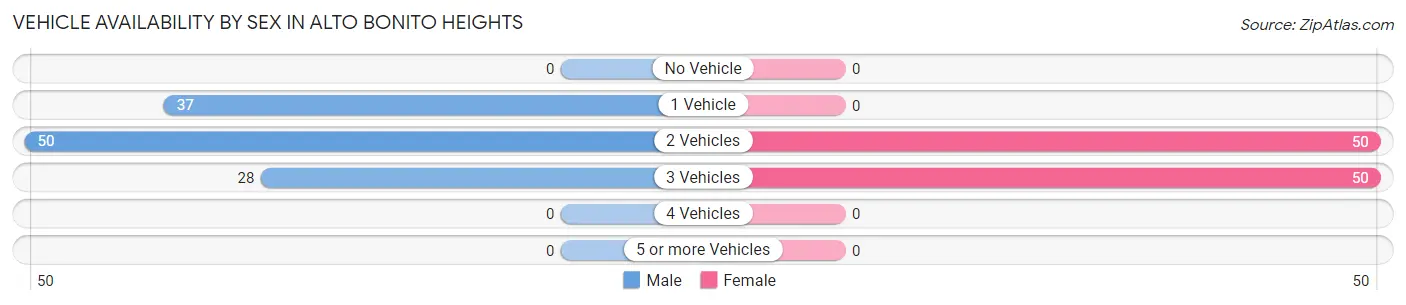
| Vehicles Available | Male | Female |
| No Vehicle | 0 (0.0%) | 0 (0.0%) |
| 1 Vehicle | 37 (32.2%) | 0 (0.0%) |
| 2 Vehicles | 50 (43.5%) | 50 (50.0%) |
| 3 Vehicles | 28 (24.3%) | 50 (50.0%) |
| 4 Vehicles | 0 (0.0%) | 0 (0.0%) |
| 5 or more Vehicles | 0 (0.0%) | 0 (0.0%) |
| Total | 115 (100.0%) | 100 (100.0%) |
Commute Time in Alto Bonito Heights
The most frequently occuring commute durations in Alto Bonito Heights are 10 to 14 minutes (39 commuters, 33.9%), 60 to 89 minutes (37 commuters, 32.2%), and 5 to 9 minutes (24 commuters, 20.9%).
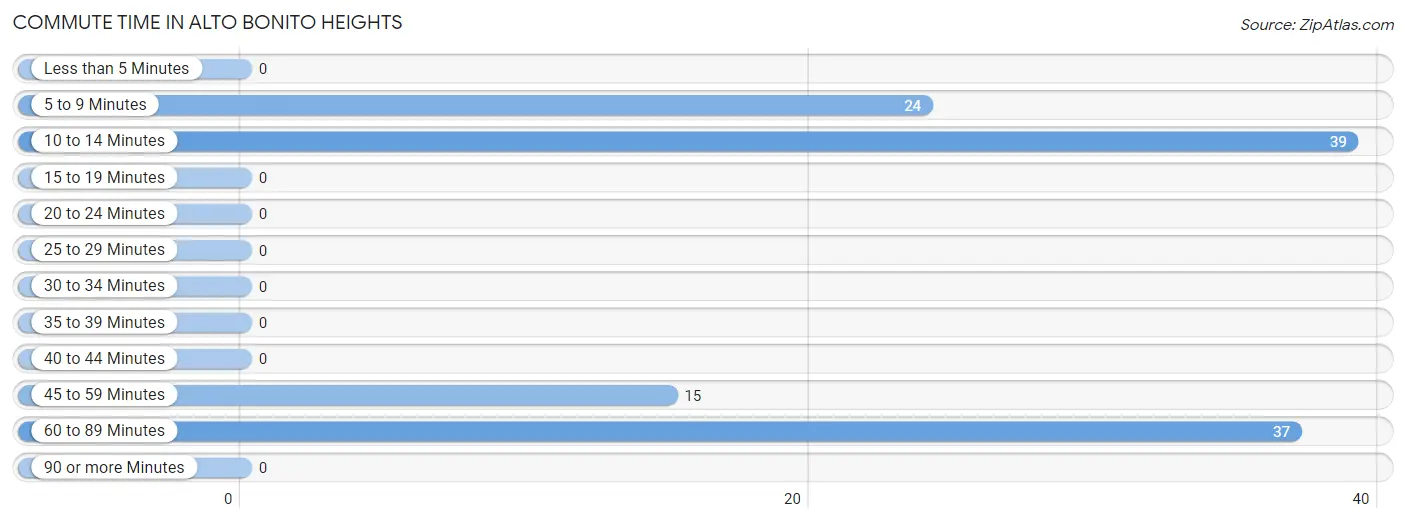
| Commute Time | # Commuters | % Commuters |
| Less than 5 Minutes | 0 | 0.0% |
| 5 to 9 Minutes | 24 | 20.9% |
| 10 to 14 Minutes | 39 | 33.9% |
| 15 to 19 Minutes | 0 | 0.0% |
| 20 to 24 Minutes | 0 | 0.0% |
| 25 to 29 Minutes | 0 | 0.0% |
| 30 to 34 Minutes | 0 | 0.0% |
| 35 to 39 Minutes | 0 | 0.0% |
| 40 to 44 Minutes | 0 | 0.0% |
| 45 to 59 Minutes | 15 | 13.0% |
| 60 to 89 Minutes | 37 | 32.2% |
| 90 or more Minutes | 0 | 0.0% |
Commute Time by Sex in Alto Bonito Heights
The most common commute times in Alto Bonito Heights are 60 to 89 minutes (37 commuters, 56.9%) for males and 10 to 14 minutes (39 commuters, 78.0%) for females.
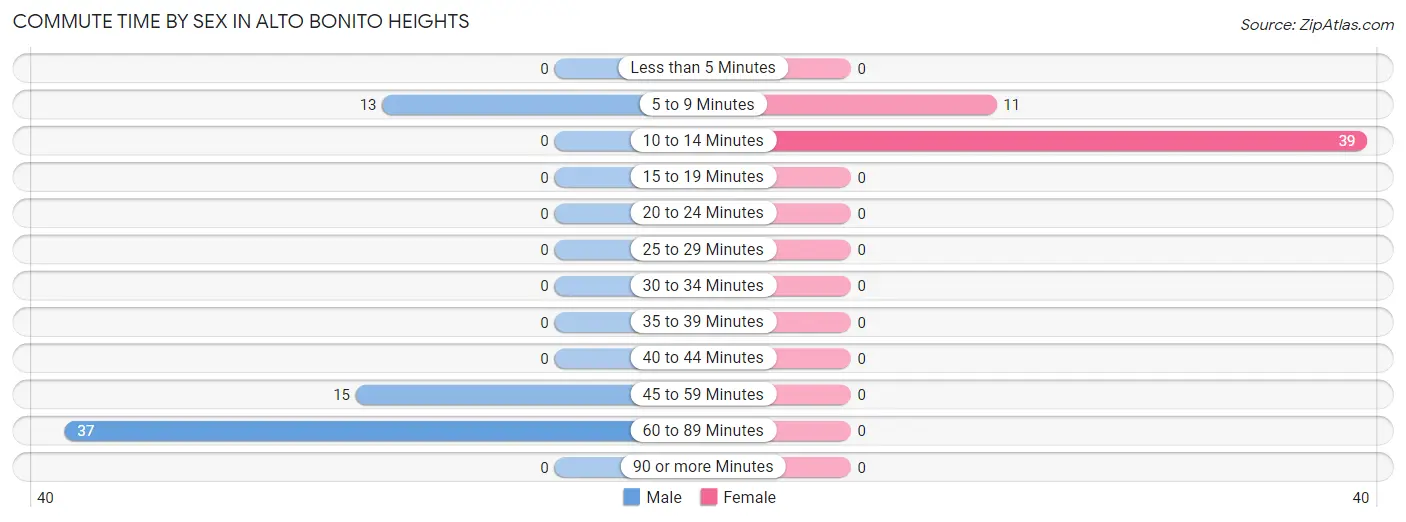
| Commute Time | Male | Female |
| Less than 5 Minutes | 0 (0.0%) | 0 (0.0%) |
| 5 to 9 Minutes | 13 (20.0%) | 11 (22.0%) |
| 10 to 14 Minutes | 0 (0.0%) | 39 (78.0%) |
| 15 to 19 Minutes | 0 (0.0%) | 0 (0.0%) |
| 20 to 24 Minutes | 0 (0.0%) | 0 (0.0%) |
| 25 to 29 Minutes | 0 (0.0%) | 0 (0.0%) |
| 30 to 34 Minutes | 0 (0.0%) | 0 (0.0%) |
| 35 to 39 Minutes | 0 (0.0%) | 0 (0.0%) |
| 40 to 44 Minutes | 0 (0.0%) | 0 (0.0%) |
| 45 to 59 Minutes | 15 (23.1%) | 0 (0.0%) |
| 60 to 89 Minutes | 37 (56.9%) | 0 (0.0%) |
| 90 or more Minutes | 0 (0.0%) | 0 (0.0%) |
Time of Departure to Work by Sex in Alto Bonito Heights
The most frequent times of departure to work in Alto Bonito Heights are 7:00 AM to 7:29 AM (37, 56.9%) for males and 7:00 AM to 7:29 AM (39, 78.0%) for females.
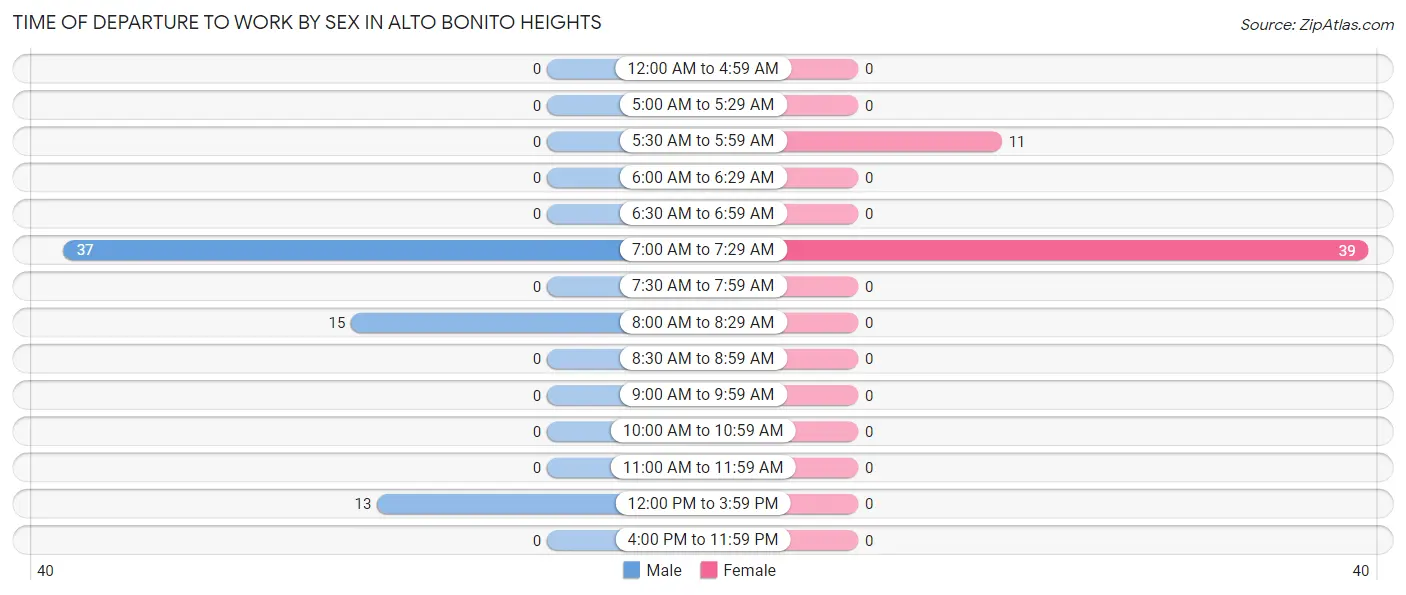
| Time of Departure | Male | Female |
| 12:00 AM to 4:59 AM | 0 (0.0%) | 0 (0.0%) |
| 5:00 AM to 5:29 AM | 0 (0.0%) | 0 (0.0%) |
| 5:30 AM to 5:59 AM | 0 (0.0%) | 11 (22.0%) |
| 6:00 AM to 6:29 AM | 0 (0.0%) | 0 (0.0%) |
| 6:30 AM to 6:59 AM | 0 (0.0%) | 0 (0.0%) |
| 7:00 AM to 7:29 AM | 37 (56.9%) | 39 (78.0%) |
| 7:30 AM to 7:59 AM | 0 (0.0%) | 0 (0.0%) |
| 8:00 AM to 8:29 AM | 15 (23.1%) | 0 (0.0%) |
| 8:30 AM to 8:59 AM | 0 (0.0%) | 0 (0.0%) |
| 9:00 AM to 9:59 AM | 0 (0.0%) | 0 (0.0%) |
| 10:00 AM to 10:59 AM | 0 (0.0%) | 0 (0.0%) |
| 11:00 AM to 11:59 AM | 0 (0.0%) | 0 (0.0%) |
| 12:00 PM to 3:59 PM | 13 (20.0%) | 0 (0.0%) |
| 4:00 PM to 11:59 PM | 0 (0.0%) | 0 (0.0%) |
| Total | 65 (100.0%) | 50 (100.0%) |
Housing Occupancy in Alto Bonito Heights
Occupancy by Ownership in Alto Bonito Heights
Of the total 148 dwellings in Alto Bonito Heights, owner-occupied units account for 148 (100.0%), while renter-occupied units make up 0 (0.0%).
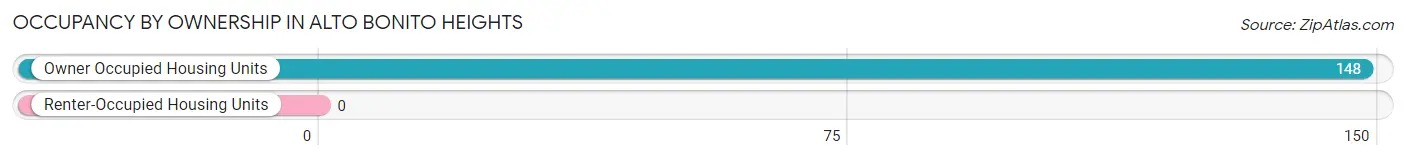
| Occupancy | # Housing Units | % Housing Units |
| Owner Occupied Housing Units | 148 | 100.0% |
| Renter-Occupied Housing Units | 0 | 0.0% |
| Total Occupied Housing Units | 148 | 100.0% |
Occupancy by Household Size in Alto Bonito Heights
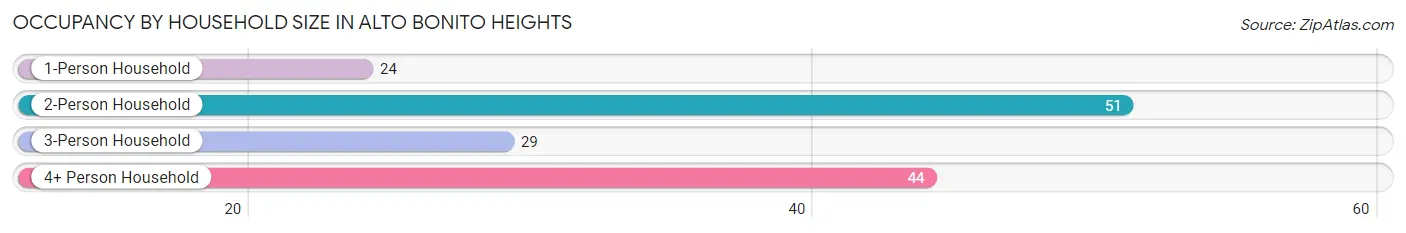
| Household Size | # Housing Units | % Housing Units |
| 1-Person Household | 24 | 16.2% |
| 2-Person Household | 51 | 34.5% |
| 3-Person Household | 29 | 19.6% |
| 4+ Person Household | 44 | 29.7% |
| Total Housing Units | 148 | 100.0% |
Occupancy by Ownership by Household Size in Alto Bonito Heights
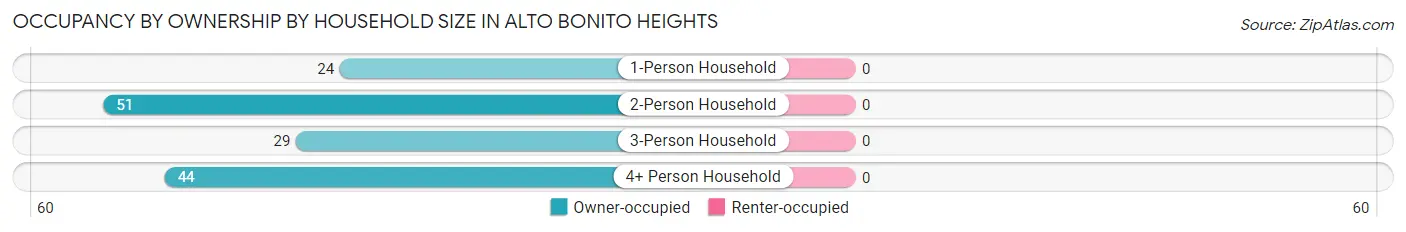
| Household Size | Owner-occupied | Renter-occupied |
| 1-Person Household | 24 (100.0%) | 0 (0.0%) |
| 2-Person Household | 51 (100.0%) | 0 (0.0%) |
| 3-Person Household | 29 (100.0%) | 0 (0.0%) |
| 4+ Person Household | 44 (100.0%) | 0 (0.0%) |
| Total Housing Units | 148 (100.0%) | 0 (0.0%) |
Occupancy by Educational Attainment in Alto Bonito Heights
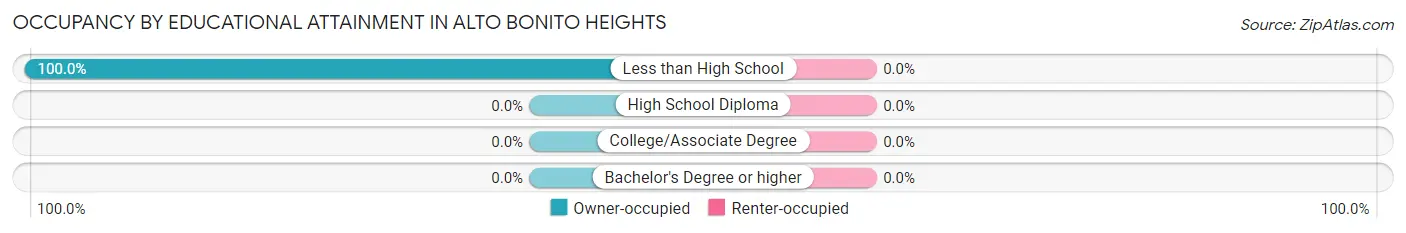
| Household Size | Owner-occupied | Renter-occupied |
| Less than High School | 148 (100.0%) | 0 (0.0%) |
| High School Diploma | 0 (0.0%) | 0 (0.0%) |
| College/Associate Degree | 0 (0.0%) | 0 (0.0%) |
| Bachelor's Degree or higher | 0 (0.0%) | 0 (0.0%) |
Occupancy by Age of Householder in Alto Bonito Heights
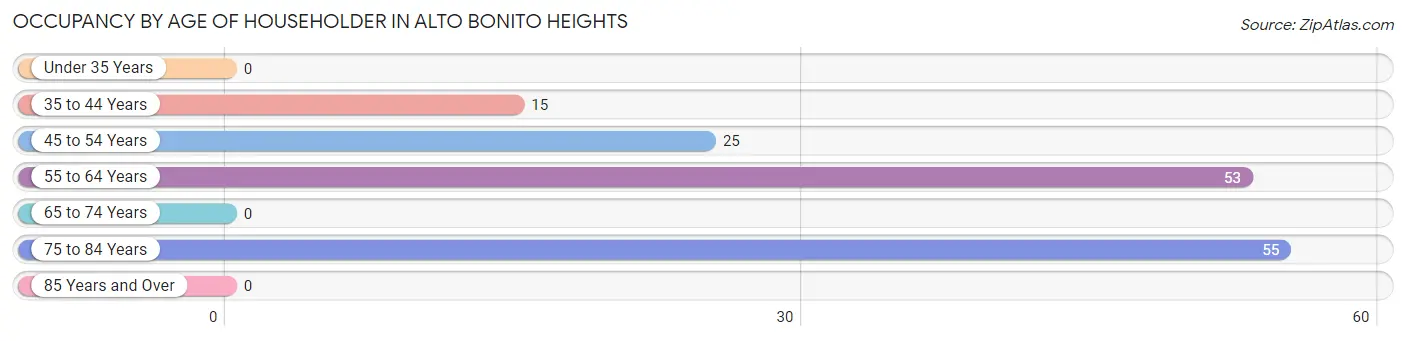
| Age Bracket | # Households | % Households |
| Under 35 Years | 0 | 0.0% |
| 35 to 44 Years | 15 | 10.1% |
| 45 to 54 Years | 25 | 16.9% |
| 55 to 64 Years | 53 | 35.8% |
| 65 to 74 Years | 0 | 0.0% |
| 75 to 84 Years | 55 | 37.2% |
| 85 Years and Over | 0 | 0.0% |
| Total | 148 | 100.0% |
Housing Finances in Alto Bonito Heights
Median Income by Occupancy in Alto Bonito Heights
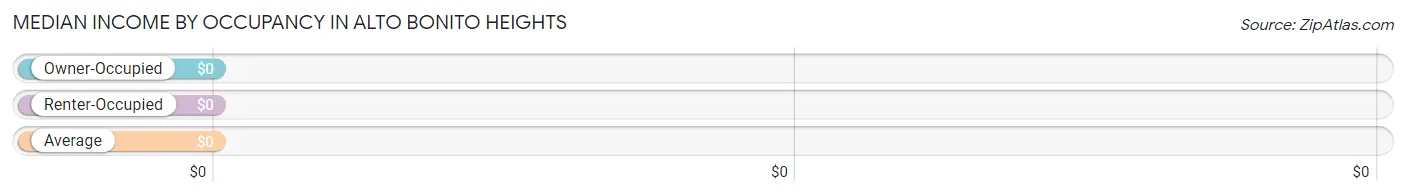
| Occupancy Type | # Households | Median Income |
| Owner-Occupied | 148 (100.0%) | $0 |
| Renter-Occupied | 0 (0.0%) | $0 |
| Average | 148 (100.0%) | $0 |
Occupancy by Householder Income Bracket in Alto Bonito Heights
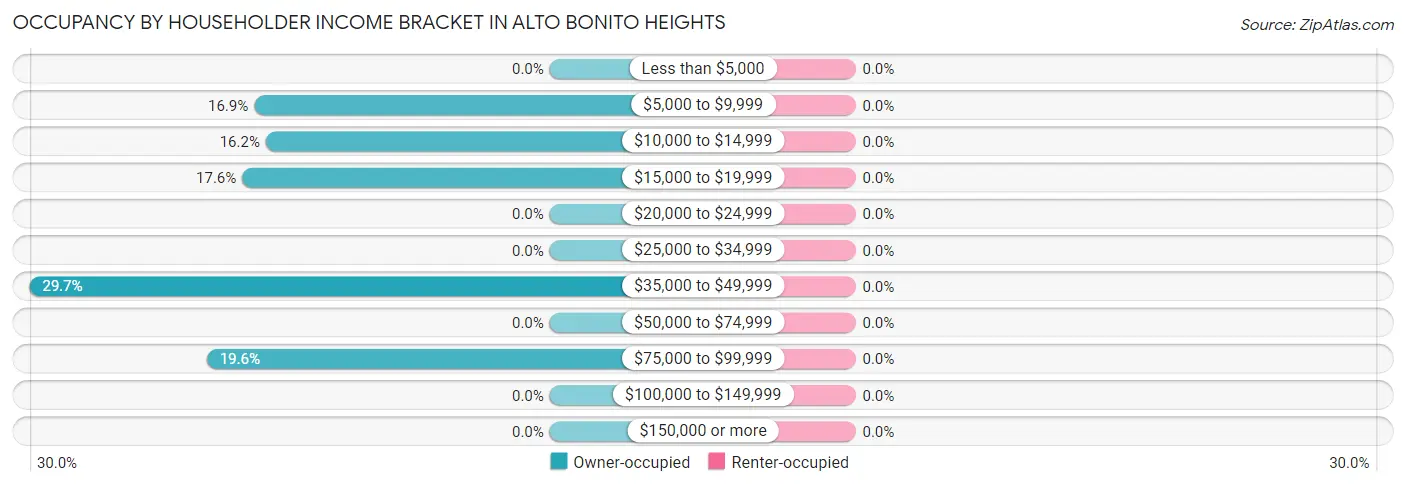
| Income Bracket | Owner-occupied | Renter-occupied |
| Less than $5,000 | 0 (0.0%) | 0 (0.0%) |
| $5,000 to $9,999 | 25 (16.9%) | 0 (0.0%) |
| $10,000 to $14,999 | 24 (16.2%) | 0 (0.0%) |
| $15,000 to $19,999 | 26 (17.6%) | 0 (0.0%) |
| $20,000 to $24,999 | 0 (0.0%) | 0 (0.0%) |
| $25,000 to $34,999 | 0 (0.0%) | 0 (0.0%) |
| $35,000 to $49,999 | 44 (29.7%) | 0 (0.0%) |
| $50,000 to $74,999 | 0 (0.0%) | 0 (0.0%) |
| $75,000 to $99,999 | 29 (19.6%) | 0 (0.0%) |
| $100,000 to $149,999 | 0 (0.0%) | 0 (0.0%) |
| $150,000 or more | 0 (0.0%) | 0 (0.0%) |
| Total | 148 (100.0%) | 0 (0.0%) |
Monthly Housing Cost Tiers in Alto Bonito Heights
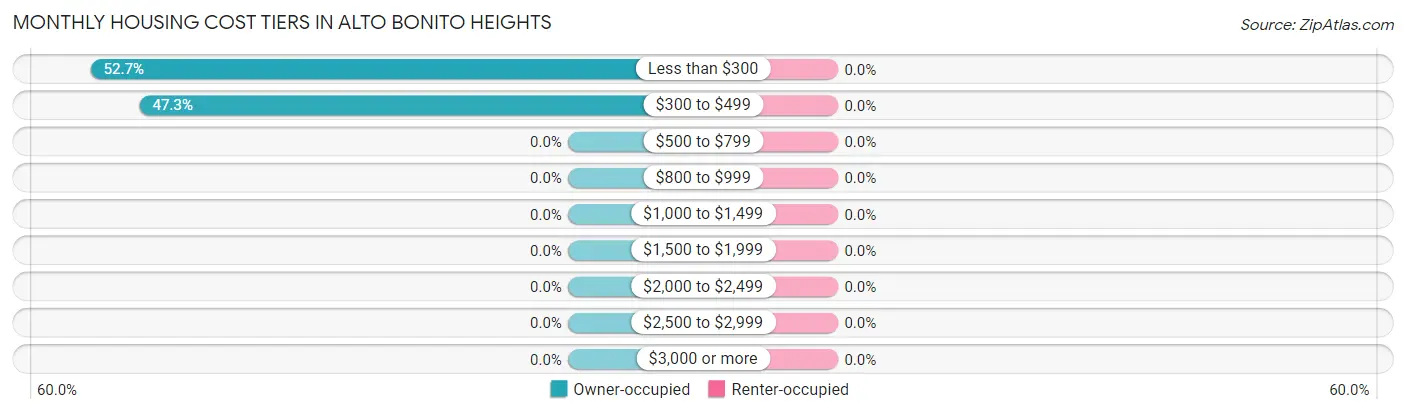
| Monthly Cost | Owner-occupied | Renter-occupied |
| Less than $300 | 78 (52.7%) | 0 (0.0%) |
| $300 to $499 | 70 (47.3%) | 0 (0.0%) |
| $500 to $799 | 0 (0.0%) | 0 (0.0%) |
| $800 to $999 | 0 (0.0%) | 0 (0.0%) |
| $1,000 to $1,499 | 0 (0.0%) | 0 (0.0%) |
| $1,500 to $1,999 | 0 (0.0%) | 0 (0.0%) |
| $2,000 to $2,499 | 0 (0.0%) | 0 (0.0%) |
| $2,500 to $2,999 | 0 (0.0%) | 0 (0.0%) |
| $3,000 or more | 0 (0.0%) | 0 (0.0%) |
| Total | 148 (100.0%) | 0 (0.0%) |
Physical Housing Characteristics in Alto Bonito Heights
Housing Structures in Alto Bonito Heights
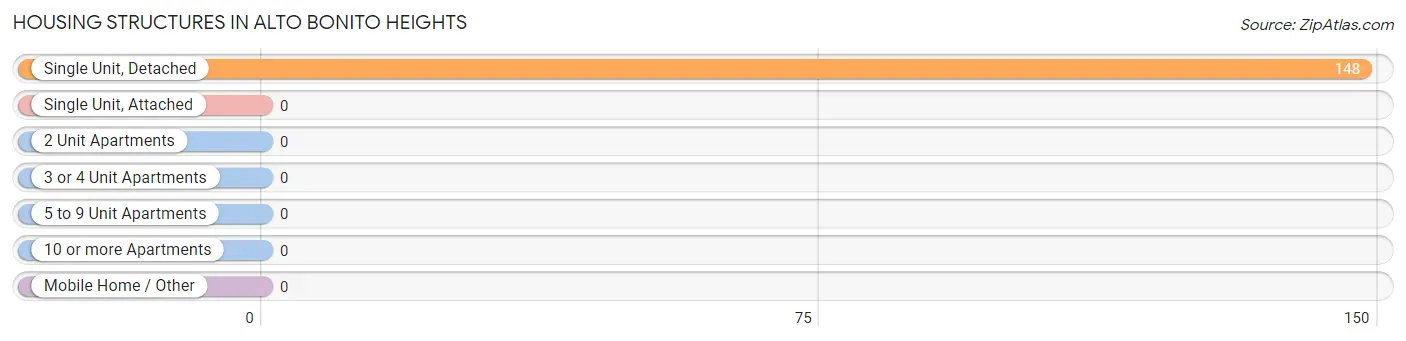
| Structure Type | # Housing Units | % Housing Units |
| Single Unit, Detached | 148 | 100.0% |
| Single Unit, Attached | 0 | 0.0% |
| 2 Unit Apartments | 0 | 0.0% |
| 3 or 4 Unit Apartments | 0 | 0.0% |
| 5 to 9 Unit Apartments | 0 | 0.0% |
| 10 or more Apartments | 0 | 0.0% |
| Mobile Home / Other | 0 | 0.0% |
| Total | 148 | 100.0% |
Housing Structures by Occupancy in Alto Bonito Heights
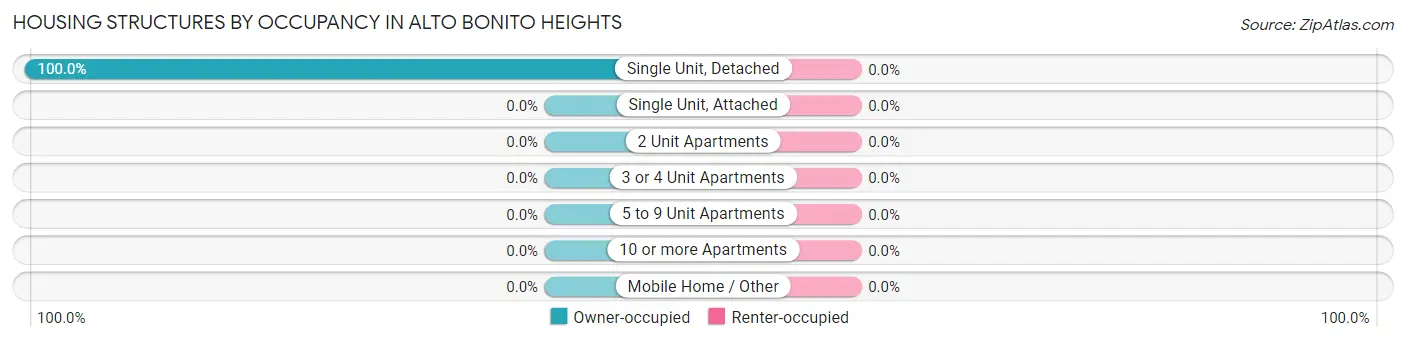
| Structure Type | Owner-occupied | Renter-occupied |
| Single Unit, Detached | 148 (100.0%) | 0 (0.0%) |
| Single Unit, Attached | 0 (0.0%) | 0 (0.0%) |
| 2 Unit Apartments | 0 (0.0%) | 0 (0.0%) |
| 3 or 4 Unit Apartments | 0 (0.0%) | 0 (0.0%) |
| 5 to 9 Unit Apartments | 0 (0.0%) | 0 (0.0%) |
| 10 or more Apartments | 0 (0.0%) | 0 (0.0%) |
| Mobile Home / Other | 0 (0.0%) | 0 (0.0%) |
| Total | 148 (100.0%) | 0 (0.0%) |
Housing Structures by Number of Rooms in Alto Bonito Heights
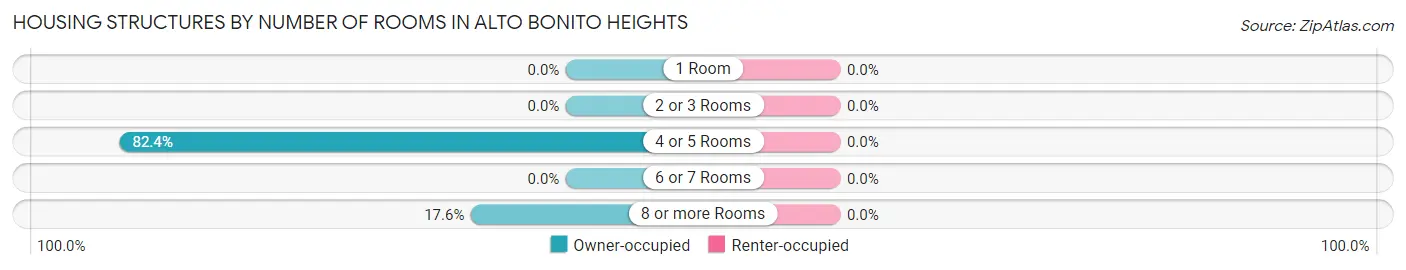
| Number of Rooms | Owner-occupied | Renter-occupied |
| 1 Room | 0 (0.0%) | 0 (0.0%) |
| 2 or 3 Rooms | 0 (0.0%) | 0 (0.0%) |
| 4 or 5 Rooms | 122 (82.4%) | 0 (0.0%) |
| 6 or 7 Rooms | 0 (0.0%) | 0 (0.0%) |
| 8 or more Rooms | 26 (17.6%) | 0 (0.0%) |
| Total | 148 (100.0%) | 0 (0.0%) |
Housing Structure by Heating Type in Alto Bonito Heights
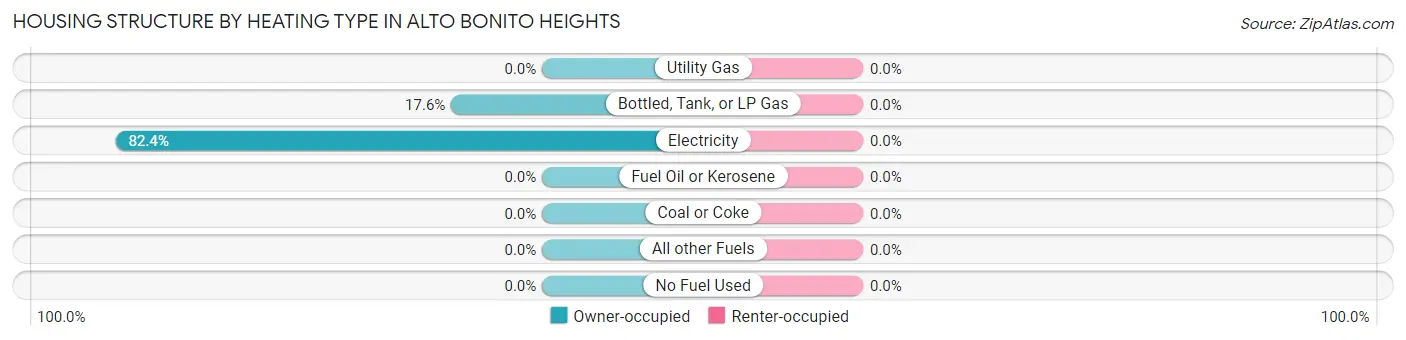
| Heating Type | Owner-occupied | Renter-occupied |
| Utility Gas | 0 (0.0%) | 0 (0.0%) |
| Bottled, Tank, or LP Gas | 26 (17.6%) | 0 (0.0%) |
| Electricity | 122 (82.4%) | 0 (0.0%) |
| Fuel Oil or Kerosene | 0 (0.0%) | 0 (0.0%) |
| Coal or Coke | 0 (0.0%) | 0 (0.0%) |
| All other Fuels | 0 (0.0%) | 0 (0.0%) |
| No Fuel Used | 0 (0.0%) | 0 (0.0%) |
| Total | 148 (100.0%) | 0 (0.0%) |
Household Vehicle Usage in Alto Bonito Heights
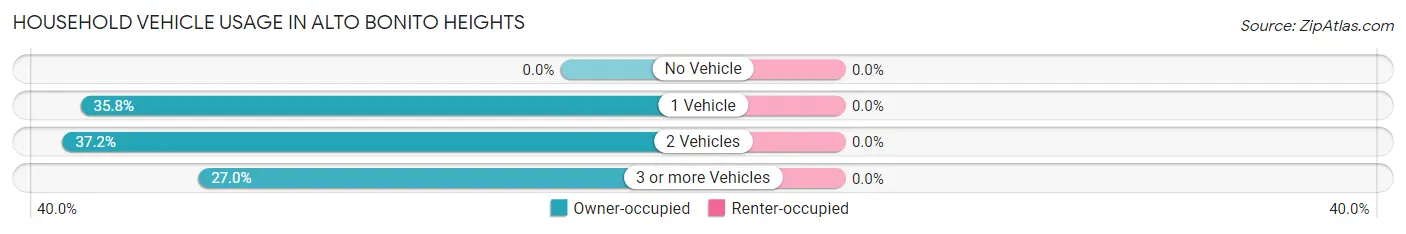
| Vehicles per Household | Owner-occupied | Renter-occupied |
| No Vehicle | 0 (0.0%) | 0 (0.0%) |
| 1 Vehicle | 53 (35.8%) | 0 (0.0%) |
| 2 Vehicles | 55 (37.2%) | 0 (0.0%) |
| 3 or more Vehicles | 40 (27.0%) | 0 (0.0%) |
| Total | 148 (100.0%) | 0 (0.0%) |
Real Estate & Mortgages in Alto Bonito Heights
Real Estate and Mortgage Overview in Alto Bonito Heights
| Characteristic | Without Mortgage | With Mortgage |
| Housing Units | 148 | 0 |
| Median Property Value | $109,500 | $0 |
| Median Household Income | - | - |
| Monthly Housing Costs | $296 | $0 |
| Real Estate Taxes | - | - |
Property Value by Mortgage Status in Alto Bonito Heights
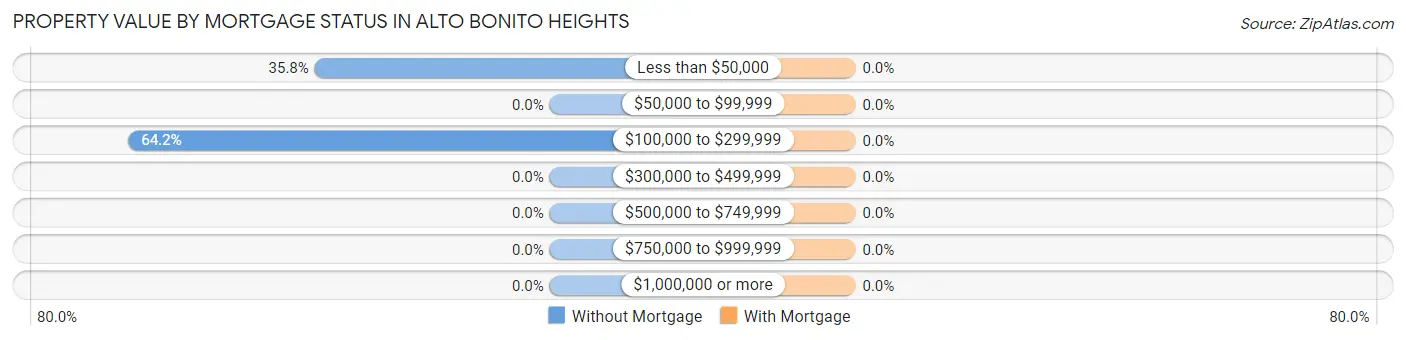
| Property Value | Without Mortgage | With Mortgage |
| Less than $50,000 | 53 (35.8%) | 0 (0.0%) |
| $50,000 to $99,999 | 0 (0.0%) | 0 (0.0%) |
| $100,000 to $299,999 | 95 (64.2%) | 0 (0.0%) |
| $300,000 to $499,999 | 0 (0.0%) | 0 (0.0%) |
| $500,000 to $749,999 | 0 (0.0%) | 0 (0.0%) |
| $750,000 to $999,999 | 0 (0.0%) | 0 (0.0%) |
| $1,000,000 or more | 0 (0.0%) | 0 (0.0%) |
| Total | 148 (100.0%) | 0 (0.0%) |
Household Income by Mortgage Status in Alto Bonito Heights
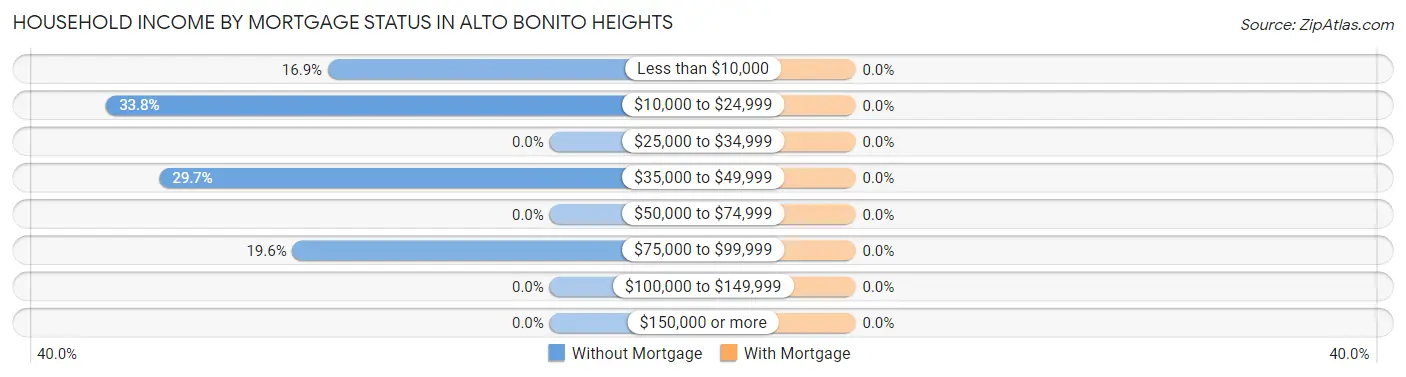
| Household Income | Without Mortgage | With Mortgage |
| Less than $10,000 | 25 (16.9%) | 0 (0.0%) |
| $10,000 to $24,999 | 50 (33.8%) | 0 (0.0%) |
| $25,000 to $34,999 | 0 (0.0%) | 0 (0.0%) |
| $35,000 to $49,999 | 44 (29.7%) | 0 (0.0%) |
| $50,000 to $74,999 | 0 (0.0%) | 0 (0.0%) |
| $75,000 to $99,999 | 29 (19.6%) | 0 (0.0%) |
| $100,000 to $149,999 | 0 (0.0%) | 0 (0.0%) |
| $150,000 or more | 0 (0.0%) | 0 (0.0%) |
| Total | 148 (100.0%) | 0 (0.0%) |
Property Value to Household Income Ratio in Alto Bonito Heights
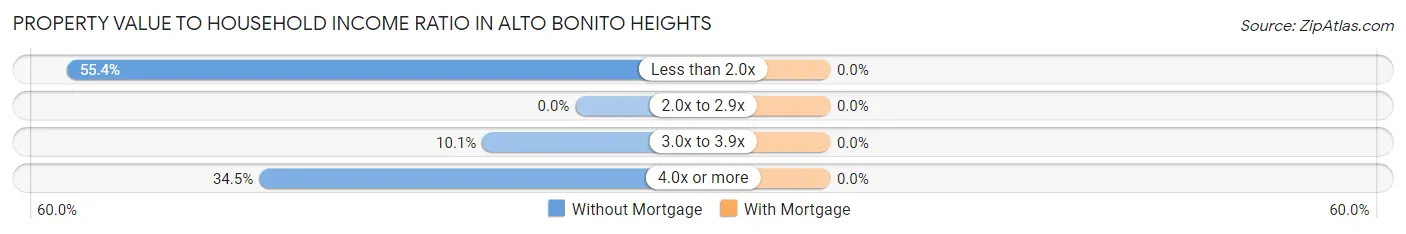
| Value-to-Income Ratio | Without Mortgage | With Mortgage |
| Less than 2.0x | 82 (55.4%) | 0 (0.0%) |
| 2.0x to 2.9x | 0 (0.0%) | 0 (0.0%) |
| 3.0x to 3.9x | 15 (10.1%) | 0 (0.0%) |
| 4.0x or more | 51 (34.5%) | 0 (0.0%) |
| Total | 148 (100.0%) | 0 (0.0%) |
Real Estate Taxes by Mortgage Status in Alto Bonito Heights
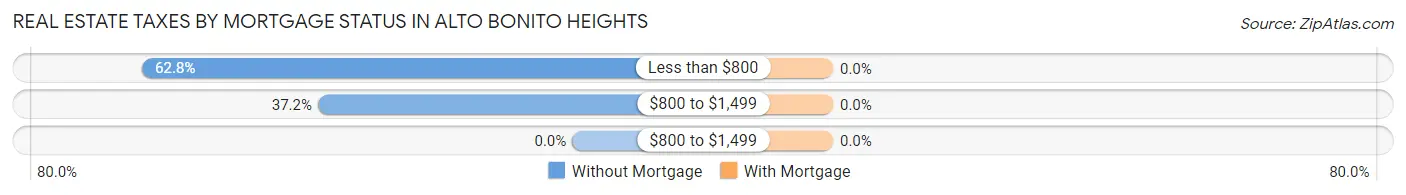
| Property Taxes | Without Mortgage | With Mortgage |
| Less than $800 | 93 (62.8%) | 0 (0.0%) |
| $800 to $1,499 | 55 (37.2%) | 0 (0.0%) |
| $800 to $1,499 | 0 (0.0%) | 0 (0.0%) |
| Total | 148 (100.0%) | 0 (0.0%) |
Health & Disability in Alto Bonito Heights
Health Insurance Coverage by Age in Alto Bonito Heights
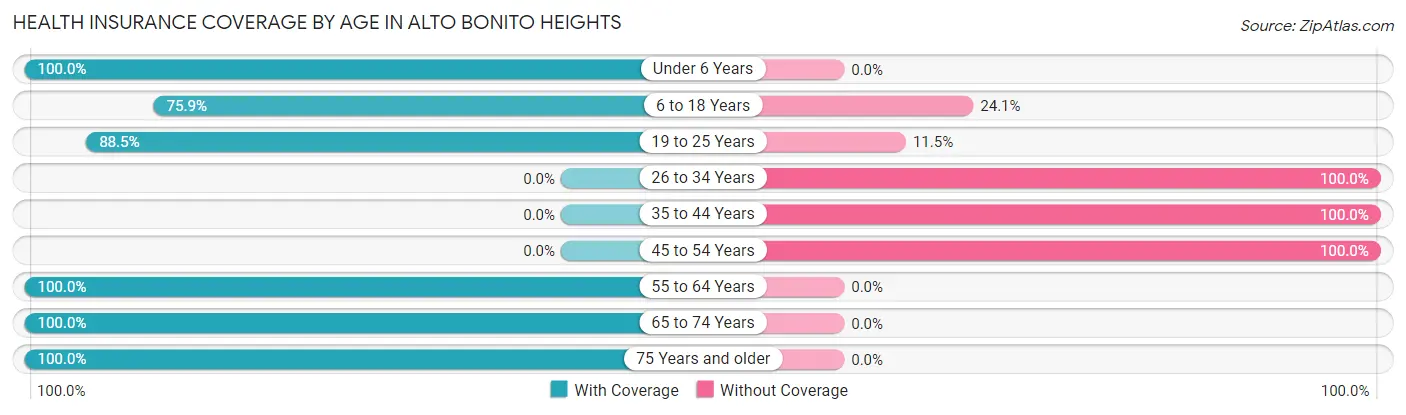
| Age Bracket | With Coverage | Without Coverage |
| Under 6 Years | 185 (100.0%) | 0 (0.0%) |
| 6 to 18 Years | 41 (75.9%) | 13 (24.1%) |
| 19 to 25 Years | 100 (88.5%) | 13 (11.5%) |
| 26 to 34 Years | 0 (0.0%) | 89 (100.0%) |
| 35 to 44 Years | 0 (0.0%) | 26 (100.0%) |
| 45 to 54 Years | 0 (0.0%) | 25 (100.0%) |
| 55 to 64 Years | 90 (100.0%) | 0 (0.0%) |
| 65 to 74 Years | 22 (100.0%) | 0 (0.0%) |
| 75 Years and older | 122 (100.0%) | 0 (0.0%) |
| Total | 560 (77.1%) | 166 (22.9%) |
Health Insurance Coverage by Citizenship Status in Alto Bonito Heights
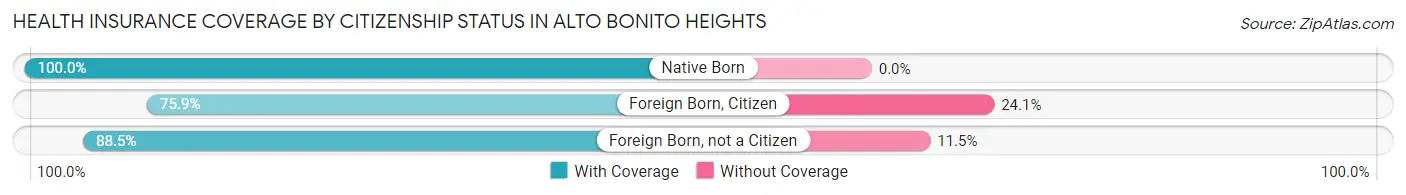
| Citizenship Status | With Coverage | Without Coverage |
| Native Born | 185 (100.0%) | 0 (0.0%) |
| Foreign Born, Citizen | 41 (75.9%) | 13 (24.1%) |
| Foreign Born, not a Citizen | 100 (88.5%) | 13 (11.5%) |
Health Insurance Coverage by Household Income in Alto Bonito Heights
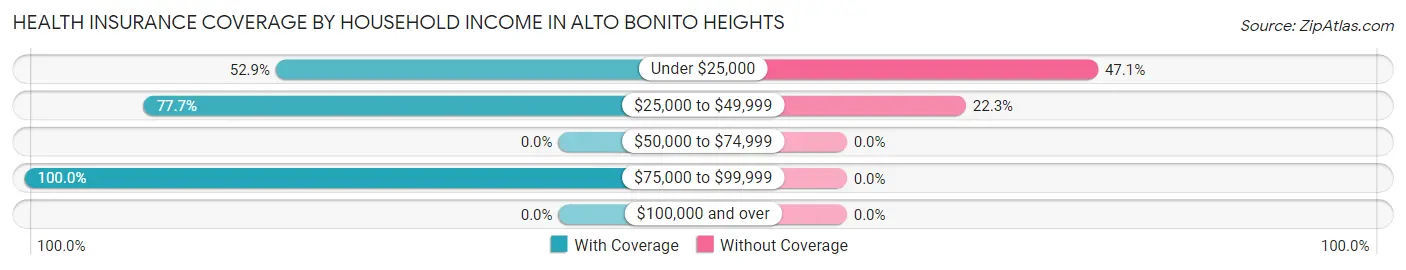
| Household Income | With Coverage | Without Coverage |
| Under $25,000 | 72 (52.9%) | 64 (47.1%) |
| $25,000 to $49,999 | 355 (77.7%) | 102 (22.3%) |
| $50,000 to $74,999 | 0 (0.0%) | 0 (0.0%) |
| $75,000 to $99,999 | 133 (100.0%) | 0 (0.0%) |
| $100,000 and over | 0 (0.0%) | 0 (0.0%) |
Public vs Private Health Insurance Coverage by Age in Alto Bonito Heights
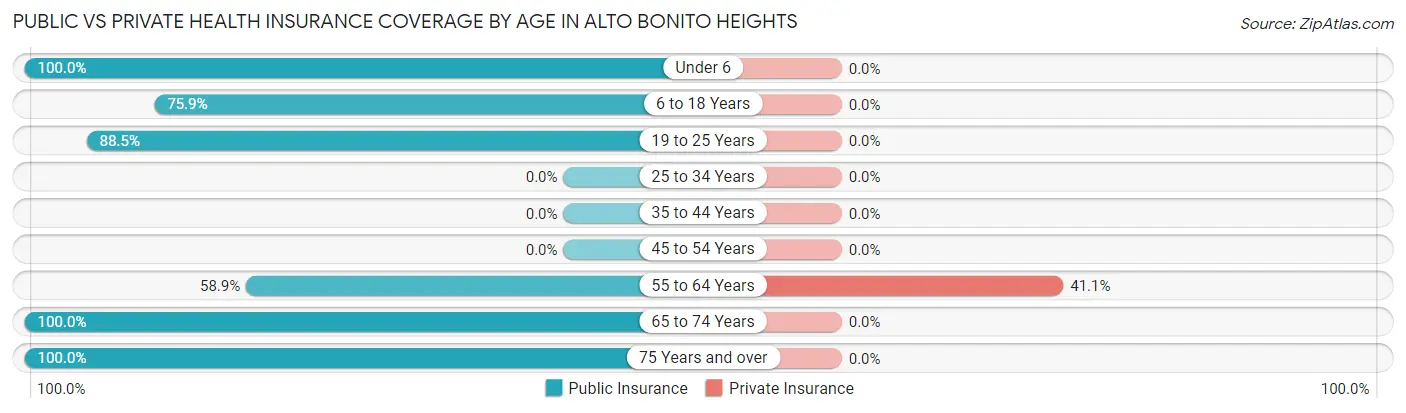
| Age Bracket | Public Insurance | Private Insurance |
| Under 6 | 185 (100.0%) | 0 (0.0%) |
| 6 to 18 Years | 41 (75.9%) | 0 (0.0%) |
| 19 to 25 Years | 100 (88.5%) | 0 (0.0%) |
| 25 to 34 Years | 0 (0.0%) | 0 (0.0%) |
| 35 to 44 Years | 0 (0.0%) | 0 (0.0%) |
| 45 to 54 Years | 0 (0.0%) | 0 (0.0%) |
| 55 to 64 Years | 53 (58.9%) | 37 (41.1%) |
| 65 to 74 Years | 22 (100.0%) | 0 (0.0%) |
| 75 Years and over | 122 (100.0%) | 0 (0.0%) |
| Total | 523 (72.0%) | 37 (5.1%) |
Disability Status by Sex by Age in Alto Bonito Heights
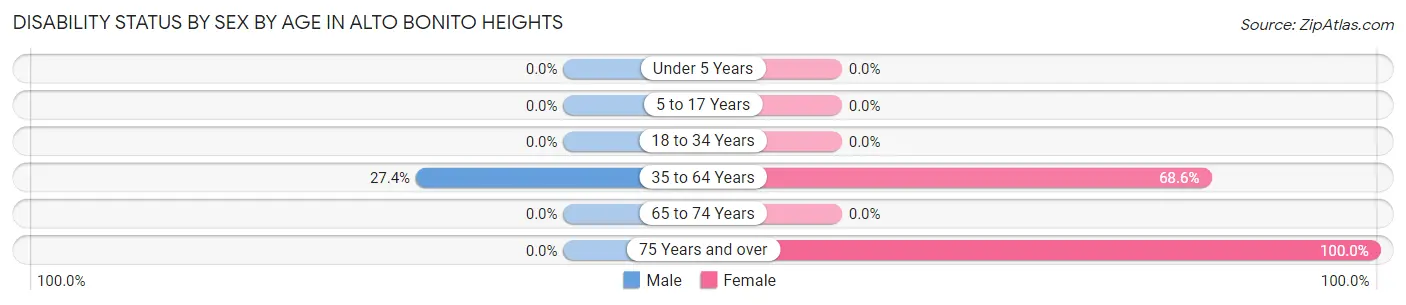
| Age Bracket | Male | Female |
| Under 5 Years | 0 (0.0%) | 0 (0.0%) |
| 5 to 17 Years | 0 (0.0%) | 0 (0.0%) |
| 18 to 34 Years | 0 (0.0%) | 0 (0.0%) |
| 35 to 64 Years | 29 (27.4%) | 24 (68.6%) |
| 65 to 74 Years | 0 (0.0%) | 0 (0.0%) |
| 75 Years and over | 0 (0.0%) | 29 (100.0%) |
Disability Class by Sex by Age in Alto Bonito Heights
Disability Class: Hearing Difficulty

| Age Bracket | Male | Female |
| Under 5 Years | 0 (0.0%) | 0 (0.0%) |
| 5 to 17 Years | 0 (0.0%) | 0 (0.0%) |
| 18 to 34 Years | 0 (0.0%) | 0 (0.0%) |
| 35 to 64 Years | 0 (0.0%) | 24 (68.6%) |
| 65 to 74 Years | 0 (0.0%) | 0 (0.0%) |
| 75 Years and over | 0 (0.0%) | 29 (100.0%) |
Disability Class: Vision Difficulty
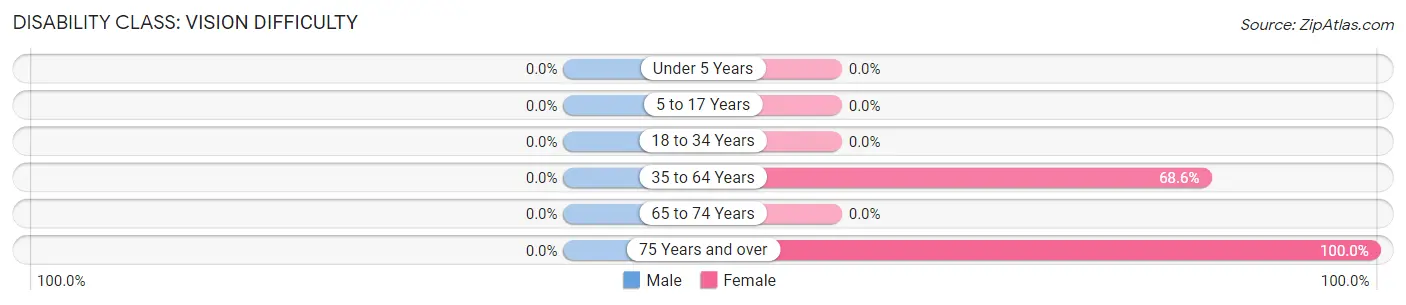
| Age Bracket | Male | Female |
| Under 5 Years | 0 (0.0%) | 0 (0.0%) |
| 5 to 17 Years | 0 (0.0%) | 0 (0.0%) |
| 18 to 34 Years | 0 (0.0%) | 0 (0.0%) |
| 35 to 64 Years | 0 (0.0%) | 24 (68.6%) |
| 65 to 74 Years | 0 (0.0%) | 0 (0.0%) |
| 75 Years and over | 0 (0.0%) | 29 (100.0%) |
Disability Class: Cognitive Difficulty
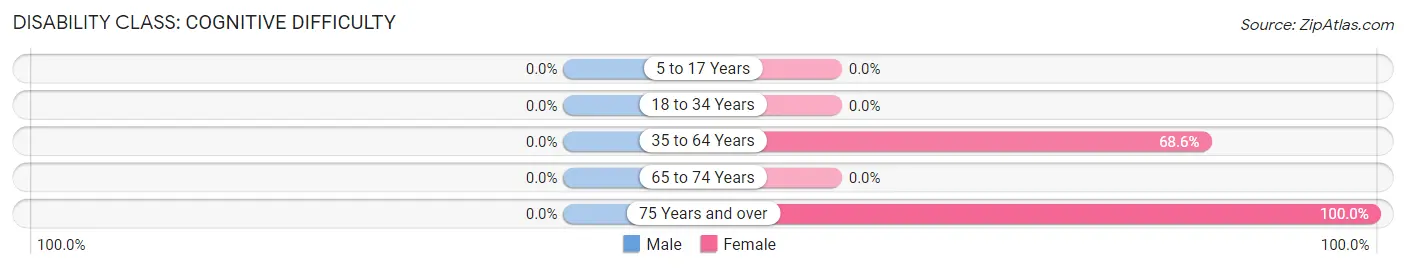
| Age Bracket | Male | Female |
| 5 to 17 Years | 0 (0.0%) | 0 (0.0%) |
| 18 to 34 Years | 0 (0.0%) | 0 (0.0%) |
| 35 to 64 Years | 0 (0.0%) | 24 (68.6%) |
| 65 to 74 Years | 0 (0.0%) | 0 (0.0%) |
| 75 Years and over | 0 (0.0%) | 29 (100.0%) |
Disability Class: Ambulatory Difficulty
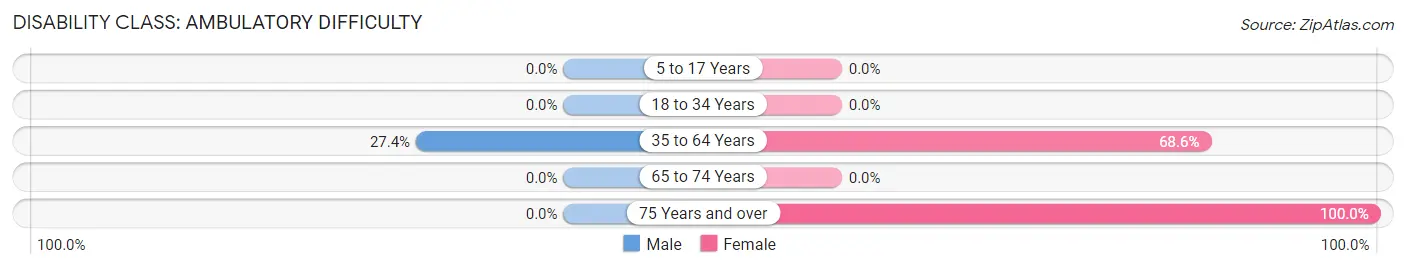
| Age Bracket | Male | Female |
| 5 to 17 Years | 0 (0.0%) | 0 (0.0%) |
| 18 to 34 Years | 0 (0.0%) | 0 (0.0%) |
| 35 to 64 Years | 29 (27.4%) | 24 (68.6%) |
| 65 to 74 Years | 0 (0.0%) | 0 (0.0%) |
| 75 Years and over | 0 (0.0%) | 29 (100.0%) |
Disability Class: Self-Care Difficulty
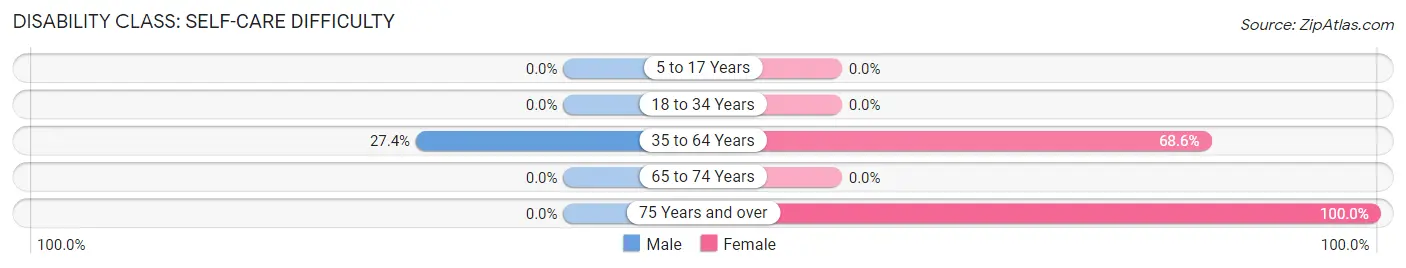
| Age Bracket | Male | Female |
| 5 to 17 Years | 0 (0.0%) | 0 (0.0%) |
| 18 to 34 Years | 0 (0.0%) | 0 (0.0%) |
| 35 to 64 Years | 29 (27.4%) | 24 (68.6%) |
| 65 to 74 Years | 0 (0.0%) | 0 (0.0%) |
| 75 Years and over | 0 (0.0%) | 29 (100.0%) |
Technology Access in Alto Bonito Heights
Computing Device Access in Alto Bonito Heights
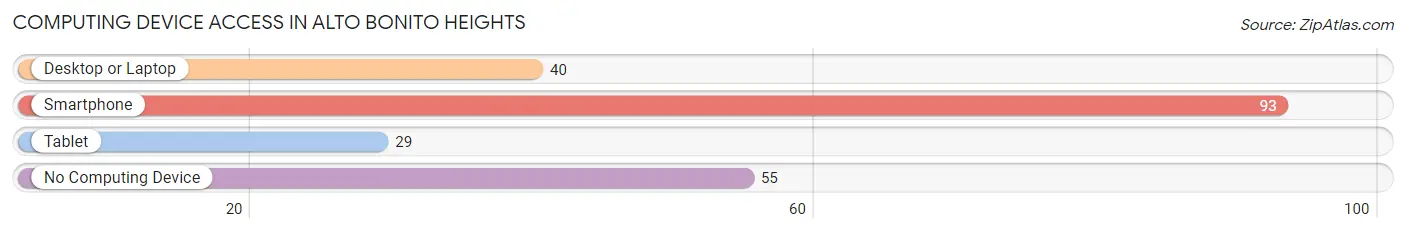
| Device Type | # Households | % Households |
| Desktop or Laptop | 40 | 27.0% |
| Smartphone | 93 | 62.8% |
| Tablet | 29 | 19.6% |
| No Computing Device | 55 | 37.2% |
| Total | 148 | 100.0% |
Internet Access in Alto Bonito Heights
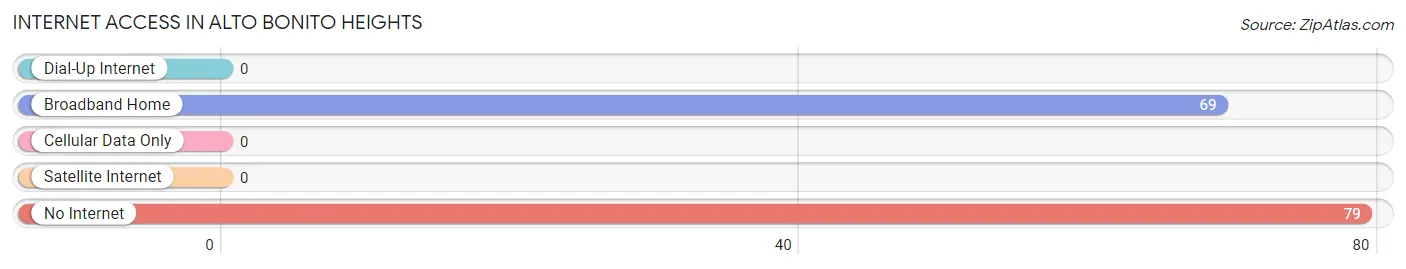
| Internet Type | # Households | % Households |
| Dial-Up Internet | 0 | 0.0% |
| Broadband Home | 69 | 46.6% |
| Cellular Data Only | 0 | 0.0% |
| Satellite Internet | 0 | 0.0% |
| No Internet | 79 | 53.4% |
| Total | 148 | 100.0% |
Alto Bonito Heights Summary
Alto Bonito Heights is a small city located in the state of Texas, United States. It is situated in the Rio Grande Valley, in the southernmost part of the state. The city is located in Hidalgo County, and is part of the McAllen–Edinburg–Mission Metropolitan Statistical Area. As of the 2010 census, the population of Alto Bonito Heights was 8,945.
History
Alto Bonito Heights was founded in the late 19th century by a group of Mexican settlers. The city was originally known as “El Alto Bonito”, which translates to “The Beautiful High”. The settlers were attracted to the area due to its fertile soil and abundant water supply. The city was officially incorporated in 1909.
In the early 20th century, Alto Bonito Heights was a thriving agricultural community. The city was known for its production of cotton, corn, and other crops. The city also had a thriving dairy industry.
In the 1950s, the city began to experience a population boom due to the influx of Mexican immigrants. This influx of immigrants led to the development of a vibrant Mexican-American culture in the city.
Geography
Alto Bonito Heights is located in the Rio Grande Valley, in the southernmost part of Texas. The city is situated in Hidalgo County, and is part of the McAllen–Edinburg–Mission Metropolitan Statistical Area. The city is located at an elevation of approximately 200 feet (61 meters).
The city has a total area of 2.3 square miles (6.0 km2), all of which is land. The city is located near the Rio Grande River, and is bordered by the cities of McAllen, Edinburg, and Mission.
Economy
Alto Bonito Heights is a primarily agricultural city. The city is known for its production of cotton, corn, and other crops. The city also has a thriving dairy industry.
In recent years, the city has seen an influx of new businesses. These businesses include restaurants, retail stores, and other service-oriented businesses. The city is also home to several manufacturing plants.
Demographics
As of the 2010 census, the population of Alto Bonito Heights was 8,945. The racial makeup of the city was 79.3% Hispanic or Latino, 16.2% White, 1.2% African American, 0.7% Native American, 0.3% Asian, and 2.5% from other races.
The median household income in the city was $25,945, and the median family income was $30,945. The per capita income in the city was $13,945. Approximately 24.3% of the population was below the poverty line.
Conclusion
Alto Bonito Heights is a small city located in the Rio Grande Valley of Texas. The city was founded in the late 19th century by a group of Mexican settlers, and was officially incorporated in 1909. The city is known for its production of cotton, corn, and other crops, as well as its thriving dairy industry. As of the 2010 census, the population of Alto Bonito Heights was 8,945. The city has a primarily agricultural economy, and has seen an influx of new businesses in recent years. The racial makeup of the city is 79.3% Hispanic or Latino, 16.2% White, 1.2% African American, 0.7% Native American, 0.3% Asian, and 2.5% from other races. The median household income in the city was $25,945, and the median family income was $30,945. Approximately 24.3% of the population was below the poverty line.
Common Questions
What is Per Capita Income in Alto Bonito Heights?
Per Capita income in Alto Bonito Heights is $9,116.
What is Inequality or Gini Index in Alto Bonito Heights?
Inequality or Gini Index in Alto Bonito Heights is 0.42.
What is the Total Population of Alto Bonito Heights?
Total Population of Alto Bonito Heights is 726.
What is the Total Male Population of Alto Bonito Heights?
Total Male Population of Alto Bonito Heights is 337.
What is the Total Female Population of Alto Bonito Heights?
Total Female Population of Alto Bonito Heights is 389.
What is the Ratio of Males per 100 Females in Alto Bonito Heights?
There are 86.63 Males per 100 Females in Alto Bonito Heights.
What is the Ratio of Females per 100 Males in Alto Bonito Heights?
There are 115.43 Females per 100 Males in Alto Bonito Heights.
What is the Median Population Age in Alto Bonito Heights?
Median Population Age in Alto Bonito Heights is 28.2 Years.
What is the Average Family Size in Alto Bonito Heights
Average Family Size in Alto Bonito Heights is 5.9 People.
What is the Average Household Size in Alto Bonito Heights
Average Household Size in Alto Bonito Heights is 4.9 People.
How Large is the Labor Force in Alto Bonito Heights?
There are 215 People in the Labor Forcein in Alto Bonito Heights.
What is the Percentage of People in the Labor Force in Alto Bonito Heights?
44.1% of People are in the Labor Force in Alto Bonito Heights.