East Alto Bonito, TX Map & Demographics
East Alto Bonito Map
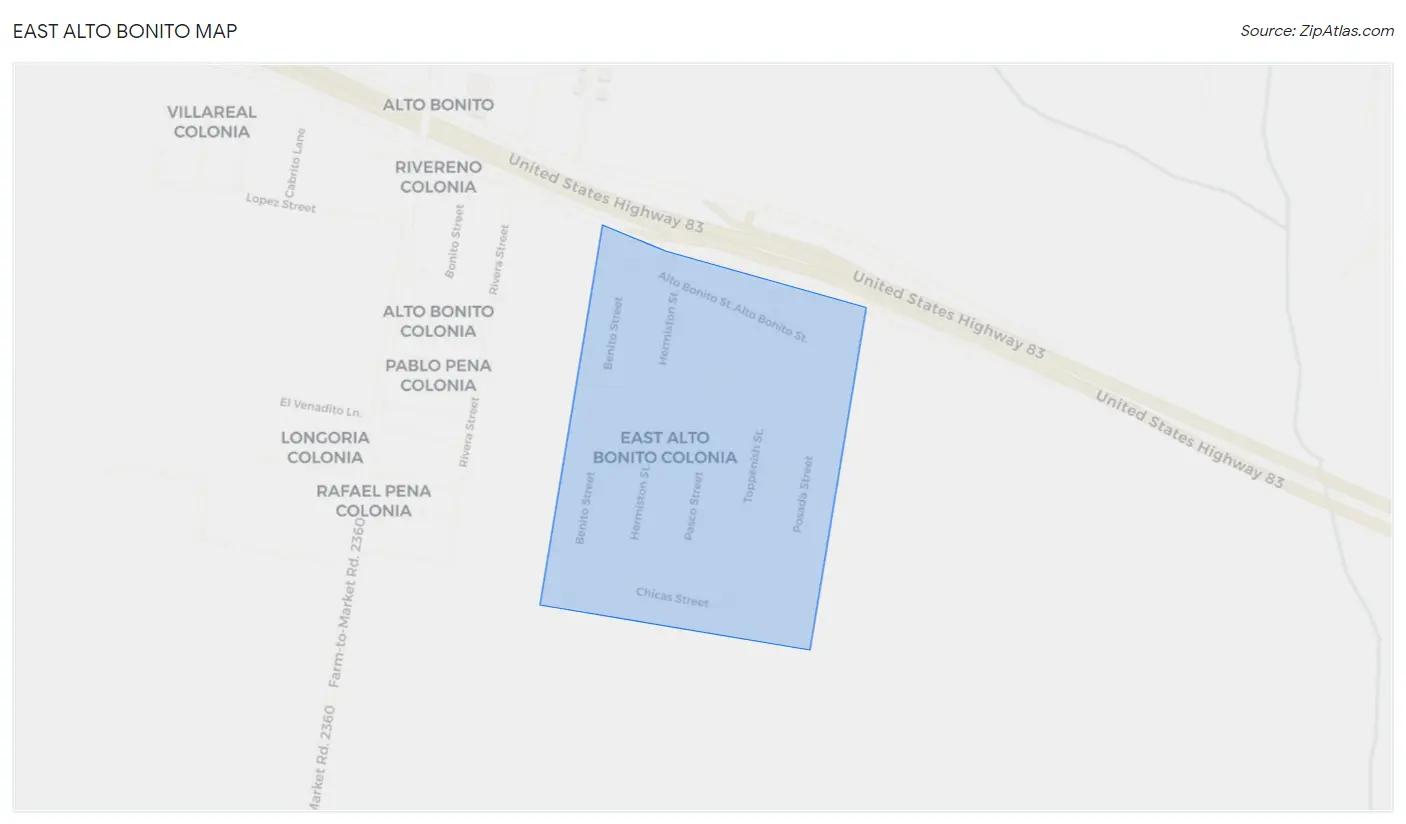
East Alto Bonito Overview
$12,198
PER CAPITA INCOME
$41,000
AVG FAMILY INCOME
$41,000
AVG HOUSEHOLD INCOME
0.31
INEQUALITY / GINI INDEX
522
TOTAL POPULATION
199
MALE POPULATION
323
FEMALE POPULATION
61.61
MALES / 100 FEMALES
162.31
FEMALES / 100 MALES
21.6
MEDIAN AGE
5.0
AVG FAMILY SIZE
5.1
AVG HOUSEHOLD SIZE
278
LABOR FORCE [ PEOPLE ]
63.5%
PERCENT IN LABOR FORCE
Income in East Alto Bonito
Income Overview in East Alto Bonito
Per Capita Income in East Alto Bonito is $12,198, while median incomes of families and households are $41,000 and $41,000 respectively.
| Characteristic | Number | Measure |
| Per Capita Income | 522 | $12,198 |
| Median Family Income | 102 | $41,000 |
| Mean Family Income | 102 | $50,542 |
| Median Household Income | 102 | $41,000 |
| Mean Household Income | 102 | $50,542 |
| Income Deficit | 102 | $0 |
| Wage / Income Gap (%) | 522 | 0.00% |
| Wage / Income Gap ($) | 522 | 100.00¢ per $1 |
| Gini / Inequality Index | 522 | 0.31 |
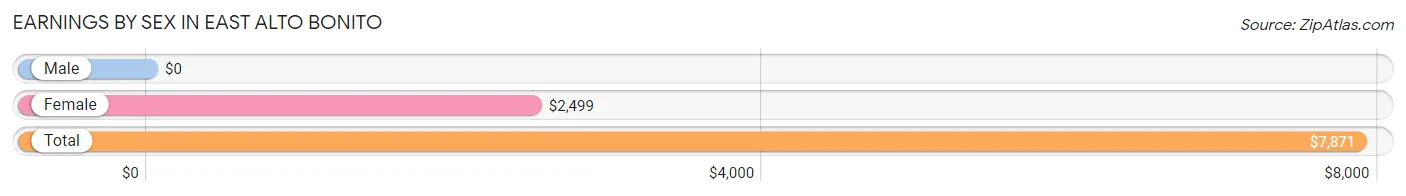
Earnings by Sex in East Alto Bonito
| Sex | Number | Average Earnings |
| Male | 168 (48.4%) | $0 |
| Female | 179 (51.6%) | $2,499 |
| Total | 347 (100.0%) | $7,871 |
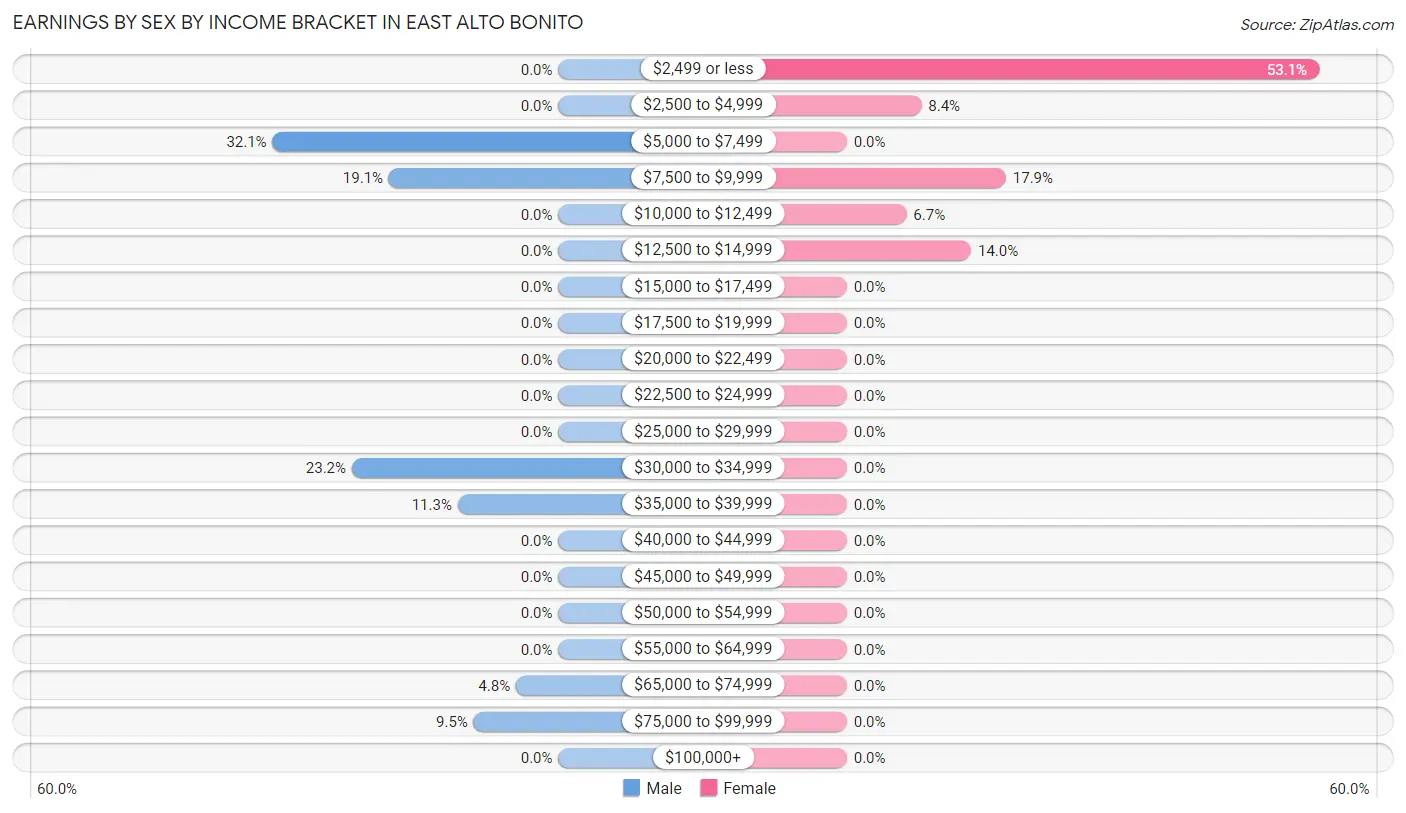
Earnings by Sex by Income Bracket in East Alto Bonito
The most common earnings brackets in East Alto Bonito are $5,000 to $7,499 for men (54 | 32.1%) and $2,499 or less for women (95 | 53.1%).
| Income | Male | Female |
| $2,499 or less | 0 (0.0%) | 95 (53.1%) |
| $2,500 to $4,999 | 0 (0.0%) | 15 (8.4%) |
| $5,000 to $7,499 | 54 (32.1%) | 0 (0.0%) |
| $7,500 to $9,999 | 32 (19.1%) | 32 (17.9%) |
| $10,000 to $12,499 | 0 (0.0%) | 12 (6.7%) |
| $12,500 to $14,999 | 0 (0.0%) | 25 (14.0%) |
| $15,000 to $17,499 | 0 (0.0%) | 0 (0.0%) |
| $17,500 to $19,999 | 0 (0.0%) | 0 (0.0%) |
| $20,000 to $22,499 | 0 (0.0%) | 0 (0.0%) |
| $22,500 to $24,999 | 0 (0.0%) | 0 (0.0%) |
| $25,000 to $29,999 | 0 (0.0%) | 0 (0.0%) |
| $30,000 to $34,999 | 39 (23.2%) | 0 (0.0%) |
| $35,000 to $39,999 | 19 (11.3%) | 0 (0.0%) |
| $40,000 to $44,999 | 0 (0.0%) | 0 (0.0%) |
| $45,000 to $49,999 | 0 (0.0%) | 0 (0.0%) |
| $50,000 to $54,999 | 0 (0.0%) | 0 (0.0%) |
| $55,000 to $64,999 | 0 (0.0%) | 0 (0.0%) |
| $65,000 to $74,999 | 8 (4.8%) | 0 (0.0%) |
| $75,000 to $99,999 | 16 (9.5%) | 0 (0.0%) |
| $100,000+ | 0 (0.0%) | 0 (0.0%) |
| Total | 168 (100.0%) | 179 (100.0%) |
Earnings by Sex by Educational Attainment in East Alto Bonito
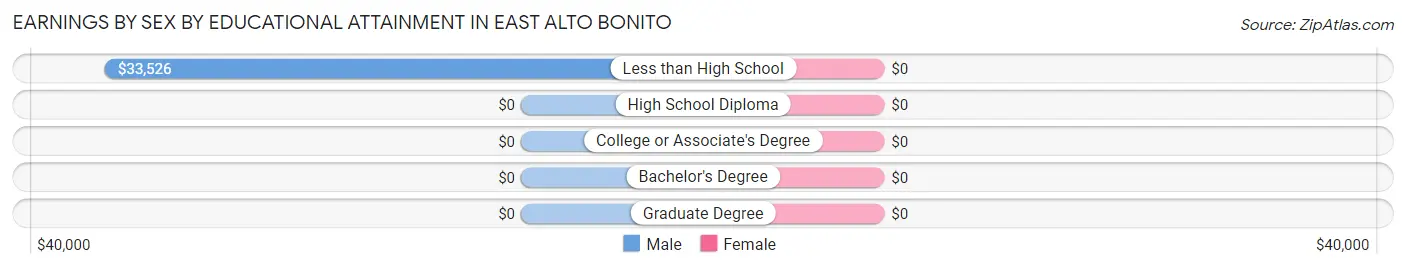
| Educational Attainment | Male Income | Female Income |
| Less than High School | $33,526 | $0 |
| High School Diploma | - | - |
| College or Associate's Degree | - | - |
| Bachelor's Degree | - | - |
| Graduate Degree | - | - |
| Total | $34,647 | $0 |
Family Income in East Alto Bonito
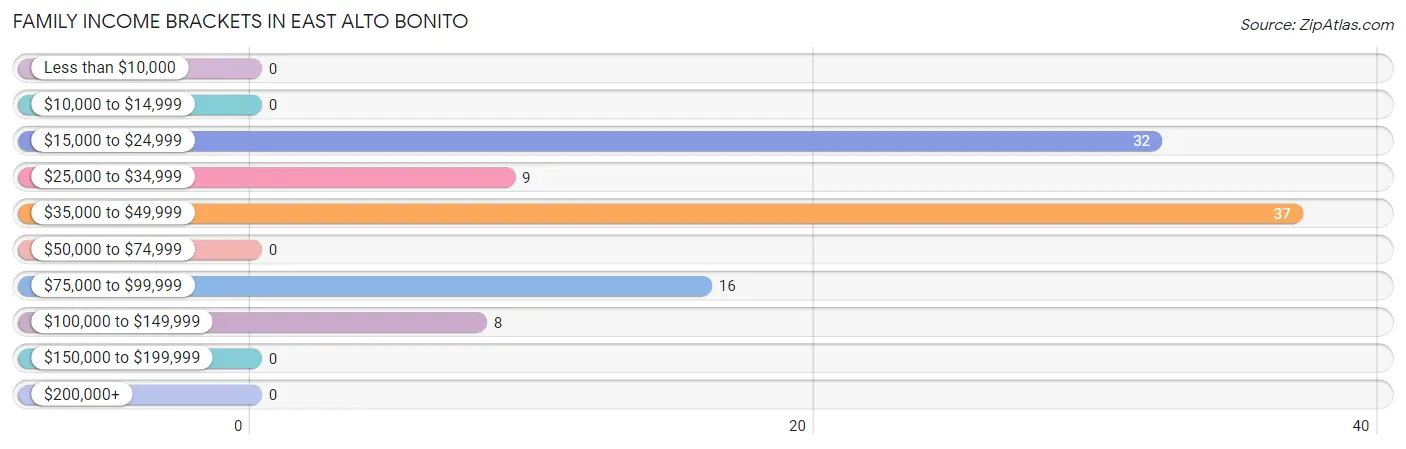
Family Income Brackets in East Alto Bonito
According to the East Alto Bonito family income data, there are 37 families falling into the $35,000 to $49,999 income range, which is the most common income bracket and makes up 36.3% of all families.
| Income Bracket | # Families | % Families |
| Less than $10,000 | 0 | 0.0% |
| $10,000 to $14,999 | 0 | 0.0% |
| $15,000 to $24,999 | 32 | 31.4% |
| $25,000 to $34,999 | 9 | 8.8% |
| $35,000 to $49,999 | 37 | 36.3% |
| $50,000 to $74,999 | 0 | 0.0% |
| $75,000 to $99,999 | 16 | 15.7% |
| $100,000 to $149,999 | 8 | 7.8% |
| $150,000 to $199,999 | 0 | 0.0% |
| $200,000+ | 0 | 0.0% |
Family Income by Famaliy Size in East Alto Bonito
| Income Bracket | # Families | Median Income |
| 2-Person Families | 37 (36.3%) | $0 |
| 3-Person Families | 0 (0.0%) | $0 |
| 4-Person Families | 56 (54.9%) | $0 |
| 5-Person Families | 0 (0.0%) | $0 |
| 6-Person Families | 0 (0.0%) | $0 |
| 7+ Person Families | 9 (8.8%) | $0 |
| Total | 102 (100.0%) | $41,000 |
Family Income by Number of Earners in East Alto Bonito
| Number of Earners | # Families | Median Income |
| No Earners | 0 (0.0%) | $0 |
| 1 Earner | 0 (0.0%) | $0 |
| 2 Earners | 62 (60.8%) | $0 |
| 3+ Earners | 40 (39.2%) | $0 |
| Total | 102 (100.0%) | $41,000 |
Household Income in East Alto Bonito
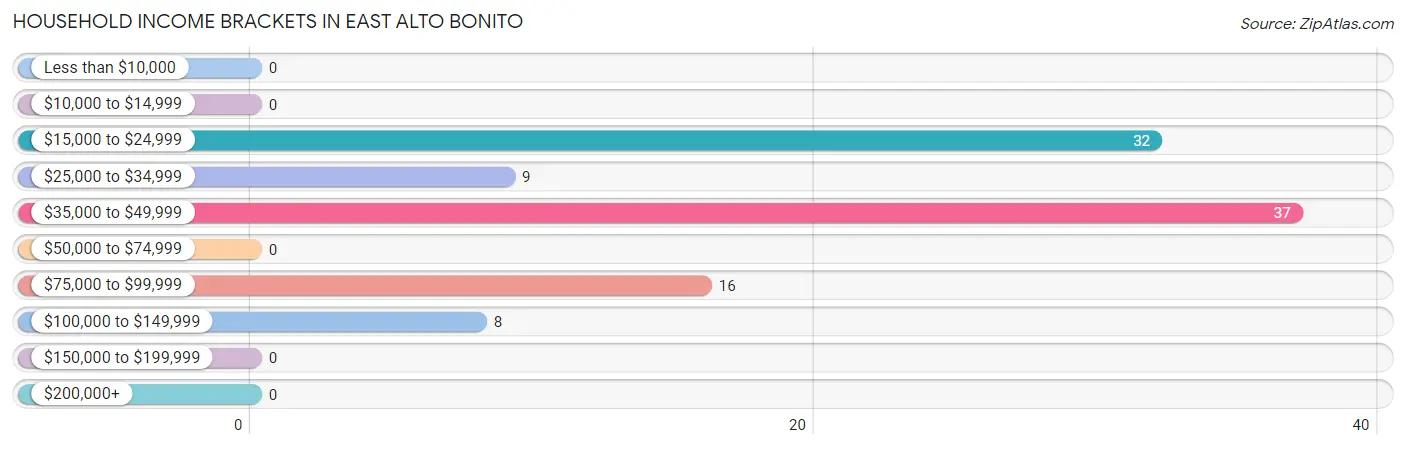
Household Income Brackets in East Alto Bonito
With 37 households falling in the category, the $35,000 to $49,999 income range is the most frequent in East Alto Bonito, accounting for 36.3% of all households.
| Income Bracket | # Households | % Households |
| Less than $10,000 | 0 | 0.0% |
| $10,000 to $14,999 | 0 | 0.0% |
| $15,000 to $24,999 | 32 | 31.4% |
| $25,000 to $34,999 | 9 | 8.8% |
| $35,000 to $49,999 | 37 | 36.3% |
| $50,000 to $74,999 | 0 | 0.0% |
| $75,000 to $99,999 | 16 | 15.7% |
| $100,000 to $149,999 | 8 | 7.8% |
| $150,000 to $199,999 | 0 | 0.0% |
| $200,000+ | 0 | 0.0% |
Household Income by Householder Age in East Alto Bonito
The median household income in East Alto Bonito is $41,000, with the highest median household income of $41,800 found in the 45 to 64 years age bracket for the primary householder. A total of 54 households (52.9%) fall into this category.
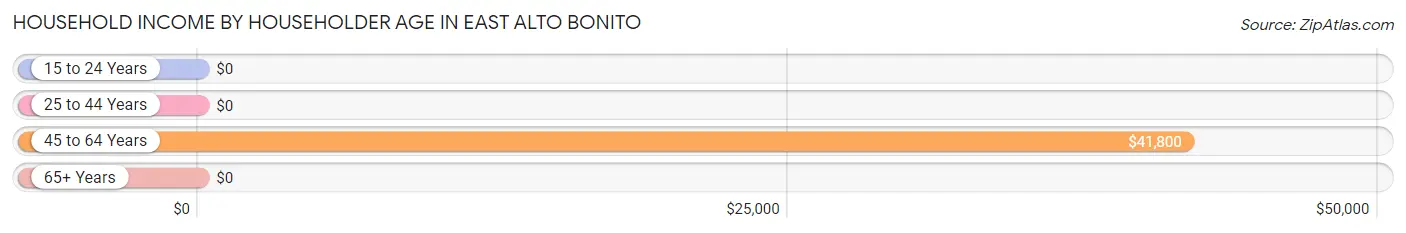
| Income Bracket | # Households | Median Income |
| 15 to 24 Years | 0 (0.0%) | $0 |
| 25 to 44 Years | 48 (47.1%) | $0 |
| 45 to 64 Years | 54 (52.9%) | $41,800 |
| 65+ Years | 0 (0.0%) | $0 |
| Total | 102 (100.0%) | $41,000 |
Poverty in East Alto Bonito
Income Below Poverty by Sex and Age in East Alto Bonito
With 23.1% poverty level for males and 72.8% for females among the residents of East Alto Bonito, under 5 year old males and under 5 year old females are the most vulnerable to poverty, with 17 males (100.0%) and 16 females (100.0%) in their respective age groups living below the poverty level.
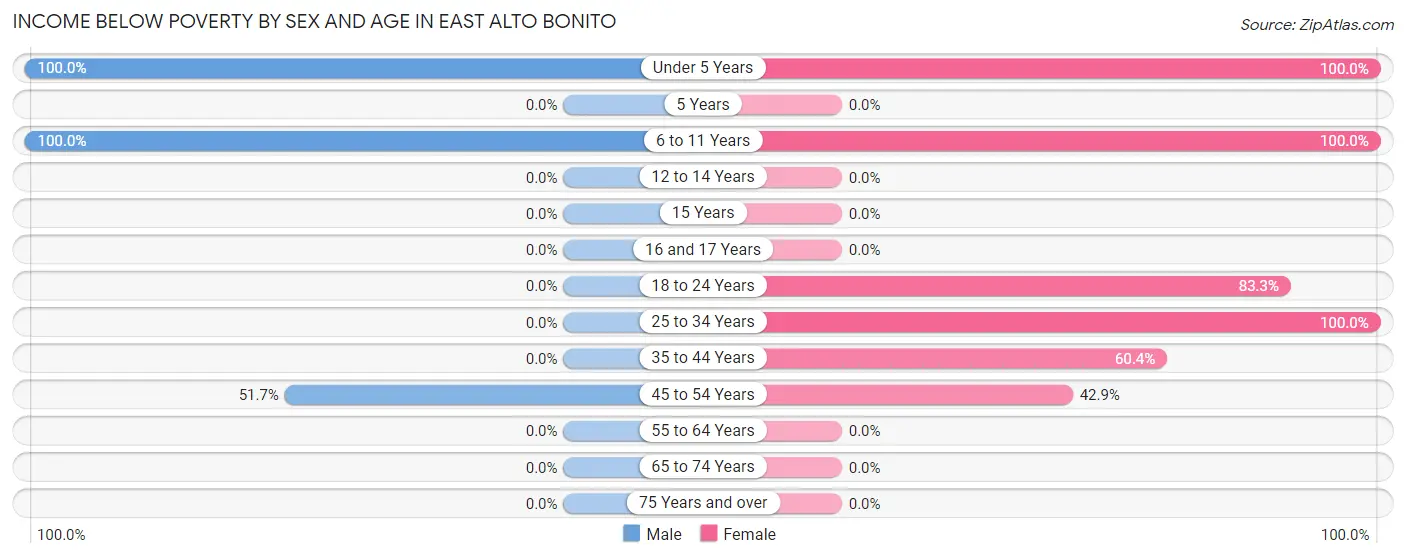
| Age Bracket | Male | Female |
| Under 5 Years | 17 (100.0%) | 16 (100.0%) |
| 5 Years | 0 (0.0%) | 0 (0.0%) |
| 6 to 11 Years | 14 (100.0%) | 37 (100.0%) |
| 12 to 14 Years | 0 (0.0%) | 0 (0.0%) |
| 15 Years | 0 (0.0%) | 0 (0.0%) |
| 16 and 17 Years | 0 (0.0%) | 0 (0.0%) |
| 18 to 24 Years | 0 (0.0%) | 125 (83.3%) |
| 25 to 34 Years | 0 (0.0%) | 16 (100.0%) |
| 35 to 44 Years | 0 (0.0%) | 32 (60.4%) |
| 45 to 54 Years | 15 (51.7%) | 9 (42.9%) |
| 55 to 64 Years | 0 (0.0%) | 0 (0.0%) |
| 65 to 74 Years | 0 (0.0%) | 0 (0.0%) |
| 75 Years and over | 0 (0.0%) | 0 (0.0%) |
| Total | 46 (23.1%) | 235 (72.8%) |
Income Above Poverty by Sex and Age in East Alto Bonito
According to the poverty statistics in East Alto Bonito, males aged 18 to 24 years and females aged 16 and 17 years are the age groups that are most secure financially, with 100.0% of males and 100.0% of females in these age groups living above the poverty line.
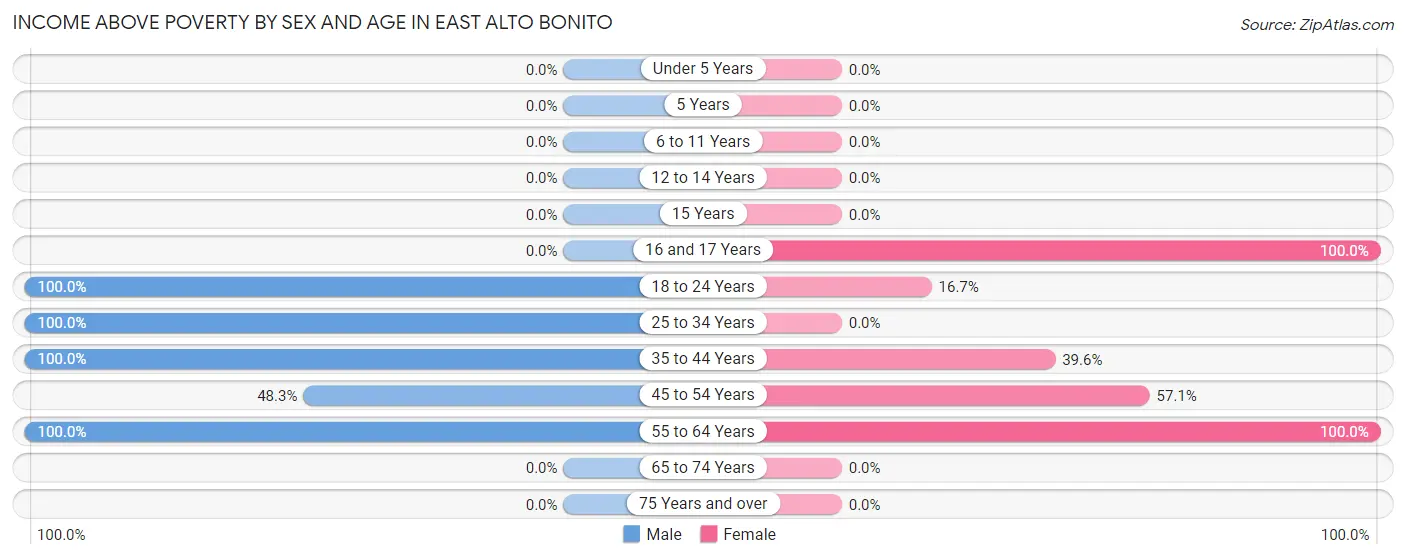
| Age Bracket | Male | Female |
| Under 5 Years | 0 (0.0%) | 0 (0.0%) |
| 5 Years | 0 (0.0%) | 0 (0.0%) |
| 6 to 11 Years | 0 (0.0%) | 0 (0.0%) |
| 12 to 14 Years | 0 (0.0%) | 0 (0.0%) |
| 15 Years | 0 (0.0%) | 0 (0.0%) |
| 16 and 17 Years | 0 (0.0%) | 23 (100.0%) |
| 18 to 24 Years | 71 (100.0%) | 25 (16.7%) |
| 25 to 34 Years | 19 (100.0%) | 0 (0.0%) |
| 35 to 44 Years | 16 (100.0%) | 21 (39.6%) |
| 45 to 54 Years | 14 (48.3%) | 12 (57.1%) |
| 55 to 64 Years | 33 (100.0%) | 7 (100.0%) |
| 65 to 74 Years | 0 (0.0%) | 0 (0.0%) |
| 75 Years and over | 0 (0.0%) | 0 (0.0%) |
| Total | 153 (76.9%) | 88 (27.2%) |
Income Below Poverty Among Married-Couple Families in East Alto Bonito
The poverty statistics for married-couple families in East Alto Bonito show that 20.0% or 9 of the total 45 families live below the poverty line. Families with 3 or 4 children have the highest poverty rate of 100.0%, comprising of 9 families. On the other hand, families with no children have the lowest poverty rate of 0.0%, which includes 0 families.
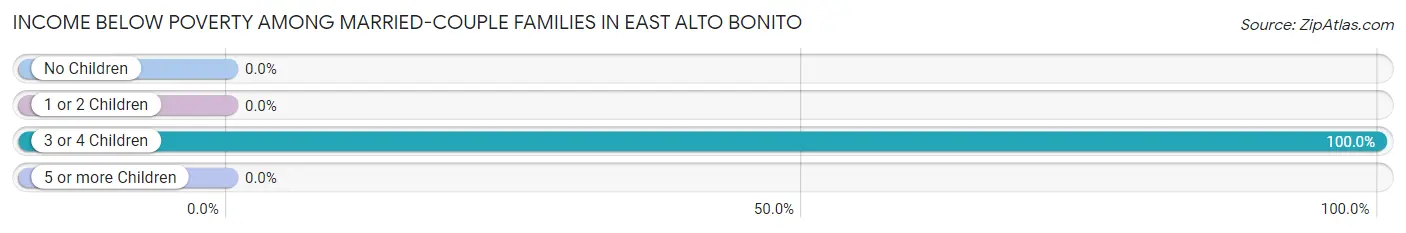
| Children | Above Poverty | Below Poverty |
| No Children | 20 (100.0%) | 0 (0.0%) |
| 1 or 2 Children | 16 (100.0%) | 0 (0.0%) |
| 3 or 4 Children | 0 (0.0%) | 9 (100.0%) |
| 5 or more Children | 0 (0.0%) | 0 (0.0%) |
| Total | 36 (80.0%) | 9 (20.0%) |
Income Below Poverty Among Single-Parent Households in East Alto Bonito
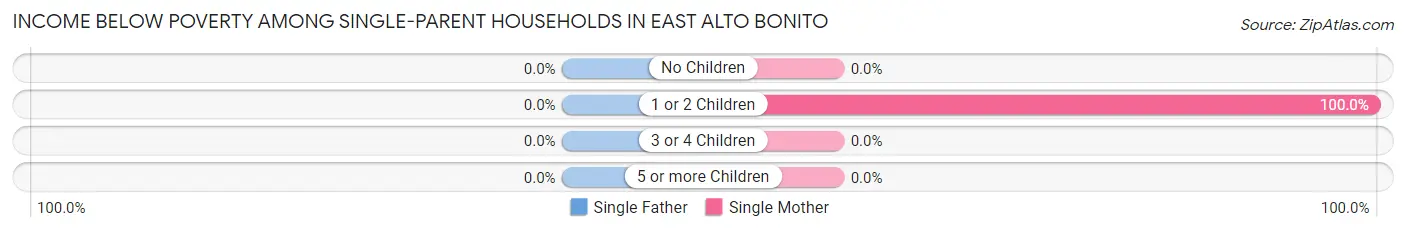
| Children | Single Father | Single Mother |
| No Children | 0 (0.0%) | 0 (0.0%) |
| 1 or 2 Children | 0 (0.0%) | 32 (100.0%) |
| 3 or 4 Children | 0 (0.0%) | 0 (0.0%) |
| 5 or more Children | 0 (0.0%) | 0 (0.0%) |
| Total | 0 (0.0%) | 32 (100.0%) |
Income Below Poverty Among Married-Couple vs Single-Parent Households in East Alto Bonito
The poverty data for East Alto Bonito shows that 9 of the married-couple family households (20.0%) and 32 of the single-parent households (56.1%) are living below the poverty level. Within the married-couple family households, those with 3 or 4 children have the highest poverty rate, with 9 households (100.0%) falling below the poverty line. Among the single-parent households, those with 1 or 2 children have the highest poverty rate, with 32 household (100.0%) living below poverty.
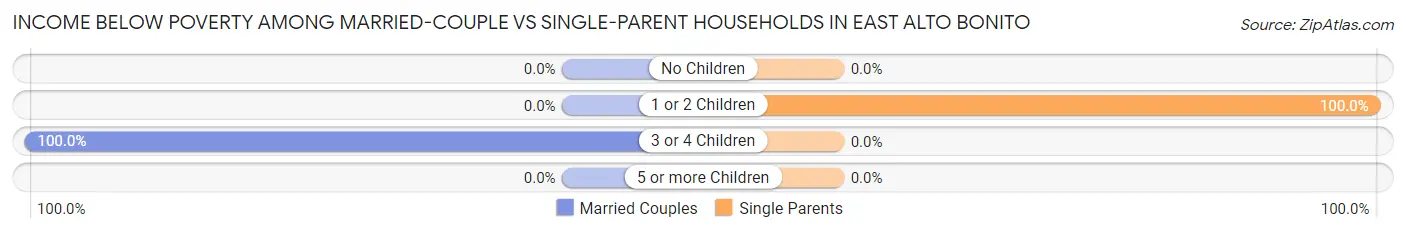
| Children | Married-Couple Families | Single-Parent Households |
| No Children | 0 (0.0%) | 0 (0.0%) |
| 1 or 2 Children | 0 (0.0%) | 32 (100.0%) |
| 3 or 4 Children | 9 (100.0%) | 0 (0.0%) |
| 5 or more Children | 0 (0.0%) | 0 (0.0%) |
| Total | 9 (20.0%) | 32 (56.1%) |
Race in East Alto Bonito
The most populous races in East Alto Bonito are Hispanic or Latino (522 | 100.0%), White / Caucasian (252 | 48.3%), and Two or more Races (245 | 46.9%).
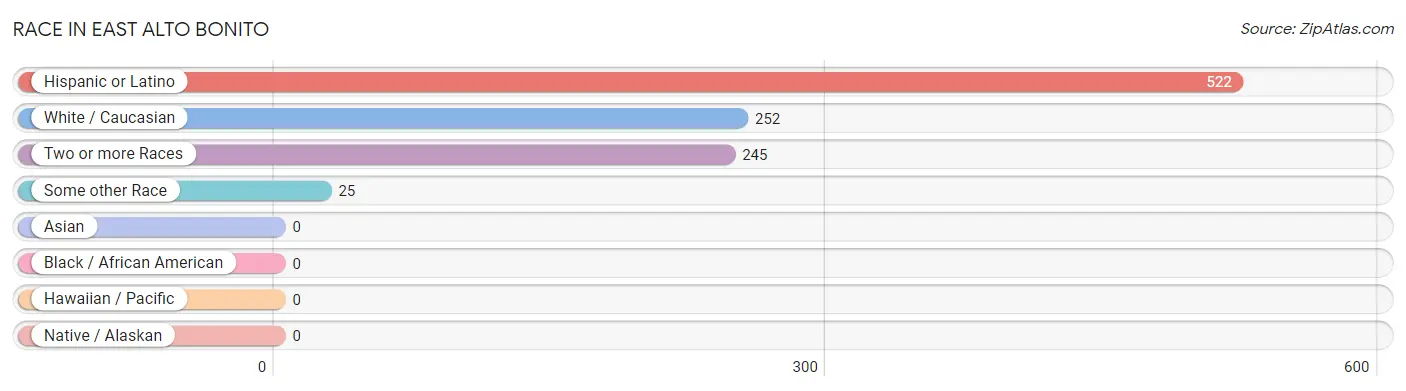
| Race | # Population | % Population |
| Asian | 0 | 0.0% |
| Black / African American | 0 | 0.0% |
| Hawaiian / Pacific | 0 | 0.0% |
| Hispanic or Latino | 522 | 100.0% |
| Native / Alaskan | 0 | 0.0% |
| White / Caucasian | 252 | 48.3% |
| Two or more Races | 245 | 46.9% |
| Some other Race | 25 | 4.8% |
| Total | 522 | 100.0% |
Ancestry in East Alto Bonito
The most populous ancestries reported in East Alto Bonito are , and Mexican (522 | 100.0%), together accounting for 100.0% of all East Alto Bonito residents.

| Ancestry | # Population | % Population |
| Mexican | 522 | 100.0% | View All 1 Rows |
Immigrants in East Alto Bonito
The most numerous immigrant groups reported in East Alto Bonito came from Central America (183 | 35.1%), Latin America (183 | 35.1%), and Mexico (183 | 35.1%), together accounting for 105.2% of all East Alto Bonito residents.
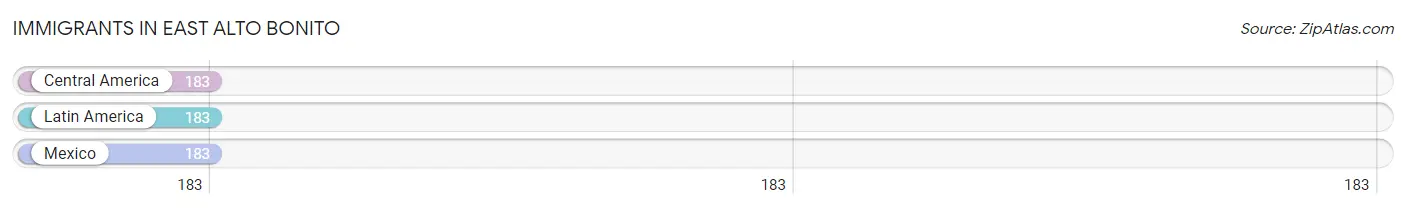
| Immigration Origin | # Population | % Population |
| Central America | 183 | 35.1% |
| Latin America | 183 | 35.1% |
| Mexico | 183 | 35.1% | View All 3 Rows |
Sex and Age in East Alto Bonito
Sex and Age in East Alto Bonito
The most populous age groups in East Alto Bonito are 20 to 24 Years (71 | 35.7%) for men and 15 to 19 Years (98 | 30.3%) for women.
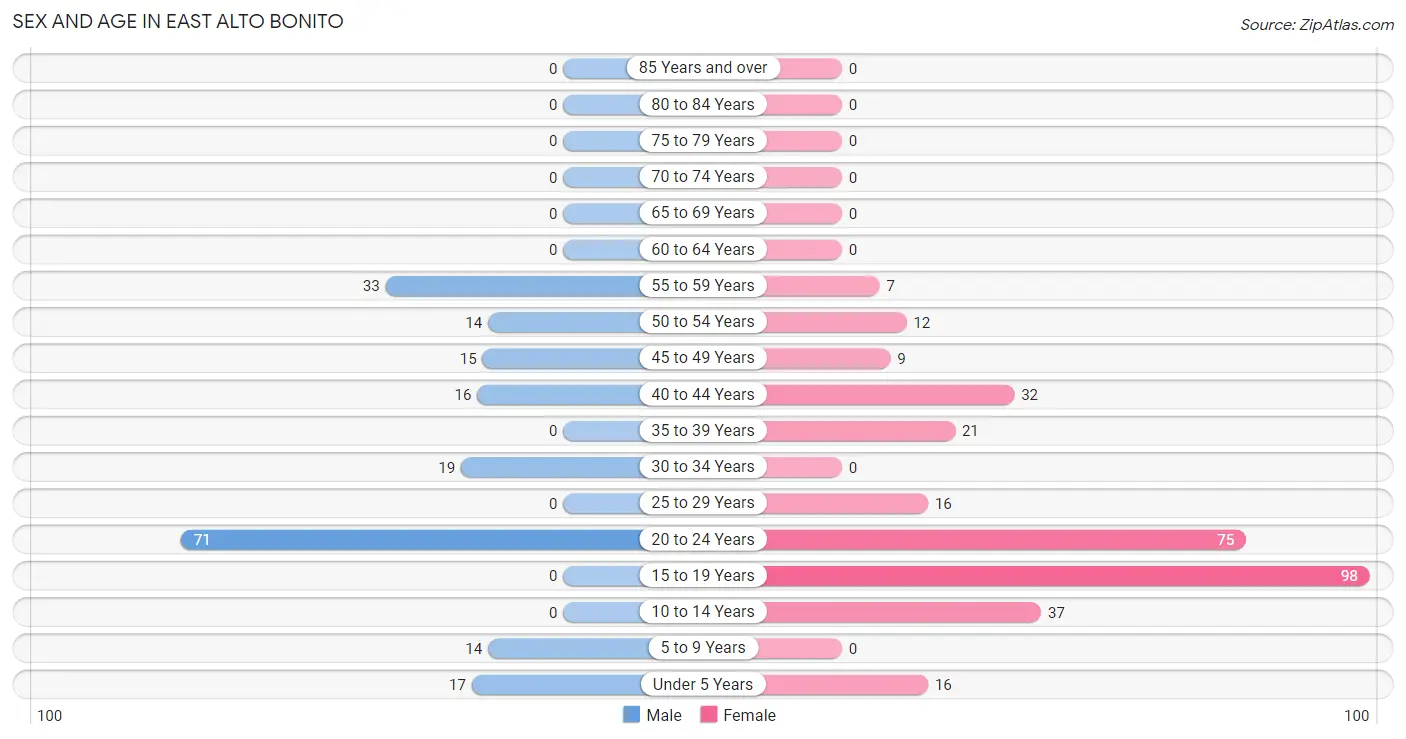
| Age Bracket | Male | Female |
| Under 5 Years | 17 (8.5%) | 16 (5.0%) |
| 5 to 9 Years | 14 (7.0%) | 0 (0.0%) |
| 10 to 14 Years | 0 (0.0%) | 37 (11.5%) |
| 15 to 19 Years | 0 (0.0%) | 98 (30.3%) |
| 20 to 24 Years | 71 (35.7%) | 75 (23.2%) |
| 25 to 29 Years | 0 (0.0%) | 16 (5.0%) |
| 30 to 34 Years | 19 (9.6%) | 0 (0.0%) |
| 35 to 39 Years | 0 (0.0%) | 21 (6.5%) |
| 40 to 44 Years | 16 (8.0%) | 32 (9.9%) |
| 45 to 49 Years | 15 (7.5%) | 9 (2.8%) |
| 50 to 54 Years | 14 (7.0%) | 12 (3.7%) |
| 55 to 59 Years | 33 (16.6%) | 7 (2.2%) |
| 60 to 64 Years | 0 (0.0%) | 0 (0.0%) |
| 65 to 69 Years | 0 (0.0%) | 0 (0.0%) |
| 70 to 74 Years | 0 (0.0%) | 0 (0.0%) |
| 75 to 79 Years | 0 (0.0%) | 0 (0.0%) |
| 80 to 84 Years | 0 (0.0%) | 0 (0.0%) |
| 85 Years and over | 0 (0.0%) | 0 (0.0%) |
| Total | 199 (100.0%) | 323 (100.0%) |
Families and Households in East Alto Bonito
Median Family Size in East Alto Bonito
The median family size in East Alto Bonito is 4.97 persons per family, with married-couple families (45 | 44.1%) accounting for the largest median family size of 5.87 persons per family. On the other hand, single male/father families (25 | 24.5%) represent the smallest median family size with 3.16 persons per family.
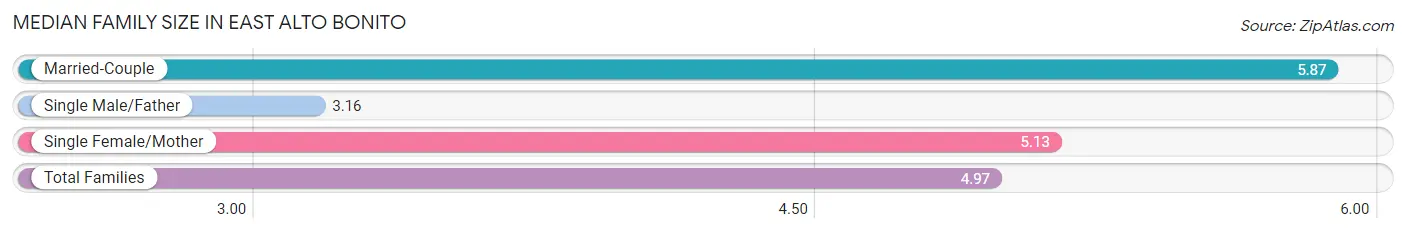
| Family Type | # Families | Family Size |
| Married-Couple | 45 (44.1%) | 5.87 |
| Single Male/Father | 25 (24.5%) | 3.16 |
| Single Female/Mother | 32 (31.4%) | 5.13 |
| Total Families | 102 (100.0%) | 4.97 |
Median Household Size in East Alto Bonito
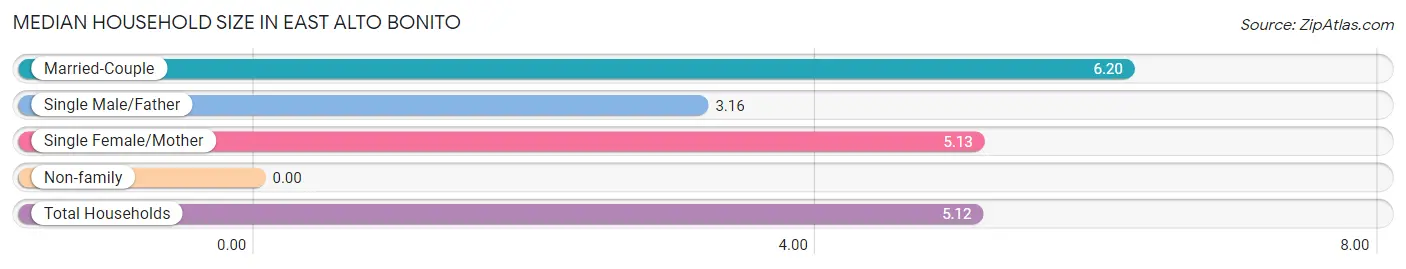
| Household Type | # Households | Household Size |
| Married-Couple | 45 (44.1%) | 6.20 |
| Single Male/Father | 25 (24.5%) | 3.16 |
| Single Female/Mother | 32 (31.4%) | 5.13 |
| Non-family | 0 (0.0%) | - |
| Total Households | 102 (100.0%) | 5.12 |
Household Size by Marriage Status in East Alto Bonito
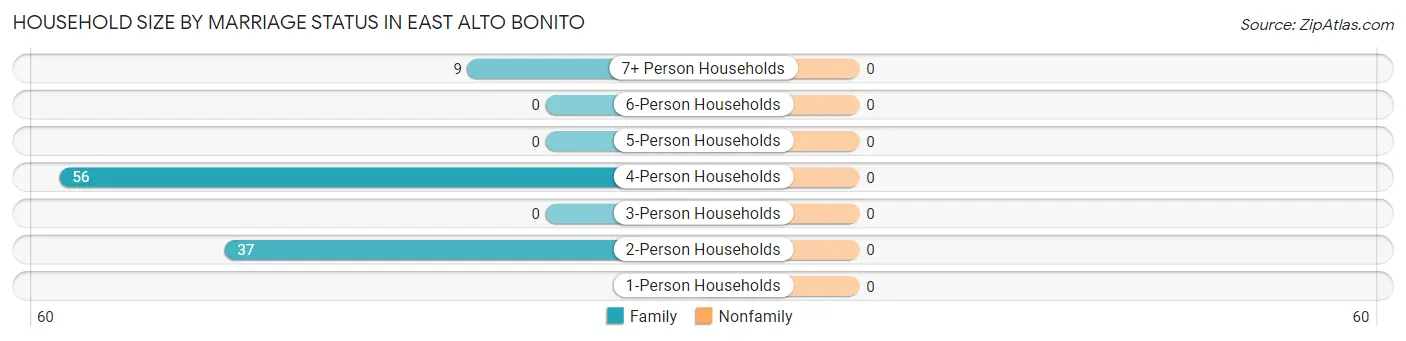
| Household Size | Family Households | Nonfamily Households |
| 1-Person Households | - | 0 (0.0%) |
| 2-Person Households | 37 (36.3%) | 0 (0.0%) |
| 3-Person Households | 0 (0.0%) | 0 (0.0%) |
| 4-Person Households | 56 (54.9%) | 0 (0.0%) |
| 5-Person Households | 0 (0.0%) | 0 (0.0%) |
| 6-Person Households | 0 (0.0%) | 0 (0.0%) |
| 7+ Person Households | 9 (8.8%) | 0 (0.0%) |
| Total | 102 (100.0%) | 0 (0.0%) |
Female Fertility in East Alto Bonito
Fertility by Age in East Alto Bonito
| Age Bracket | Women with Births | Births / 1,000 Women |
| 15 to 19 years | 0 (0.0%) | 0.0 |
| 20 to 34 years | 0 (0.0%) | 0.0 |
| 35 to 50 years | 0 (0.0%) | 0.0 |
| Total | 0 (0.0%) | 0.0 |
Fertility by Age by Marriage Status in East Alto Bonito
| Age Bracket | Married | Unmarried |
| 15 to 19 years | 0 (0.0%) | 0 (0.0%) |
| 20 to 34 years | 0 (0.0%) | 0 (0.0%) |
| 35 to 50 years | 0 (0.0%) | 0 (0.0%) |
| Total | 0 (0.0%) | 0 (0.0%) |
Fertility by Education in East Alto Bonito
| Educational Attainment | Women with Births | Births / 1,000 Women |
| Less than High School | 0 (0.0%) | 0.0 |
| High School Diploma | 0 (0.0%) | 0.0 |
| College or Associate's Degree | 0 (0.0%) | 0.0 |
| Bachelor's Degree | 0 (0.0%) | 0.0 |
| Graduate Degree | 0 (0.0%) | 0.0 |
| Total | 0 (0.0%) | 0.0 |
Fertility by Education by Marriage Status in East Alto Bonito
| Educational Attainment | Married | Unmarried |
| Less than High School | 0 (0.0%) | 0 (0.0%) |
| High School Diploma | 0 (0.0%) | 0 (0.0%) |
| College or Associate's Degree | 0 (0.0%) | 0 (0.0%) |
| Bachelor's Degree | 0 (0.0%) | 0 (0.0%) |
| Graduate Degree | 0 (0.0%) | 0 (0.0%) |
| Total | 0 (0.0%) | 0 (0.0%) |
Employment Characteristics in East Alto Bonito
Employment by Class of Employer in East Alto Bonito
Among the 216 employed individuals in East Alto Bonito, private company employees (106 | 49.1%), local government employees (66 | 30.6%), and self-employed (not incorporated) (15 | 6.9%) make up the most common classes of employment.
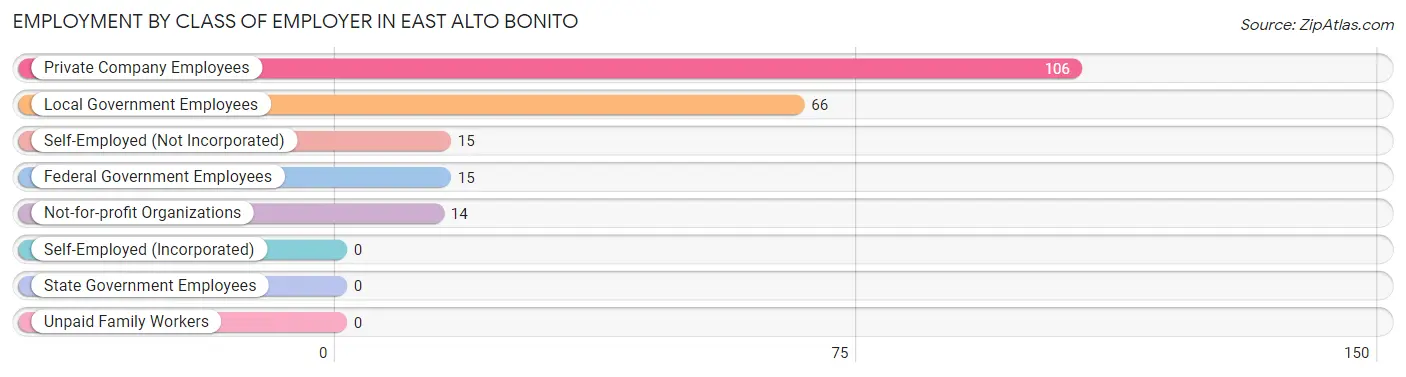
| Employer Class | # Employees | % Employees |
| Private Company Employees | 106 | 49.1% |
| Self-Employed (Incorporated) | 0 | 0.0% |
| Self-Employed (Not Incorporated) | 15 | 6.9% |
| Not-for-profit Organizations | 14 | 6.5% |
| Local Government Employees | 66 | 30.6% |
| State Government Employees | 0 | 0.0% |
| Federal Government Employees | 15 | 6.9% |
| Unpaid Family Workers | 0 | 0.0% |
| Total | 216 | 100.0% |
Employment Status by Age in East Alto Bonito
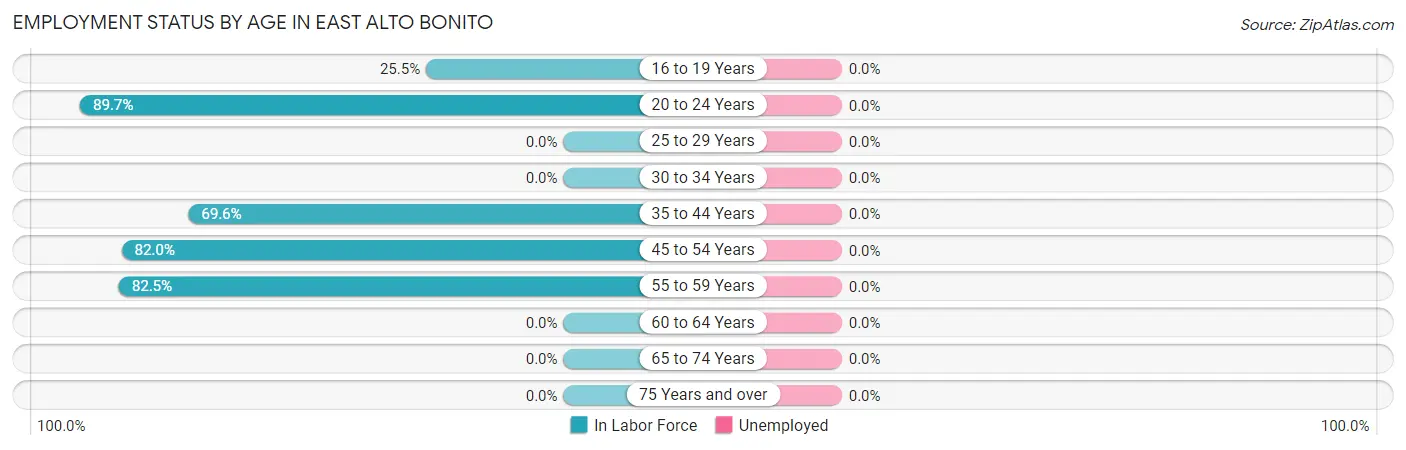
| Age Bracket | In Labor Force | Unemployed |
| 16 to 19 Years | 25 (25.5%) | 0 (0.0%) |
| 20 to 24 Years | 131 (89.7%) | 0 (0.0%) |
| 25 to 29 Years | 0 (0.0%) | 0 (0.0%) |
| 30 to 34 Years | 0 (0.0%) | 0 (0.0%) |
| 35 to 44 Years | 48 (69.6%) | 0 (0.0%) |
| 45 to 54 Years | 41 (82.0%) | 0 (0.0%) |
| 55 to 59 Years | 33 (82.5%) | 0 (0.0%) |
| 60 to 64 Years | 0 (0.0%) | 0 (0.0%) |
| 65 to 74 Years | 0 (0.0%) | 0 (0.0%) |
| 75 Years and over | 0 (0.0%) | 0 (0.0%) |
| Total | 278 (63.5%) | 0 (0.0%) |
Employment Status by Educational Attainment in East Alto Bonito
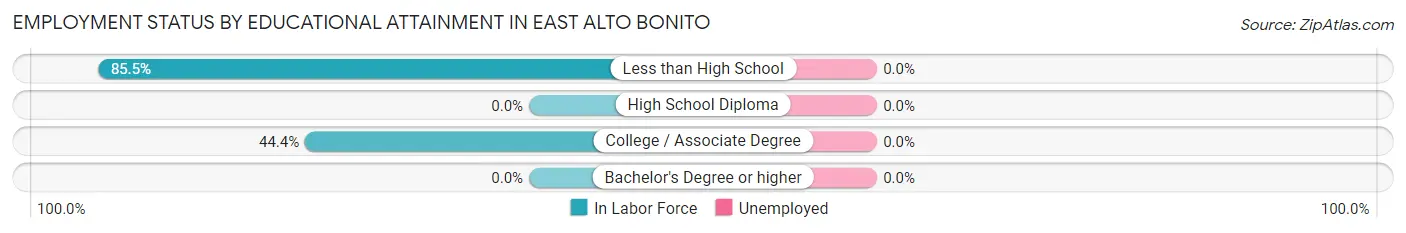
| Educational Attainment | In Labor Force | Unemployed |
| Less than High School | 94 (85.5%) | 0 (0.0%) |
| High School Diploma | 0 (0.0%) | 0 (0.0%) |
| College / Associate Degree | 28 (44.4%) | 0 (0.0%) |
| Bachelor's Degree or higher | 0 (0.0%) | 0 (0.0%) |
| Total | 122 (62.9%) | 0 (0.0%) |
Employment Occupations by Sex in East Alto Bonito
Management, Business, Science and Arts Occupations
The most common Management, Business, Science and Arts occupations in East Alto Bonito are , and Business & Financial (15 | 5.4%).
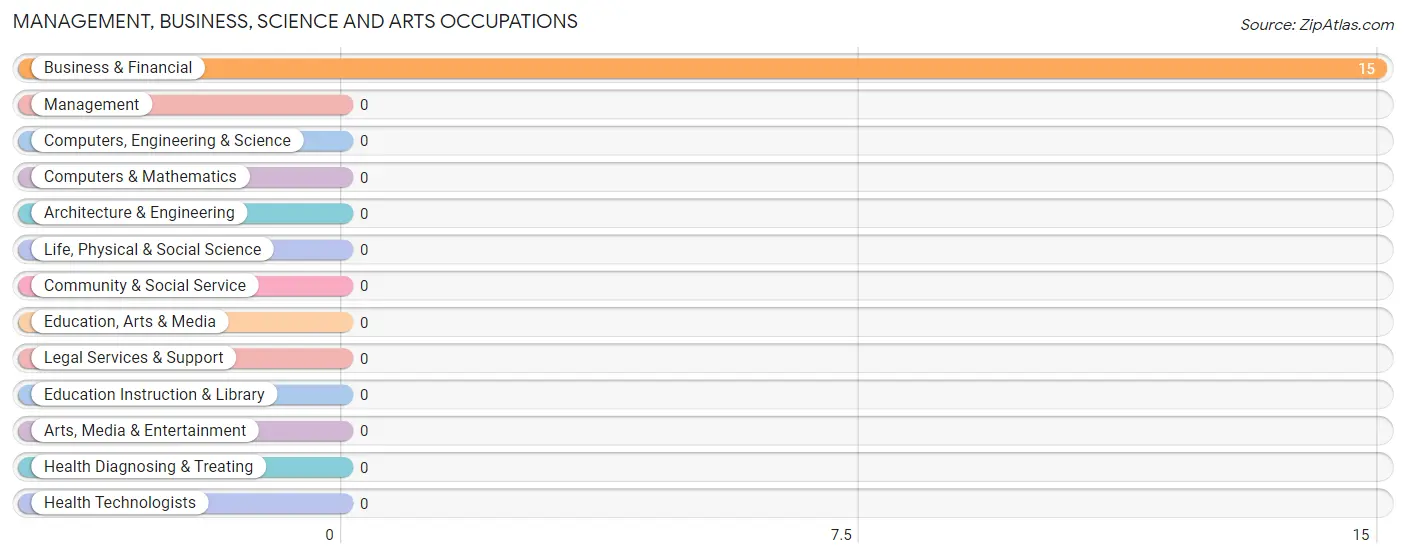
Management, Business, Science and Arts Occupations by Sex
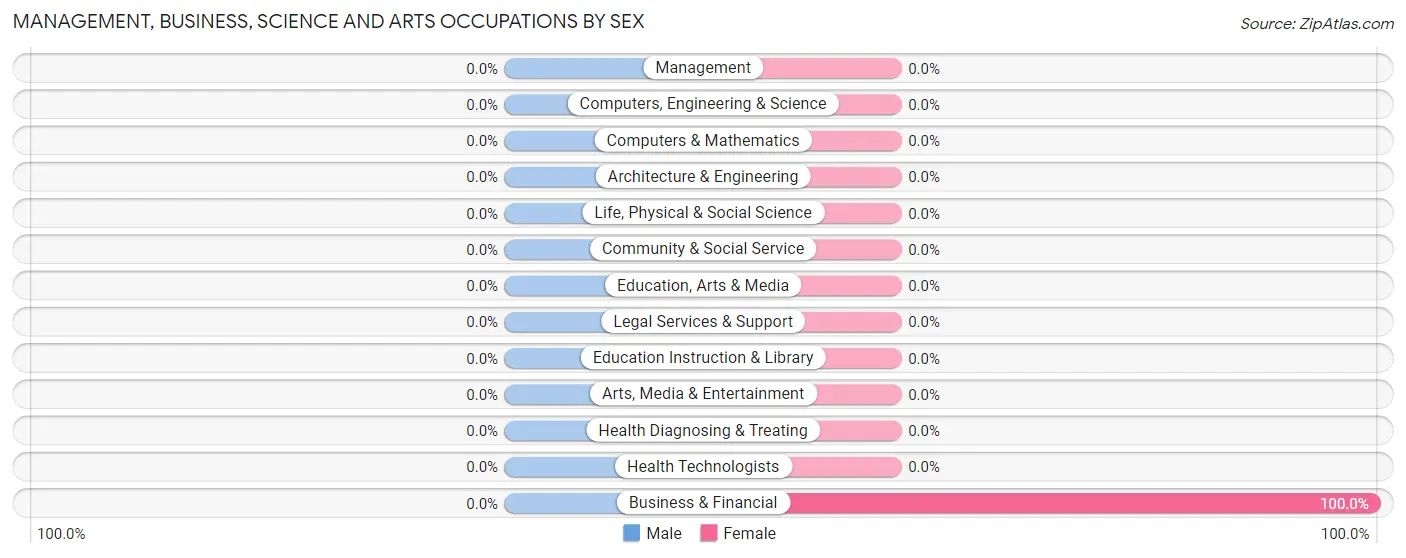
| Occupation | Male | Female |
| Management | 0 (0.0%) | 0 (0.0%) |
| Business & Financial | 0 (0.0%) | 15 (100.0%) |
| Computers, Engineering & Science | 0 (0.0%) | 0 (0.0%) |
| Computers & Mathematics | 0 (0.0%) | 0 (0.0%) |
| Architecture & Engineering | 0 (0.0%) | 0 (0.0%) |
| Life, Physical & Social Science | 0 (0.0%) | 0 (0.0%) |
| Community & Social Service | 0 (0.0%) | 0 (0.0%) |
| Education, Arts & Media | 0 (0.0%) | 0 (0.0%) |
| Legal Services & Support | 0 (0.0%) | 0 (0.0%) |
| Education Instruction & Library | 0 (0.0%) | 0 (0.0%) |
| Arts, Media & Entertainment | 0 (0.0%) | 0 (0.0%) |
| Health Diagnosing & Treating | 0 (0.0%) | 0 (0.0%) |
| Health Technologists | 0 (0.0%) | 0 (0.0%) |
| Total (Category) | 0 (0.0%) | 15 (100.0%) |
| Total (Overall) | 149 (53.6%) | 129 (46.4%) |
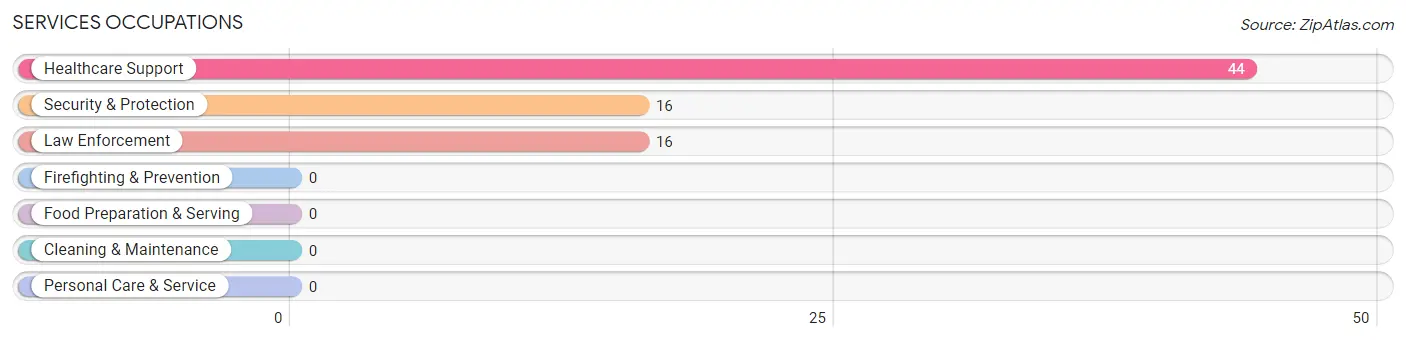
Services Occupations
The most common Services occupations in East Alto Bonito are Healthcare Support (44 | 15.8%), Security & Protection (16 | 5.8%), and Law Enforcement (16 | 5.8%).
Services Occupations by Sex
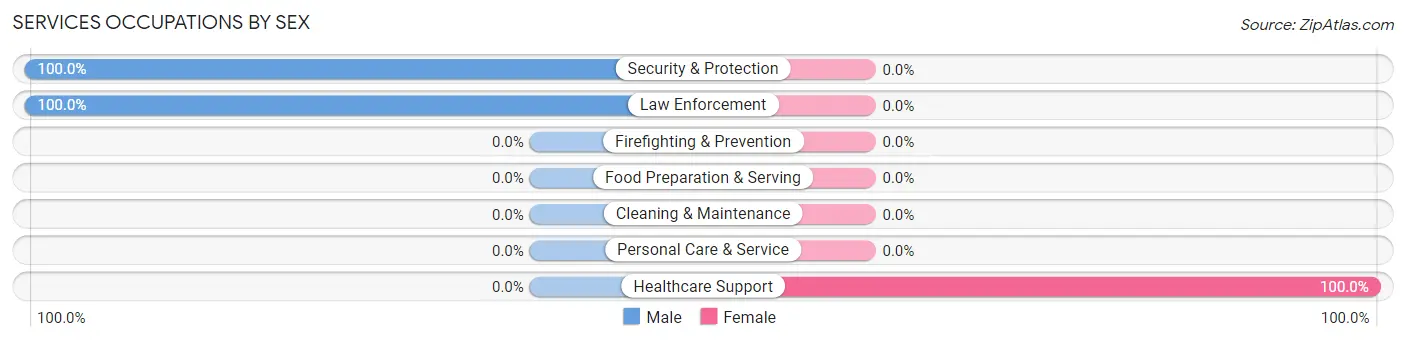
| Occupation | Male | Female |
| Healthcare Support | 0 (0.0%) | 44 (100.0%) |
| Security & Protection | 16 (100.0%) | 0 (0.0%) |
| Firefighting & Prevention | 0 (0.0%) | 0 (0.0%) |
| Law Enforcement | 16 (100.0%) | 0 (0.0%) |
| Food Preparation & Serving | 0 (0.0%) | 0 (0.0%) |
| Cleaning & Maintenance | 0 (0.0%) | 0 (0.0%) |
| Personal Care & Service | 0 (0.0%) | 0 (0.0%) |
| Total (Category) | 16 (26.7%) | 44 (73.3%) |
| Total (Overall) | 149 (53.6%) | 129 (46.4%) |
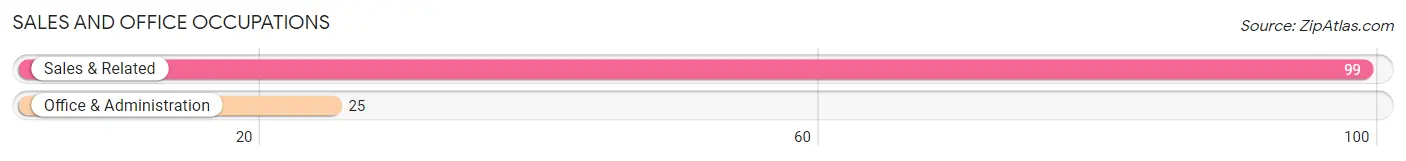
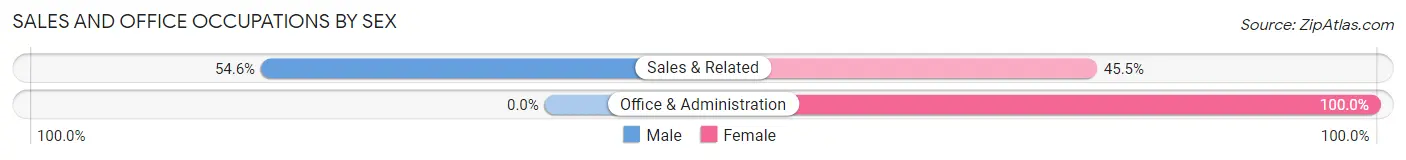
Sales and Office Occupations
The most common Sales and Office occupations in East Alto Bonito are Sales & Related (99 | 35.6%), and Office & Administration (25 | 9.0%).
Sales and Office Occupations by Sex
| Occupation | Male | Female |
| Sales & Related | 54 (54.5%) | 45 (45.5%) |
| Office & Administration | 0 (0.0%) | 25 (100.0%) |
| Total (Category) | 54 (43.5%) | 70 (56.5%) |
| Total (Overall) | 149 (53.6%) | 129 (46.4%) |
Natural Resources, Construction and Maintenance Occupations
The most common Natural Resources, Construction and Maintenance occupations in East Alto Bonito are , and Construction & Extraction (37 | 13.3%).
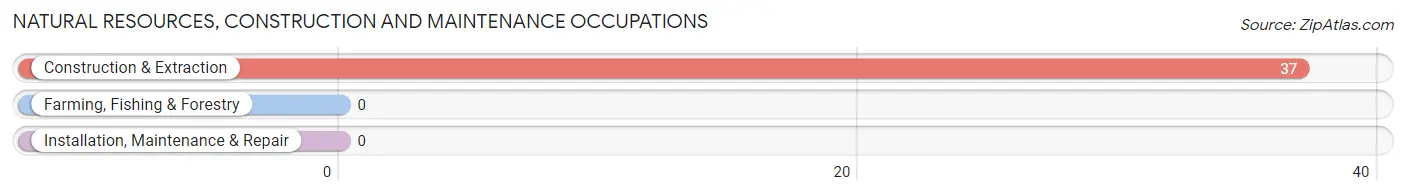
Natural Resources, Construction and Maintenance Occupations by Sex
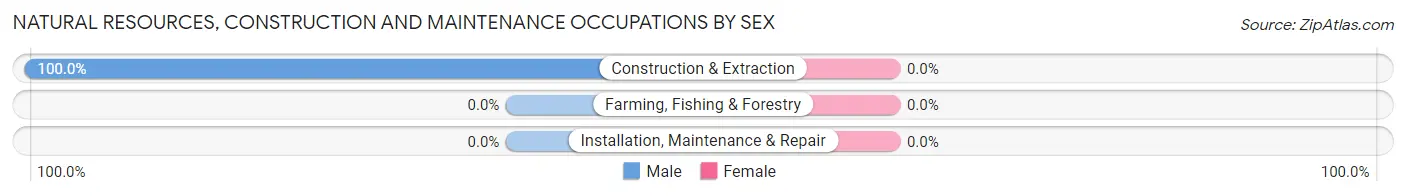
| Occupation | Male | Female |
| Farming, Fishing & Forestry | 0 (0.0%) | 0 (0.0%) |
| Construction & Extraction | 37 (100.0%) | 0 (0.0%) |
| Installation, Maintenance & Repair | 0 (0.0%) | 0 (0.0%) |
| Total (Category) | 37 (100.0%) | 0 (0.0%) |
| Total (Overall) | 149 (53.6%) | 129 (46.4%) |
Production, Transportation and Moving Occupations
The most common Production, Transportation and Moving occupations in East Alto Bonito are Transportation (25 | 9.0%), and Material Moving (17 | 6.1%).
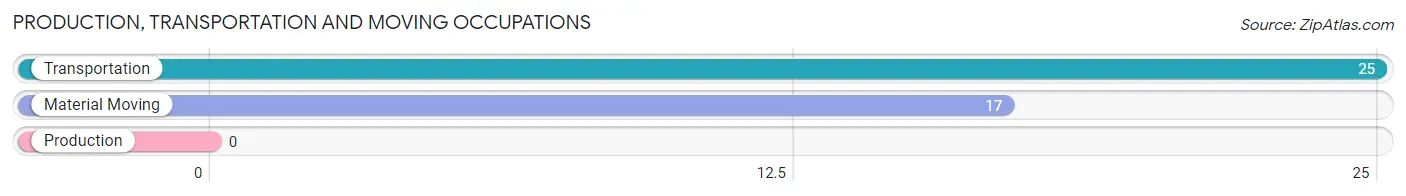
Production, Transportation and Moving Occupations by Sex
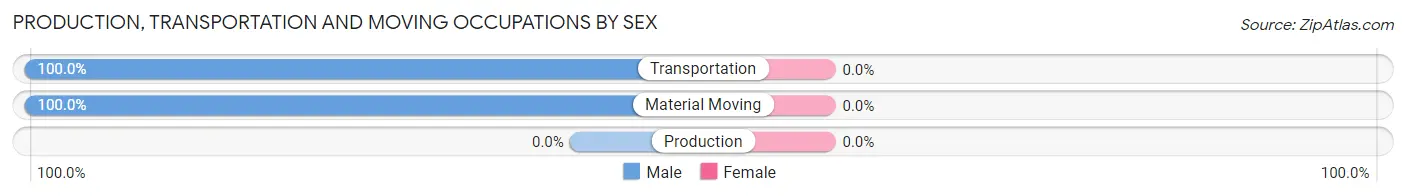
| Occupation | Male | Female |
| Production | 0 (0.0%) | 0 (0.0%) |
| Transportation | 25 (100.0%) | 0 (0.0%) |
| Material Moving | 17 (100.0%) | 0 (0.0%) |
| Total (Category) | 42 (100.0%) | 0 (0.0%) |
| Total (Overall) | 149 (53.6%) | 129 (46.4%) |
Employment Industries by Sex in East Alto Bonito
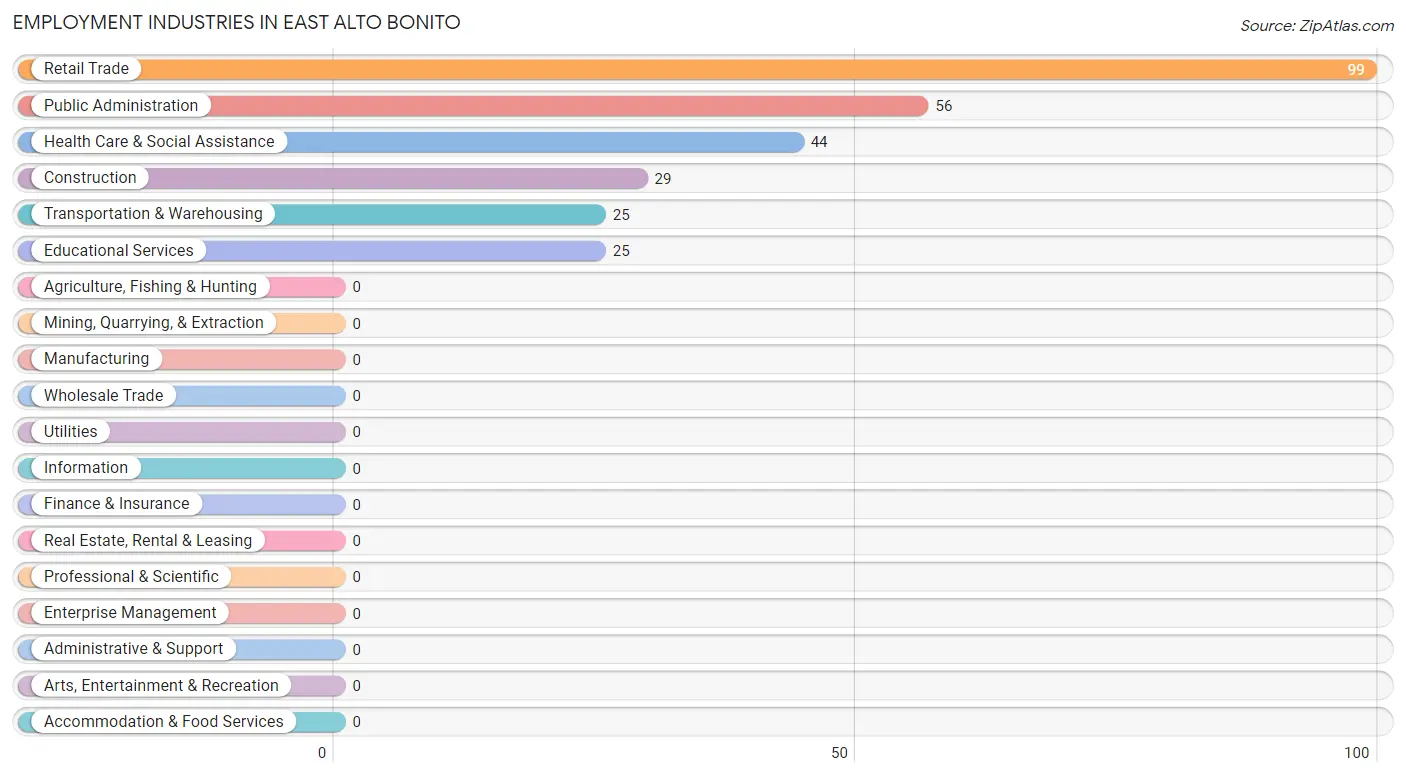
Employment Industries in East Alto Bonito
The major employment industries in East Alto Bonito include Retail Trade (99 | 35.6%), Public Administration (56 | 20.1%), Health Care & Social Assistance (44 | 15.8%), Construction (29 | 10.4%), and Transportation & Warehousing (25 | 9.0%).
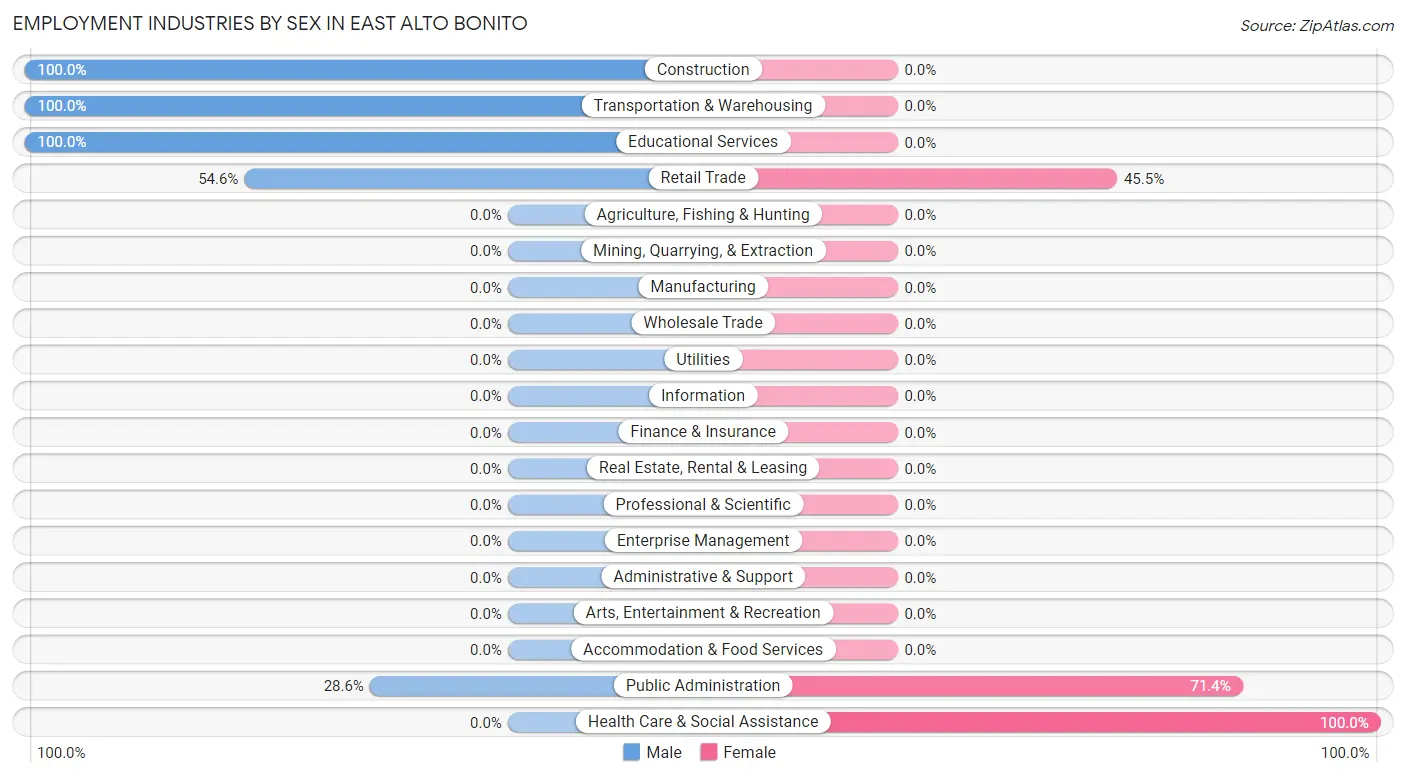
Employment Industries by Sex in East Alto Bonito
The East Alto Bonito industries that see more men than women are Construction (100.0%), Transportation & Warehousing (100.0%), and Educational Services (100.0%), whereas the industries that tend to have a higher number of women are Health Care & Social Assistance (100.0%), Public Administration (71.4%), and Retail Trade (45.5%).
| Industry | Male | Female |
| Agriculture, Fishing & Hunting | 0 (0.0%) | 0 (0.0%) |
| Mining, Quarrying, & Extraction | 0 (0.0%) | 0 (0.0%) |
| Construction | 29 (100.0%) | 0 (0.0%) |
| Manufacturing | 0 (0.0%) | 0 (0.0%) |
| Wholesale Trade | 0 (0.0%) | 0 (0.0%) |
| Retail Trade | 54 (54.5%) | 45 (45.5%) |
| Transportation & Warehousing | 25 (100.0%) | 0 (0.0%) |
| Utilities | 0 (0.0%) | 0 (0.0%) |
| Information | 0 (0.0%) | 0 (0.0%) |
| Finance & Insurance | 0 (0.0%) | 0 (0.0%) |
| Real Estate, Rental & Leasing | 0 (0.0%) | 0 (0.0%) |
| Professional & Scientific | 0 (0.0%) | 0 (0.0%) |
| Enterprise Management | 0 (0.0%) | 0 (0.0%) |
| Administrative & Support | 0 (0.0%) | 0 (0.0%) |
| Educational Services | 25 (100.0%) | 0 (0.0%) |
| Health Care & Social Assistance | 0 (0.0%) | 44 (100.0%) |
| Arts, Entertainment & Recreation | 0 (0.0%) | 0 (0.0%) |
| Accommodation & Food Services | 0 (0.0%) | 0 (0.0%) |
| Public Administration | 16 (28.6%) | 40 (71.4%) |
| Total | 149 (53.6%) | 129 (46.4%) |
Education in East Alto Bonito
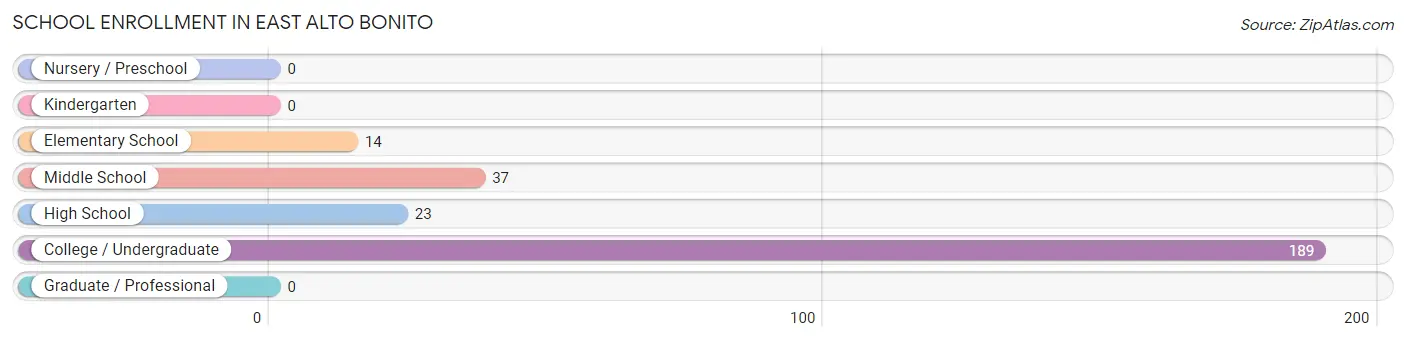
School Enrollment in East Alto Bonito
The most common levels of schooling among the 263 students in East Alto Bonito are college / undergraduate (189 | 71.9%), middle school (37 | 14.1%), and high school (23 | 8.7%).
| School Level | # Students | % Students |
| Nursery / Preschool | 0 | 0.0% |
| Kindergarten | 0 | 0.0% |
| Elementary School | 14 | 5.3% |
| Middle School | 37 | 14.1% |
| High School | 23 | 8.7% |
| College / Undergraduate | 189 | 71.9% |
| Graduate / Professional | 0 | 0.0% |
| Total | 263 | 100.0% |
School Enrollment by Age by Funding Source in East Alto Bonito
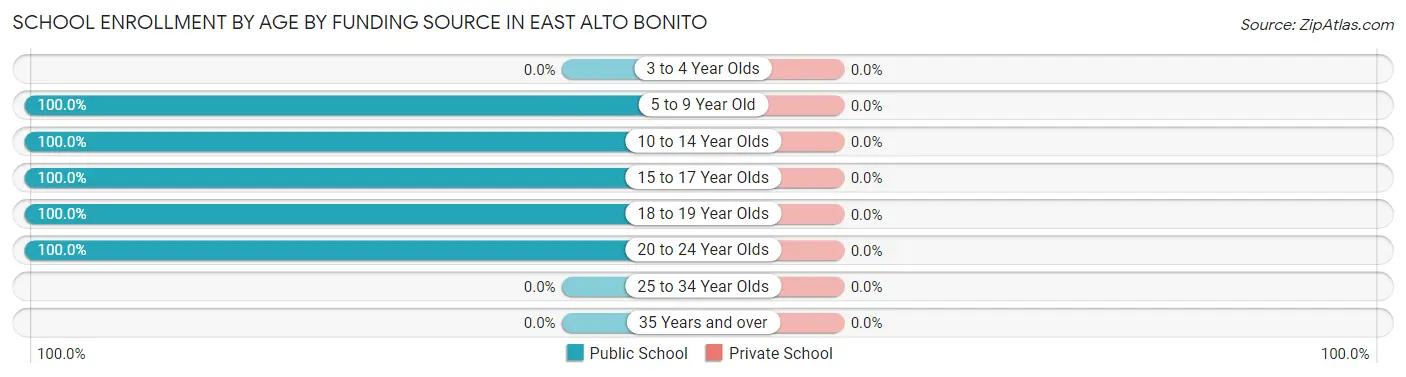
| Age Bracket | Public School | Private School |
| 3 to 4 Year Olds | 0 (0.0%) | 0 (0.0%) |
| 5 to 9 Year Old | 14 (100.0%) | 0 (0.0%) |
| 10 to 14 Year Olds | 37 (100.0%) | 0 (0.0%) |
| 15 to 17 Year Olds | 23 (100.0%) | 0 (0.0%) |
| 18 to 19 Year Olds | 75 (100.0%) | 0 (0.0%) |
| 20 to 24 Year Olds | 114 (100.0%) | 0 (0.0%) |
| 25 to 34 Year Olds | 0 (0.0%) | 0 (0.0%) |
| 35 Years and over | 0 (0.0%) | 0 (0.0%) |
| Total | 263 (100.0%) | 0 (0.0%) |
Educational Attainment by Field of Study in East Alto Bonito
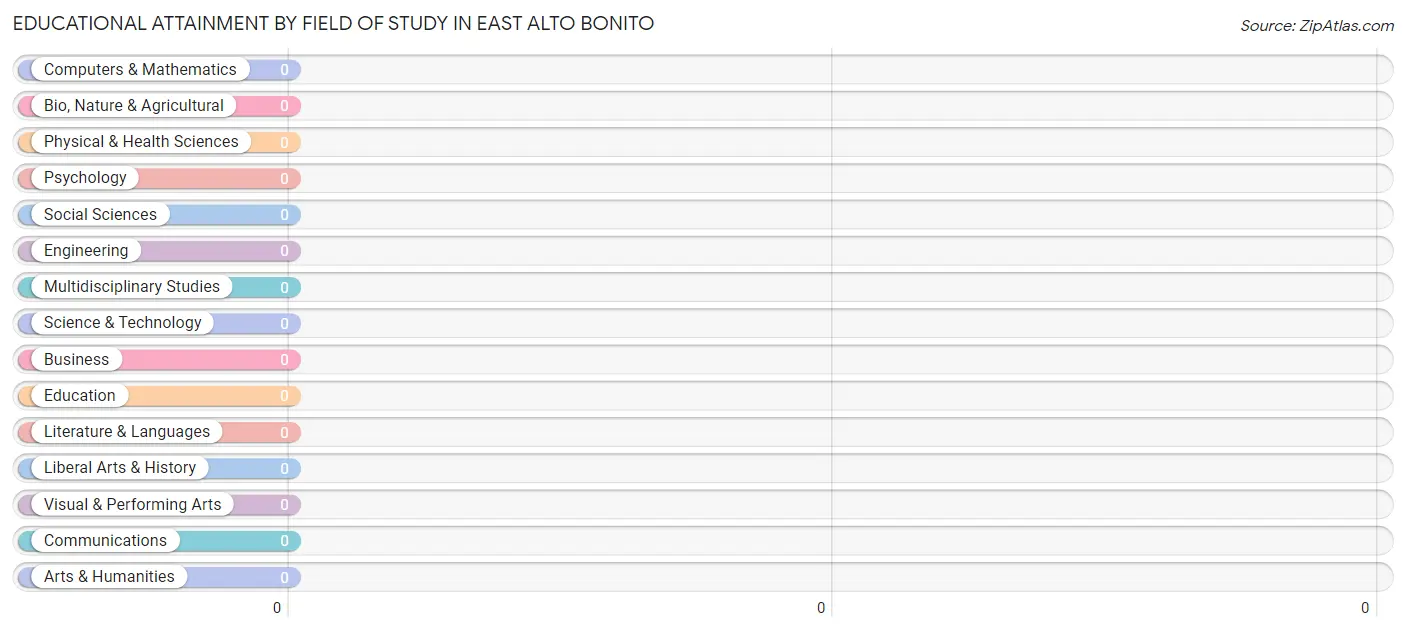
| Field of Study | # Graduates | % Graduates |
| Computers & Mathematics | 0 | 0.0% |
| Bio, Nature & Agricultural | 0 | 0.0% |
| Physical & Health Sciences | 0 | 0.0% |
| Psychology | 0 | 0.0% |
| Social Sciences | 0 | 0.0% |
| Engineering | 0 | 0.0% |
| Multidisciplinary Studies | 0 | 0.0% |
| Science & Technology | 0 | 0.0% |
| Business | 0 | 0.0% |
| Education | 0 | 0.0% |
| Literature & Languages | 0 | 0.0% |
| Liberal Arts & History | 0 | 0.0% |
| Visual & Performing Arts | 0 | 0.0% |
| Communications | 0 | 0.0% |
| Arts & Humanities | 0 | 0.0% |
| Total | 0 | 0.0% |
Transportation & Commute in East Alto Bonito
Vehicle Availability by Sex in East Alto Bonito
The most prevalent vehicle ownership categories in East Alto Bonito are males with 4 vehicles (110, accounting for 83.3%) and females with 4 vehicles (72, making up 131.0%).
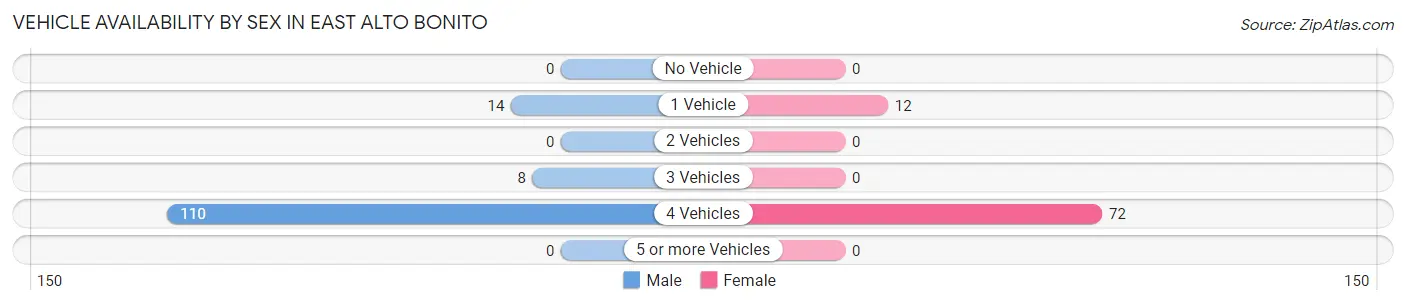
| Vehicles Available | Male | Female |
| No Vehicle | 0 (0.0%) | 0 (0.0%) |
| 1 Vehicle | 14 (10.6%) | 12 (14.3%) |
| 2 Vehicles | 0 (0.0%) | 0 (0.0%) |
| 3 Vehicles | 8 (6.1%) | 0 (0.0%) |
| 4 Vehicles | 110 (83.3%) | 72 (85.7%) |
| 5 or more Vehicles | 0 (0.0%) | 0 (0.0%) |
| Total | 132 (100.0%) | 84 (100.0%) |
Commute Time in East Alto Bonito
The most frequently occuring commute durations in East Alto Bonito are 15 to 19 minutes (95 commuters, 45.7%), 10 to 14 minutes (44 commuters, 21.1%), and 60 to 89 minutes (29 commuters, 13.9%).
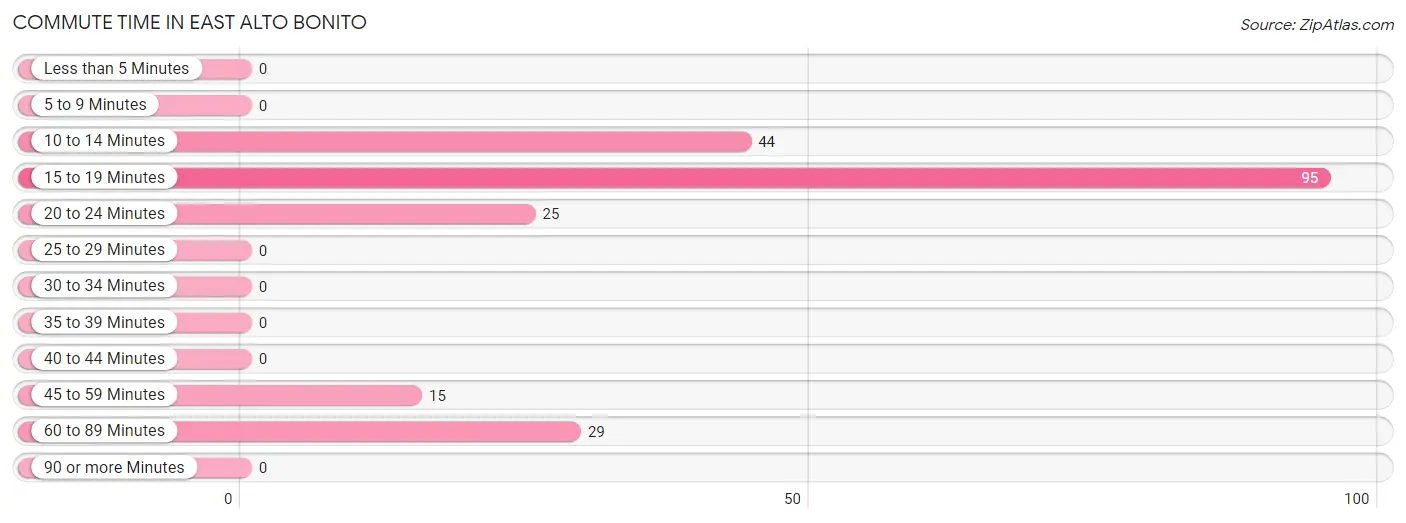
| Commute Time | # Commuters | % Commuters |
| Less than 5 Minutes | 0 | 0.0% |
| 5 to 9 Minutes | 0 | 0.0% |
| 10 to 14 Minutes | 44 | 21.1% |
| 15 to 19 Minutes | 95 | 45.7% |
| 20 to 24 Minutes | 25 | 12.0% |
| 25 to 29 Minutes | 0 | 0.0% |
| 30 to 34 Minutes | 0 | 0.0% |
| 35 to 39 Minutes | 0 | 0.0% |
| 40 to 44 Minutes | 0 | 0.0% |
| 45 to 59 Minutes | 15 | 7.2% |
| 60 to 89 Minutes | 29 | 13.9% |
| 90 or more Minutes | 0 | 0.0% |
Commute Time by Sex in East Alto Bonito
The most common commute times in East Alto Bonito are 15 to 19 minutes (95 commuters, 76.6%) for males and 10 to 14 minutes (44 commuters, 52.4%) for females.
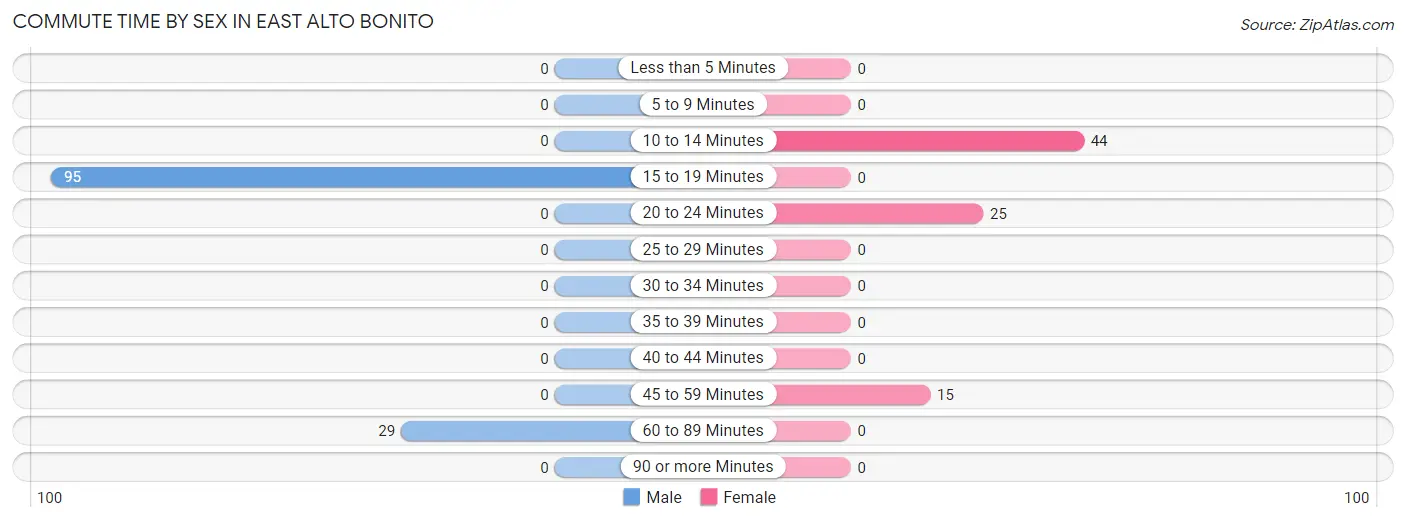
| Commute Time | Male | Female |
| Less than 5 Minutes | 0 (0.0%) | 0 (0.0%) |
| 5 to 9 Minutes | 0 (0.0%) | 0 (0.0%) |
| 10 to 14 Minutes | 0 (0.0%) | 44 (52.4%) |
| 15 to 19 Minutes | 95 (76.6%) | 0 (0.0%) |
| 20 to 24 Minutes | 0 (0.0%) | 25 (29.8%) |
| 25 to 29 Minutes | 0 (0.0%) | 0 (0.0%) |
| 30 to 34 Minutes | 0 (0.0%) | 0 (0.0%) |
| 35 to 39 Minutes | 0 (0.0%) | 0 (0.0%) |
| 40 to 44 Minutes | 0 (0.0%) | 0 (0.0%) |
| 45 to 59 Minutes | 0 (0.0%) | 15 (17.9%) |
| 60 to 89 Minutes | 29 (23.4%) | 0 (0.0%) |
| 90 or more Minutes | 0 (0.0%) | 0 (0.0%) |
Time of Departure to Work by Sex in East Alto Bonito
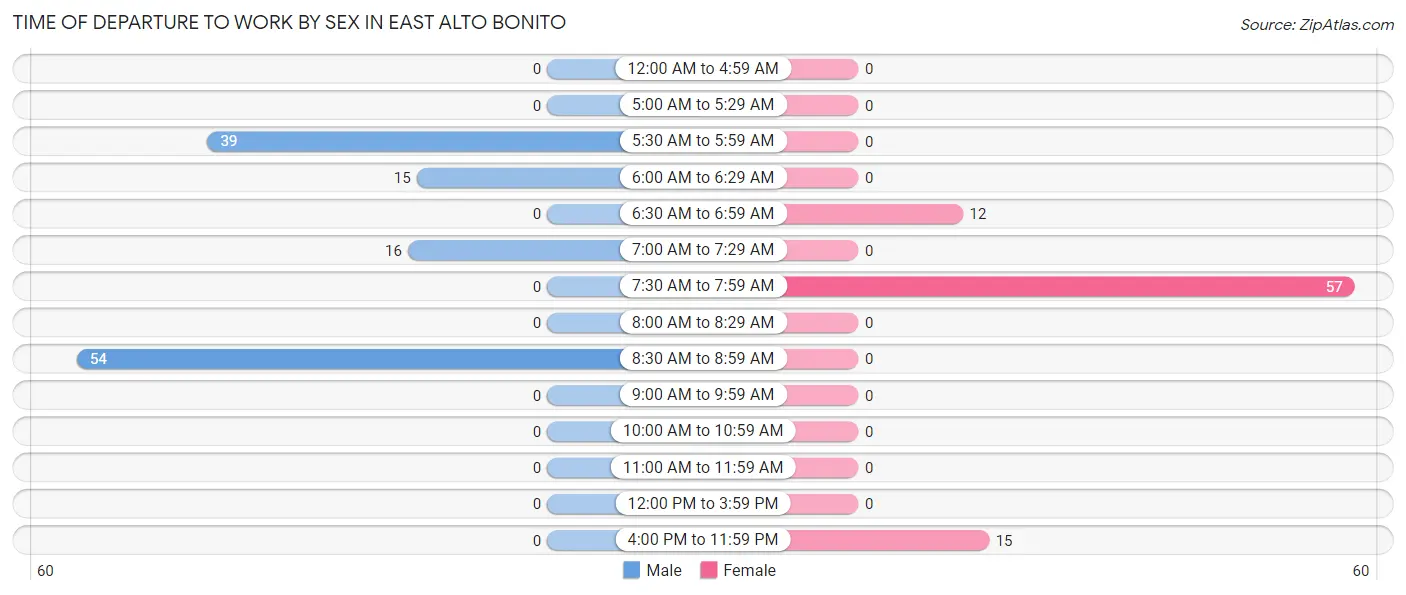
The most frequent times of departure to work in East Alto Bonito are 8:30 AM to 8:59 AM (54, 43.5%) for males and 7:30 AM to 7:59 AM (57, 67.9%) for females.
| Time of Departure | Male | Female |
| 12:00 AM to 4:59 AM | 0 (0.0%) | 0 (0.0%) |
| 5:00 AM to 5:29 AM | 0 (0.0%) | 0 (0.0%) |
| 5:30 AM to 5:59 AM | 39 (31.5%) | 0 (0.0%) |
| 6:00 AM to 6:29 AM | 15 (12.1%) | 0 (0.0%) |
| 6:30 AM to 6:59 AM | 0 (0.0%) | 12 (14.3%) |
| 7:00 AM to 7:29 AM | 16 (12.9%) | 0 (0.0%) |
| 7:30 AM to 7:59 AM | 0 (0.0%) | 57 (67.9%) |
| 8:00 AM to 8:29 AM | 0 (0.0%) | 0 (0.0%) |
| 8:30 AM to 8:59 AM | 54 (43.5%) | 0 (0.0%) |
| 9:00 AM to 9:59 AM | 0 (0.0%) | 0 (0.0%) |
| 10:00 AM to 10:59 AM | 0 (0.0%) | 0 (0.0%) |
| 11:00 AM to 11:59 AM | 0 (0.0%) | 0 (0.0%) |
| 12:00 PM to 3:59 PM | 0 (0.0%) | 0 (0.0%) |
| 4:00 PM to 11:59 PM | 0 (0.0%) | 15 (17.9%) |
| Total | 124 (100.0%) | 84 (100.0%) |
Housing Occupancy in East Alto Bonito
Occupancy by Ownership in East Alto Bonito
Of the total 102 dwellings in East Alto Bonito, owner-occupied units account for 102 (100.0%), while renter-occupied units make up 0 (0.0%).
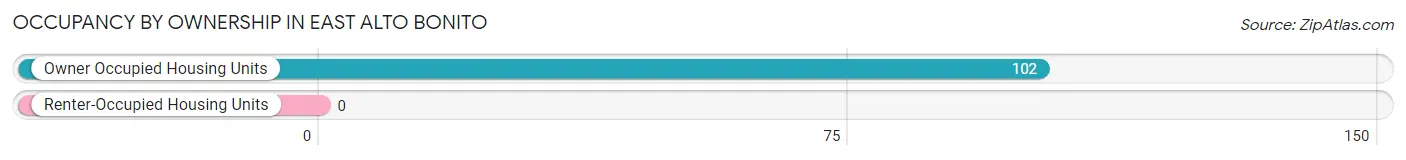
| Occupancy | # Housing Units | % Housing Units |
| Owner Occupied Housing Units | 102 | 100.0% |
| Renter-Occupied Housing Units | 0 | 0.0% |
| Total Occupied Housing Units | 102 | 100.0% |
Occupancy by Household Size in East Alto Bonito
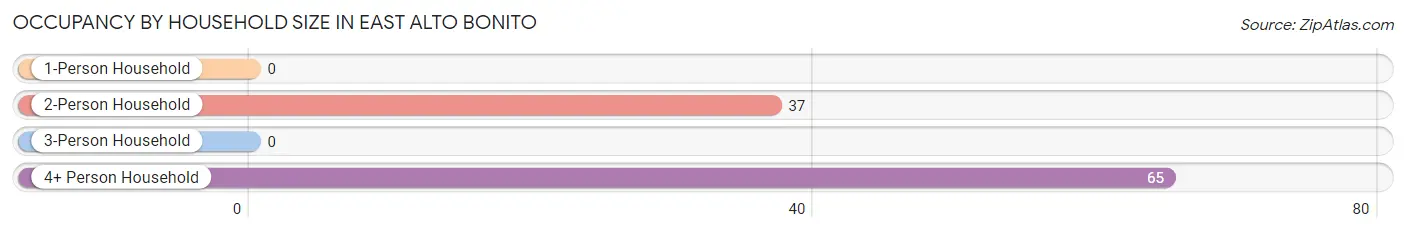
| Household Size | # Housing Units | % Housing Units |
| 1-Person Household | 0 | 0.0% |
| 2-Person Household | 37 | 36.3% |
| 3-Person Household | 0 | 0.0% |
| 4+ Person Household | 65 | 63.7% |
| Total Housing Units | 102 | 100.0% |
Occupancy by Ownership by Household Size in East Alto Bonito
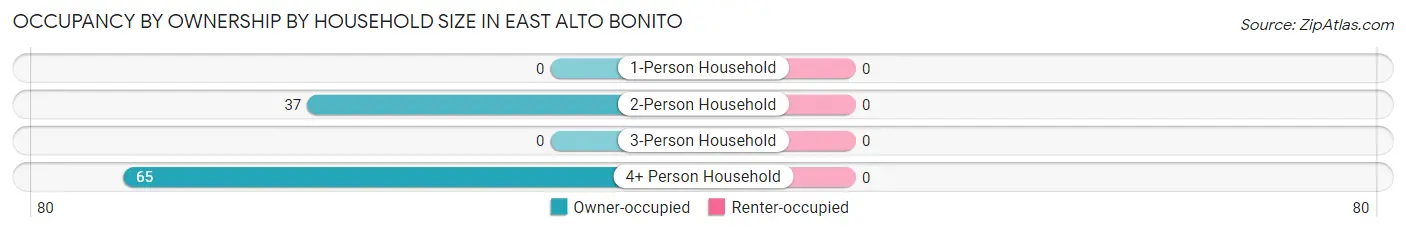
| Household Size | Owner-occupied | Renter-occupied |
| 1-Person Household | 0 (0.0%) | 0 (0.0%) |
| 2-Person Household | 37 (100.0%) | 0 (0.0%) |
| 3-Person Household | 0 (0.0%) | 0 (0.0%) |
| 4+ Person Household | 65 (100.0%) | 0 (0.0%) |
| Total Housing Units | 102 (100.0%) | 0 (0.0%) |
Occupancy by Educational Attainment in East Alto Bonito
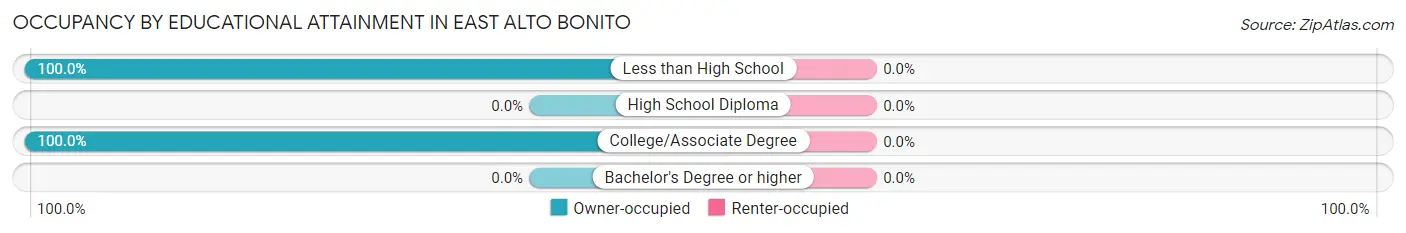
| Household Size | Owner-occupied | Renter-occupied |
| Less than High School | 74 (100.0%) | 0 (0.0%) |
| High School Diploma | 0 (0.0%) | 0 (0.0%) |
| College/Associate Degree | 28 (100.0%) | 0 (0.0%) |
| Bachelor's Degree or higher | 0 (0.0%) | 0 (0.0%) |
Occupancy by Age of Householder in East Alto Bonito
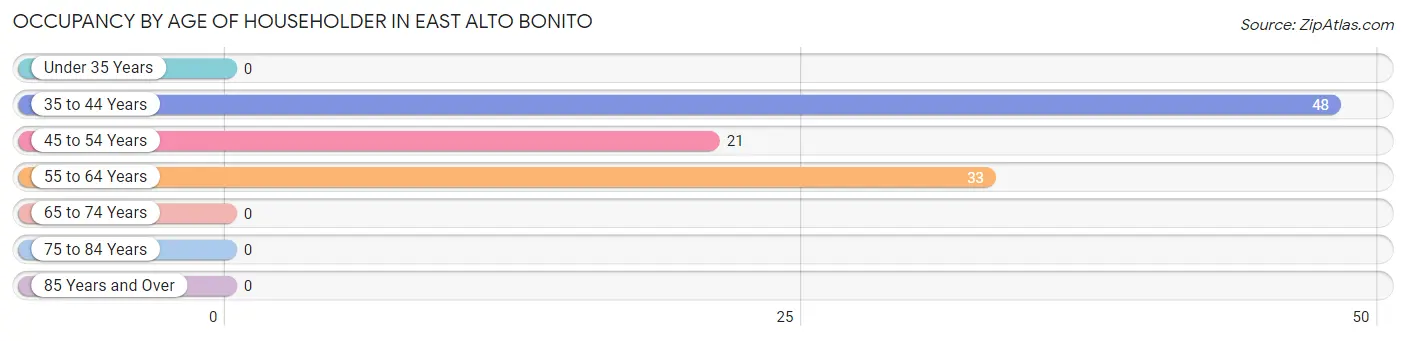
| Age Bracket | # Households | % Households |
| Under 35 Years | 0 | 0.0% |
| 35 to 44 Years | 48 | 47.1% |
| 45 to 54 Years | 21 | 20.6% |
| 55 to 64 Years | 33 | 32.4% |
| 65 to 74 Years | 0 | 0.0% |
| 75 to 84 Years | 0 | 0.0% |
| 85 Years and Over | 0 | 0.0% |
| Total | 102 | 100.0% |
Housing Finances in East Alto Bonito
Median Income by Occupancy in East Alto Bonito
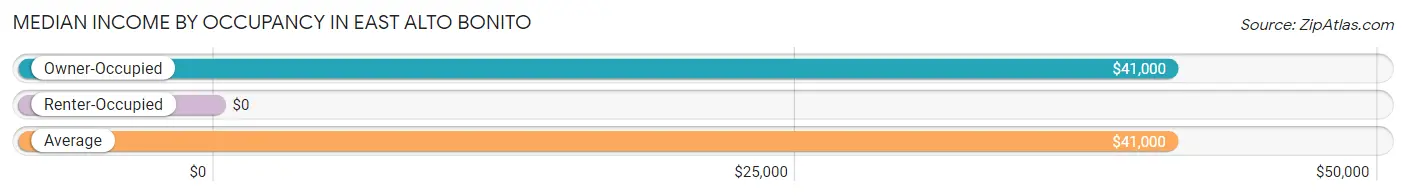
| Occupancy Type | # Households | Median Income |
| Owner-Occupied | 102 (100.0%) | $41,000 |
| Renter-Occupied | 0 (0.0%) | $0 |
| Average | 102 (100.0%) | $41,000 |
Occupancy by Householder Income Bracket in East Alto Bonito
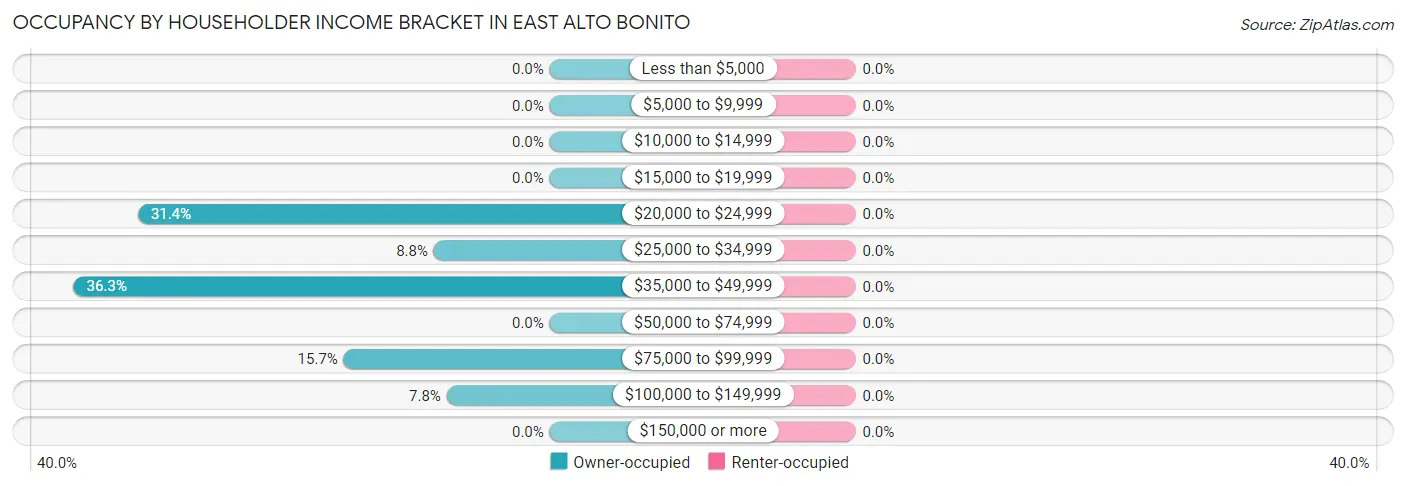
| Income Bracket | Owner-occupied | Renter-occupied |
| Less than $5,000 | 0 (0.0%) | 0 (0.0%) |
| $5,000 to $9,999 | 0 (0.0%) | 0 (0.0%) |
| $10,000 to $14,999 | 0 (0.0%) | 0 (0.0%) |
| $15,000 to $19,999 | 0 (0.0%) | 0 (0.0%) |
| $20,000 to $24,999 | 32 (31.4%) | 0 (0.0%) |
| $25,000 to $34,999 | 9 (8.8%) | 0 (0.0%) |
| $35,000 to $49,999 | 37 (36.3%) | 0 (0.0%) |
| $50,000 to $74,999 | 0 (0.0%) | 0 (0.0%) |
| $75,000 to $99,999 | 16 (15.7%) | 0 (0.0%) |
| $100,000 to $149,999 | 8 (7.8%) | 0 (0.0%) |
| $150,000 or more | 0 (0.0%) | 0 (0.0%) |
| Total | 102 (100.0%) | 0 (0.0%) |
Monthly Housing Cost Tiers in East Alto Bonito
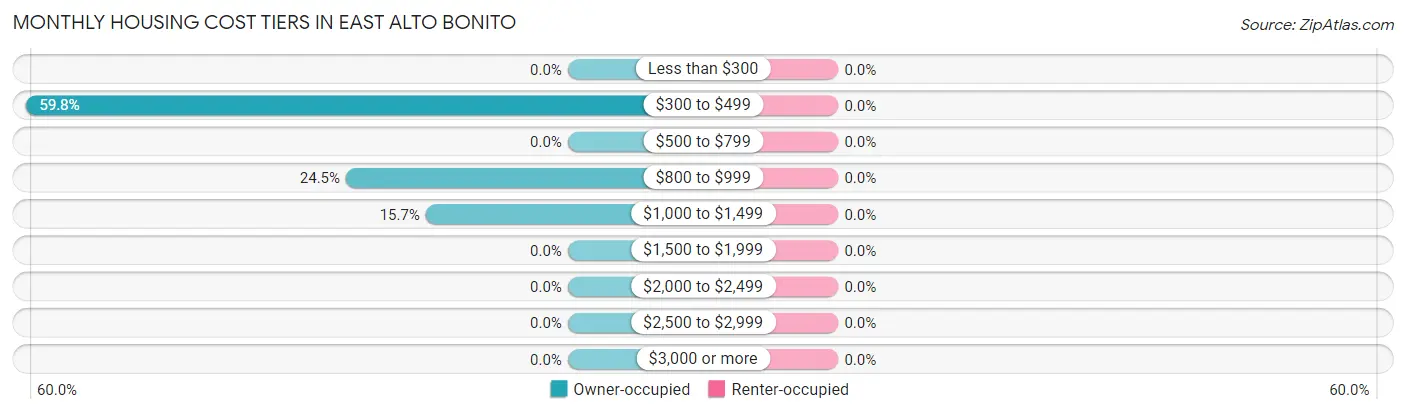
| Monthly Cost | Owner-occupied | Renter-occupied |
| Less than $300 | 0 (0.0%) | 0 (0.0%) |
| $300 to $499 | 61 (59.8%) | 0 (0.0%) |
| $500 to $799 | 0 (0.0%) | 0 (0.0%) |
| $800 to $999 | 25 (24.5%) | 0 (0.0%) |
| $1,000 to $1,499 | 16 (15.7%) | 0 (0.0%) |
| $1,500 to $1,999 | 0 (0.0%) | 0 (0.0%) |
| $2,000 to $2,499 | 0 (0.0%) | 0 (0.0%) |
| $2,500 to $2,999 | 0 (0.0%) | 0 (0.0%) |
| $3,000 or more | 0 (0.0%) | 0 (0.0%) |
| Total | 102 (100.0%) | 0 (0.0%) |
Physical Housing Characteristics in East Alto Bonito
Housing Structures in East Alto Bonito
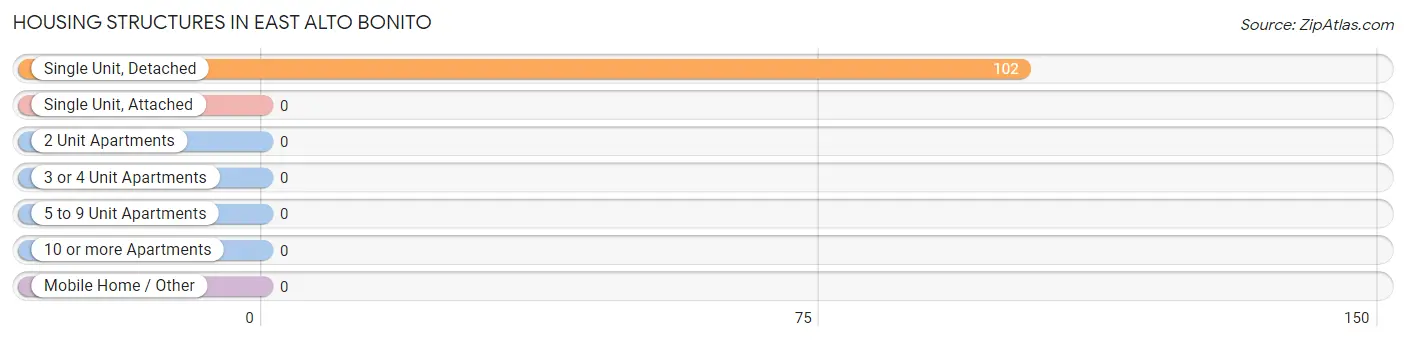
| Structure Type | # Housing Units | % Housing Units |
| Single Unit, Detached | 102 | 100.0% |
| Single Unit, Attached | 0 | 0.0% |
| 2 Unit Apartments | 0 | 0.0% |
| 3 or 4 Unit Apartments | 0 | 0.0% |
| 5 to 9 Unit Apartments | 0 | 0.0% |
| 10 or more Apartments | 0 | 0.0% |
| Mobile Home / Other | 0 | 0.0% |
| Total | 102 | 100.0% |
Housing Structures by Occupancy in East Alto Bonito
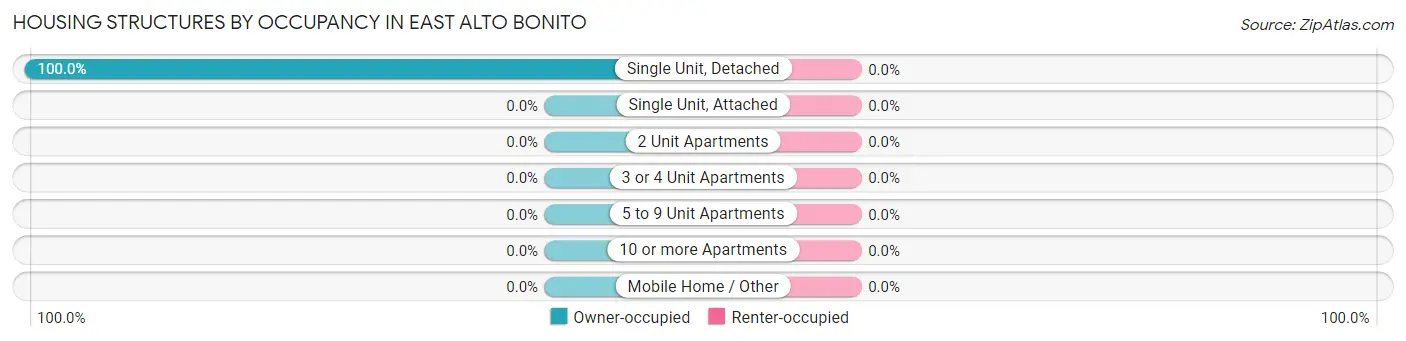
| Structure Type | Owner-occupied | Renter-occupied |
| Single Unit, Detached | 102 (100.0%) | 0 (0.0%) |
| Single Unit, Attached | 0 (0.0%) | 0 (0.0%) |
| 2 Unit Apartments | 0 (0.0%) | 0 (0.0%) |
| 3 or 4 Unit Apartments | 0 (0.0%) | 0 (0.0%) |
| 5 to 9 Unit Apartments | 0 (0.0%) | 0 (0.0%) |
| 10 or more Apartments | 0 (0.0%) | 0 (0.0%) |
| Mobile Home / Other | 0 (0.0%) | 0 (0.0%) |
| Total | 102 (100.0%) | 0 (0.0%) |
Housing Structures by Number of Rooms in East Alto Bonito
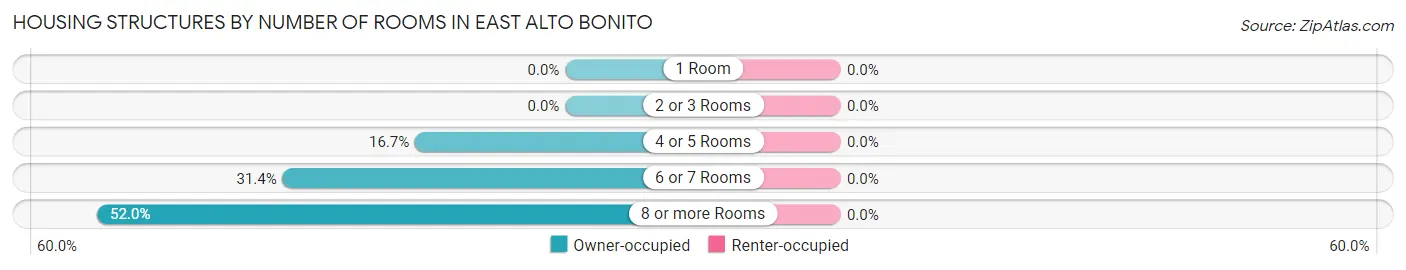
| Number of Rooms | Owner-occupied | Renter-occupied |
| 1 Room | 0 (0.0%) | 0 (0.0%) |
| 2 or 3 Rooms | 0 (0.0%) | 0 (0.0%) |
| 4 or 5 Rooms | 17 (16.7%) | 0 (0.0%) |
| 6 or 7 Rooms | 32 (31.4%) | 0 (0.0%) |
| 8 or more Rooms | 53 (52.0%) | 0 (0.0%) |
| Total | 102 (100.0%) | 0 (0.0%) |
Housing Structure by Heating Type in East Alto Bonito
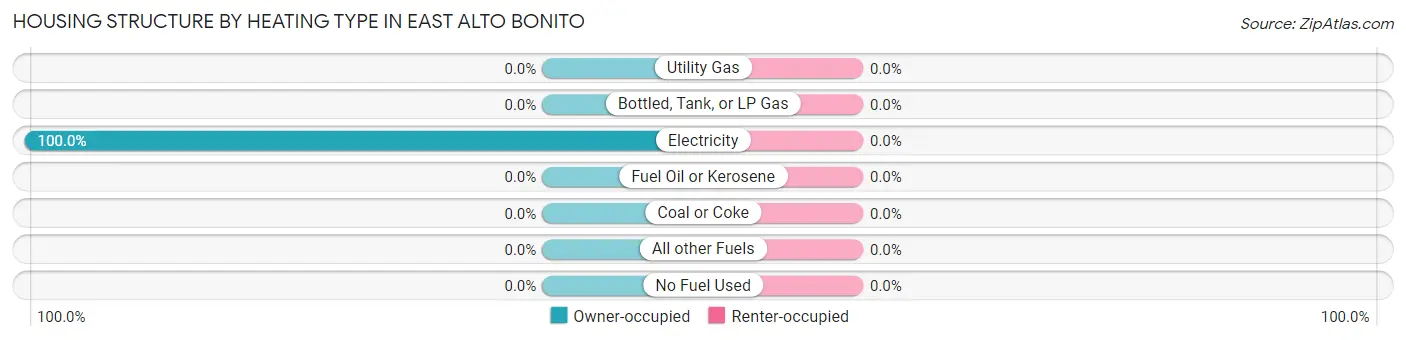
| Heating Type | Owner-occupied | Renter-occupied |
| Utility Gas | 0 (0.0%) | 0 (0.0%) |
| Bottled, Tank, or LP Gas | 0 (0.0%) | 0 (0.0%) |
| Electricity | 102 (100.0%) | 0 (0.0%) |
| Fuel Oil or Kerosene | 0 (0.0%) | 0 (0.0%) |
| Coal or Coke | 0 (0.0%) | 0 (0.0%) |
| All other Fuels | 0 (0.0%) | 0 (0.0%) |
| No Fuel Used | 0 (0.0%) | 0 (0.0%) |
| Total | 102 (100.0%) | 0 (0.0%) |
Household Vehicle Usage in East Alto Bonito
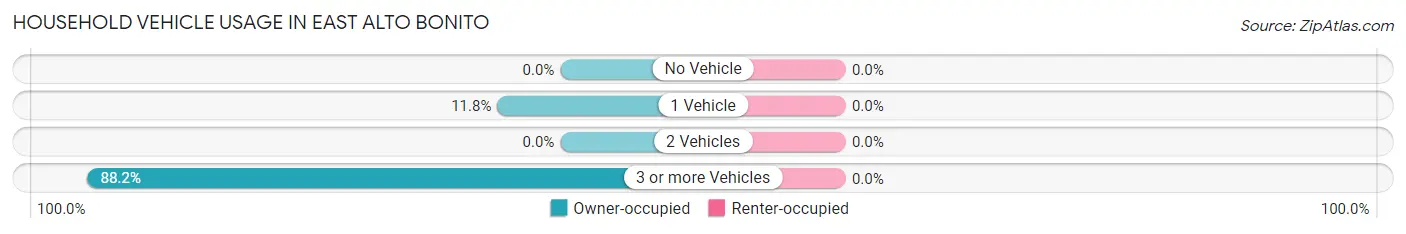
| Vehicles per Household | Owner-occupied | Renter-occupied |
| No Vehicle | 0 (0.0%) | 0 (0.0%) |
| 1 Vehicle | 12 (11.8%) | 0 (0.0%) |
| 2 Vehicles | 0 (0.0%) | 0 (0.0%) |
| 3 or more Vehicles | 90 (88.2%) | 0 (0.0%) |
| Total | 102 (100.0%) | 0 (0.0%) |
Real Estate & Mortgages in East Alto Bonito
Real Estate and Mortgage Overview in East Alto Bonito
| Characteristic | Without Mortgage | With Mortgage |
| Housing Units | 61 | 41 |
| Median Property Value | $137,200 | $0 |
| Median Household Income | - | - |
| Monthly Housing Costs | $424 | $0 |
| Real Estate Taxes | $1,288 | $0 |
Property Value by Mortgage Status in East Alto Bonito
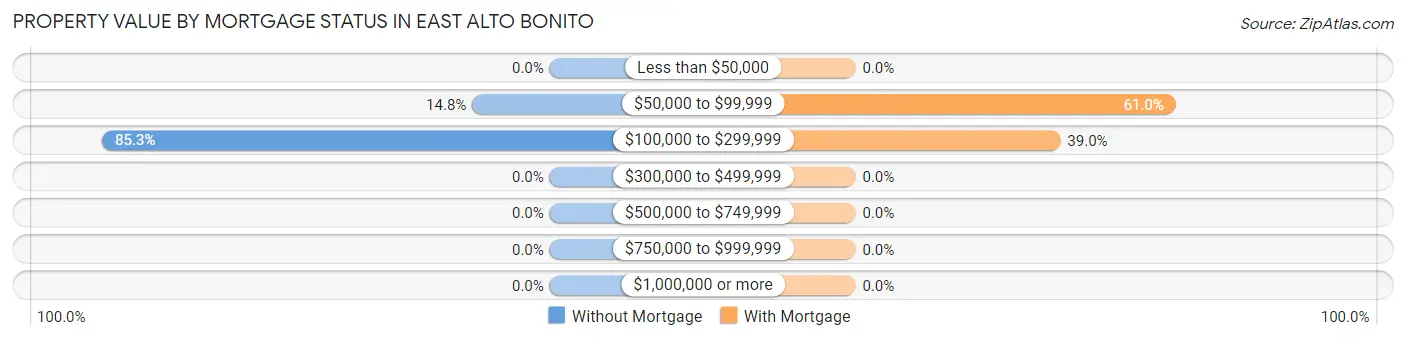
| Property Value | Without Mortgage | With Mortgage |
| Less than $50,000 | 0 (0.0%) | 0 (0.0%) |
| $50,000 to $99,999 | 9 (14.7%) | 25 (61.0%) |
| $100,000 to $299,999 | 52 (85.3%) | 16 (39.0%) |
| $300,000 to $499,999 | 0 (0.0%) | 0 (0.0%) |
| $500,000 to $749,999 | 0 (0.0%) | 0 (0.0%) |
| $750,000 to $999,999 | 0 (0.0%) | 0 (0.0%) |
| $1,000,000 or more | 0 (0.0%) | 0 (0.0%) |
| Total | 61 (100.0%) | 41 (100.0%) |
Household Income by Mortgage Status in East Alto Bonito
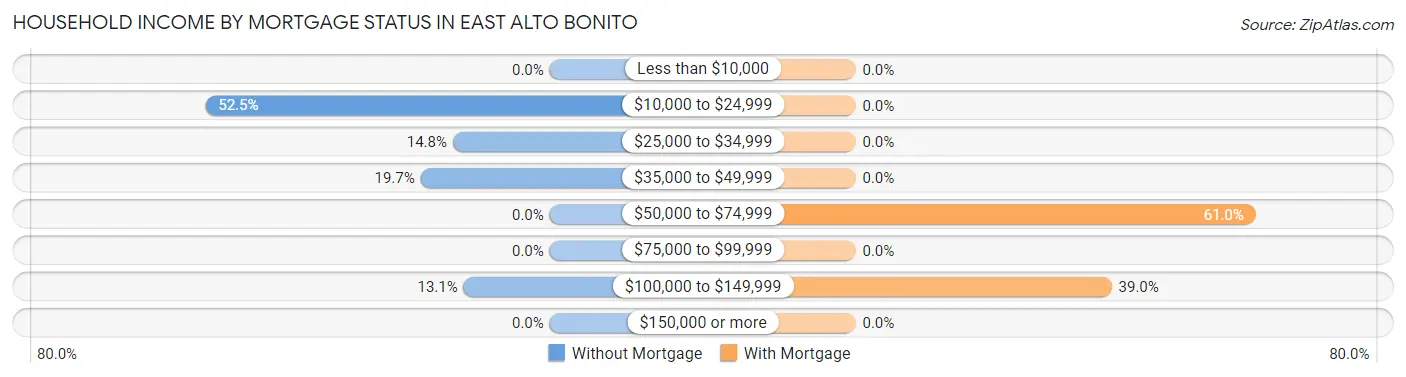
| Household Income | Without Mortgage | With Mortgage |
| Less than $10,000 | 0 (0.0%) | 0 (0.0%) |
| $10,000 to $24,999 | 32 (52.5%) | 0 (0.0%) |
| $25,000 to $34,999 | 9 (14.7%) | 0 (0.0%) |
| $35,000 to $49,999 | 12 (19.7%) | 0 (0.0%) |
| $50,000 to $74,999 | 0 (0.0%) | 25 (61.0%) |
| $75,000 to $99,999 | 0 (0.0%) | 0 (0.0%) |
| $100,000 to $149,999 | 8 (13.1%) | 16 (39.0%) |
| $150,000 or more | 0 (0.0%) | 0 (0.0%) |
| Total | 61 (100.0%) | 41 (100.0%) |
Property Value to Household Income Ratio in East Alto Bonito
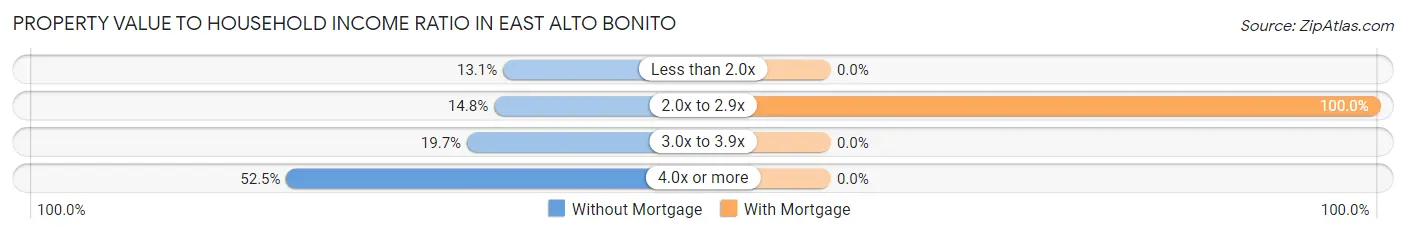
| Value-to-Income Ratio | Without Mortgage | With Mortgage |
| Less than 2.0x | 8 (13.1%) | 0 (0.0%) |
| 2.0x to 2.9x | 9 (14.7%) | 41 (100.0%) |
| 3.0x to 3.9x | 12 (19.7%) | 0 (0.0%) |
| 4.0x or more | 32 (52.5%) | 0 (0.0%) |
| Total | 61 (100.0%) | 41 (100.0%) |
Real Estate Taxes by Mortgage Status in East Alto Bonito
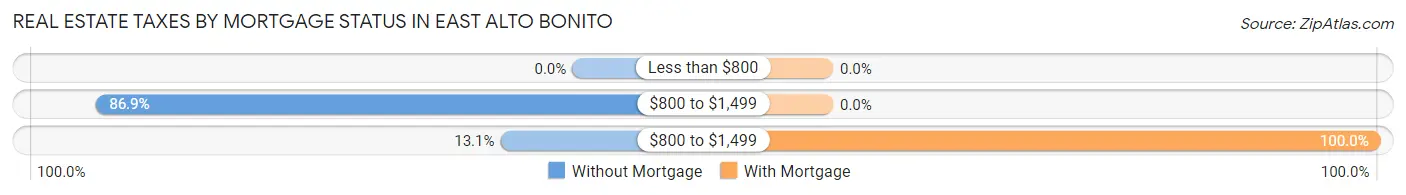
| Property Taxes | Without Mortgage | With Mortgage |
| Less than $800 | 0 (0.0%) | 0 (0.0%) |
| $800 to $1,499 | 53 (86.9%) | 0 (0.0%) |
| $800 to $1,499 | 8 (13.1%) | 41 (100.0%) |
| Total | 61 (100.0%) | 41 (100.0%) |
Health & Disability in East Alto Bonito
Health Insurance Coverage by Age in East Alto Bonito
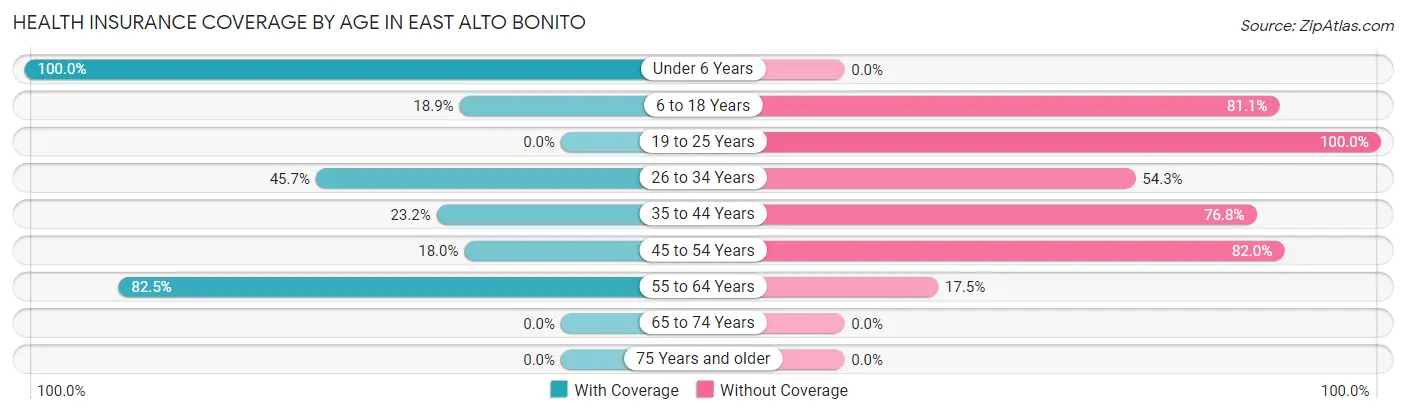
| Age Bracket | With Coverage | Without Coverage |
| Under 6 Years | 33 (100.0%) | 0 (0.0%) |
| 6 to 18 Years | 14 (18.9%) | 60 (81.1%) |
| 19 to 25 Years | 0 (0.0%) | 221 (100.0%) |
| 26 to 34 Years | 16 (45.7%) | 19 (54.3%) |
| 35 to 44 Years | 16 (23.2%) | 53 (76.8%) |
| 45 to 54 Years | 9 (18.0%) | 41 (82.0%) |
| 55 to 64 Years | 33 (82.5%) | 7 (17.5%) |
| 65 to 74 Years | 0 (0.0%) | 0 (0.0%) |
| 75 Years and older | 0 (0.0%) | 0 (0.0%) |
| Total | 121 (23.2%) | 401 (76.8%) |
Health Insurance Coverage by Citizenship Status in East Alto Bonito
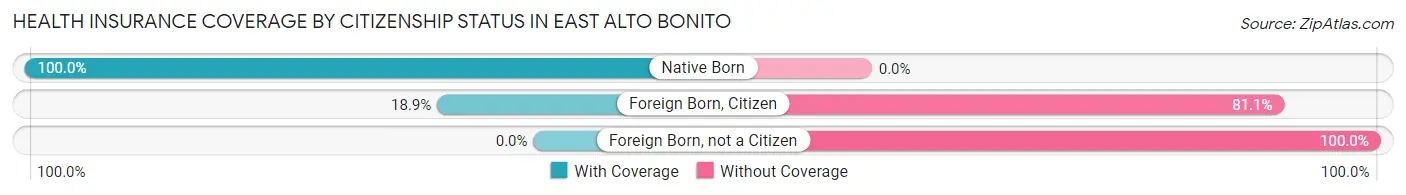
| Citizenship Status | With Coverage | Without Coverage |
| Native Born | 33 (100.0%) | 0 (0.0%) |
| Foreign Born, Citizen | 14 (18.9%) | 60 (81.1%) |
| Foreign Born, not a Citizen | 0 (0.0%) | 221 (100.0%) |
Health Insurance Coverage by Household Income in East Alto Bonito
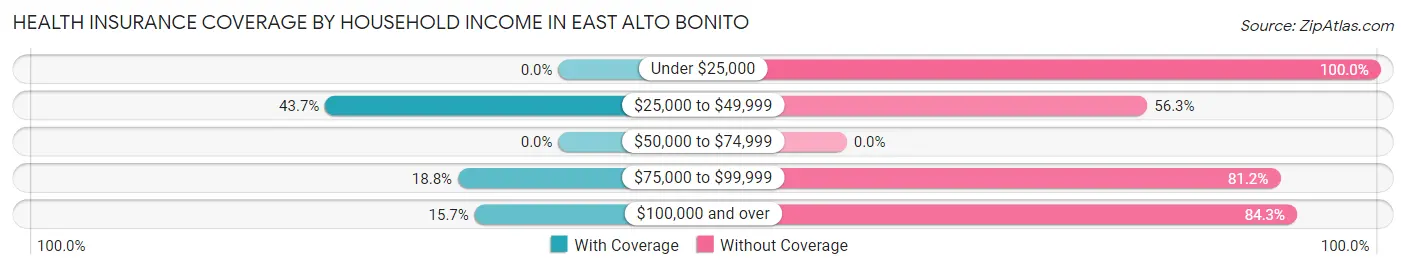
| Household Income | With Coverage | Without Coverage |
| Under $25,000 | 0 (0.0%) | 164 (100.0%) |
| $25,000 to $49,999 | 97 (43.7%) | 125 (56.3%) |
| $50,000 to $74,999 | 0 (0.0%) | 0 (0.0%) |
| $75,000 to $99,999 | 16 (18.8%) | 69 (81.2%) |
| $100,000 and over | 8 (15.7%) | 43 (84.3%) |
Public vs Private Health Insurance Coverage by Age in East Alto Bonito
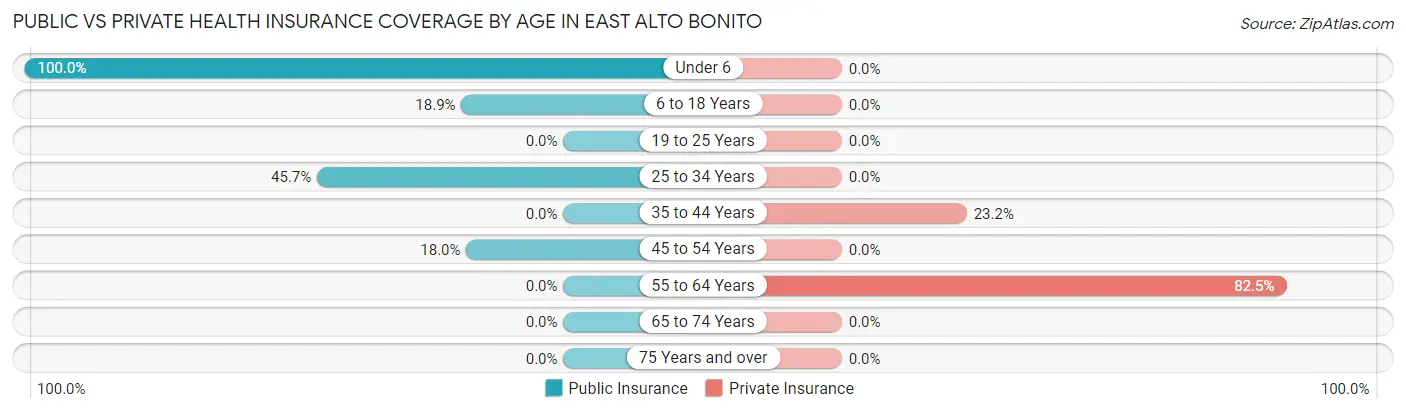
| Age Bracket | Public Insurance | Private Insurance |
| Under 6 | 33 (100.0%) | 0 (0.0%) |
| 6 to 18 Years | 14 (18.9%) | 0 (0.0%) |
| 19 to 25 Years | 0 (0.0%) | 0 (0.0%) |
| 25 to 34 Years | 16 (45.7%) | 0 (0.0%) |
| 35 to 44 Years | 0 (0.0%) | 16 (23.2%) |
| 45 to 54 Years | 9 (18.0%) | 0 (0.0%) |
| 55 to 64 Years | 0 (0.0%) | 33 (82.5%) |
| 65 to 74 Years | 0 (0.0%) | 0 (0.0%) |
| 75 Years and over | 0 (0.0%) | 0 (0.0%) |
| Total | 72 (13.8%) | 49 (9.4%) |
Disability Status by Sex by Age in East Alto Bonito
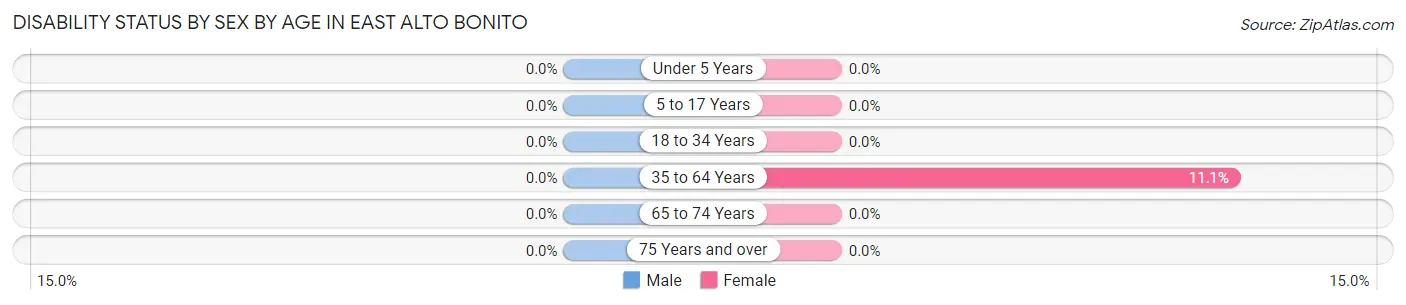
| Age Bracket | Male | Female |
| Under 5 Years | 0 (0.0%) | 0 (0.0%) |
| 5 to 17 Years | 0 (0.0%) | 0 (0.0%) |
| 18 to 34 Years | 0 (0.0%) | 0 (0.0%) |
| 35 to 64 Years | 0 (0.0%) | 9 (11.1%) |
| 65 to 74 Years | 0 (0.0%) | 0 (0.0%) |
| 75 Years and over | 0 (0.0%) | 0 (0.0%) |
Disability Class by Sex by Age in East Alto Bonito
Disability Class: Hearing Difficulty
| Age Bracket | Male | Female |
| Under 5 Years | 0 (0.0%) | 0 (0.0%) |
| 5 to 17 Years | 0 (0.0%) | 0 (0.0%) |
| 18 to 34 Years | 0 (0.0%) | 0 (0.0%) |
| 35 to 64 Years | 0 (0.0%) | 0 (0.0%) |
| 65 to 74 Years | 0 (0.0%) | 0 (0.0%) |
| 75 Years and over | 0 (0.0%) | 0 (0.0%) |
Disability Class: Vision Difficulty
| Age Bracket | Male | Female |
| Under 5 Years | 0 (0.0%) | 0 (0.0%) |
| 5 to 17 Years | 0 (0.0%) | 0 (0.0%) |
| 18 to 34 Years | 0 (0.0%) | 0 (0.0%) |
| 35 to 64 Years | 0 (0.0%) | 9 (11.1%) |
| 65 to 74 Years | 0 (0.0%) | 0 (0.0%) |
| 75 Years and over | 0 (0.0%) | 0 (0.0%) |
Disability Class: Cognitive Difficulty
| Age Bracket | Male | Female |
| 5 to 17 Years | 0 (0.0%) | 0 (0.0%) |
| 18 to 34 Years | 0 (0.0%) | 0 (0.0%) |
| 35 to 64 Years | 0 (0.0%) | 0 (0.0%) |
| 65 to 74 Years | 0 (0.0%) | 0 (0.0%) |
| 75 Years and over | 0 (0.0%) | 0 (0.0%) |
Disability Class: Ambulatory Difficulty
| Age Bracket | Male | Female |
| 5 to 17 Years | 0 (0.0%) | 0 (0.0%) |
| 18 to 34 Years | 0 (0.0%) | 0 (0.0%) |
| 35 to 64 Years | 0 (0.0%) | 9 (11.1%) |
| 65 to 74 Years | 0 (0.0%) | 0 (0.0%) |
| 75 Years and over | 0 (0.0%) | 0 (0.0%) |
Disability Class: Self-Care Difficulty
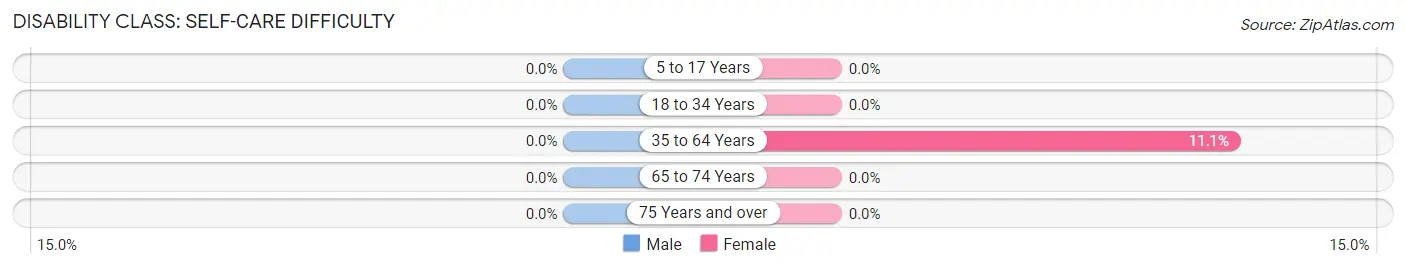
| Age Bracket | Male | Female |
| 5 to 17 Years | 0 (0.0%) | 0 (0.0%) |
| 18 to 34 Years | 0 (0.0%) | 0 (0.0%) |
| 35 to 64 Years | 0 (0.0%) | 9 (11.1%) |
| 65 to 74 Years | 0 (0.0%) | 0 (0.0%) |
| 75 Years and over | 0 (0.0%) | 0 (0.0%) |
Technology Access in East Alto Bonito
Computing Device Access in East Alto Bonito
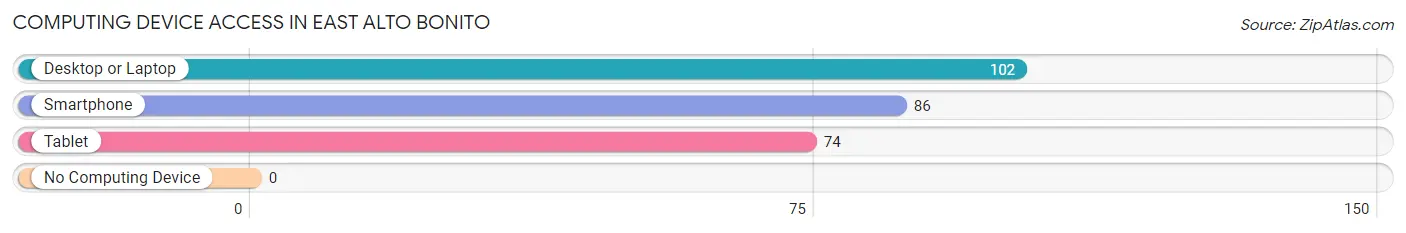
| Device Type | # Households | % Households |
| Desktop or Laptop | 102 | 100.0% |
| Smartphone | 86 | 84.3% |
| Tablet | 74 | 72.6% |
| No Computing Device | 0 | 0.0% |
| Total | 102 | 100.0% |
Internet Access in East Alto Bonito
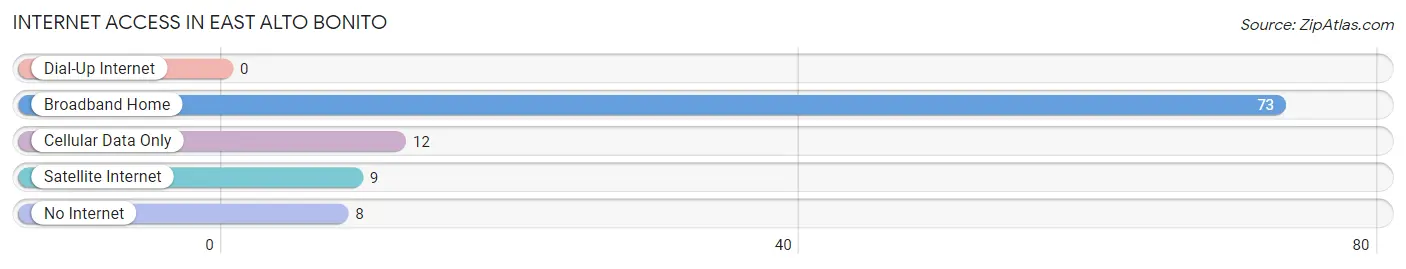
| Internet Type | # Households | % Households |
| Dial-Up Internet | 0 | 0.0% |
| Broadband Home | 73 | 71.6% |
| Cellular Data Only | 12 | 11.8% |
| Satellite Internet | 9 | 8.8% |
| No Internet | 8 | 7.8% |
| Total | 102 | 100.0% |
East Alto Bonito Summary
History
East Alto Bonito is a small unincorporated community located in Starr County, Texas. It is situated on the banks of the Rio Grande, just south of the city of Rio Grande City. The area was first settled in the late 1800s by Mexican and Tejano settlers, who were attracted to the fertile land and abundant water sources. The community was originally known as El Alto Bonito, which translates to “the beautiful high place” in Spanish.
In the early 1900s, East Alto Bonito began to grow as a farming and ranching community. The area was known for its production of cotton, corn, and other crops. The community also had a thriving dairy industry, with several local dairies producing milk, cheese, and other dairy products.
In the mid-1900s, East Alto Bonito began to experience a population boom as more people moved to the area. This was due in part to the construction of the Falcon Dam, which provided irrigation water to the area and allowed for increased agricultural production. The population of East Alto Bonito continued to grow throughout the 20th century, and by the 2000 census, the population was estimated to be around 1,500.
Geography
East Alto Bonito is located in Starr County, Texas, on the banks of the Rio Grande. The area is situated in the Rio Grande Valley, which is known for its fertile soil and abundant water sources. The climate in the area is semi-arid, with hot summers and mild winters.
The terrain in East Alto Bonito is mostly flat, with some rolling hills. The area is mostly covered in grasslands, with some areas of scrubland and desert. The Rio Grande serves as the western border of the community, and the Falcon Dam is located just to the north.
Economy
The economy of East Alto Bonito is largely based on agriculture. The area is known for its production of cotton, corn, and other crops. The area also has a thriving dairy industry, with several local dairies producing milk, cheese, and other dairy products.
In addition to agriculture, East Alto Bonito also has a growing tourism industry. The area is known for its beautiful scenery and outdoor activities, such as fishing, hunting, and bird watching. The area also has several historical sites, including the Falcon Dam and the historic town of Rio Grande City.
Demographics
As of the 2000 census, the population of East Alto Bonito was estimated to be around 1,500. The population is mostly Hispanic, with a small percentage of other ethnicities. The median household income in the area is around $25,000, and the median home value is around $50,000. The area has a high poverty rate, with around 40% of the population living below the poverty line.
Common Questions
What is Per Capita Income in East Alto Bonito?
Per Capita income in East Alto Bonito is $12,198.
What is the Median Family Income in East Alto Bonito?
Median Family Income in East Alto Bonito is $41,000.
What is the Median Household income in East Alto Bonito?
Median Household Income in East Alto Bonito is $41,000.
What is Inequality or Gini Index in East Alto Bonito?
Inequality or Gini Index in East Alto Bonito is 0.31.
What is the Total Population of East Alto Bonito?
Total Population of East Alto Bonito is 522.
What is the Total Male Population of East Alto Bonito?
Total Male Population of East Alto Bonito is 199.
What is the Total Female Population of East Alto Bonito?
Total Female Population of East Alto Bonito is 323.
What is the Ratio of Males per 100 Females in East Alto Bonito?
There are 61.61 Males per 100 Females in East Alto Bonito.
What is the Ratio of Females per 100 Males in East Alto Bonito?
There are 162.31 Females per 100 Males in East Alto Bonito.
What is the Median Population Age in East Alto Bonito?
Median Population Age in East Alto Bonito is 21.6 Years.
What is the Average Family Size in East Alto Bonito
Average Family Size in East Alto Bonito is 5.0 People.
What is the Average Household Size in East Alto Bonito
Average Household Size in East Alto Bonito is 5.1 People.
How Large is the Labor Force in East Alto Bonito?
There are 278 People in the Labor Forcein in East Alto Bonito.
What is the Percentage of People in the Labor Force in East Alto Bonito?
63.5% of People are in the Labor Force in East Alto Bonito.