Zip Codes with the Highest Poverty Level Among Children Under the Age of 5 in Fort Worth, TX

RELATED REPORTS & OPTIONS

Highest Poverty | Child 0-5
Population
Families and Households
Female Fertility
Female Fertility (Unmarried)
Race (Community Size)
Race (Percentage)
Ancestry (Community Size)
AfghanAfricanAlbanianAlsatianAmericanApacheArabArgentineanArmenianAustralianAustrianBahamianBangladeshiBarbadianBasqueBelgianBhutaneseBlackfeetBolivianBrazilianBritishBritish West IndianBulgarianBurmeseCajunCambodianCanadianCelticCentral AmericanCentral American IndianCherokeeCheyenneChickasawChileanChippewaChoctawColombianComancheCosta RicanCreekCroatianCrowCubanCzechCzechoslovakianDanishDelawareDominicanDutchDutch West IndianEastern EuropeanEcuadorianEgyptianEnglishEstonianEthiopianEuropeanFilipinoFinnishFrenchFrench American IndianFrench CanadianGermanGerman RussianGhanaianGreekGuamanian / ChamorroGuatemalanGuyaneseHaitianHonduranHopiHungarianIcelanderIndian (Asian)IndonesianInupiatIranianIraqiIrishIroquoisIsraeliItalianJamaicanJapaneseJordanianKenyanKiowaKoreanLaotianLatvianLebaneseLiberianLithuanianLuxembourgerMalaysianMalteseMexicanMexican American IndianMongolianMoroccanNative HawaiianNavajoNicaraguanNigerianNorthern EuropeanNorwegianOsageOttawaPakistaniPalestinianPanamanianPennsylvania GermanPeruvianPolishPortuguesePotawatomiPuebloPuerto RicanRomanianRussianSalvadoranSamoanScandinavianScotch-IrishScottishSerbianSiouxSlavicSlovakSloveneSomaliSouth AfricanSouth AmericanSouth American IndianSpaniardSpanishSpanish AmericanSpanish American IndianSri LankanSubsaharan AfricanSudaneseSwedishSwissSyrianThaiTonganTrinidadian and TobagonianTurkishUgandanUkrainianVenezuelanVietnameseWelshWest IndianYaquiYugoslavianZimbabwean
Ancestry (Percentage)
AfghanAfricanAlbanianAlsatianAmericanApacheArabArgentineanArmenianAustralianAustrianBahamianBangladeshiBarbadianBasqueBelgianBhutaneseBlackfeetBolivianBrazilianBritishBritish West IndianBulgarianBurmeseCajunCambodianCanadianCelticCentral AmericanCentral American IndianCherokeeCheyenneChickasawChileanChippewaChoctawColombianComancheCosta RicanCreekCroatianCrowCubanCzechCzechoslovakianDanishDelawareDominicanDutchDutch West IndianEastern EuropeanEcuadorianEgyptianEnglishEstonianEthiopianEuropeanFilipinoFinnishFrenchFrench American IndianFrench CanadianGermanGerman RussianGhanaianGreekGuamanian / ChamorroGuatemalanGuyaneseHaitianHonduranHopiHungarianIcelanderIndian (Asian)IndonesianInupiatIranianIraqiIrishIroquoisIsraeliItalianJamaicanJapaneseJordanianKenyanKiowaKoreanLaotianLatvianLebaneseLiberianLithuanianLuxembourgerMalaysianMalteseMexicanMexican American IndianMongolianMoroccanNative HawaiianNavajoNicaraguanNigerianNorthern EuropeanNorwegianOsageOttawaPakistaniPalestinianPanamanianPennsylvania GermanPeruvianPolishPortuguesePotawatomiPuebloPuerto RicanRomanianRussianSalvadoranSamoanScandinavianScotch-IrishScottishSerbianSiouxSlavicSlovakSloveneSomaliSouth AfricanSouth AmericanSouth American IndianSpaniardSpanishSpanish AmericanSpanish American IndianSri LankanSubsaharan AfricanSudaneseSwedishSwissSyrianThaiTonganTrinidadian and TobagonianTurkishUgandanUkrainianVenezuelanVietnameseWelshWest IndianYaquiYugoslavianZimbabwean
Immigrant Origin (Total)
AfghanistanAfricaAlbaniaArgentinaAsiaAustraliaBahamasBangladeshBarbadosBelarusBelizeBoliviaBosnia and HerzegovinaBrazilBulgariaBurma / MyanmarCambodiaCameroonCanadaCaribbeanCentral AmericaChileChinaColombiaCongoCosta RicaCroatiaCubaCzechoslovakiaDominican RepublicEastern AfricaEastern AsiaEastern EuropeEcuadorEgyptEl SalvadorEnglandEritreaEthiopiaEuropeFranceGermanyGhanaGreeceGuatemalaHaitiHondurasHong KongHungaryIndiaIndonesiaIranIraqIrelandIsraelItalyJamaicaJapanJordanKenyaKoreaLaosLatin AmericaLebanonLiberiaMalaysiaMexicoMicronesiaMiddle AfricaMoroccoNepalNetherlandsNicaraguaNigeriaNorthern AfricaNorthern EuropeOceaniaPakistanPanamaPeruPhilippinesPolandPortugalRomaniaRussiaScotlandSenegalSerbiaSomaliaSouth AfricaSouth AmericaSouth Central AsiaSouth Eastern AsiaSouthern EuropeSpainSri LankaSudanSwedenSwitzerlandSyriaTaiwanThailandTrinidad and TobagoTurkeyUgandaUkraineVenezuelaVietnamWestern AfricaWestern AsiaWestern EuropeZaireZimbabwe
Immigrant Origin (Percentage)
AfghanistanAfricaAlbaniaArgentinaAsiaAustraliaBahamasBangladeshBarbadosBelarusBelizeBoliviaBosnia and HerzegovinaBrazilBulgariaBurma / MyanmarCambodiaCameroonCanadaCaribbeanCentral AmericaChileChinaColombiaCongoCosta RicaCroatiaCubaCzechoslovakiaDominican RepublicEastern AfricaEastern AsiaEastern EuropeEcuadorEgyptEl SalvadorEnglandEritreaEthiopiaEuropeFranceGermanyGhanaGreeceGuatemalaHaitiHondurasHong KongHungaryIndiaIndonesiaIranIraqIrelandIsraelItalyJamaicaJapanJordanKenyaKoreaLaosLatin AmericaLebanonLiberiaMalaysiaMexicoMicronesiaMiddle AfricaMoroccoNepalNetherlandsNicaraguaNigeriaNorthern AfricaNorthern EuropeOceaniaPakistanPanamaPeruPhilippinesPolandPortugalRomaniaRussiaScotlandSenegalSerbiaSomaliaSouth AfricaSouth AmericaSouth Central AsiaSouth Eastern AsiaSouthern EuropeSpainSri LankaSudanSwedenSwitzerlandSyriaTaiwanThailandTrinidad and TobagoTurkeyUgandaUkraineVenezuelaVietnamWestern AfricaWestern AsiaWestern EuropeZaireZimbabwe
Income
Income (Families)
Income (Households)
Poverty
Poverty (Families)
Unemployment
Employment Occupations
Employment Industries
Employer Class
Commute Time
Commute Means
School Enrollment
Education by Degree Field
Occupancy
Finances
Physical Characteristics
Fort Worth
Compare Zip Codes
Comparison Subject

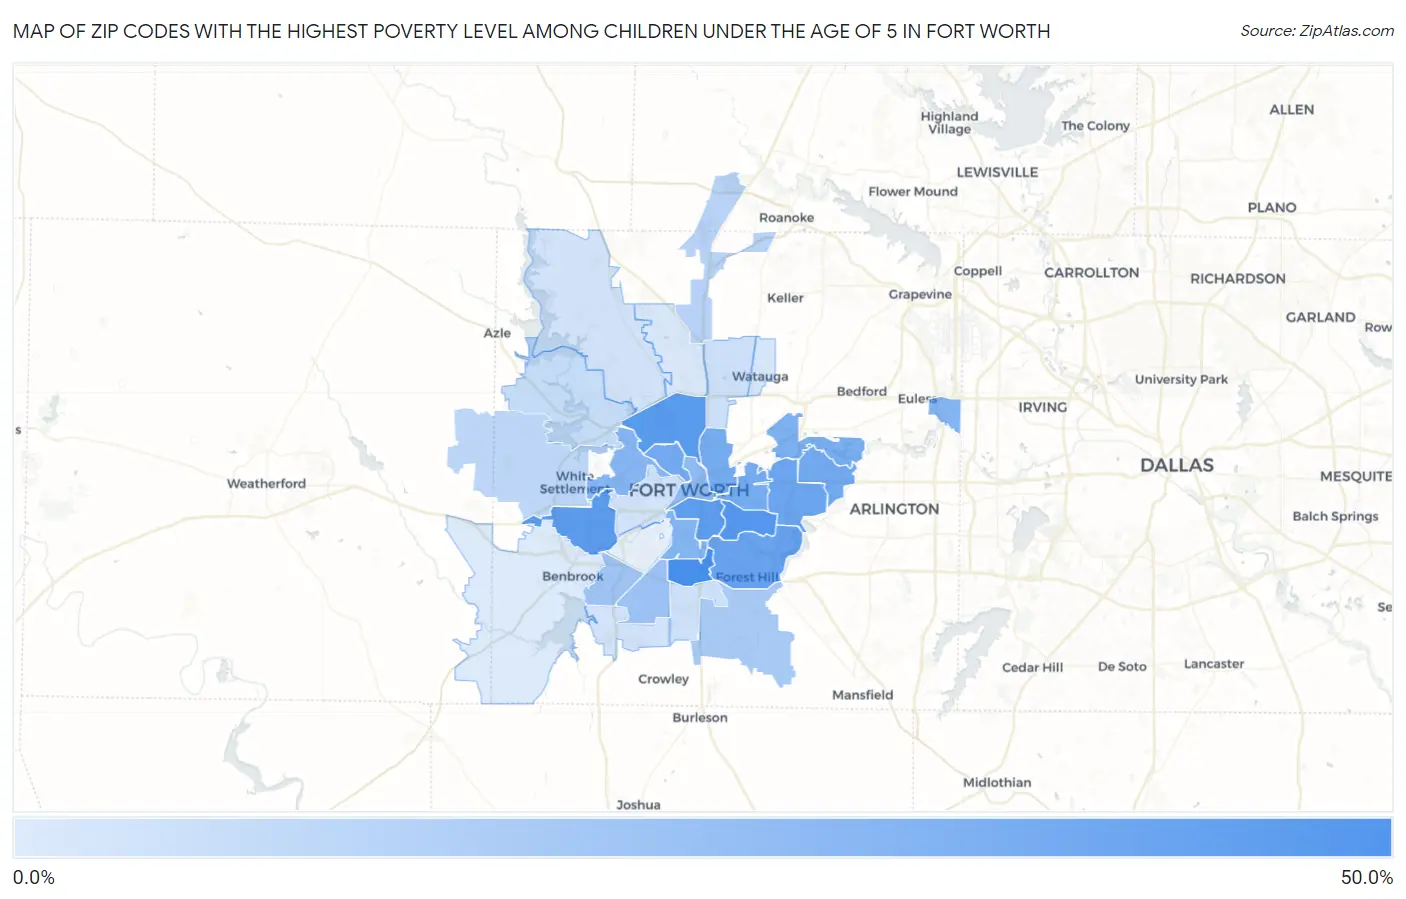
Map of Zip Codes with the Highest Poverty Level Among Children Under the Age of 5 in Fort Worth

0.0%
50.0%
Zip Codes with the Highest Poverty Level Among Children Under the Age of 5 in Fort Worth Map

Zip Codes with the Highest Poverty Level Among Children Under the Age of 5 in Fort Worth, TX

Zip Code Child Poverty vs State vs National
1.7611545.0%21.1%(+23.9)#17818.1%(+27.0)#3,180
2.7610540.8%21.1%(+19.7)#24318.1%(+22.7)#3,869
3.7610640.1%21.1%(+19.0)#25118.1%(+22.0)#3,994
4.7611638.9%21.1%(+17.8)#27418.1%(+20.8)#4,237
5.7610437.6%21.1%(+16.5)#29318.1%(+19.5)#4,478
6.7611935.4%21.1%(+14.3)#33118.1%(+17.3)#4,981
7.7611233.6%21.1%(+12.5)#36418.1%(+15.5)#5,393
8.7612031.6%21.1%(+10.5)#40718.1%(+13.6)#5,924
9.7616431.4%21.1%(+10.3)#41018.1%(+13.3)#5,979
10.7610330.7%21.1%(+9.62)#42418.1%(+12.6)#6,168
11.7611130.7%21.1%(+9.60)#42518.1%(+12.6)#6,173
12.7611829.0%21.1%(+7.93)#47418.1%(+10.9)#6,652
13.7615527.0%21.1%(+5.95)#53218.1%(+8.97)#7,297
14.7611026.9%21.1%(+5.82)#53518.1%(+8.84)#7,334
15.7611426.3%21.1%(+5.21)#55118.1%(+8.23)#7,552
16.7610224.1%21.1%(+3.05)#60318.1%(+6.08)#8,296
17.7613320.7%21.1%(-0.338)#69618.1%(+2.69)#9,706
18.7613218.7%21.1%(-2.37)#75018.1%(+0.657)#10,633
19.7614017.3%21.1%(-3.79)#78818.1%(-0.765)#11,278
20.7617712.8%21.1%(-8.32)#94918.1%(-5.29)#13,764
21.7610811.9%21.1%(-9.20)#97918.1%(-6.17)#14,282
22.761359.8%21.1%(-11.3)#1,06518.1%(-8.27)#15,539
23.761377.8%21.1%(-13.3)#1,12818.1%(-10.3)#16,870
24.761347.2%21.1%(-13.9)#1,15318.1%(-10.9)#17,251
25.761237.1%21.1%(-14.0)#1,15718.1%(-11.0)#17,327
26.761796.8%21.1%(-14.3)#1,17218.1%(-11.3)#17,543
27.761076.7%21.1%(-14.4)#1,17818.1%(-11.4)#17,648
28.761486.0%21.1%(-15.1)#1,19518.1%(-12.0)#18,065
29.761315.1%21.1%(-16.0)#1,22518.1%(-13.0)#18,724
30.761264.2%21.1%(-16.9)#1,25618.1%(-13.9)#19,323

Common Questions

What are the Top 10 Zip Codes with the Highest Poverty Level Among Children Under the Age of 5 in Fort Worth, TX?
Top 10 Zip Codes with the Highest Poverty Level Among Children Under the Age of 5 in Fort Worth, TX are:
#1
45.0%
#2
40.8%
#3
40.1%
#4
38.9%
#5
37.6%
#6
35.4%
#7
33.6%
#8
31.6%
#9
31.4%
#10
30.7%
What zip code has the Highest Poverty Level Among Children Under the Age of 5 in Fort Worth, TX?
76115 has the Highest Poverty Level Among Children Under the Age of 5 in Fort Worth, TX with 45.0%.
What is the Poverty Level Among Children Under the Age of 5 in Fort Worth, TX?
Poverty Level Among Children Under the Age of 5 in Fort Worth is 19.6%.
What is the Poverty Level Among Children Under the Age of 5 in Texas?
Poverty Level Among Children Under the Age of 5 in Texas is 21.1%.
What is the Poverty Level Among Children Under the Age of 5 in the United States?
Poverty Level Among Children Under the Age of 5 in the United States is 18.1%.