Zip Codes with the Highest Poverty Level Among Children Under the Age of 5 in Texas
RELATED REPORTS & OPTIONS
Highest Poverty | Child 0-5
Texas
Compare Zip Codes
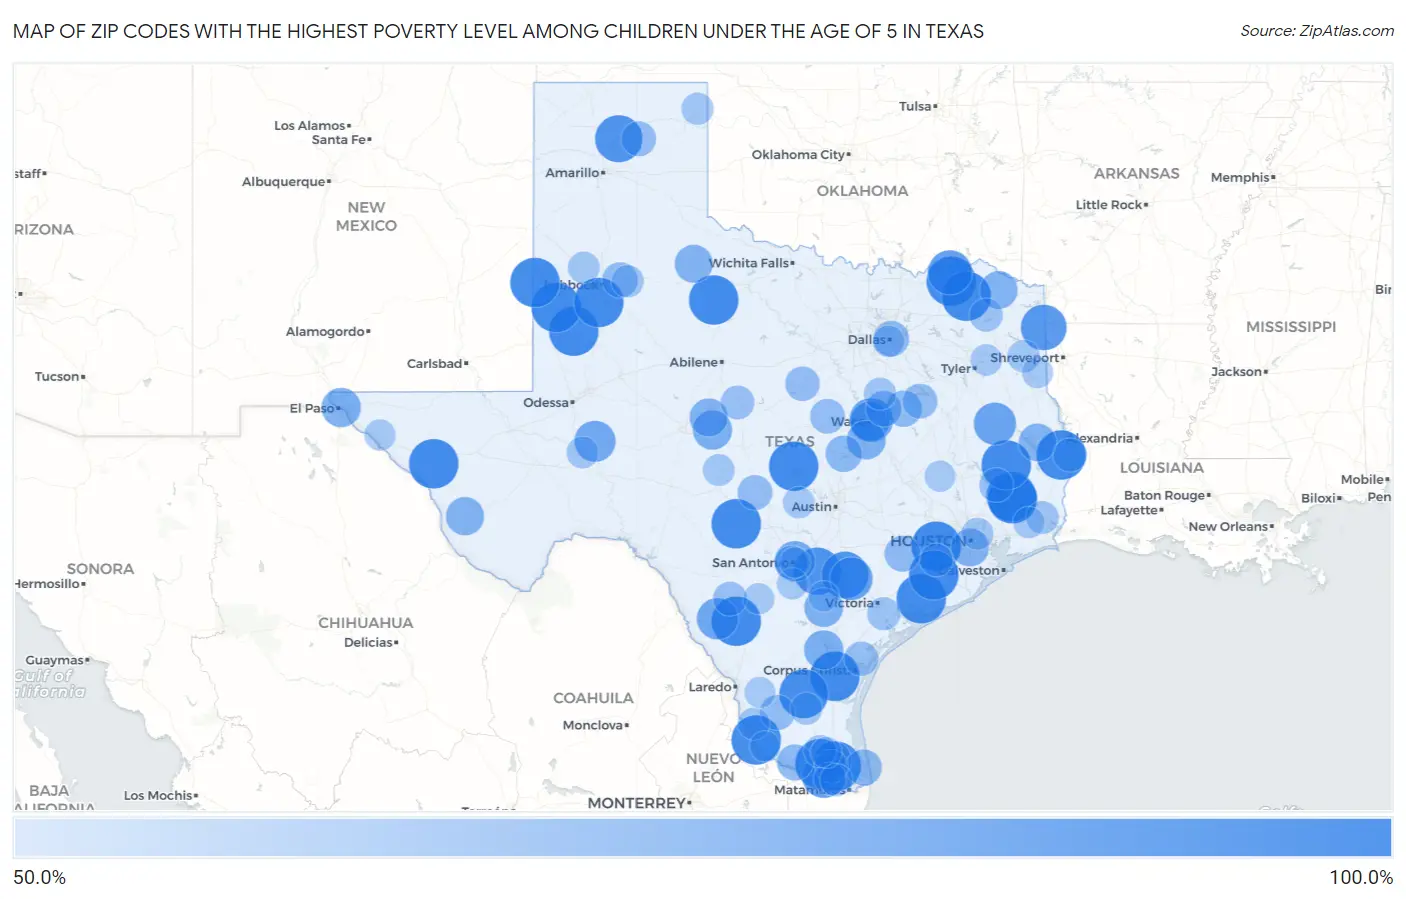
Map of Zip Codes with the Highest Poverty Level Among Children Under the Age of 5 in Texas
50.0%
100.0%
Zip Codes with the Highest Poverty Level Among Children Under the Age of 5 in Texas
| Zip Code | Child Poverty | vs State | vs National | |
| 1. | 79855 | 100.0% | 21.1%(+78.9)#1 | 18.1%(+81.9)#20 |
| 2. | 78024 | 100.0% | 21.1%(+78.9)#2 | 18.1%(+81.9)#70 |
| 3. | 75421 | 100.0% | 21.1%(+78.9)#3 | 18.1%(+81.9)#115 |
| 4. | 77419 | 100.0% | 21.1%(+78.9)#4 | 18.1%(+81.9)#146 |
| 5. | 78672 | 100.0% | 21.1%(+78.9)#5 | 18.1%(+81.9)#163 |
| 6. | 78351 | 100.0% | 21.1%(+78.9)#6 | 18.1%(+81.9)#177 |
| 7. | 78535 | 100.0% | 21.1%(+78.9)#7 | 18.1%(+81.9)#184 |
| 8. | 77376 | 100.0% | 21.1%(+78.9)#8 | 18.1%(+81.9)#191 |
| 9. | 78558 | 100.0% | 21.1%(+78.9)#9 | 18.1%(+81.9)#222 |
| 10. | 75450 | 100.0% | 21.1%(+78.9)#10 | 18.1%(+81.9)#240 |
| 11. | 78830 | 100.0% | 21.1%(+78.9)#11 | 18.1%(+81.9)#241 |
| 12. | 75977 | 100.0% | 21.1%(+78.9)#12 | 18.1%(+81.9)#248 |
| 13. | 77374 | 100.0% | 21.1%(+78.9)#13 | 18.1%(+81.9)#286 |
| 14. | 79342 | 100.0% | 21.1%(+78.9)#14 | 18.1%(+81.9)#301 |
| 15. | 77476 | 100.0% | 21.1%(+78.9)#15 | 18.1%(+81.9)#358 |
| 16. | 79539 | 100.0% | 21.1%(+78.9)#16 | 18.1%(+81.9)#417 |
| 17. | 77453 | 100.0% | 21.1%(+78.9)#17 | 18.1%(+81.9)#428 |
| 18. | 75934 | 100.0% | 21.1%(+78.9)#18 | 18.1%(+81.9)#471 |
| 19. | 79376 | 100.0% | 21.1%(+78.9)#19 | 18.1%(+81.9)#500 |
| 20. | 79314 | 100.0% | 21.1%(+78.9)#20 | 18.1%(+81.9)#505 |
| 21. | 79383 | 100.0% | 21.1%(+78.9)#21 | 18.1%(+81.9)#519 |
| 22. | 78564 | 100.0% | 21.1%(+78.9)#22 | 18.1%(+81.9)#545 |
| 23. | 78349 | 98.5% | 21.1%(+77.4)#23 | 18.1%(+80.4)#562 |
| 24. | 78161 | 95.0% | 21.1%(+73.9)#24 | 18.1%(+76.9)#583 |
| 25. | 79078 | 94.7% | 21.1%(+73.7)#25 | 18.1%(+76.7)#586 |
| 26. | 78159 | 93.8% | 21.1%(+72.7)#26 | 18.1%(+75.7)#594 |
| 27. | 75565 | 91.4% | 21.1%(+70.3)#27 | 18.1%(+73.3)#623 |
| 28. | 75486 | 88.0% | 21.1%(+66.9)#28 | 18.1%(+69.9)#655 |
| 29. | 76704 | 86.7% | 21.1%(+65.6)#29 | 18.1%(+68.6)#676 |
| 30. | 78579 | 86.0% | 21.1%(+64.9)#30 | 18.1%(+67.9)#689 |
| 31. | 77994 | 84.4% | 21.1%(+63.4)#31 | 18.1%(+66.4)#721 |
| 32. | 75976 | 83.5% | 21.1%(+62.4)#32 | 18.1%(+65.4)#737 |
| 33. | 78834 | 81.6% | 21.1%(+60.5)#33 | 18.1%(+63.5)#777 |
| 34. | 79778 | 81.0% | 21.1%(+59.9)#34 | 18.1%(+62.9)#791 |
| 35. | 78208 | 79.2% | 21.1%(+58.1)#35 | 18.1%(+61.1)#840 |
| 36. | 76701 | 77.8% | 21.1%(+56.7)#36 | 18.1%(+59.7)#874 |
| 37. | 76866 | 76.8% | 21.1%(+55.7)#37 | 18.1%(+58.8)#904 |
| 38. | 78383 | 76.8% | 21.1%(+55.7)#38 | 18.1%(+58.8)#905 |
| 39. | 79905 | 76.7% | 21.1%(+55.6)#39 | 18.1%(+58.6)#910 |
| 40. | 78119 | 75.8% | 21.1%(+54.7)#40 | 18.1%(+57.8)#932 |
| 41. | 76524 | 75.6% | 21.1%(+54.6)#41 | 18.1%(+57.6)#942 |
| 42. | 79843 | 74.3% | 21.1%(+53.2)#42 | 18.1%(+56.2)#995 |
| 43. | 76875 | 73.9% | 21.1%(+52.8)#43 | 18.1%(+55.9)#1,010 |
| 44. | 77051 | 73.8% | 21.1%(+52.8)#44 | 18.1%(+55.8)#1,013 |
| 45. | 79248 | 73.8% | 21.1%(+52.7)#45 | 18.1%(+55.7)#1,016 |
| 46. | 75929 | 73.4% | 21.1%(+52.4)#46 | 18.1%(+55.4)#1,031 |
| 47. | 78594 | 73.3% | 21.1%(+52.2)#47 | 18.1%(+55.3)#1,036 |
| 48. | 75550 | 73.1% | 21.1%(+52.0)#48 | 18.1%(+55.0)#1,047 |
| 49. | 76559 | 70.2% | 21.1%(+49.1)#49 | 18.1%(+52.1)#1,138 |
| 50. | 76686 | 70.0% | 21.1%(+48.9)#50 | 18.1%(+51.9)#1,149 |
| 51. | 78597 | 69.7% | 21.1%(+48.7)#51 | 18.1%(+51.7)#1,158 |
| 52. | 78576 | 69.7% | 21.1%(+48.6)#52 | 18.1%(+51.6)#1,161 |
| 53. | 77470 | 69.2% | 21.1%(+48.1)#53 | 18.1%(+51.2)#1,186 |
| 54. | 76673 | 69.0% | 21.1%(+48.0)#54 | 18.1%(+51.0)#1,195 |
| 55. | 75246 | 68.7% | 21.1%(+47.6)#55 | 18.1%(+50.6)#1,204 |
| 56. | 79343 | 68.4% | 21.1%(+47.3)#56 | 18.1%(+50.3)#1,218 |
| 57. | 78361 | 67.4% | 21.1%(+46.3)#57 | 18.1%(+49.4)#1,259 |
| 58. | 75859 | 66.7% | 21.1%(+45.6)#58 | 18.1%(+48.6)#1,278 |
| 59. | 76538 | 66.7% | 21.1%(+45.6)#59 | 18.1%(+48.6)#1,284 |
| 60. | 79080 | 66.7% | 21.1%(+45.6)#60 | 18.1%(+48.6)#1,295 |
| 61. | 78618 | 66.7% | 21.1%(+45.6)#61 | 18.1%(+48.6)#1,304 |
| 62. | 76446 | 66.2% | 21.1%(+45.1)#62 | 18.1%(+48.1)#1,334 |
| 63. | 78359 | 65.4% | 21.1%(+44.3)#63 | 18.1%(+47.3)#1,368 |
| 64. | 77335 | 65.1% | 21.1%(+44.0)#64 | 18.1%(+47.0)#1,377 |
| 65. | 78829 | 64.9% | 21.1%(+43.8)#65 | 18.1%(+46.9)#1,386 |
| 66. | 76834 | 64.3% | 21.1%(+43.2)#66 | 18.1%(+46.2)#1,433 |
| 67. | 78207 | 64.2% | 21.1%(+43.1)#67 | 18.1%(+46.2)#1,437 |
| 68. | 75932 | 63.6% | 21.1%(+42.5)#68 | 18.1%(+45.6)#1,467 |
| 69. | 75493 | 63.2% | 21.1%(+42.1)#69 | 18.1%(+45.2)#1,487 |
| 70. | 77951 | 62.8% | 21.1%(+41.7)#70 | 18.1%(+44.7)#1,506 |
| 71. | 78593 | 62.7% | 21.1%(+41.6)#71 | 18.1%(+44.6)#1,515 |
| 72. | 77417 | 62.5% | 21.1%(+41.4)#72 | 18.1%(+44.4)#1,521 |
| 73. | 77703 | 61.9% | 21.1%(+40.8)#73 | 18.1%(+43.9)#1,560 |
| 74. | 78592 | 61.8% | 21.1%(+40.7)#74 | 18.1%(+43.7)#1,576 |
| 75. | 78567 | 61.5% | 21.1%(+40.5)#75 | 18.1%(+43.5)#1,594 |
| 76. | 75670 | 61.5% | 21.1%(+40.4)#76 | 18.1%(+43.4)#1,600 |
| 77. | 78549 | 61.3% | 21.1%(+40.2)#77 | 18.1%(+43.2)#1,609 |
| 78. | 79357 | 61.3% | 21.1%(+40.2)#78 | 18.1%(+43.2)#1,610 |
| 79. | 76631 | 61.1% | 21.1%(+40.0)#79 | 18.1%(+43.0)#1,620 |
| 80. | 79046 | 60.9% | 21.1%(+39.8)#80 | 18.1%(+42.8)#1,631 |
| 81. | 78355 | 60.4% | 21.1%(+39.3)#81 | 18.1%(+42.3)#1,655 |
| 82. | 77078 | 60.3% | 21.1%(+39.2)#82 | 18.1%(+42.2)#1,659 |
| 83. | 78076 | 60.3% | 21.1%(+39.2)#83 | 18.1%(+42.2)#1,661 |
| 84. | 79752 | 60.0% | 21.1%(+38.9)#84 | 18.1%(+41.9)#1,674 |
| 85. | 76859 | 60.0% | 21.1%(+38.9)#85 | 18.1%(+41.9)#1,676 |
| 86. | 79313 | 60.0% | 21.1%(+38.9)#86 | 18.1%(+41.9)#1,678 |
| 87. | 78636 | 59.6% | 21.1%(+38.5)#87 | 18.1%(+41.6)#1,719 |
| 88. | 75203 | 59.3% | 21.1%(+38.2)#88 | 18.1%(+41.2)#1,743 |
| 89. | 77613 | 59.3% | 21.1%(+38.2)#89 | 18.1%(+41.2)#1,747 |
| 90. | 75792 | 59.2% | 21.1%(+38.1)#90 | 18.1%(+41.1)#1,756 |
| 91. | 78050 | 59.0% | 21.1%(+37.9)#91 | 18.1%(+41.0)#1,767 |
| 92. | 79839 | 58.8% | 21.1%(+37.7)#92 | 18.1%(+40.8)#1,779 |
| 93. | 78561 | 58.5% | 21.1%(+37.5)#93 | 18.1%(+40.5)#1,791 |
| 94. | 78061 | 58.5% | 21.1%(+37.4)#94 | 18.1%(+40.4)#1,796 |
| 95. | 75639 | 58.4% | 21.1%(+37.4)#95 | 18.1%(+40.4)#1,799 |
| 96. | 78369 | 58.3% | 21.1%(+37.2)#96 | 18.1%(+40.3)#1,808 |
| 97. | 77831 | 58.2% | 21.1%(+37.2)#97 | 18.1%(+40.2)#1,809 |
| 98. | 78118 | 57.1% | 21.1%(+36.1)#98 | 18.1%(+39.1)#1,882 |
| 99. | 78202 | 57.1% | 21.1%(+36.0)#99 | 18.1%(+39.0)#1,899 |
| 100. | 78584 | 56.9% | 21.1%(+35.8)#100 | 18.1%(+38.9)#1,916 |
Common Questions
What are the Top 10 Zip Codes with the Highest Poverty Level Among Children Under the Age of 5 in Texas?
Top 10 Zip Codes with the Highest Poverty Level Among Children Under the Age of 5 in Texas are:
What zip code has the Highest Poverty Level Among Children Under the Age of 5 in Texas?
79855 has the Highest Poverty Level Among Children Under the Age of 5 in Texas with 100.0%.
What is the Poverty Level Among Children Under the Age of 5 in the State of Texas?
Poverty Level Among Children Under the Age of 5 in Texas is 21.1%.
What is the Poverty Level Among Children Under the Age of 5 in the United States?
Poverty Level Among Children Under the Age of 5 in the United States is 18.1%.