Perezville, TX Map & Demographics
Perezville Map
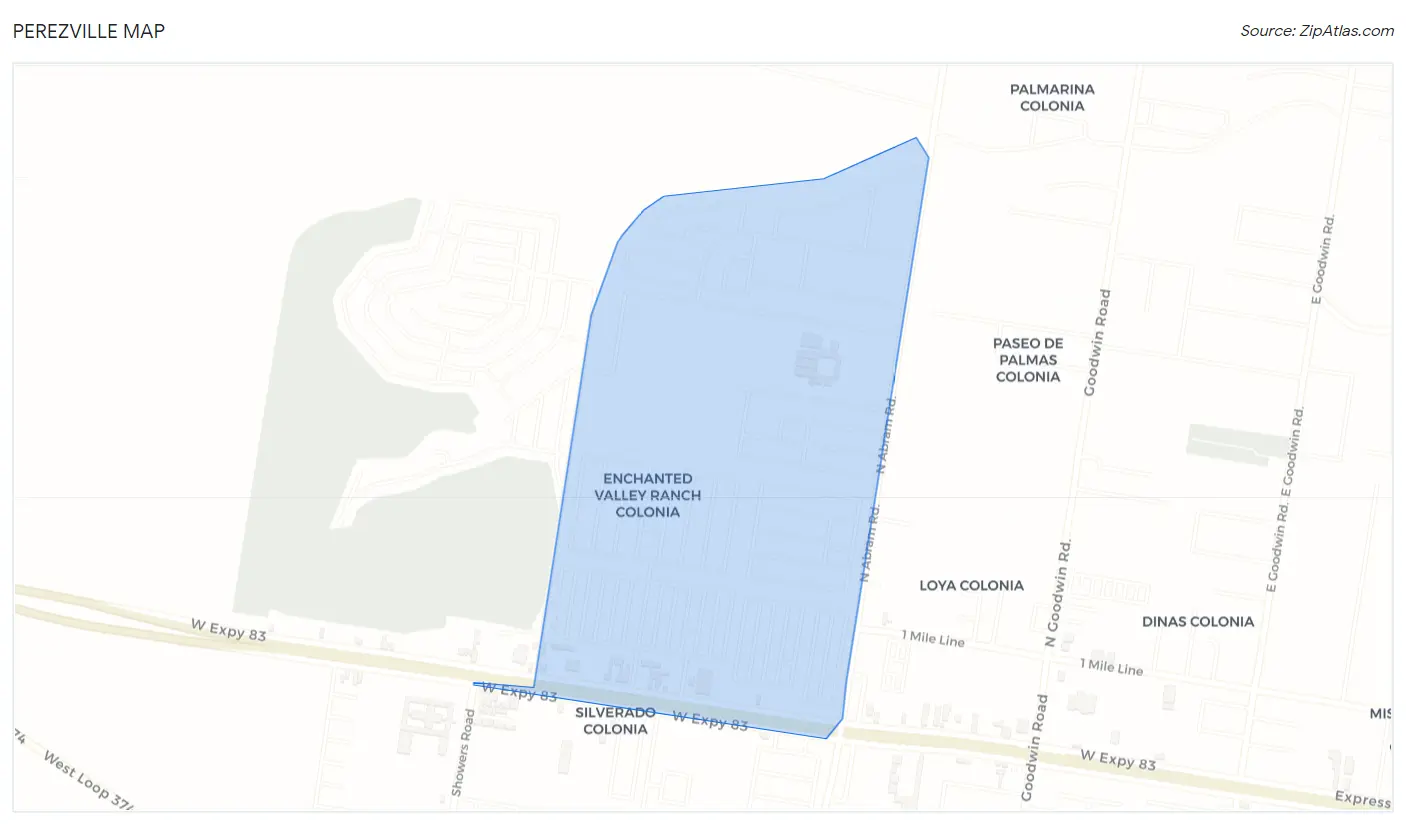
Perezville Overview
$18,195
PER CAPITA INCOME
$54,225
AVG FAMILY INCOME
$45,556
AVG HOUSEHOLD INCOME
58.6%
WAGE / INCOME GAP [ % ]
41.4¢/ $1
WAGE / INCOME GAP [ $ ]
0.38
INEQUALITY / GINI INDEX
2,703
TOTAL POPULATION
1,298
MALE POPULATION
1,405
FEMALE POPULATION
92.38
MALES / 100 FEMALES
108.24
FEMALES / 100 MALES
51.9
MEDIAN AGE
3.3
AVG FAMILY SIZE
2.7
AVG HOUSEHOLD SIZE
557
LABOR FORCE [ PEOPLE ]
26.5%
PERCENT IN LABOR FORCE
Income in Perezville
Income Overview in Perezville
Per Capita Income in Perezville is $18,195, while median incomes of families and households are $54,225 and $45,556 respectively.
| Characteristic | Number | Measure |
| Per Capita Income | 2,703 | $18,195 |
| Median Family Income | 729 | $54,225 |
| Mean Family Income | 729 | $55,852 |
| Median Household Income | 1,000 | $45,556 |
| Mean Household Income | 1,000 | $48,758 |
| Income Deficit | 729 | $0 |
| Wage / Income Gap (%) | 2,703 | 58.58% |
| Wage / Income Gap ($) | 2,703 | 41.42¢ per $1 |
| Gini / Inequality Index | 2,703 | 0.38 |
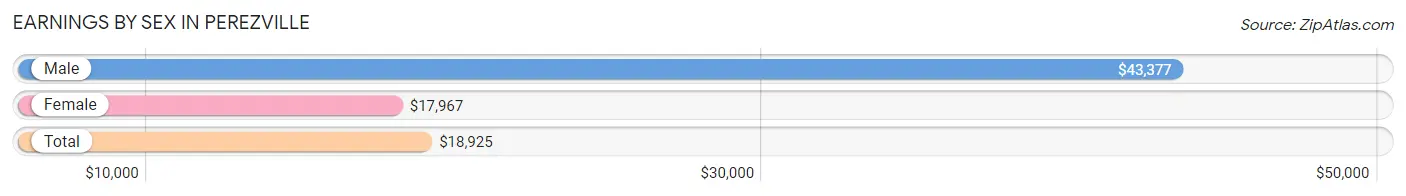
Earnings by Sex in Perezville
Average Earnings in Perezville are $18,925, $43,377 for men and $17,967 for women, a difference of 58.6%.
| Sex | Number | Average Earnings |
| Male | 264 (42.3%) | $43,377 |
| Female | 360 (57.7%) | $17,967 |
| Total | 624 (100.0%) | $18,925 |
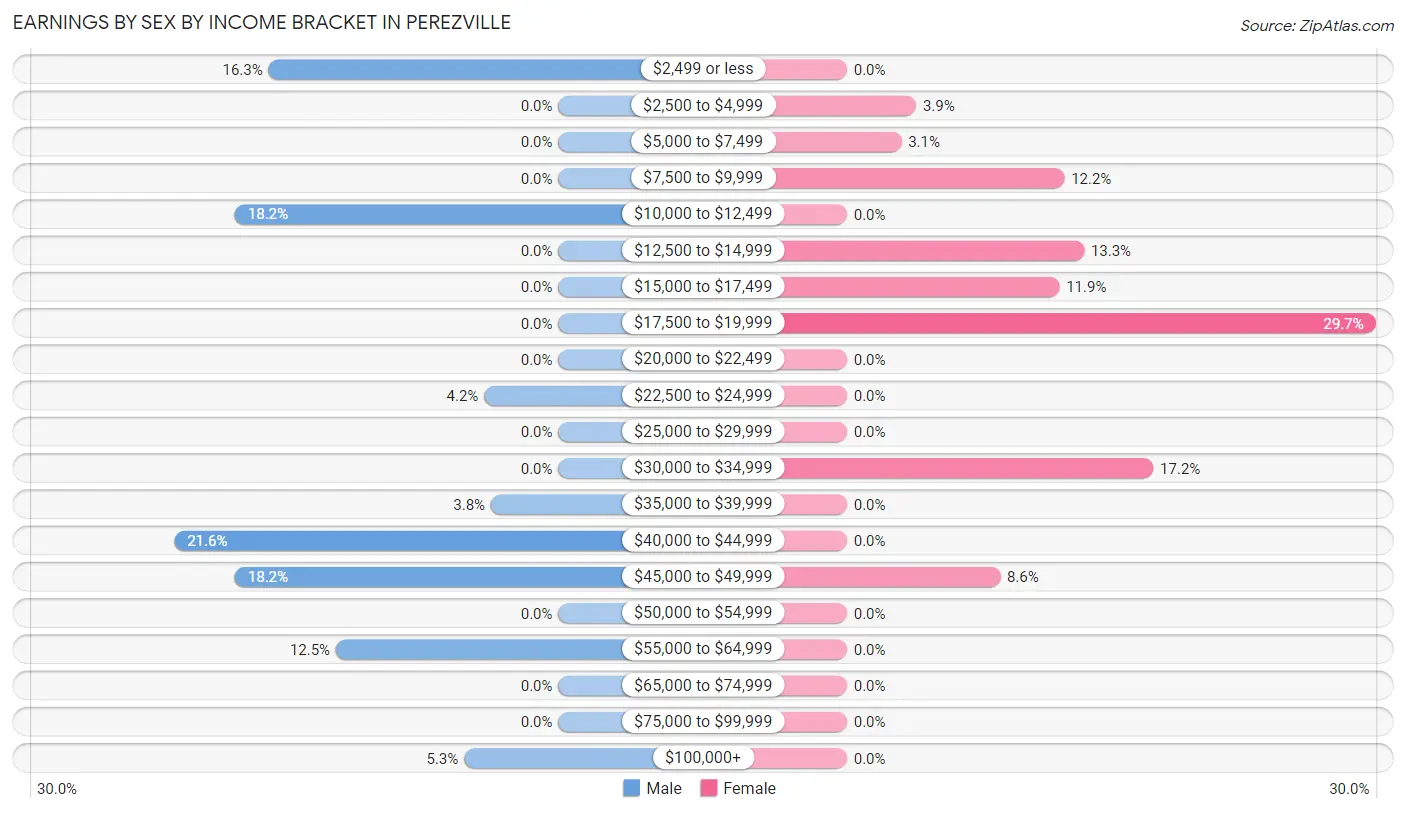
Earnings by Sex by Income Bracket in Perezville
The most common earnings brackets in Perezville are $40,000 to $44,999 for men (57 | 21.6%) and $17,500 to $19,999 for women (107 | 29.7%).
| Income | Male | Female |
| $2,499 or less | 43 (16.3%) | 0 (0.0%) |
| $2,500 to $4,999 | 0 (0.0%) | 14 (3.9%) |
| $5,000 to $7,499 | 0 (0.0%) | 11 (3.1%) |
| $7,500 to $9,999 | 0 (0.0%) | 44 (12.2%) |
| $10,000 to $12,499 | 48 (18.2%) | 0 (0.0%) |
| $12,500 to $14,999 | 0 (0.0%) | 48 (13.3%) |
| $15,000 to $17,499 | 0 (0.0%) | 43 (11.9%) |
| $17,500 to $19,999 | 0 (0.0%) | 107 (29.7%) |
| $20,000 to $22,499 | 0 (0.0%) | 0 (0.0%) |
| $22,500 to $24,999 | 11 (4.2%) | 0 (0.0%) |
| $25,000 to $29,999 | 0 (0.0%) | 0 (0.0%) |
| $30,000 to $34,999 | 0 (0.0%) | 62 (17.2%) |
| $35,000 to $39,999 | 10 (3.8%) | 0 (0.0%) |
| $40,000 to $44,999 | 57 (21.6%) | 0 (0.0%) |
| $45,000 to $49,999 | 48 (18.2%) | 31 (8.6%) |
| $50,000 to $54,999 | 0 (0.0%) | 0 (0.0%) |
| $55,000 to $64,999 | 33 (12.5%) | 0 (0.0%) |
| $65,000 to $74,999 | 0 (0.0%) | 0 (0.0%) |
| $75,000 to $99,999 | 0 (0.0%) | 0 (0.0%) |
| $100,000+ | 14 (5.3%) | 0 (0.0%) |
| Total | 264 (100.0%) | 360 (100.0%) |
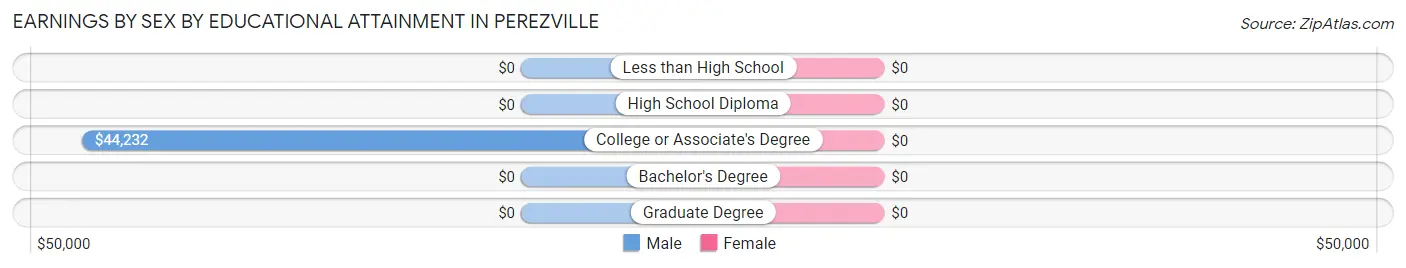
Earnings by Sex by Educational Attainment in Perezville
| Educational Attainment | Male Income | Female Income |
| Less than High School | - | - |
| High School Diploma | - | - |
| College or Associate's Degree | $44,232 | $0 |
| Bachelor's Degree | - | - |
| Graduate Degree | - | - |
| Total | $44,320 | $18,227 |
Family Income in Perezville
Family Income Brackets in Perezville
According to the Perezville family income data, there are 240 families falling into the $50,000 to $74,999 income range, which is the most common income bracket and makes up 32.9% of all families.
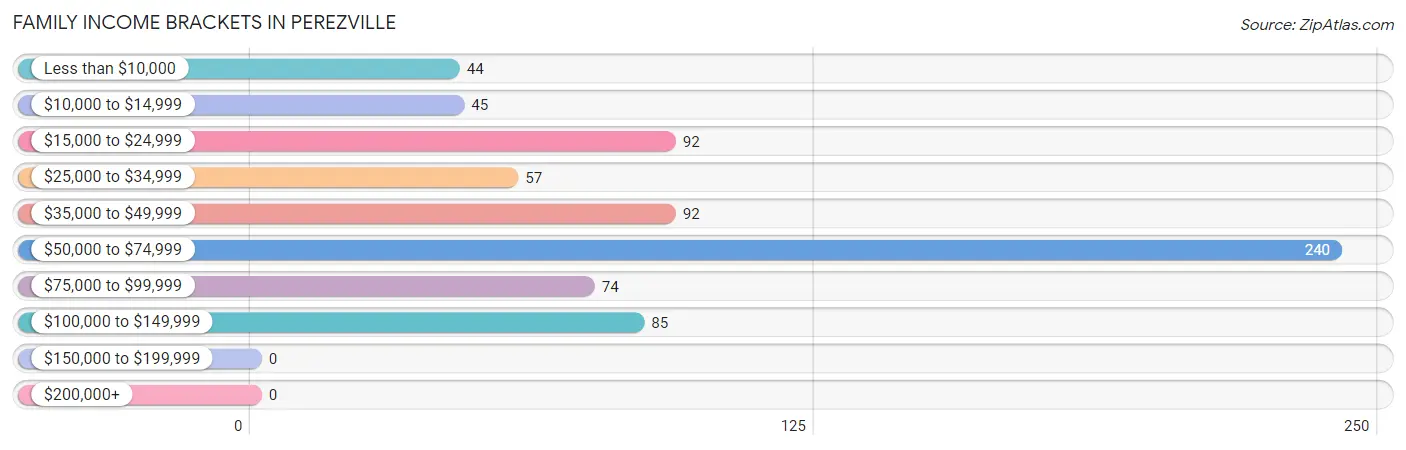
| Income Bracket | # Families | % Families |
| Less than $10,000 | 44 | 6.0% |
| $10,000 to $14,999 | 45 | 6.2% |
| $15,000 to $24,999 | 92 | 12.6% |
| $25,000 to $34,999 | 57 | 7.8% |
| $35,000 to $49,999 | 92 | 12.6% |
| $50,000 to $74,999 | 240 | 32.9% |
| $75,000 to $99,999 | 74 | 10.2% |
| $100,000 to $149,999 | 85 | 11.7% |
| $150,000 to $199,999 | 0 | 0.0% |
| $200,000+ | 0 | 0.0% |
Family Income by Famaliy Size in Perezville
2-person families (379 | 52.0%) account for the highest median family income in Perezville with $55,774 per family, while 2-person families (379 | 52.0%) have the highest median income of $27,887 per family member.
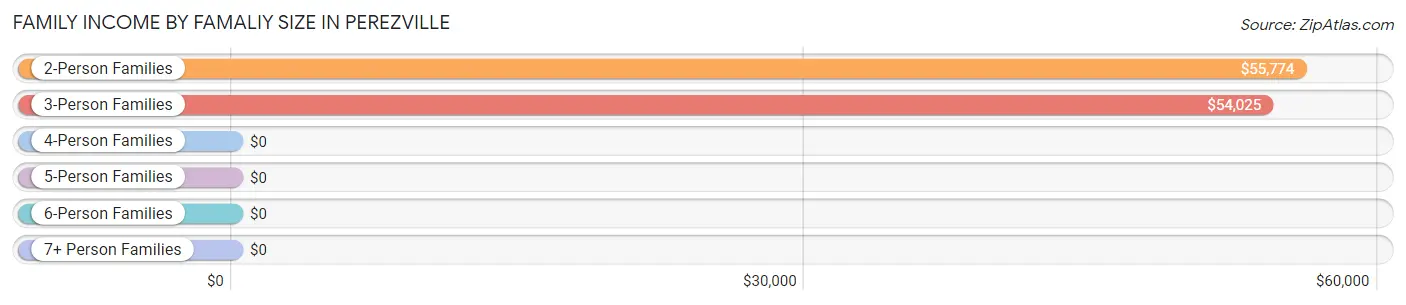
| Income Bracket | # Families | Median Income |
| 2-Person Families | 379 (52.0%) | $55,774 |
| 3-Person Families | 81 (11.1%) | $54,025 |
| 4-Person Families | 77 (10.6%) | $0 |
| 5-Person Families | 105 (14.4%) | $0 |
| 6-Person Families | 87 (11.9%) | $0 |
| 7+ Person Families | 0 (0.0%) | $0 |
| Total | 729 (100.0%) | $54,225 |
Family Income by Number of Earners in Perezville
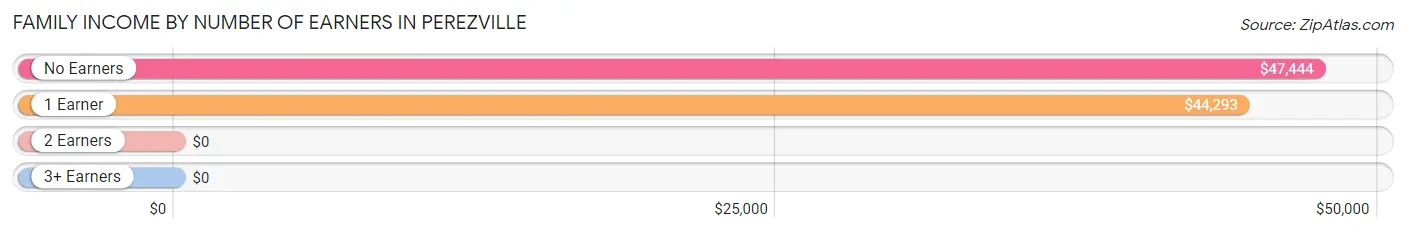
| Number of Earners | # Families | Median Income |
| No Earners | 408 (56.0%) | $47,444 |
| 1 Earner | 141 (19.3%) | $44,293 |
| 2 Earners | 90 (12.3%) | $0 |
| 3+ Earners | 90 (12.3%) | $0 |
| Total | 729 (100.0%) | $54,225 |
Household Income in Perezville
Household Income Brackets in Perezville
With 268 households falling in the category, the $50,000 to $74,999 income range is the most frequent in Perezville, accounting for 26.8% of all households.
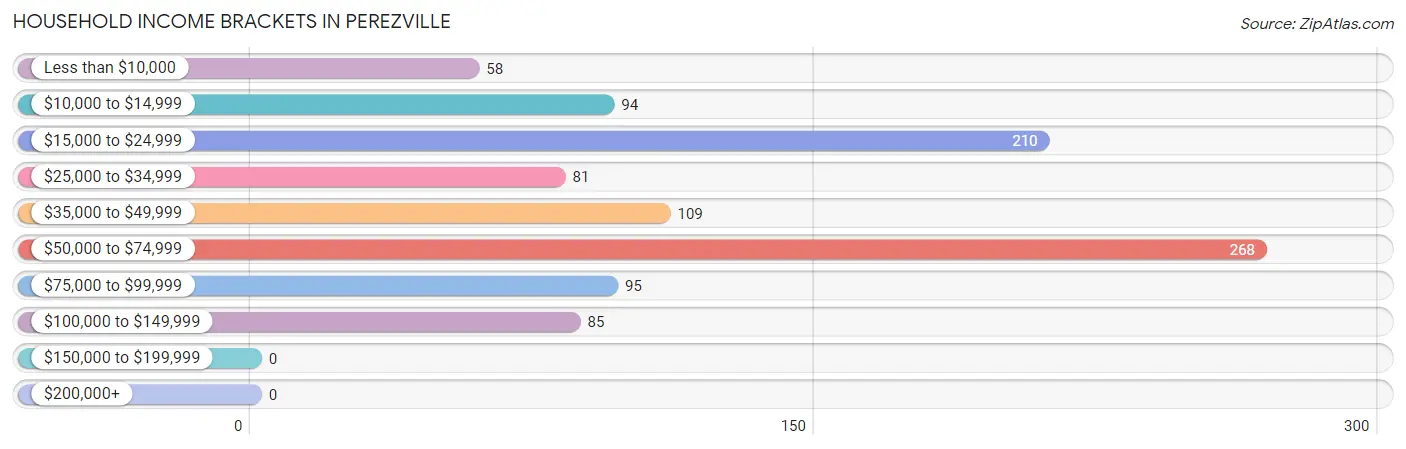
| Income Bracket | # Households | % Households |
| Less than $10,000 | 58 | 5.8% |
| $10,000 to $14,999 | 94 | 9.4% |
| $15,000 to $24,999 | 210 | 21.0% |
| $25,000 to $34,999 | 81 | 8.1% |
| $35,000 to $49,999 | 109 | 10.9% |
| $50,000 to $74,999 | 268 | 26.8% |
| $75,000 to $99,999 | 95 | 9.5% |
| $100,000 to $149,999 | 85 | 8.5% |
| $150,000 to $199,999 | 0 | 0.0% |
| $200,000+ | 0 | 0.0% |
Household Income by Householder Age in Perezville
The median household income in Perezville is $45,556, with the highest median household income of $46,444 found in the 65+ years age bracket for the primary householder. A total of 576 households (57.6%) fall into this category. Meanwhile, the 15 to 24 years age bracket for the primary householder has the lowest median household income of $0, with 44 households (4.4%) in this group.
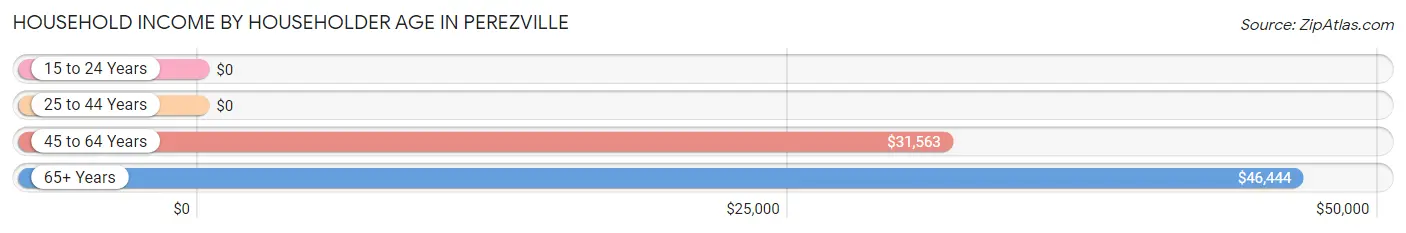
| Income Bracket | # Households | Median Income |
| 15 to 24 Years | 44 (4.4%) | $0 |
| 25 to 44 Years | 90 (9.0%) | $0 |
| 45 to 64 Years | 290 (29.0%) | $31,563 |
| 65+ Years | 576 (57.6%) | $46,444 |
| Total | 1,000 (100.0%) | $45,556 |
Poverty in Perezville
Income Below Poverty by Sex and Age in Perezville
With 30.9% poverty level for males and 42.1% for females among the residents of Perezville, 12 to 14 year old males and under 5 year old females are the most vulnerable to poverty, with 51 males (100.0%) and 161 females (100.0%) in their respective age groups living below the poverty level.
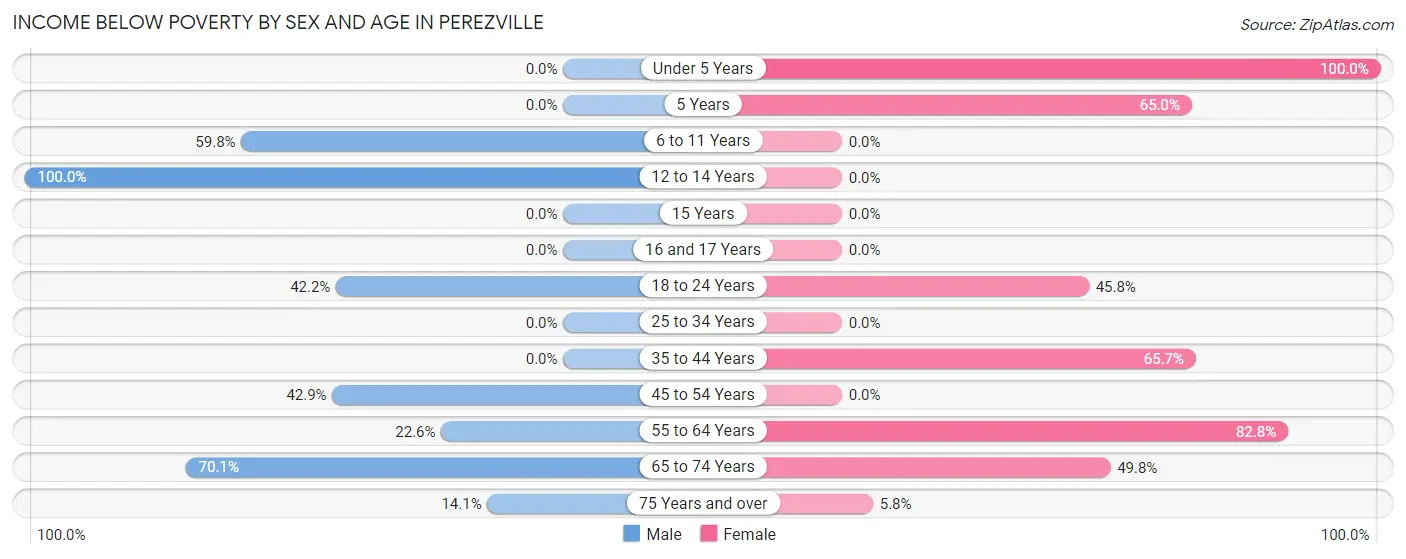
| Age Bracket | Male | Female |
| Under 5 Years | 0 (0.0%) | 161 (100.0%) |
| 5 Years | 0 (0.0%) | 89 (65.0%) |
| 6 to 11 Years | 101 (59.8%) | 0 (0.0%) |
| 12 to 14 Years | 51 (100.0%) | 0 (0.0%) |
| 15 Years | 0 (0.0%) | 0 (0.0%) |
| 16 and 17 Years | 0 (0.0%) | 0 (0.0%) |
| 18 to 24 Years | 43 (42.2%) | 44 (45.8%) |
| 25 to 34 Years | 0 (0.0%) | 0 (0.0%) |
| 35 to 44 Years | 0 (0.0%) | 92 (65.7%) |
| 45 to 54 Years | 48 (42.9%) | 0 (0.0%) |
| 55 to 64 Years | 48 (22.6%) | 53 (82.8%) |
| 65 to 74 Years | 61 (70.1%) | 138 (49.8%) |
| 75 Years and over | 49 (14.1%) | 15 (5.8%) |
| Total | 401 (30.9%) | 592 (42.1%) |
Income Above Poverty by Sex and Age in Perezville
According to the poverty statistics in Perezville, males aged under 5 years and females aged 25 to 34 years are the age groups that are most secure financially, with 100.0% of males and 100.0% of females in these age groups living above the poverty line.
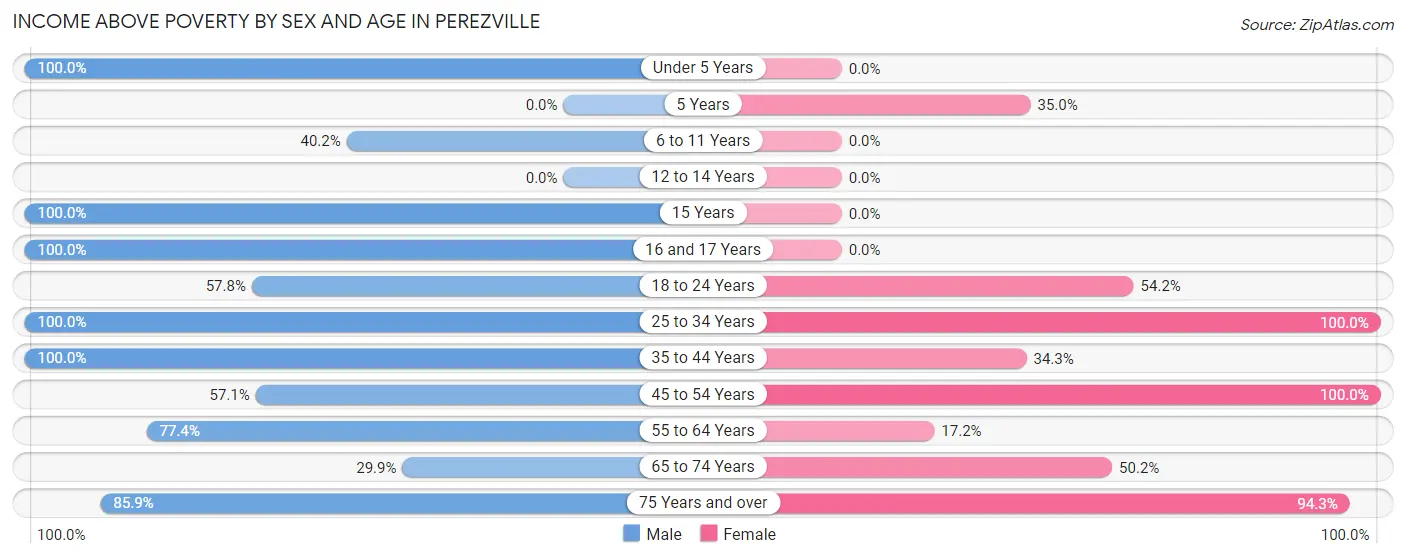
| Age Bracket | Male | Female |
| Under 5 Years | 37 (100.0%) | 0 (0.0%) |
| 5 Years | 0 (0.0%) | 48 (35.0%) |
| 6 to 11 Years | 68 (40.2%) | 0 (0.0%) |
| 12 to 14 Years | 0 (0.0%) | 0 (0.0%) |
| 15 Years | 45 (100.0%) | 0 (0.0%) |
| 16 and 17 Years | 45 (100.0%) | 0 (0.0%) |
| 18 to 24 Years | 59 (57.8%) | 52 (54.2%) |
| 25 to 34 Years | 33 (100.0%) | 148 (100.0%) |
| 35 to 44 Years | 57 (100.0%) | 48 (34.3%) |
| 45 to 54 Years | 64 (57.1%) | 121 (100.0%) |
| 55 to 64 Years | 164 (77.4%) | 11 (17.2%) |
| 65 to 74 Years | 26 (29.9%) | 139 (50.2%) |
| 75 Years and over | 299 (85.9%) | 246 (94.3%) |
| Total | 897 (69.1%) | 813 (57.9%) |
Income Below Poverty Among Married-Couple Families in Perezville
The poverty statistics for married-couple families in Perezville show that 27.0% or 185 of the total 685 families live below the poverty line. Families with 3 or 4 children have the highest poverty rate of 100.0%, comprising of 45 families. On the other hand, families with no children have the lowest poverty rate of 20.6%, which includes 92 families.
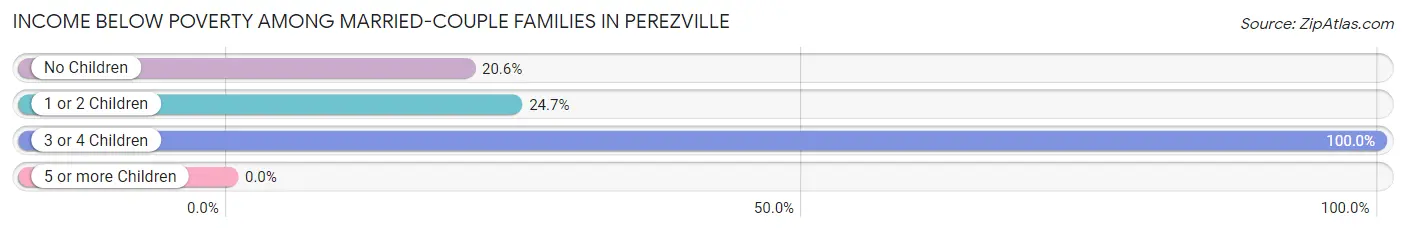
| Children | Above Poverty | Below Poverty |
| No Children | 354 (79.4%) | 92 (20.6%) |
| 1 or 2 Children | 146 (75.3%) | 48 (24.7%) |
| 3 or 4 Children | 0 (0.0%) | 45 (100.0%) |
| 5 or more Children | 0 (0.0%) | 0 (0.0%) |
| Total | 500 (73.0%) | 185 (27.0%) |
Income Below Poverty Among Single-Parent Households in Perezville
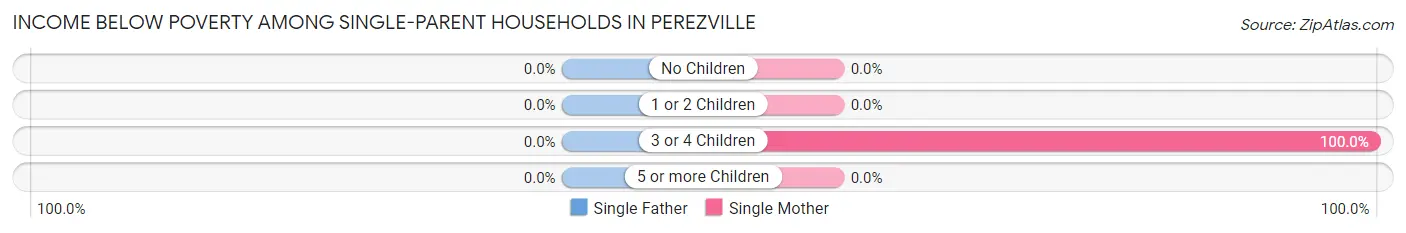
| Children | Single Father | Single Mother |
| No Children | 0 (0.0%) | 0 (0.0%) |
| 1 or 2 Children | 0 (0.0%) | 0 (0.0%) |
| 3 or 4 Children | 0 (0.0%) | 44 (100.0%) |
| 5 or more Children | 0 (0.0%) | 0 (0.0%) |
| Total | 0 (0.0%) | 44 (100.0%) |
Income Below Poverty Among Married-Couple vs Single-Parent Households in Perezville
The poverty data for Perezville shows that 185 of the married-couple family households (27.0%) and 44 of the single-parent households (100.0%) are living below the poverty level. Within the married-couple family households, those with 3 or 4 children have the highest poverty rate, with 45 households (100.0%) falling below the poverty line. Among the single-parent households, those with 3 or 4 children have the highest poverty rate, with 44 household (100.0%) living below poverty.
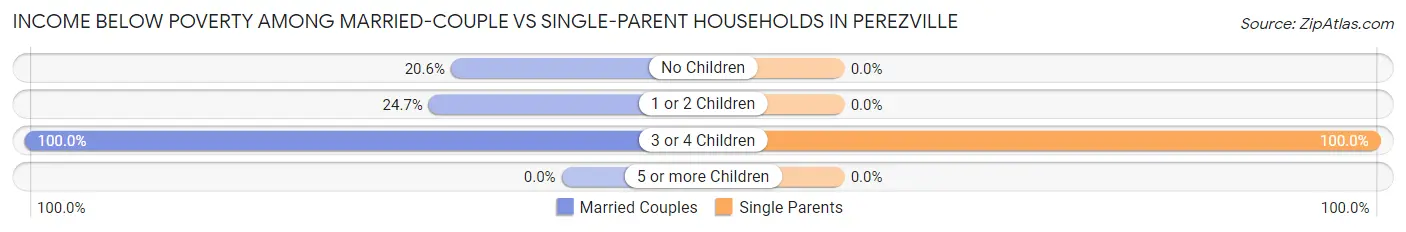
| Children | Married-Couple Families | Single-Parent Households |
| No Children | 92 (20.6%) | 0 (0.0%) |
| 1 or 2 Children | 48 (24.7%) | 0 (0.0%) |
| 3 or 4 Children | 45 (100.0%) | 44 (100.0%) |
| 5 or more Children | 0 (0.0%) | 0 (0.0%) |
| Total | 185 (27.0%) | 44 (100.0%) |
Race in Perezville
The most populous races in Perezville are Hispanic or Latino (1,949 | 72.1%), White / Caucasian (1,725 | 63.8%), and Two or more Races (929 | 34.4%).
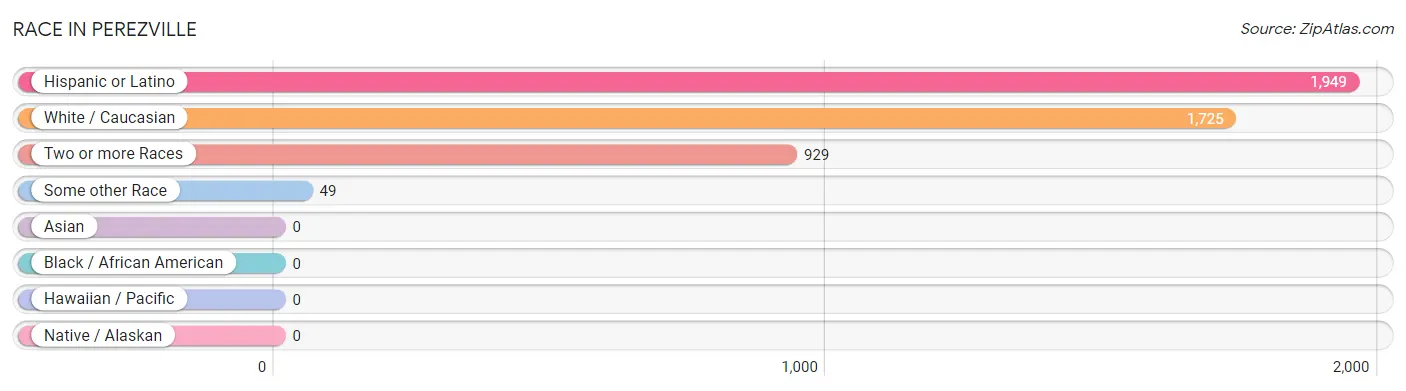
| Race | # Population | % Population |
| Asian | 0 | 0.0% |
| Black / African American | 0 | 0.0% |
| Hawaiian / Pacific | 0 | 0.0% |
| Hispanic or Latino | 1,949 | 72.1% |
| Native / Alaskan | 0 | 0.0% |
| White / Caucasian | 1,725 | 63.8% |
| Two or more Races | 929 | 34.4% |
| Some other Race | 49 | 1.8% |
| Total | 2,703 | 100.0% |
Ancestry in Perezville
The most populous ancestries reported in Perezville are Mexican (1,935 | 71.6%), German (297 | 11.0%), French Canadian (98 | 3.6%), Irish (96 | 3.5%), and American (81 | 3.0%), together accounting for 92.8% of all Perezville residents.
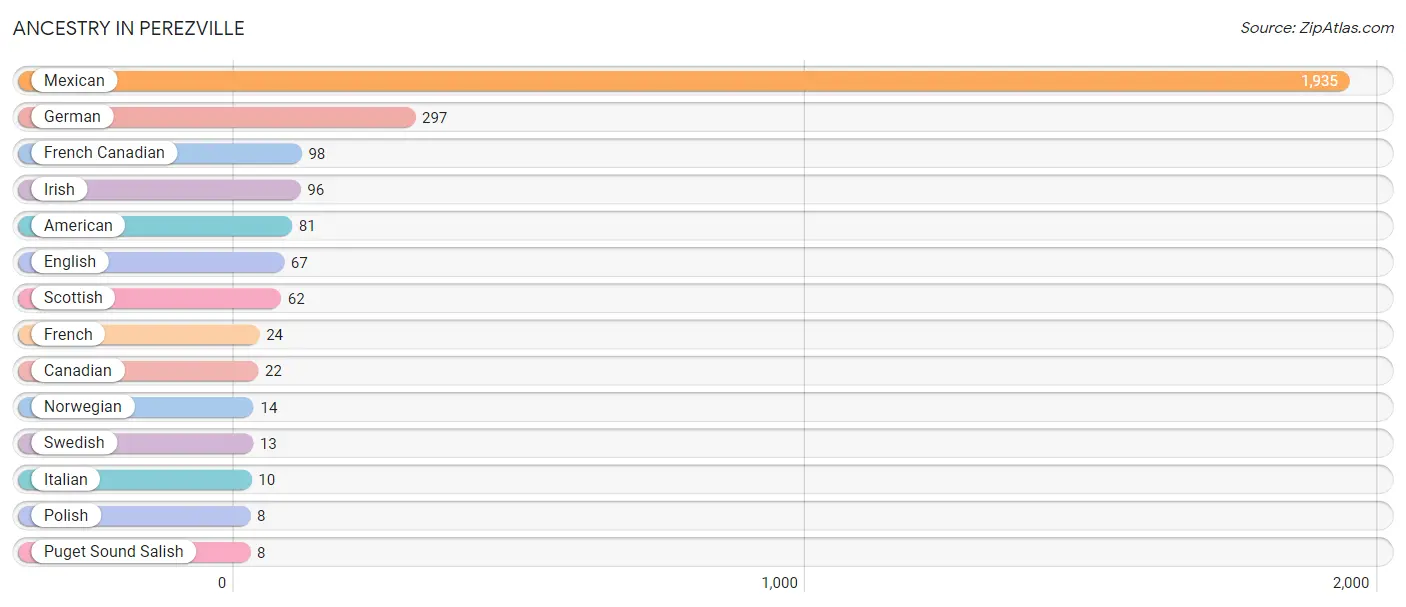
| Ancestry | # Population | % Population |
| American | 81 | 3.0% |
| Canadian | 22 | 0.8% |
| English | 67 | 2.5% |
| French | 24 | 0.9% |
| French Canadian | 98 | 3.6% |
| German | 297 | 11.0% |
| Irish | 96 | 3.5% |
| Italian | 10 | 0.4% |
| Mexican | 1,935 | 71.6% |
| Norwegian | 14 | 0.5% |
| Polish | 8 | 0.3% |
| Puget Sound Salish | 8 | 0.3% |
| Scottish | 62 | 2.3% |
| Swedish | 13 | 0.5% | View All 14 Rows |
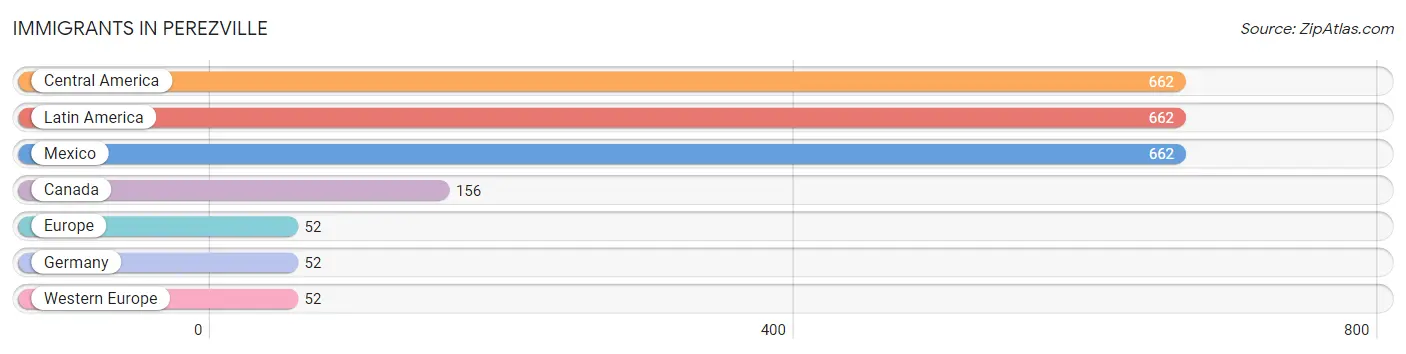
Immigrants in Perezville
The most numerous immigrant groups reported in Perezville came from Central America (662 | 24.5%), Latin America (662 | 24.5%), Mexico (662 | 24.5%), Canada (156 | 5.8%), and Europe (52 | 1.9%), together accounting for 81.2% of all Perezville residents.
| Immigration Origin | # Population | % Population |
| Canada | 156 | 5.8% |
| Central America | 662 | 24.5% |
| Europe | 52 | 1.9% |
| Germany | 52 | 1.9% |
| Latin America | 662 | 24.5% |
| Mexico | 662 | 24.5% |
| Western Europe | 52 | 1.9% | View All 7 Rows |
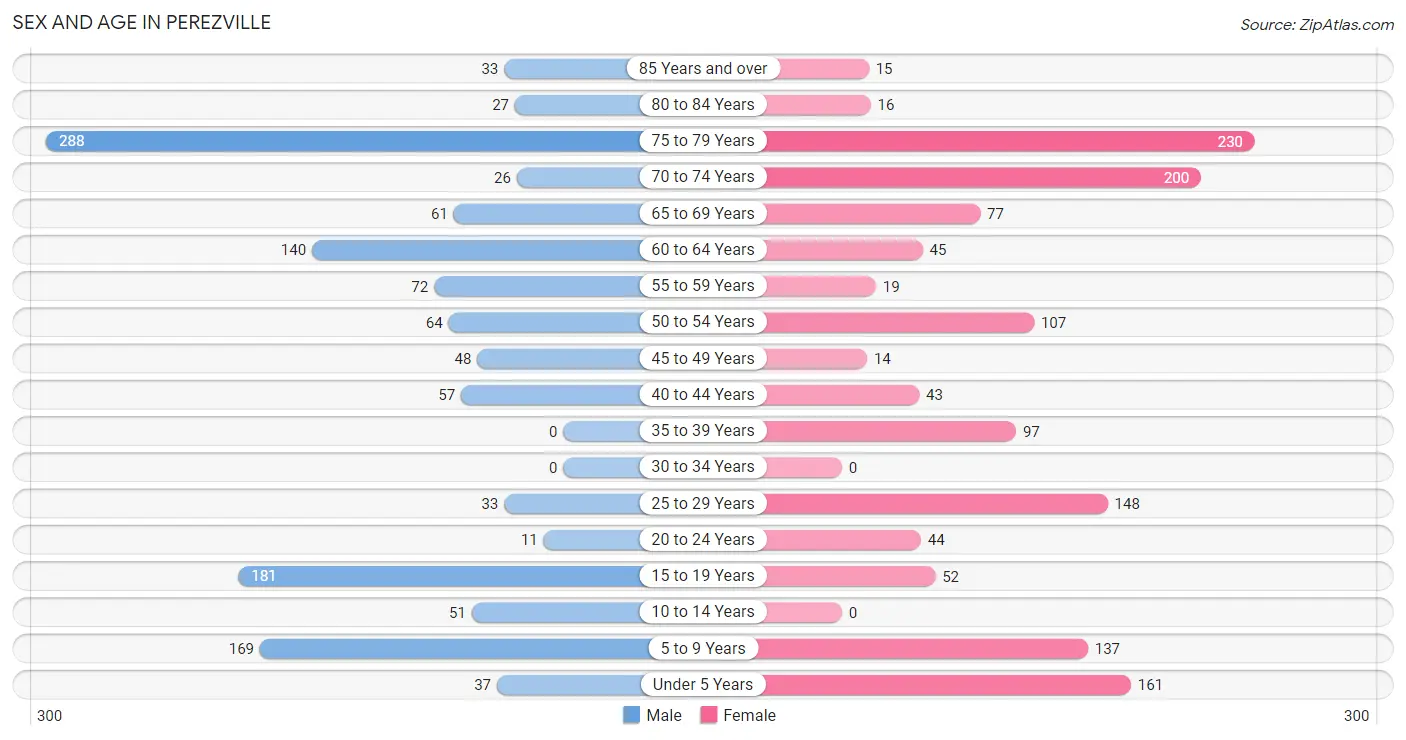
Sex and Age in Perezville
Sex and Age in Perezville
The most populous age groups in Perezville are 75 to 79 Years (288 | 22.2%) for men and 75 to 79 Years (230 | 16.4%) for women.
| Age Bracket | Male | Female |
| Under 5 Years | 37 (2.9%) | 161 (11.5%) |
| 5 to 9 Years | 169 (13.0%) | 137 (9.8%) |
| 10 to 14 Years | 51 (3.9%) | 0 (0.0%) |
| 15 to 19 Years | 181 (13.9%) | 52 (3.7%) |
| 20 to 24 Years | 11 (0.9%) | 44 (3.1%) |
| 25 to 29 Years | 33 (2.5%) | 148 (10.5%) |
| 30 to 34 Years | 0 (0.0%) | 0 (0.0%) |
| 35 to 39 Years | 0 (0.0%) | 97 (6.9%) |
| 40 to 44 Years | 57 (4.4%) | 43 (3.1%) |
| 45 to 49 Years | 48 (3.7%) | 14 (1.0%) |
| 50 to 54 Years | 64 (4.9%) | 107 (7.6%) |
| 55 to 59 Years | 72 (5.6%) | 19 (1.3%) |
| 60 to 64 Years | 140 (10.8%) | 45 (3.2%) |
| 65 to 69 Years | 61 (4.7%) | 77 (5.5%) |
| 70 to 74 Years | 26 (2.0%) | 200 (14.2%) |
| 75 to 79 Years | 288 (22.2%) | 230 (16.4%) |
| 80 to 84 Years | 27 (2.1%) | 16 (1.1%) |
| 85 Years and over | 33 (2.5%) | 15 (1.1%) |
| Total | 1,298 (100.0%) | 1,405 (100.0%) |
Families and Households in Perezville
Median Family Size in Perezville
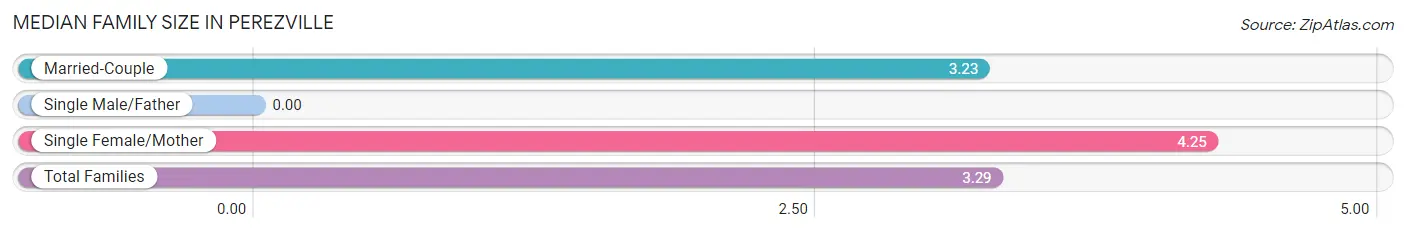
| Family Type | # Families | Family Size |
| Married-Couple | 685 (94.0%) | 3.23 |
| Single Male/Father | 0 (0.0%) | - |
| Single Female/Mother | 44 (6.0%) | 4.25 |
| Total Families | 729 (100.0%) | 3.29 |
Median Household Size in Perezville
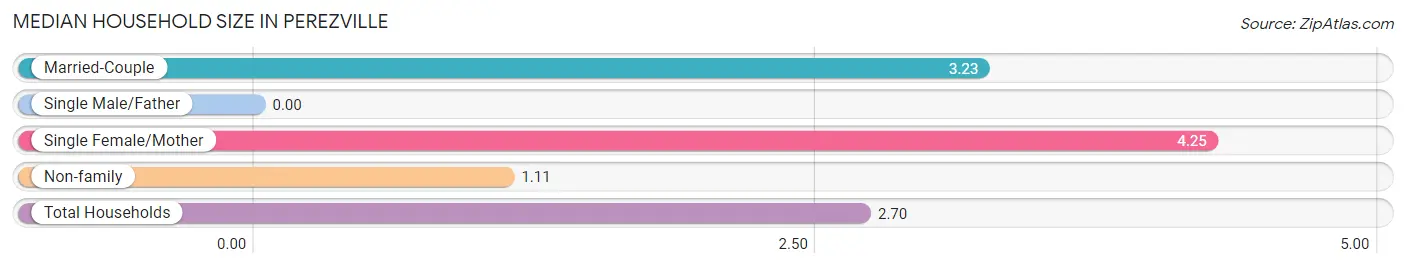
| Household Type | # Households | Household Size |
| Married-Couple | 685 (68.5%) | 3.23 |
| Single Male/Father | 0 (0.0%) | - |
| Single Female/Mother | 44 (4.4%) | 4.25 |
| Non-family | 271 (27.1%) | 1.11 |
| Total Households | 1,000 (100.0%) | 2.70 |
Household Size by Marriage Status in Perezville
Out of a total of 1,000 households in Perezville, 729 (72.9%) are family households, while 271 (27.1%) are nonfamily households. The most numerous type of family households are 2-person households, comprising 379, and the most common type of nonfamily households are 1-person households, comprising 230.
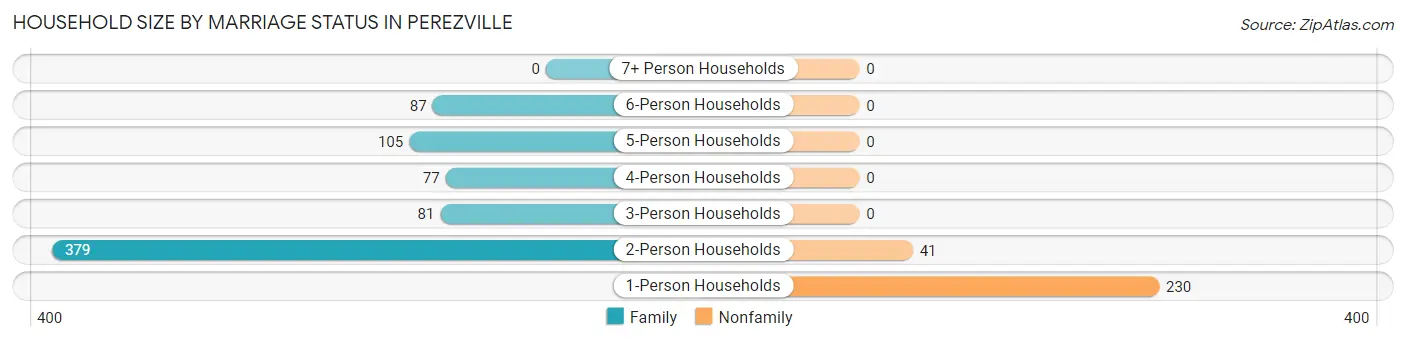
| Household Size | Family Households | Nonfamily Households |
| 1-Person Households | - | 230 (23.0%) |
| 2-Person Households | 379 (37.9%) | 41 (4.1%) |
| 3-Person Households | 81 (8.1%) | 0 (0.0%) |
| 4-Person Households | 77 (7.7%) | 0 (0.0%) |
| 5-Person Households | 105 (10.5%) | 0 (0.0%) |
| 6-Person Households | 87 (8.7%) | 0 (0.0%) |
| 7+ Person Households | 0 (0.0%) | 0 (0.0%) |
| Total | 729 (72.9%) | 271 (27.1%) |
Female Fertility in Perezville
Fertility by Age in Perezville
Average fertility rate in Perezville is 76.0 births per 1,000 women. Women in the age bracket of 20 to 34 years have the highest fertility rate with 161.0 births per 1,000 women. Women in the age bracket of 20 to 34 years acount for 100.0% of all women with births.
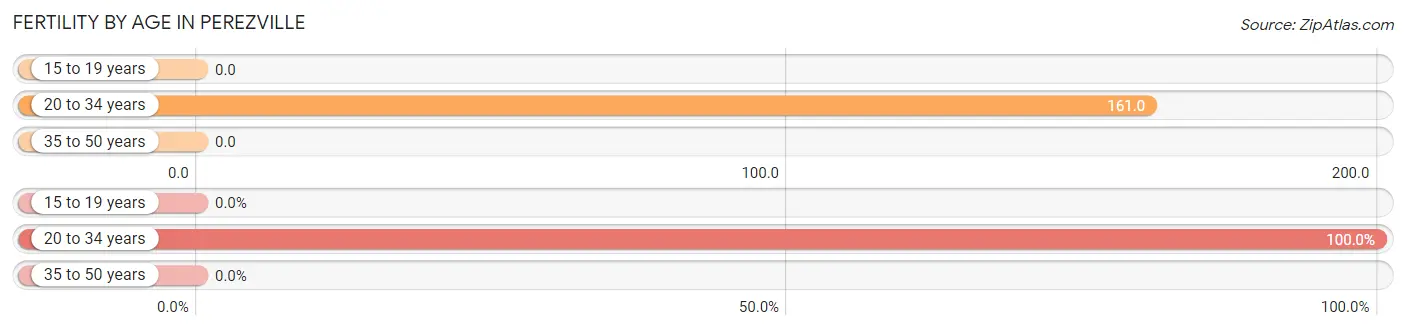
| Age Bracket | Women with Births | Births / 1,000 Women |
| 15 to 19 years | 0 (0.0%) | 0.0 |
| 20 to 34 years | 31 (100.0%) | 161.0 |
| 35 to 50 years | 0 (0.0%) | 0.0 |
| Total | 31 (100.0%) | 76.0 |
Fertility by Age by Marriage Status in Perezville
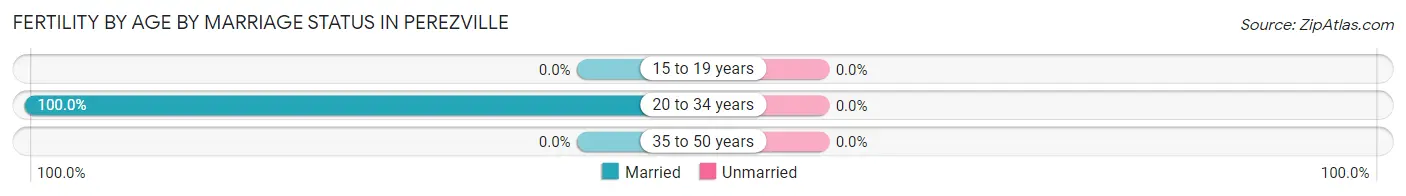
| Age Bracket | Married | Unmarried |
| 15 to 19 years | 0 (0.0%) | 0 (0.0%) |
| 20 to 34 years | 31 (100.0%) | 0 (0.0%) |
| 35 to 50 years | 0 (0.0%) | 0 (0.0%) |
| Total | 31 (100.0%) | 0 (0.0%) |
Fertility by Education in Perezville
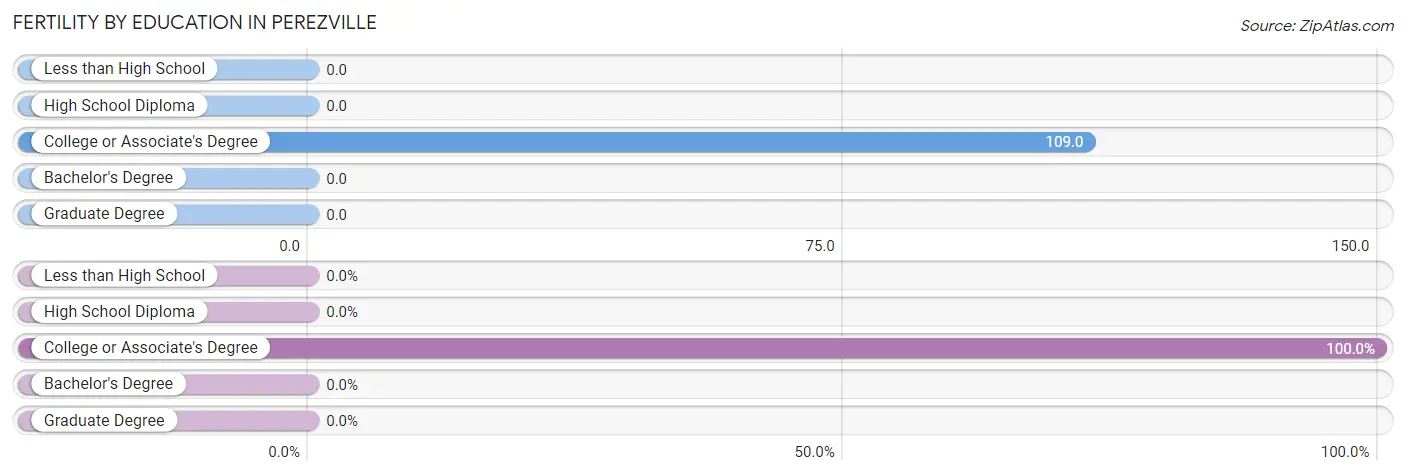
| Educational Attainment | Women with Births | Births / 1,000 Women |
| Less than High School | 0 (0.0%) | 0.0 |
| High School Diploma | 0 (0.0%) | 0.0 |
| College or Associate's Degree | 31 (100.0%) | 109.0 |
| Bachelor's Degree | 0 (0.0%) | 0.0 |
| Graduate Degree | 0 (0.0%) | 0.0 |
| Total | 31 (100.0%) | 76.0 |
Fertility by Education by Marriage Status in Perezville
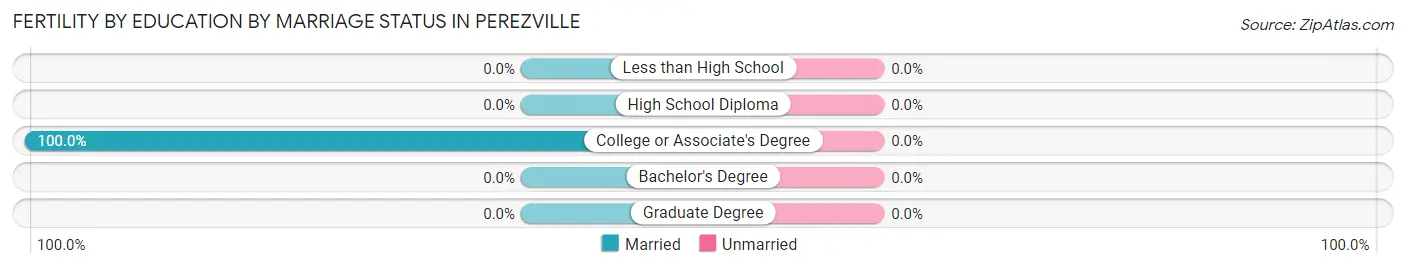
| Educational Attainment | Married | Unmarried |
| Less than High School | 0 (0.0%) | 0 (0.0%) |
| High School Diploma | 0 (0.0%) | 0 (0.0%) |
| College or Associate's Degree | 31 (100.0%) | 0 (0.0%) |
| Bachelor's Degree | 0 (0.0%) | 0 (0.0%) |
| Graduate Degree | 0 (0.0%) | 0 (0.0%) |
| Total | 31 (100.0%) | 0 (0.0%) |
Employment Characteristics in Perezville
Employment by Class of Employer in Perezville
Among the 558 employed individuals in Perezville, private company employees (341 | 61.1%), local government employees (64 | 11.5%), and self-employed (not incorporated) (62 | 11.1%) make up the most common classes of employment.
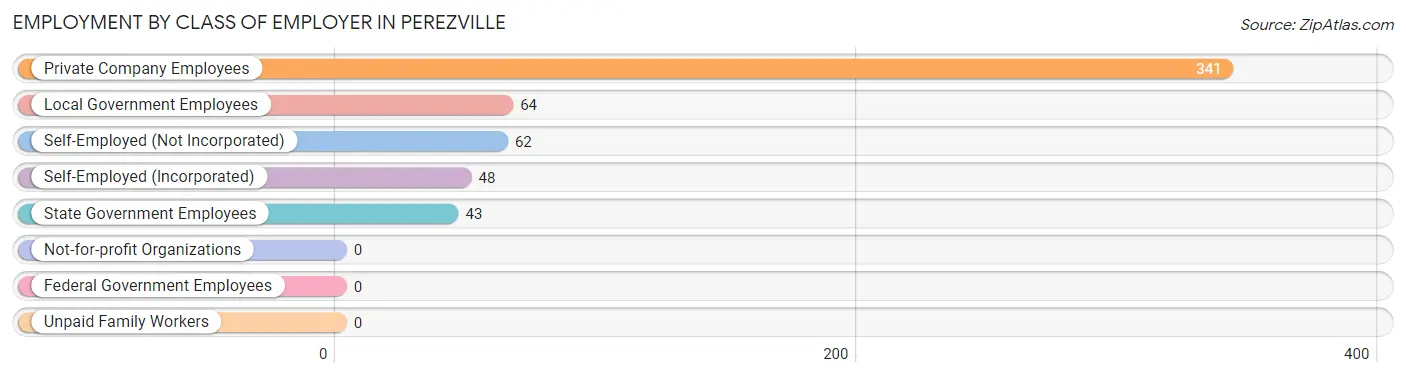
| Employer Class | # Employees | % Employees |
| Private Company Employees | 341 | 61.1% |
| Self-Employed (Incorporated) | 48 | 8.6% |
| Self-Employed (Not Incorporated) | 62 | 11.1% |
| Not-for-profit Organizations | 0 | 0.0% |
| Local Government Employees | 64 | 11.5% |
| State Government Employees | 43 | 7.7% |
| Federal Government Employees | 0 | 0.0% |
| Unpaid Family Workers | 0 | 0.0% |
| Total | 558 | 100.0% |
Employment Status by Age in Perezville
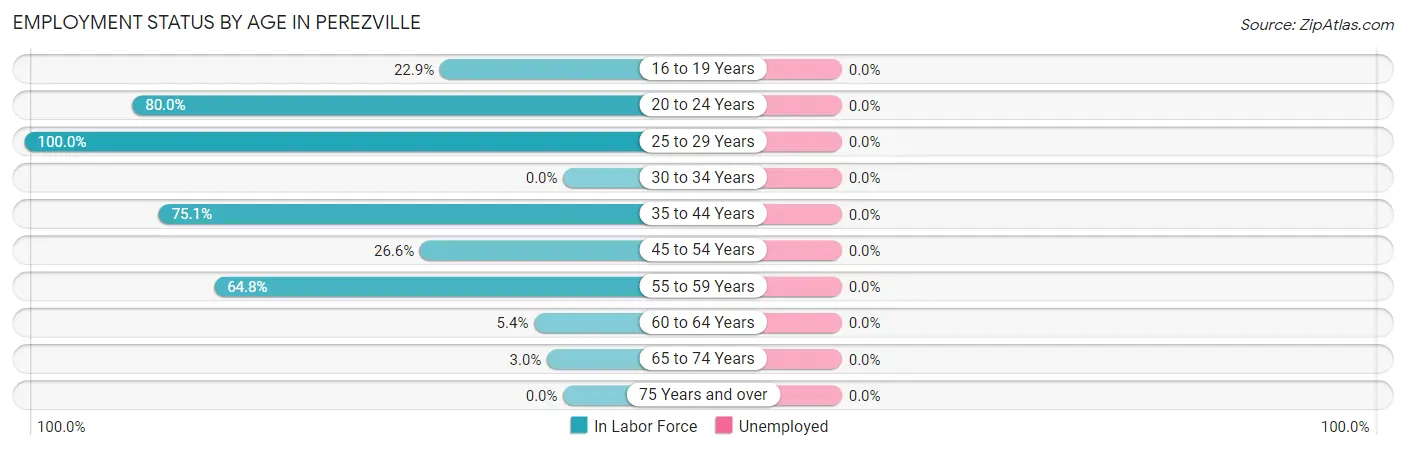
| Age Bracket | In Labor Force | Unemployed |
| 16 to 19 Years | 43 (22.9%) | 0 (0.0%) |
| 20 to 24 Years | 44 (80.0%) | 0 (0.0%) |
| 25 to 29 Years | 181 (100.0%) | 0 (0.0%) |
| 30 to 34 Years | 0 (0.0%) | 0 (0.0%) |
| 35 to 44 Years | 148 (75.1%) | 0 (0.0%) |
| 45 to 54 Years | 62 (26.6%) | 0 (0.0%) |
| 55 to 59 Years | 59 (64.8%) | 0 (0.0%) |
| 60 to 64 Years | 10 (5.4%) | 0 (0.0%) |
| 65 to 74 Years | 11 (3.0%) | 0 (0.0%) |
| 75 Years and over | 0 (0.0%) | 0 (0.0%) |
| Total | 557 (26.5%) | 0 (0.0%) |
Employment Status by Educational Attainment in Perezville
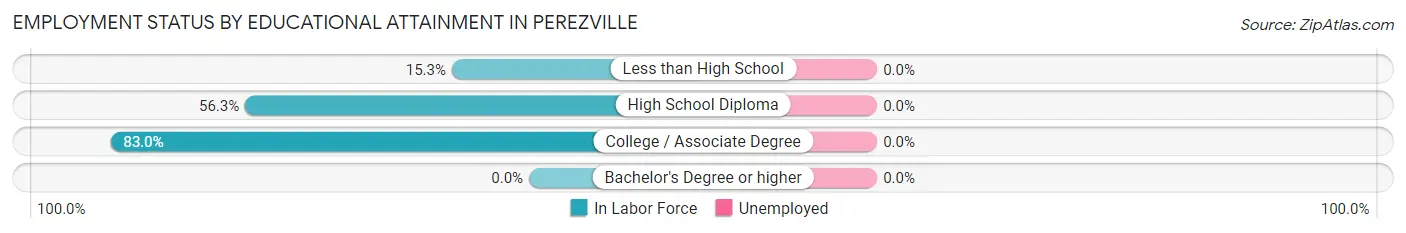
| Educational Attainment | In Labor Force | Unemployed |
| Less than High School | 48 (15.3%) | 0 (0.0%) |
| High School Diploma | 120 (56.3%) | 0 (0.0%) |
| College / Associate Degree | 292 (83.0%) | 0 (0.0%) |
| Bachelor's Degree or higher | 0 (0.0%) | 0 (0.0%) |
| Total | 460 (51.9%) | 0 (0.0%) |
Employment Occupations by Sex in Perezville
Management, Business, Science and Arts Occupations
The most common Management, Business, Science and Arts occupations in Perezville are Computers, Engineering & Science (11 | 2.0%), and Architecture & Engineering (11 | 2.0%).
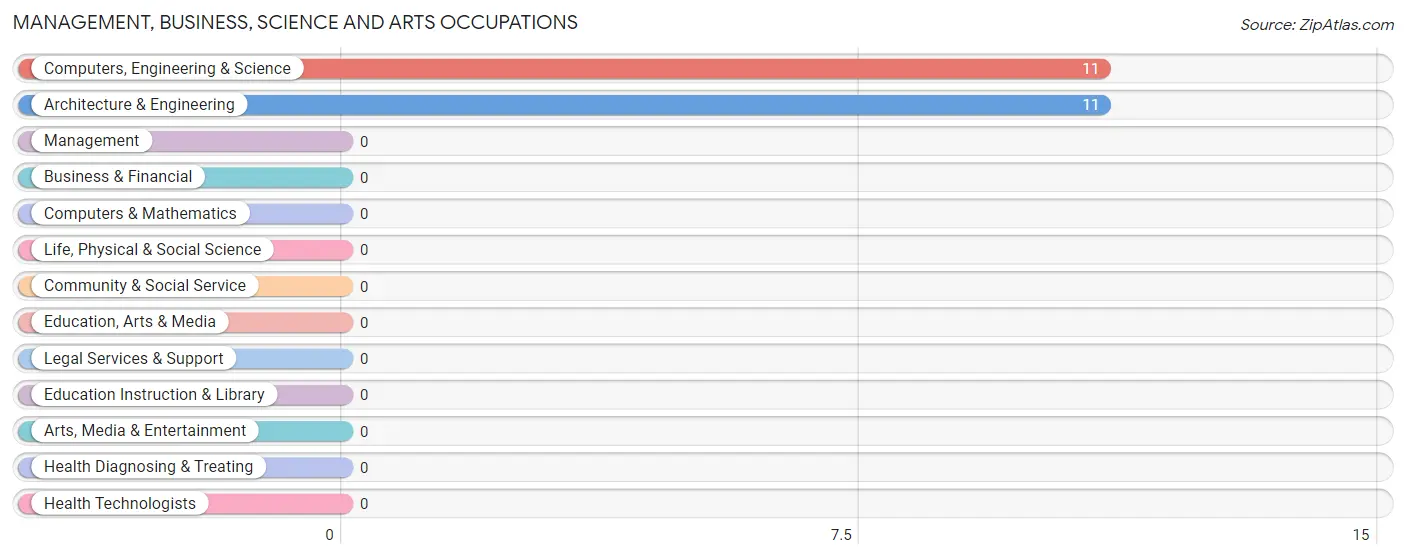
Management, Business, Science and Arts Occupations by Sex
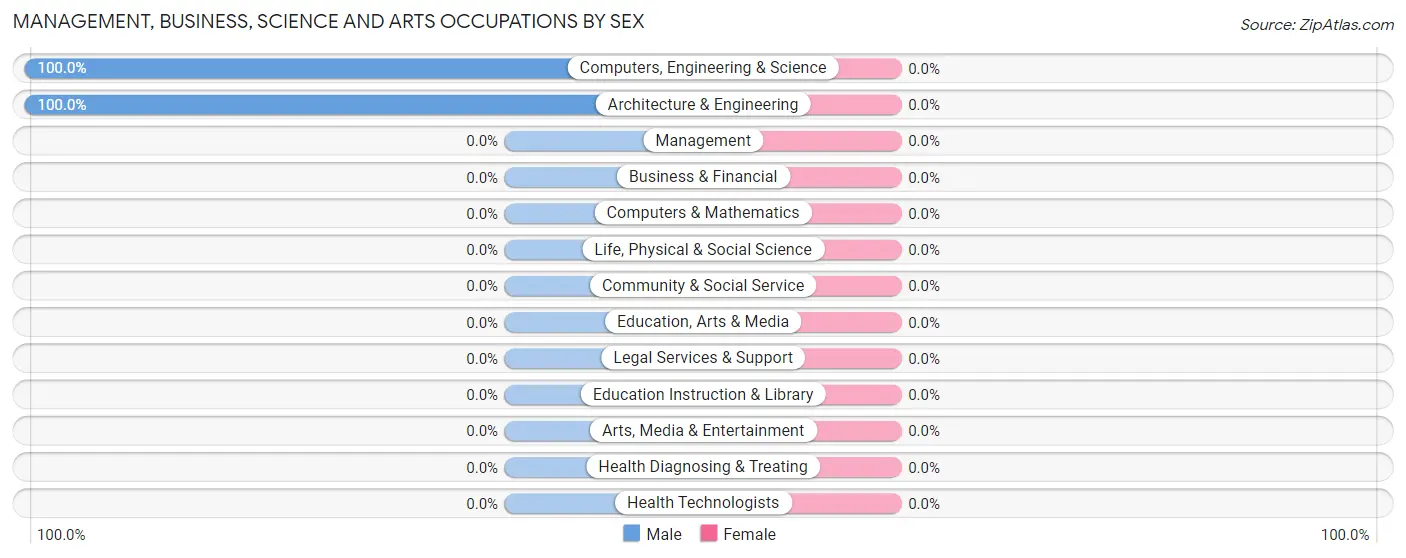
| Occupation | Male | Female |
| Management | 0 (0.0%) | 0 (0.0%) |
| Business & Financial | 0 (0.0%) | 0 (0.0%) |
| Computers, Engineering & Science | 11 (100.0%) | 0 (0.0%) |
| Computers & Mathematics | 0 (0.0%) | 0 (0.0%) |
| Architecture & Engineering | 11 (100.0%) | 0 (0.0%) |
| Life, Physical & Social Science | 0 (0.0%) | 0 (0.0%) |
| Community & Social Service | 0 (0.0%) | 0 (0.0%) |
| Education, Arts & Media | 0 (0.0%) | 0 (0.0%) |
| Legal Services & Support | 0 (0.0%) | 0 (0.0%) |
| Education Instruction & Library | 0 (0.0%) | 0 (0.0%) |
| Arts, Media & Entertainment | 0 (0.0%) | 0 (0.0%) |
| Health Diagnosing & Treating | 0 (0.0%) | 0 (0.0%) |
| Health Technologists | 0 (0.0%) | 0 (0.0%) |
| Total (Category) | 11 (100.0%) | 0 (0.0%) |
| Total (Overall) | 264 (47.3%) | 294 (52.7%) |
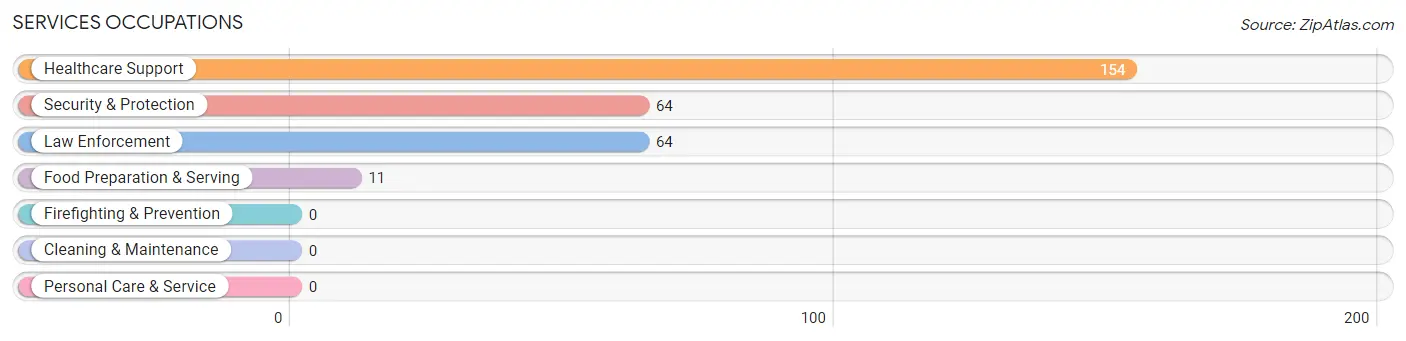
Services Occupations
The most common Services occupations in Perezville are Healthcare Support (154 | 27.6%), Security & Protection (64 | 11.5%), Law Enforcement (64 | 11.5%), and Food Preparation & Serving (11 | 2.0%).
Services Occupations by Sex
Within the Services occupations in Perezville, the most male-oriented occupations are Security & Protection (51.6%), and Law Enforcement (51.6%), while the most female-oriented occupations are Healthcare Support (100.0%), Food Preparation & Serving (100.0%), and Security & Protection (48.4%).
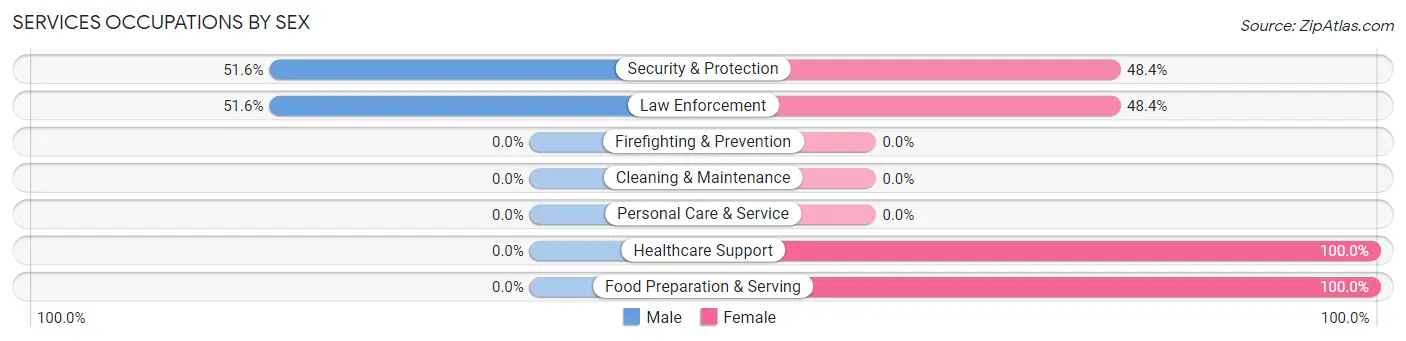
| Occupation | Male | Female |
| Healthcare Support | 0 (0.0%) | 154 (100.0%) |
| Security & Protection | 33 (51.6%) | 31 (48.4%) |
| Firefighting & Prevention | 0 (0.0%) | 0 (0.0%) |
| Law Enforcement | 33 (51.6%) | 31 (48.4%) |
| Food Preparation & Serving | 0 (0.0%) | 11 (100.0%) |
| Cleaning & Maintenance | 0 (0.0%) | 0 (0.0%) |
| Personal Care & Service | 0 (0.0%) | 0 (0.0%) |
| Total (Category) | 33 (14.4%) | 196 (85.6%) |
| Total (Overall) | 264 (47.3%) | 294 (52.7%) |
Sales and Office Occupations
The most common Sales and Office occupations in Perezville are Sales & Related (100 | 17.9%), and Office & Administration (55 | 9.9%).
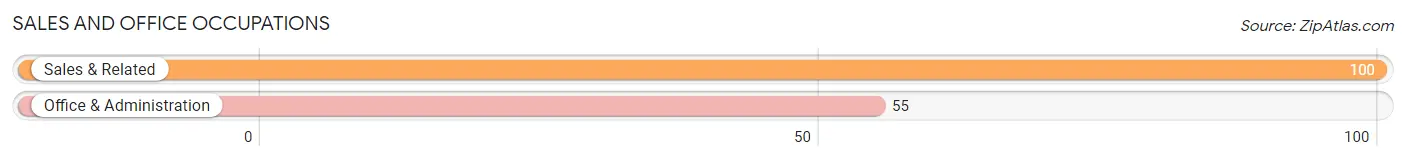
Sales and Office Occupations by Sex

| Occupation | Male | Female |
| Sales & Related | 100 (100.0%) | 0 (0.0%) |
| Office & Administration | 0 (0.0%) | 55 (100.0%) |
| Total (Category) | 100 (64.5%) | 55 (35.5%) |
| Total (Overall) | 264 (47.3%) | 294 (52.7%) |
Natural Resources, Construction and Maintenance Occupations
The most common Natural Resources, Construction and Maintenance occupations in Perezville are Construction & Extraction (48 | 8.6%), and Installation, Maintenance & Repair (24 | 4.3%).
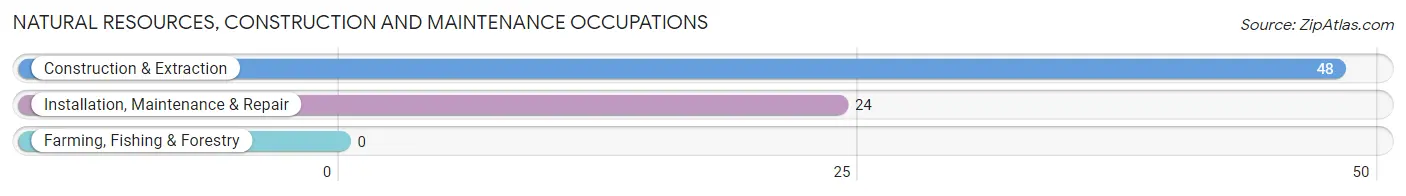
Natural Resources, Construction and Maintenance Occupations by Sex
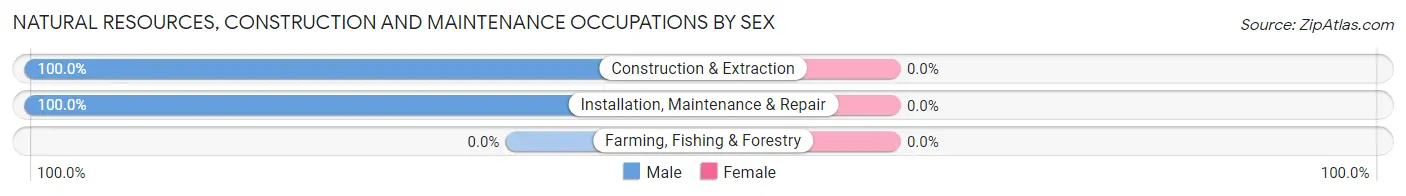
| Occupation | Male | Female |
| Farming, Fishing & Forestry | 0 (0.0%) | 0 (0.0%) |
| Construction & Extraction | 48 (100.0%) | 0 (0.0%) |
| Installation, Maintenance & Repair | 24 (100.0%) | 0 (0.0%) |
| Total (Category) | 72 (100.0%) | 0 (0.0%) |
| Total (Overall) | 264 (47.3%) | 294 (52.7%) |
Production, Transportation and Moving Occupations
The most common Production, Transportation and Moving occupations in Perezville are , and Transportation (91 | 16.3%).
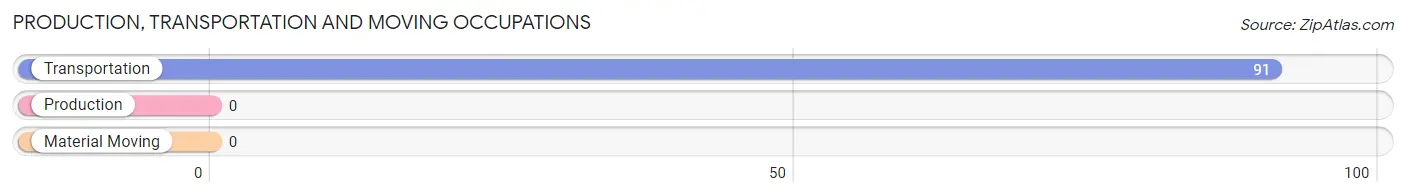
Production, Transportation and Moving Occupations by Sex
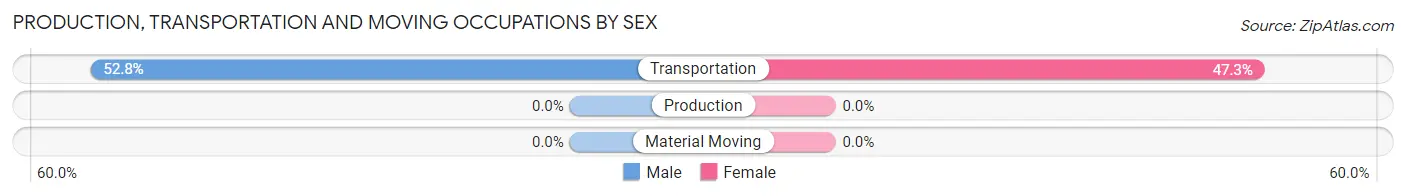
| Occupation | Male | Female |
| Production | 0 (0.0%) | 0 (0.0%) |
| Transportation | 48 (52.7%) | 43 (47.2%) |
| Material Moving | 0 (0.0%) | 0 (0.0%) |
| Total (Category) | 48 (52.7%) | 43 (47.2%) |
| Total (Overall) | 264 (47.3%) | 294 (52.7%) |
Employment Industries by Sex in Perezville
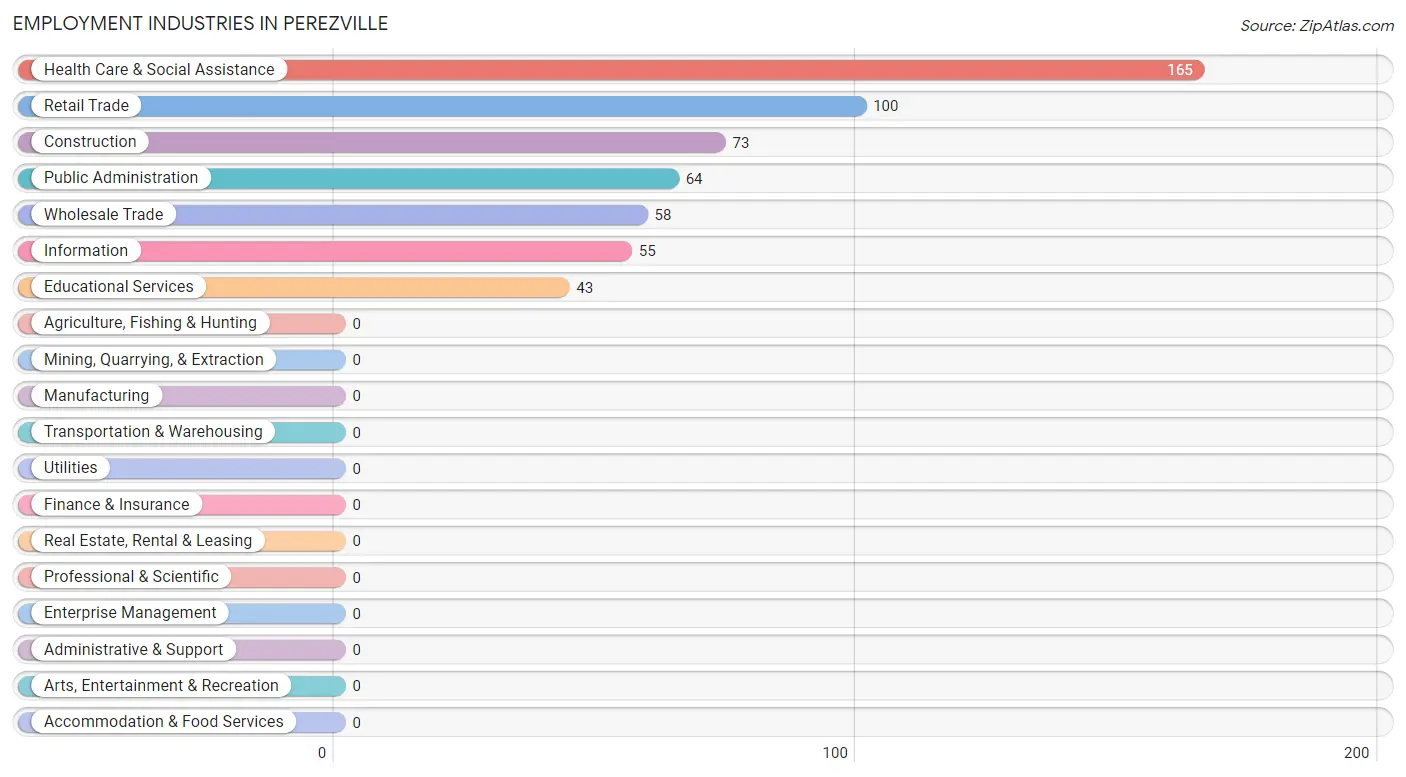
Employment Industries in Perezville
The major employment industries in Perezville include Health Care & Social Assistance (165 | 29.6%), Retail Trade (100 | 17.9%), Construction (73 | 13.1%), Public Administration (64 | 11.5%), and Wholesale Trade (58 | 10.4%).
Employment Industries by Sex in Perezville
The Perezville industries that see more men than women are Construction (100.0%), Wholesale Trade (100.0%), and Retail Trade (100.0%), whereas the industries that tend to have a higher number of women are Information (100.0%), Educational Services (100.0%), and Health Care & Social Assistance (100.0%).
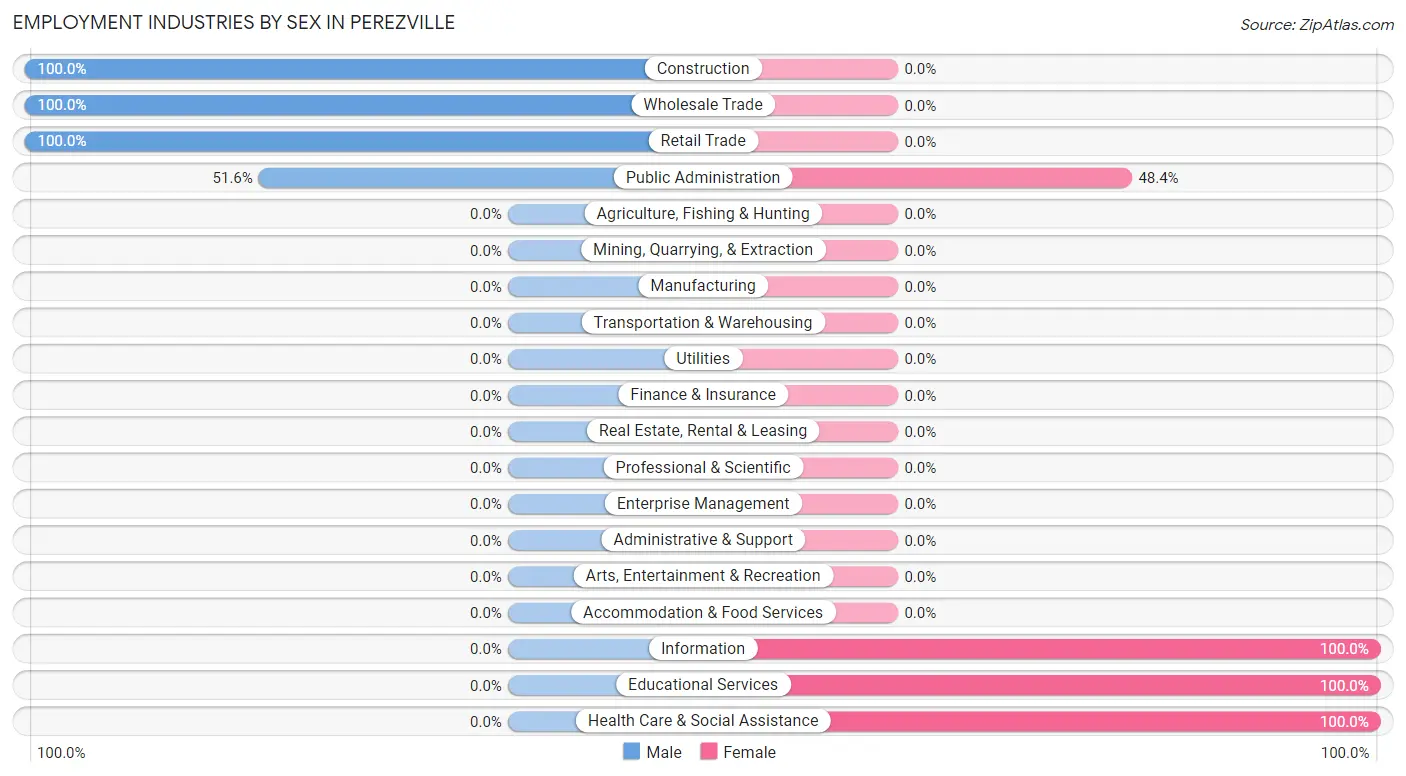
| Industry | Male | Female |
| Agriculture, Fishing & Hunting | 0 (0.0%) | 0 (0.0%) |
| Mining, Quarrying, & Extraction | 0 (0.0%) | 0 (0.0%) |
| Construction | 73 (100.0%) | 0 (0.0%) |
| Manufacturing | 0 (0.0%) | 0 (0.0%) |
| Wholesale Trade | 58 (100.0%) | 0 (0.0%) |
| Retail Trade | 100 (100.0%) | 0 (0.0%) |
| Transportation & Warehousing | 0 (0.0%) | 0 (0.0%) |
| Utilities | 0 (0.0%) | 0 (0.0%) |
| Information | 0 (0.0%) | 55 (100.0%) |
| Finance & Insurance | 0 (0.0%) | 0 (0.0%) |
| Real Estate, Rental & Leasing | 0 (0.0%) | 0 (0.0%) |
| Professional & Scientific | 0 (0.0%) | 0 (0.0%) |
| Enterprise Management | 0 (0.0%) | 0 (0.0%) |
| Administrative & Support | 0 (0.0%) | 0 (0.0%) |
| Educational Services | 0 (0.0%) | 43 (100.0%) |
| Health Care & Social Assistance | 0 (0.0%) | 165 (100.0%) |
| Arts, Entertainment & Recreation | 0 (0.0%) | 0 (0.0%) |
| Accommodation & Food Services | 0 (0.0%) | 0 (0.0%) |
| Public Administration | 33 (51.6%) | 31 (48.4%) |
| Total | 264 (47.3%) | 294 (52.7%) |
Education in Perezville
School Enrollment in Perezville
The most common levels of schooling among the 611 students in Perezville are elementary school (169 | 27.7%), college / undergraduate (164 | 26.8%), and kindergarten (96 | 15.7%).
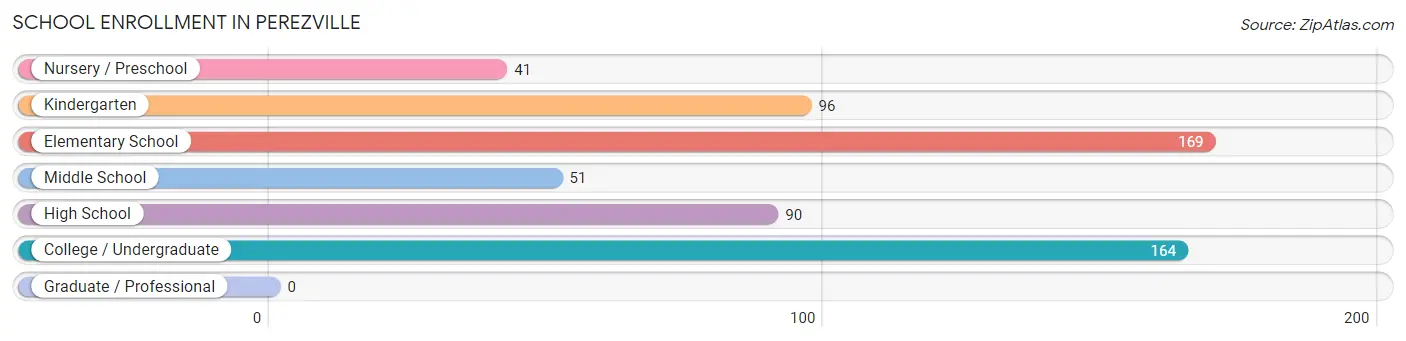
| School Level | # Students | % Students |
| Nursery / Preschool | 41 | 6.7% |
| Kindergarten | 96 | 15.7% |
| Elementary School | 169 | 27.7% |
| Middle School | 51 | 8.4% |
| High School | 90 | 14.7% |
| College / Undergraduate | 164 | 26.8% |
| Graduate / Professional | 0 | 0.0% |
| Total | 611 | 100.0% |
School Enrollment by Age by Funding Source in Perezville
Out of a total of 611 students who are enrolled in schools in Perezville, 100 (16.4%) attend a private institution, while the remaining 511 (83.6%) are enrolled in public schools. The age group of 5 to 9 year old has the highest likelihood of being enrolled in private schools, with 100 (32.7% in the age bracket) enrolled. Conversely, the age group of 10 to 14 year olds has the lowest likelihood of being enrolled in a private school, with 51 (100.0% in the age bracket) attending a public institution.
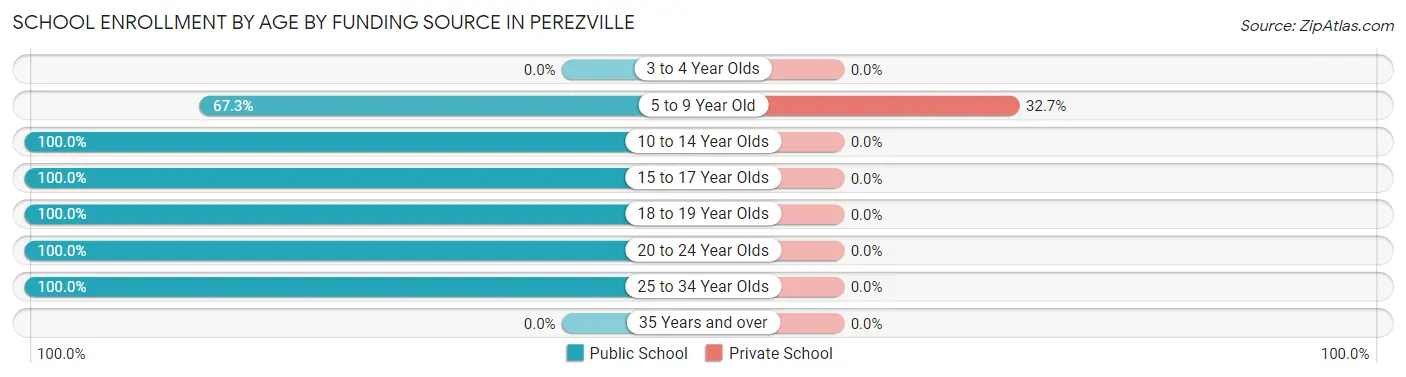
| Age Bracket | Public School | Private School |
| 3 to 4 Year Olds | 0 (0.0%) | 0 (0.0%) |
| 5 to 9 Year Old | 206 (67.3%) | 100 (32.7%) |
| 10 to 14 Year Olds | 51 (100.0%) | 0 (0.0%) |
| 15 to 17 Year Olds | 90 (100.0%) | 0 (0.0%) |
| 18 to 19 Year Olds | 91 (100.0%) | 0 (0.0%) |
| 20 to 24 Year Olds | 11 (100.0%) | 0 (0.0%) |
| 25 to 34 Year Olds | 62 (100.0%) | 0 (0.0%) |
| 35 Years and over | 0 (0.0%) | 0 (0.0%) |
| Total | 511 (83.6%) | 100 (16.4%) |
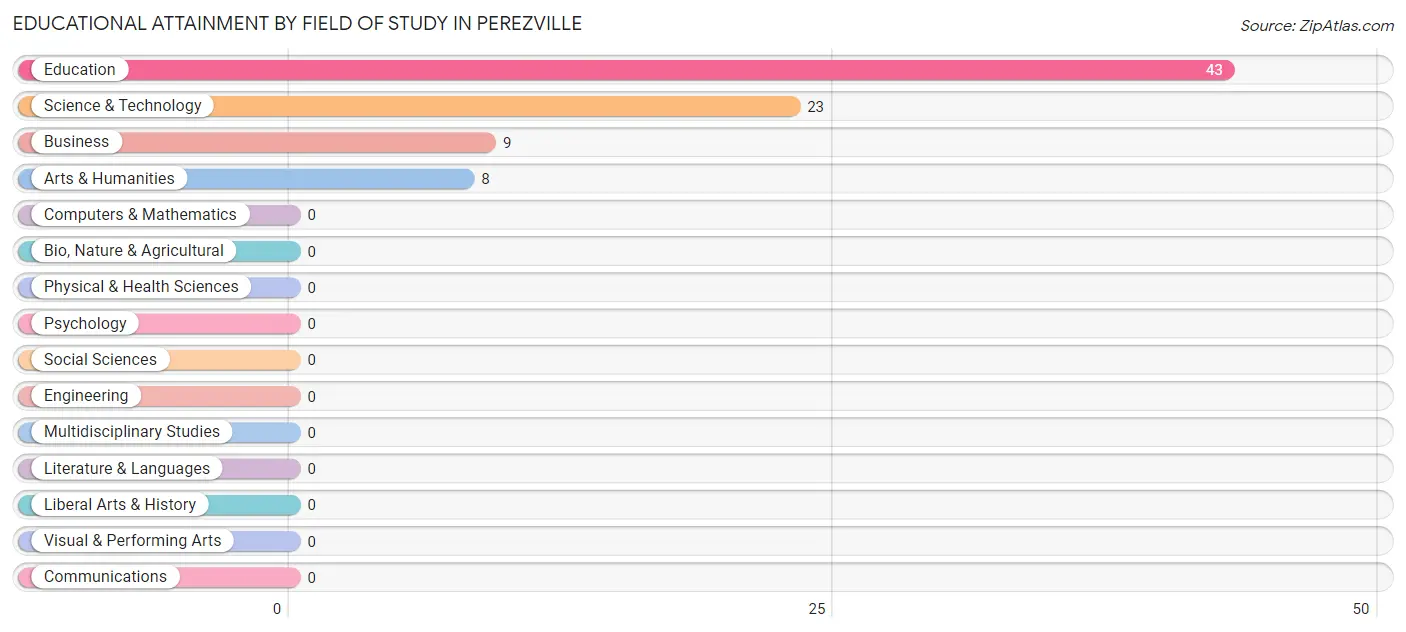
Educational Attainment by Field of Study in Perezville
Education (43 | 51.8%), science & technology (23 | 27.7%), business (9 | 10.8%), and arts & humanities (8 | 9.6%) are the most common fields of study among 83 individuals in Perezville who have obtained a bachelor's degree or higher.
| Field of Study | # Graduates | % Graduates |
| Computers & Mathematics | 0 | 0.0% |
| Bio, Nature & Agricultural | 0 | 0.0% |
| Physical & Health Sciences | 0 | 0.0% |
| Psychology | 0 | 0.0% |
| Social Sciences | 0 | 0.0% |
| Engineering | 0 | 0.0% |
| Multidisciplinary Studies | 0 | 0.0% |
| Science & Technology | 23 | 27.7% |
| Business | 9 | 10.8% |
| Education | 43 | 51.8% |
| Literature & Languages | 0 | 0.0% |
| Liberal Arts & History | 0 | 0.0% |
| Visual & Performing Arts | 0 | 0.0% |
| Communications | 0 | 0.0% |
| Arts & Humanities | 8 | 9.6% |
| Total | 83 | 100.0% |
Transportation & Commute in Perezville
Vehicle Availability by Sex in Perezville
The most prevalent vehicle ownership categories in Perezville are males with 3 vehicles (153, accounting for 58.0%) and females with 3 vehicles (160, making up 52.0%).
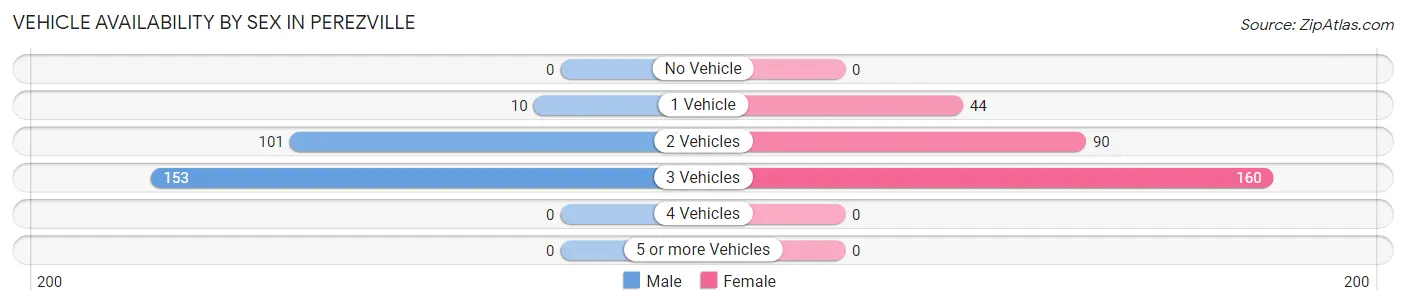
| Vehicles Available | Male | Female |
| No Vehicle | 0 (0.0%) | 0 (0.0%) |
| 1 Vehicle | 10 (3.8%) | 44 (15.0%) |
| 2 Vehicles | 101 (38.3%) | 90 (30.6%) |
| 3 Vehicles | 153 (58.0%) | 160 (54.4%) |
| 4 Vehicles | 0 (0.0%) | 0 (0.0%) |
| 5 or more Vehicles | 0 (0.0%) | 0 (0.0%) |
| Total | 264 (100.0%) | 294 (100.0%) |
Commute Time in Perezville
The most frequently occuring commute durations in Perezville are 15 to 19 minutes (117 commuters, 21.0%), 30 to 34 minutes (106 commuters, 19.0%), and 25 to 29 minutes (90 commuters, 16.1%).
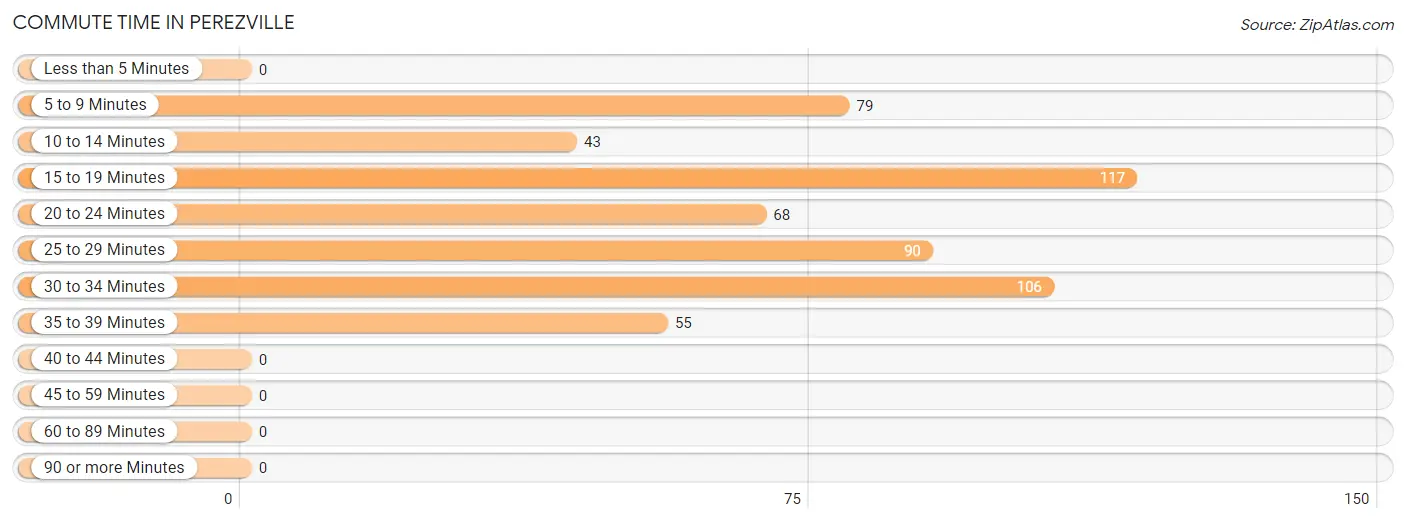
| Commute Time | # Commuters | % Commuters |
| Less than 5 Minutes | 0 | 0.0% |
| 5 to 9 Minutes | 79 | 14.2% |
| 10 to 14 Minutes | 43 | 7.7% |
| 15 to 19 Minutes | 117 | 21.0% |
| 20 to 24 Minutes | 68 | 12.2% |
| 25 to 29 Minutes | 90 | 16.1% |
| 30 to 34 Minutes | 106 | 19.0% |
| 35 to 39 Minutes | 55 | 9.9% |
| 40 to 44 Minutes | 0 | 0.0% |
| 45 to 59 Minutes | 0 | 0.0% |
| 60 to 89 Minutes | 0 | 0.0% |
| 90 or more Minutes | 0 | 0.0% |
Commute Time by Sex in Perezville
The most common commute times in Perezville are 30 to 34 minutes (106 commuters, 40.2%) for males and 15 to 19 minutes (117 commuters, 39.8%) for females.
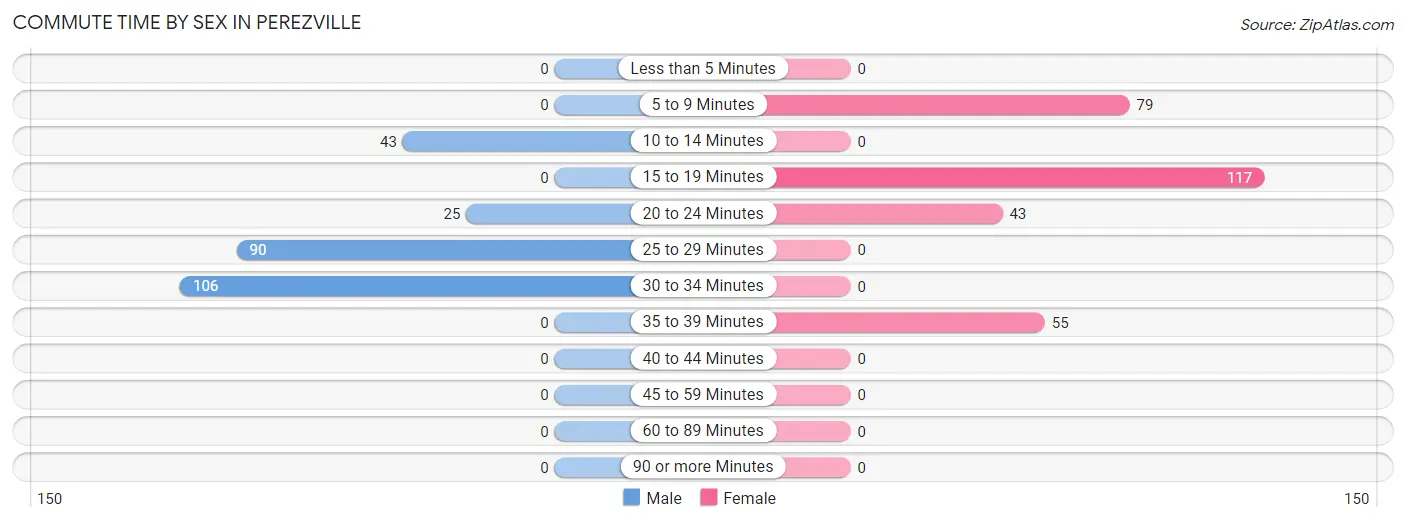
| Commute Time | Male | Female |
| Less than 5 Minutes | 0 (0.0%) | 0 (0.0%) |
| 5 to 9 Minutes | 0 (0.0%) | 79 (26.9%) |
| 10 to 14 Minutes | 43 (16.3%) | 0 (0.0%) |
| 15 to 19 Minutes | 0 (0.0%) | 117 (39.8%) |
| 20 to 24 Minutes | 25 (9.5%) | 43 (14.6%) |
| 25 to 29 Minutes | 90 (34.1%) | 0 (0.0%) |
| 30 to 34 Minutes | 106 (40.2%) | 0 (0.0%) |
| 35 to 39 Minutes | 0 (0.0%) | 55 (18.7%) |
| 40 to 44 Minutes | 0 (0.0%) | 0 (0.0%) |
| 45 to 59 Minutes | 0 (0.0%) | 0 (0.0%) |
| 60 to 89 Minutes | 0 (0.0%) | 0 (0.0%) |
| 90 or more Minutes | 0 (0.0%) | 0 (0.0%) |
Time of Departure to Work by Sex in Perezville
The most frequent times of departure to work in Perezville are 7:00 AM to 7:29 AM (121, 45.8%) for males and 12:00 PM to 3:59 PM (110, 37.4%) for females.
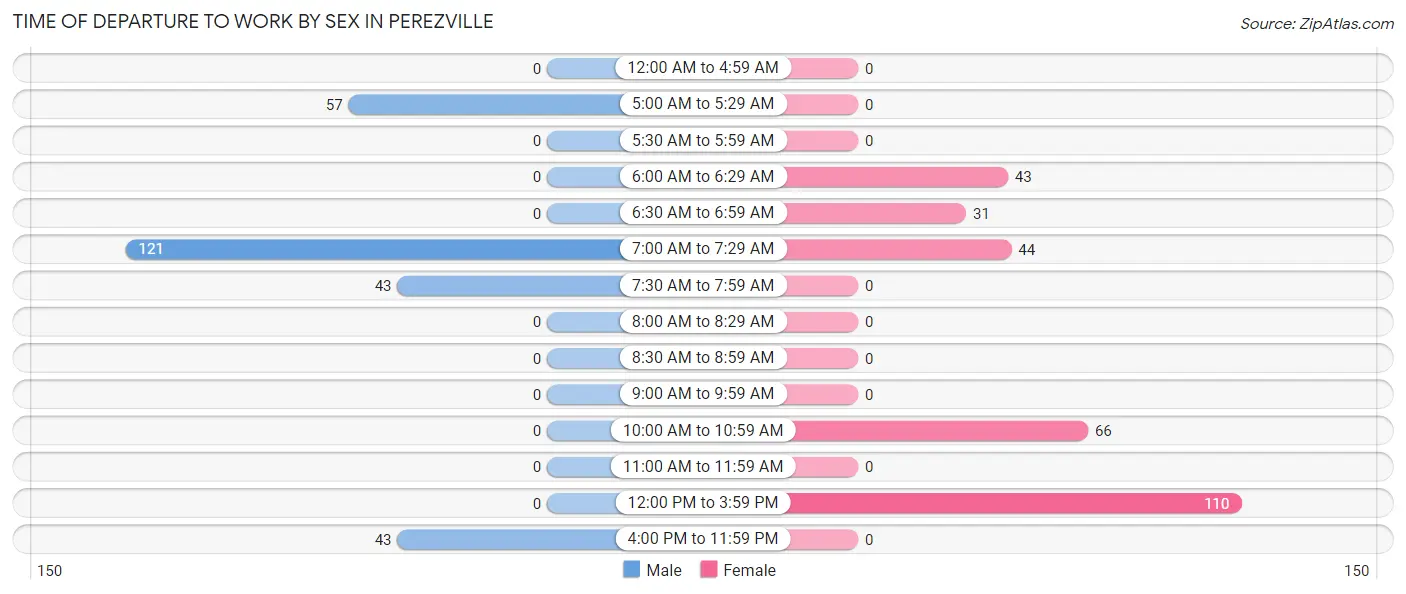
| Time of Departure | Male | Female |
| 12:00 AM to 4:59 AM | 0 (0.0%) | 0 (0.0%) |
| 5:00 AM to 5:29 AM | 57 (21.6%) | 0 (0.0%) |
| 5:30 AM to 5:59 AM | 0 (0.0%) | 0 (0.0%) |
| 6:00 AM to 6:29 AM | 0 (0.0%) | 43 (14.6%) |
| 6:30 AM to 6:59 AM | 0 (0.0%) | 31 (10.5%) |
| 7:00 AM to 7:29 AM | 121 (45.8%) | 44 (15.0%) |
| 7:30 AM to 7:59 AM | 43 (16.3%) | 0 (0.0%) |
| 8:00 AM to 8:29 AM | 0 (0.0%) | 0 (0.0%) |
| 8:30 AM to 8:59 AM | 0 (0.0%) | 0 (0.0%) |
| 9:00 AM to 9:59 AM | 0 (0.0%) | 0 (0.0%) |
| 10:00 AM to 10:59 AM | 0 (0.0%) | 66 (22.5%) |
| 11:00 AM to 11:59 AM | 0 (0.0%) | 0 (0.0%) |
| 12:00 PM to 3:59 PM | 0 (0.0%) | 110 (37.4%) |
| 4:00 PM to 11:59 PM | 43 (16.3%) | 0 (0.0%) |
| Total | 264 (100.0%) | 294 (100.0%) |
Housing Occupancy in Perezville
Occupancy by Ownership in Perezville
Of the total 1,000 dwellings in Perezville, owner-occupied units account for 883 (88.3%), while renter-occupied units make up 117 (11.7%).
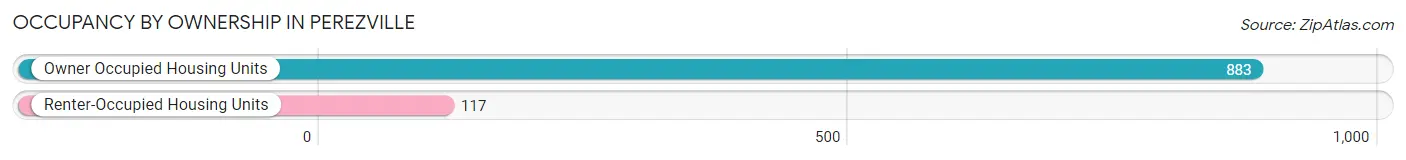
| Occupancy | # Housing Units | % Housing Units |
| Owner Occupied Housing Units | 883 | 88.3% |
| Renter-Occupied Housing Units | 117 | 11.7% |
| Total Occupied Housing Units | 1,000 | 100.0% |
Occupancy by Household Size in Perezville
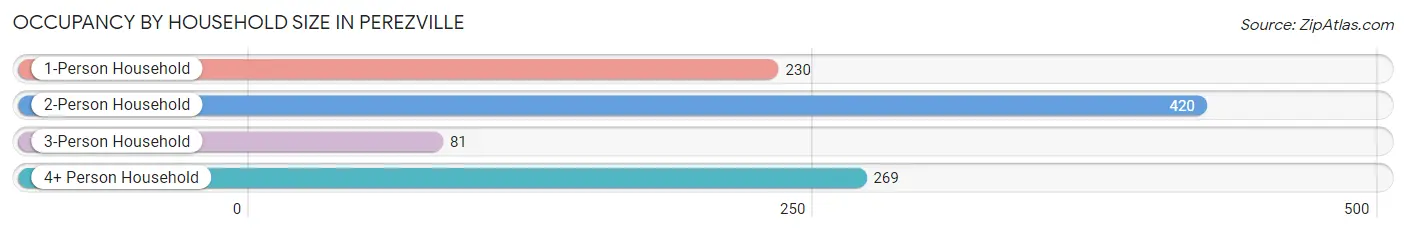
| Household Size | # Housing Units | % Housing Units |
| 1-Person Household | 230 | 23.0% |
| 2-Person Household | 420 | 42.0% |
| 3-Person Household | 81 | 8.1% |
| 4+ Person Household | 269 | 26.9% |
| Total Housing Units | 1,000 | 100.0% |
Occupancy by Ownership by Household Size in Perezville
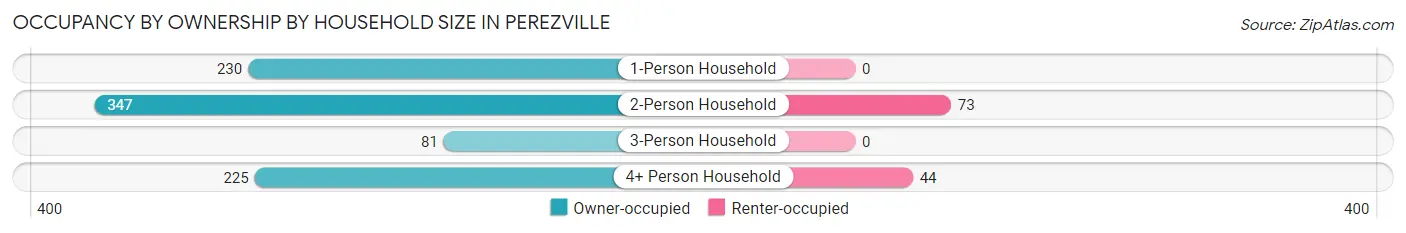
| Household Size | Owner-occupied | Renter-occupied |
| 1-Person Household | 230 (100.0%) | 0 (0.0%) |
| 2-Person Household | 347 (82.6%) | 73 (17.4%) |
| 3-Person Household | 81 (100.0%) | 0 (0.0%) |
| 4+ Person Household | 225 (83.6%) | 44 (16.4%) |
| Total Housing Units | 883 (88.3%) | 117 (11.7%) |
Occupancy by Educational Attainment in Perezville
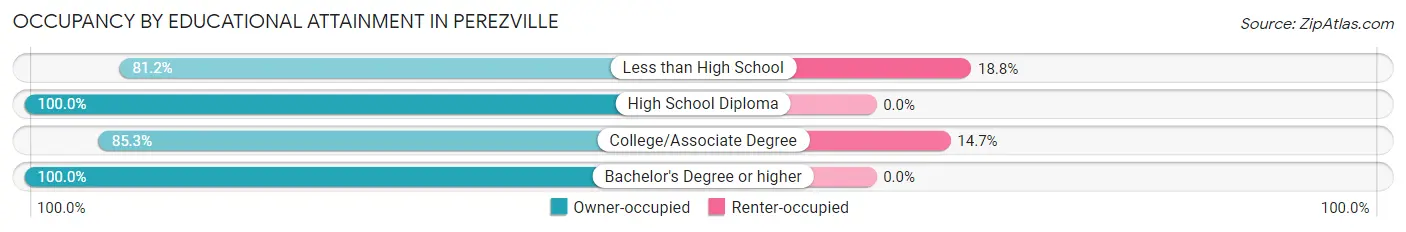
| Household Size | Owner-occupied | Renter-occupied |
| Less than High School | 315 (81.2%) | 73 (18.8%) |
| High School Diploma | 296 (100.0%) | 0 (0.0%) |
| College/Associate Degree | 255 (85.3%) | 44 (14.7%) |
| Bachelor's Degree or higher | 17 (100.0%) | 0 (0.0%) |
Occupancy by Age of Householder in Perezville
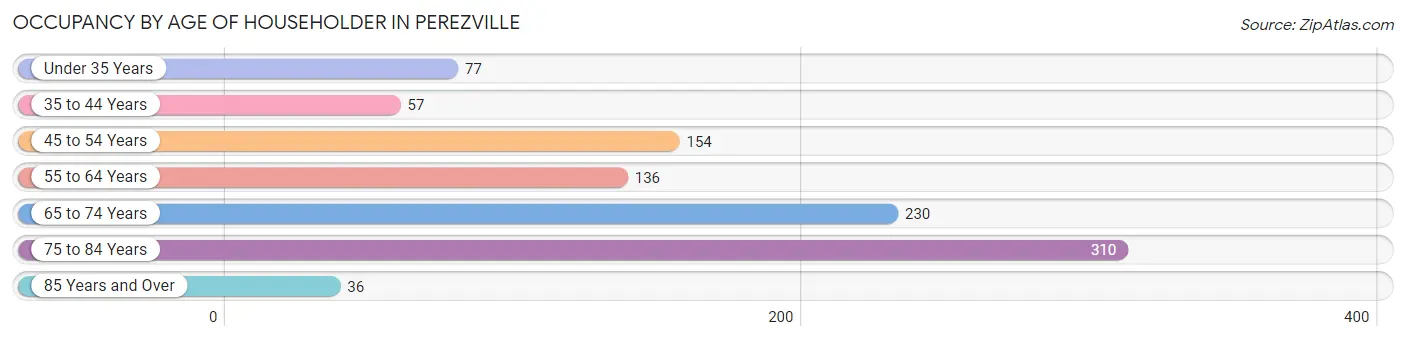
| Age Bracket | # Households | % Households |
| Under 35 Years | 77 | 7.7% |
| 35 to 44 Years | 57 | 5.7% |
| 45 to 54 Years | 154 | 15.4% |
| 55 to 64 Years | 136 | 13.6% |
| 65 to 74 Years | 230 | 23.0% |
| 75 to 84 Years | 310 | 31.0% |
| 85 Years and Over | 36 | 3.6% |
| Total | 1,000 | 100.0% |
Housing Finances in Perezville
Median Income by Occupancy in Perezville
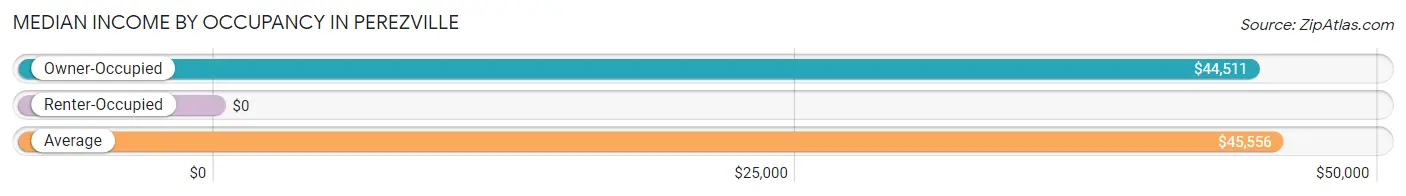
| Occupancy Type | # Households | Median Income |
| Owner-Occupied | 883 (88.3%) | $44,511 |
| Renter-Occupied | 117 (11.7%) | $0 |
| Average | 1,000 (100.0%) | $45,556 |
Occupancy by Householder Income Bracket in Perezville
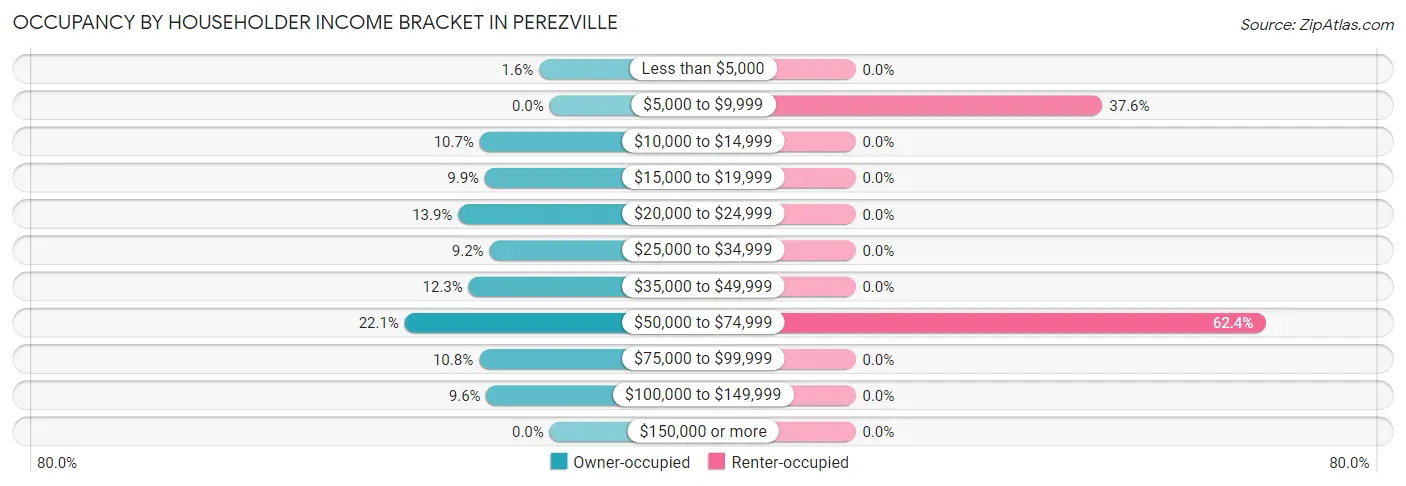
| Income Bracket | Owner-occupied | Renter-occupied |
| Less than $5,000 | 14 (1.6%) | 0 (0.0%) |
| $5,000 to $9,999 | 0 (0.0%) | 44 (37.6%) |
| $10,000 to $14,999 | 94 (10.6%) | 0 (0.0%) |
| $15,000 to $19,999 | 87 (9.9%) | 0 (0.0%) |
| $20,000 to $24,999 | 123 (13.9%) | 0 (0.0%) |
| $25,000 to $34,999 | 81 (9.2%) | 0 (0.0%) |
| $35,000 to $49,999 | 109 (12.3%) | 0 (0.0%) |
| $50,000 to $74,999 | 195 (22.1%) | 73 (62.4%) |
| $75,000 to $99,999 | 95 (10.8%) | 0 (0.0%) |
| $100,000 to $149,999 | 85 (9.6%) | 0 (0.0%) |
| $150,000 or more | 0 (0.0%) | 0 (0.0%) |
| Total | 883 (100.0%) | 117 (100.0%) |
Monthly Housing Cost Tiers in Perezville
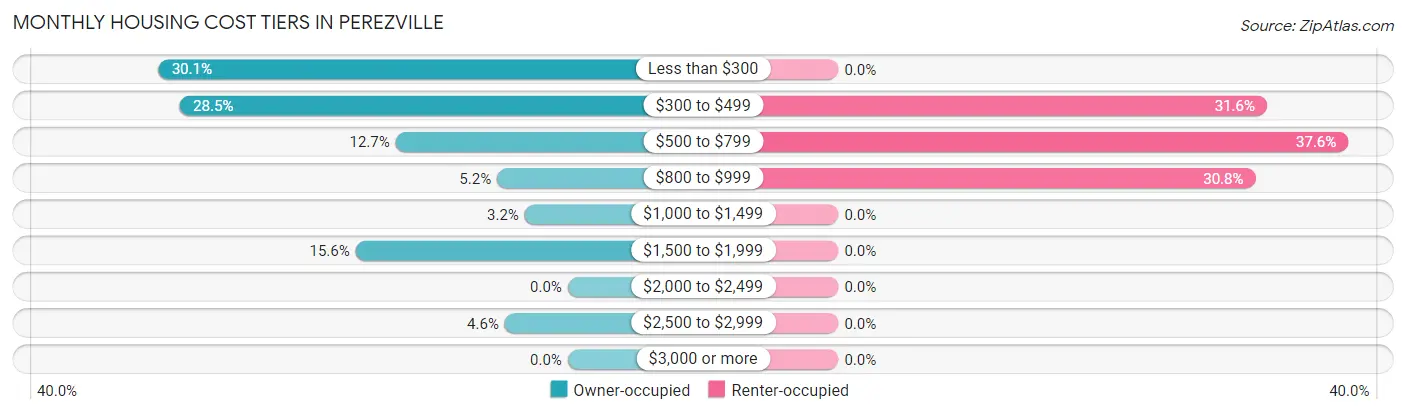
| Monthly Cost | Owner-occupied | Renter-occupied |
| Less than $300 | 266 (30.1%) | 0 (0.0%) |
| $300 to $499 | 252 (28.5%) | 37 (31.6%) |
| $500 to $799 | 112 (12.7%) | 44 (37.6%) |
| $800 to $999 | 46 (5.2%) | 36 (30.8%) |
| $1,000 to $1,499 | 28 (3.2%) | 0 (0.0%) |
| $1,500 to $1,999 | 138 (15.6%) | 0 (0.0%) |
| $2,000 to $2,499 | 0 (0.0%) | 0 (0.0%) |
| $2,500 to $2,999 | 41 (4.6%) | 0 (0.0%) |
| $3,000 or more | 0 (0.0%) | 0 (0.0%) |
| Total | 883 (100.0%) | 117 (100.0%) |
Physical Housing Characteristics in Perezville
Housing Structures in Perezville
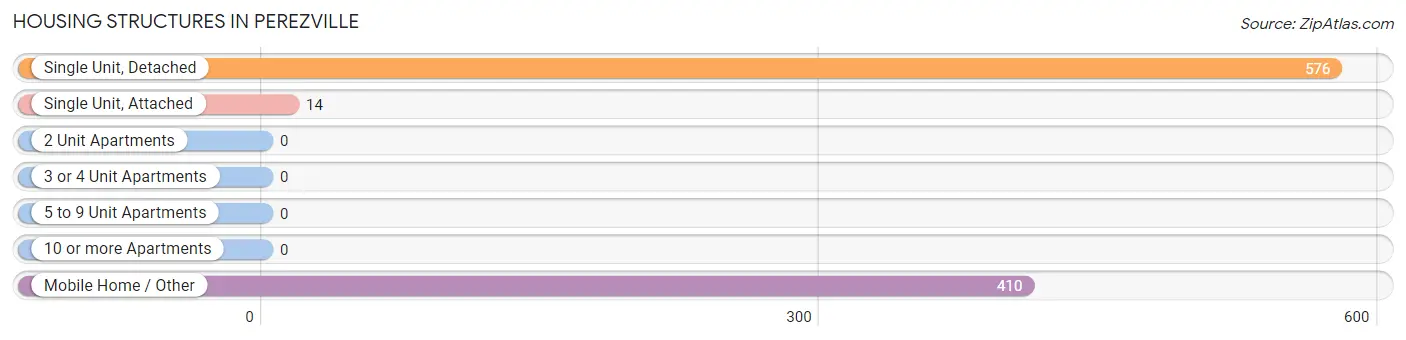
| Structure Type | # Housing Units | % Housing Units |
| Single Unit, Detached | 576 | 57.6% |
| Single Unit, Attached | 14 | 1.4% |
| 2 Unit Apartments | 0 | 0.0% |
| 3 or 4 Unit Apartments | 0 | 0.0% |
| 5 to 9 Unit Apartments | 0 | 0.0% |
| 10 or more Apartments | 0 | 0.0% |
| Mobile Home / Other | 410 | 41.0% |
| Total | 1,000 | 100.0% |
Housing Structures by Occupancy in Perezville
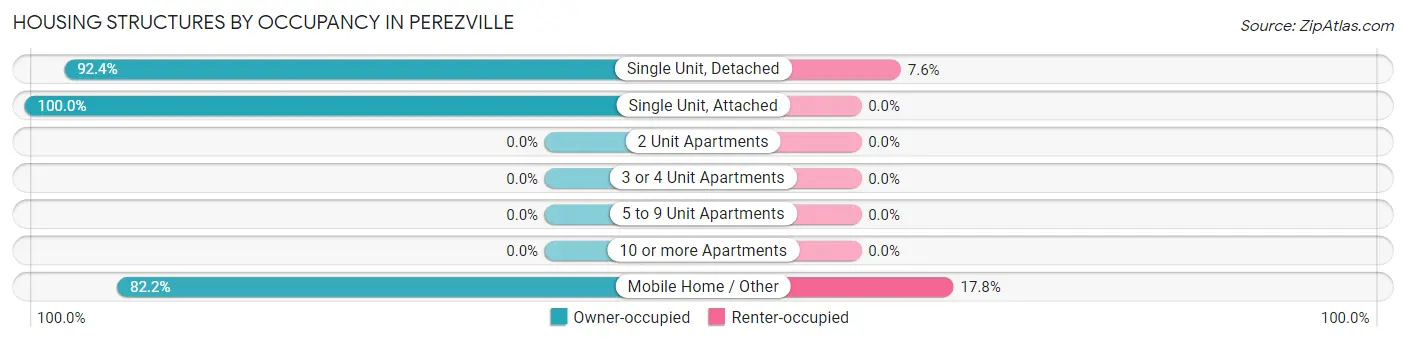
| Structure Type | Owner-occupied | Renter-occupied |
| Single Unit, Detached | 532 (92.4%) | 44 (7.6%) |
| Single Unit, Attached | 14 (100.0%) | 0 (0.0%) |
| 2 Unit Apartments | 0 (0.0%) | 0 (0.0%) |
| 3 or 4 Unit Apartments | 0 (0.0%) | 0 (0.0%) |
| 5 to 9 Unit Apartments | 0 (0.0%) | 0 (0.0%) |
| 10 or more Apartments | 0 (0.0%) | 0 (0.0%) |
| Mobile Home / Other | 337 (82.2%) | 73 (17.8%) |
| Total | 883 (88.3%) | 117 (11.7%) |
Housing Structures by Number of Rooms in Perezville
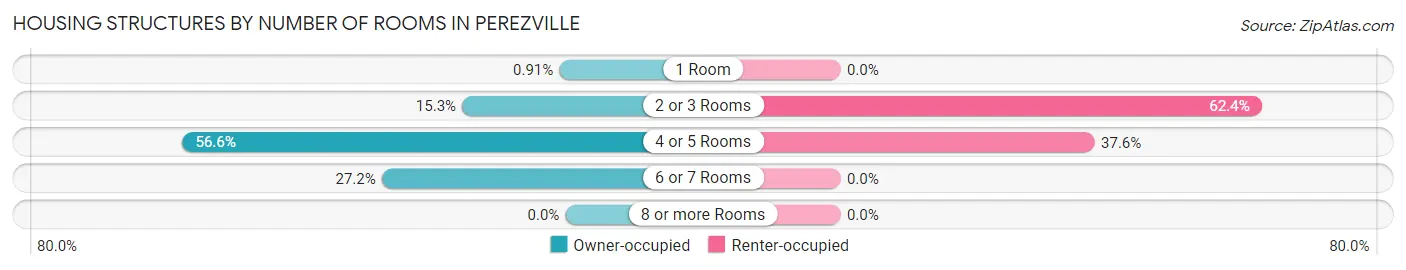
| Number of Rooms | Owner-occupied | Renter-occupied |
| 1 Room | 8 (0.9%) | 0 (0.0%) |
| 2 or 3 Rooms | 135 (15.3%) | 73 (62.4%) |
| 4 or 5 Rooms | 500 (56.6%) | 44 (37.6%) |
| 6 or 7 Rooms | 240 (27.2%) | 0 (0.0%) |
| 8 or more Rooms | 0 (0.0%) | 0 (0.0%) |
| Total | 883 (100.0%) | 117 (100.0%) |
Housing Structure by Heating Type in Perezville
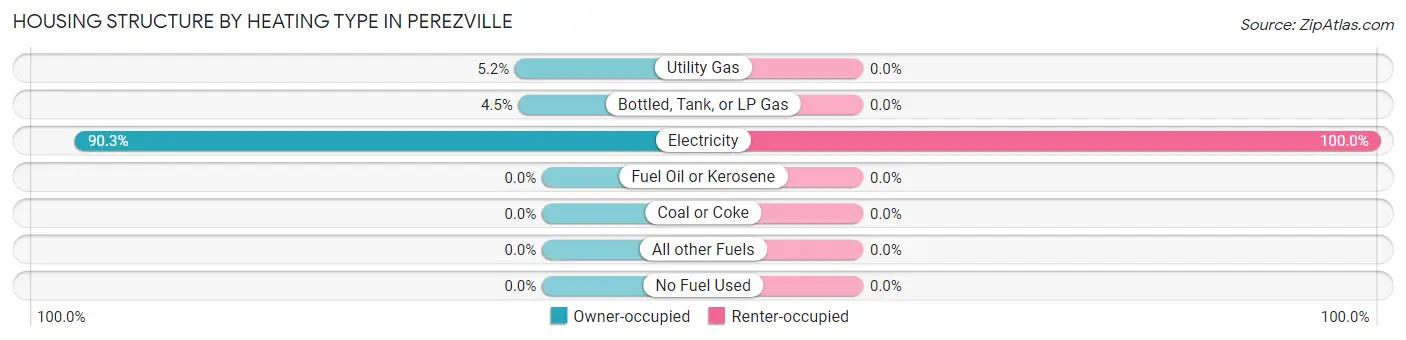
| Heating Type | Owner-occupied | Renter-occupied |
| Utility Gas | 46 (5.2%) | 0 (0.0%) |
| Bottled, Tank, or LP Gas | 40 (4.5%) | 0 (0.0%) |
| Electricity | 797 (90.3%) | 117 (100.0%) |
| Fuel Oil or Kerosene | 0 (0.0%) | 0 (0.0%) |
| Coal or Coke | 0 (0.0%) | 0 (0.0%) |
| All other Fuels | 0 (0.0%) | 0 (0.0%) |
| No Fuel Used | 0 (0.0%) | 0 (0.0%) |
| Total | 883 (100.0%) | 117 (100.0%) |
Household Vehicle Usage in Perezville
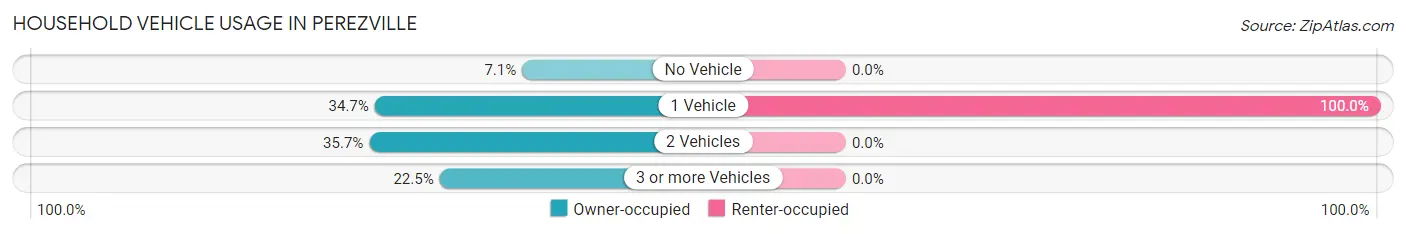
| Vehicles per Household | Owner-occupied | Renter-occupied |
| No Vehicle | 63 (7.1%) | 0 (0.0%) |
| 1 Vehicle | 306 (34.6%) | 117 (100.0%) |
| 2 Vehicles | 315 (35.7%) | 0 (0.0%) |
| 3 or more Vehicles | 199 (22.5%) | 0 (0.0%) |
| Total | 883 (100.0%) | 117 (100.0%) |
Real Estate & Mortgages in Perezville
Real Estate and Mortgage Overview in Perezville
| Characteristic | Without Mortgage | With Mortgage |
| Housing Units | 630 | 253 |
| Median Property Value | $71,500 | $141,300 |
| Median Household Income | $41,607 | $0 |
| Monthly Housing Costs | $400 | $0 |
| Real Estate Taxes | $889 | $32 |
Property Value by Mortgage Status in Perezville
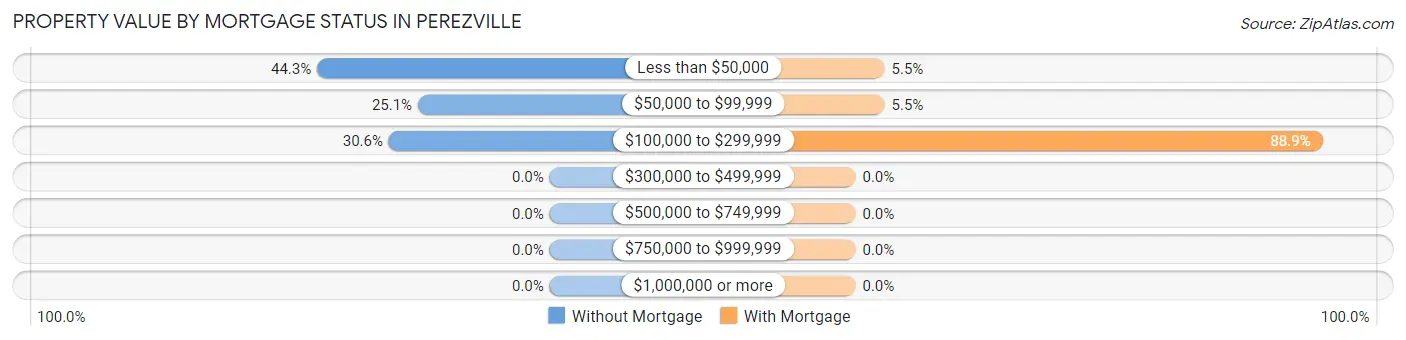
| Property Value | Without Mortgage | With Mortgage |
| Less than $50,000 | 279 (44.3%) | 14 (5.5%) |
| $50,000 to $99,999 | 158 (25.1%) | 14 (5.5%) |
| $100,000 to $299,999 | 193 (30.6%) | 225 (88.9%) |
| $300,000 to $499,999 | 0 (0.0%) | 0 (0.0%) |
| $500,000 to $749,999 | 0 (0.0%) | 0 (0.0%) |
| $750,000 to $999,999 | 0 (0.0%) | 0 (0.0%) |
| $1,000,000 or more | 0 (0.0%) | 0 (0.0%) |
| Total | 630 (100.0%) | 253 (100.0%) |
Household Income by Mortgage Status in Perezville
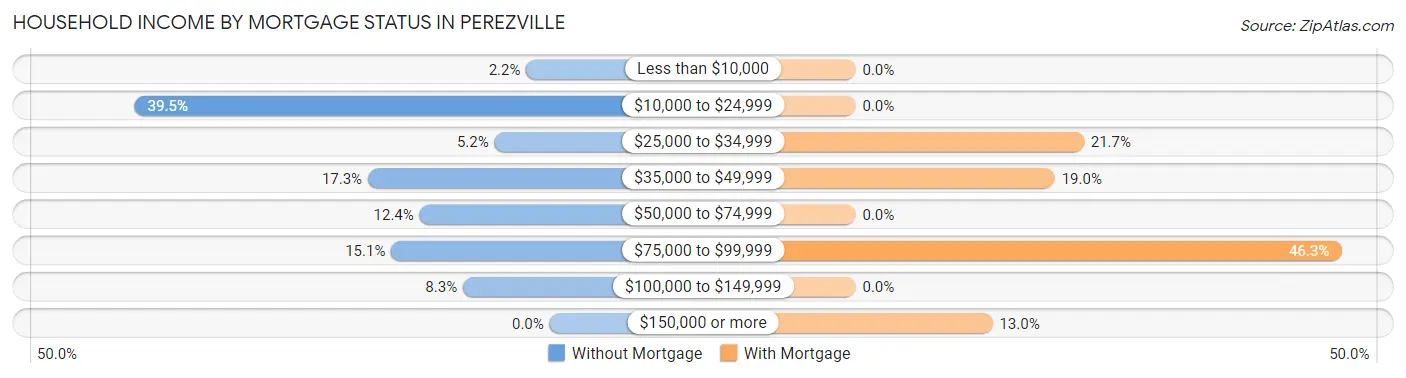
| Household Income | Without Mortgage | With Mortgage |
| Less than $10,000 | 14 (2.2%) | 0 (0.0%) |
| $10,000 to $24,999 | 249 (39.5%) | 0 (0.0%) |
| $25,000 to $34,999 | 33 (5.2%) | 55 (21.7%) |
| $35,000 to $49,999 | 109 (17.3%) | 48 (19.0%) |
| $50,000 to $74,999 | 78 (12.4%) | 0 (0.0%) |
| $75,000 to $99,999 | 95 (15.1%) | 117 (46.3%) |
| $100,000 to $149,999 | 52 (8.3%) | 0 (0.0%) |
| $150,000 or more | 0 (0.0%) | 33 (13.0%) |
| Total | 630 (100.0%) | 253 (100.0%) |
Property Value to Household Income Ratio in Perezville
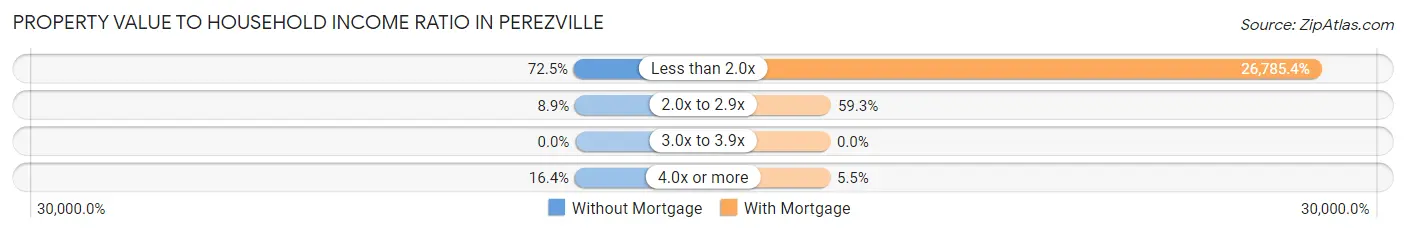
| Value-to-Income Ratio | Without Mortgage | With Mortgage |
| Less than 2.0x | 457 (72.5%) | 67,767 (26,785.4%) |
| 2.0x to 2.9x | 56 (8.9%) | 150 (59.3%) |
| 3.0x to 3.9x | 0 (0.0%) | 0 (0.0%) |
| 4.0x or more | 103 (16.4%) | 14 (5.5%) |
| Total | 630 (100.0%) | 253 (100.0%) |
Real Estate Taxes by Mortgage Status in Perezville
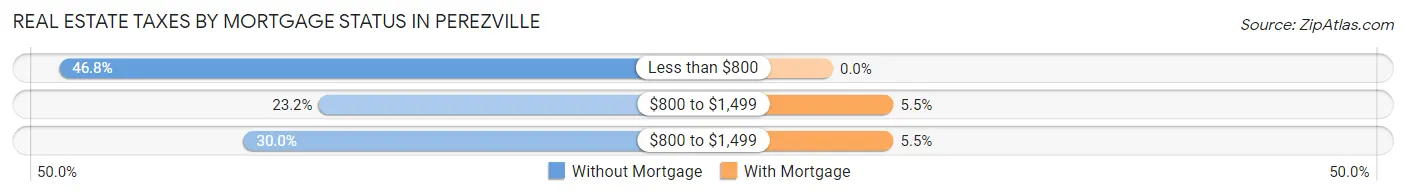
| Property Taxes | Without Mortgage | With Mortgage |
| Less than $800 | 295 (46.8%) | 0 (0.0%) |
| $800 to $1,499 | 146 (23.2%) | 14 (5.5%) |
| $800 to $1,499 | 189 (30.0%) | 14 (5.5%) |
| Total | 630 (100.0%) | 253 (100.0%) |
Health & Disability in Perezville
Health Insurance Coverage by Age in Perezville
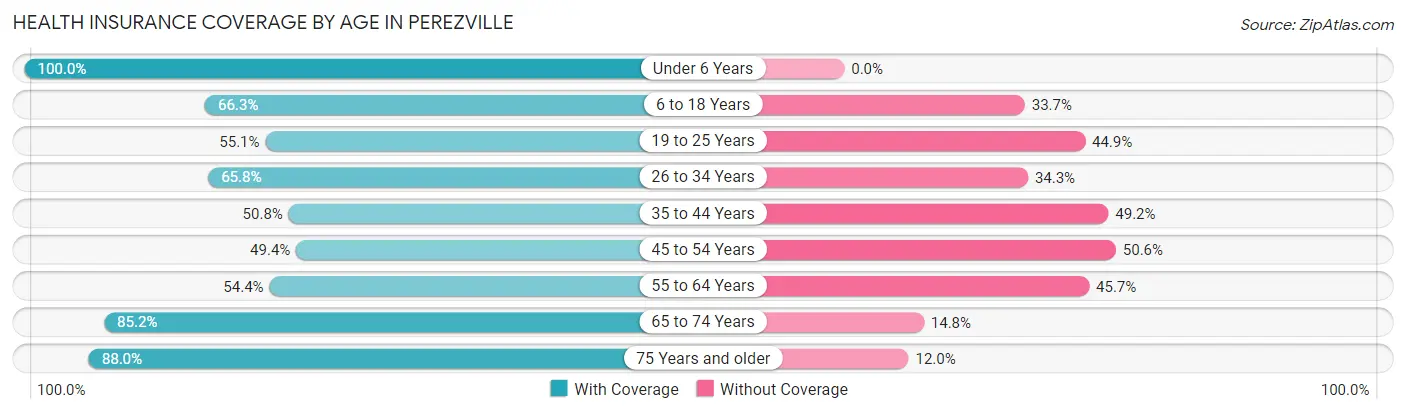
| Age Bracket | With Coverage | Without Coverage |
| Under 6 Years | 335 (100.0%) | 0 (0.0%) |
| 6 to 18 Years | 272 (66.3%) | 138 (33.7%) |
| 19 to 25 Years | 54 (55.1%) | 44 (44.9%) |
| 26 to 34 Years | 119 (65.7%) | 62 (34.3%) |
| 35 to 44 Years | 100 (50.8%) | 97 (49.2%) |
| 45 to 54 Years | 115 (49.4%) | 118 (50.6%) |
| 55 to 64 Years | 150 (54.3%) | 126 (45.7%) |
| 65 to 74 Years | 310 (85.2%) | 54 (14.8%) |
| 75 Years and older | 536 (88.0%) | 73 (12.0%) |
| Total | 1,991 (73.7%) | 712 (26.3%) |
Health Insurance Coverage by Citizenship Status in Perezville
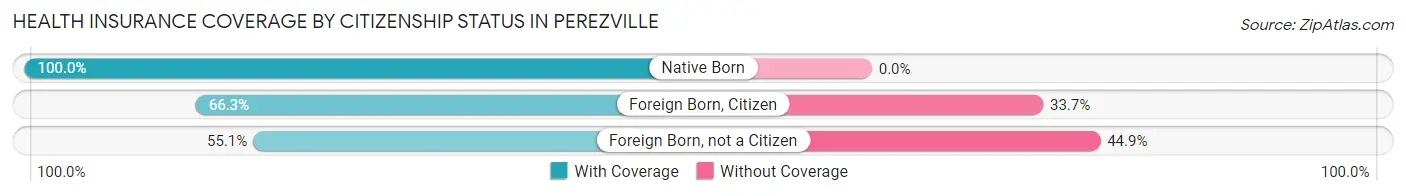
| Citizenship Status | With Coverage | Without Coverage |
| Native Born | 335 (100.0%) | 0 (0.0%) |
| Foreign Born, Citizen | 272 (66.3%) | 138 (33.7%) |
| Foreign Born, not a Citizen | 54 (55.1%) | 44 (44.9%) |
Health Insurance Coverage by Household Income in Perezville
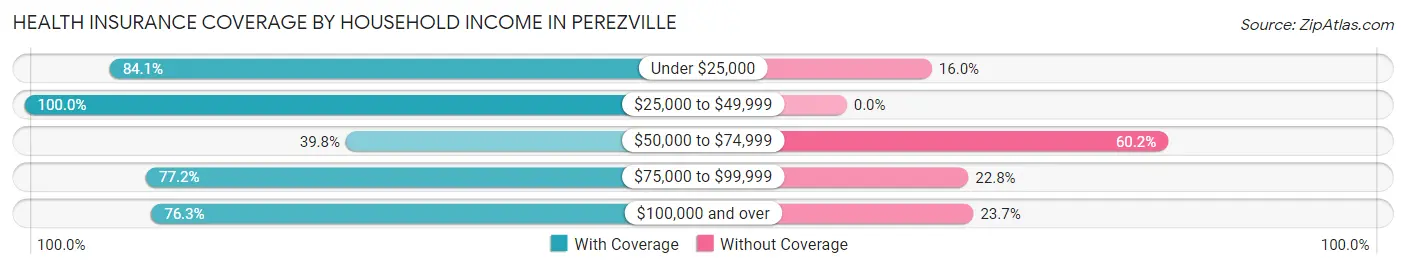
| Household Income | With Coverage | Without Coverage |
| Under $25,000 | 727 (84.1%) | 138 (16.0%) |
| $25,000 to $49,999 | 483 (100.0%) | 0 (0.0%) |
| $50,000 to $74,999 | 280 (39.8%) | 423 (60.2%) |
| $75,000 to $99,999 | 305 (77.2%) | 90 (22.8%) |
| $100,000 and over | 196 (76.3%) | 61 (23.7%) |
Public vs Private Health Insurance Coverage by Age in Perezville
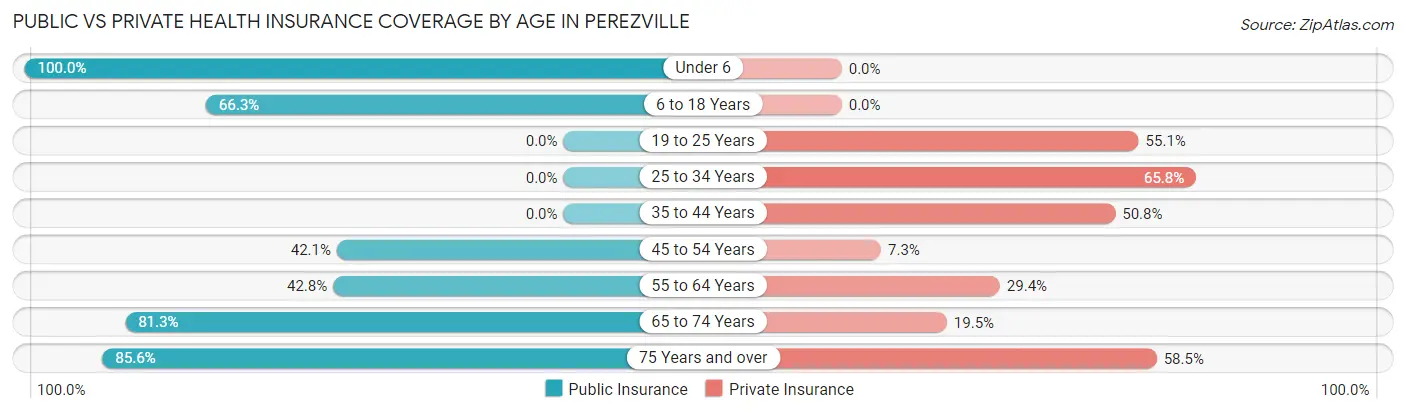
| Age Bracket | Public Insurance | Private Insurance |
| Under 6 | 335 (100.0%) | 0 (0.0%) |
| 6 to 18 Years | 272 (66.3%) | 0 (0.0%) |
| 19 to 25 Years | 0 (0.0%) | 54 (55.1%) |
| 25 to 34 Years | 0 (0.0%) | 119 (65.7%) |
| 35 to 44 Years | 0 (0.0%) | 100 (50.8%) |
| 45 to 54 Years | 98 (42.1%) | 17 (7.3%) |
| 55 to 64 Years | 118 (42.7%) | 81 (29.3%) |
| 65 to 74 Years | 296 (81.3%) | 71 (19.5%) |
| 75 Years and over | 521 (85.6%) | 356 (58.5%) |
| Total | 1,640 (60.7%) | 798 (29.5%) |
Disability Status by Sex by Age in Perezville
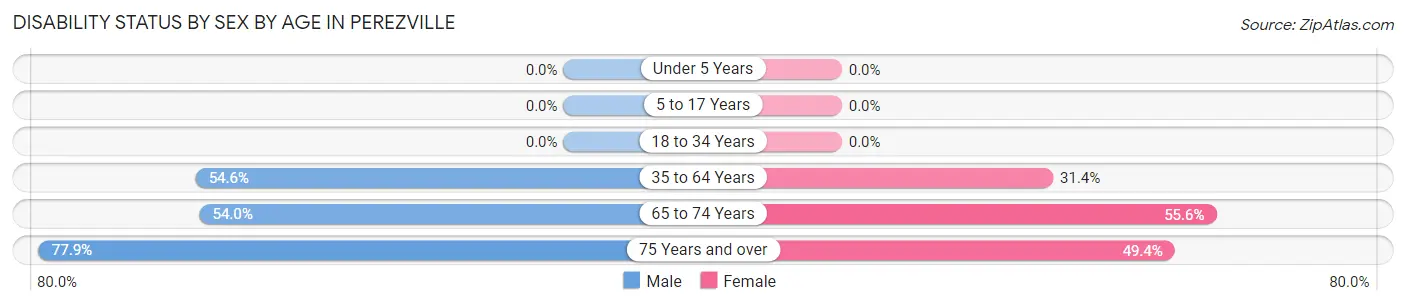
| Age Bracket | Male | Female |
| Under 5 Years | 0 (0.0%) | 0 (0.0%) |
| 5 to 17 Years | 0 (0.0%) | 0 (0.0%) |
| 18 to 34 Years | 0 (0.0%) | 0 (0.0%) |
| 35 to 64 Years | 208 (54.6%) | 102 (31.4%) |
| 65 to 74 Years | 47 (54.0%) | 154 (55.6%) |
| 75 Years and over | 271 (77.9%) | 129 (49.4%) |
Disability Class by Sex by Age in Perezville
Disability Class: Hearing Difficulty
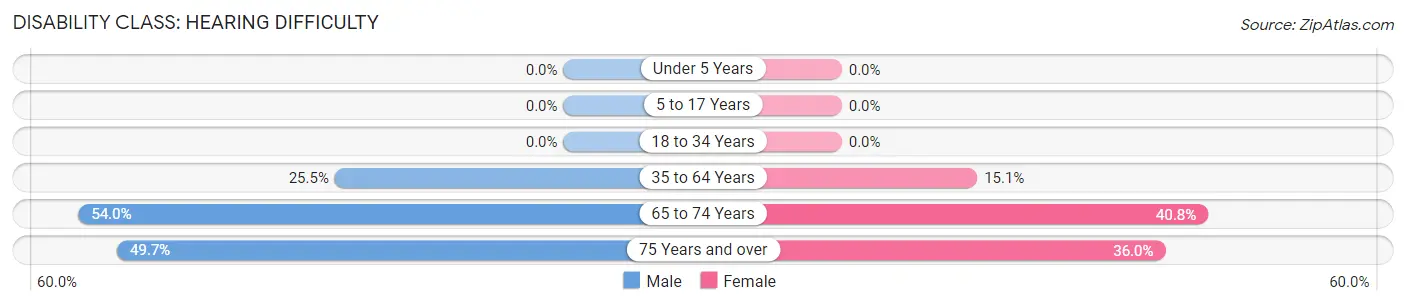
| Age Bracket | Male | Female |
| Under 5 Years | 0 (0.0%) | 0 (0.0%) |
| 5 to 17 Years | 0 (0.0%) | 0 (0.0%) |
| 18 to 34 Years | 0 (0.0%) | 0 (0.0%) |
| 35 to 64 Years | 97 (25.5%) | 49 (15.1%) |
| 65 to 74 Years | 47 (54.0%) | 113 (40.8%) |
| 75 Years and over | 173 (49.7%) | 94 (36.0%) |
Disability Class: Vision Difficulty
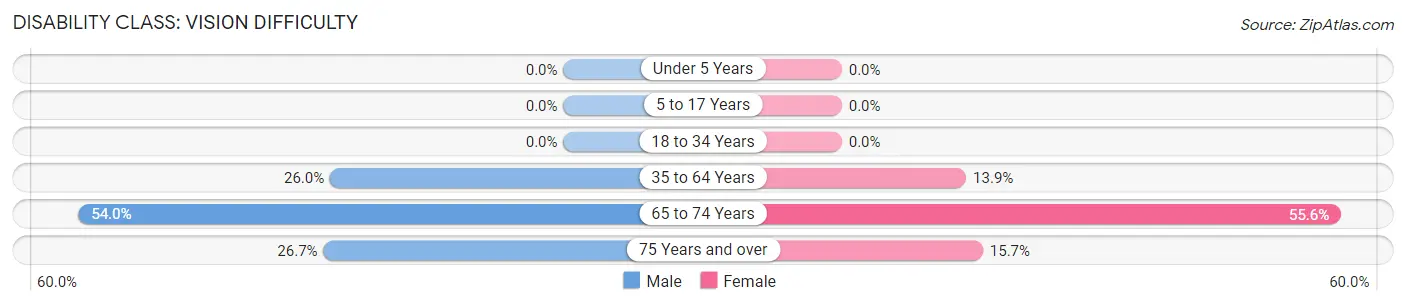
| Age Bracket | Male | Female |
| Under 5 Years | 0 (0.0%) | 0 (0.0%) |
| 5 to 17 Years | 0 (0.0%) | 0 (0.0%) |
| 18 to 34 Years | 0 (0.0%) | 0 (0.0%) |
| 35 to 64 Years | 99 (26.0%) | 45 (13.9%) |
| 65 to 74 Years | 47 (54.0%) | 154 (55.6%) |
| 75 Years and over | 93 (26.7%) | 41 (15.7%) |
Disability Class: Cognitive Difficulty
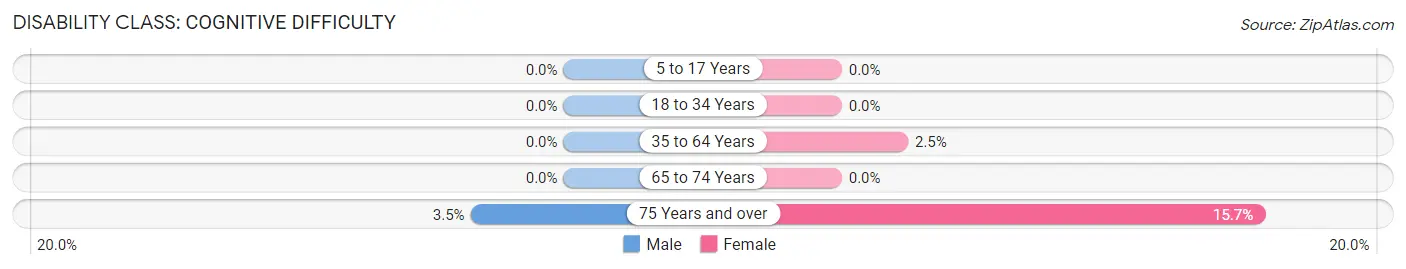
| Age Bracket | Male | Female |
| 5 to 17 Years | 0 (0.0%) | 0 (0.0%) |
| 18 to 34 Years | 0 (0.0%) | 0 (0.0%) |
| 35 to 64 Years | 0 (0.0%) | 8 (2.5%) |
| 65 to 74 Years | 0 (0.0%) | 0 (0.0%) |
| 75 Years and over | 12 (3.5%) | 41 (15.7%) |
Disability Class: Ambulatory Difficulty
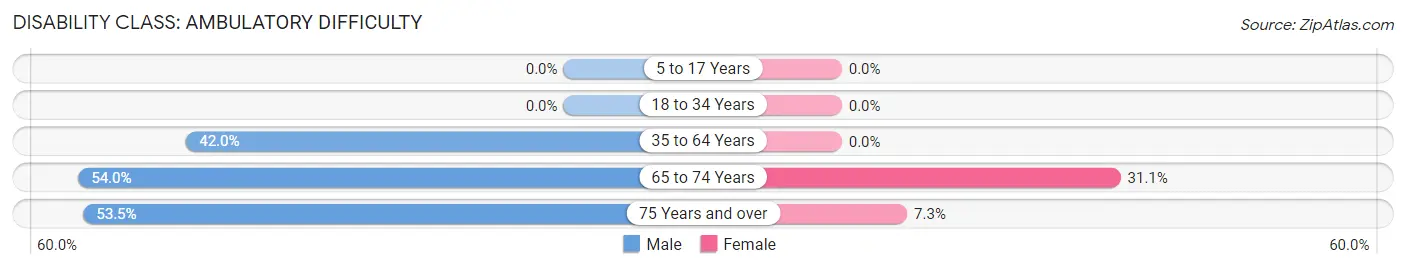
| Age Bracket | Male | Female |
| 5 to 17 Years | 0 (0.0%) | 0 (0.0%) |
| 18 to 34 Years | 0 (0.0%) | 0 (0.0%) |
| 35 to 64 Years | 160 (42.0%) | 0 (0.0%) |
| 65 to 74 Years | 47 (54.0%) | 86 (31.0%) |
| 75 Years and over | 186 (53.4%) | 19 (7.3%) |
Disability Class: Self-Care Difficulty
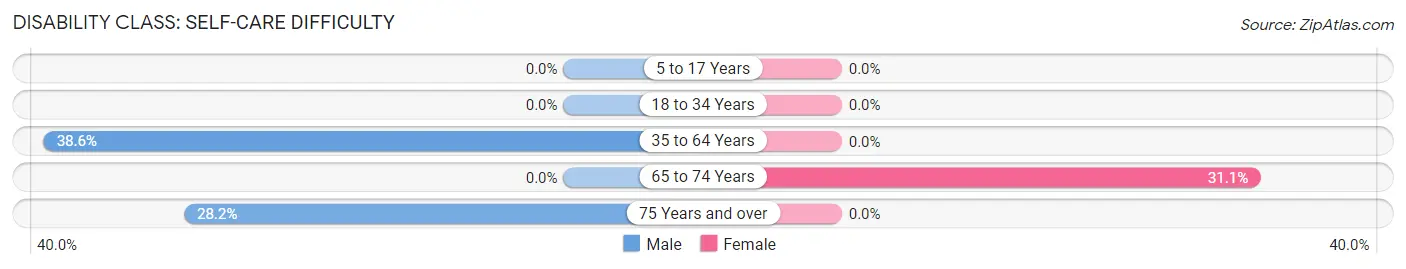
| Age Bracket | Male | Female |
| 5 to 17 Years | 0 (0.0%) | 0 (0.0%) |
| 18 to 34 Years | 0 (0.0%) | 0 (0.0%) |
| 35 to 64 Years | 147 (38.6%) | 0 (0.0%) |
| 65 to 74 Years | 0 (0.0%) | 86 (31.0%) |
| 75 Years and over | 98 (28.2%) | 0 (0.0%) |
Technology Access in Perezville
Computing Device Access in Perezville
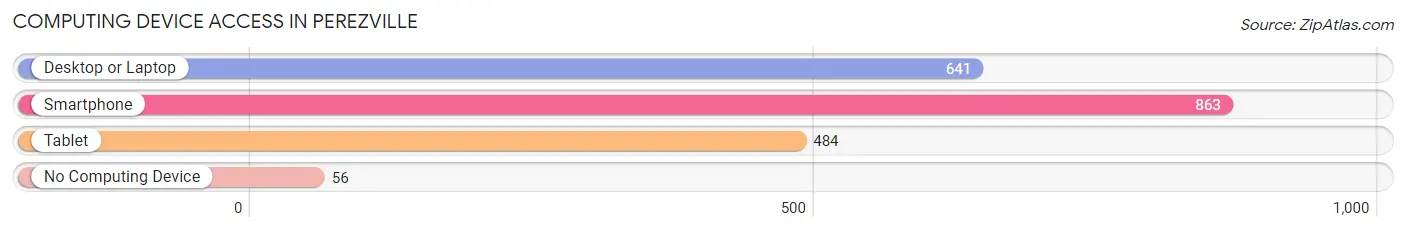
| Device Type | # Households | % Households |
| Desktop or Laptop | 641 | 64.1% |
| Smartphone | 863 | 86.3% |
| Tablet | 484 | 48.4% |
| No Computing Device | 56 | 5.6% |
| Total | 1,000 | 100.0% |
Internet Access in Perezville
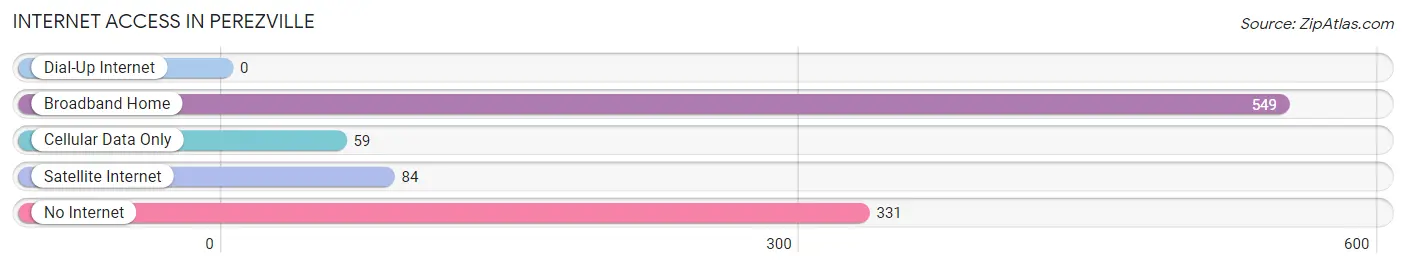
| Internet Type | # Households | % Households |
| Dial-Up Internet | 0 | 0.0% |
| Broadband Home | 549 | 54.9% |
| Cellular Data Only | 59 | 5.9% |
| Satellite Internet | 84 | 8.4% |
| No Internet | 331 | 33.1% |
| Total | 1,000 | 100.0% |
Perezville Summary
Perezville is a small unincorporated community located in the state of Texas, United States. It is situated in the western part of the state, in the county of Zapata. The population of Perezville was estimated to be around 1,000 people in the year 2000.
History
Perezville was founded in the late 19th century by a group of Mexican settlers who were looking for a place to settle and start a new life. The town was named after the first settler, Jose Perez, who was a rancher and farmer. The town grew slowly but steadily over the years, and by the early 20th century, it had become a thriving community.
The town was home to a variety of businesses, including a general store, a blacksmith, a saloon, and a post office. The town also had a school, which was attended by the children of the local families.
Geography
Perezville is located in the western part of the state of Texas, in the county of Zapata. It is situated in the Rio Grande Valley, which is a region of the state that is known for its fertile soil and abundant wildlife. The town is located near the Rio Grande River, which serves as the border between the United States and Mexico.
The climate in Perezville is generally warm and humid, with temperatures ranging from the mid-70s in the summer to the mid-50s in the winter. The town receives an average of about 30 inches of rain per year.
Economy
The economy of Perezville is largely based on agriculture. The town is home to several farms and ranches, which produce a variety of crops, including cotton, corn, and sorghum. The town also has a few small businesses, such as a general store and a post office.
Demographics
As of the year 2000, the population of Perezville was estimated to be around 1,000 people. The majority of the population is of Hispanic or Latino descent, with a small percentage of other ethnicities. The median household income in the town is around $25,000, and the median home value is around $50,000.
Conclusion
Perezville is a small unincorporated community located in the western part of the state of Texas. It was founded in the late 19th century by a group of Mexican settlers, and it has grown steadily over the years. The town is home to a variety of businesses, and its economy is largely based on agriculture. The population of Perezville is estimated to be around 1,000 people, and the majority of the population is of Hispanic or Latino descent.
Common Questions
What is Per Capita Income in Perezville?
Per Capita income in Perezville is $18,195.
What is the Median Family Income in Perezville?
Median Family Income in Perezville is $54,225.
What is the Median Household income in Perezville?
Median Household Income in Perezville is $45,556.
What is Income or Wage Gap in Perezville?
Income or Wage Gap in Perezville is 58.6%.
Women in Perezville earn 41.4 cents for every dollar earned by a man.
What is Inequality or Gini Index in Perezville?
Inequality or Gini Index in Perezville is 0.38.
What is the Total Population of Perezville?
Total Population of Perezville is 2,703.
What is the Total Male Population of Perezville?
Total Male Population of Perezville is 1,298.
What is the Total Female Population of Perezville?
Total Female Population of Perezville is 1,405.
What is the Ratio of Males per 100 Females in Perezville?
There are 92.38 Males per 100 Females in Perezville.
What is the Ratio of Females per 100 Males in Perezville?
There are 108.24 Females per 100 Males in Perezville.
What is the Median Population Age in Perezville?
Median Population Age in Perezville is 51.9 Years.
What is the Average Family Size in Perezville
Average Family Size in Perezville is 3.3 People.
What is the Average Household Size in Perezville
Average Household Size in Perezville is 2.7 People.
How Large is the Labor Force in Perezville?
There are 557 People in the Labor Forcein in Perezville.
What is the Percentage of People in the Labor Force in Perezville?
26.5% of People are in the Labor Force in Perezville.